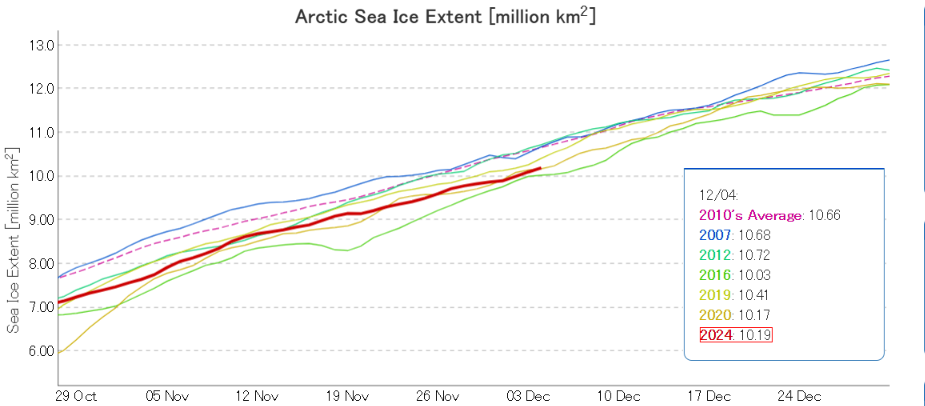
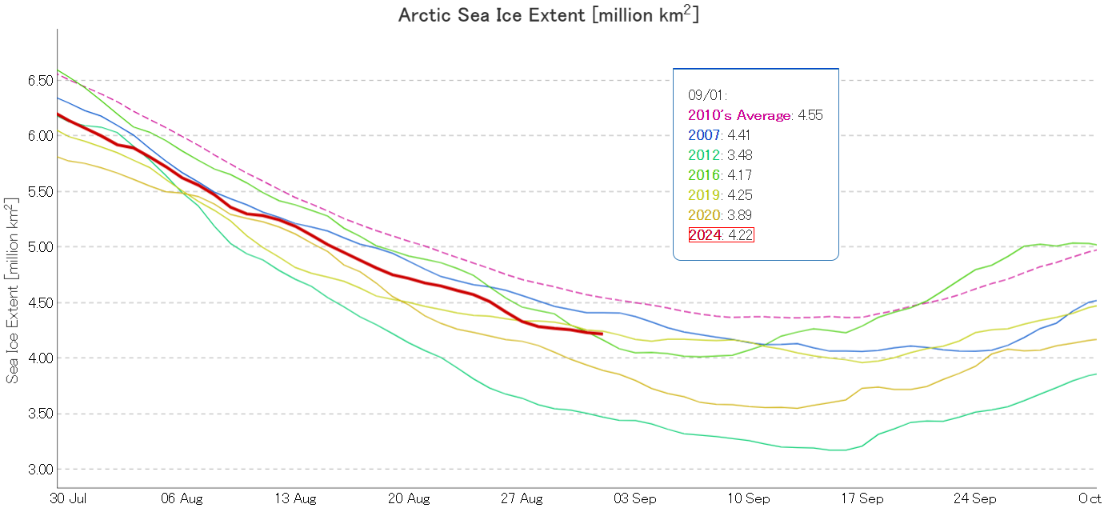
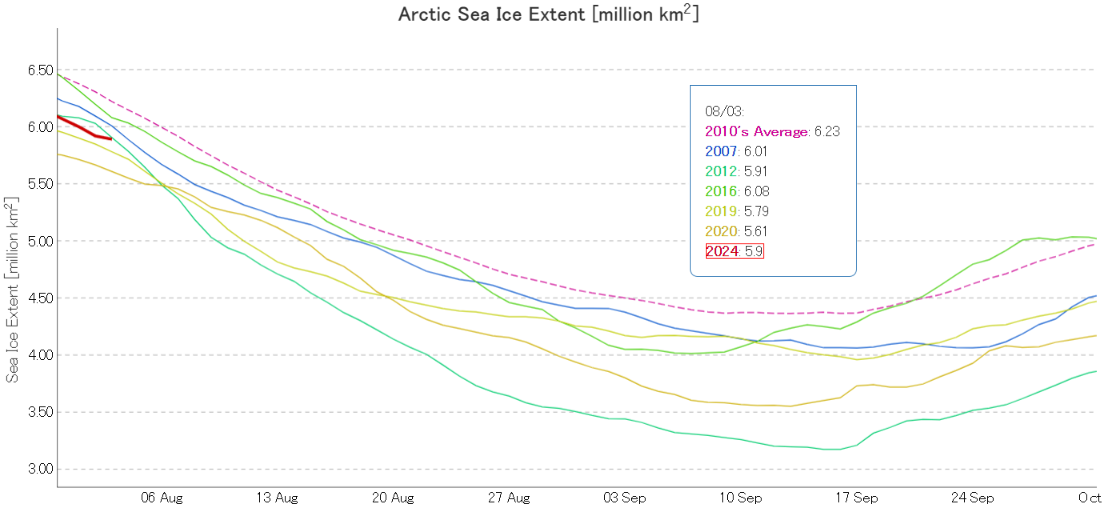
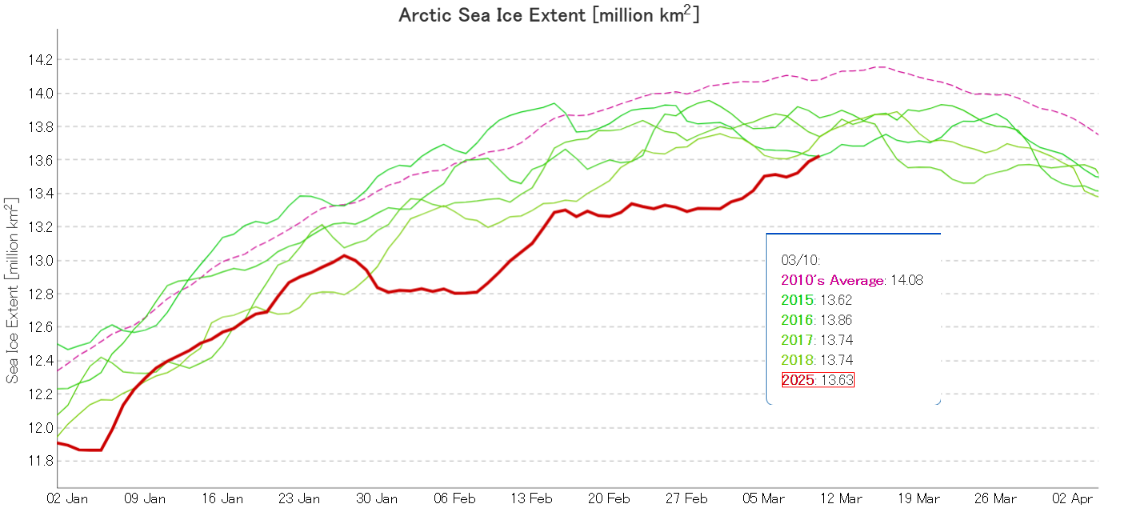
After spending several weeks in the unfortunate position of lowest for the date, JAXA/ViSHOP Arctic sea ice extent has just risen above 2015. By a mere 10,000 km²:
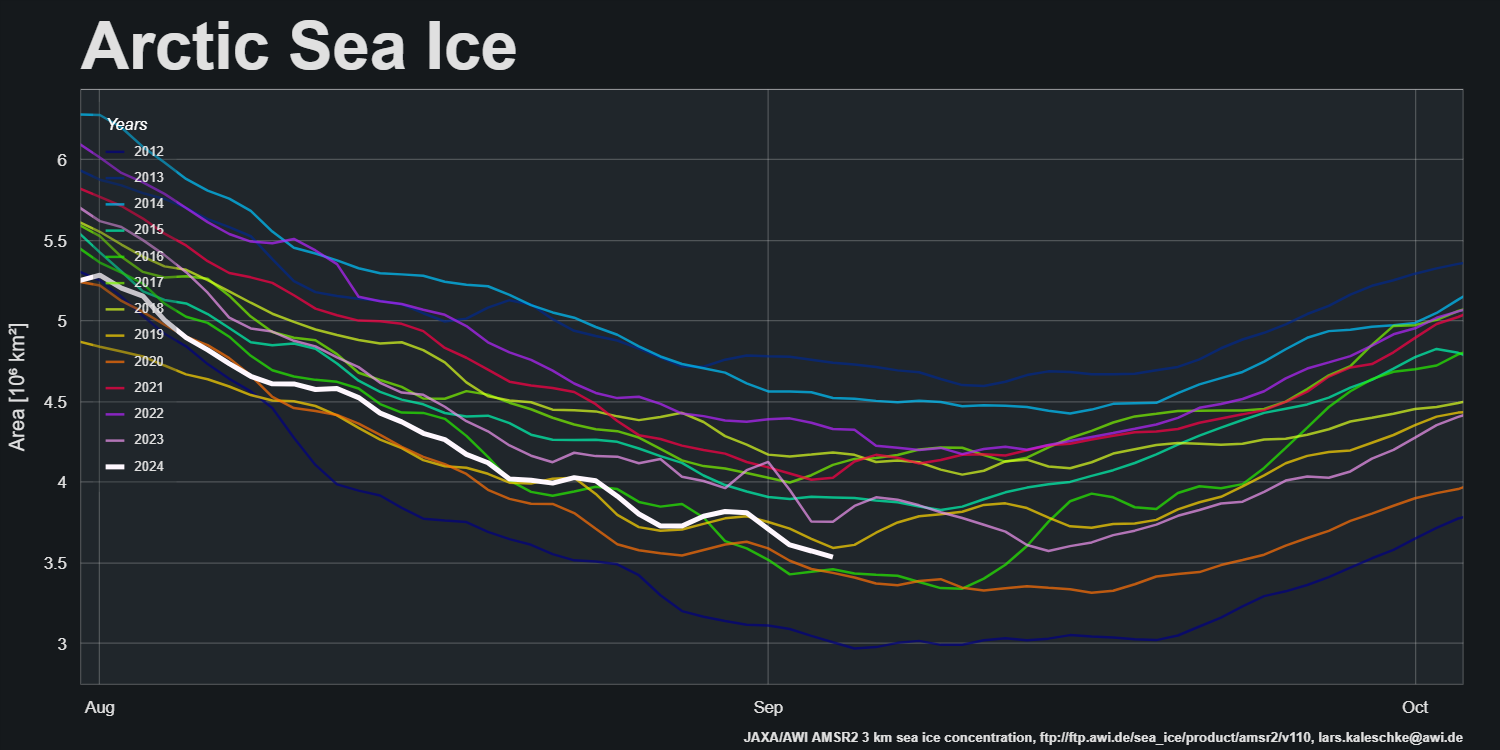
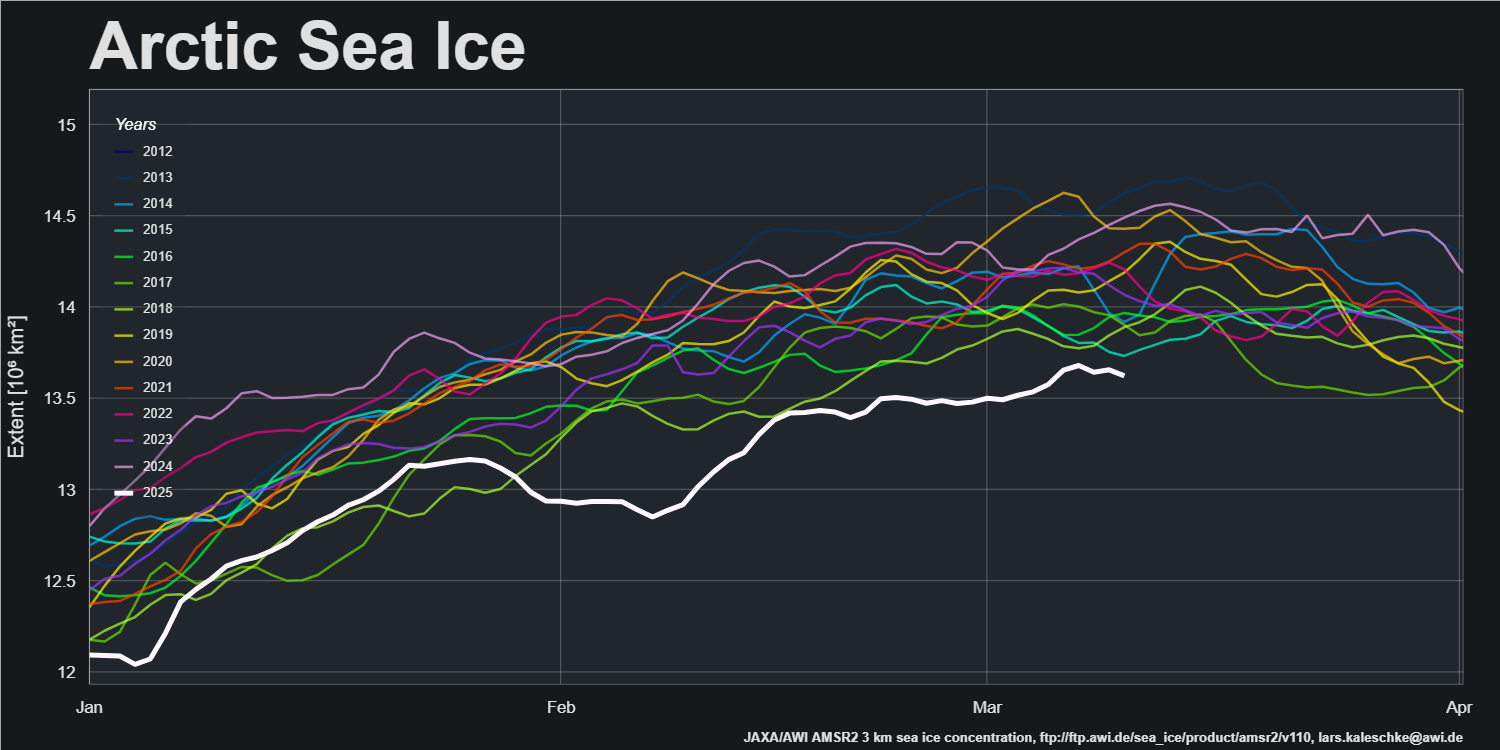
Despite the fact that JAXA extent is still rising, AWI extent has potentially already achieved its maximum value for 2025:
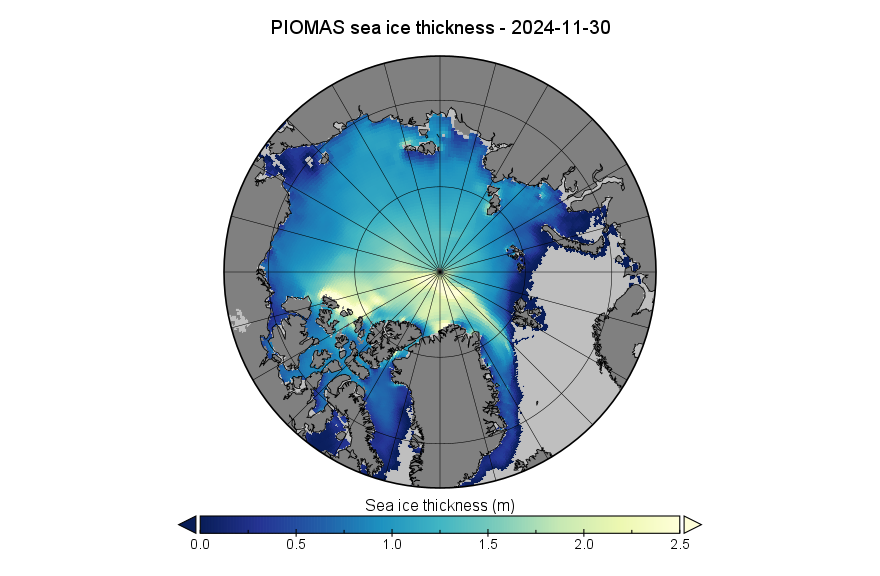
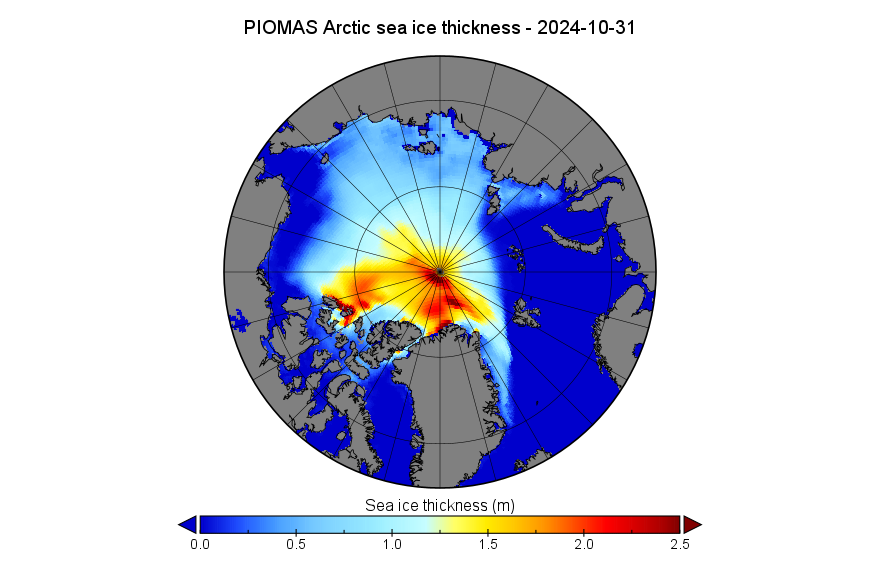
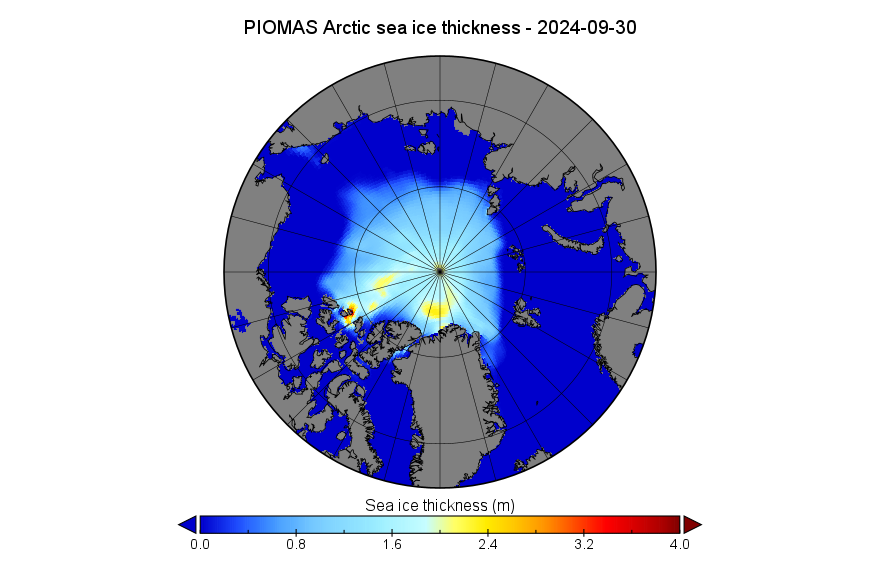
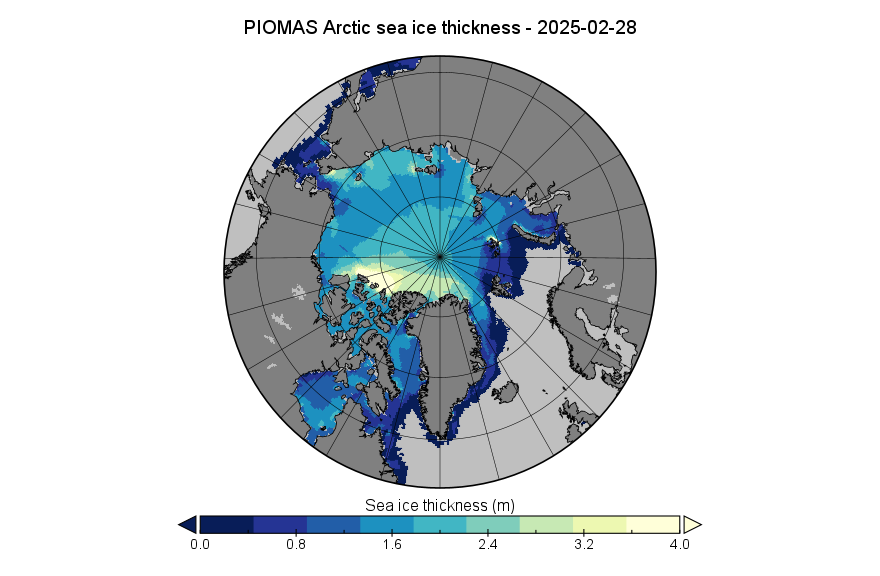
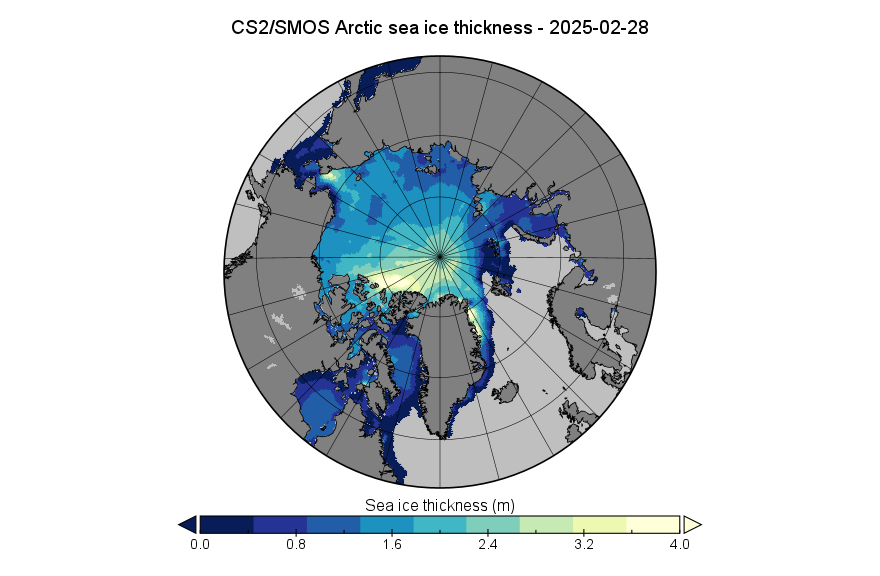
Somewhat belatedly, here is the PIOMAS sea ice thickness map for February 28th 2025:
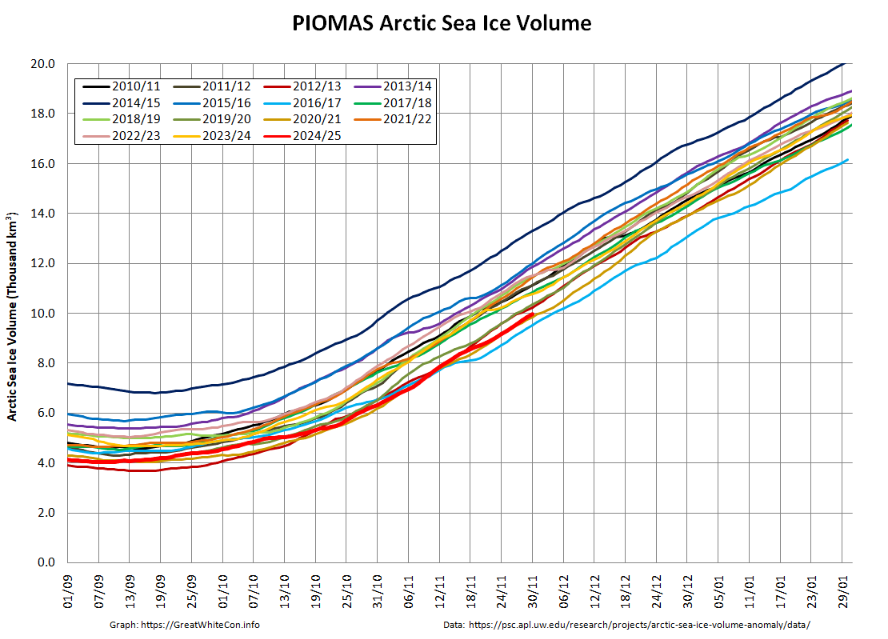
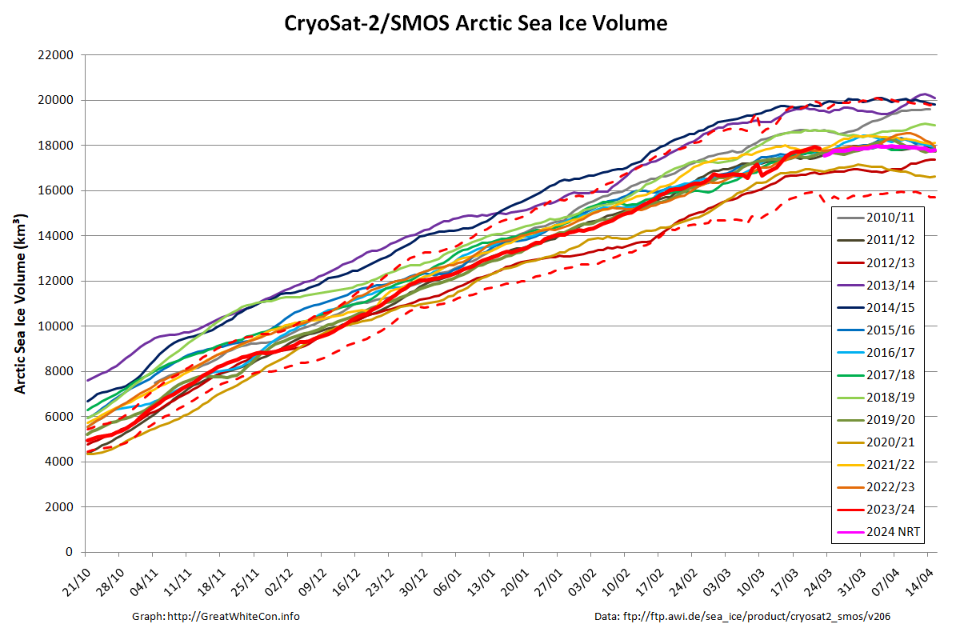
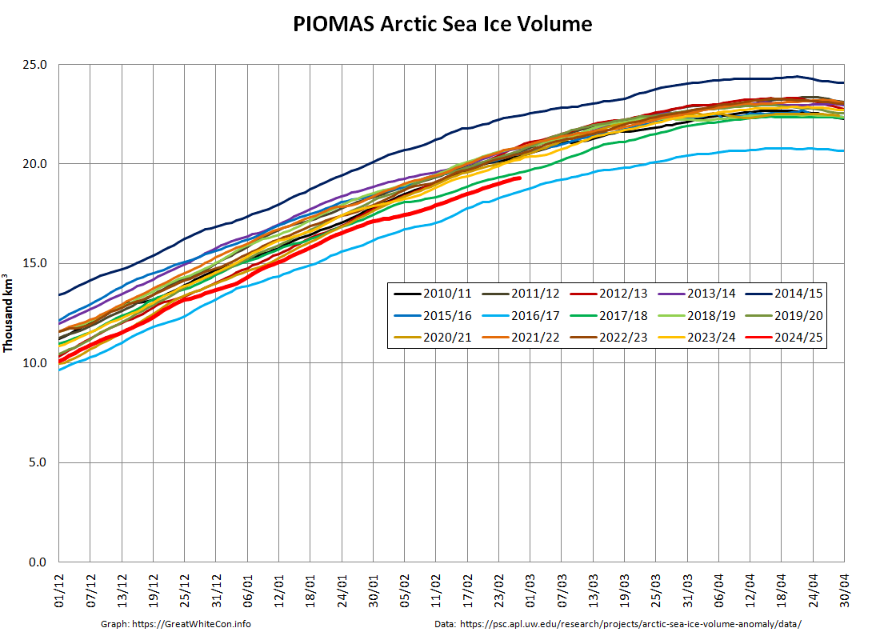
At the end of February Arctic sea ice volume had increased to 19.32 thousand km³, still 2nd lowest for the date in the PIOMAS record:
For comparison purposes, here is the “near real time” CryoSat-2/SMOS merged thickness data from the Alfred Wegener Institute:
AWI have also released a new version of their thickness product, incorporating additional data from the two Sentinel 3 satellites. The thickness data for February 28th, looks slightly different:
Continue reading Facts About the Arctic in March 2025