This article not directly related to Arctic sea ice, but instead is one of our (very!) occasional series on the psychology of anthropogenic global warming “skepticism”.
Peter Hadfield is better known as the man behind Buster Keaton’s face on the “Potholer54” channel on YouTube. Tom Nelson is the “producer” of Martin Durkin’s “Climate: The Movie”. Peter produced a video criticising that movie. Many months later Peter and Tom have just recorded a “long-form, man-to-man debate” via Zoom about those criticisms. Here is episode 1 of Potholer’s version of events:
Here is “Snow White’s” hot take on the first 10 minutes of Tom Nelson’s version of events on X (formerly Twitter):
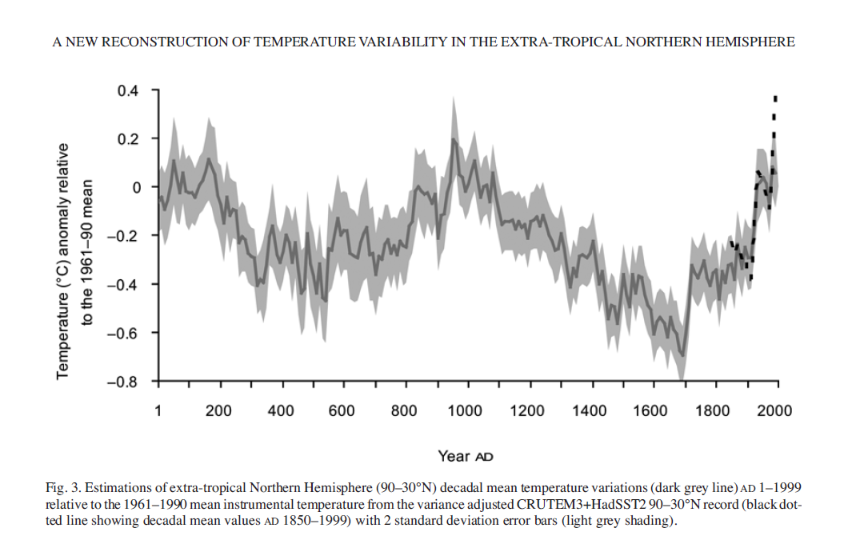
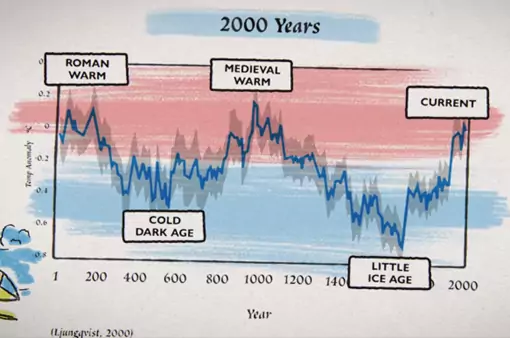
6:37 "You've referenced this as (Ljungqvist, 2000). It's not actually, it's 2010. But that's a minor mistake"
— Snow White (@GreatWhiteCon) May 4, 2025
6:46 "It's also not global temperatures, as it says in the title. These are NH temperatures, above the Tropic of Cancer… But that's just another mistake"
In brief, Tom seems to be incapable of providing a straight answer to a straight question, and instead loudly rails against what he continually refers to as the instrumental temperature “spike of doom”.
Can you spot the difference between these two graphs? The first is from Ljungqvist (2010):
The second is from Climate: The Movie (The Cold Truth):
Note that at 2:18 in the video above Tom says:
I want to make sure that my audience hears everything that you have to say, so I’d hope that we don’t filibuster and try to keep our answers short and snappy.
Here’s the second episode of the Peter v Tom “debate”:
Would anybody here care to run a stopwatch past the time spent “filibustering” by each of the two participants?
In the video description Peter has this to say:
During the debate, Tom asked me a gish-gallop of questions, including whether I ‘believe’ CO2 is the control knob of global temperature, and about the Medieval Warm Period, and the weather, etc. He did not choose any of these as topics for the debate…
So why didn’t I simply answer all his questions and explain this? Because I have had 40 years experience interviewing politicians and government officials, whose strategy is always to divert attention onto another subject whenever you are homing in on a contradiction or a mistake. Even if I had taken the bait and explained what the science actually shows regarding the weather, or the control knob, or the MWP, as soon as I got close to busting another of Tom’s fallacies, he would have interrupted me mid-sentence to try to divert onto another subject. The trick is to always keep them on the topic.
Here’s are Peter’s subsequent musings on the “debate”:
Here’s an excerpt from Peter’s conclusion at ~ 13:40:
People who lobby for industry and vested interests don’t want to discuss the science, they want to support their beliefs. If you agree with their beliefs you’re on their side. If you don’t agree with their beliefs you’re on the other side.
If changing graphs, airbrushing out contradictory information, hiding sources and misrepresenting studies is what it takes to support those beliefs, then it’s perfectly OK.
If the other person is trying to make a point that gets to the facts and the reality, then do everything you can to interrupt, filibuster and deflect. What matters outside the world of science is not getting to “the truth”, but what they call “winning”.
Unfortunately for Tom Nelson, Martin Durkin and the CO2 Coalition, the internet keeps receipts of airbrushing: