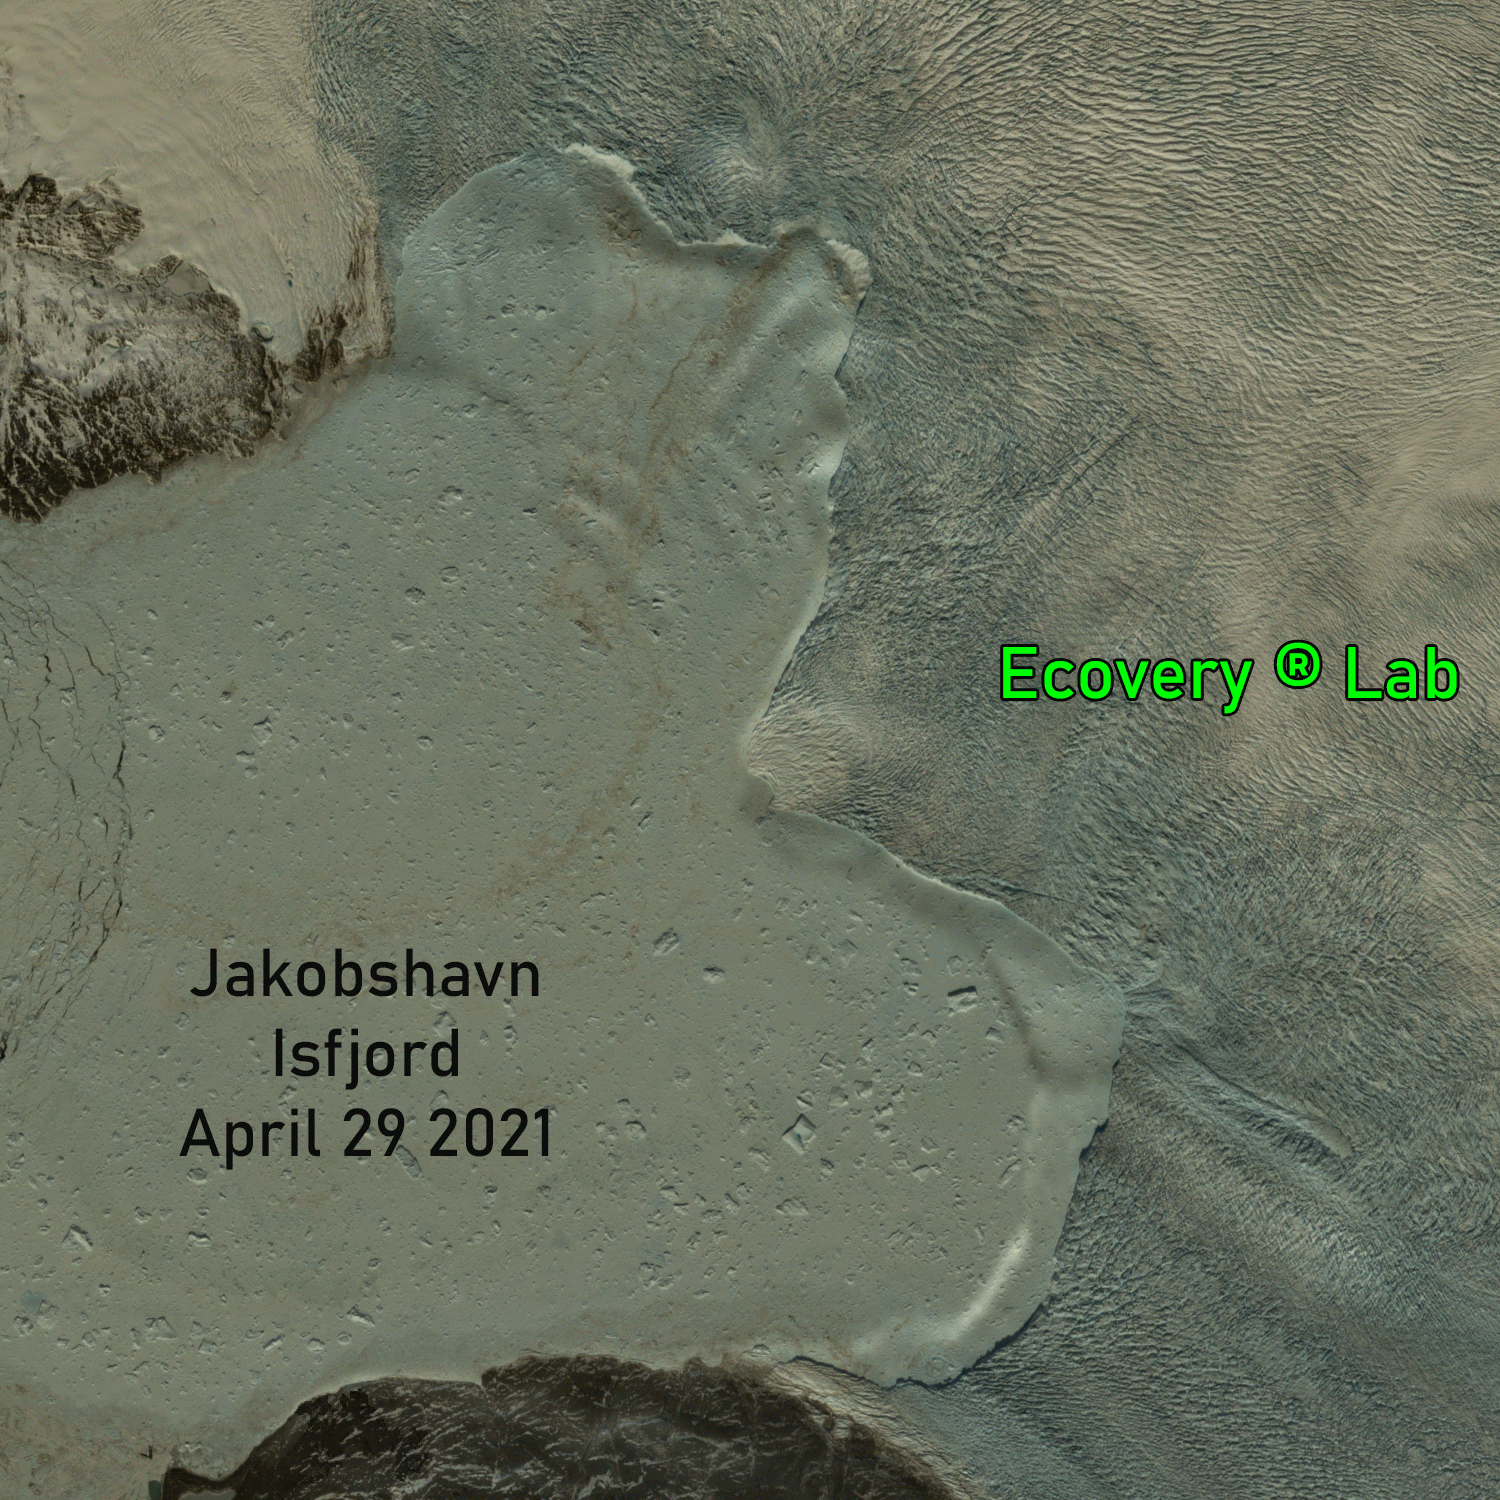
It’s not very often that we discuss an article from Watts Up With That with even the vaguest hint of approval in the smoke filled editorial offices at the Great White Con, but here’s the exception that proves the rule! No doubt the fact that allegedly I inspired the article in question is also relevant? Here’s the start of a guest post at WUWT entitled “Polariced Mysteries“, written by our old friend Willis Eschenbach:
I got into a discussion about polar sea ice in the comments to my post Where Is The Climate Emergency?. In the process I noticed some mysteries.
To start with, here’s the Arctic sea ice area record.
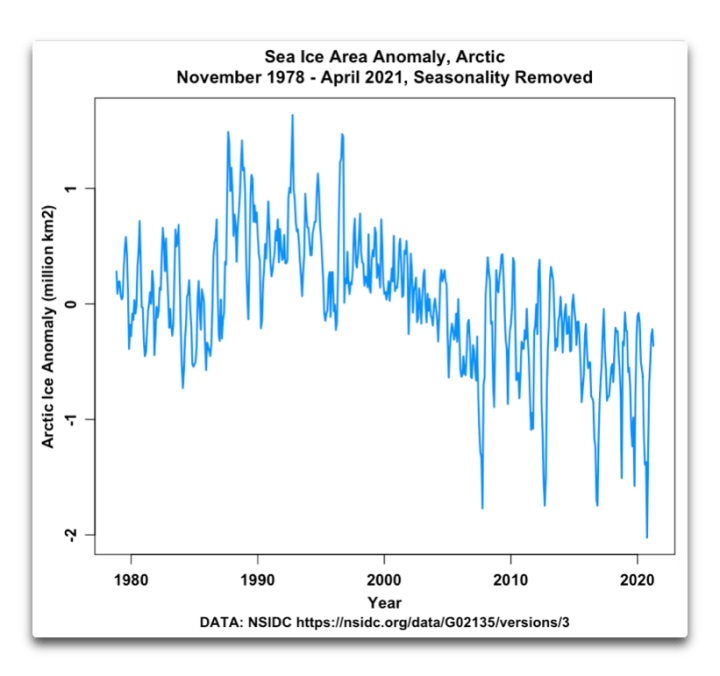
The mystery for me in this record is the decade from about 1998 to 2008. There’s very little month-to-month variation in the record over that period, and the ice area is dropping steadily … followed by ~ thirteen years of very large month-to-month variations with little overall change in ice area. Is this real? Is it an artifact? Unknown.
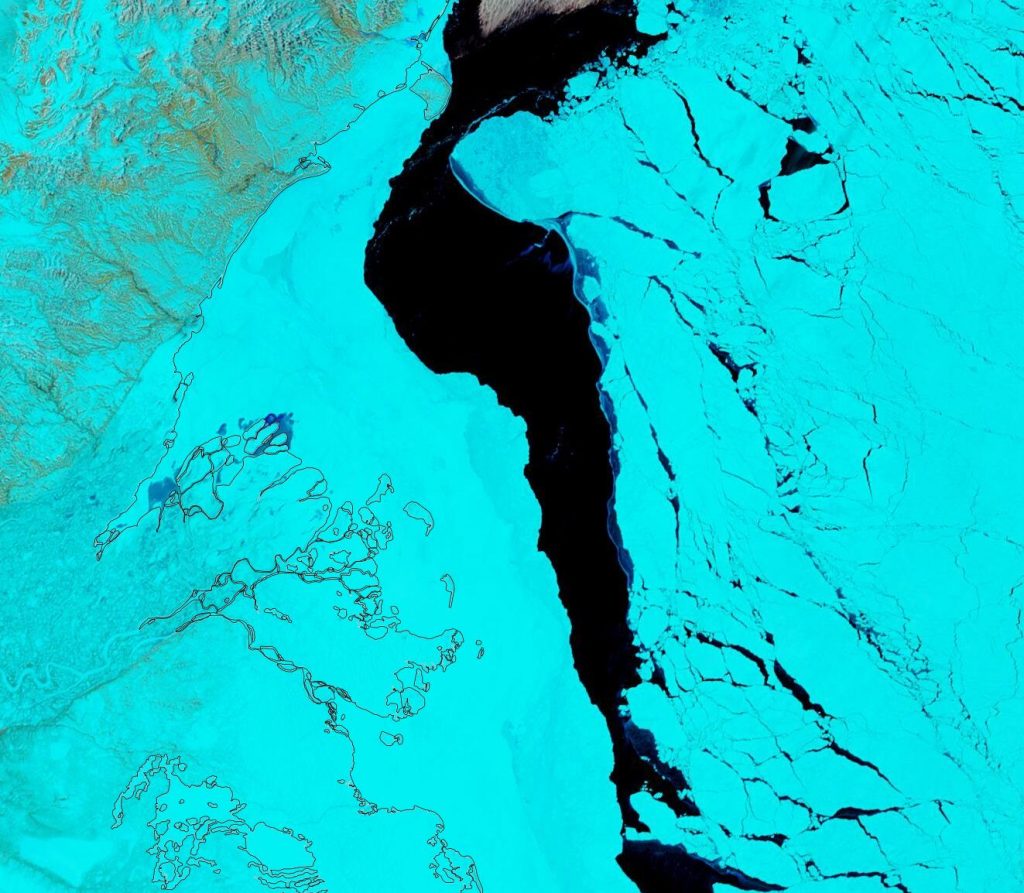
Then we have the Antarctic ice area record …
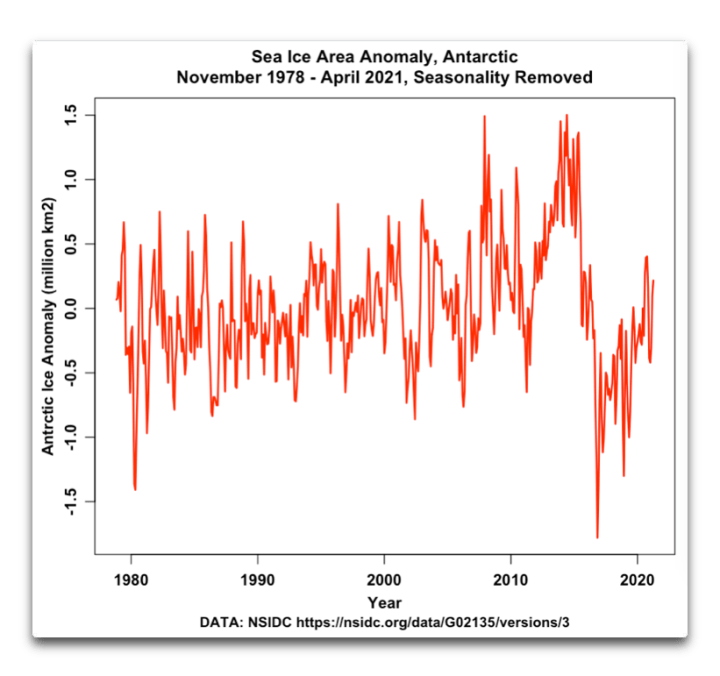
Here, the obvious mystery is, just what the heck happened around 2015-2017 to cause the Antarctic ice area to drop so precipitously?
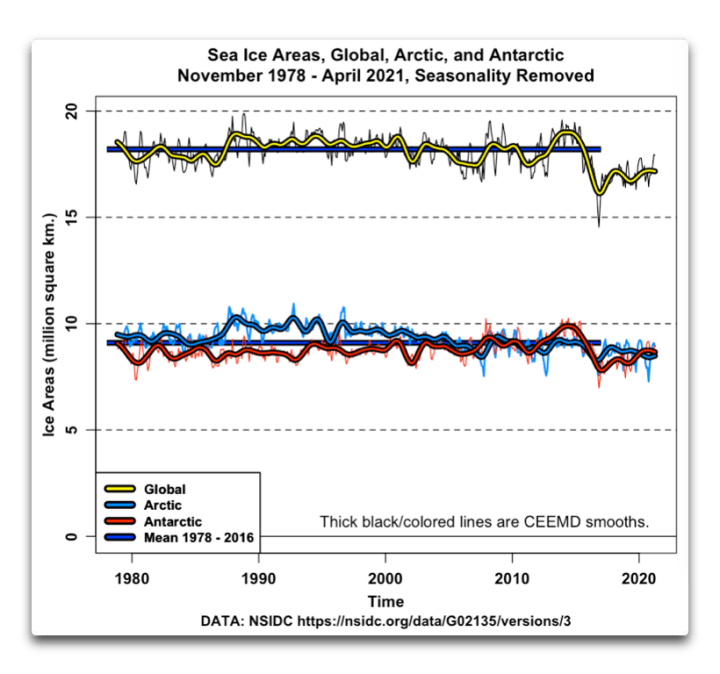
And finally, putting both poles together, we get the following:
etc. etc…
At the North Pole, there is an ocean covered with sea ice. At the South Pole, there’s a high rocky plateau covered with land ice and surrounded by sea ice. Yet despite these totally different situations, the area of sea ice is almost exactly the same at both poles … say what?
I will say that I am overjoyed that the world of climate contains far more mysteries than answers …
“When nothing is for sure, we remain alert, perennially on our toes. It is more exciting not to know which bush the rabbit is hiding behind than to behave as though we knew everything.”
—Carlos Castaneda, in The Teachings of Don Juan
My best to all adventurers in this most marvelous universe,
Thanks for your good wishes Willis, but there is a big black fly in the marvellous universal ointment. No sooner had a potentially enlightening discussion begun than darkness descended from on high:
At the risk of repeating myself:
What do you suppose the effect of ice-albedo feedback will prove to be over the next 10 years or so? Or if you prefer over the last 10 years or so?
And why “remove the seasonality”. As you correctly pointed out over there, “When the ice is mostly there the sun mostly isn’t”.