Regular readers will no doubt have noticed by now that here at the Great White Con we are publishing a series of reviews of Steven E. Koonin‘s new book “Unsettled”? Today we move on to the topic of Land-Surface Air Temperature (LSAT for short). Here is an extract from the very first page of the book:
Yes, it’s true that the globe is warming, and that humans are exerting a warming influence upon it. But beyond that—to paraphrase the classic movie The Princess Bride: “I do not think ‘The Science’ says what you think it says.”
For example, both the research literature and government reports that summarize and assess the state of climate science say clearly that heat waves in the US are now no more common than they were in 1900, and that the warmest temperatures in the US have not risen in the past fifty years. When I tell people this, most are incredulous. Some gasp. And some get downright hostile.
Here once again is an extract from page 23 of the Kindle edition of Steve’s book:
The [IPCC] assessment reports literally define The Science for non-experts. Given the intensive authoring and review processes, any reader would naturally expect that their assessments and summaries of the research literature are complete, objective, and transparent—the “gold standard.” In my experience, the reports largely do meet that expectation, and so much of the detail in the first part of this book, the science story, is drawn from them.
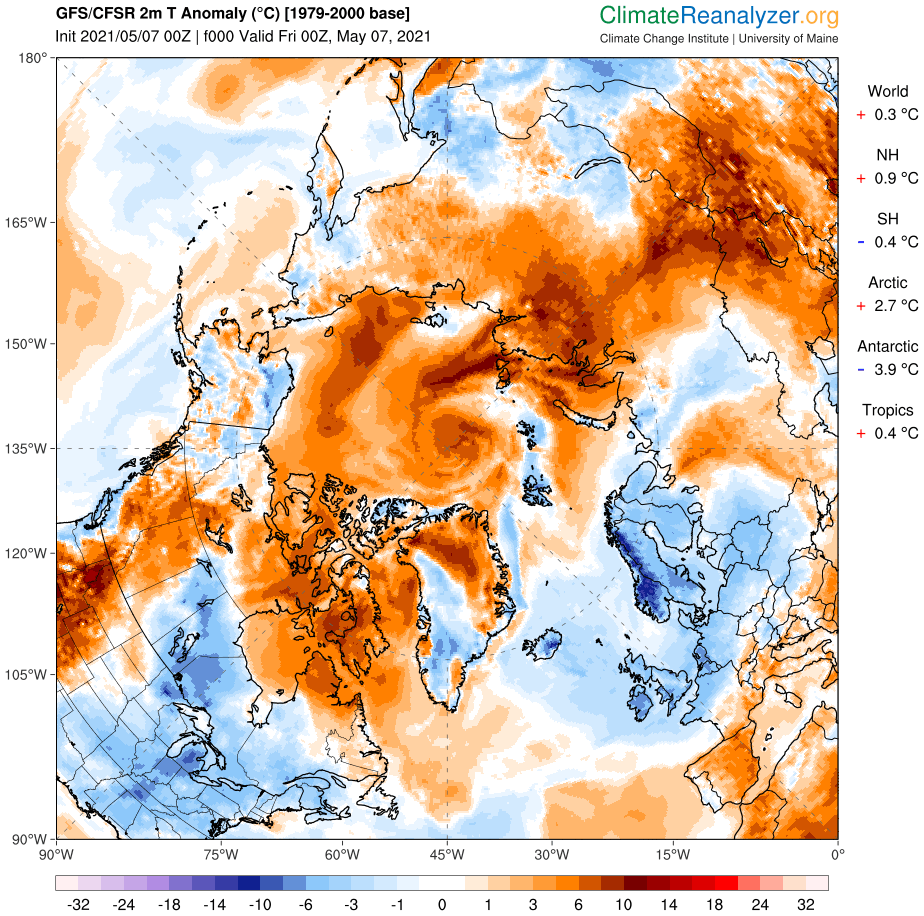
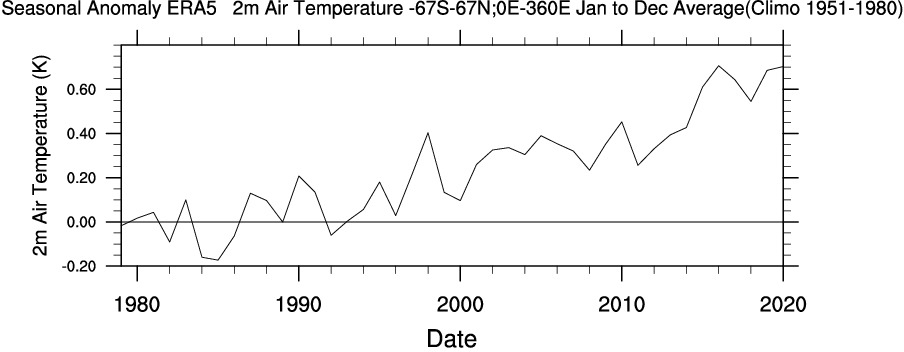
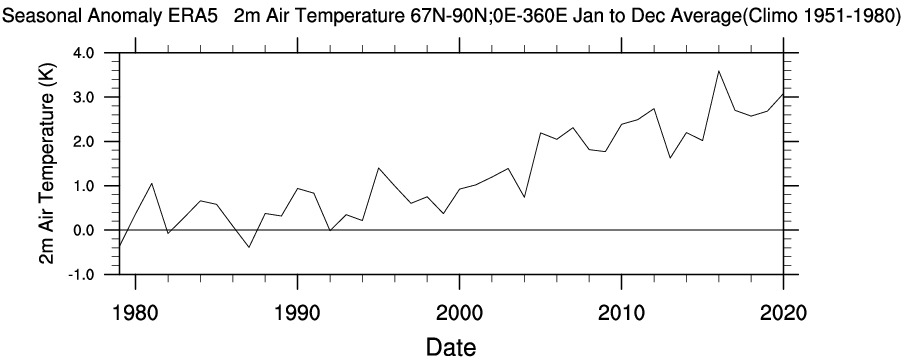
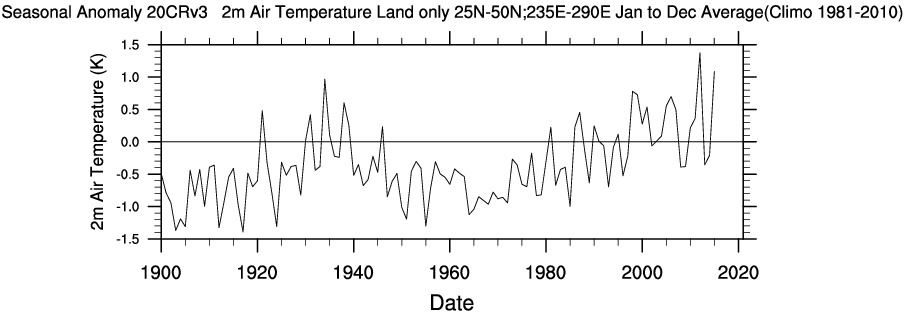
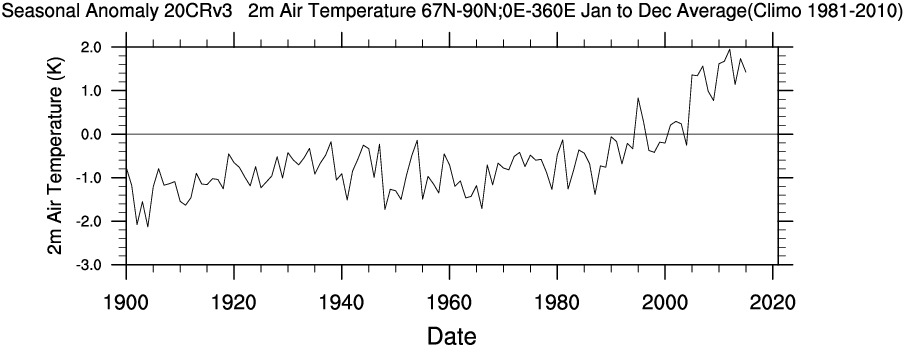
First of all let me remind Steve that the United States does not constitute the entirety of our planet. In particular the Arctic is warming a lot faster than mid latitudes in general and the US in particular. Using WRIT once again to produce our own time series, we can compare and contrast longer term temperature records between the Continental United States and the Arctic (including both land and ocean above the Arctic circle):
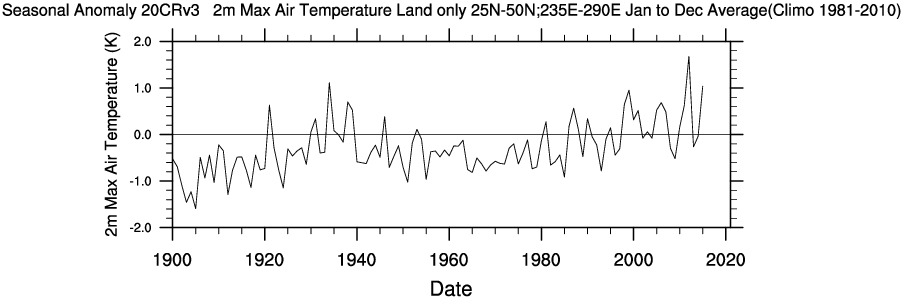
Also note that for some reason Steve makes no mention of US “coolest temperatures” and/or “cold waves” since 1900. I don’t know about you, but the top graph certainly suggest to me that “the warmest temperatures in the US have risen in the past fifty years”.
Let’s see how Steve explains himself. For that we have to wait until Chapter 5, catchily entitled “Hyping the Heat”. Therein no mention is made of recent temperature increases across the Arctic, but we are able to read in the introductory paragraphs that:
We can all agree the globe has gotten warmer over the past several decades. Here’s another summary statement from the IPCC’s AR5:
[S]ince about 1950 it is very likely that the numbers of cold days and nights have decreased and the numbers of warm days and nights have increased . . . there is medium confidence that globally the length and frequency of warm spells, including heat waves, has increased since the middle of the 20th century. (IPCC. AR5 WGI Section 2.6.1.)
Then there is a long discussion about what Steve apparently perceives to be shortcomings in the “The US government’s most recent assessment report, the 2017 Climate Science Special Report (CSSR)”. Steve is apparently well qualified in physics, so presumably he is able to comprehend these equations?
- US ≠ Global
- CSSR ≠ AR5
For those of you less familiar with the arcane language of mathematics and physics that translates to “the climate of the continental United States is not identical to Arctic climate or typical of the climate of Planet Earth as a whole” and hence “US Governmental climate reports are not necessarily typical of ‘Intergovernmental’ climate assessments”.
Next let’s check what Steve’s “gold standard for The Science” has to say on this topic. According to section 2.6.1 of the Intergovernmental Panel on Climate Change’s fifth Assessment Report, as cited by Steve:
A large amount of evidence continues to support the conclusion that most global land areas analysed have experienced significant warming of both maximum and minimum temperature extremes since about 1950 (Donat et al., 2013c). Changes in the occurrence of cold and warm days (based on daily maximum temperatures) are generally less marked (Figure 2.32):
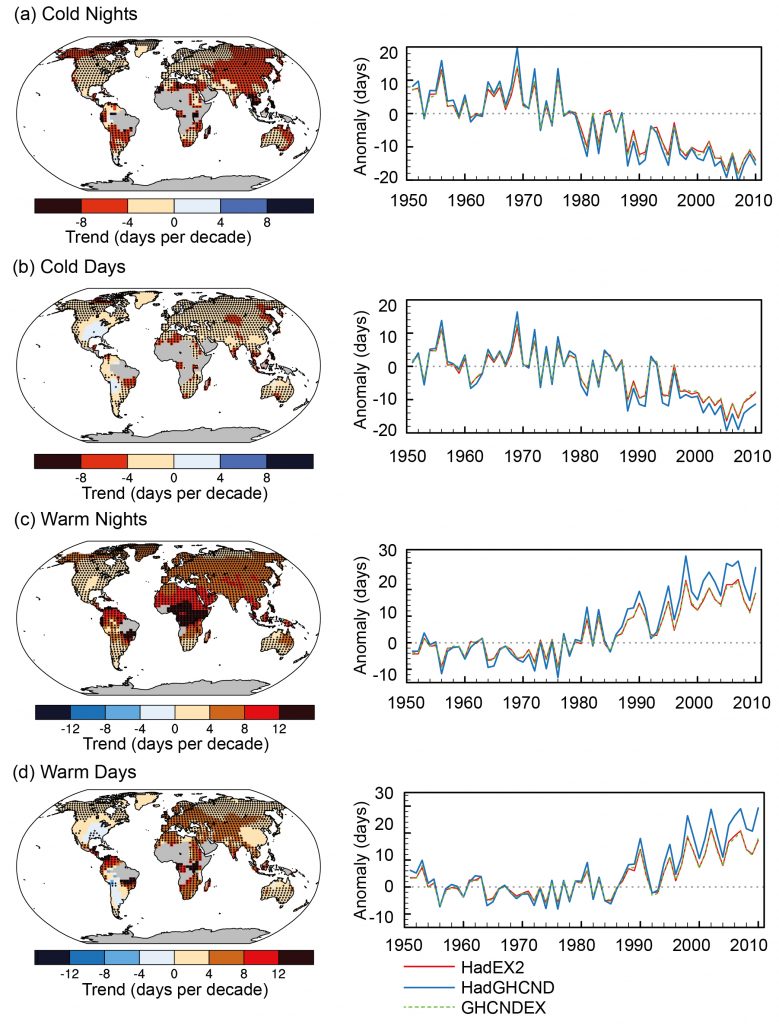
warm days (TX90p) (Box 2.4, Table 1). Trends were calculated only for grid boxes that had at least 40 years of data during this period and where data ended no earlier than 2003.
Grey areas indicate incomplete or missing data. Black plus signs (+) indicate grid boxes where trends are significant (i.e., a trend of zero lies outside the 90% confidence interval).
The data source for trend maps is HadEX2 (Donat et al., 2013c) updated to include the latest version of the European Climate Assessment data set (Klok and Tank, 2009). Beside
each map are the near-global time series of annual anomalies of these indices with respect to 1961–1990 for three global indices data sets: HadEX2 (red); HadGHCND (Caesar et al., 2006; blue) and updated to 2010 and GHCNDEX (Donat et al., 2013a; green). Global averages are only calculated using grid boxes where all three data sets have at least 90%
of data over the time period. Trends are significant (i.e., a trend of zero lies outside the 90% confidence interval) for all the global indices shown.
To paraphrase The Princess Bride once again: “I do not think ‘The Science’ says what Steven E. Koonin says it says in ‘Unsettled’”.
Unsettling, is it not?