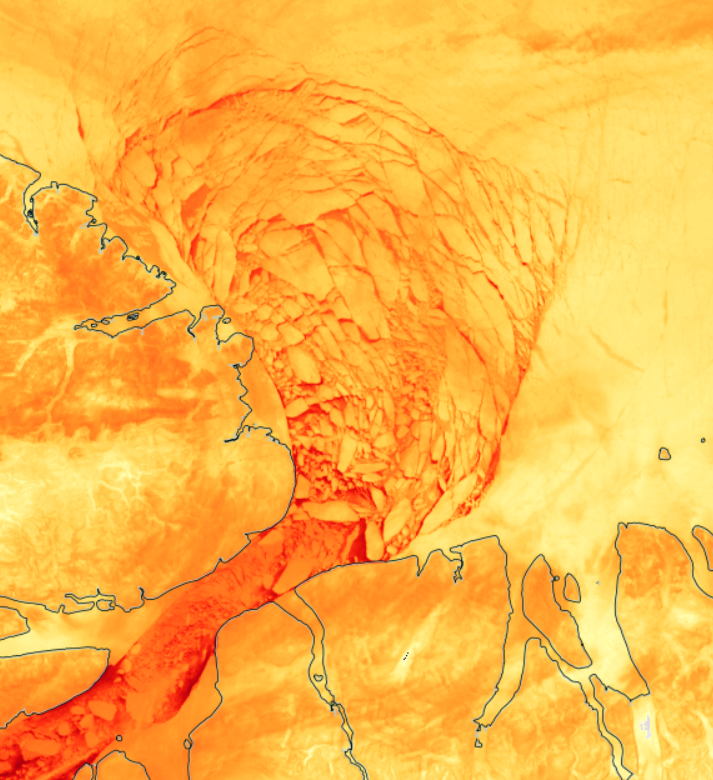
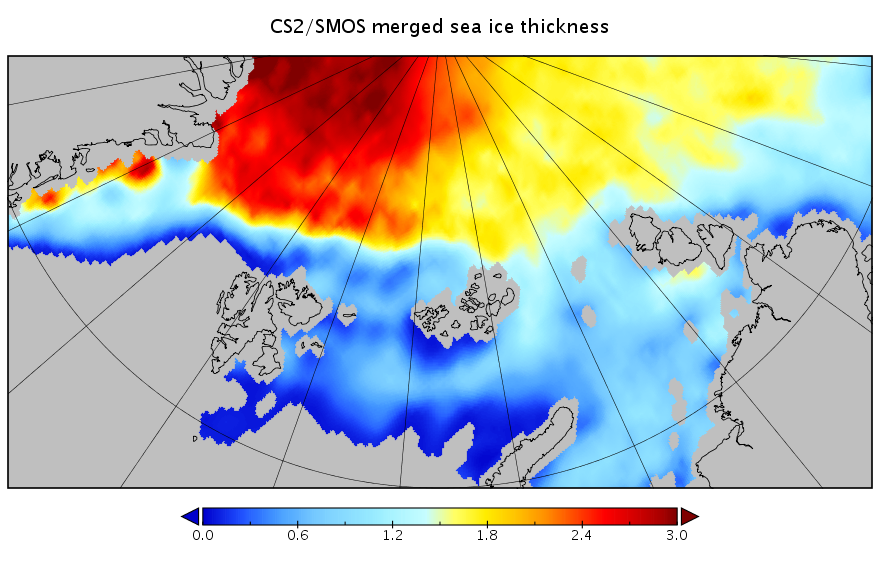
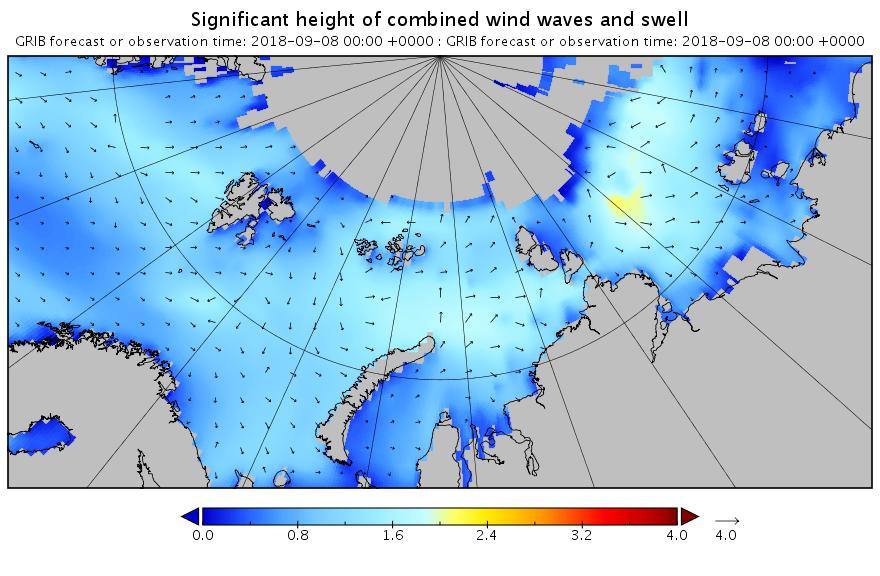
Since the FMI make the gridded data available as well as that visualisation, here’s a closer look at the Bering/Chukchi area:
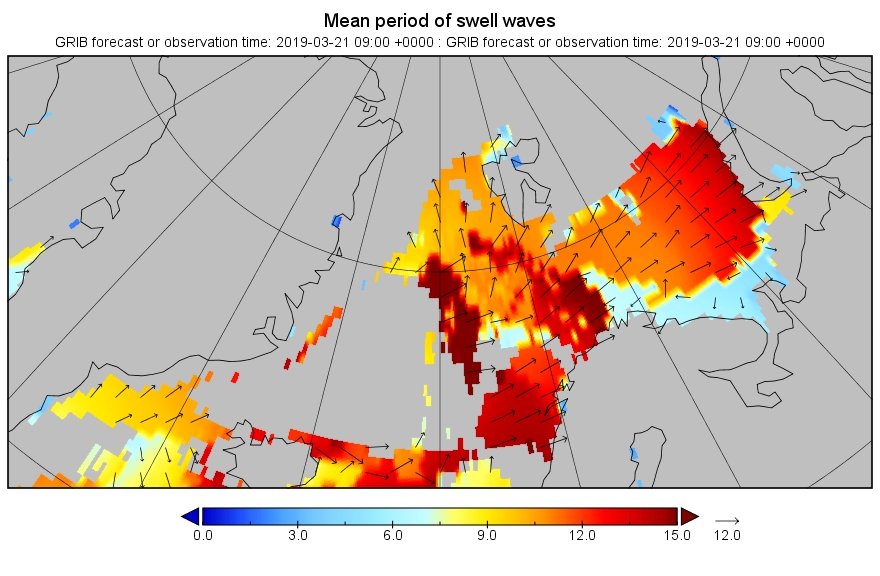
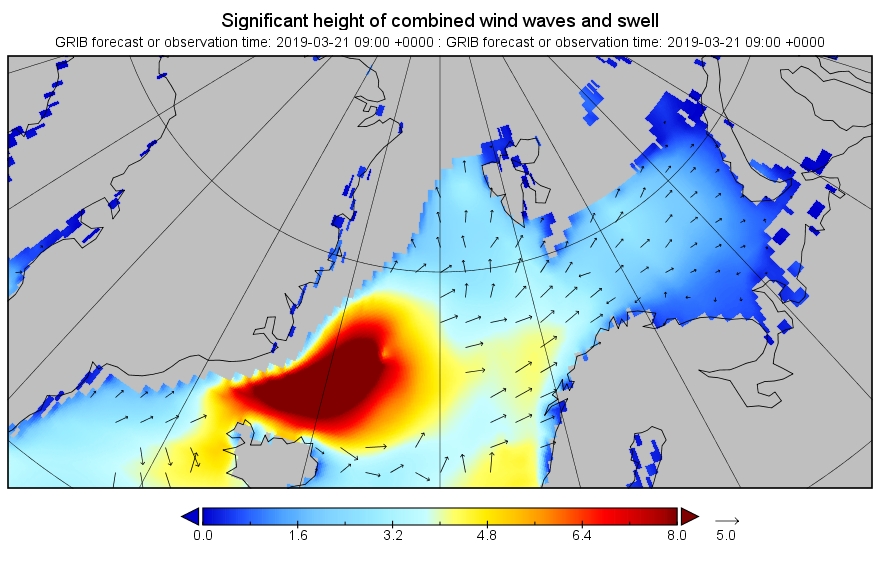
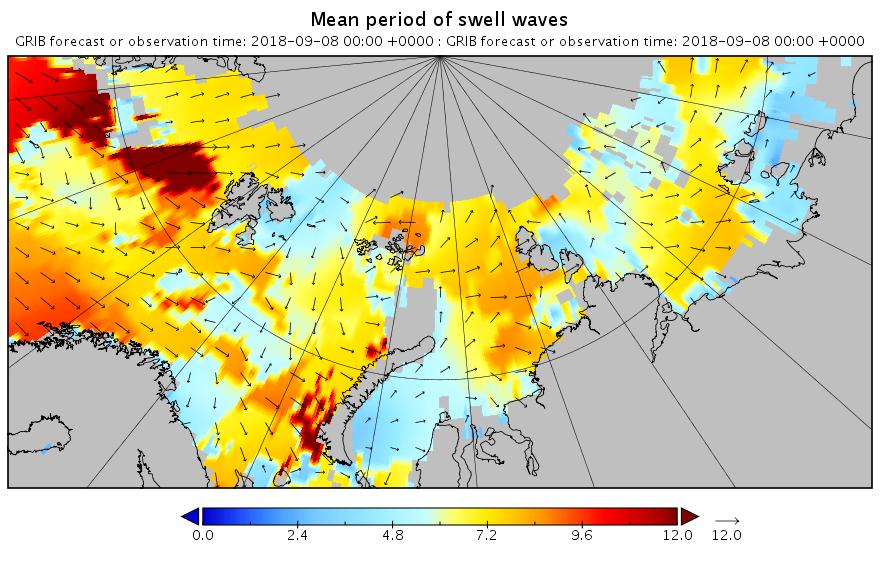
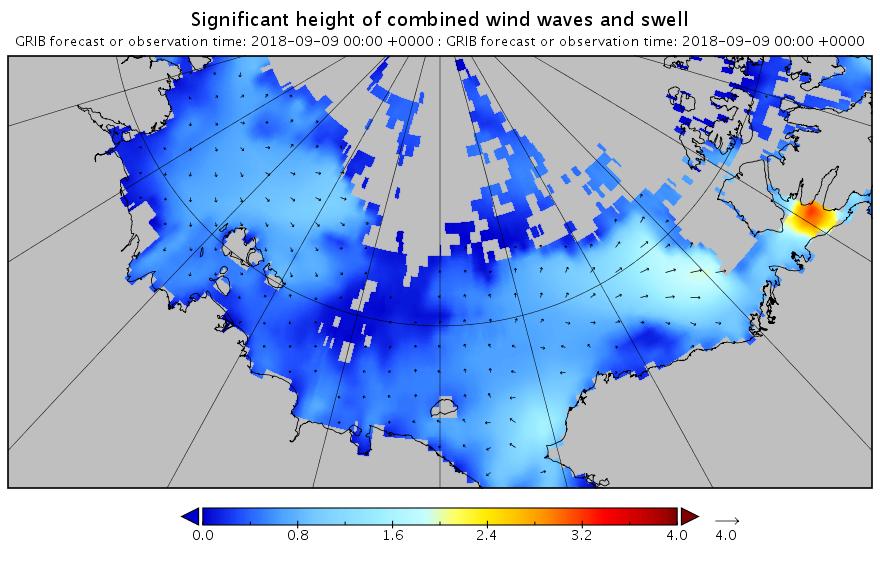
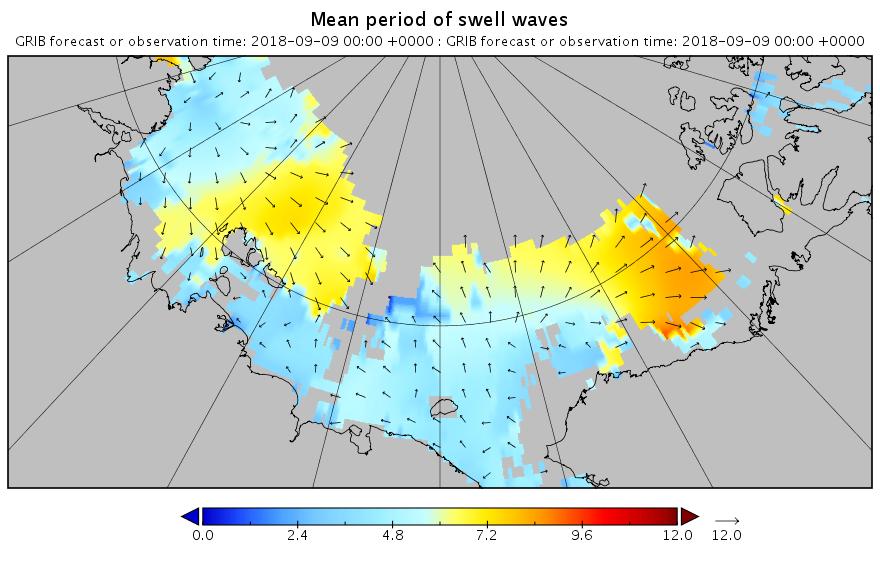
There’s an awful lot of thin ice in the region ripe for rapid melting now that the sun is shining down for a rapidly increasing number of hours per day. Over on the other side of the North Pole there’s also some significant swell forecast to hit the Atlantic edge of the Arctic ice pack. Here’s the current WaveWatch III forecast for 09:00 UTC tomorrow morning:
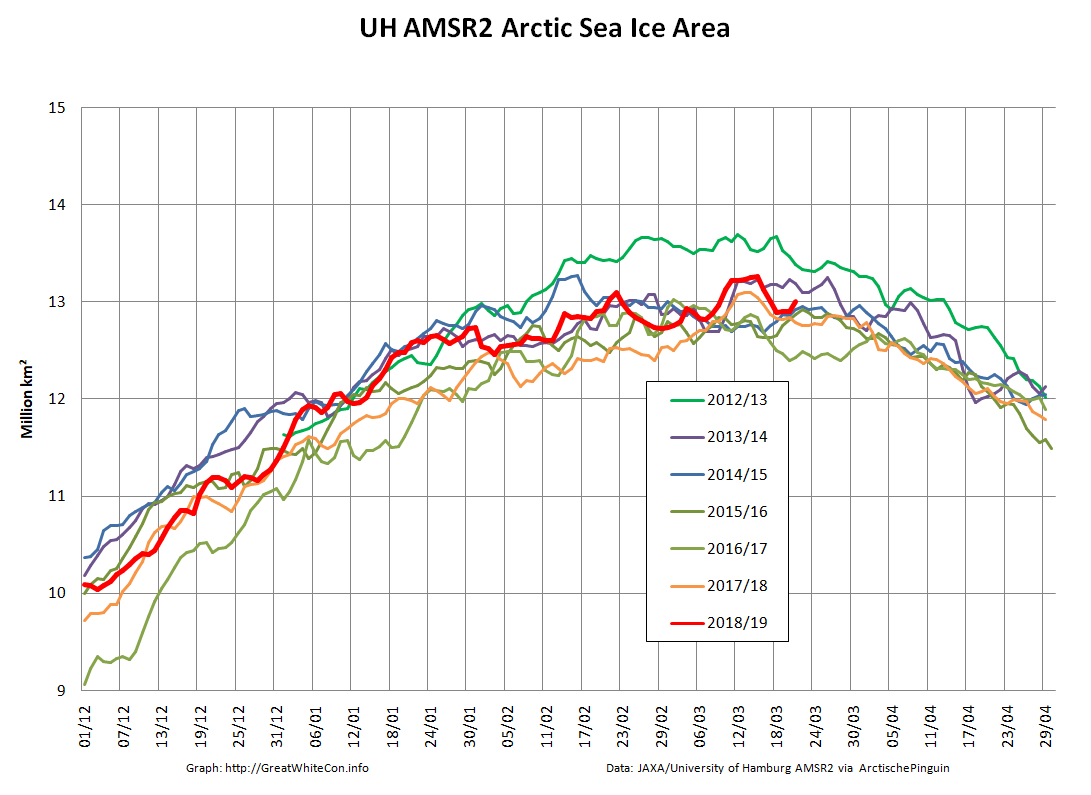
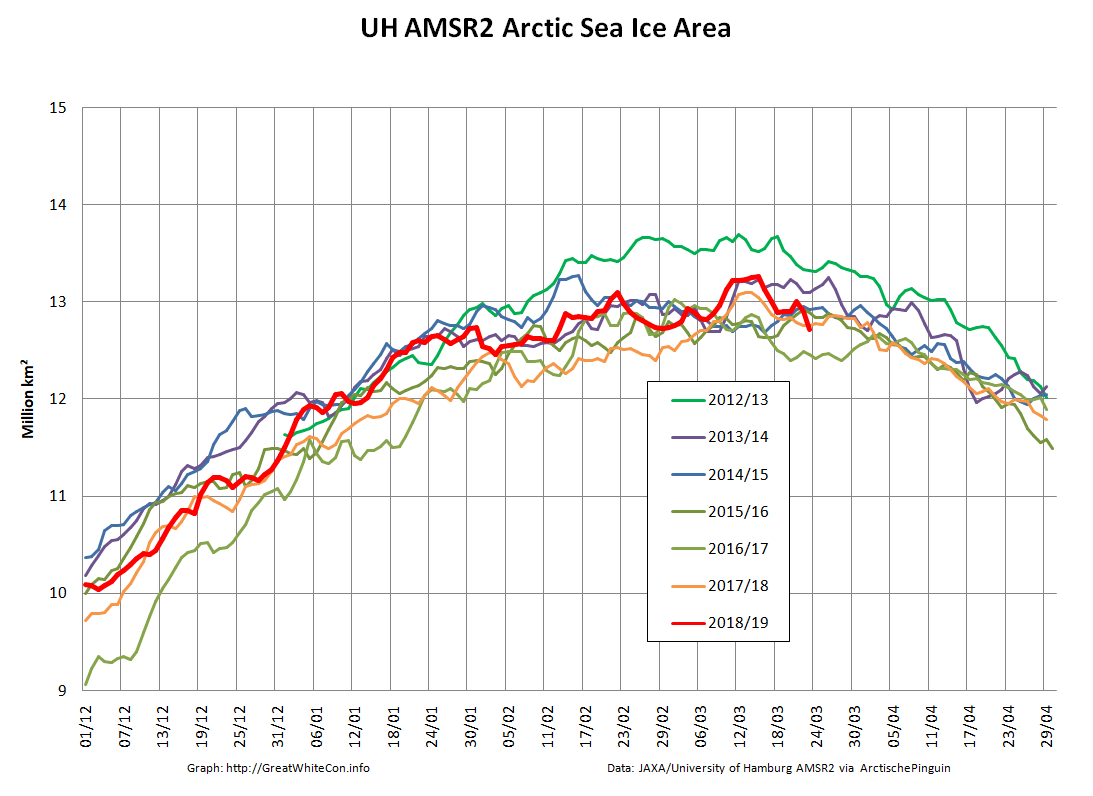
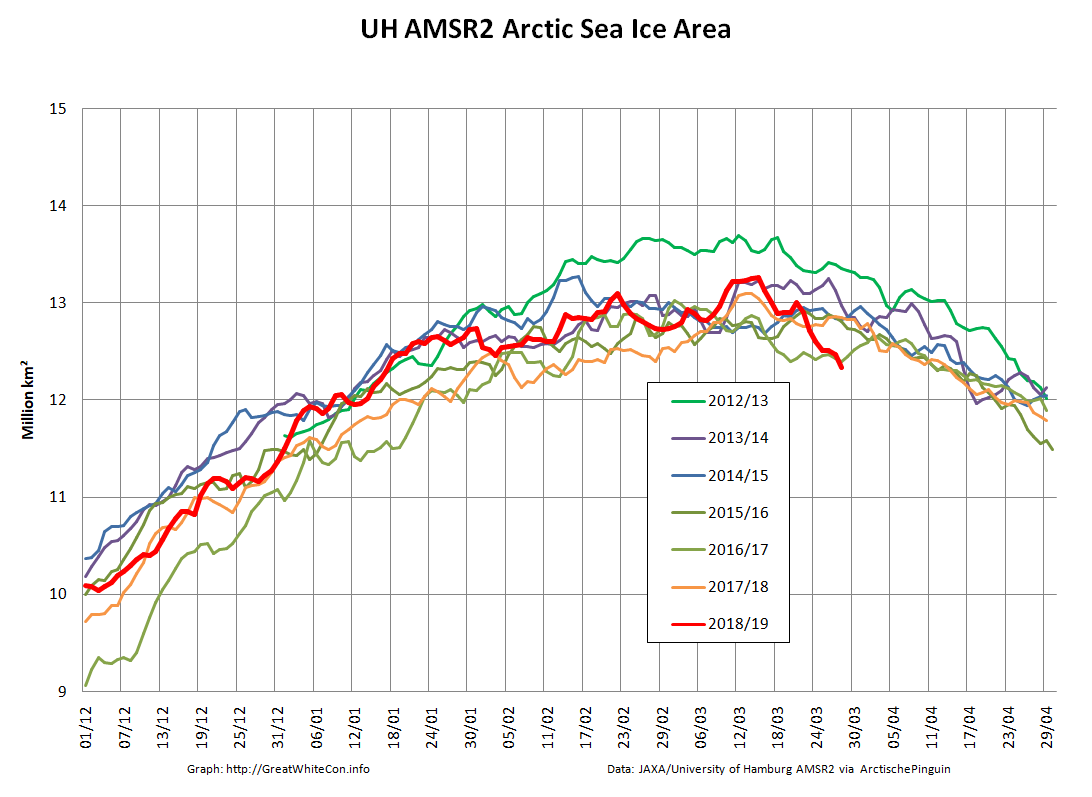
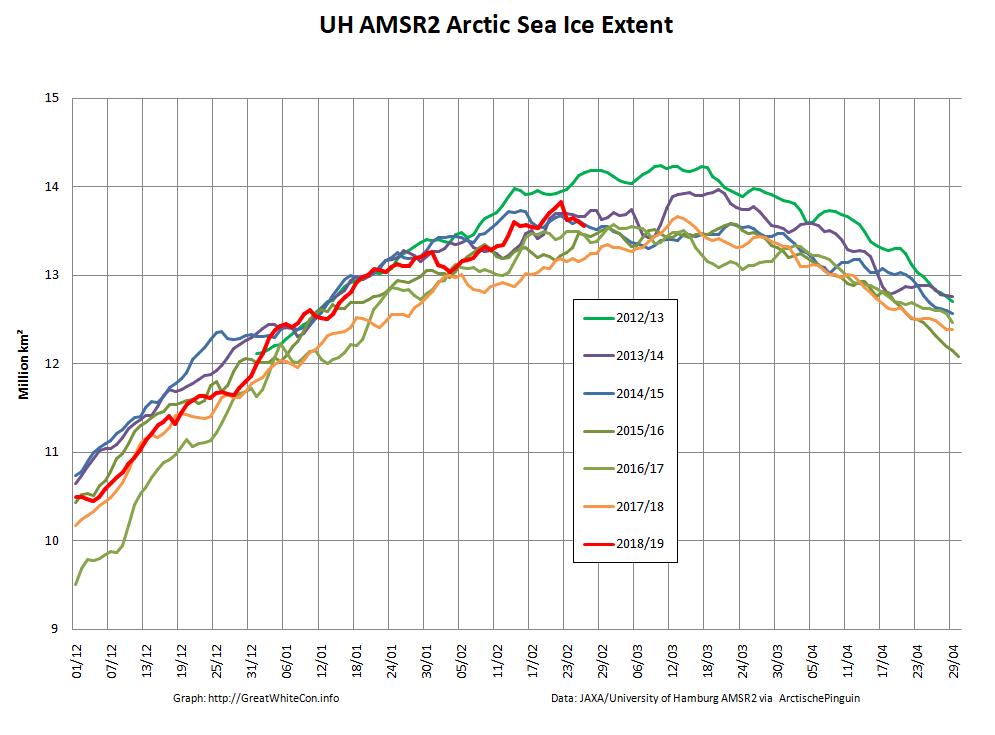
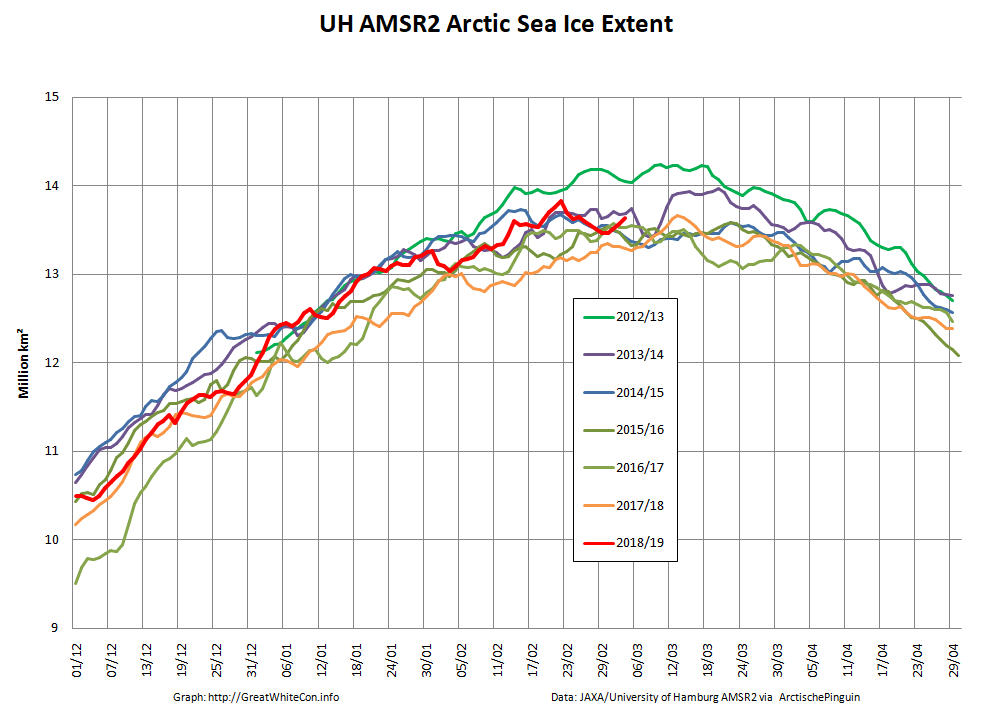
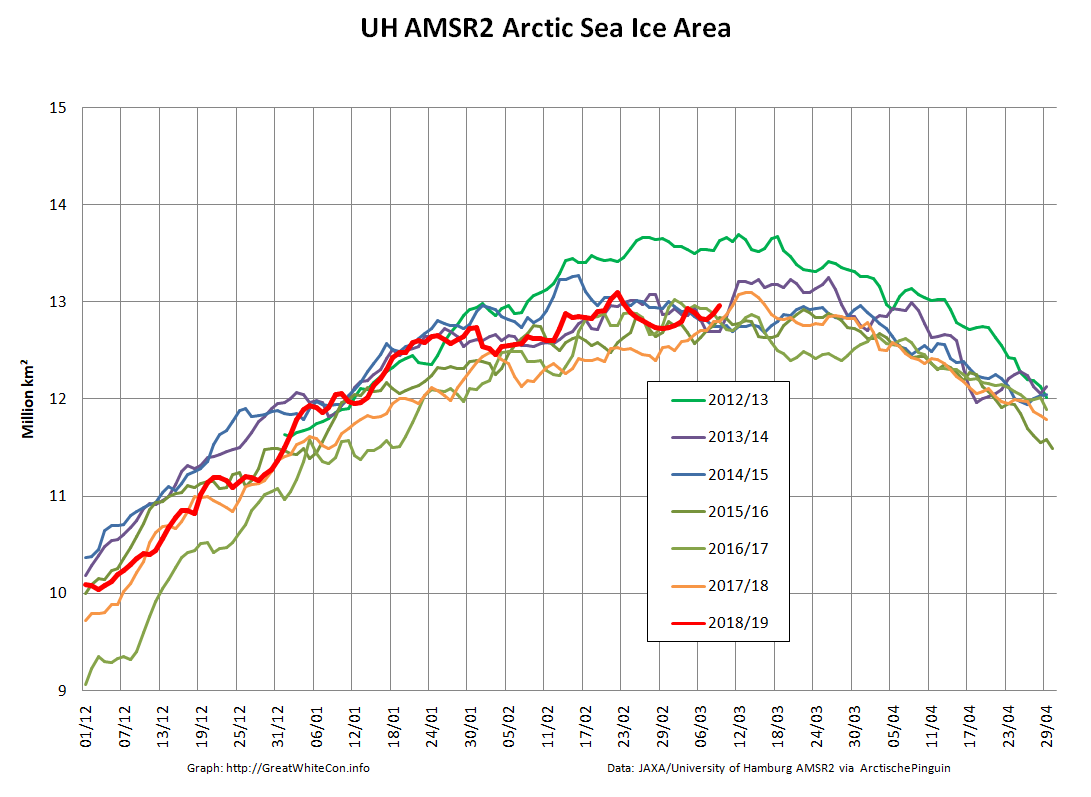
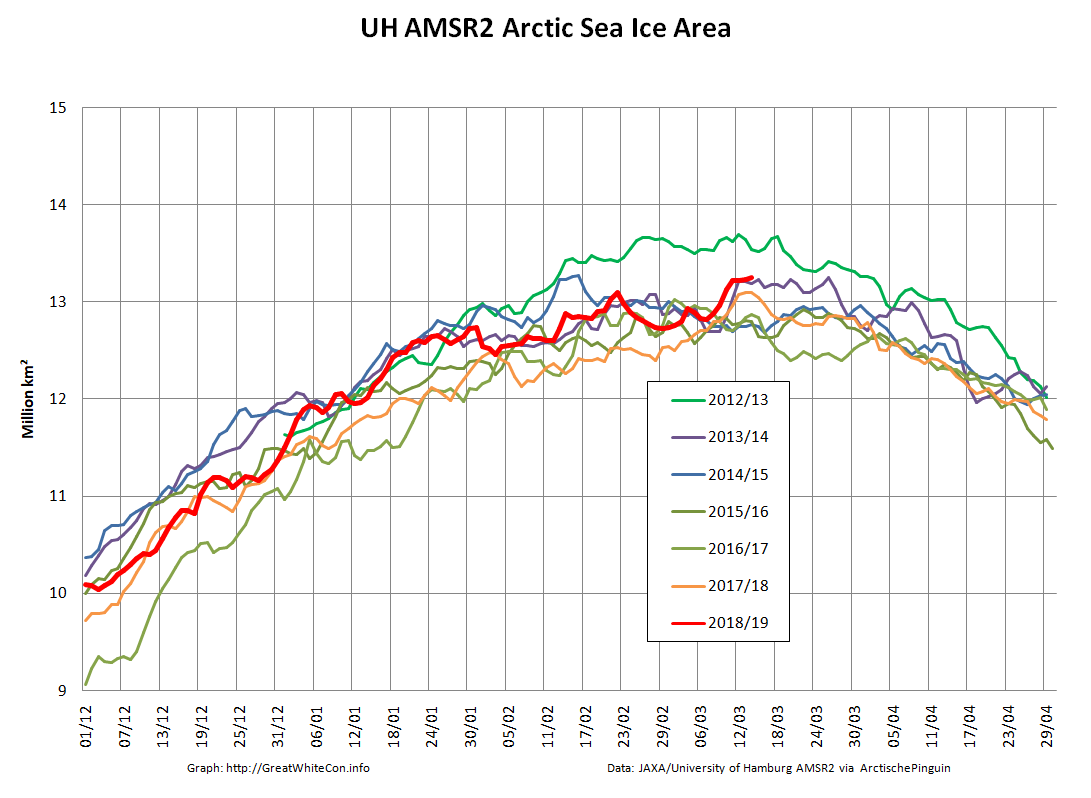
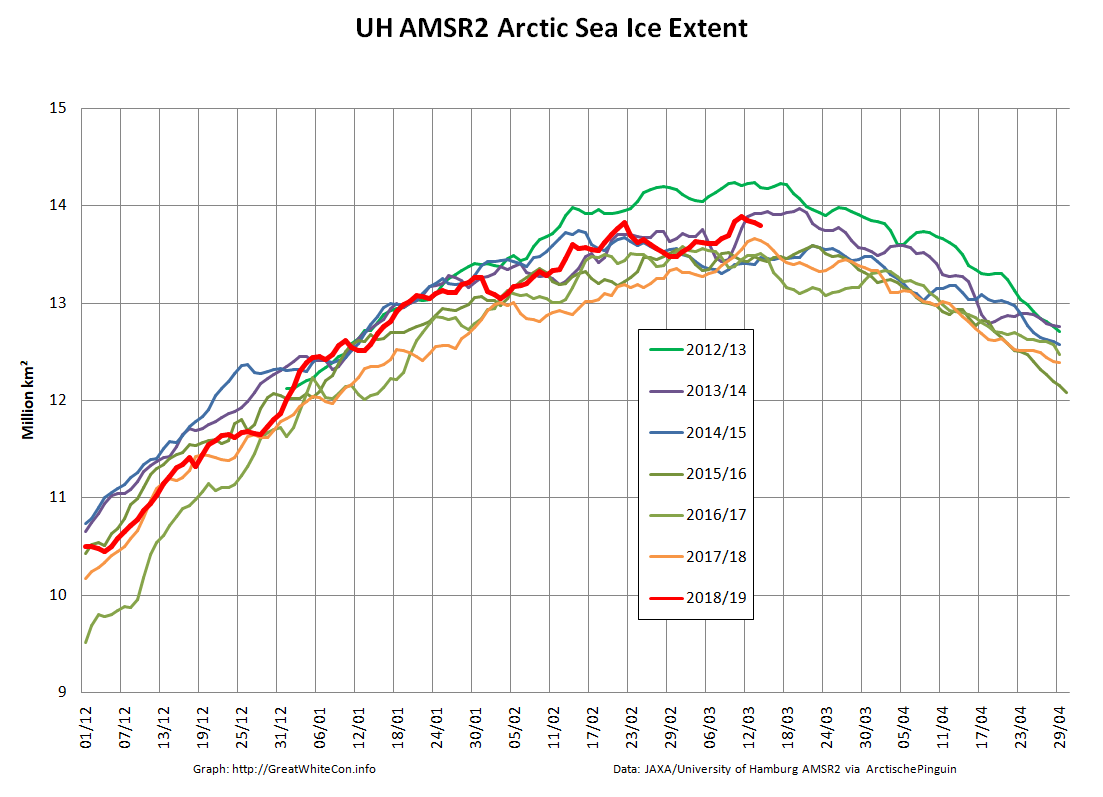
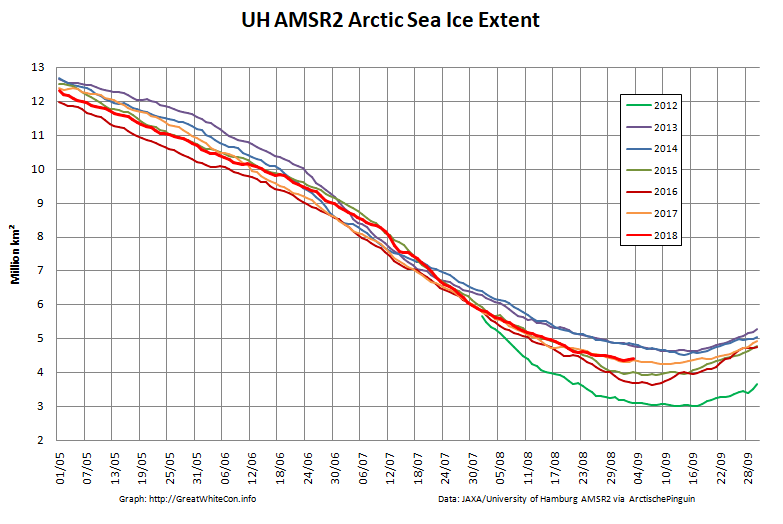
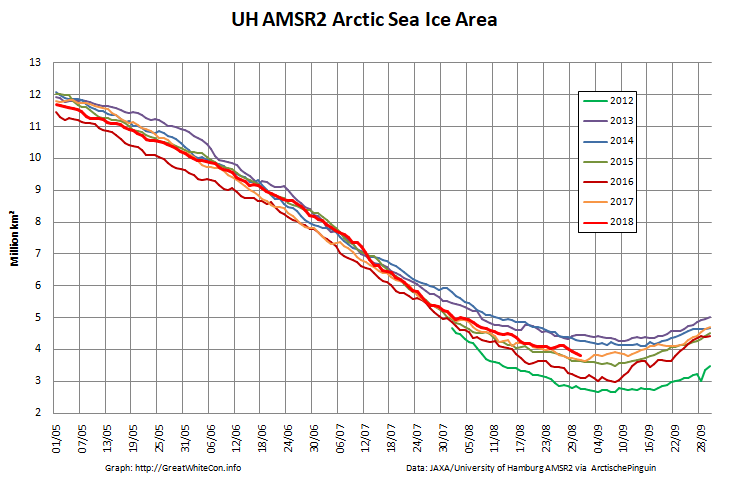
Finally, for the moment at least, here are the current Arctic wide high resolution AMSR2 sea ice area and extent graphs:
[Edit – March 22nd]
This Sentinel 1 SAR image of the Lincoln Sea from PolarView suggests that the northern arch of the Nares Strait is breaking up once again:
It is therefore conceivable that sea ice in the Lincoln Sea will continue to break up and flow south through the Nares Strait for the entire 2018/2019 winter.
[Edit – March 23rd]
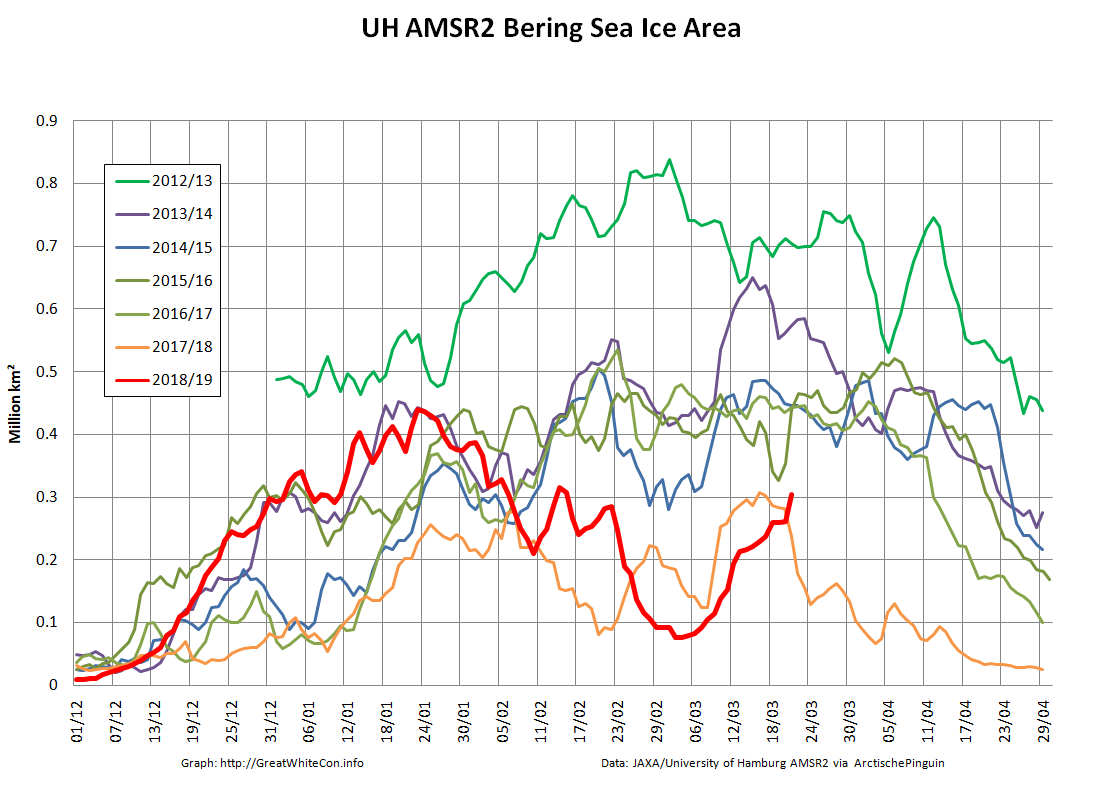
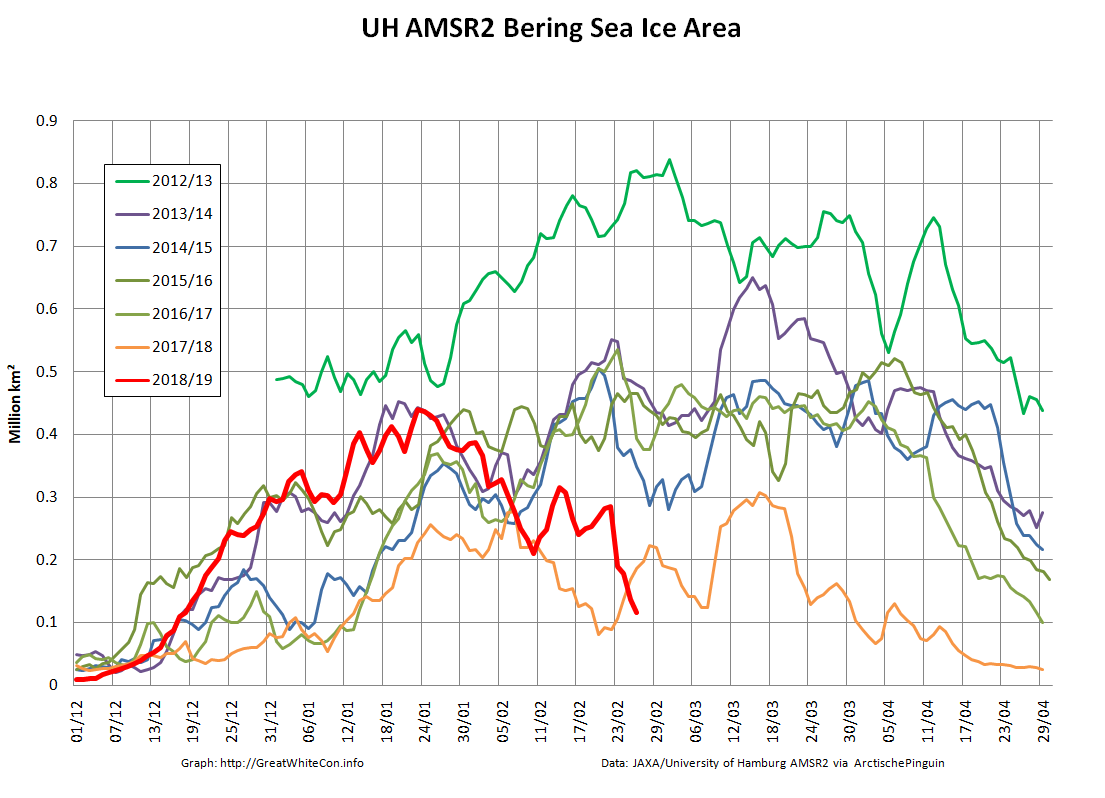
Bering Sea ice area has “rebounded” over the last few days:
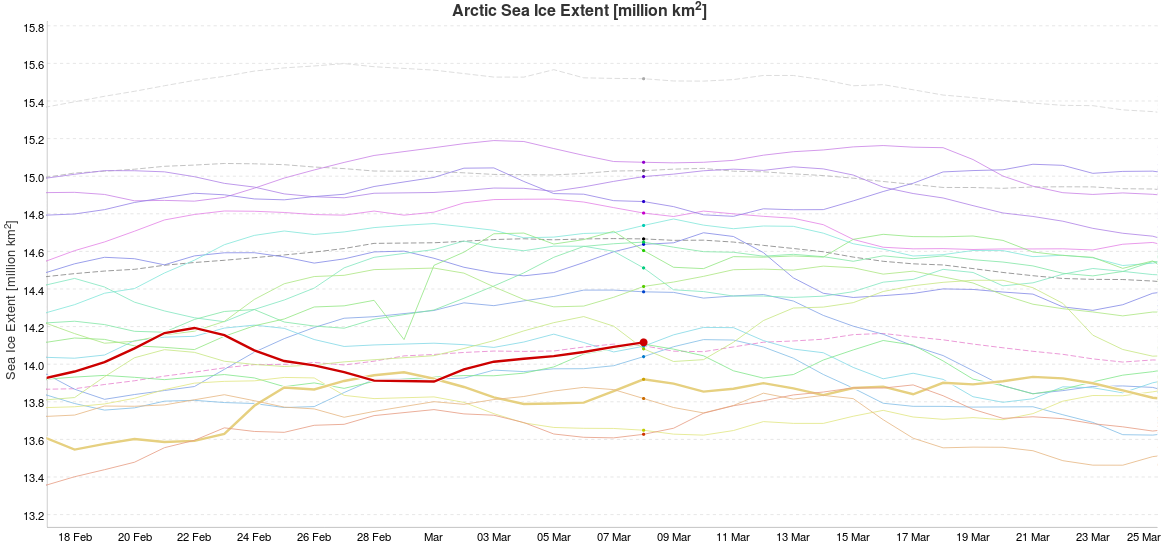
and taken the Arctic wide metrics with it:
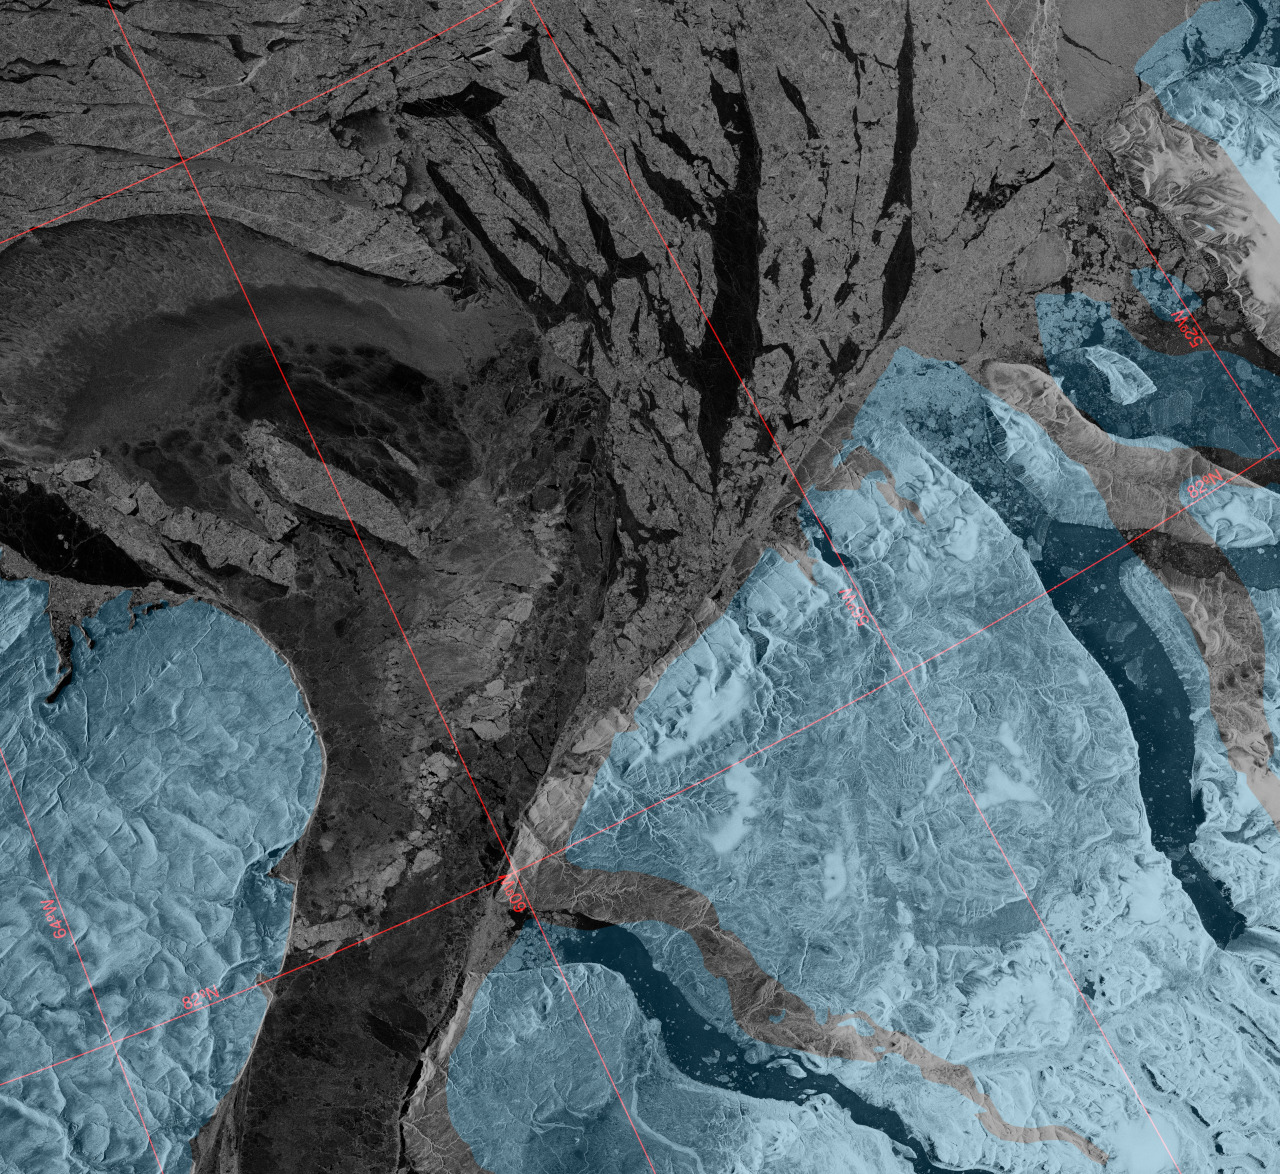
Here’s the latest Sentinel 1 SAR image of the Lincoln Sea and northern Nares Strait:
[Edit – March 24th]
The “rebound” has reversed:
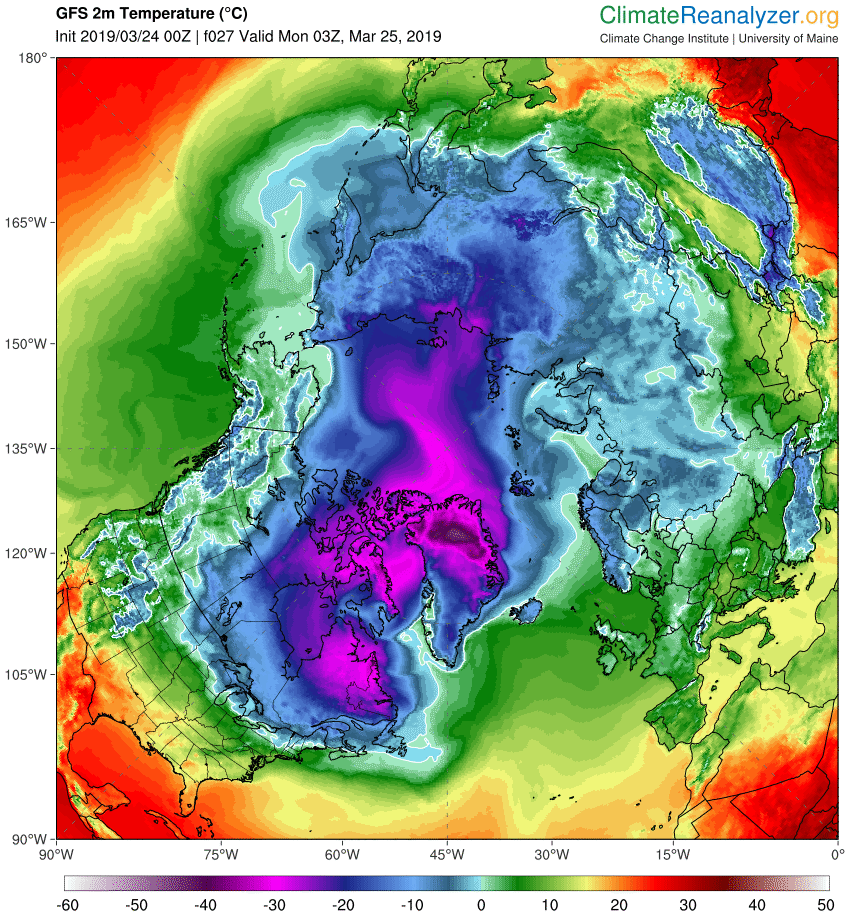
With temperatures above freezing point across the Bering and Chukchi Sea forecast for tomorrow morning expect the decline in Arctic sea ice extent to accelerate:
[Edit – March 25th]
There was a 162k decline in high resolution extent yesterday:
Here also is the current state of the thick sea ice exiting the Lincoln Sea via the Nares Strait:
[Edit – March 27th]
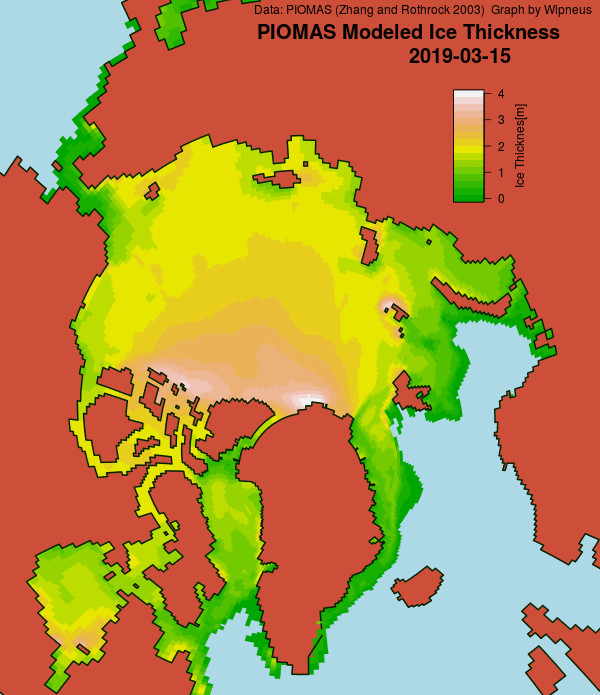
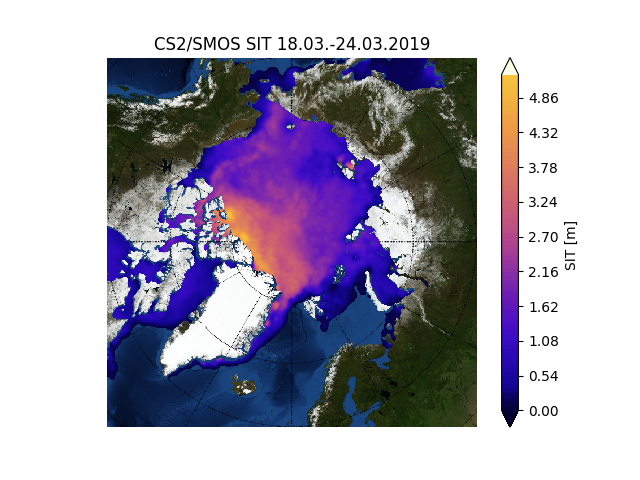
Here’s another week’s merged CryoSat-2/SMOS thickness data from the Finnish Meteorological Institute:
[Edit – March 30th]
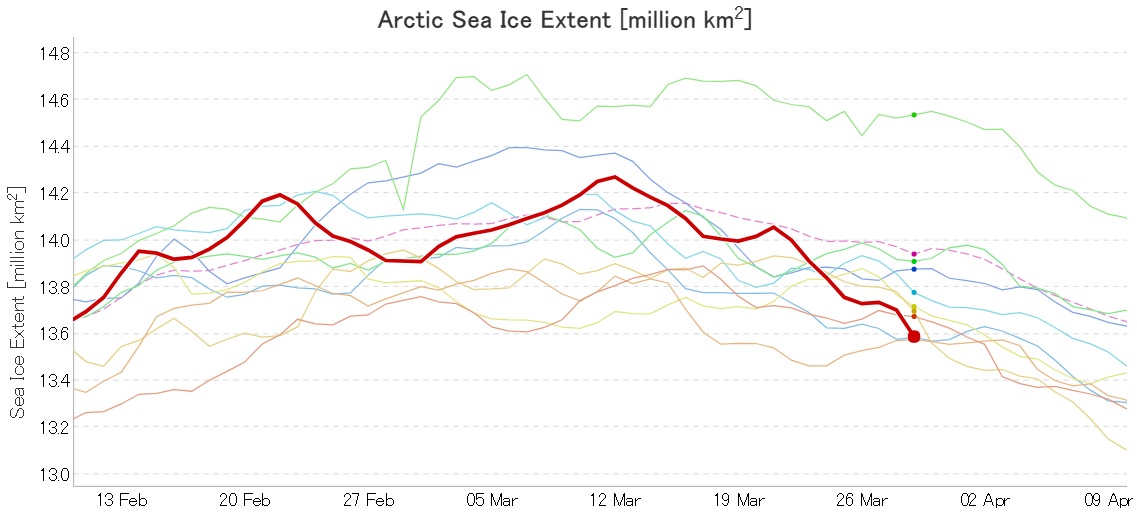
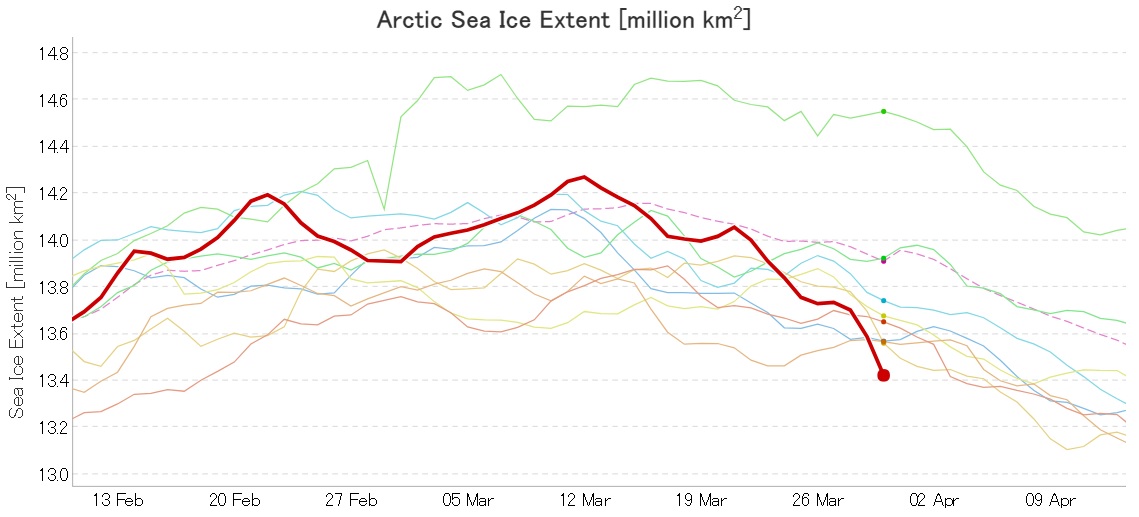
We’re still waiting for Wipneus’ Raspberry Pi to crunch the high resolution AMSR2 numbers, but here’s the latest from JAXA:
2019 currently in 3rd place by a whisker.
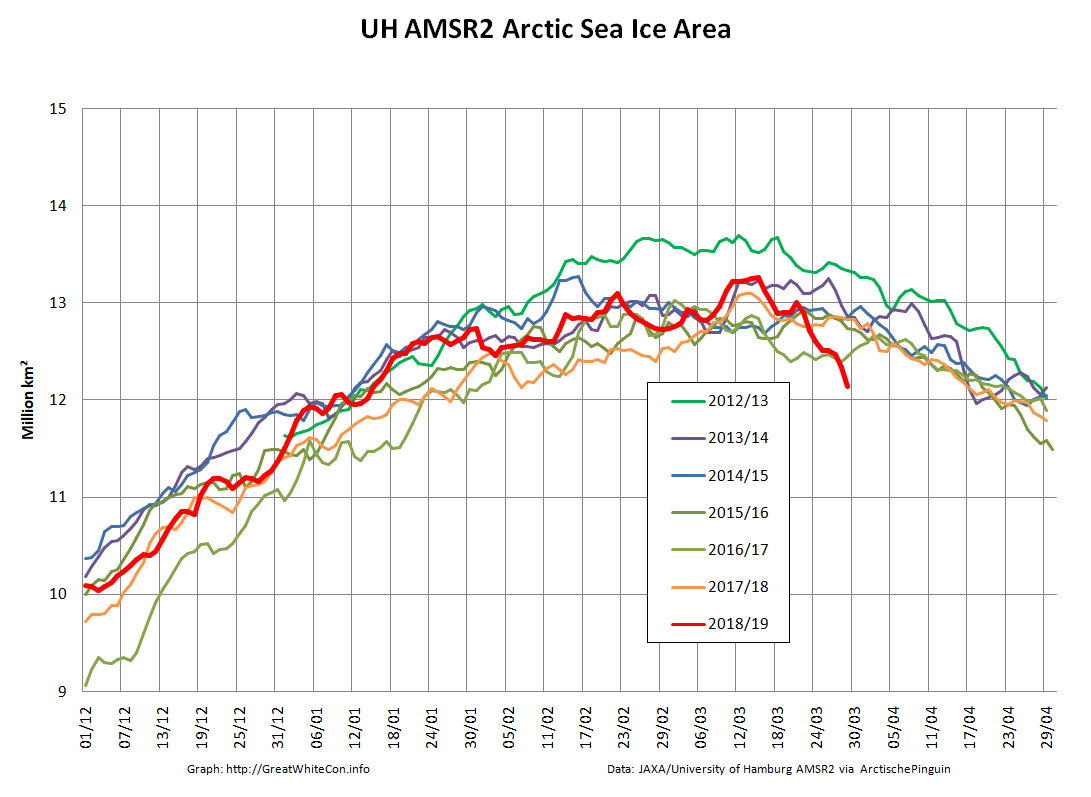
P.S. The high resolution AMSR2 numbers are out:
Area is certainly lowest for the date in the AMSR2 era. Extent will almost certainly achieve that status tomorrow. Excluding the two most peripheral seas reveals perhaps an even more worrying picture?
[Edit – March 31th]
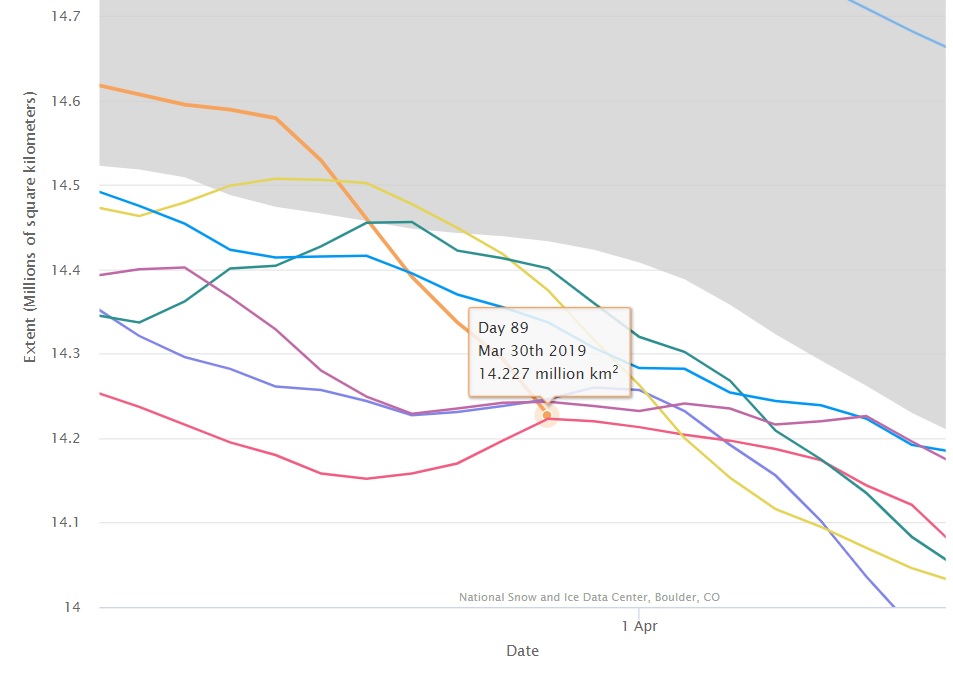
Arctic sea ice coverage is now firmly in the “lowest extent for the date in the satellite record” category, whichever metric you care to choose:
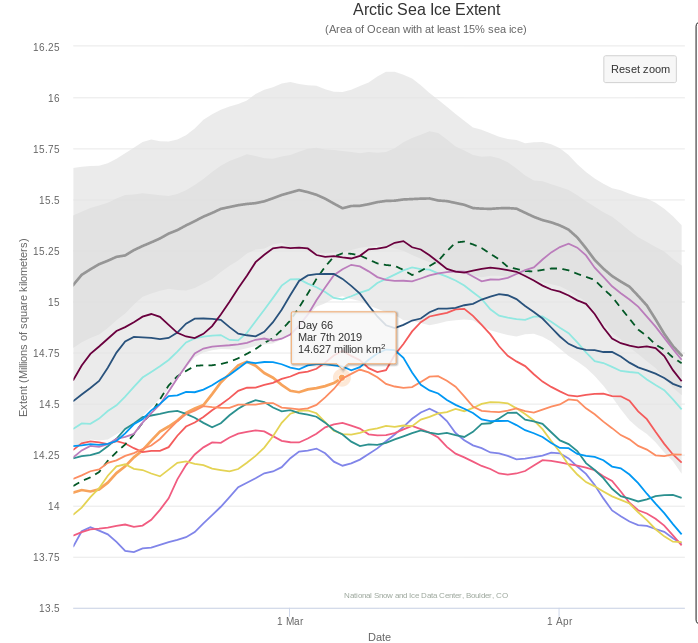
The NSIDC 5 day average is in a “statistical tie” for first place with 2017:
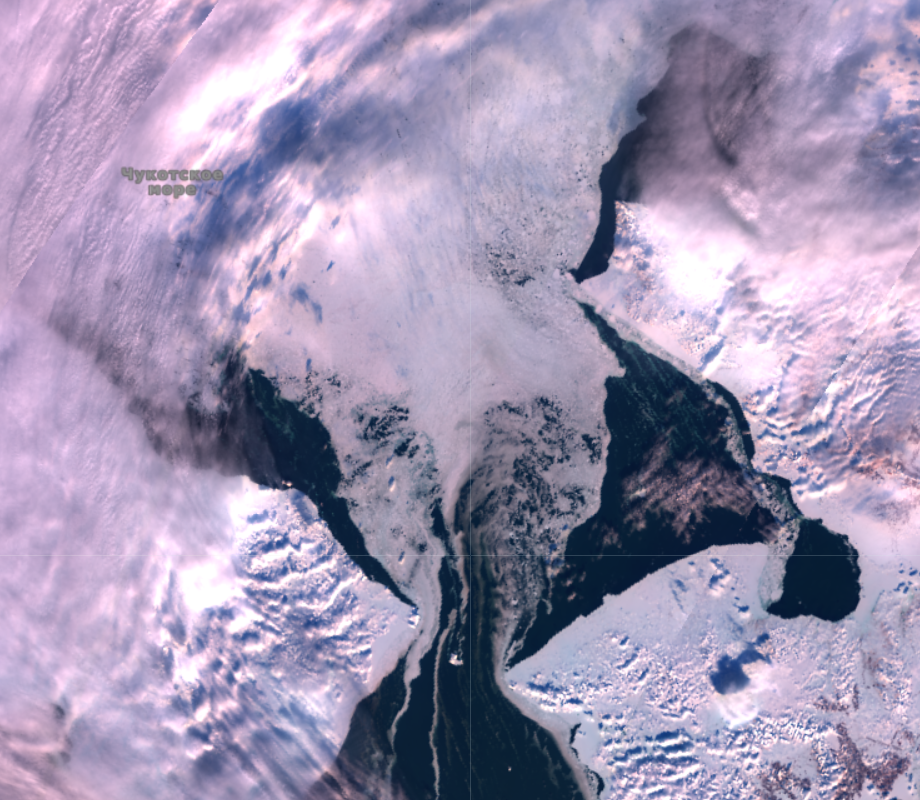
It’s been a long wait for the first ever Great White Con Arctic Basin Big Wave (Fantasy?) Surfing Contest to remove the ‘F’ from the overlong acronym. However currently the omens are bad for the sea ice in the Arctic Basin, which is sadly good for the GWCABBWSC. As we announced yesterday, there is already plenty of open water in the Chukchi Sea north of the Bering Strait between Russia and Alaska:
All of which means that today we are extremely unhappy to be able to announce that the waiting period for the Great White Con Arctic Basin Big Wave Surfing Contest 2019 began on March 1st.
Earlier this week I posed a little conundrum over on Twitter. Here it is:
Nobody has called the Great White Con Ivory Towers hotline with the correct answer as yet, so today we can also reveal that the third in our series of Arctic Basin equipment evaluations took place last Wednesday on the outskirts of Newquay in North Cornwall. Here’s a slightly less obscure clue for the pub quiz fanatics amongst you:
As you can see from my neoprene encased image on Twitter, I was perhaps slightly over dressed for the weather conditions last week. I was wearing a C-Skins thermal rash vest with integrated hood inside my ancient Gul 5/4/3 winter wetsuit plus Tiki 6 mm socks and 2 mm webbed gloves. Even my fingers were more than warm enough on the day, although it’s fair to say that conditions weren’t typical for late summer in the Arctic Basin! What’s more they weren’t even typical for Newquay, since the weather on Wednesday was the tail end of a “heat wave” involving the highest February temperatures in England since the Met Office’s records began:
We’ll be doing an attribution study on how this week’s record-breaking temperatures were affected by #climatechange A Met Office analysis in 2014 showed that since 2000 there were 10 times as many high temperature records broken as cold temperature ones https://t.co/6cgNBdj7CYpic.twitter.com/1CEaORGsQx
What with one thing and another warming wise we’re confidently(ish) anticipating that the Great White Con big wave surf team will be searching the shores of the Arctic Basin on their electric powered jetskis for potential big wave spots by early September 2019. Unfortunately the opposing “Great Green Con” team haven’t worked out how to drive a jetski yet, but hopefully we can resolve that minor problem before the Arctic refreeze begins once again?
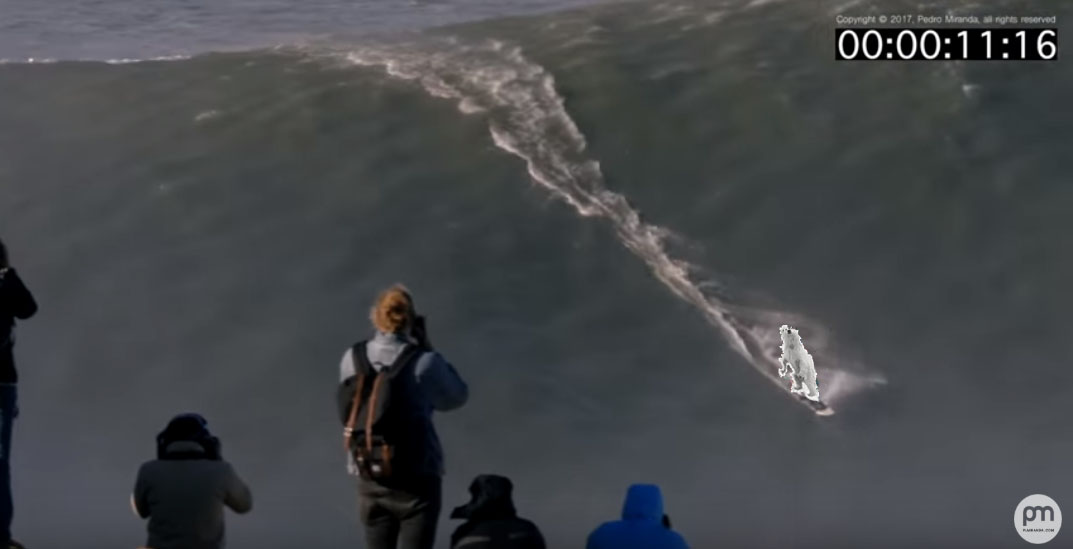
Regular readers who also follow the surfing news may recall that Great White Con team leader Andrew Cotton broke his back during his award winning wipeout at Nazaré in Portugal back in November 2017?
I spoke to Cotty yesterday and he assured me that his back was already healed sufficiently to take on the biggest waves the Arctic might care to offer over the coming months. However the same doesn’t yet apply to his more recent knee injury:
He expects to be fully fit by the end of the Northern Hemisphere summer, but failing that Cotty’s team partner Garrett McNamara has also successfully returned from injury recently, and hasn’t yet hurt anything else!
By the end of the long contest waiting period we will also have selected the lucky winner of our 2019 “New Einstein” competition who will be able to enjoy being fitted with one of our custom polar bear suits before partnering with “Great Green Con” team leader David Rose. Here’s our artist’s impression of a forthcoming GGC team equipment evaluation session on the next big swell to hit Nazaré:
With apologies to Pedro Miranda, Andrew Cotton and polar bears worldwide.
The omens are good that 2019 is destined to be a year of firsts in the Arctic. Our regular reader(s) will no doubt fondly recall previous editions of our annual Great White Con “New Einstein” Award? 2019’s competition breaks all the moulds by opening the running with a quote from Snow White’s home from home at the Arctic Sea Ice Forum rather than one of the usual “skeptical” venues!
Here for your delectation is the very first “New Einstein” contestant of the 2019 melting season:
Your unnecessary over the top haughtiness and implicit threats is not helping your communication style one bit Jim. I am far from impressed atm with your version of the Ivory Tower you seem to inhabit. By all means ‘sharpen your sword’ if that is what you imagine you are dealing with because someone says they do not quite understand what you thread is all about.
You can either answer such reasonable questions with a modicum of sincerity and genuineness or continue in the direction you are heading.
What I found out these last 3 months as a Newbie on this forum is that some people here don’t like it when new members take away the spotlight from the oldtimers. All they do is moan and bitch over file sizes, but they fail to reply to any other message I post. So what we have here my dear friend is a textbook example of bigotry. We are excluded from the group… They rather have we left, so they get all the attention again… But who cares? Leave those idiots be. Do what you know to be right, and work together for the benefit of all mankind!
in conjunction with:
Your only contributions to this thread have been complaints and promotions for your own website.
Please refrain from doing so! If you have some Nullschool animation to contribute or comments on the work that is posted here, feel free to do so! If you only come here to complain and tell people what to do, please go away!
and not forgetting:
May I remind everyone that this is the Nullschool Animations thread. I made this thread because you bastards complaint about my graphics on the melting season thread, and now you come here to bitch AGAIN? GO FUCK YOURSELVES!!!!!!!!
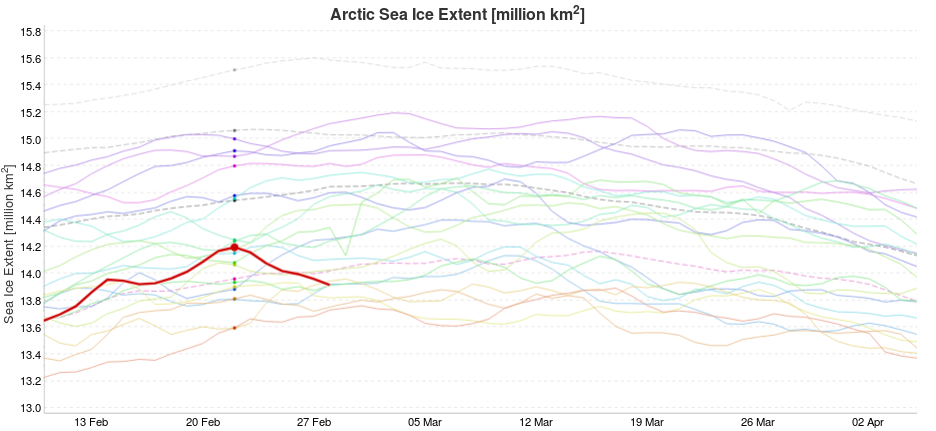
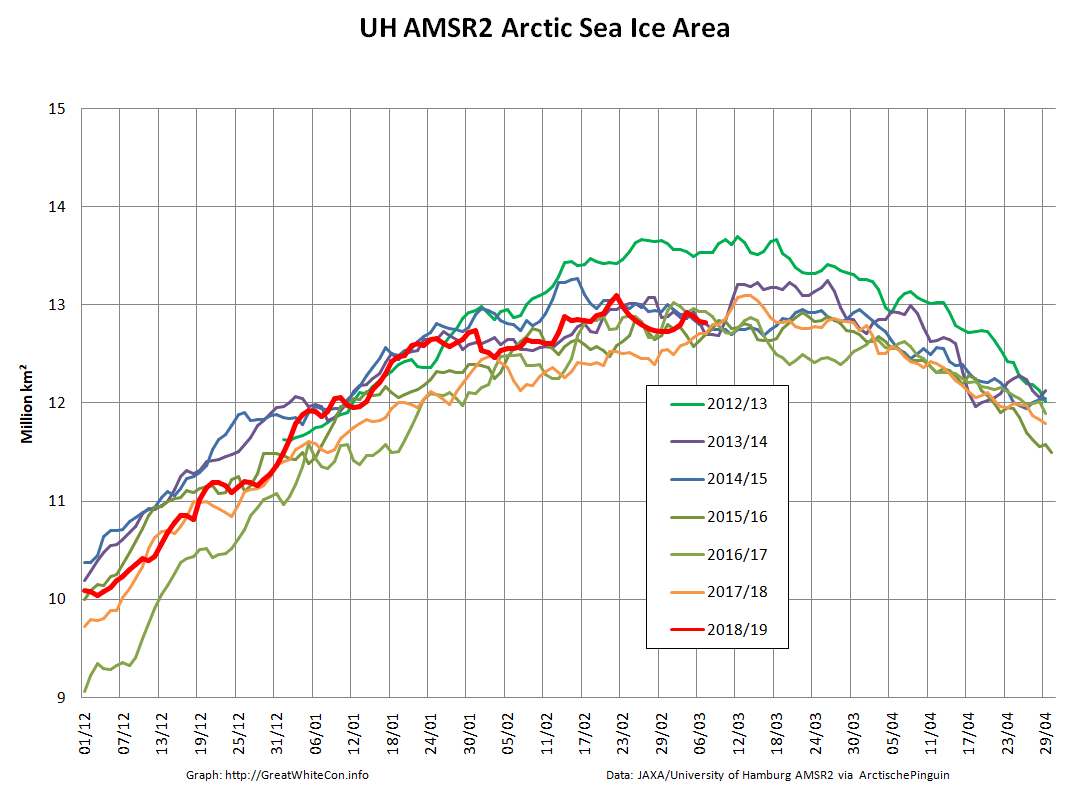
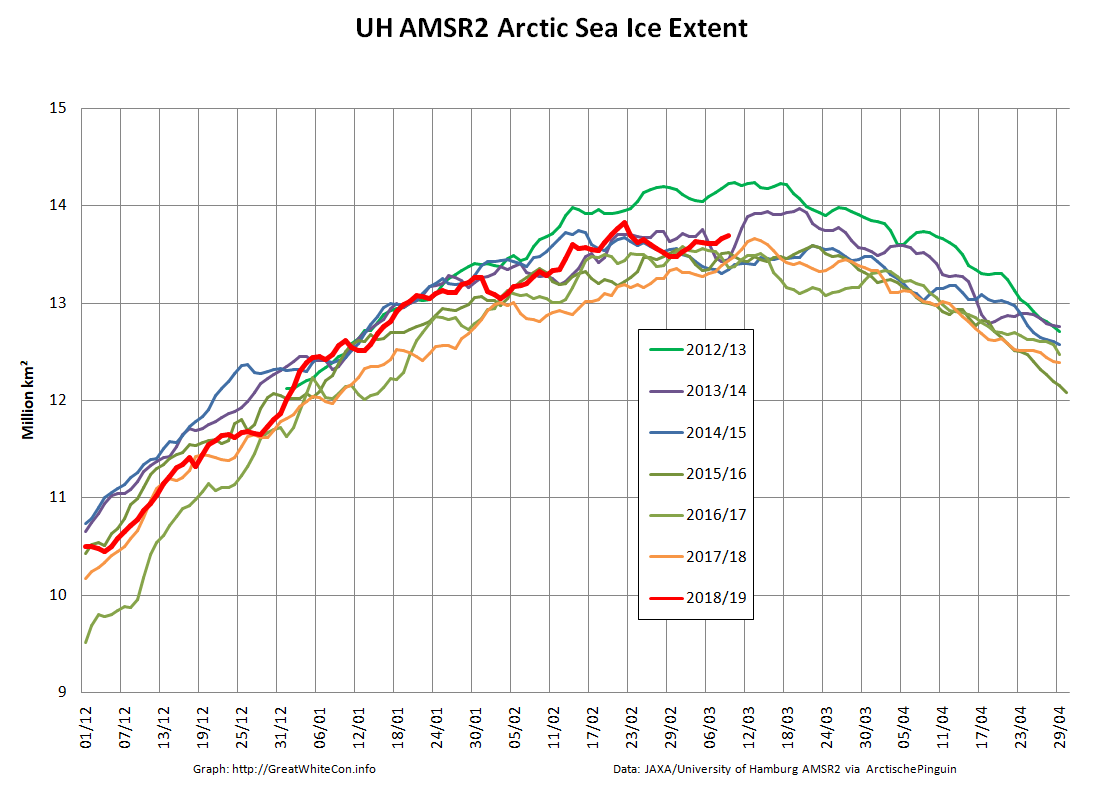
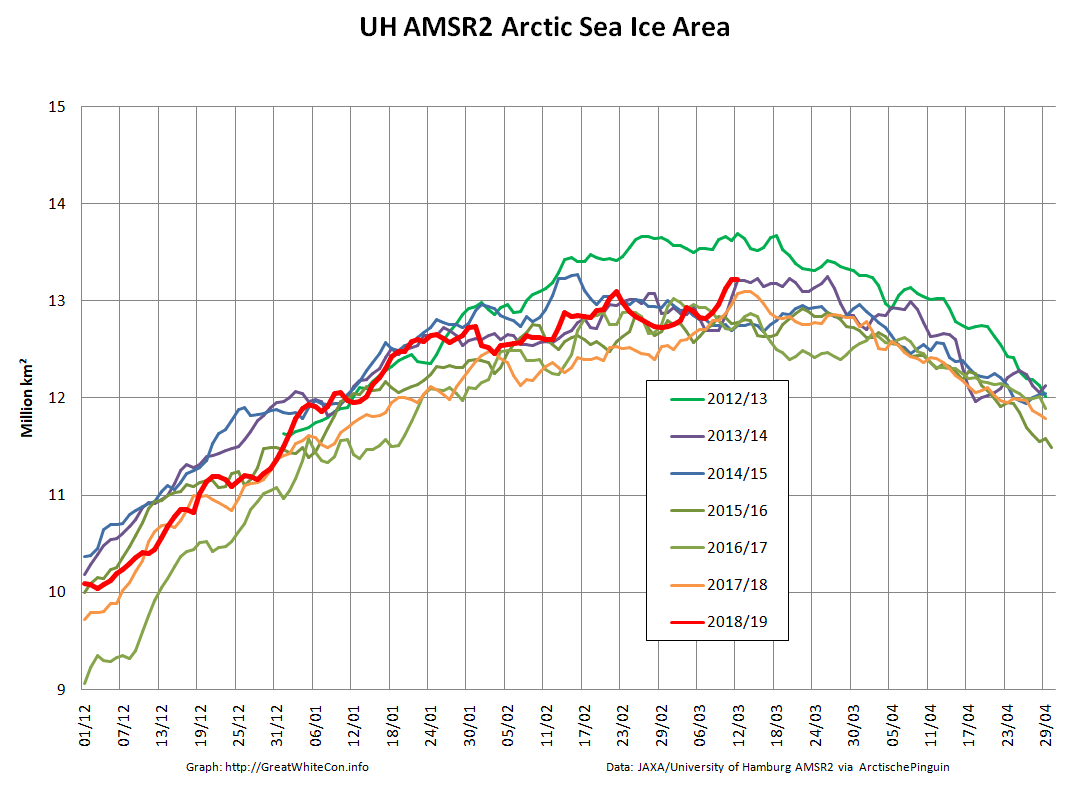
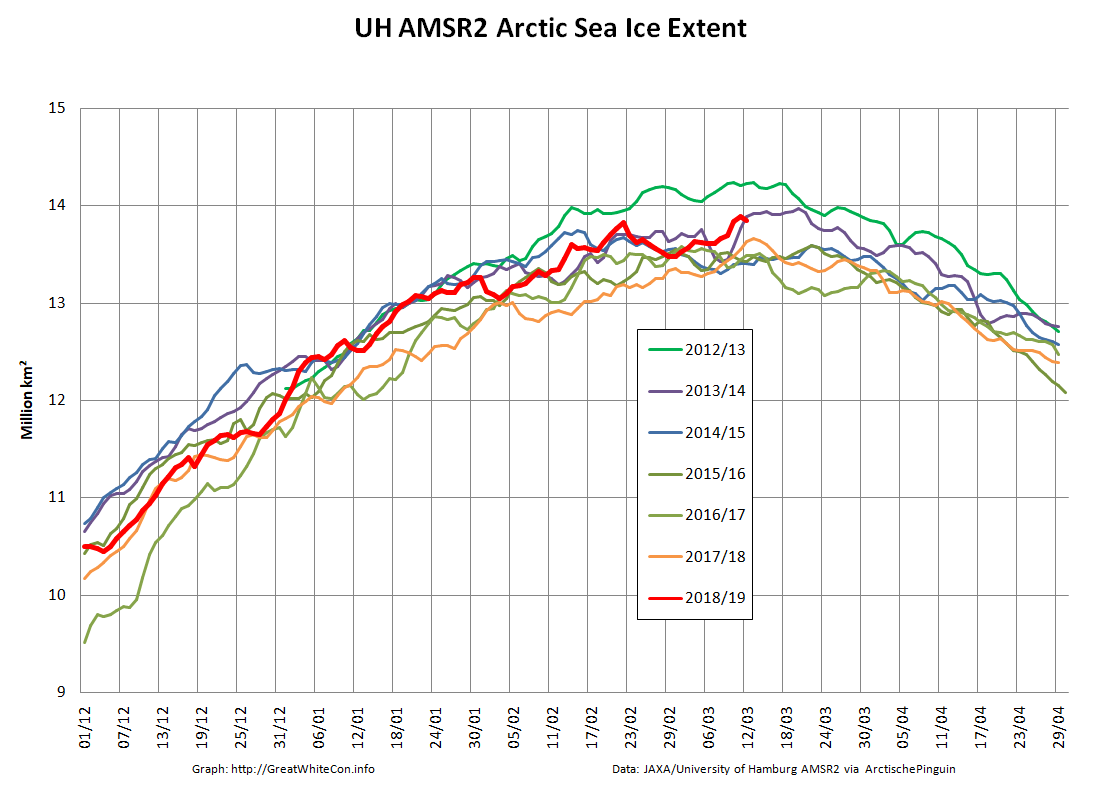
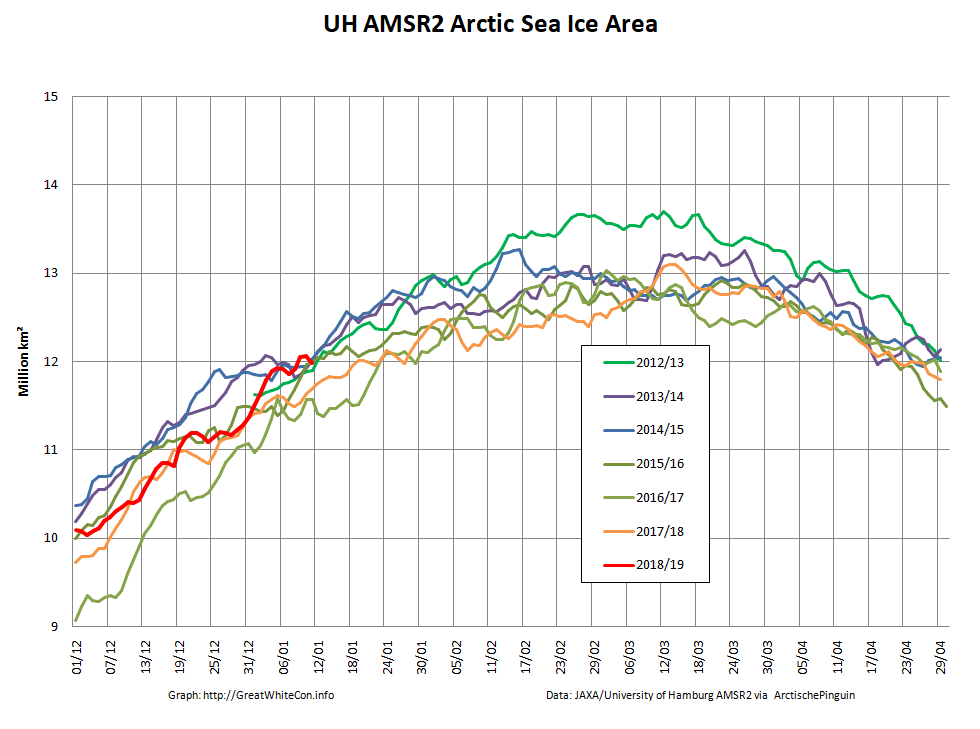
March 2019 has arrived, which in recent years has proved to be by far the likeliest month to contain the maximum extent of Arctic sea ice for the year. To begin with, here’s our favourite high resolution extent graph calculated by “Wipneus” from University of Hamburg/JAXA AMSR2 data:
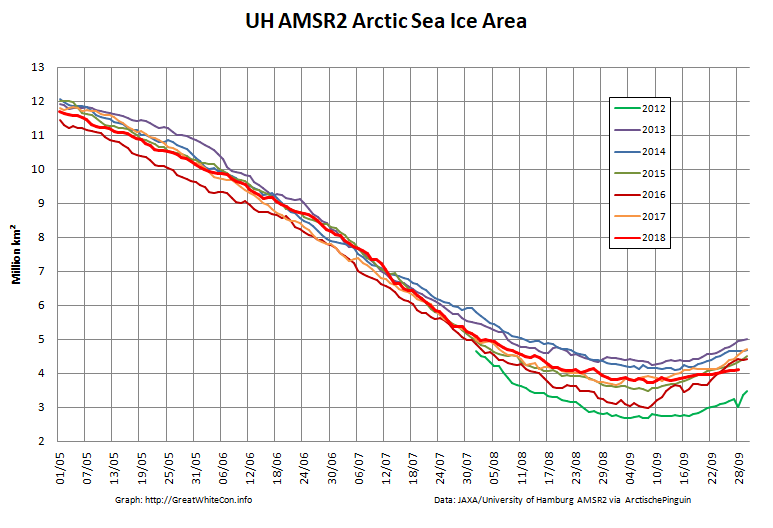
Hopefully you can plainly see the pronounced sharp peak towards the end of February 2019? The current maximum Arctic sea ice extent for 2019 is 13.83 million square kilometers on February 22nd. Here’s Arctic sea ice area for good measure:
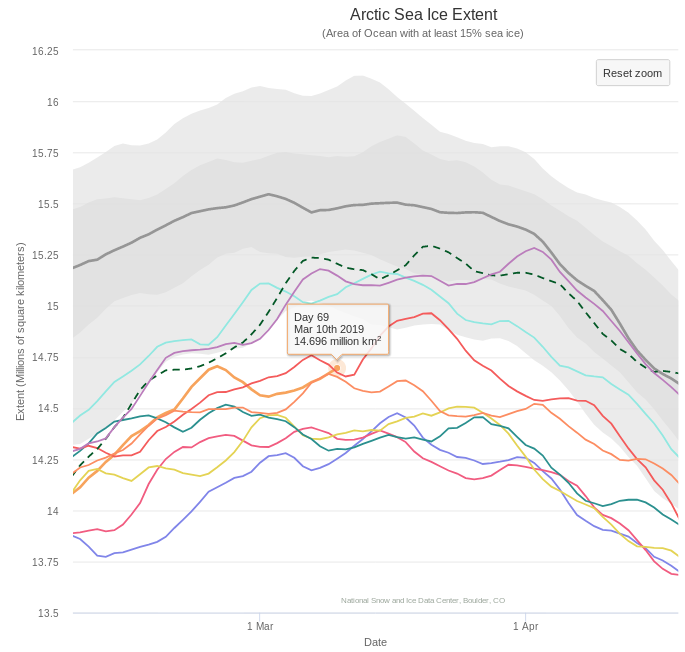
The current maximum area for 2019 is 13.10 million square kilometers, also on February 22nd. Here too is the NSIDC’s 5 day averaged extent:
This reveals a current maximum extent for 2019 of 14.705 million square kilometers on February 24th.
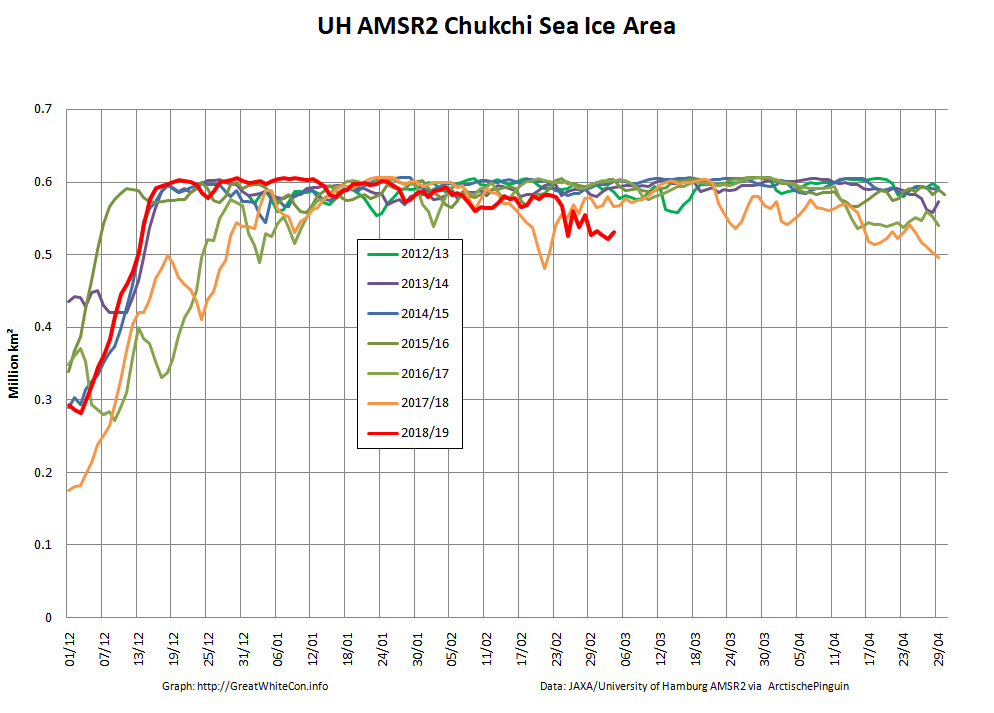
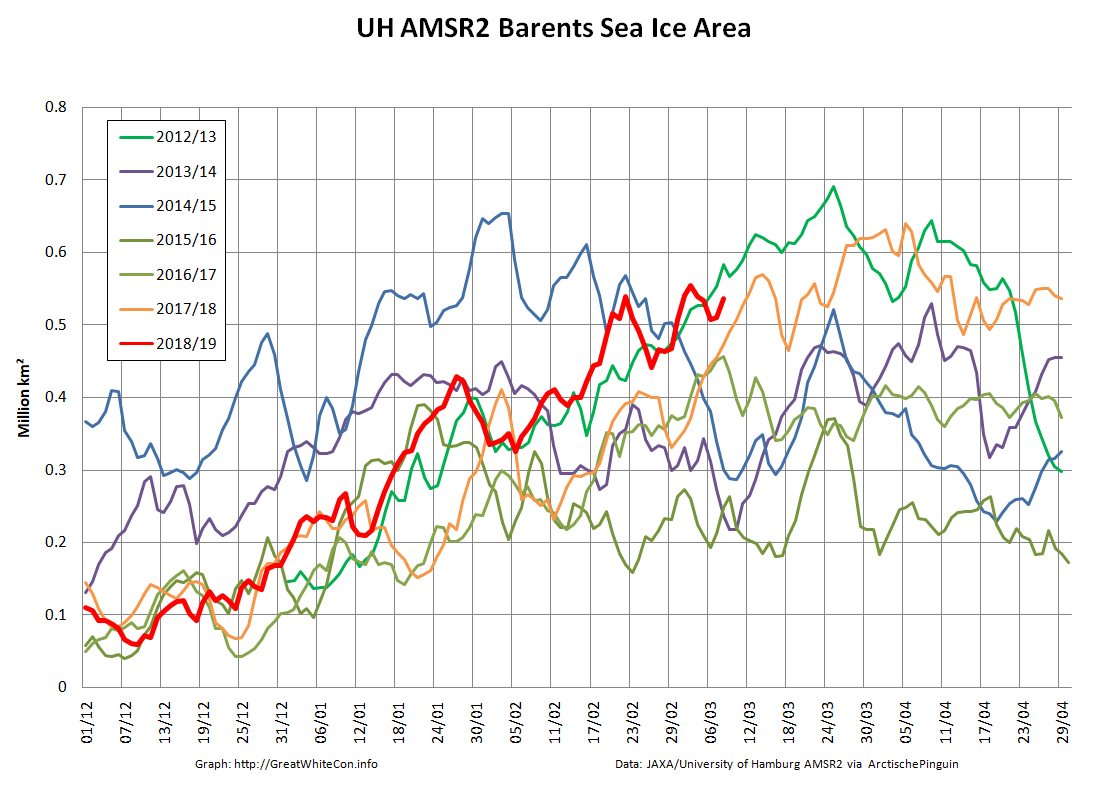
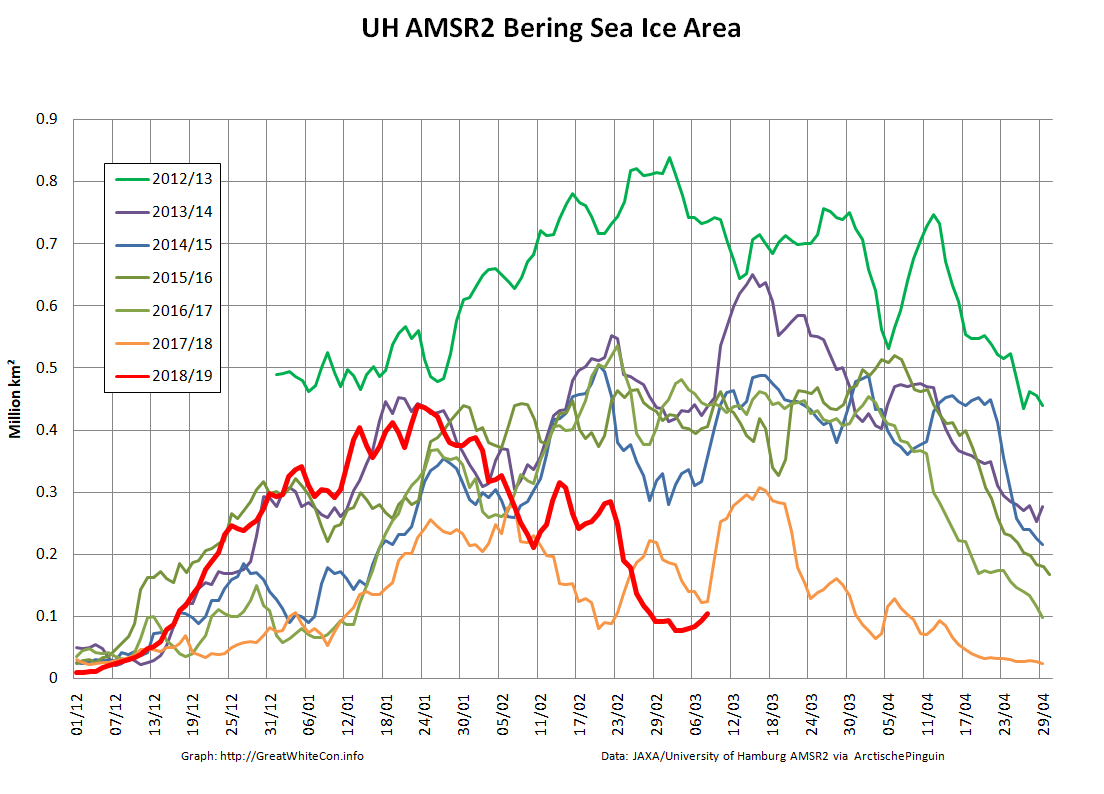
At this juncture you may well be wondering what the cause of that sudden sharp peak might be? Here’s your starter for ten:
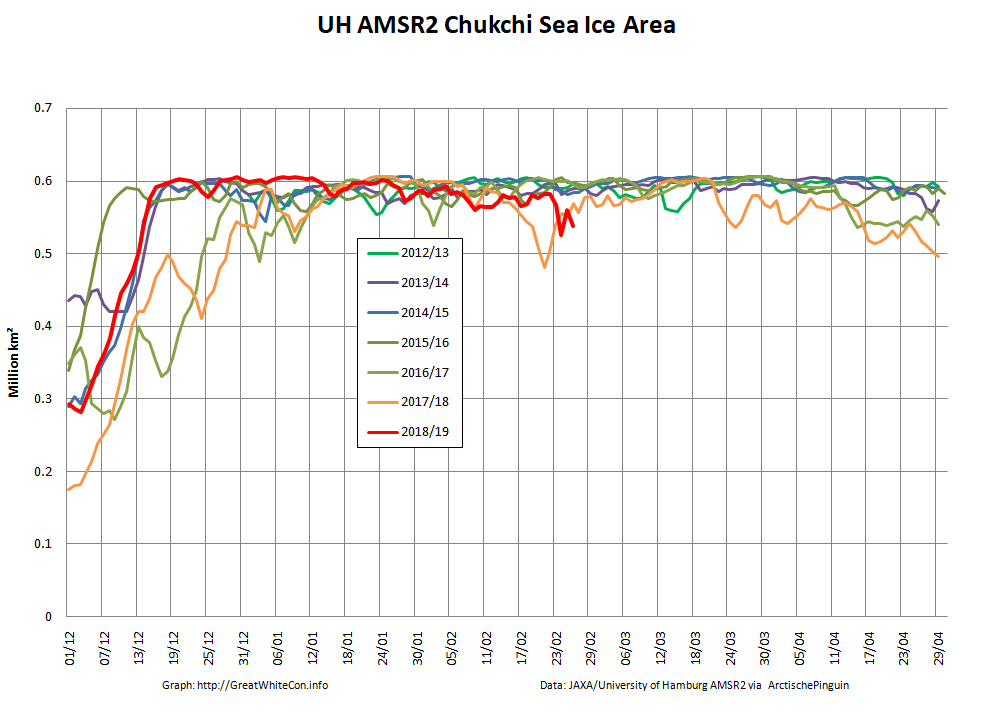
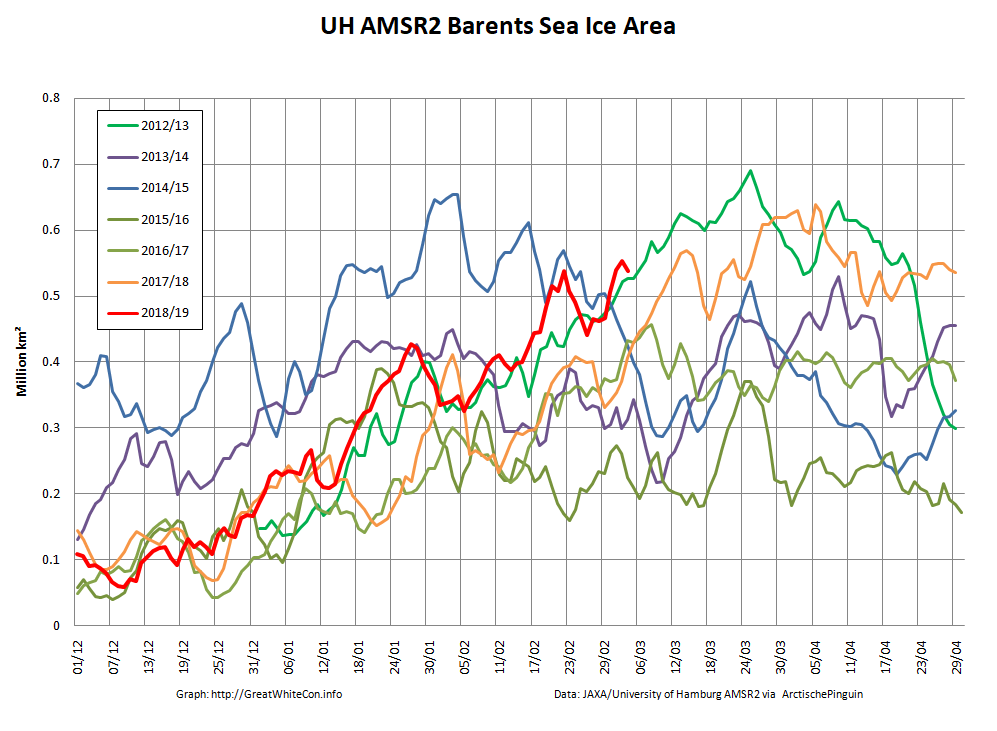
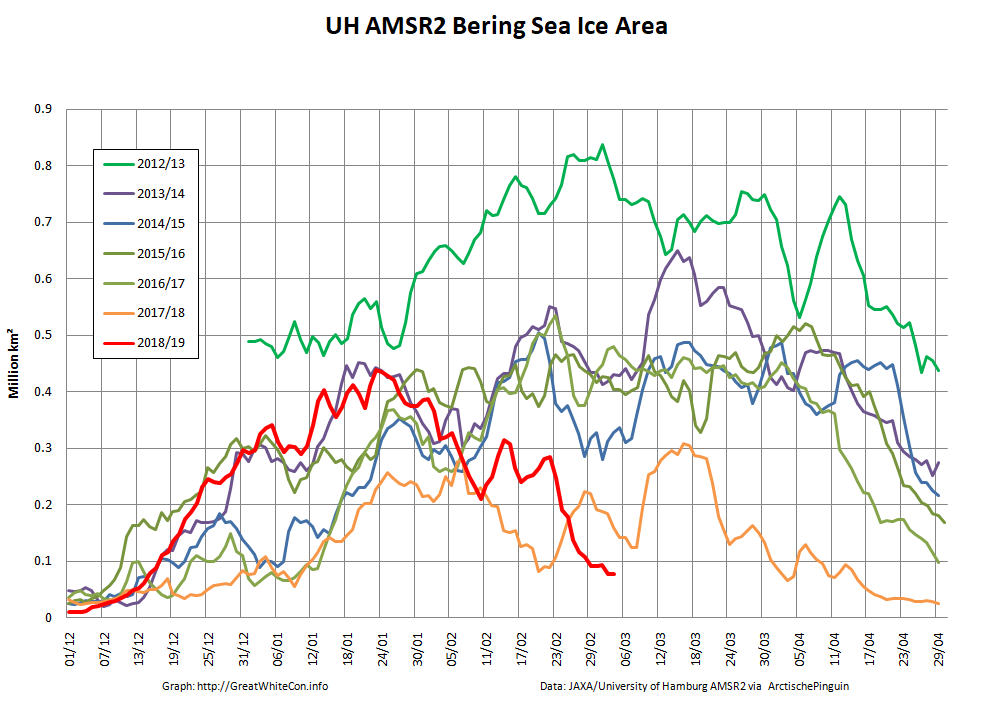
Whilst overall Arctic sea ice area is unremarkable for the current decade, sea ice area in the Bering Sea is remarkable low for the time of year! What’s more much like last year the Chukchi Sea is not currently full to overflowing with sea ice, and is also lowest for the date in the AMSR2 satellite records:
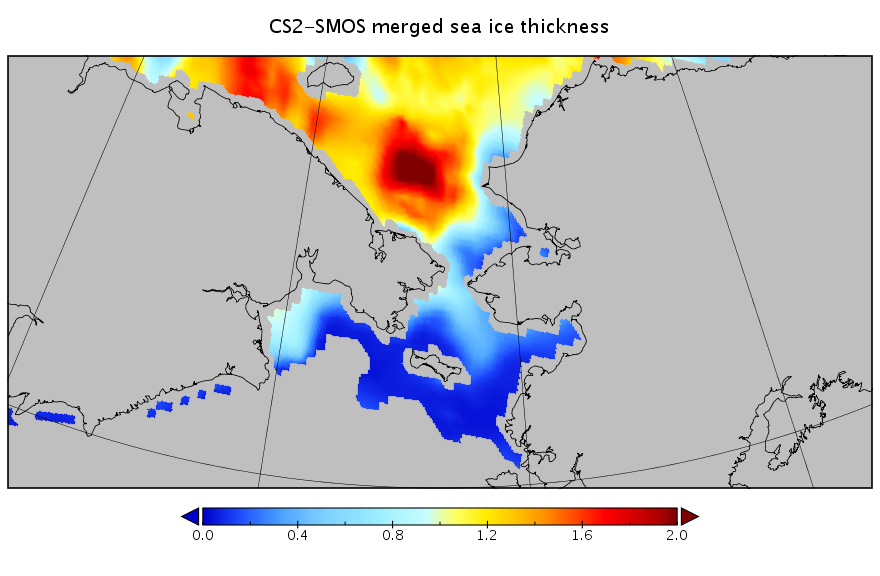
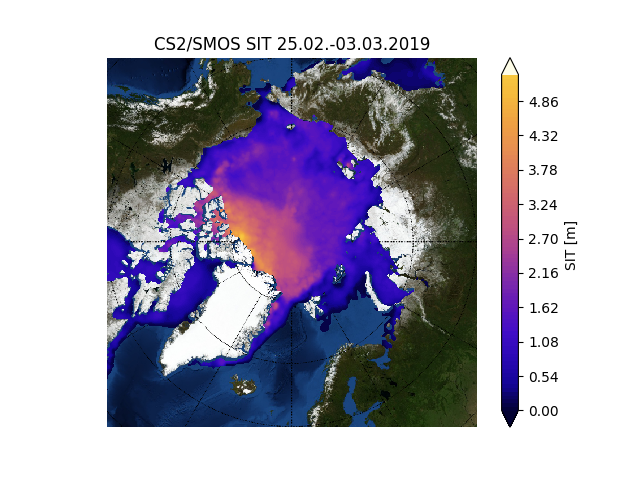
I’ve also been experimenting with the new gridded CryoSat-2/SMOS thickness data from the Finnish Meteorological Institute, which reveals this:
That’s a weekly overview dated February 24th, but it does perhaps explain how such a large area of sea ice could melt so swiftly?
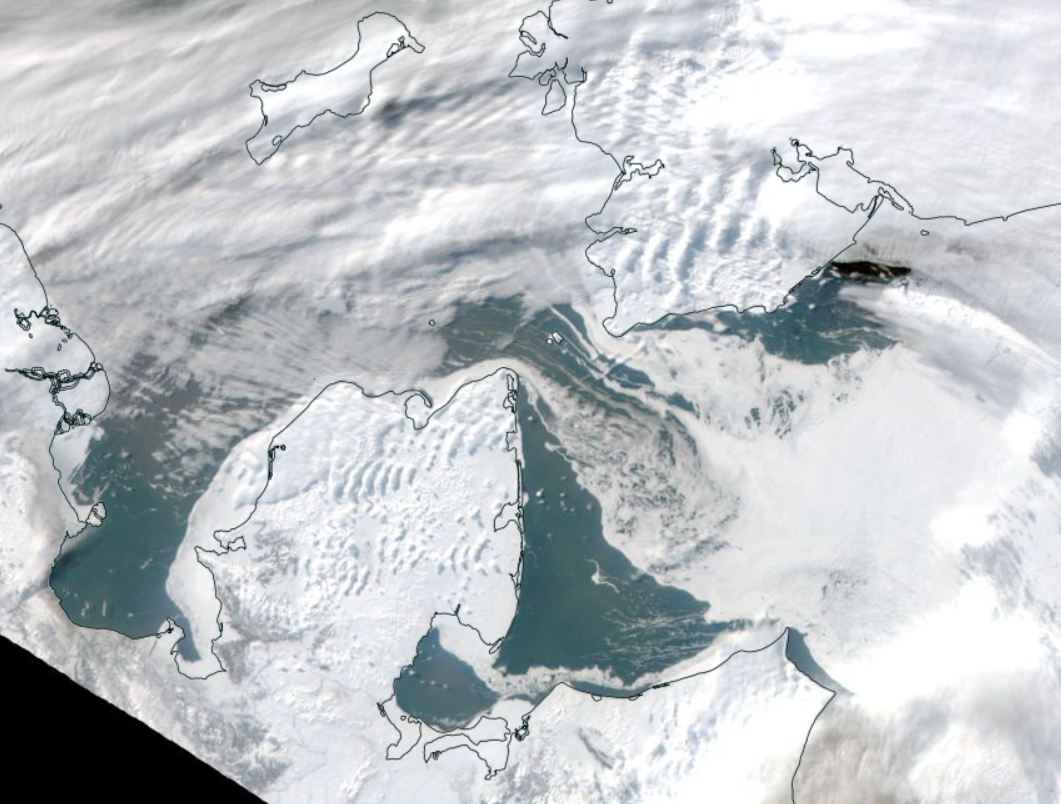
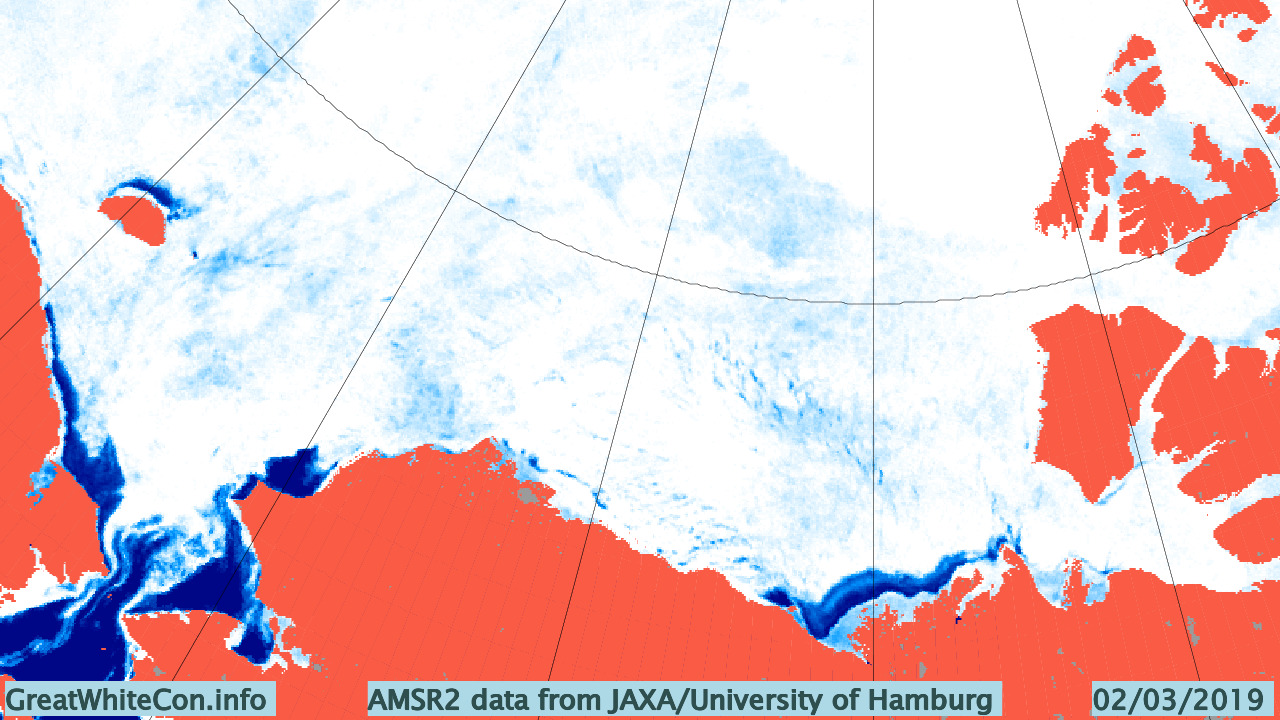
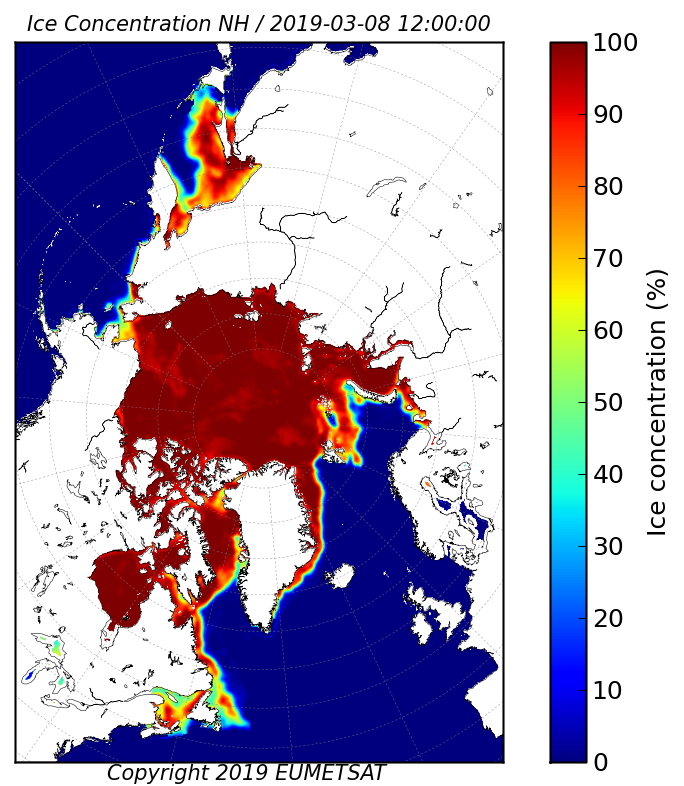
As luck would have it the skies are reasonably clear over the Bering Strait this morning (UTC). Here’s Terra’s view from on high of the current situation:
In addition, here is the underlying sea ice concentration data from the OSI-SAF:
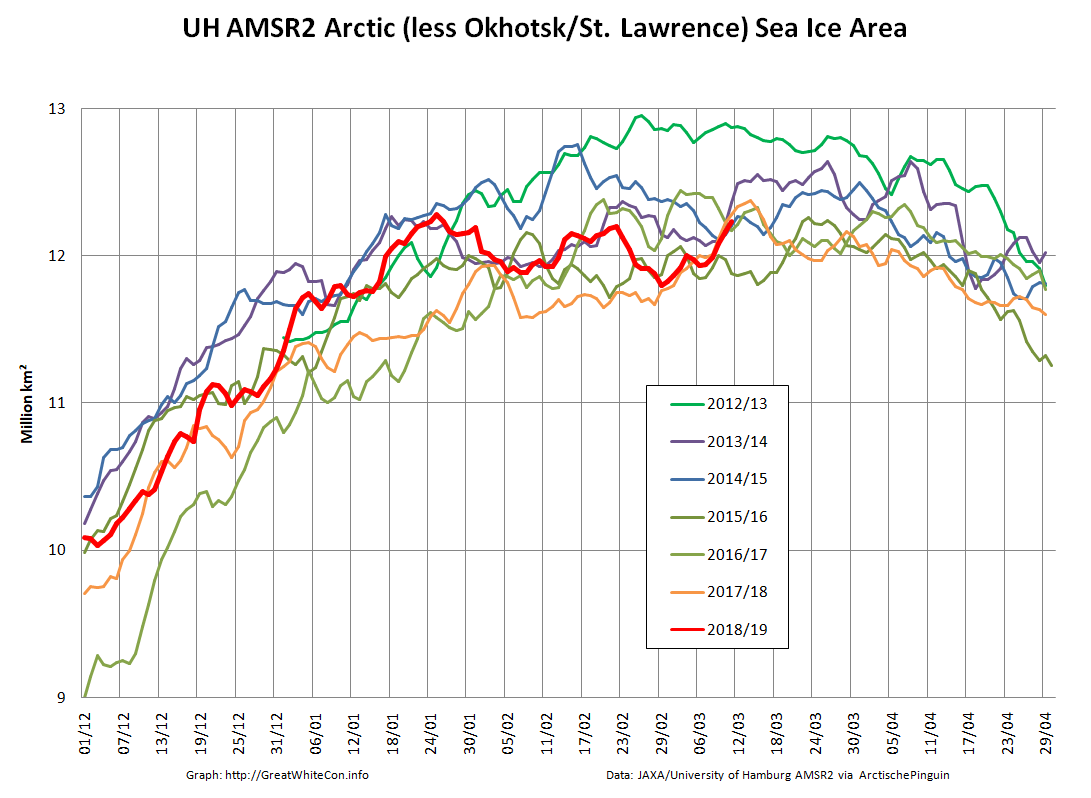
Since Michael is also asserting that there currently exists “the greatest February Arctic sea ice extent (according to DMI) in your blog’s history”, here’s Arctic sea ice area excluding the extremely peripheral Okhotsk and St. Lawrence regions:
P.S. Wipneus’ Pi has processed the AMSR2 data now, and area shows another, more modest, decline today:
Both area and extent are still moving inexorably upwards:
The late February maximum still holds, on the high resolution numbers at least. The JAXA/VISHOP web site is down at the moment, so we’ll have to wait for an update to that particular metric, as well as a post weekend update to the NSIDC’s Charctic chart.
P.S. Jaxa is still down this afternoon, but here’s the latest from the NSIDC:
[Edit – March 13th]
Arctic wide area and extent have blasted past their respective late February maxima:
However Arctic sea ice area excluding the Okhotsk and St. Lawrence peripheral regions has still not exceeded the maximum formed on January 25th:
[Edit – March 14th]
This morning’s data reveal the first decline in extent for several days:
The (extremely!) tentative new maximum Arctic sea ice extent for 2019 is 13.89 million square kilometers on March 12th.
[Edit – March 15th]
JAXA is back!
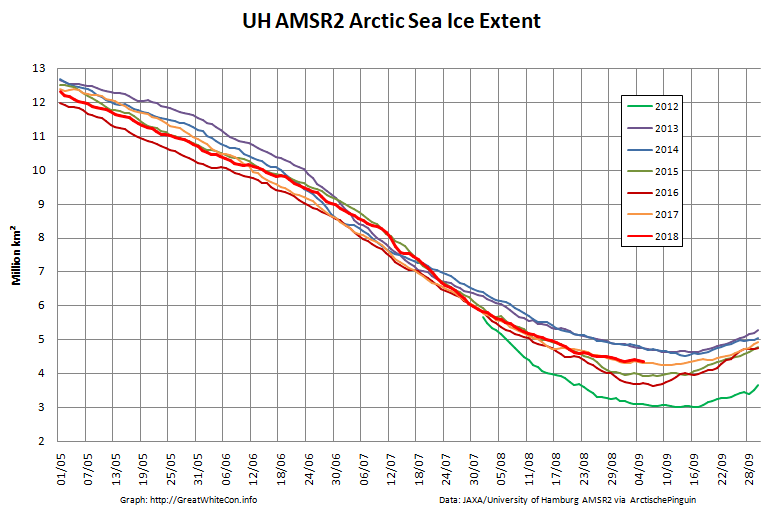
UH AMSR2 confirms that extent is still declining:
[Edit – March 16th]
Arctic sea ice extent continues to decline, whilst area is still flatlining:
Meanwhile a look at freezing degree days based on the DMI’s dubiously weighted data for north of 80 degrees reveals the story of the freezing season. A historically warm start, but now back in amongst the pack of the 2010s:
[Edit – March 17th]
It looks as though there’ll be no going back from this. Arctic sea ice area is finally following extent’s decline in no uncertain terms:
Barring exceedingly unforeseen circumstances after this year’s “double top” that leaves the 2019 Arctic sea ice maximum extent numbers as follows:
UH/Wipneus AMSR2 – 13.89 million square kilometers on March 12th
JAXA/VISHOP AMSR2 – 14.27 million square kilometers on March 12th
NSIDC 5 day SSMIS – 14.78 million square kilometers on March 13th
[Edit – March 19th]
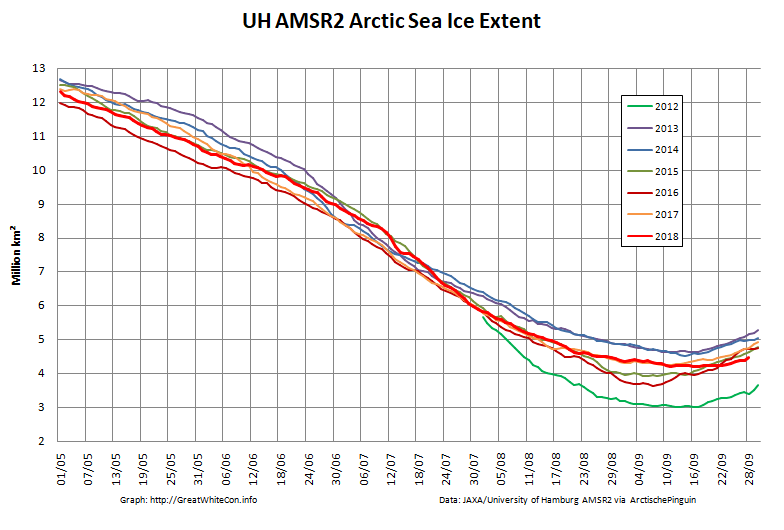
Arctic sea ice area has fallen off the proverbial cliff over the last few days. There can now be no doubt that the 2019 maximum extent has been reached:
That being the case, all other Arctic sea ice discussion for the month of March can now take place over at:
On March 13, 2019, Arctic sea ice likely reached its maximum extent for the year, at 14.78 million square kilometers (5.71 million square miles), the seventh lowest in the 40-year satellite record, tying with 2007. This year’s maximum extent is 860,000 square kilometers (332,000 square miles) below the 1981 to 2010 average maximum of 15.64 million square kilometers (6.04 million square miles) and 370,000 square kilometers (143,000 square miles) above the lowest maximum of 14.41 million square kilometers (5.56 million square miles) set on March 7, 2017. Prior to 2019, the four lowest maximum extents occurred from 2015 to 2018.
The date of the maximum this year, March 13, was very close to the 1981 to 2010 median date of March 12.
Please note this is a preliminary announcement of the sea ice maximum. At the beginning of April, NSIDC scientists will release a full analysis of winter conditions in the Arctic, along with monthly data for March.
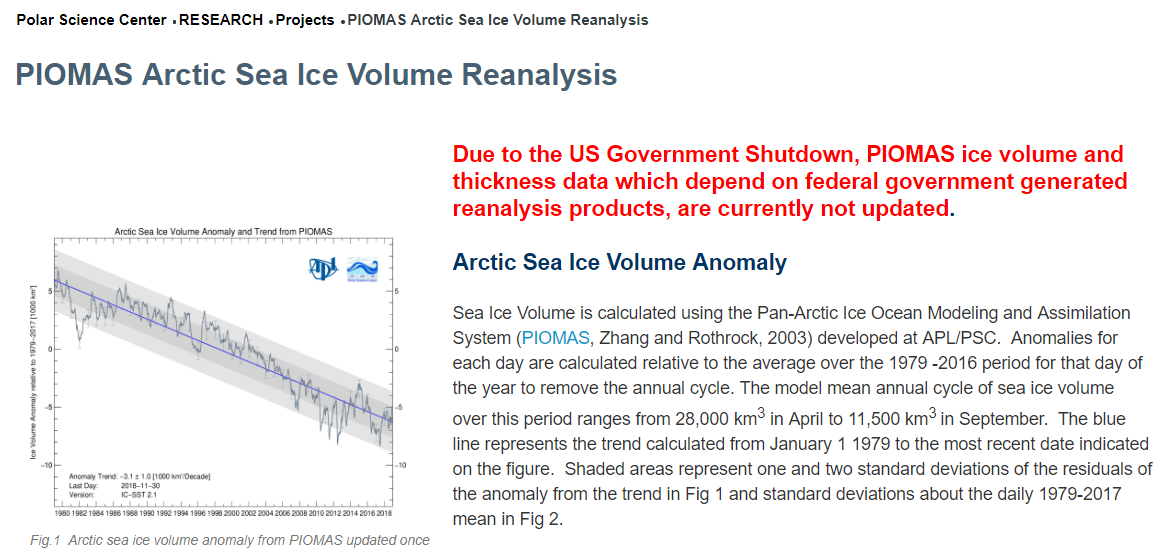
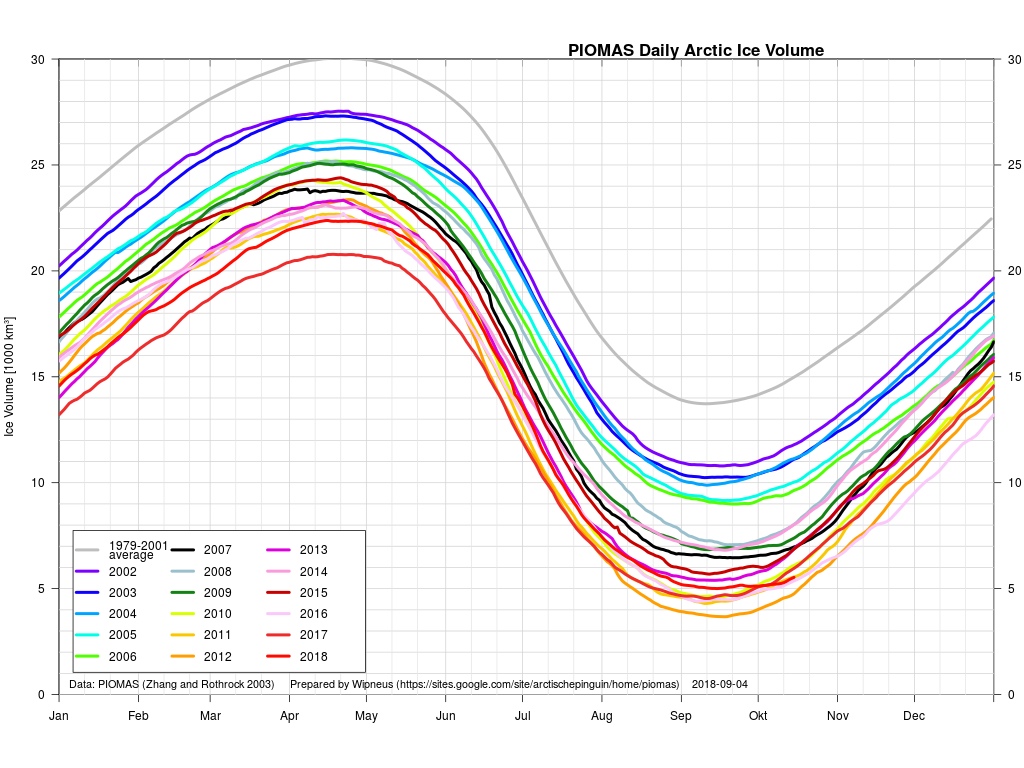
We generally write our periodic reports on the state of Arctic sea ice around the time the PIOMAS volume numbers are published. It seems as though we’ll have a long wait for that to happen at the moment though. According to The Economist today:
America’s government shutdown has become the longest in history. Hundreds of thousands of federal workers remain either stuck at home or forced to work without pay. To reopen the government President Donald Trump is demanding $5.7bn for his border wall. Nancy Pelosi, who presides over the most polarised House of Representatives in recent memory, does not want to give it to him.
Due to the US Government Shutdown, PIOMAS ice volume and thickness data which depend on federal government generated reanalysis products, are currently not updated.
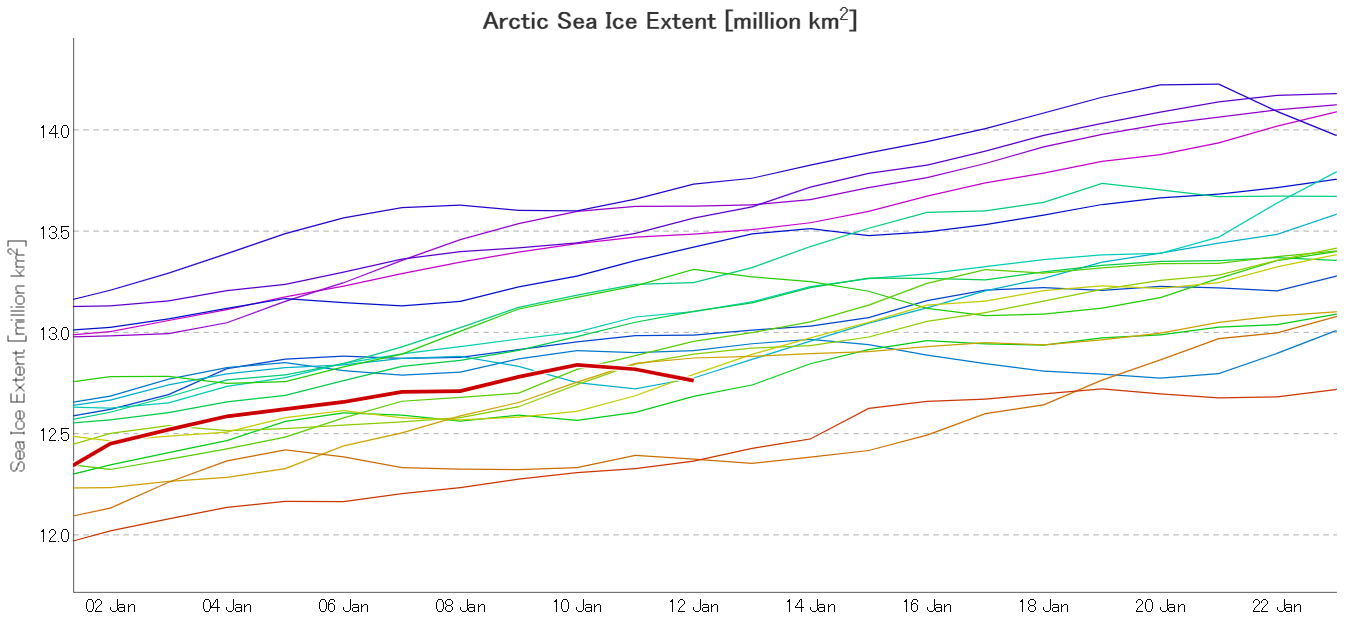
Instead of PIOMAS, let’s start instead with the January 2019 edition of the National Snow and Ice Data Center’s Arctic Sea Ice News:
As 2018 came to a close, Arctic sea ice extent was tracking at its third lowest level in the satellite record, while sea ice in the Antarctic remained at historic lows. Slightly faster growth in the first few days of the new year, mostly in the Pacific sea ice areas, has the daily sea ice extent at fifth lowest as of this post.
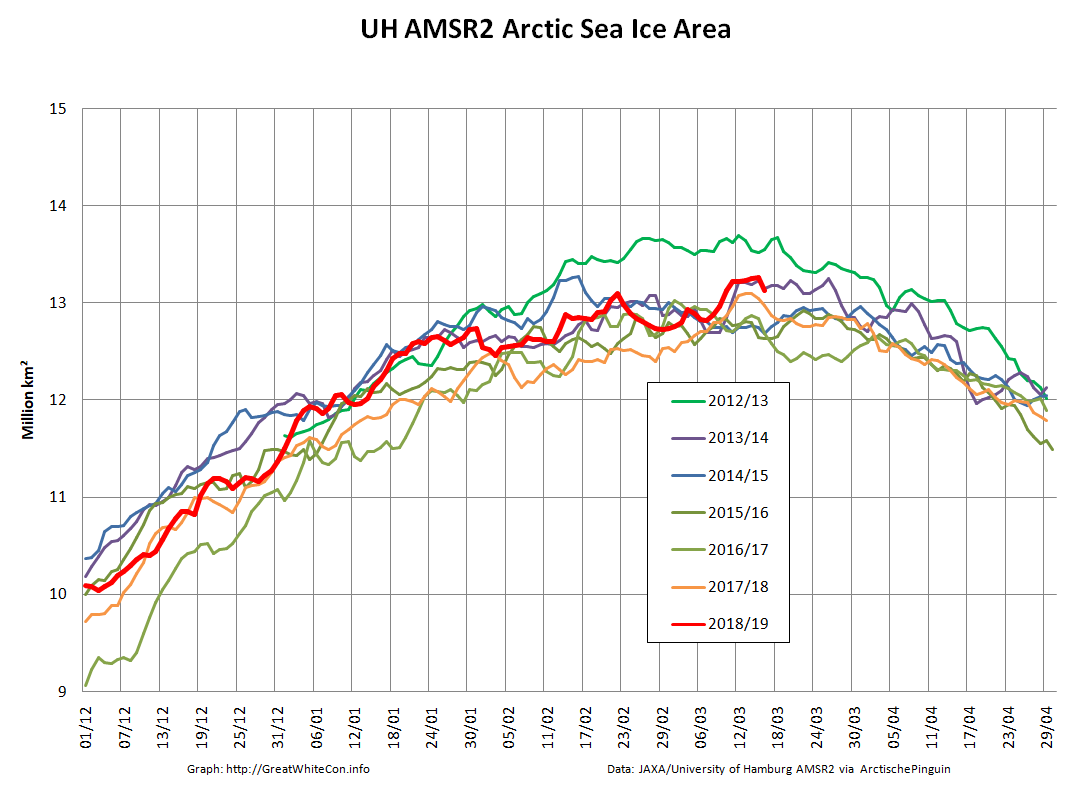
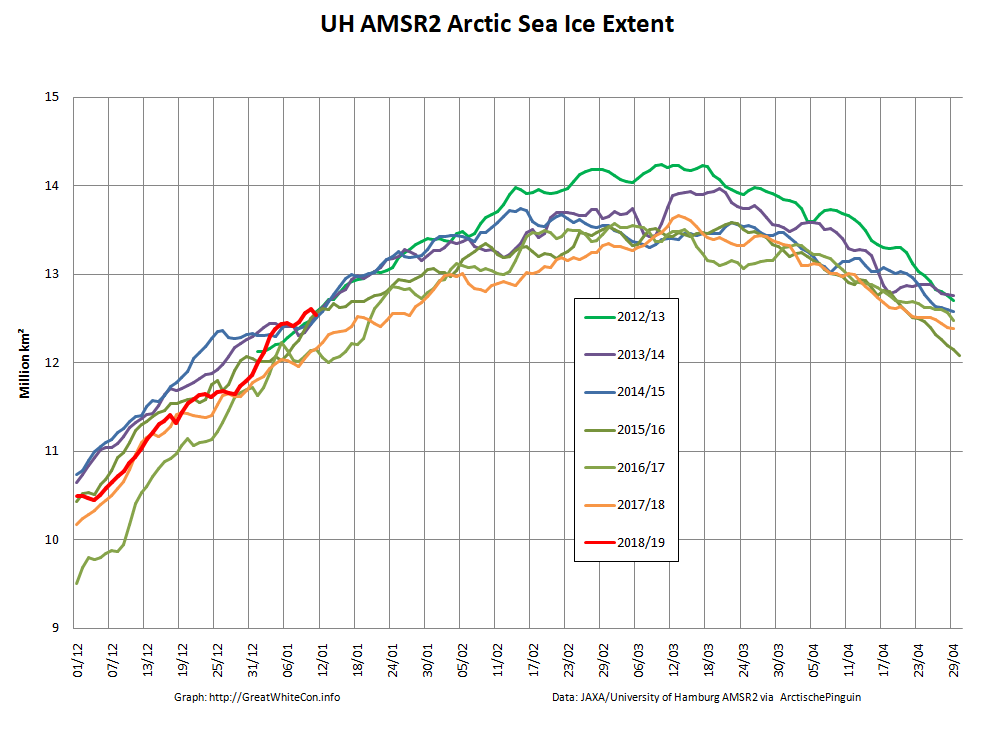
Now let’s take a look at our favourite high resolution AMSR2 area and extent metrics:
You can see that towards the end of December Arctic sea ice extent was verging on lowest for the date, since when it has risen quickly to reach highest for the date in the brief AMSR2 records a few days ago.
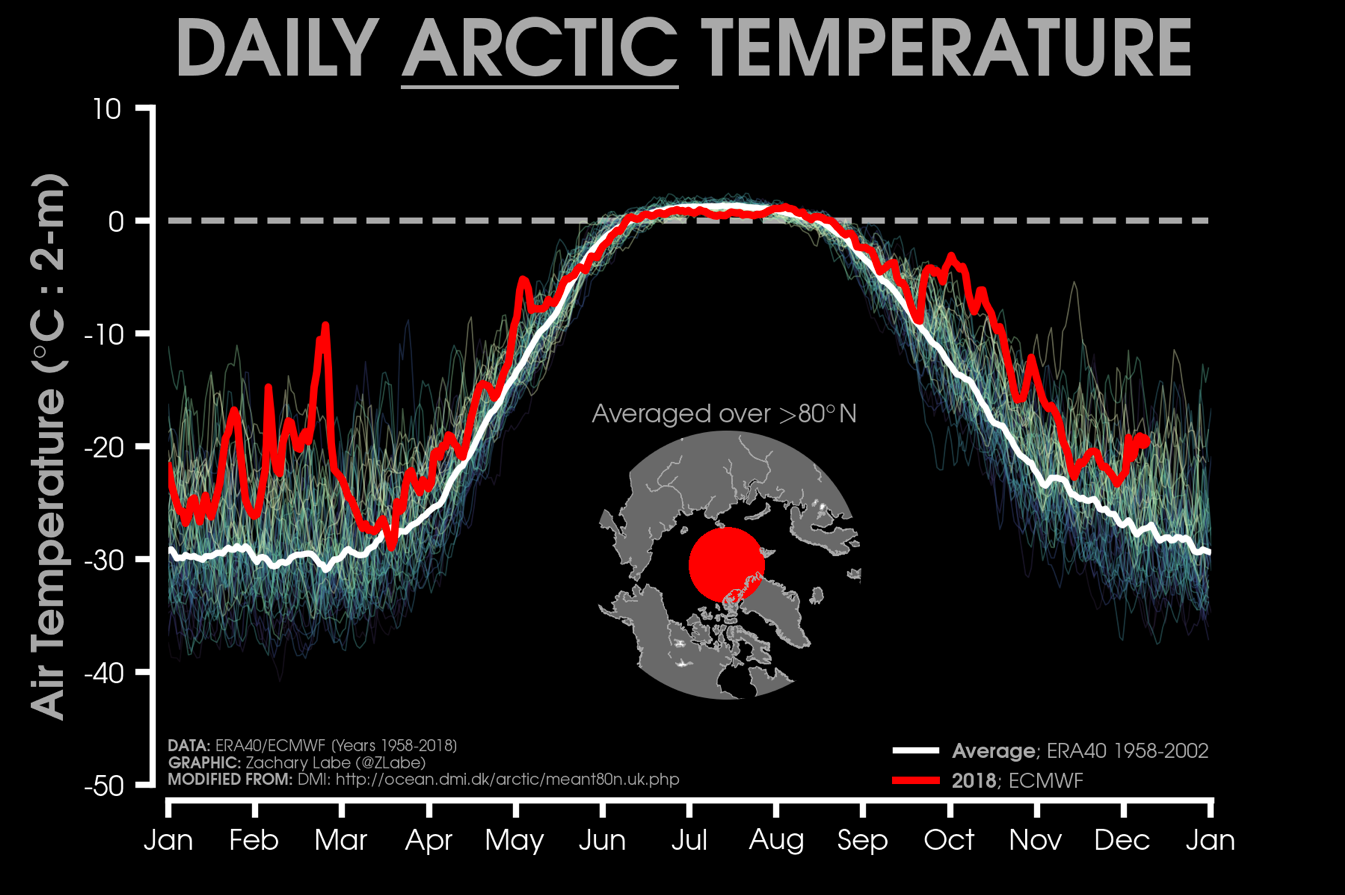
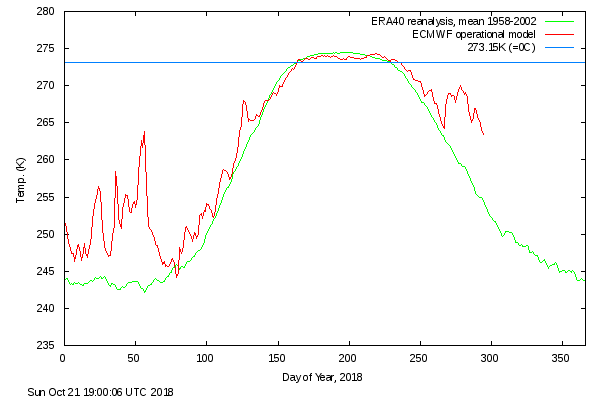
The NSIDC also mention the US Government shutdown:
Unfortunately, as a result of the partial government shutdown, we are unable to access the National Oceanic and Atmospheric Administration (NOAA) pages to retrieve information on atmospheric air temperatures and sea level pressure patterns. Instead, we turn to daily (2 meters above the surface) mean air temperatures north of 80 degrees North from the European Centre for Medium-Range Weather Forecasts (ECMWF) operational model. This analysis shows that air temperatures remained above the 1958 to 2002 average for all of December.
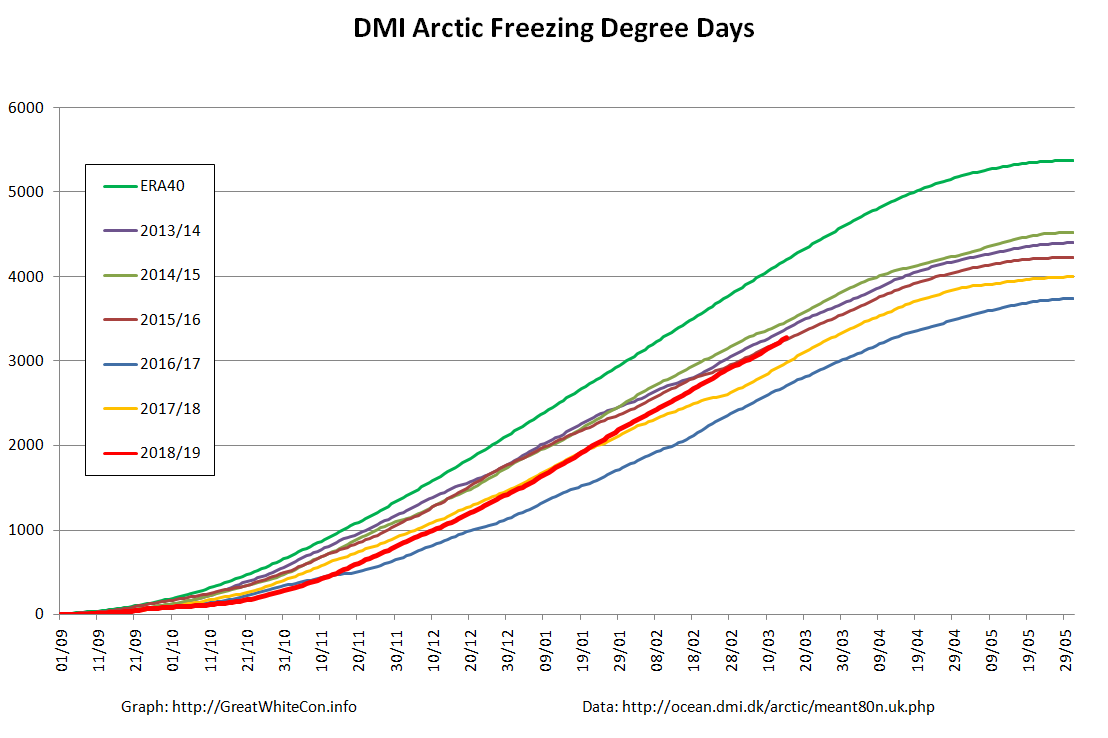
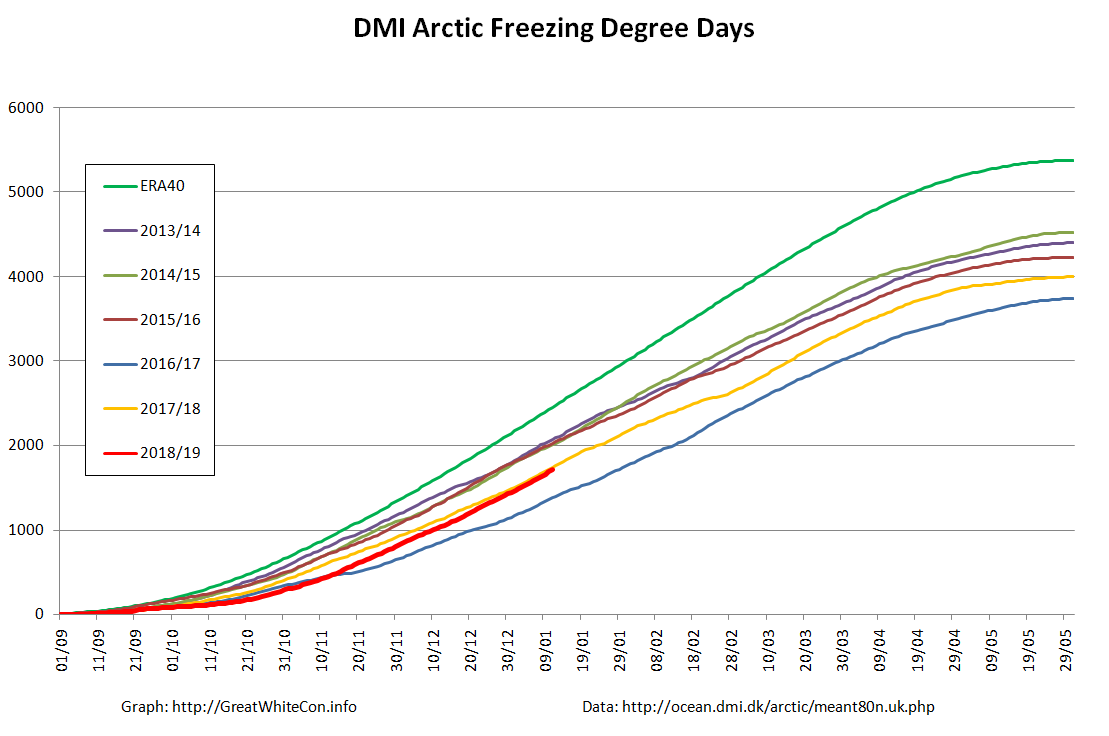
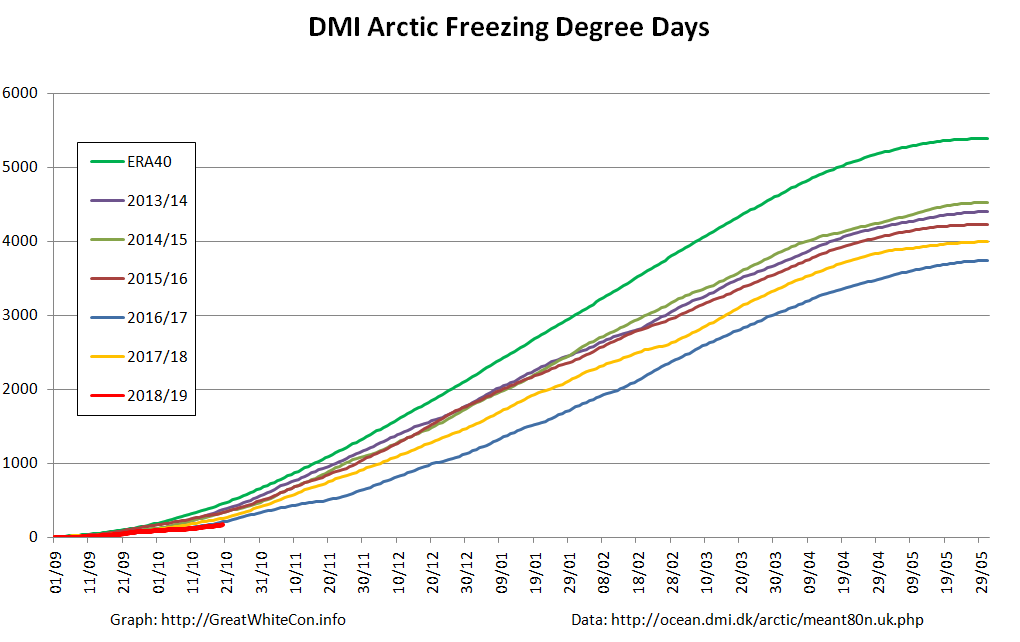
That brings us on to our Arctic freezing degree days graph, based on DMI data:
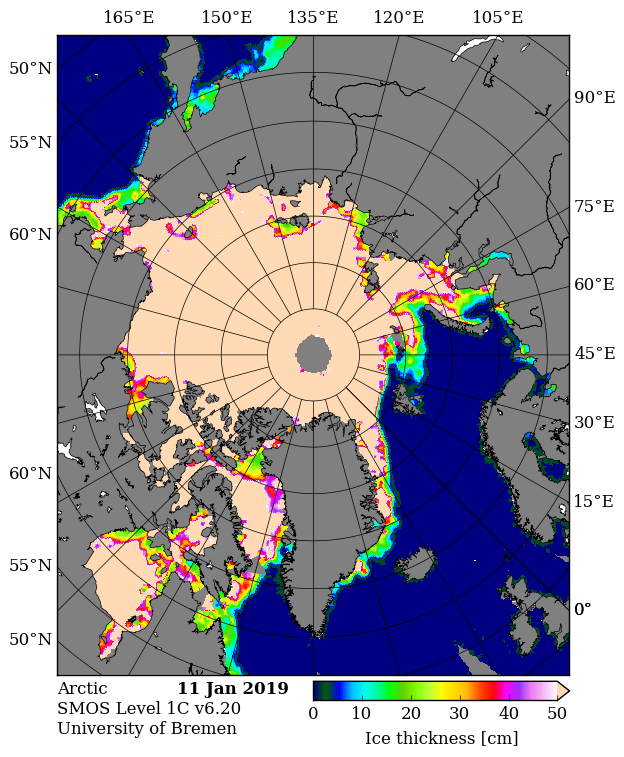
After a very slow start to the freezing season the FDD numbers are now vying for second place with last year, behind the astonishingly warm winter of 2016/17. In the absence of the PIOMAS volume numbers we can at least take a look at sea ice thickness. Here’s CryoSat-2:
All those sources seem to be agreed that large areas of both the Barents and Kara Seas are currently covered by young thin ice. Finally, for the moment at least, let’s take a look at some extracts from the NSIDC’s review of 2018:
January 2018 began the year with record low sea ice extents for the Arctic as a whole.
The seasonal maximum, reached on March 17, 2018, was the second lowest in the satellite record. While low extent persisted through April and May, sea ice loss during early summer was unremarkable despite above average 925 hPa air temperatures over the Arctic Ocean and Eurasia.
Air temperatures over the Arctic Ocean in July were below average, followed by above average temperatures in August. In fact, on average, August temperatures were higher than July temperatures in 2018. This is highly unusual in the Arctic and something not seen in at least 40 years.
The September 2018 seasonal minimum extent ended up slightly above the long-term linear trend line, tying with 2008 for the sixth lowest in the satellite record. After the minimum, the ocean was slow to freeze up, and October sea ice extent ended up as the third lowest. However, ice growth was very rapid in November, such that November 2018 extent approached the interquartile range of the 1981 to 2010 median. Nevertheless, large amounts of open water remained in the Barents and Chukchi Seas. By the end of December, ice conditions in the Chukchi Sea were back to average, while extent remained unusually low in the Barents Sea.
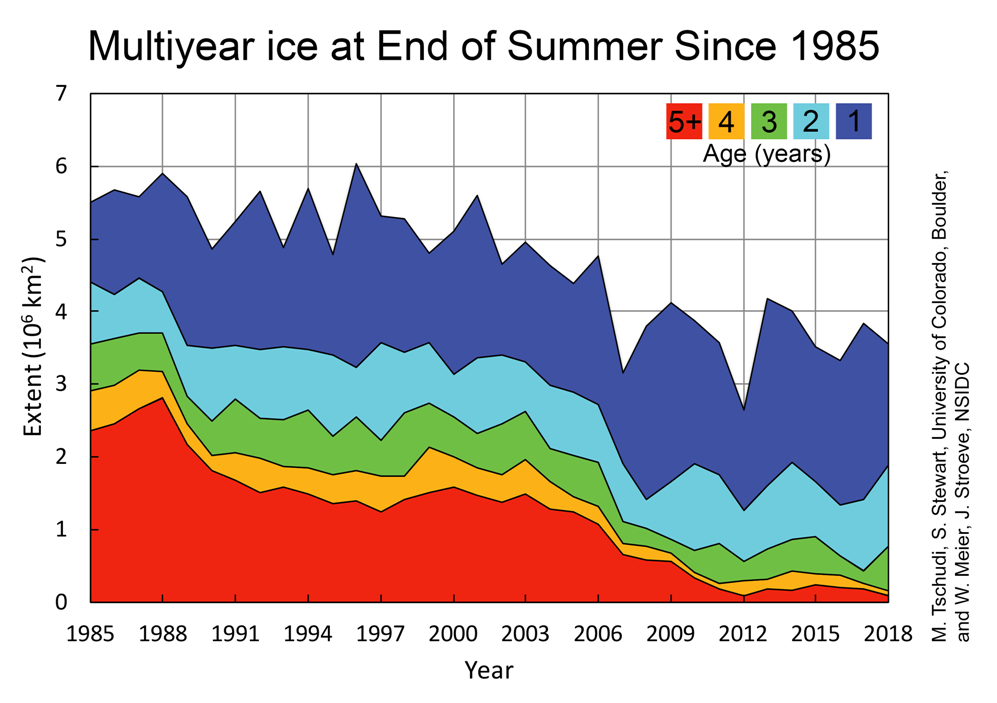
Coverage of old ice (greater than 4 years old) over the Arctic continued to decline. Such old ice covers only 5 percent of the area it used to in 1980s.
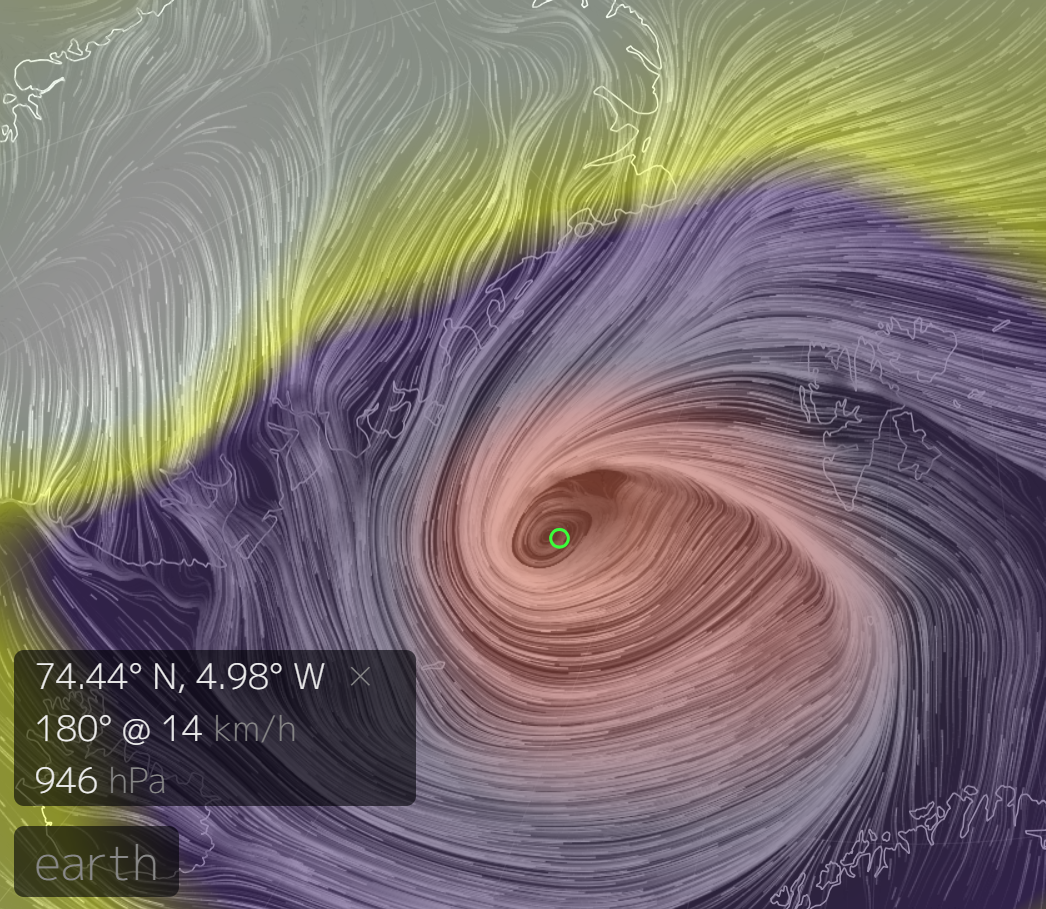
[Edit – January 13th]
Arctic sea ice area and extent have both been falling over the last few days, possibly as a result of the recent cyclone which created strong northerly winds in the Fram Strait. This is from Earth at 09:00 UTC on January 10th, showing a MSLP of 946 hPa:
Here’s what used to be referred to as JAXA extent:
A somewhat belated start to our October 2018 coverage, but firstly please take a look at this graph:
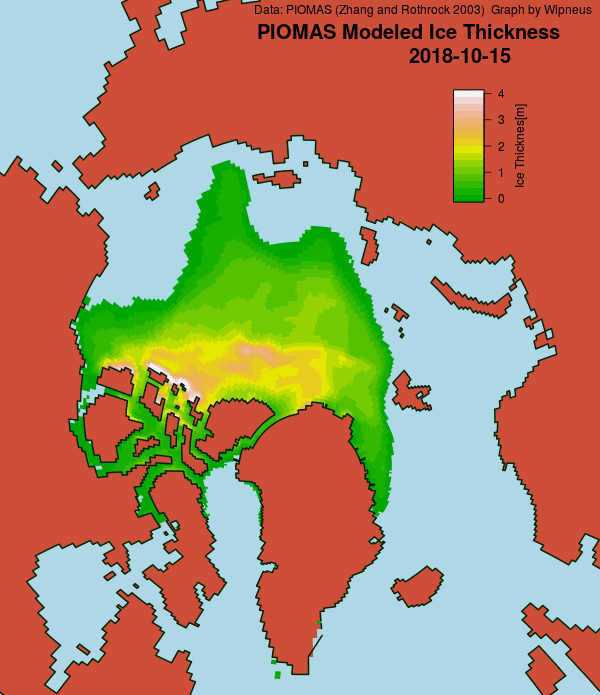
Following a remarkably sluggish refreeze this year JAXA extent is currently the lowest for the date since their records began. Meanwhile Wipneus has just released his mid month PIOMAS volume update on the Arctic Sea Ice Forum:
That graph reveals that Arctic sea ice volume has been increasing much more slowly than usual during October. The fact that the DMI freezing degree days graph is currently below all previous years in their records no doubt has something to do with that:
Wipneus has also updated the mid month PIOMAS gridded thickness map:
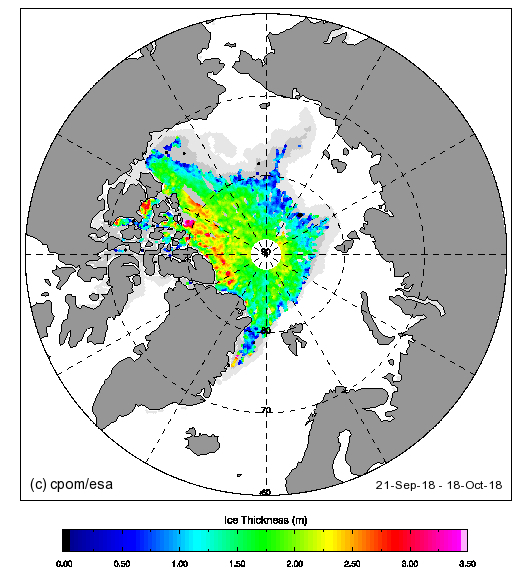
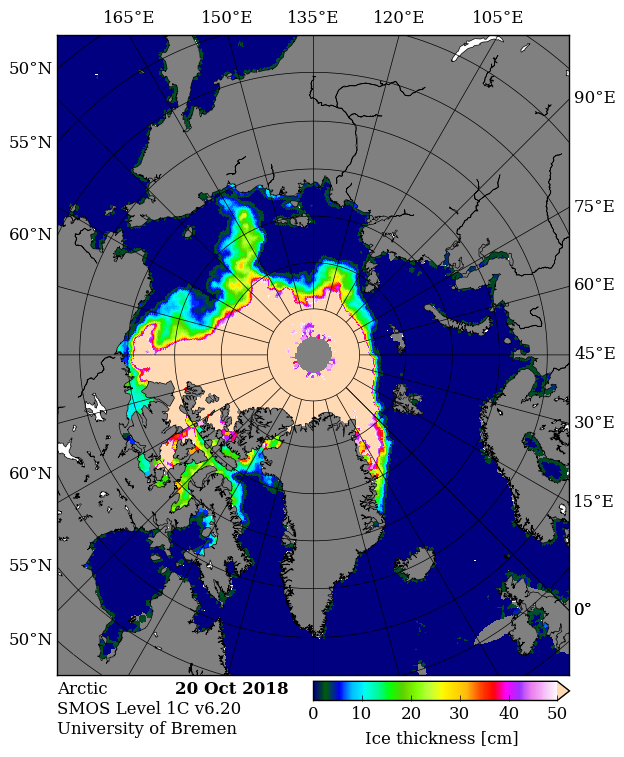
For a handle on the areas of thinner ice where refreezing is taking place around the periphery of the pack, here’s the latest SMOS map:
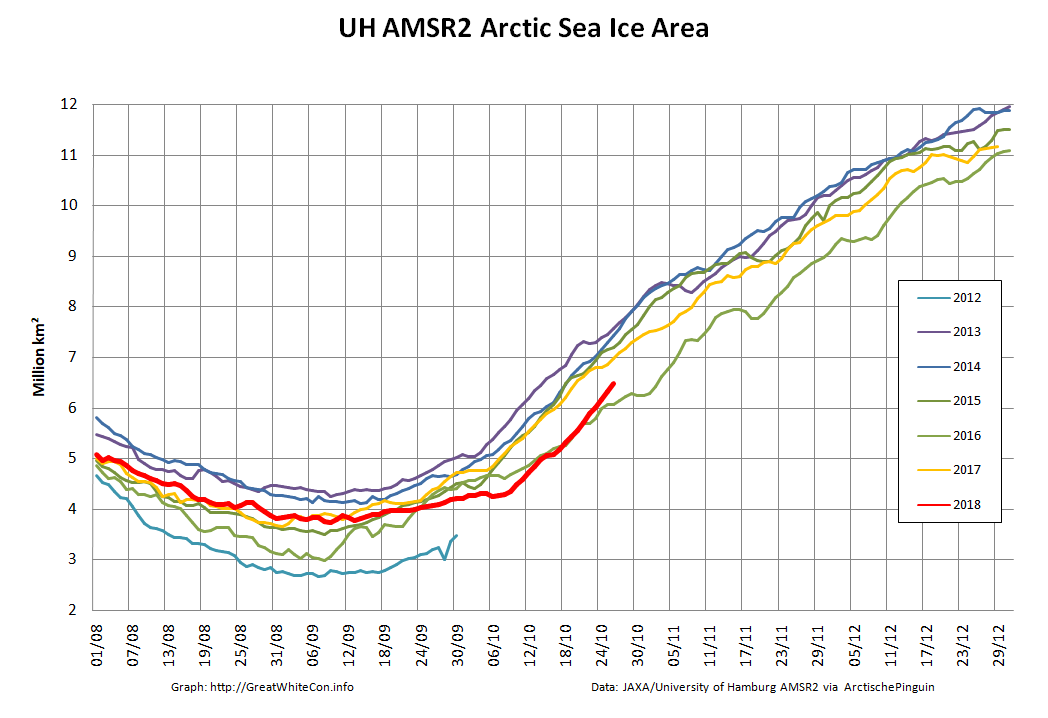
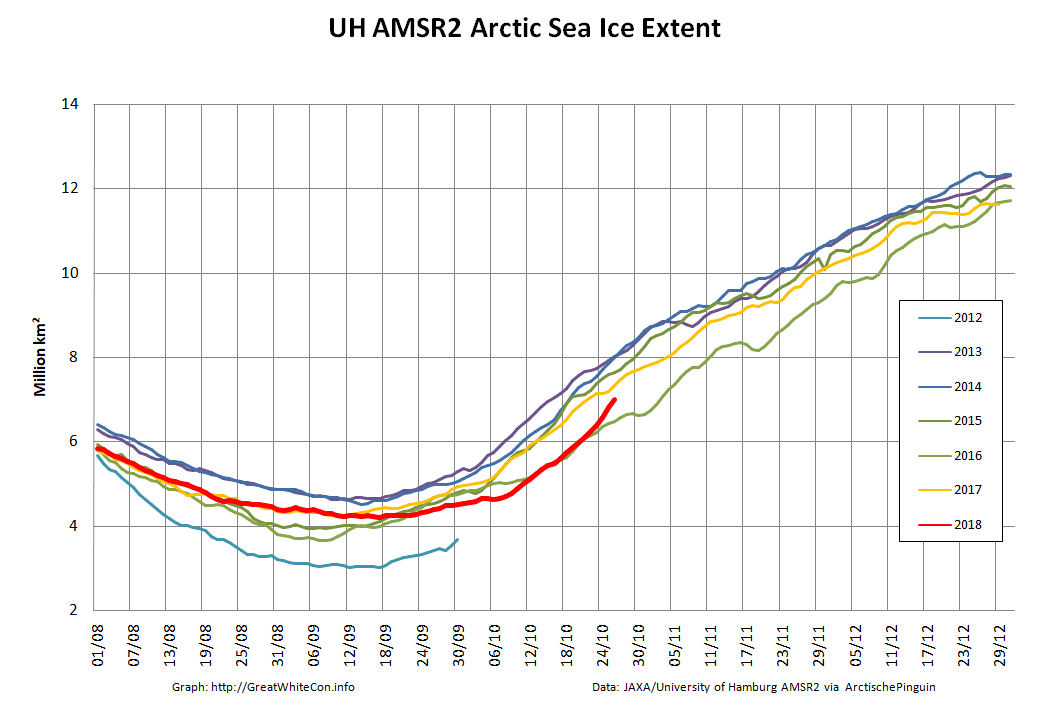
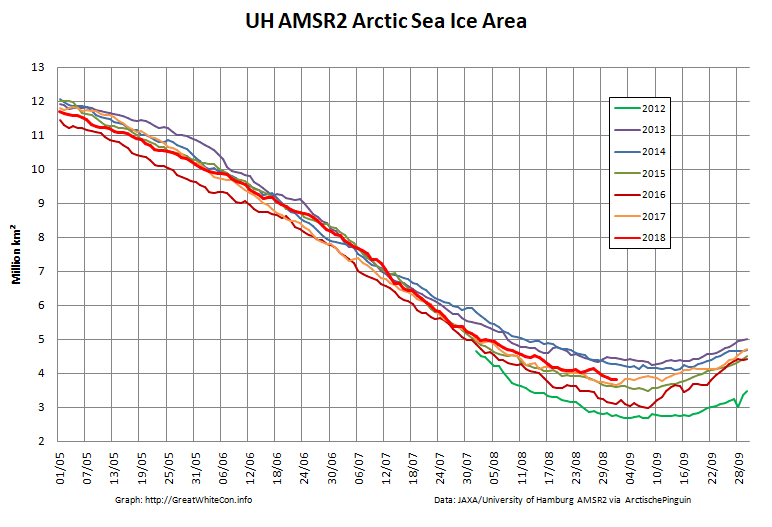
Finally, for the moment at least, here’s our favourite high resolution AMSR2 area and extent metrics based on JAXA data processed by the University of Hamburg to produced gridded concentration which is then used to derive area and extent by the inimitable Wipneus once again:
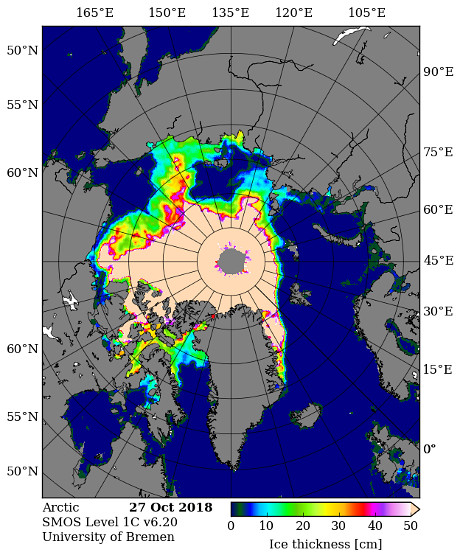
[Edit – October 28th]
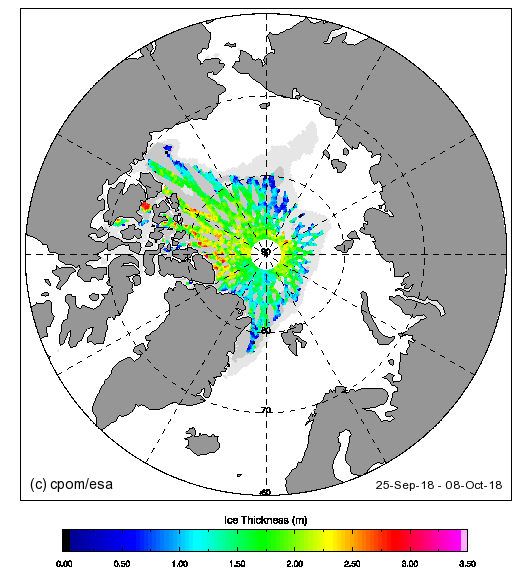
Here’s the latest thickness maps from SMOS:
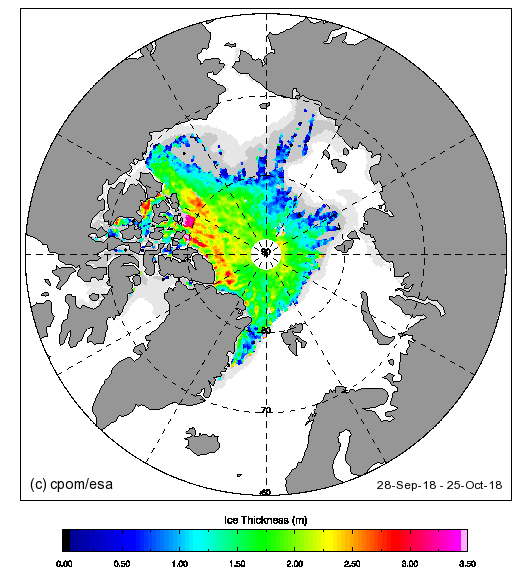
and CryoSat-2:
There’s been a recent rapid refreeze, leaving large areas of thin ice around the edges of the central pack:
Please note the abnormally thin sea ice to the north of Greenland.
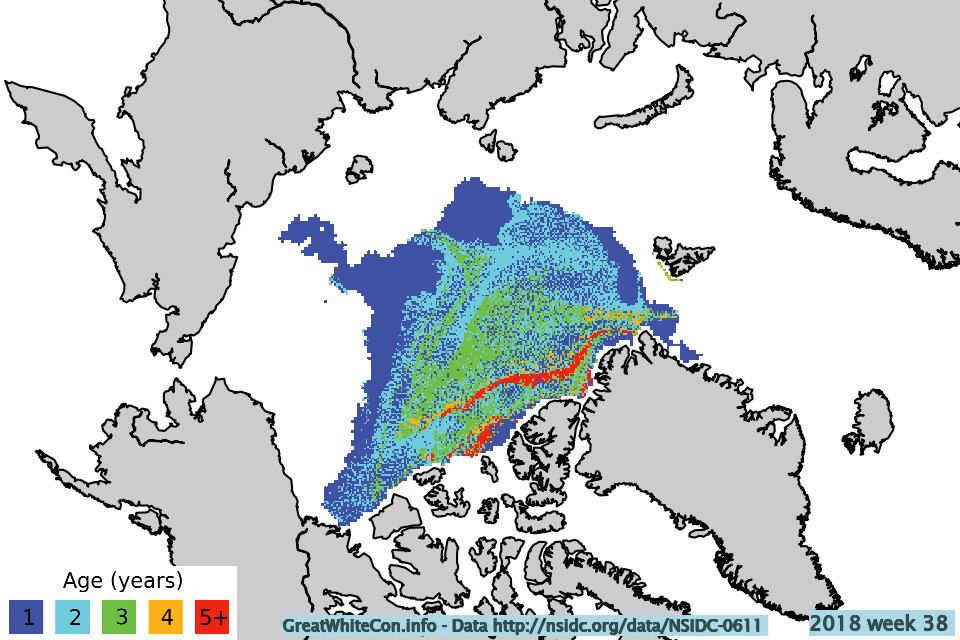
Finally, for the moment at least, here’s the latest Arctic sea ice age information extracted from the October 2018 edition of the NSIDC’s Arctic Sea Ice News:
The “oldest, thickest sea ice in the Arctic” seems to be vanishing before our very eyes.
September is upon us once again, the month in which the assorted Arctic sea ice area and extent metrics (almost) always reach their respective annual minima. Now we are free to start speculating about what the assorted minima will be, and on what date.
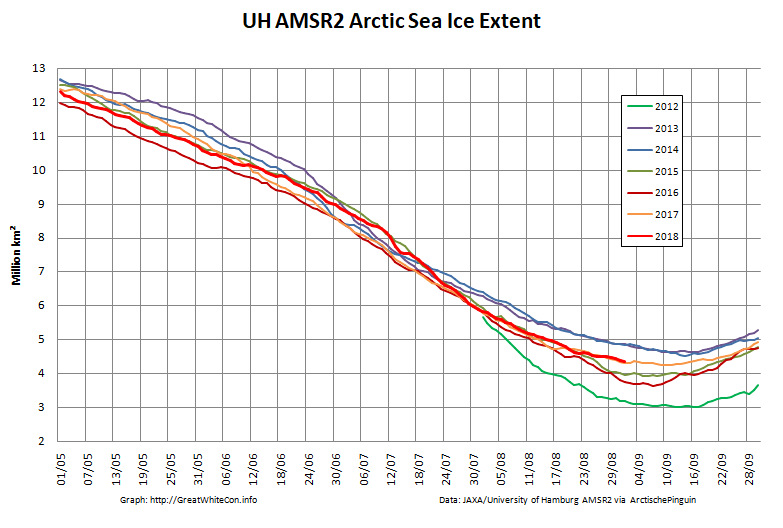
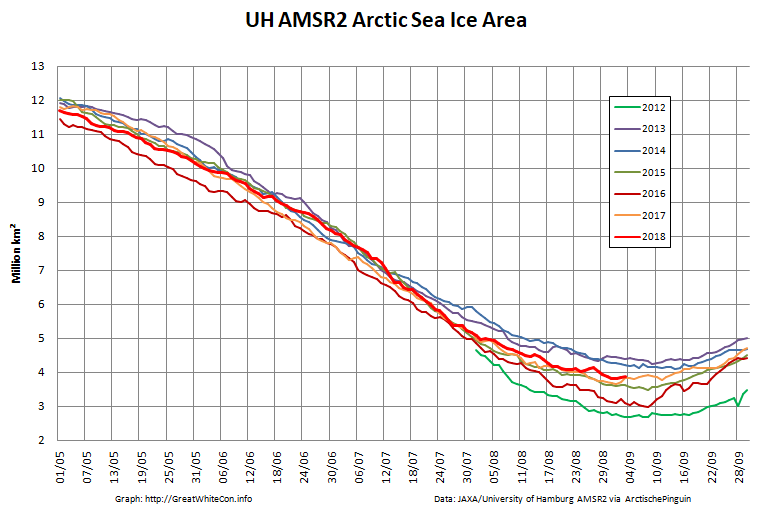
To begin with let’s take a look at our much beloved high resolution AMSR2 metrics derived by “Wipneus” from the University of Hamburg’s AMSR2 concentration data:
There’s currently some divergence between the area and extent graphs. Area is declining rapidly for the time of year, whilst extent seems to almost have come to a standstill!
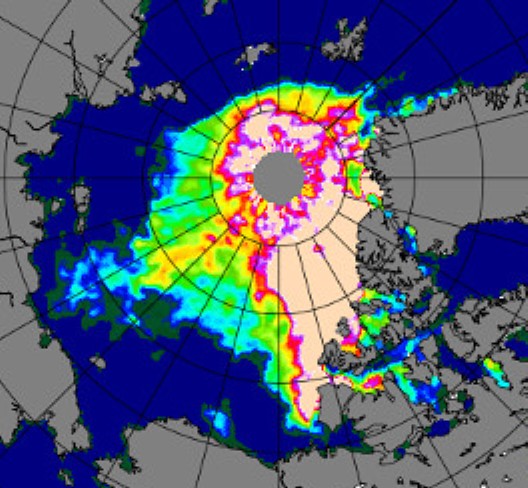
Before looking at some of the other metrics we’ll wait for the effect of the assorted storms currently circling the Arctic to play out. Here’s how the AMSR2 concentration map looks at the moment:
whilst here’s the University of Bremen’s summer SMOS sea ice “thinness” map:
[Edit – September 3rd]
UH AMSR2 area and extent both increased yesterday, so we have a (very!) provisional minimum extent of 4.35 million square kilometres on September 1st.
[Edit – September 4th]
Area and extent have both increased again:
Is the minimum already in, or will the storms still circulating around the Arctic Ocean reverse that trend over the next few days?
[Edit – September 6th]
High resolution area and extent both posted marginal new lows for the year yesterday:
On September 19 and 23, Arctic sea ice appeared to have reached its seasonal minimum extent for the year, at 4.59 million square kilometers (1.77 million square miles). This ties 2018 with 2008 and 2010 for the sixth lowest minimum extent in the nearly 40-year satellite record.
Please note that this is a preliminary announcement. Changing winds or late-season melt could still reduce the Arctic ice extent, as happened in 2005 and 2010. NSIDC scientists will release a full analysis of the Arctic melt season, and discuss the Antarctic winter sea ice growth, in early October.
The NSIDC numbers are based on a 5 day average, whereas the one day high resolution AMSR2 extent reached a minimum of 4.195 million square kilometers on September 17th:
The AMSR2 area minimum occurred significantly earlier. 3.737 million square kilometers on September 9th:
Our title for today refers back to the Great Arctic Cyclone of August 2012. There has been some speculation over on the Arctic Sea Ice Blog about whether a similar event is about to occur this year.
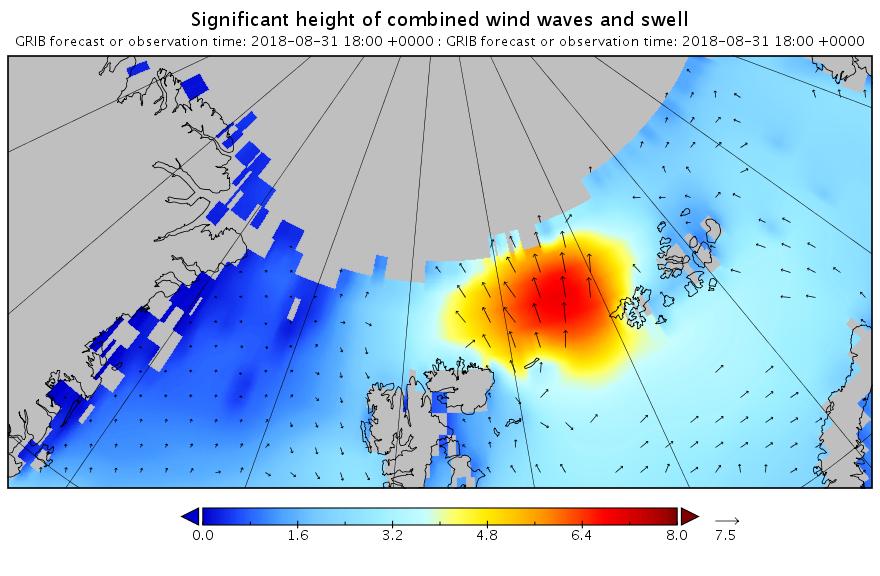
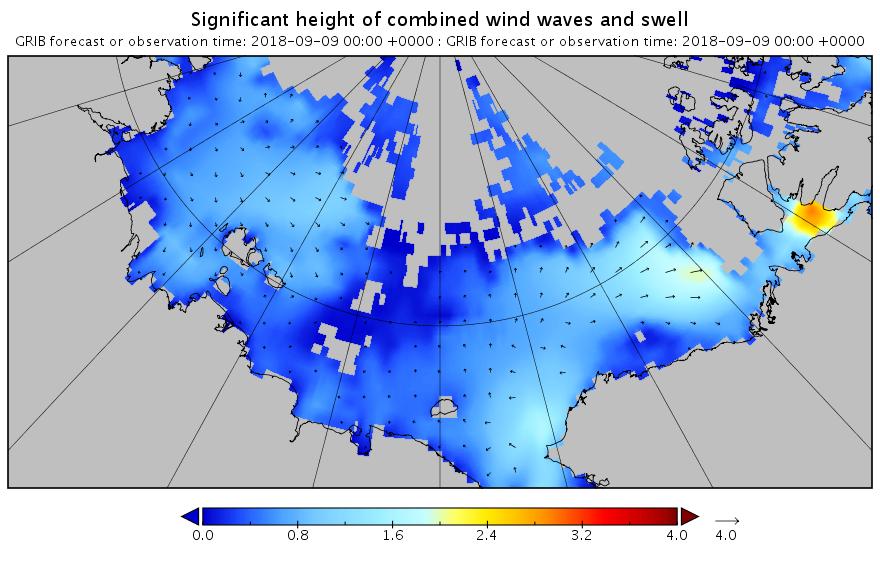
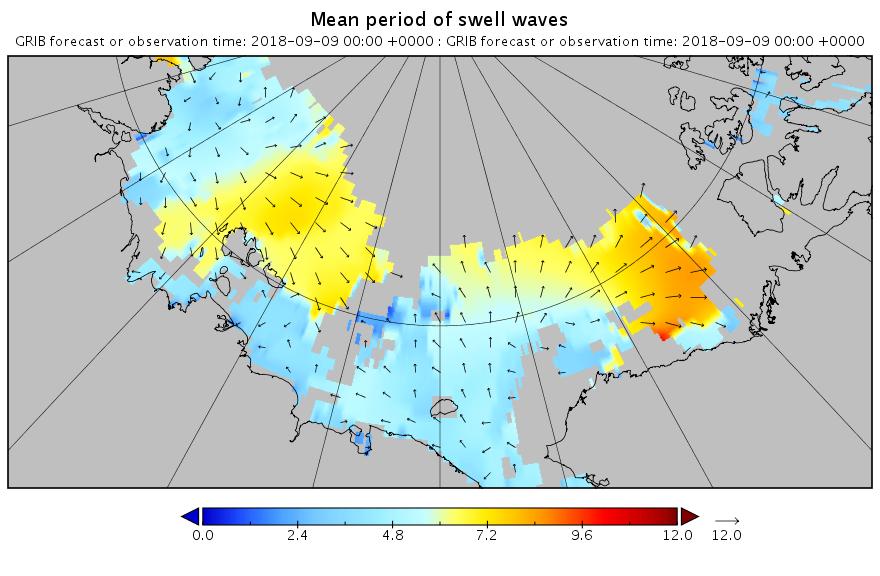
It’s later in the season of course, but as is our wont we always look at the waves first. Here is the current WaveWatch III forecast for the evening of August 31st UTC:
In summary the forecast shows some very large waves with a substantial period for inside the Arctic Circle directed straight at the ice edge. Let’s follow the forecast over the next few days carefully shall we?
[Edit – August 30th]
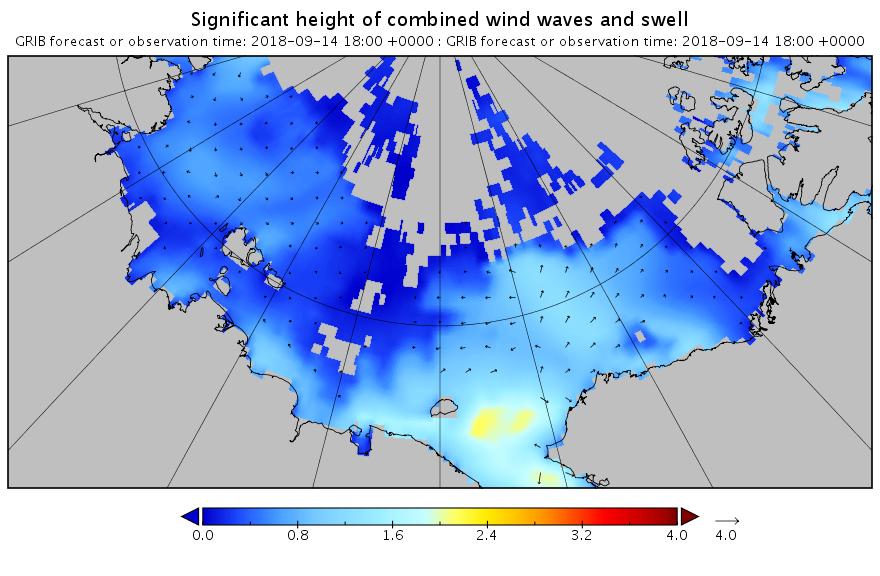
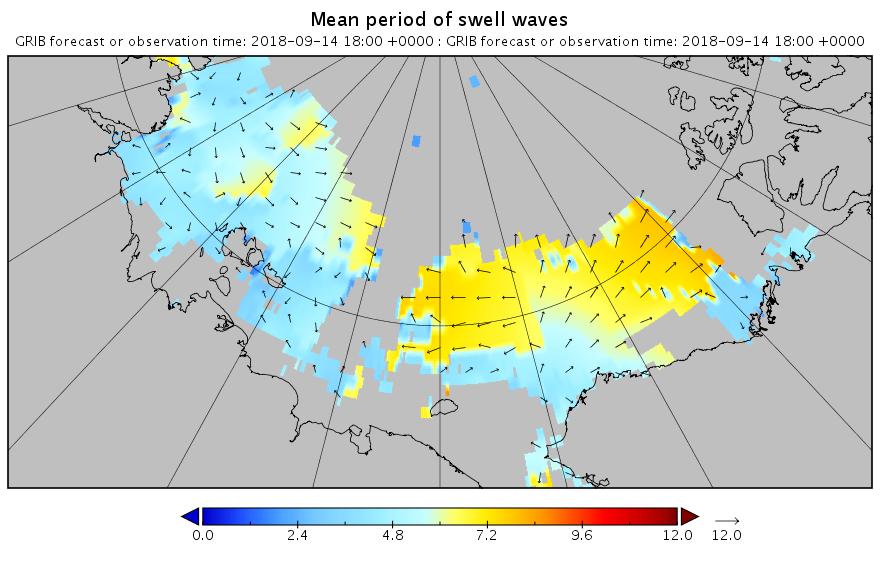
The latest wave forecast for tomorrow evening isn’t as extreme as 3 days ago. Note the change in the significant height scale:
Nonetheless the height and period are still very significant!
[Edit – August 31st]
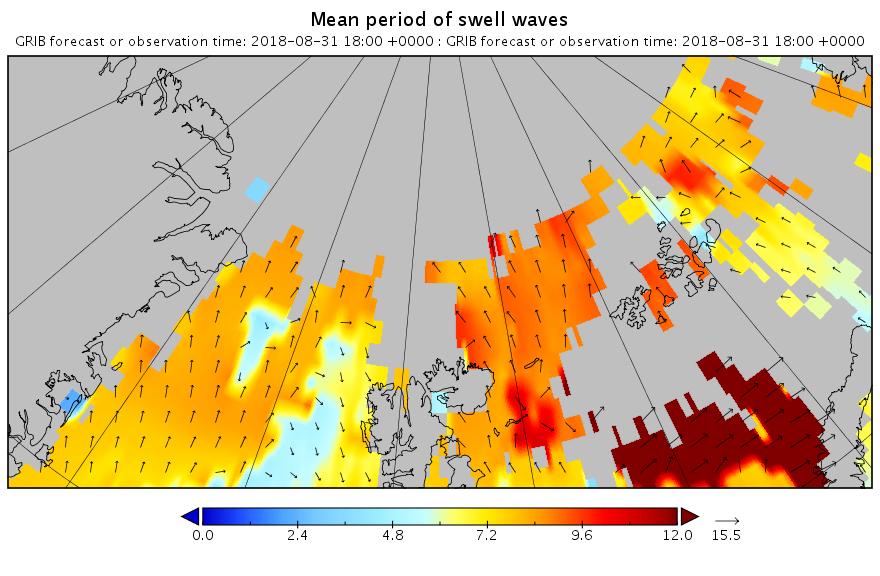
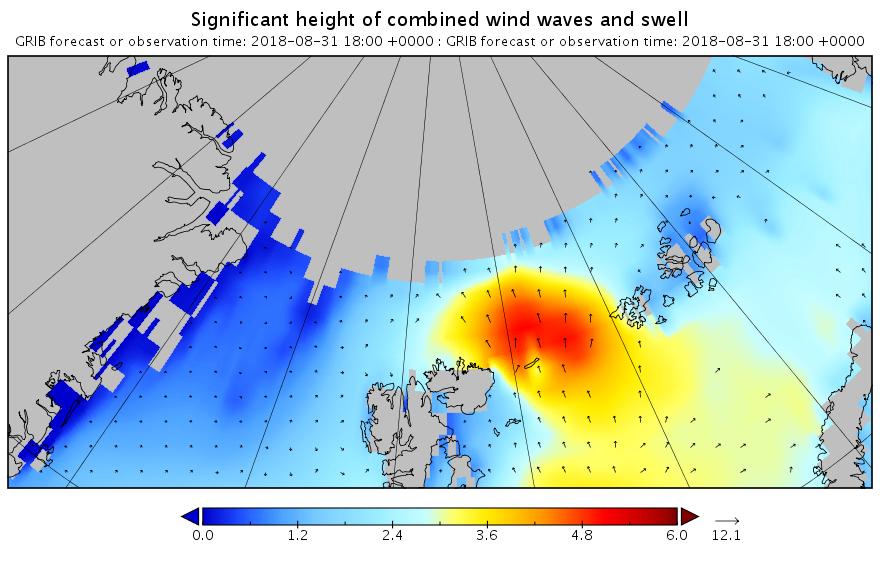
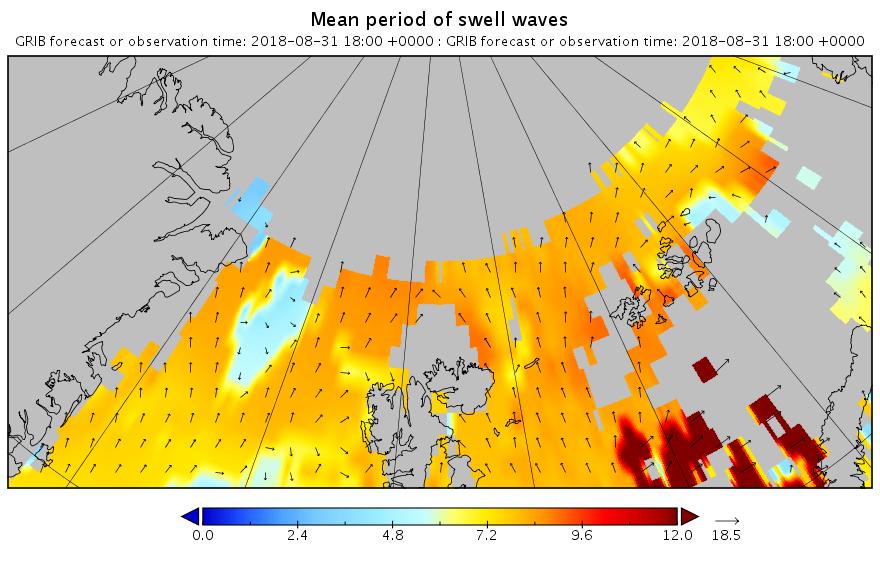
Here’s the latest forecast for 6 PM this evening (UTC):
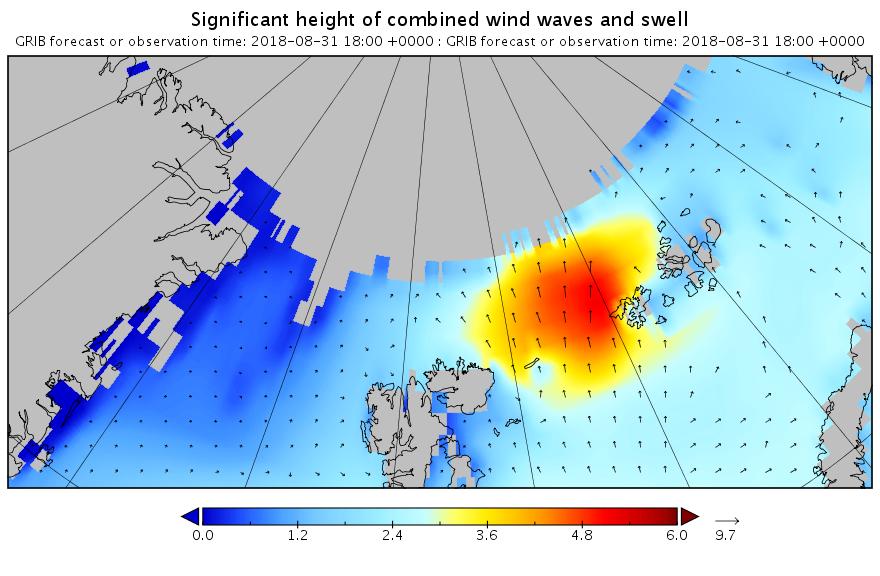
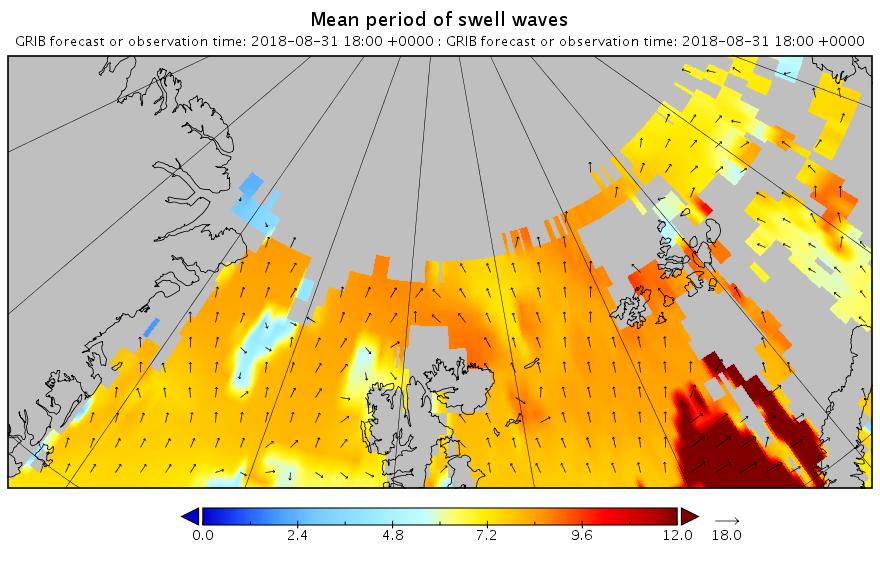
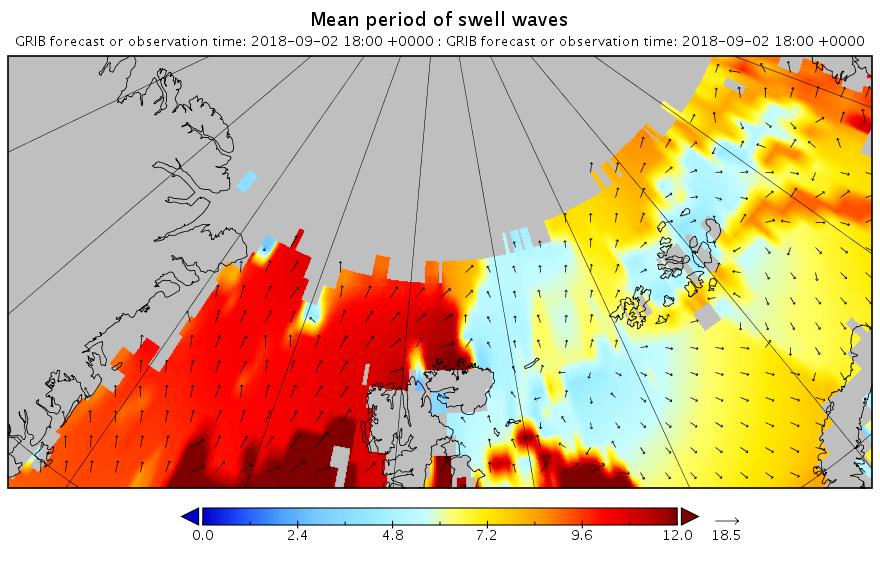
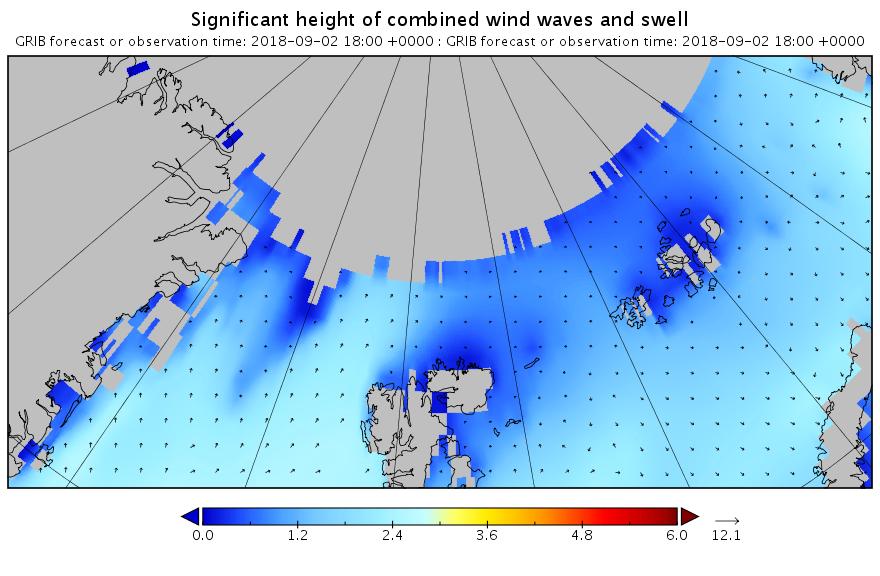
Note how the open water across almost the entire map is full of what in the Arctic counts as a long period swell. That means that the forecast for 2 days later looks like this:
Less height but with a longer period. All of which means that the sea ice north of the Atlantic Ocean isn’t about to receive a short sharp shock. It has a sustained battering lasting several days to look forward to.
[Edit – September 1st]
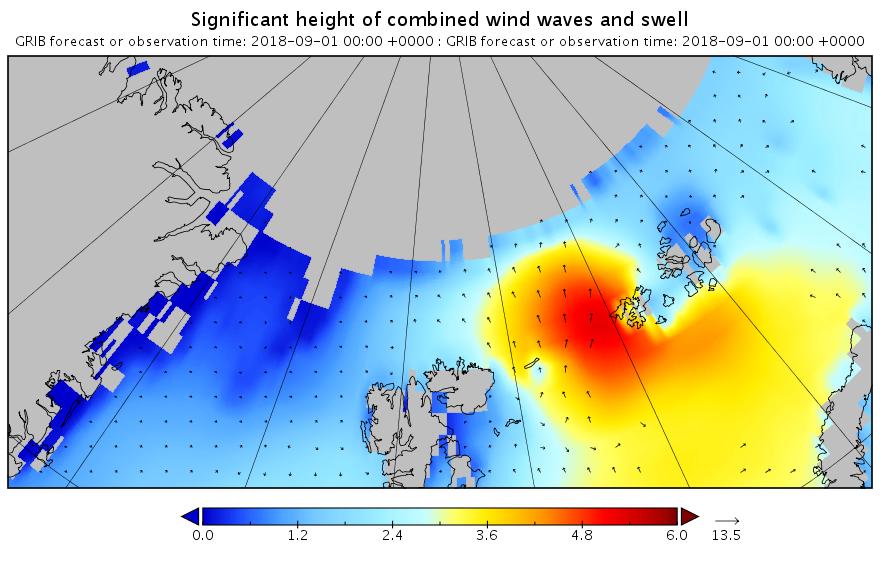
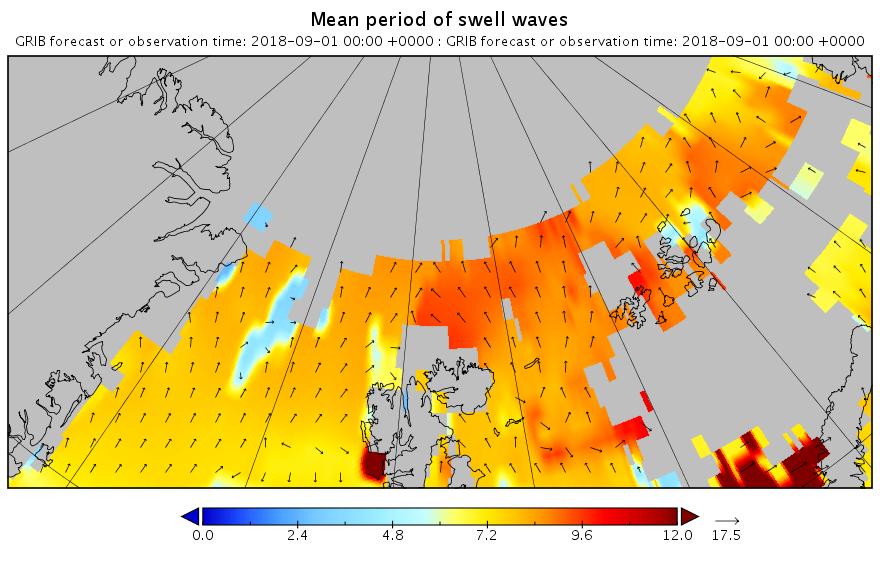
The barrage of assorted swells has begun. Here’s the “hindcast” from midnight last night UTC:
Now lets take a look at tomorrow’s forecast for the Laptev Sea. This is for 09:00 UTC:
Note once again the change of scale on the wave/swell height map. Nevertheless a 3+ meter swell heading over into the East Siberian Sea isn’t something you see every day.
Now were into September the 2018 annual minimum extent can’t be too far away. Extent decline appears to have stalled. However “high res” AMSR2 area is currently falling fast, for the time of year at least:
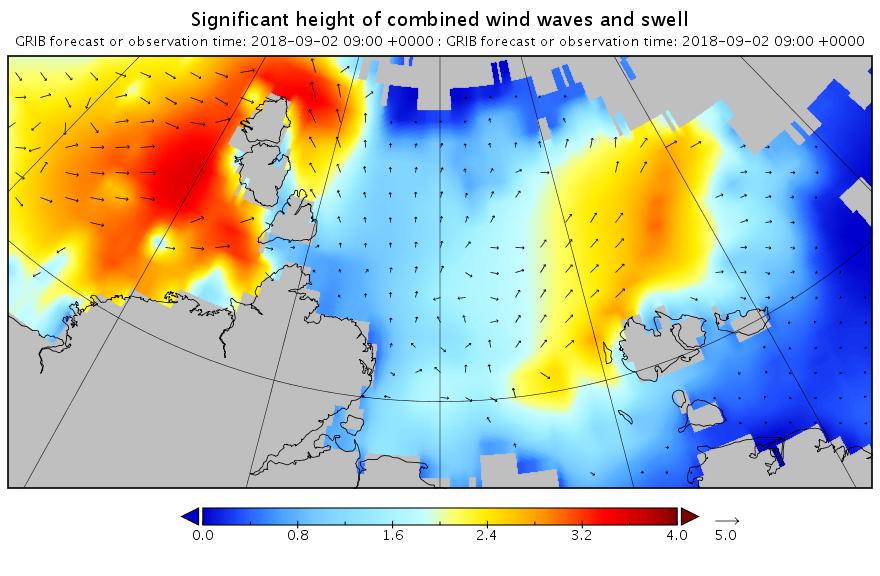
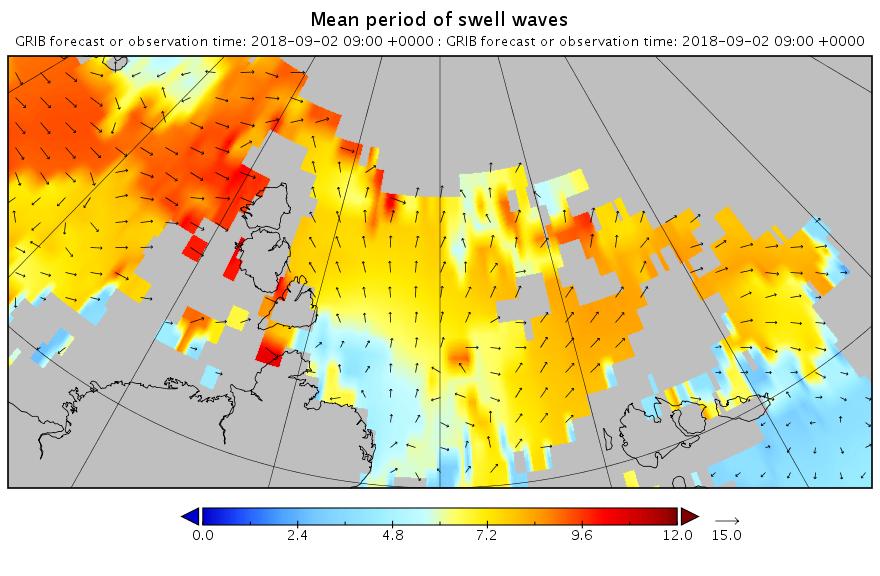
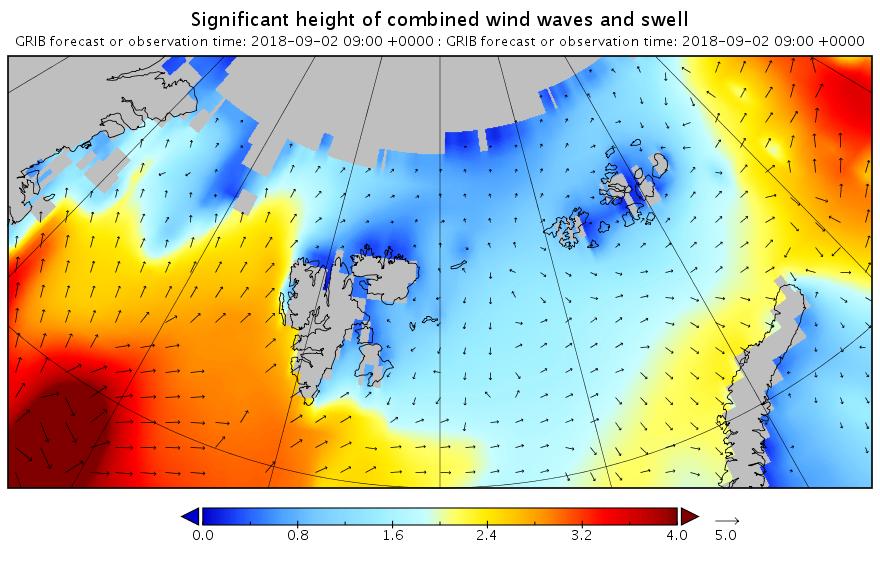
[Edit – September 2nd]
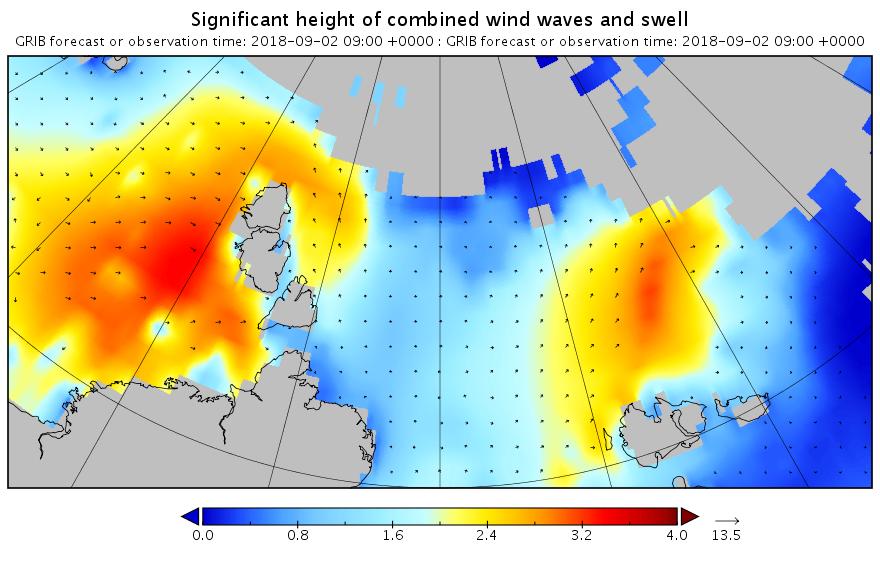
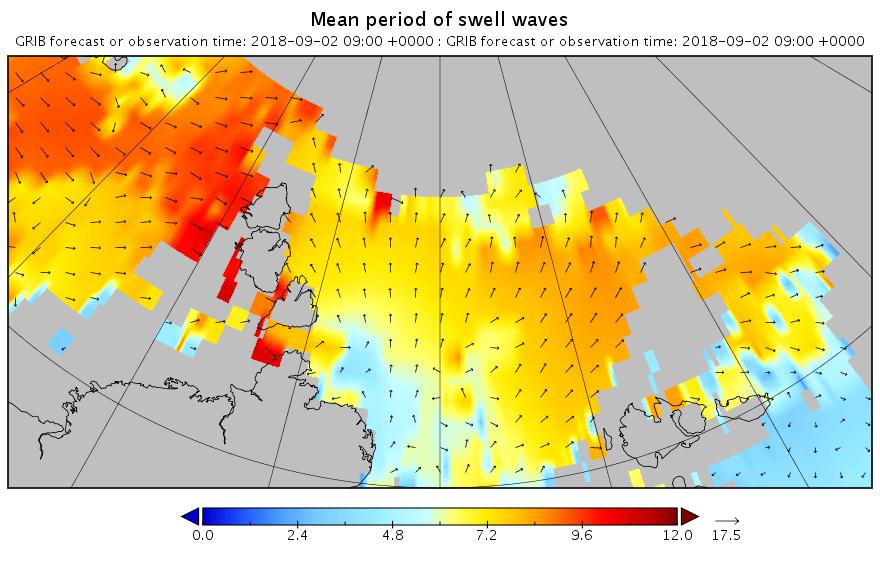
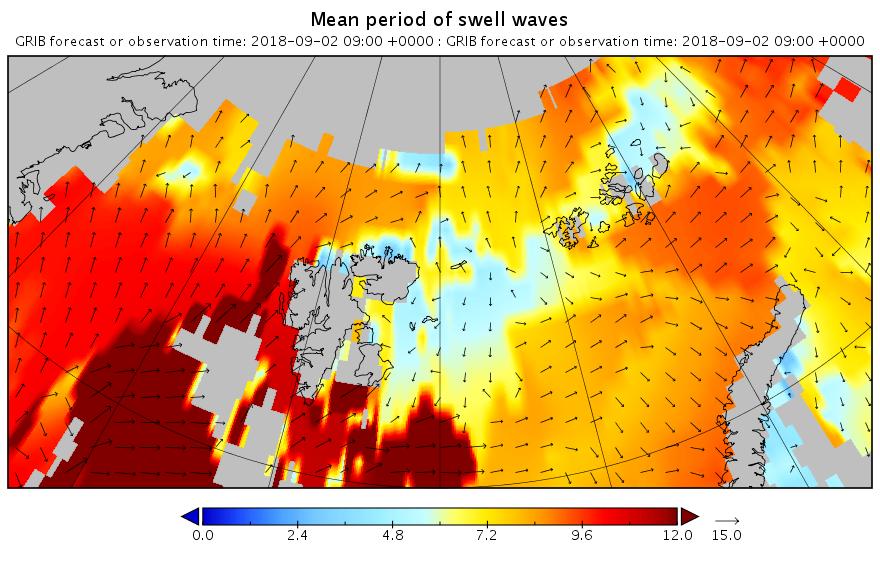
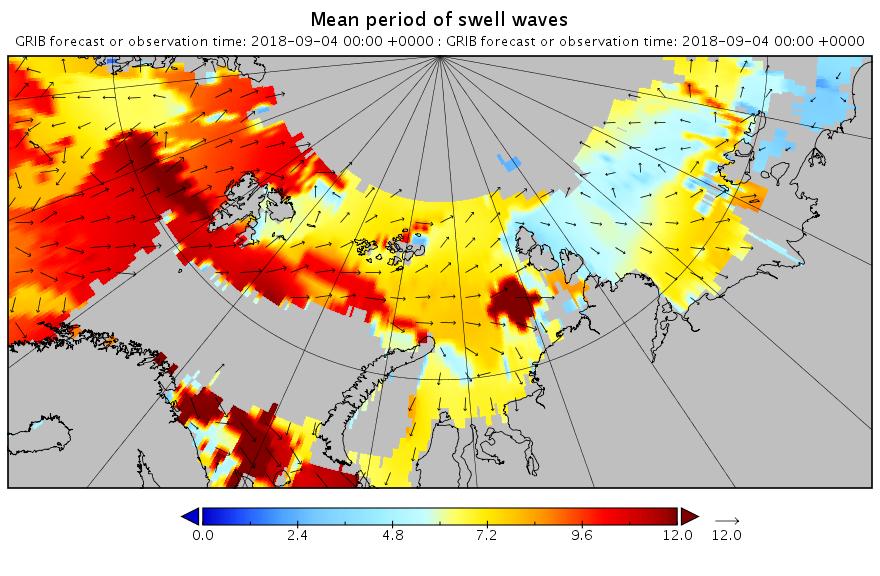
Here are the swell and period forecasts at midnight for round about now, 09:00 UTC:
All the seas between Greenland and the New Siberian Islands are awash with swells with a period of 8 second or greater. This is most unusual, to put it mildly!
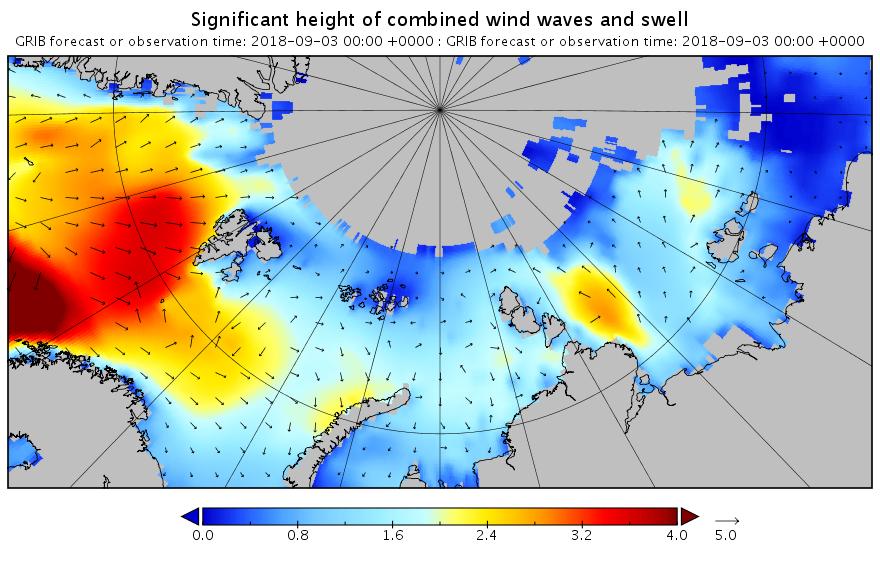
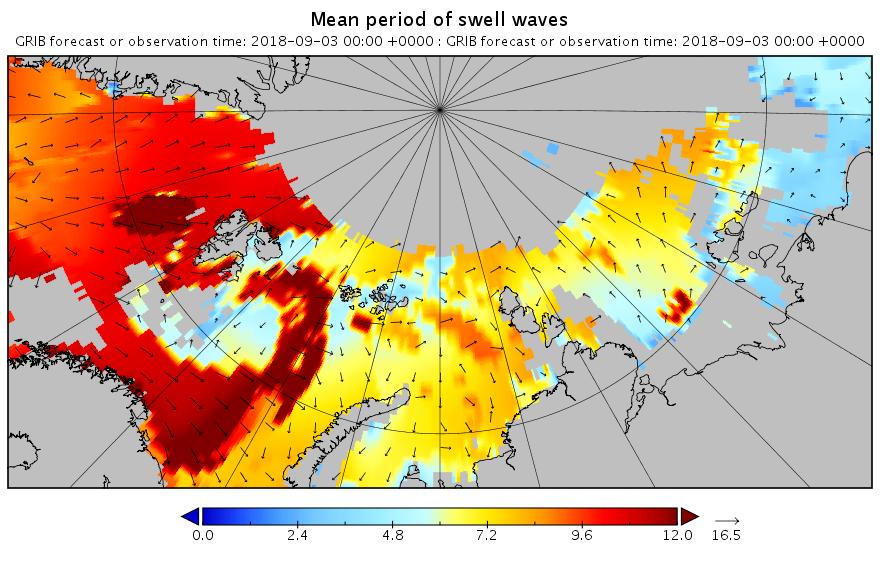
[Edit – September 3rd]
Here’s the WaveWatch III “hindcast” from midnight last night UTC for the Russian side of the Arctic Ocean:
There are still significant swells almost everywhere you look.
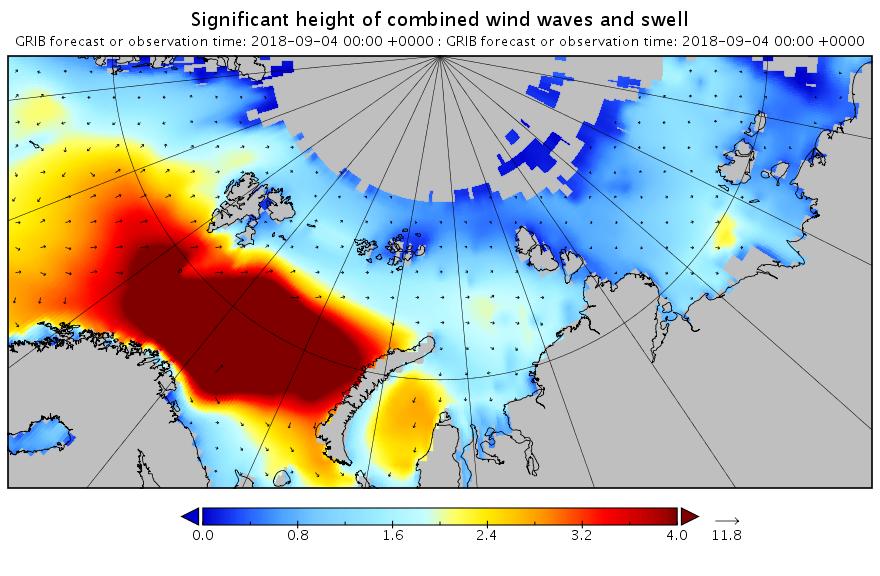
[Edit – September 4th]
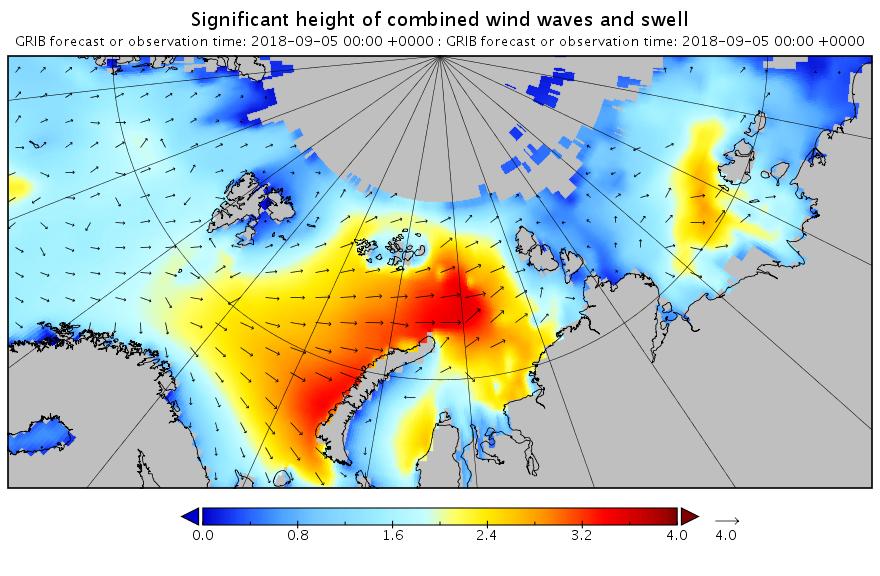
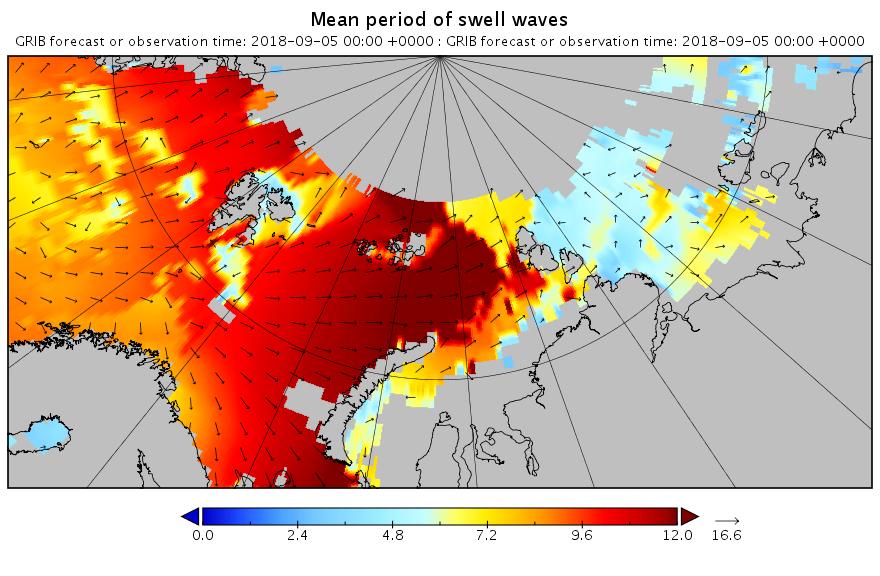
Using the same scales as yesterday, here’s today’s hindcast from midnight:
There’s still plenty of action in the Arctic Ocean!
[Edit – September 5th]
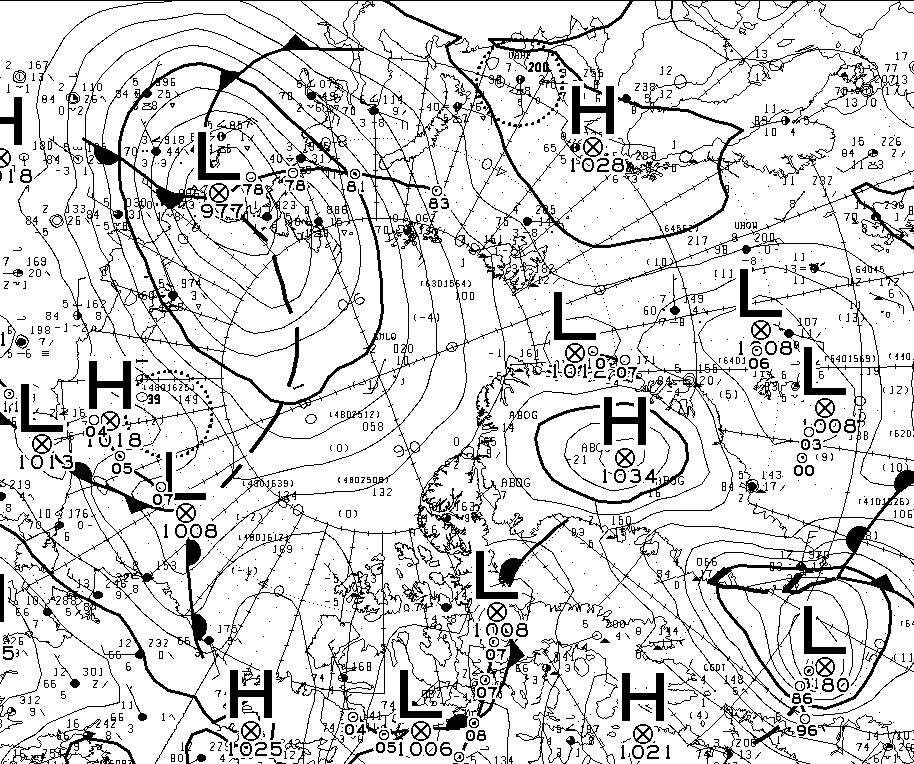
Feel free to debate whether it merits the “Great” prefix, but this is how the early September 2018 Arctic cyclone has panned out. According to this morning’s Environment Canada synopsis the cyclone is centred near the coast of the Laptev Sea and is down to a MSLP of 977 hPa:
Here’s another WaveWatch III hindcast from midnight UTC:
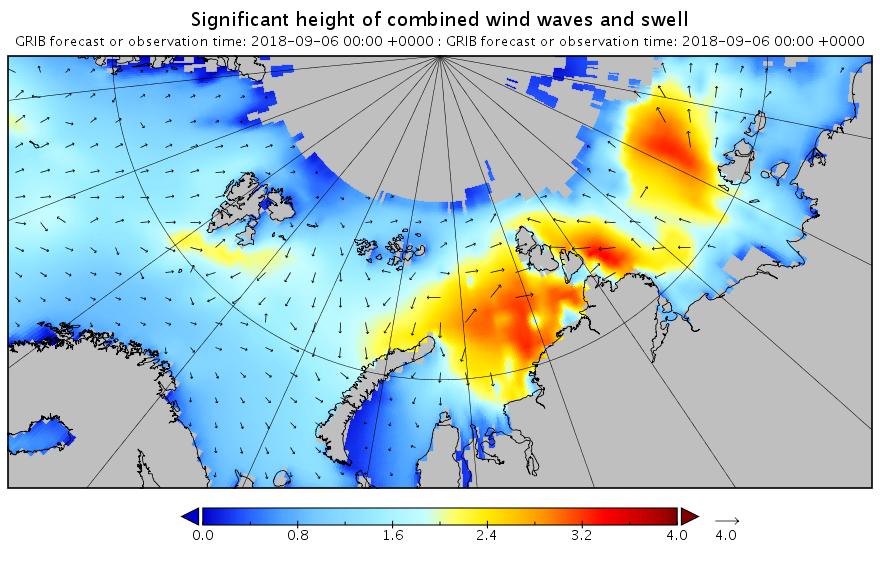
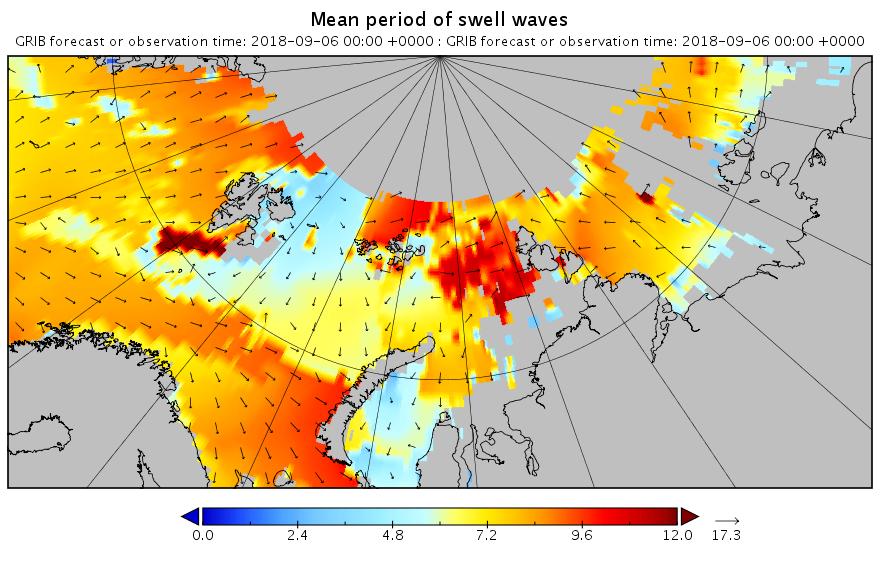
[Edit – September 6th]
Need I say more?
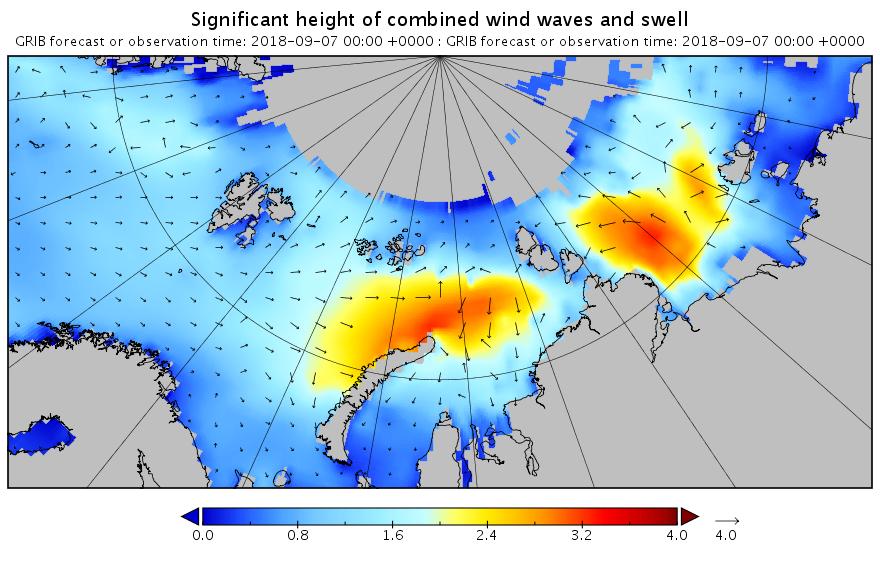
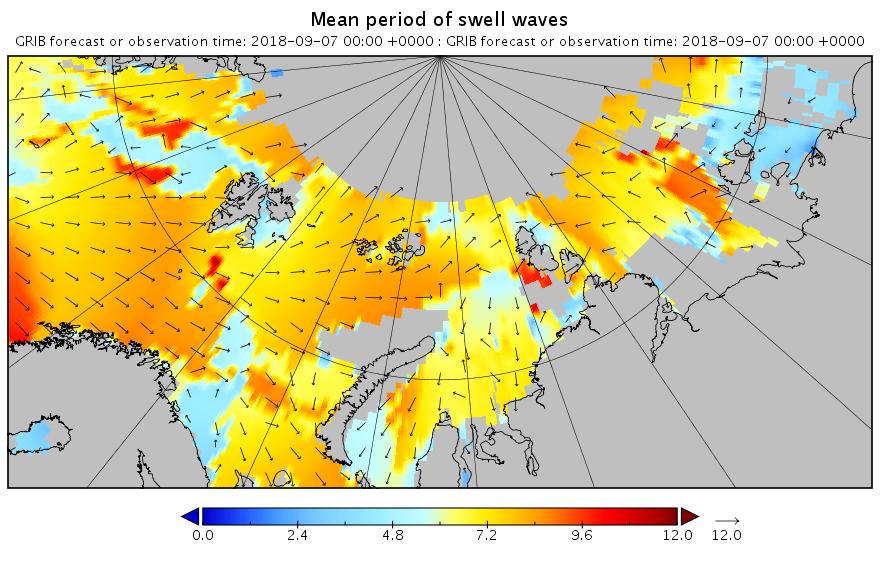
[Edit – September 7th]
The swell in the Fram Strait an Barents Sea is diminishing, but the period in the Laptev Sea is increasing now:
[Edit – September 8th]
All the wave activity in the Laptev Sea is diminishing. Here’s the hindcast from midnight:
Meanwhile things are warming up in the Chukchi and Beaufort Seas. Here’s the forecast for midnight tonight:
[Edit – September 9th]
Here’s the hindcast for this morning’s swell in the Beaufort Sea:
This is currently a long way into the future and hence may not verify in practice. However any pulse of swell is currently forecast for September 13th:
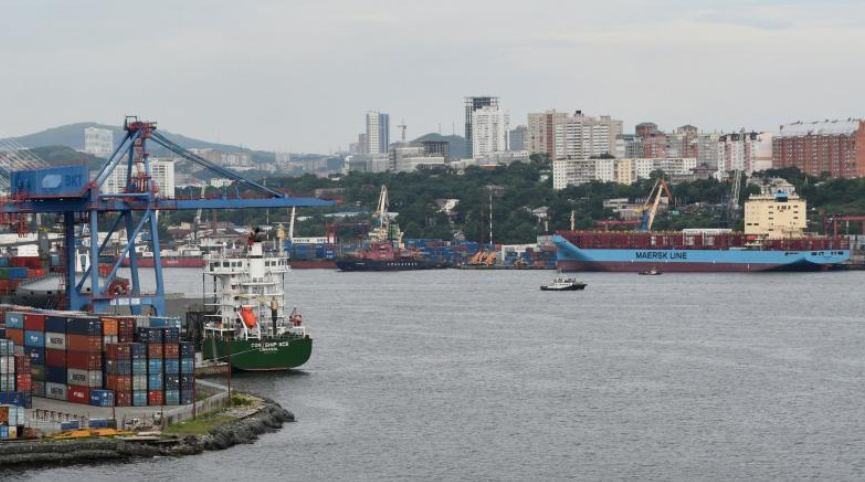
Our usual excuse for an article such as this is an attempt by a “pleasure craft” such as the plucky little yacht Northabout to journey past Russia’s northern shores. I’m not aware of any such plans for this year, but here is some interesting NSR 2018 news. According to Reuters:
A Maersk vessel loaded with Russian fish and South Korean electronics will next week become the first container ship to navigate an Arctic sea route that Russia hopes will become a new shipping highway.
The Arctic voyage by the 3,600 20-foot container capacity Venta Maersk is the latest step in the expansion of the so-called Northern Sea Route which is becoming more accessible to ships as climate change reduces the amount of sea ice.
The brand new Venta Maersk, one of the world’s largest ice-class vessels, will also collect scientific data, said Maersk, underlining that the voyage is a one-off trial for now.
The press release continues:
The decision by Maersk, the world’s biggest container shipping group, to test out the route is a positive sign for Russia, which hopes this could become a mini Suez Canal, cutting sea transport times from Asia to Europe.
“A well-respected company like Maersk sending a container ship through the Arctic, definitely signals there’s something there,” Malte Humpert, a senior fellow at U.S.-based think-tank Arctic Institute, said.
“Currently, we do not see the Northern Sea Route as an alternative to our usual routes. Today, the passage is only feasible for around three months a year which may change with time,” a spokeswoman for Maersk said.
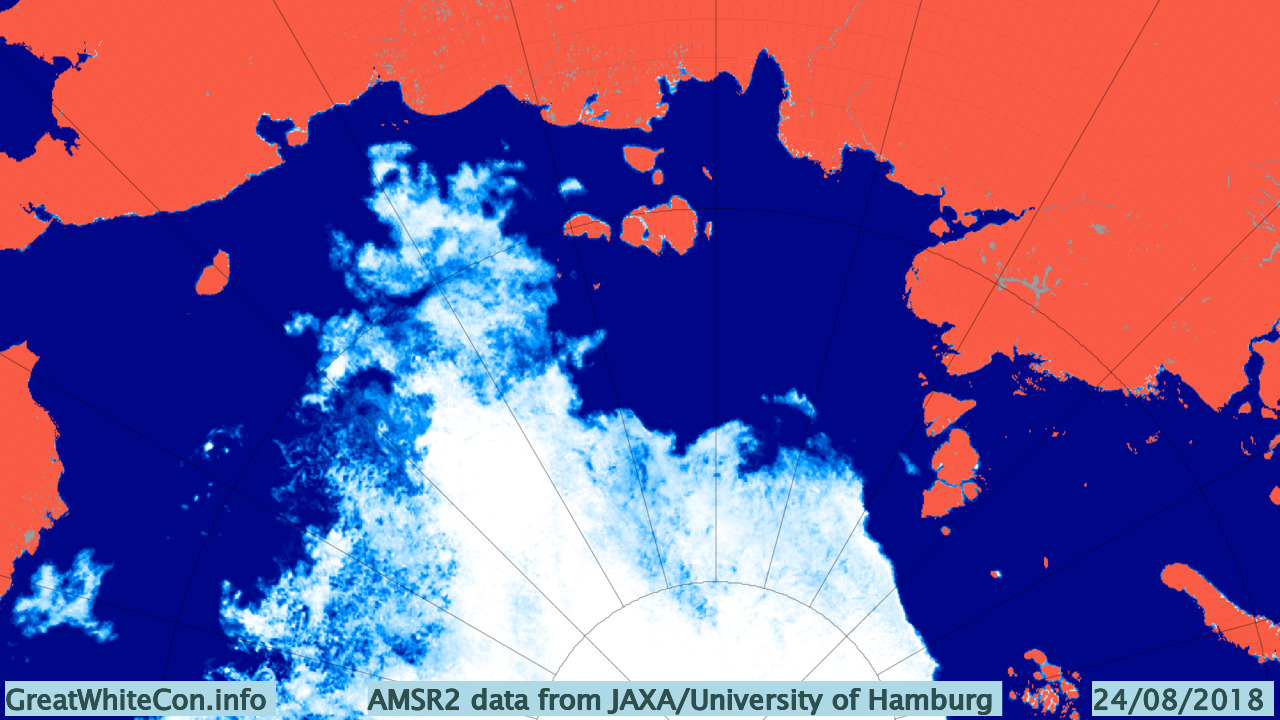
Here’s the sea ice situation that the Venta Maersk is heading for:
According to AMSR2 there’s still some sea ice quite close to shore in the East Siberian Sea. Meanwhile according to Marine Traffic the Venta Maersk has already left Vladivostok:
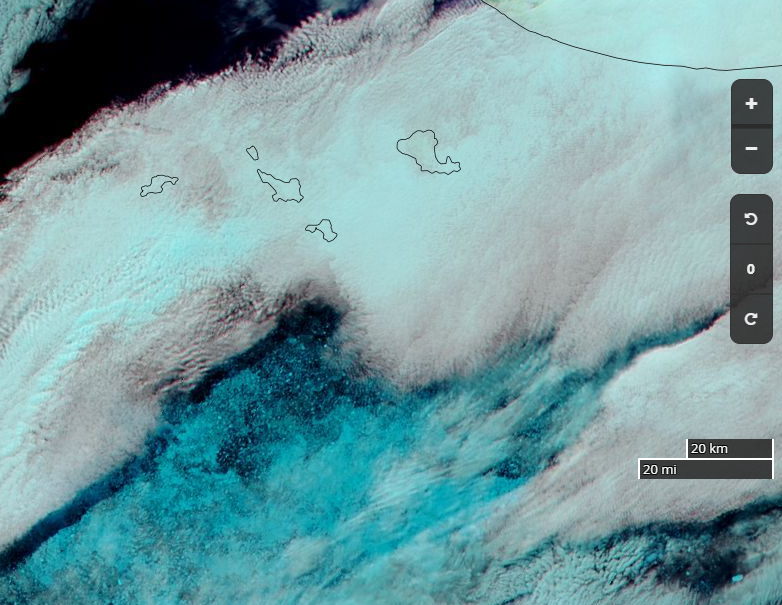
It will be a little while before she’s braving the dangers of the sea ice in the East Siberian Sea. Hopefully by that time we’ll have some clear satellite images at visual frequencies of anything solid in the path of all those containers. In the meantime here’s a glimpse through the clouds of the approximate ice edge on August 23rd:
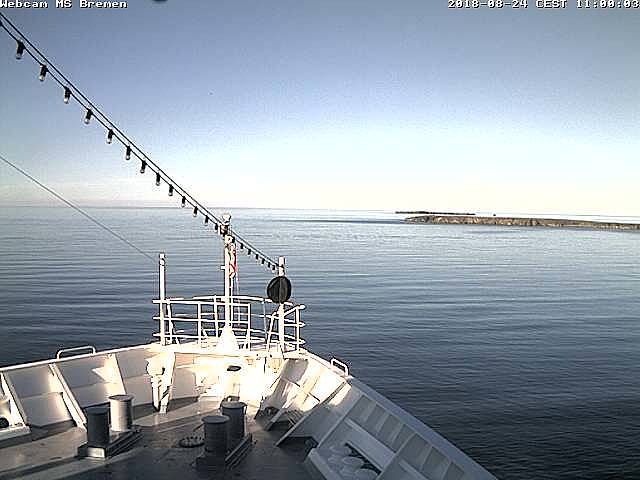
Meanwhile the Hapag Lloyd cruise ship Bremen is currently en route from Tromso to Nome via the Northern Sea Route. She is currently crossing the Laptev Sea heading for the ESS “choke point” from the opposite direction:
This website uses cookies to improve your experience. We'll assume you're ok with this, but you can opt-out if you wish. Cookie settingsACCEPT
Privacy & Cookies Policy
Privacy Overview
This website uses cookies to improve your experience while you navigate through the website. Out of these, the cookies that are categorized as necessary are stored on your browser as they are essential for the working of basic functionalities of the website. We also use third-party cookies that help us analyze and understand how you use this website. These cookies will be stored in your browser only with your consent. You also have the option to opt-out of these cookies. But opting out of some of these cookies may affect your browsing experience.
Necessary cookies are absolutely essential for the website to function properly. This category only includes cookies that ensures basic functionalities and security features of the website. These cookies do not store any personal information.
Any cookies that may not be particularly necessary for the website to function and is used specifically to collect user personal data via analytics, ads, other embedded contents are termed as non-necessary cookies. It is mandatory to procure user consent prior to running these cookies on your website.