Tag Archives: Laptev Sea

Facts About the Arctic in June 2021

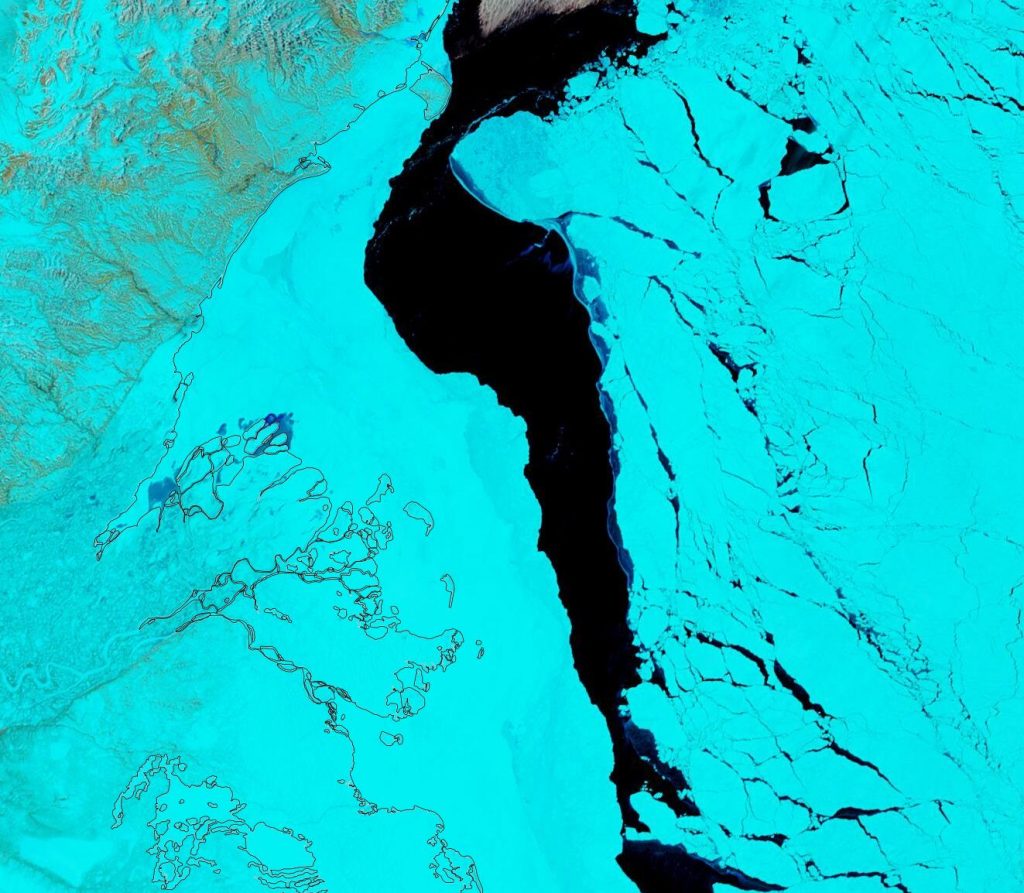
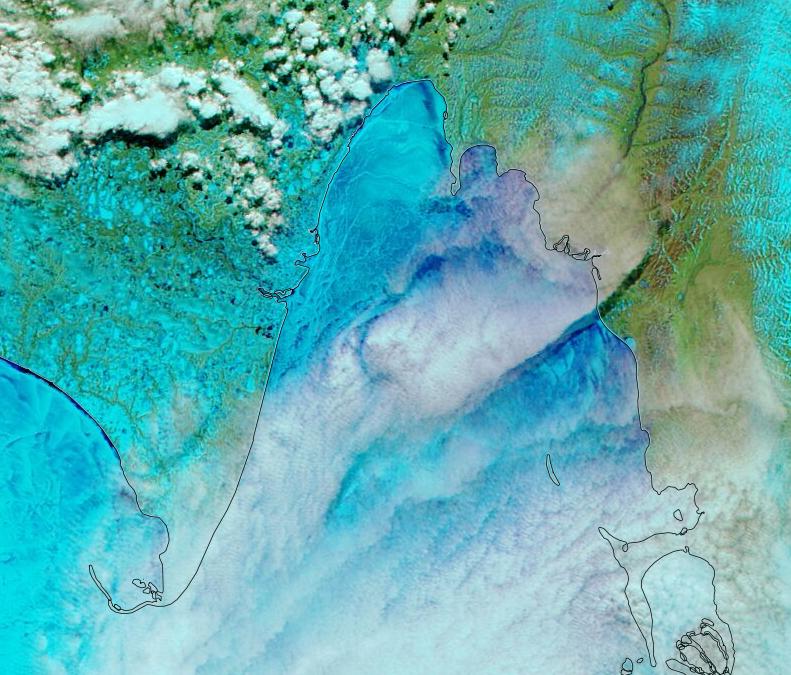
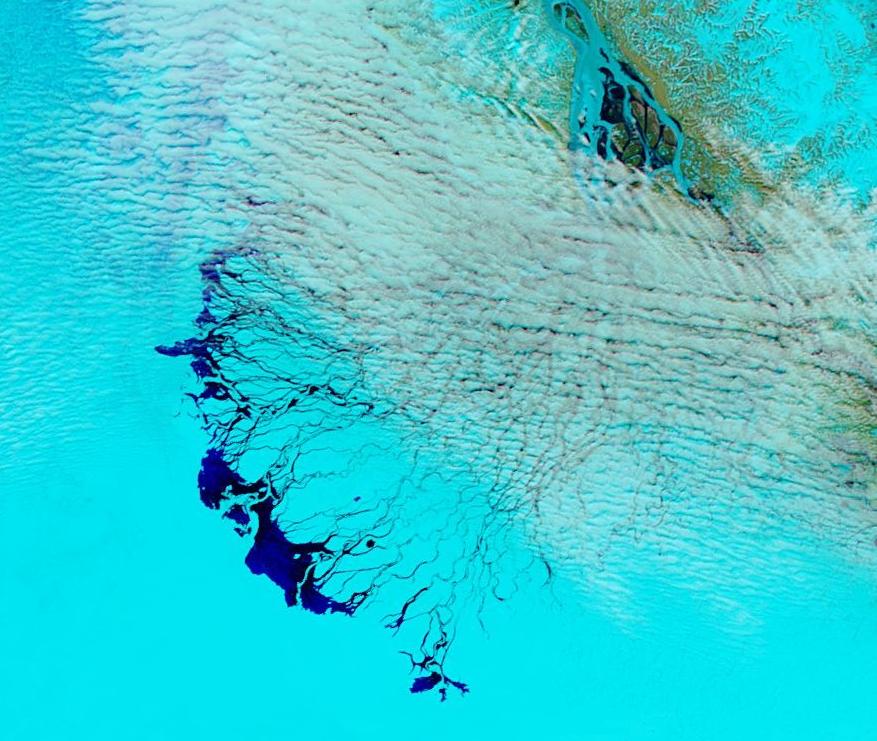
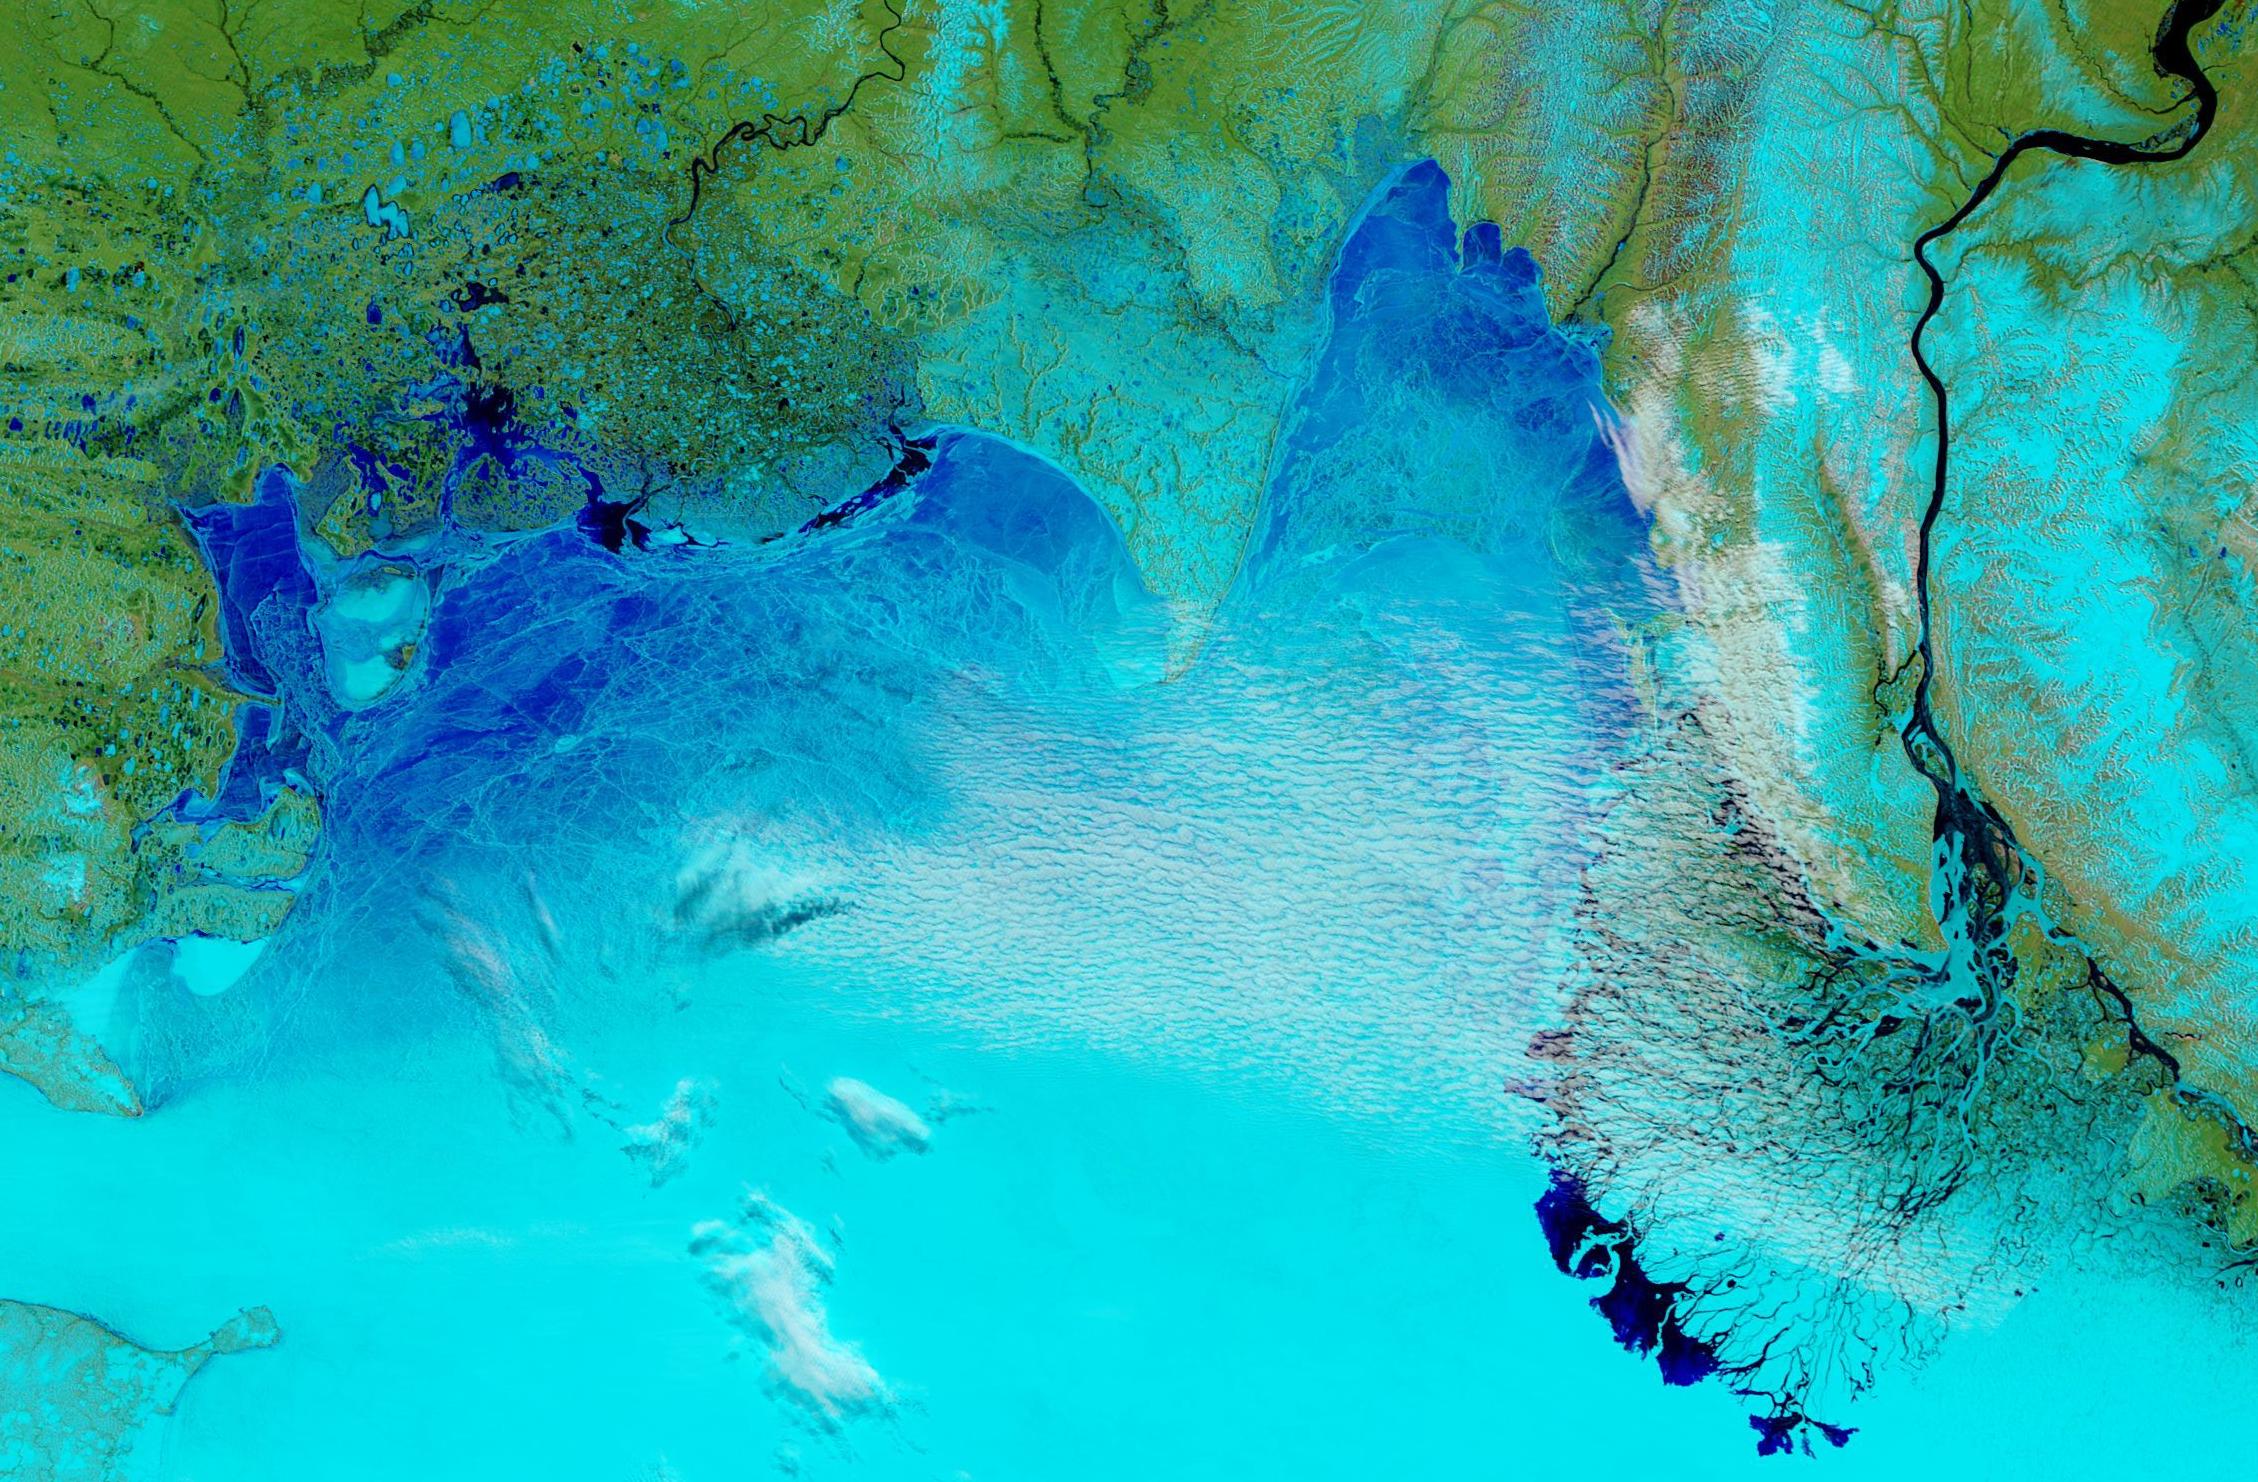
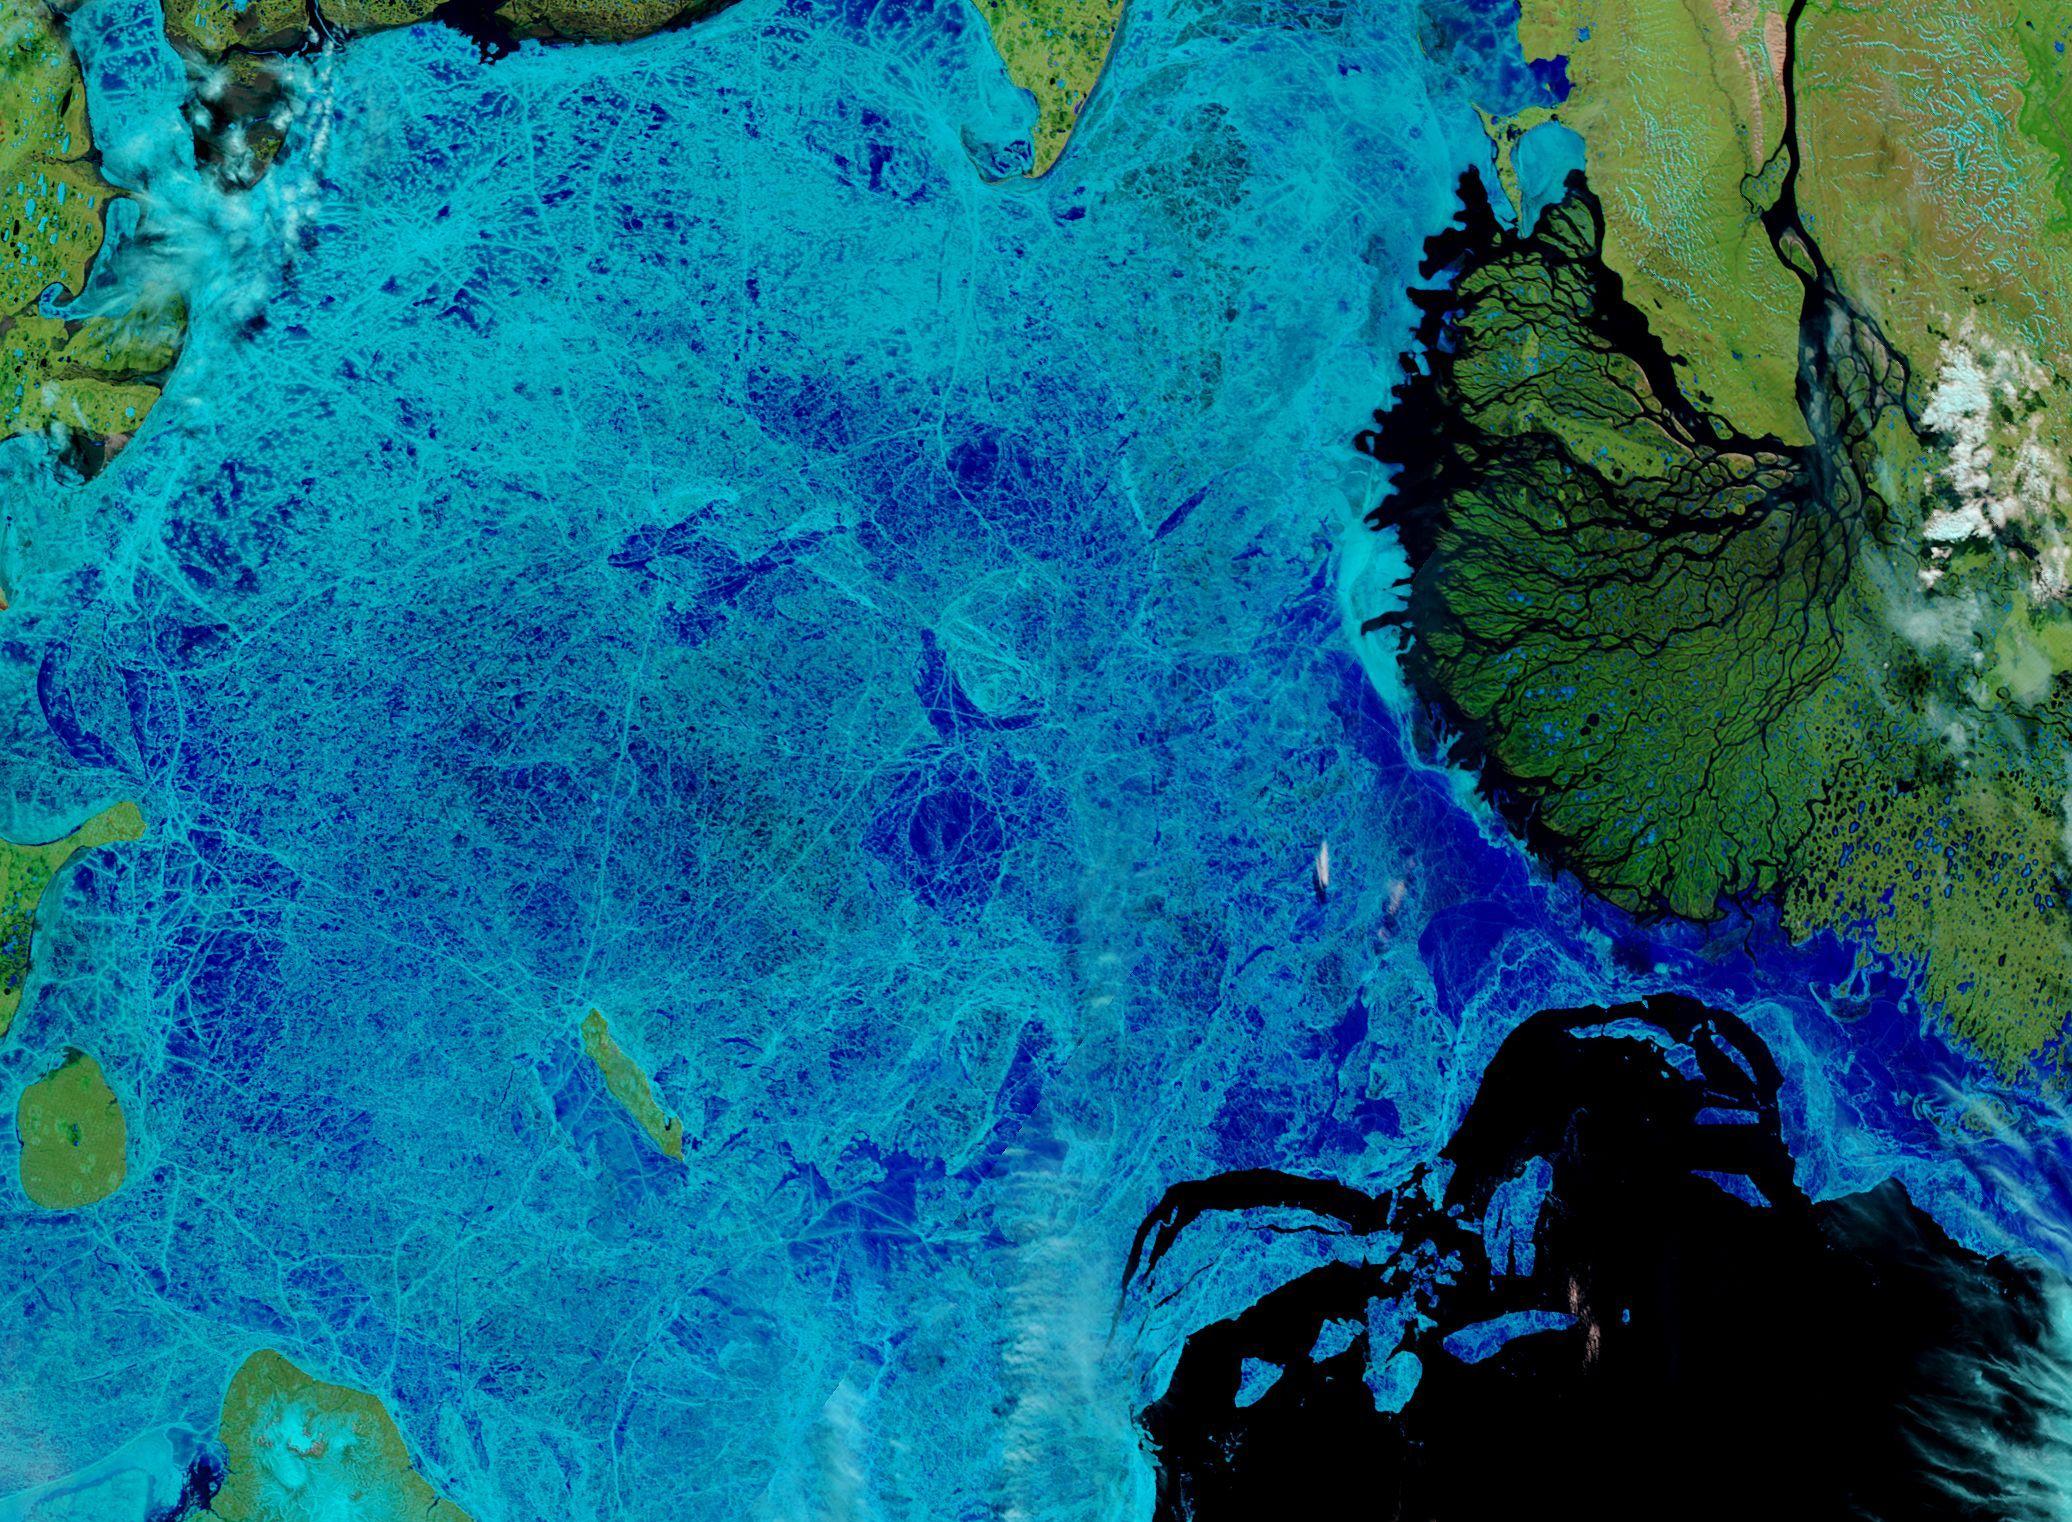
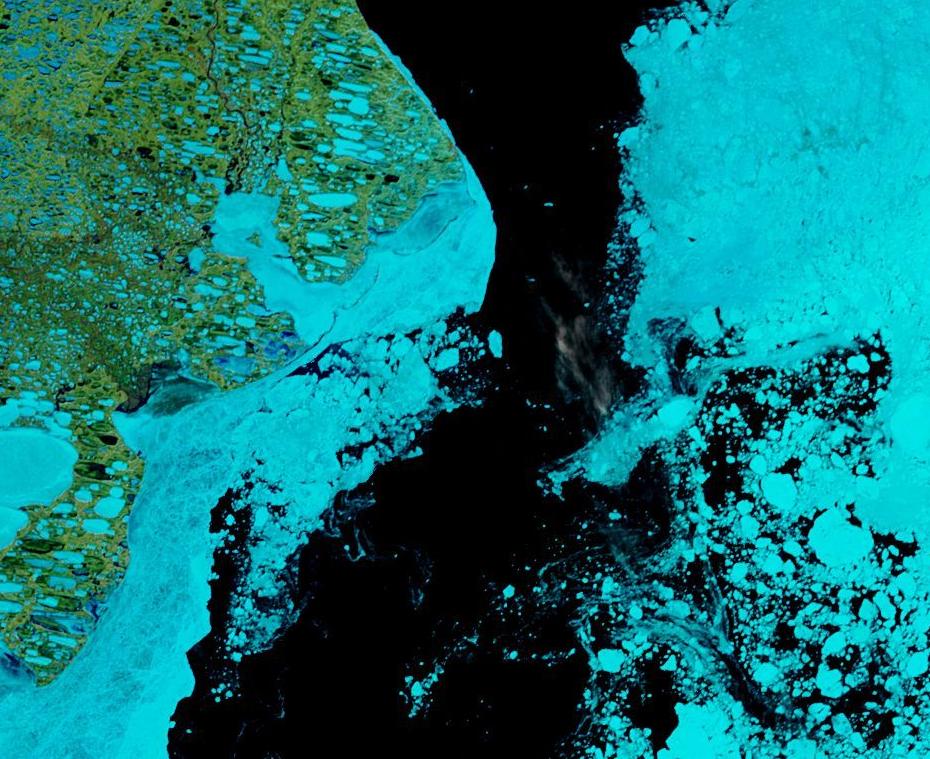
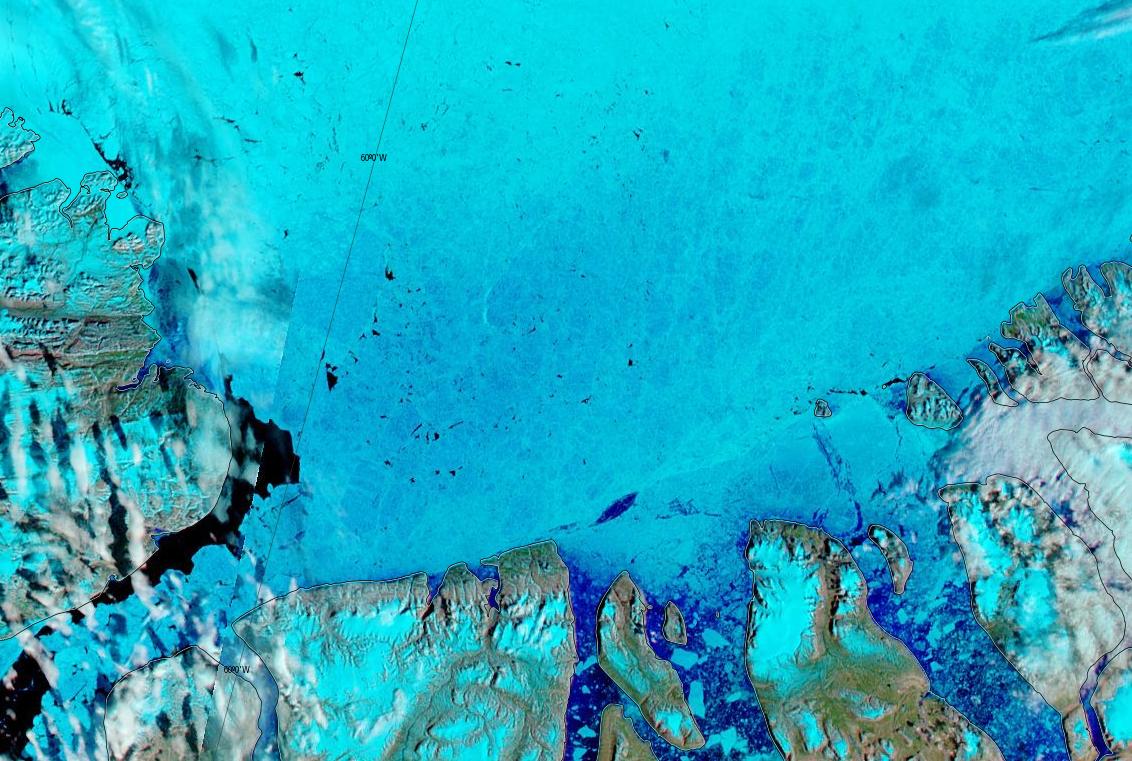
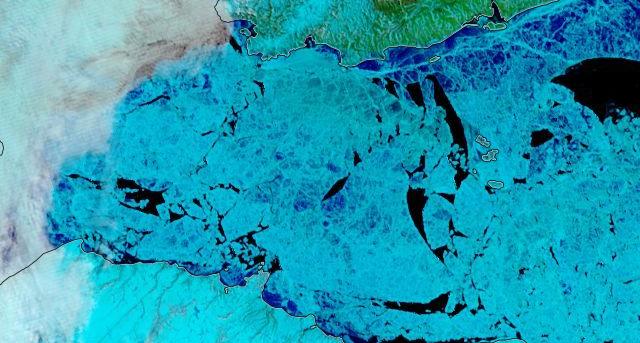
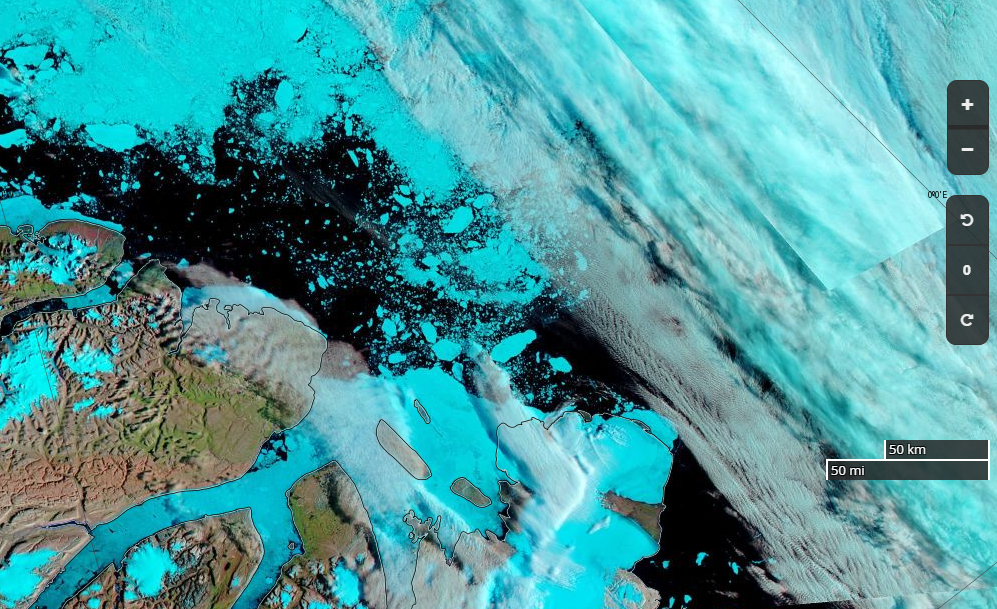
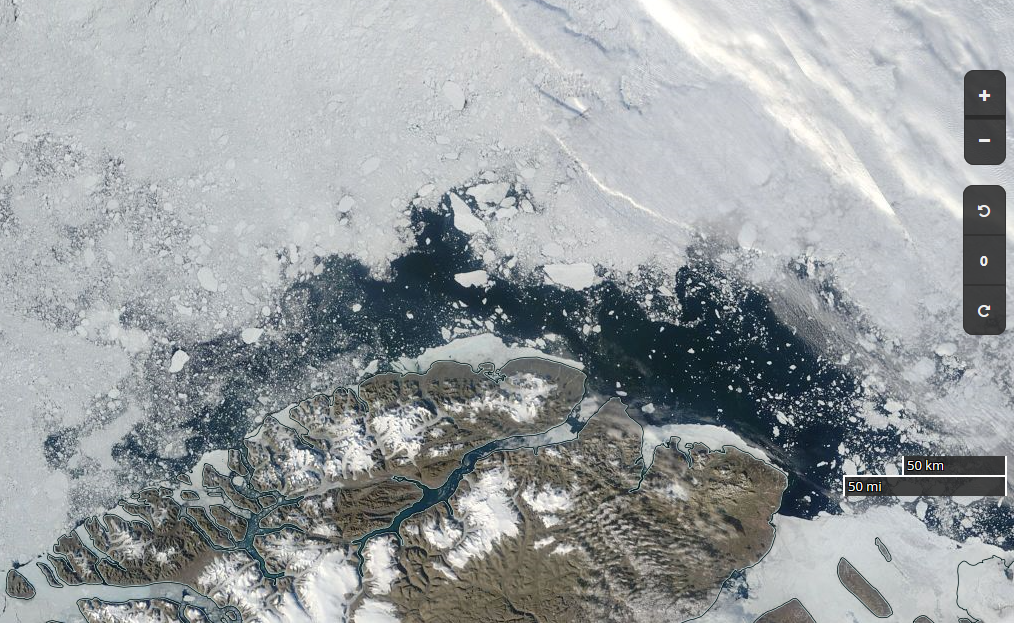
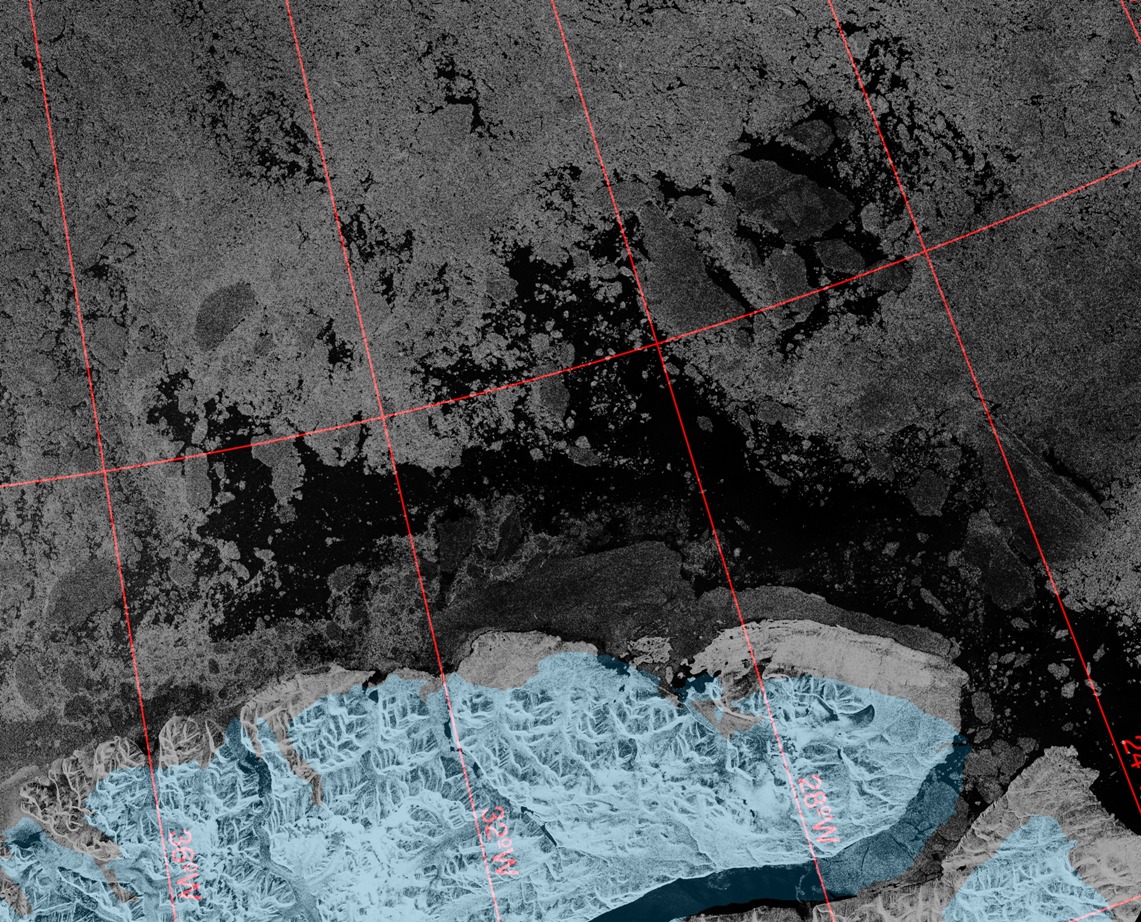
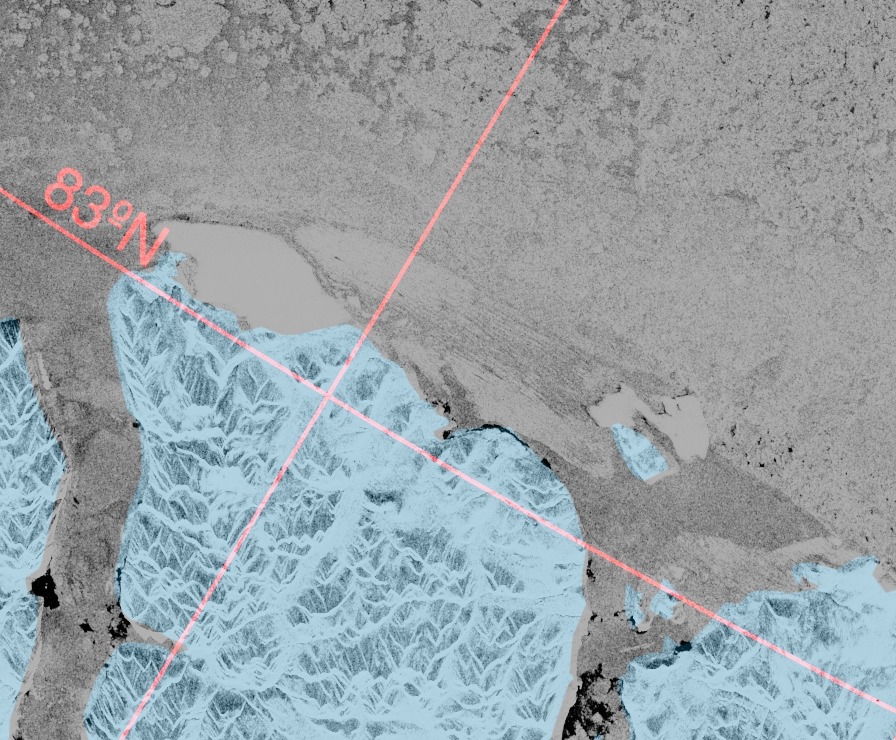
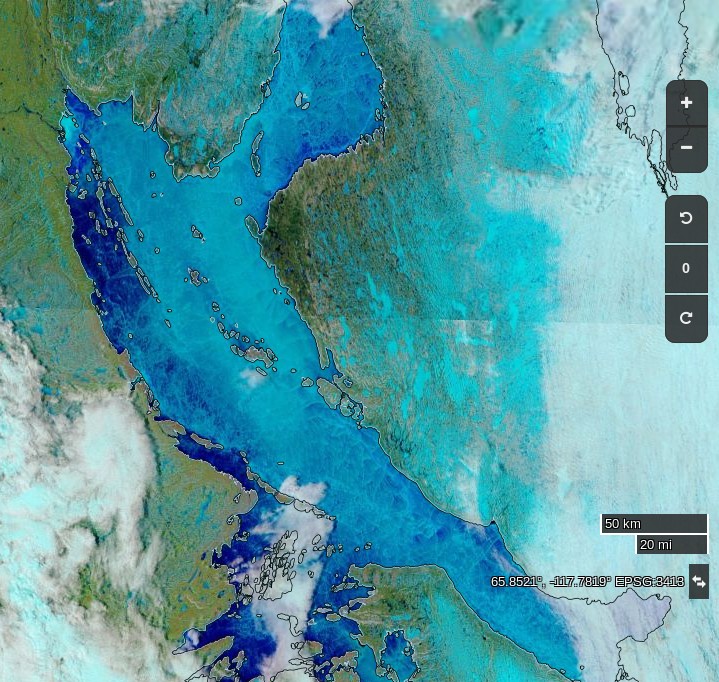
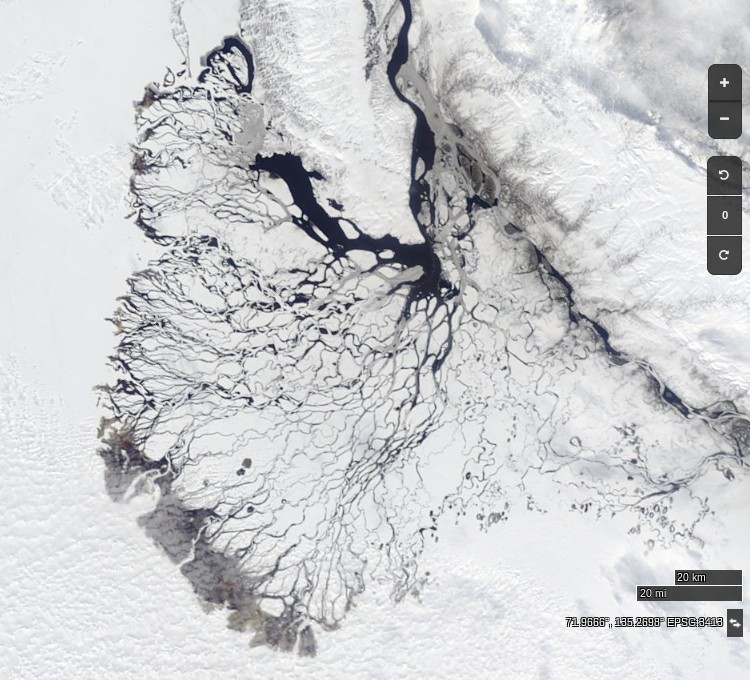
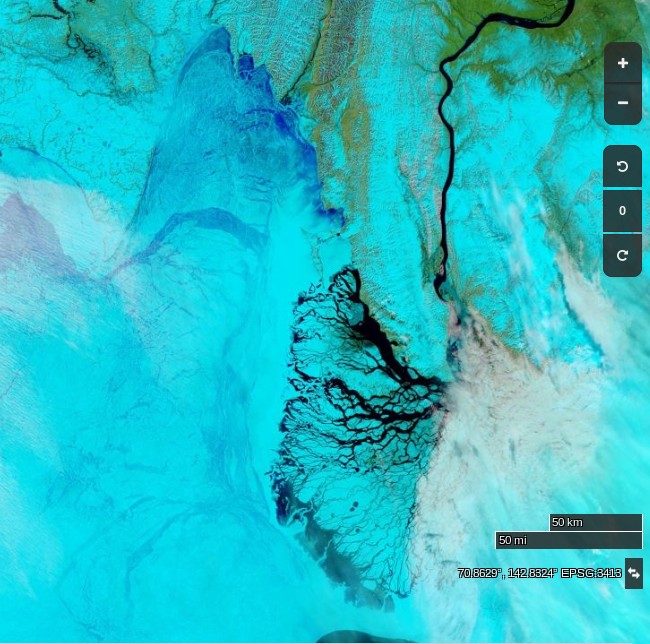
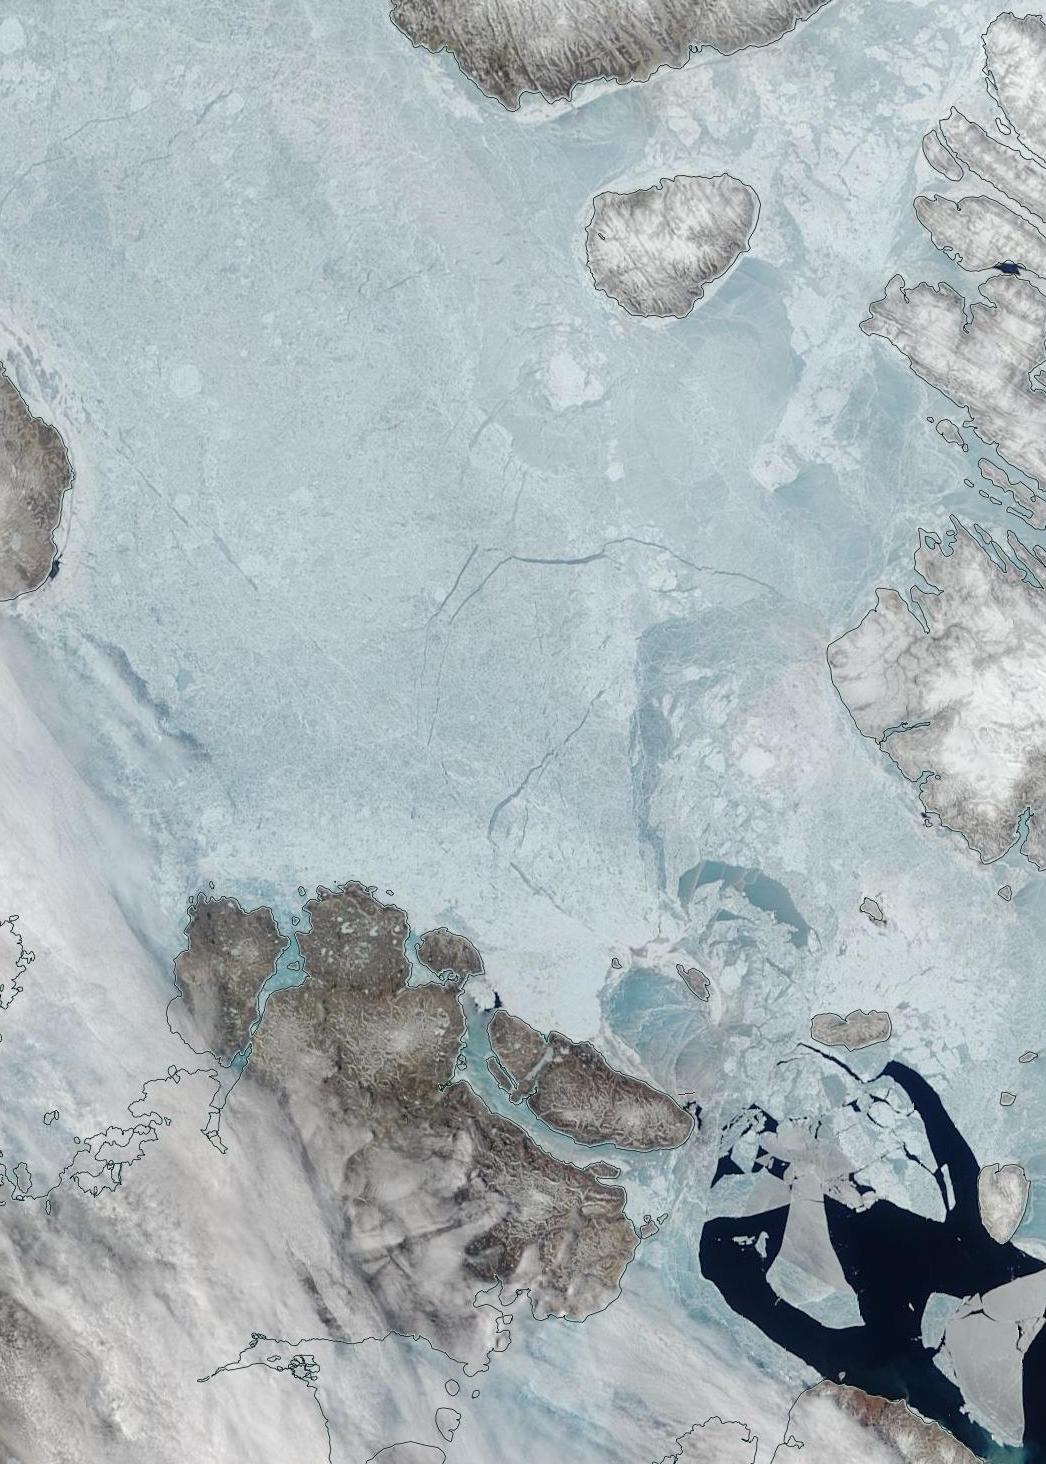
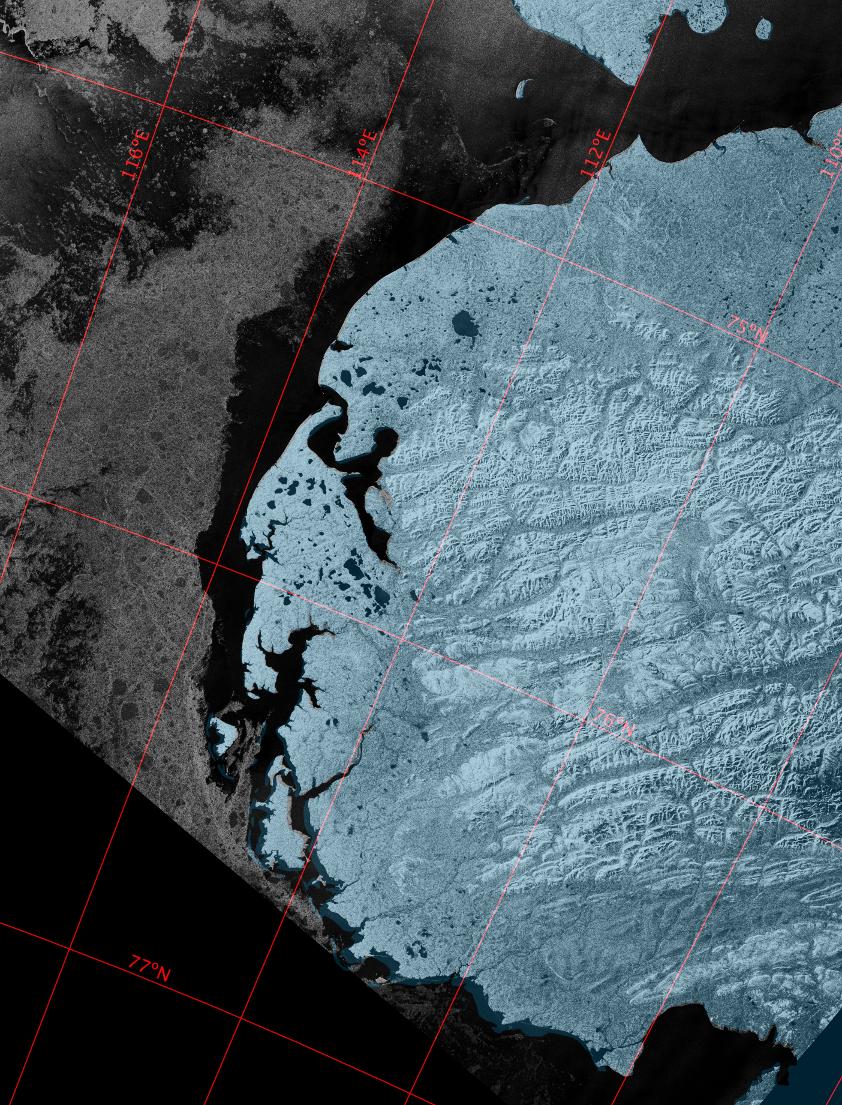
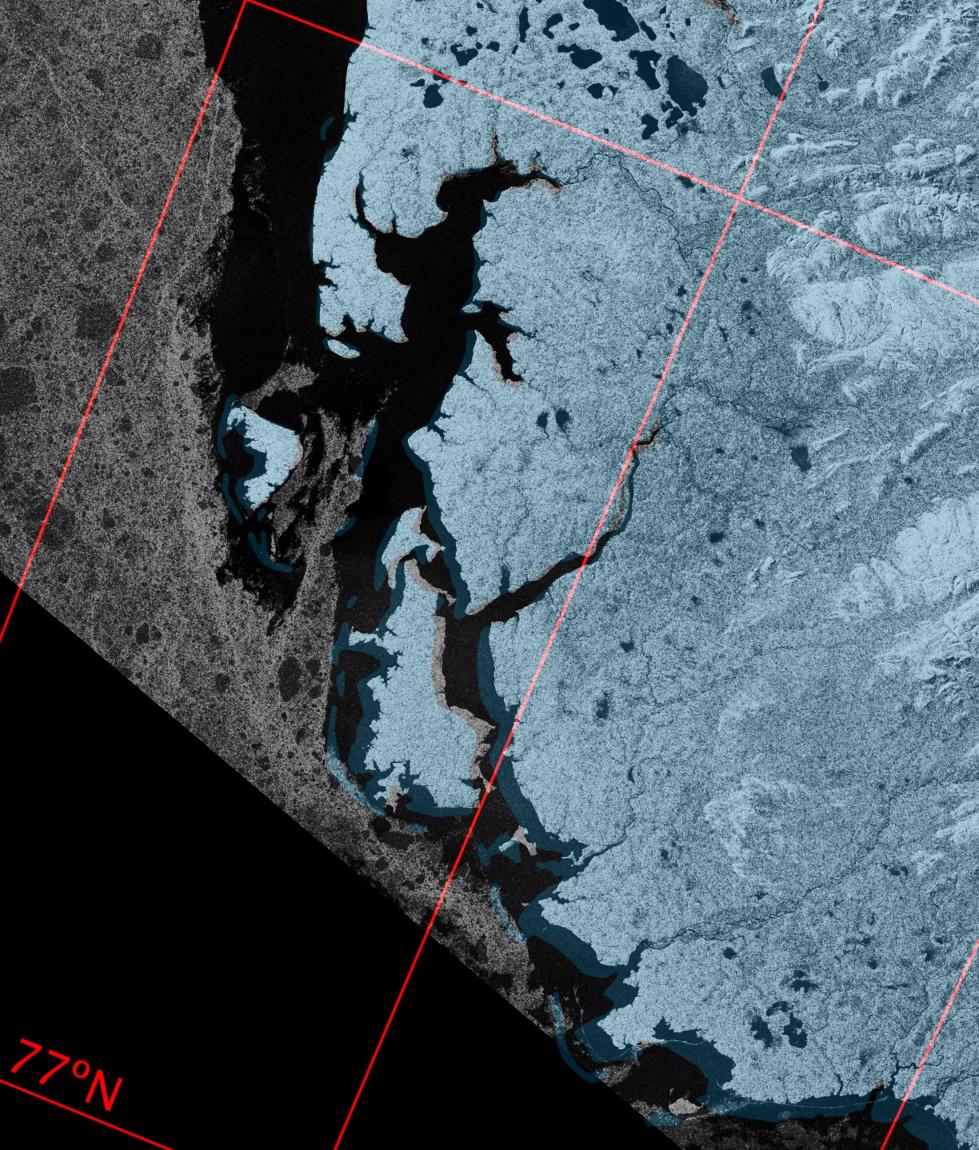
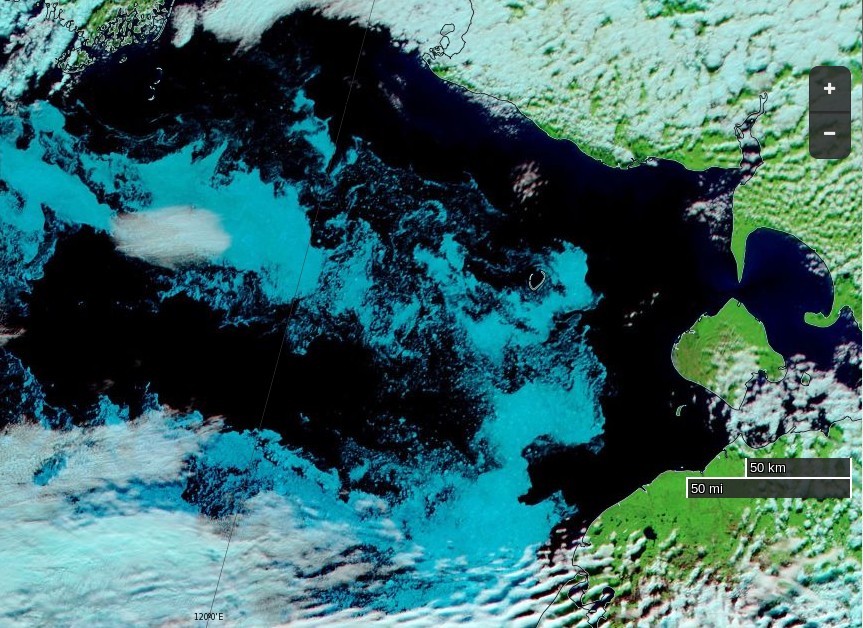
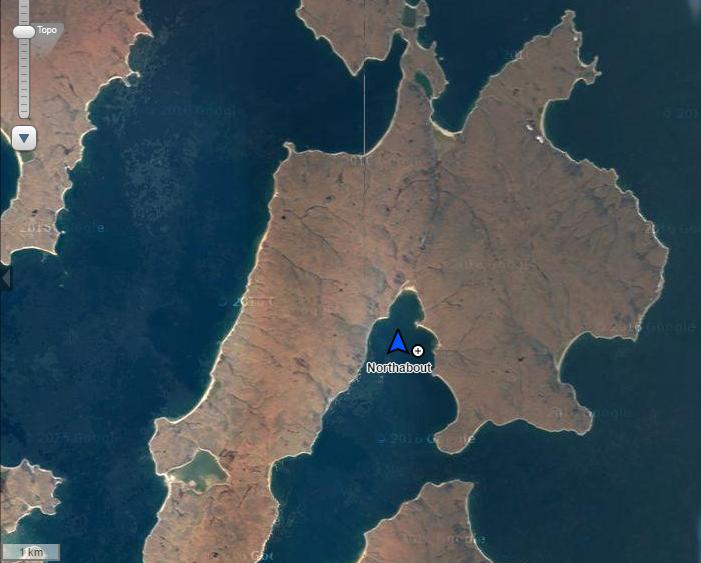
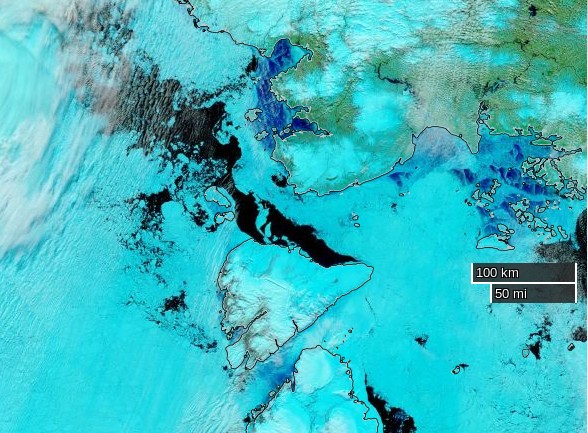
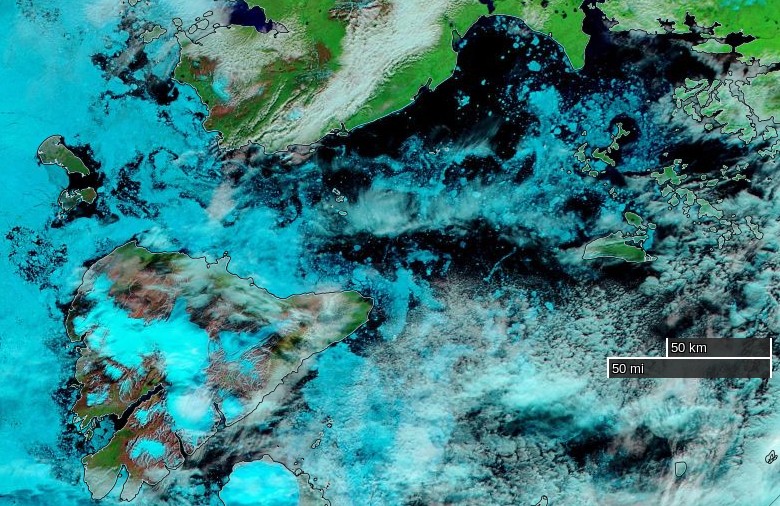
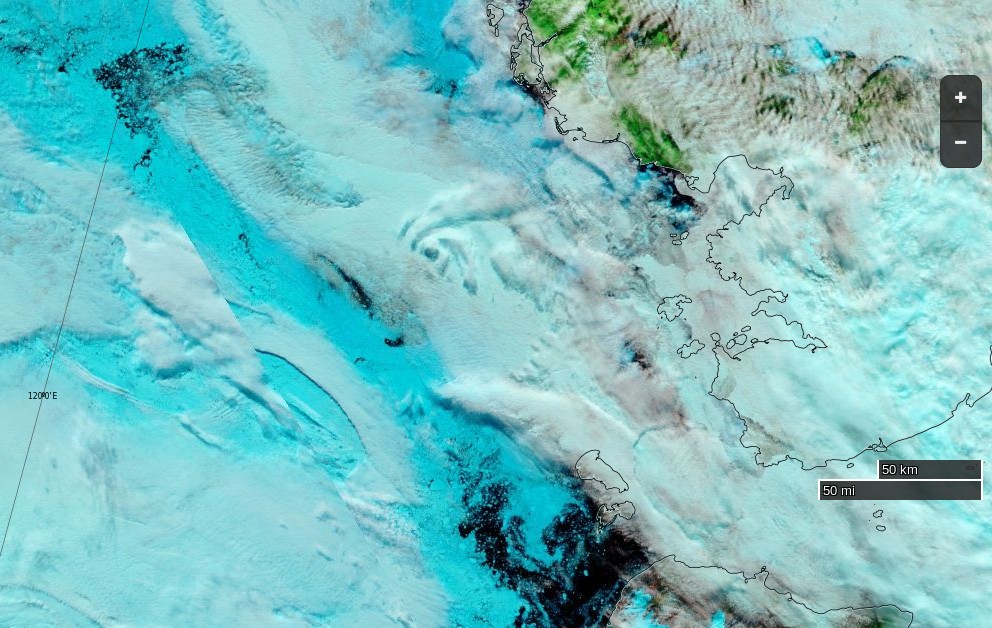
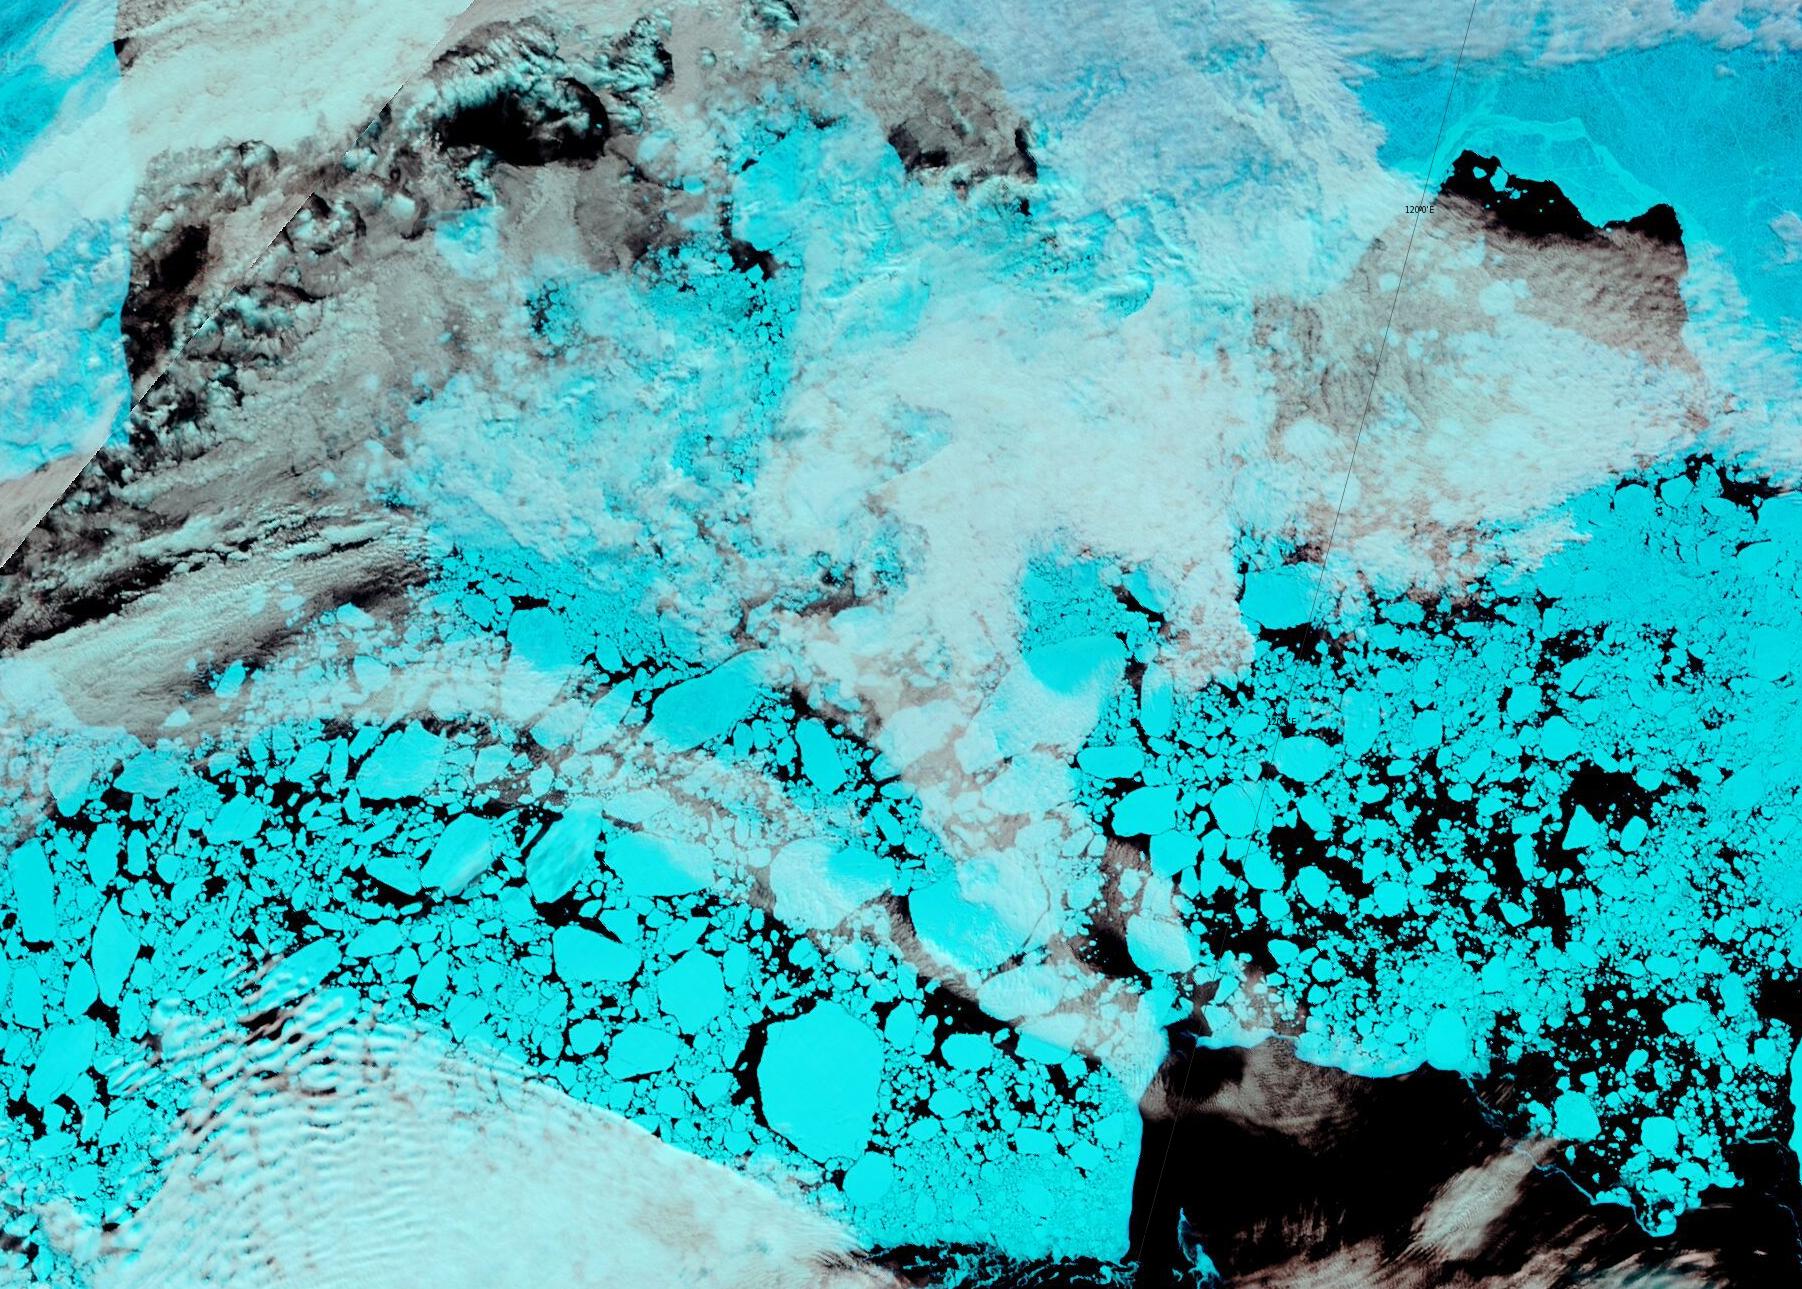
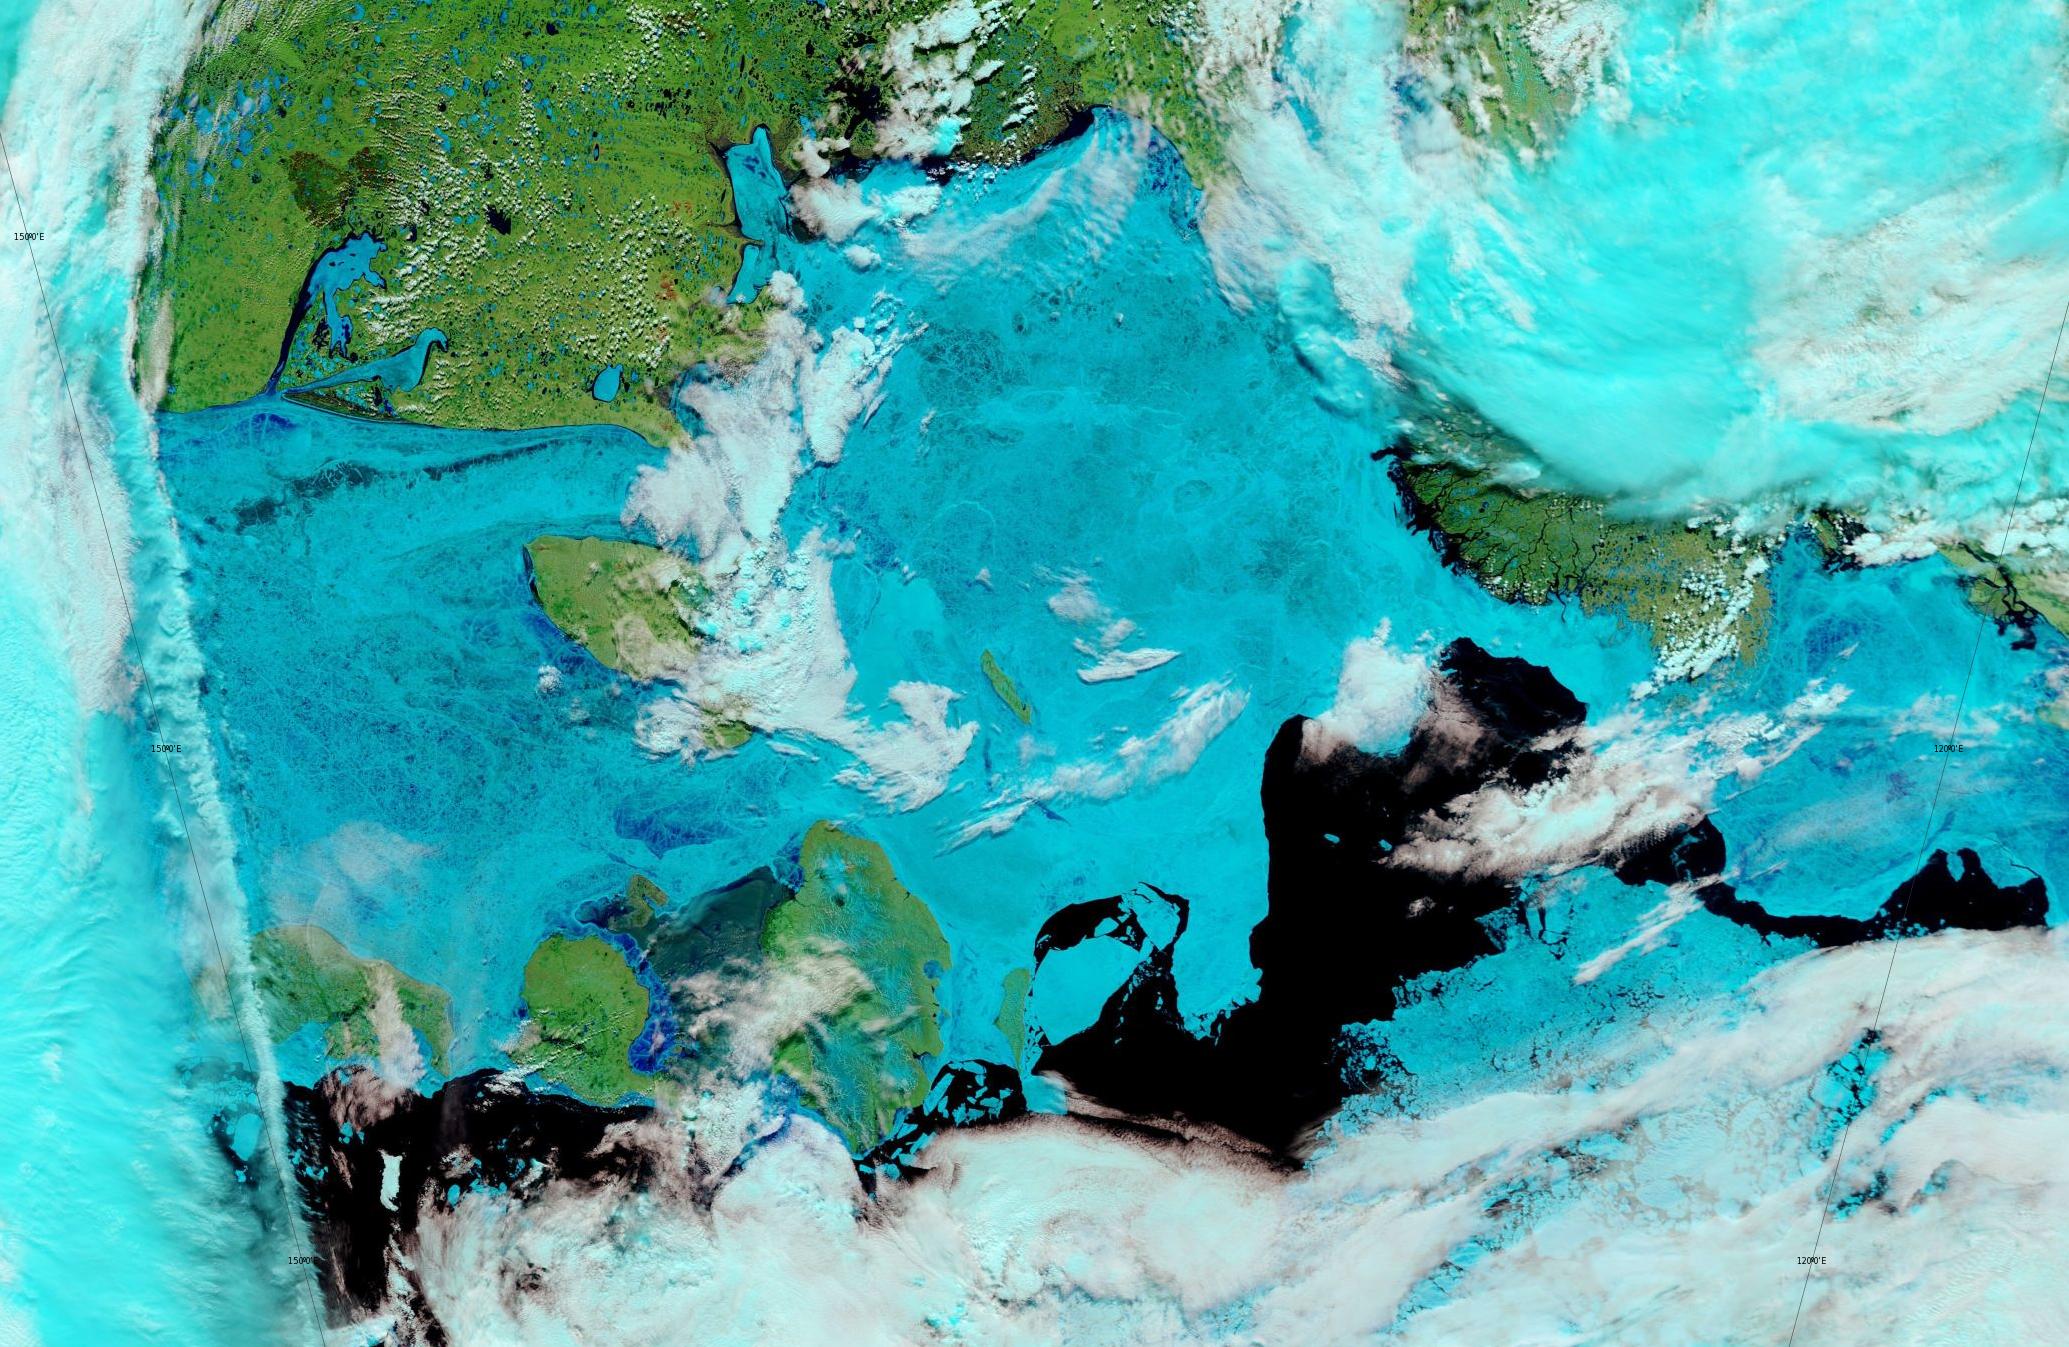
Let’s begin the month with a “true colour” image from the Terra satellite of the Laptev Sea and thereabouts:

The blueish tinge indicates the appearance of melt ponds almost everywhere over the land-fast ice currently covering the majority of the Laptev Sea.

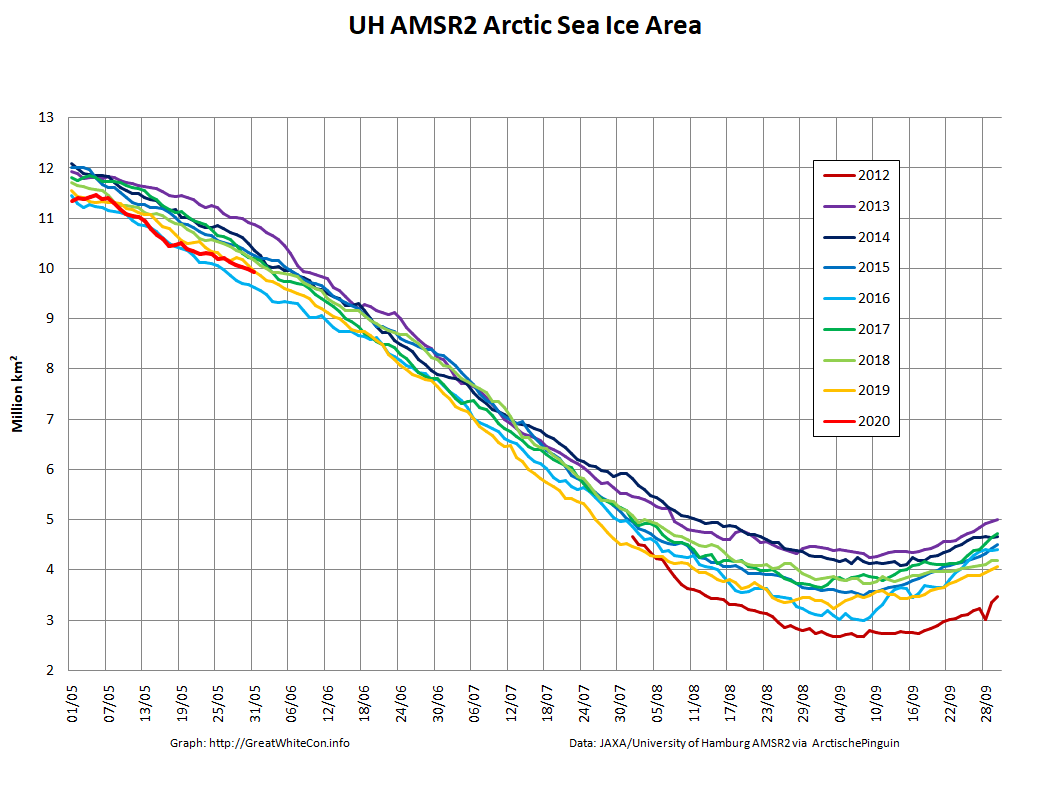
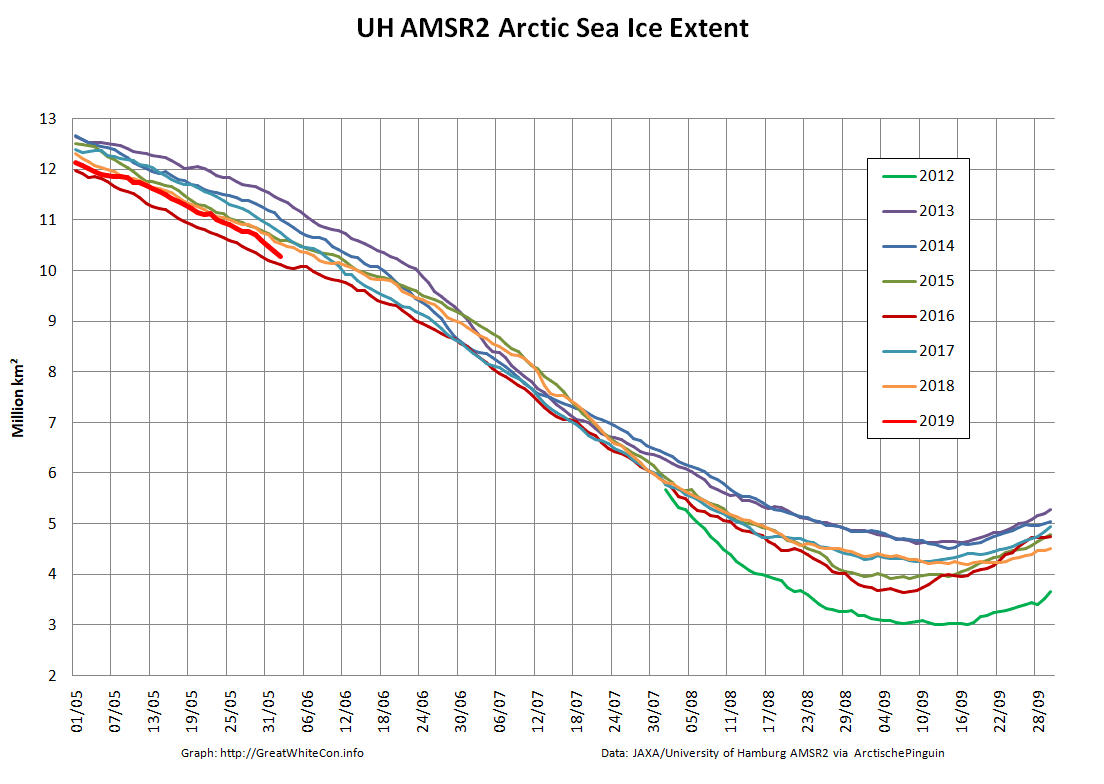
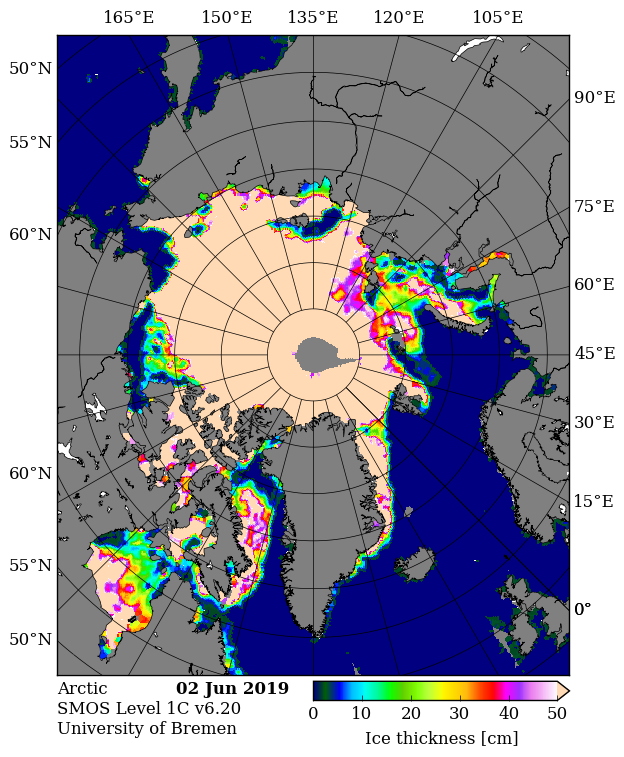
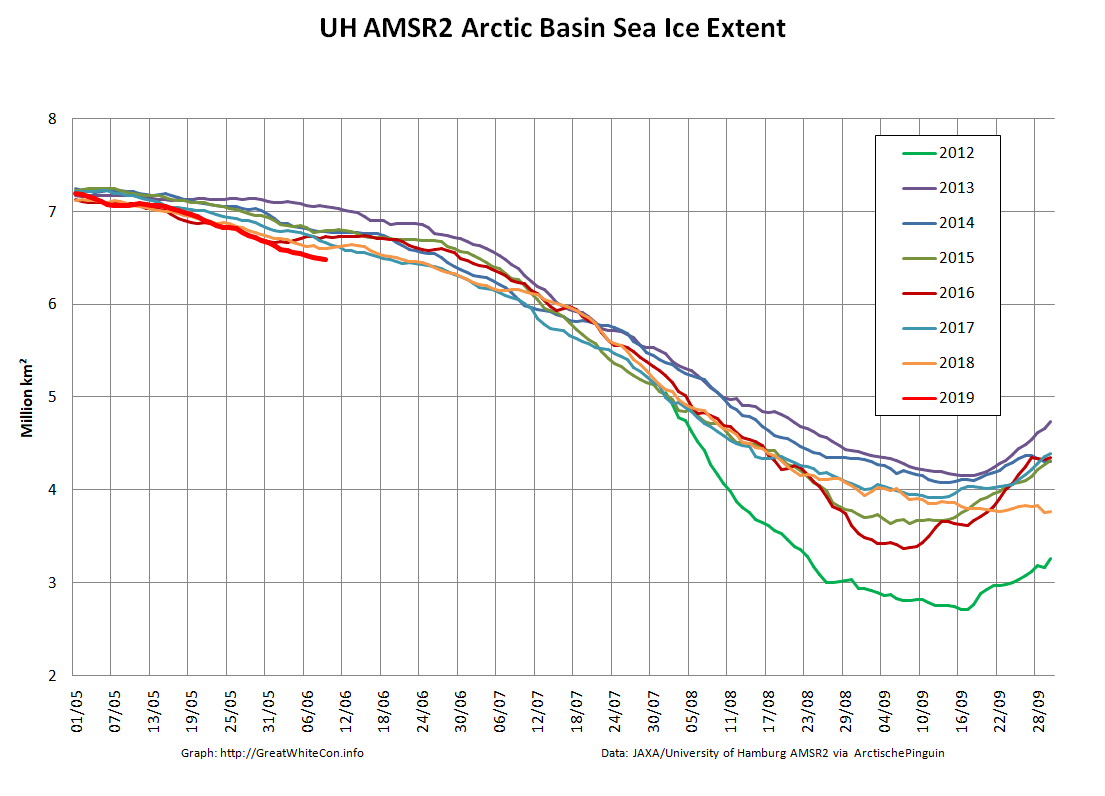
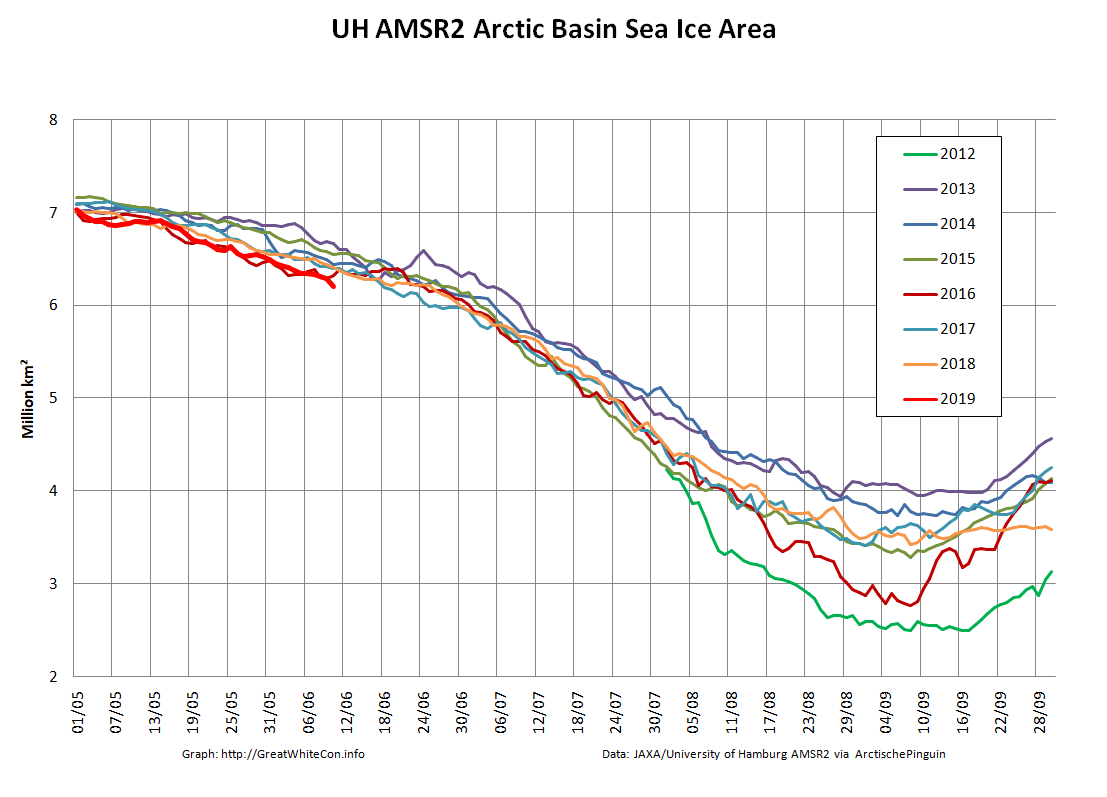
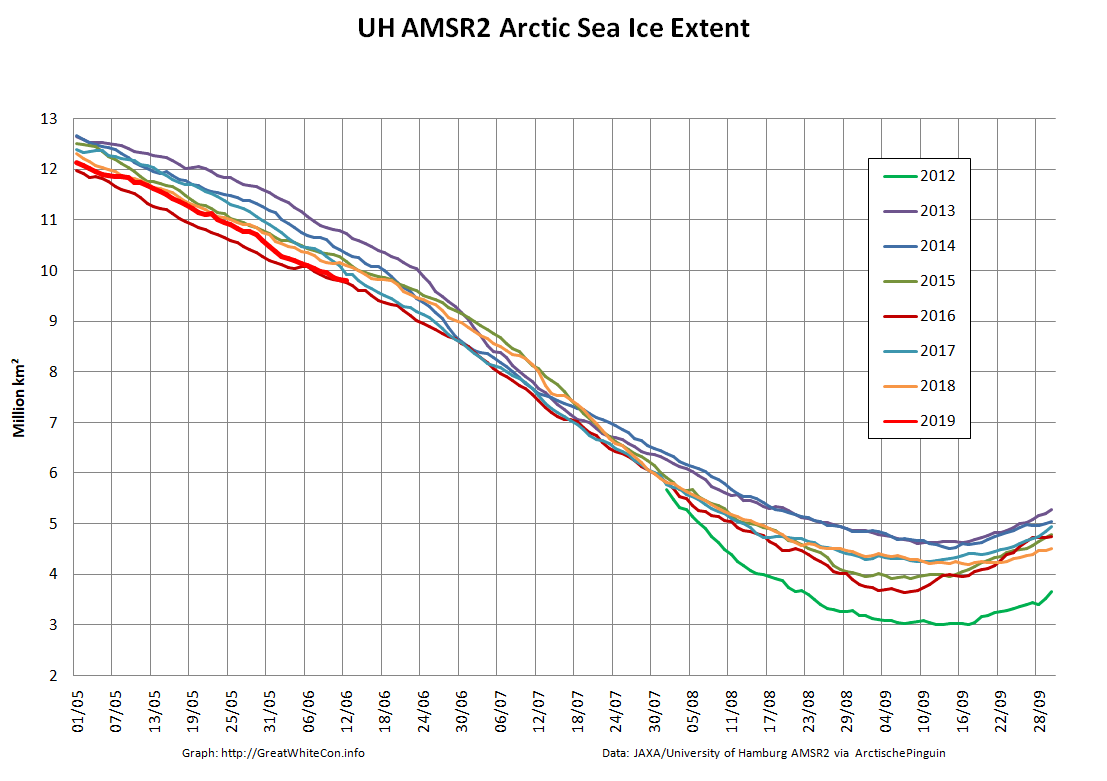
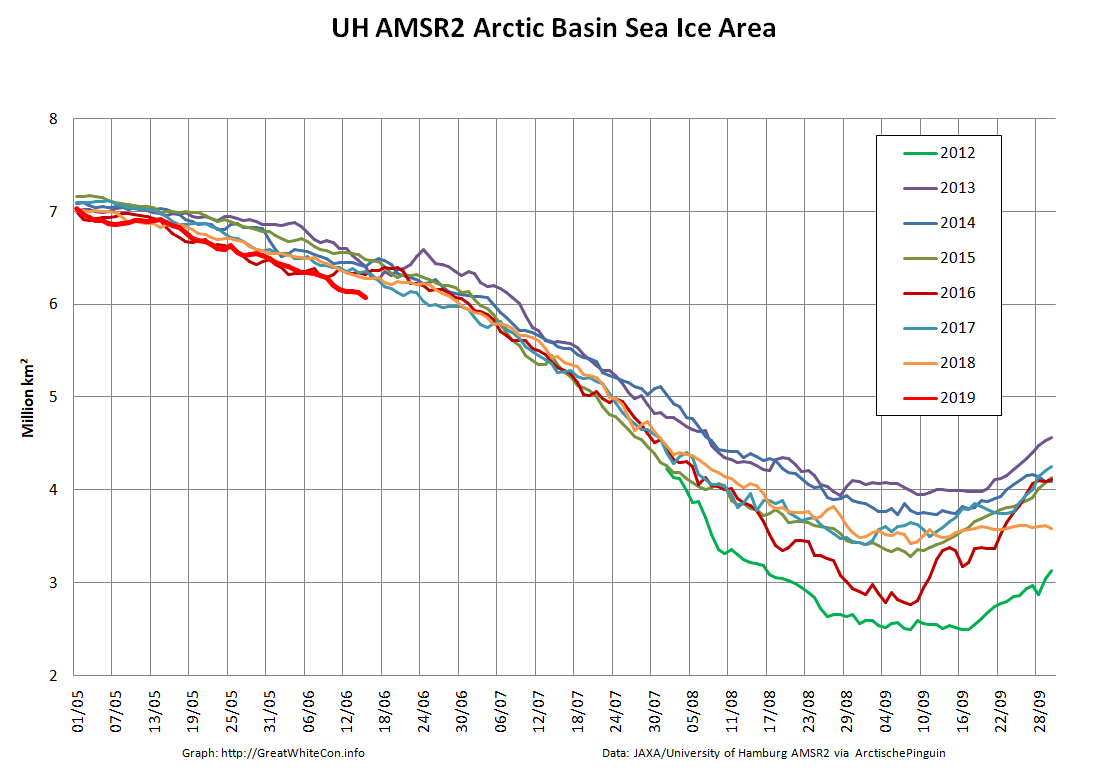
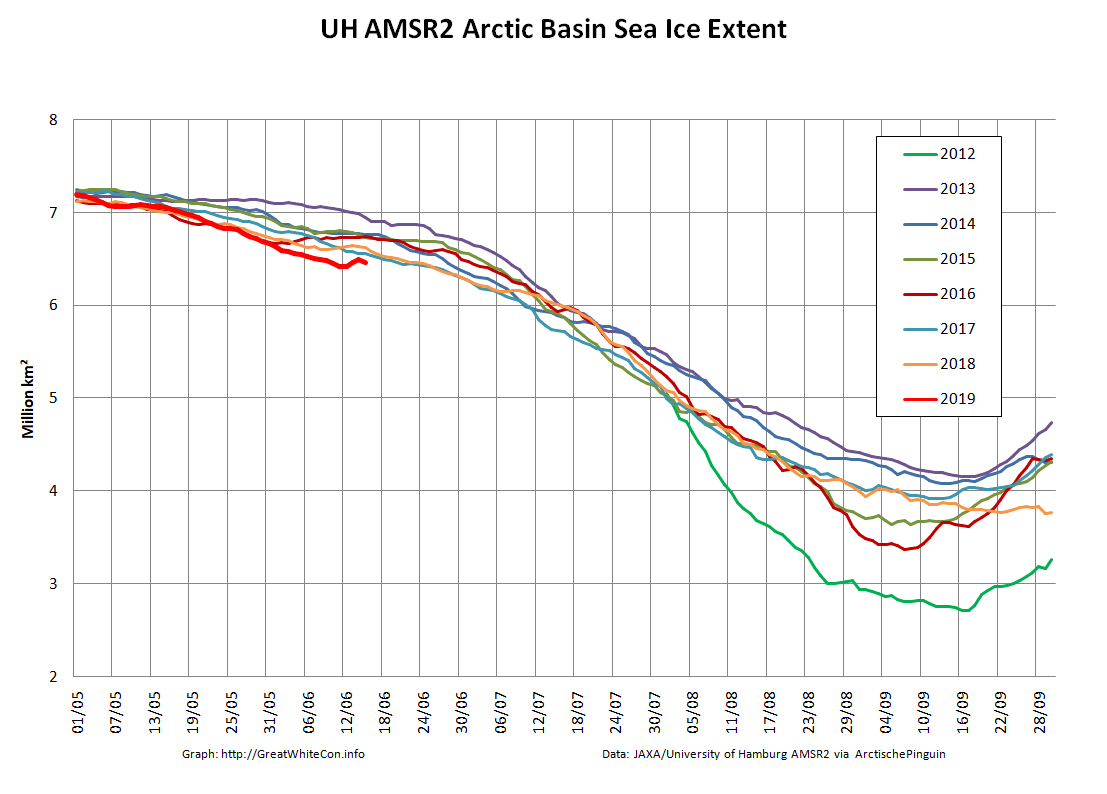
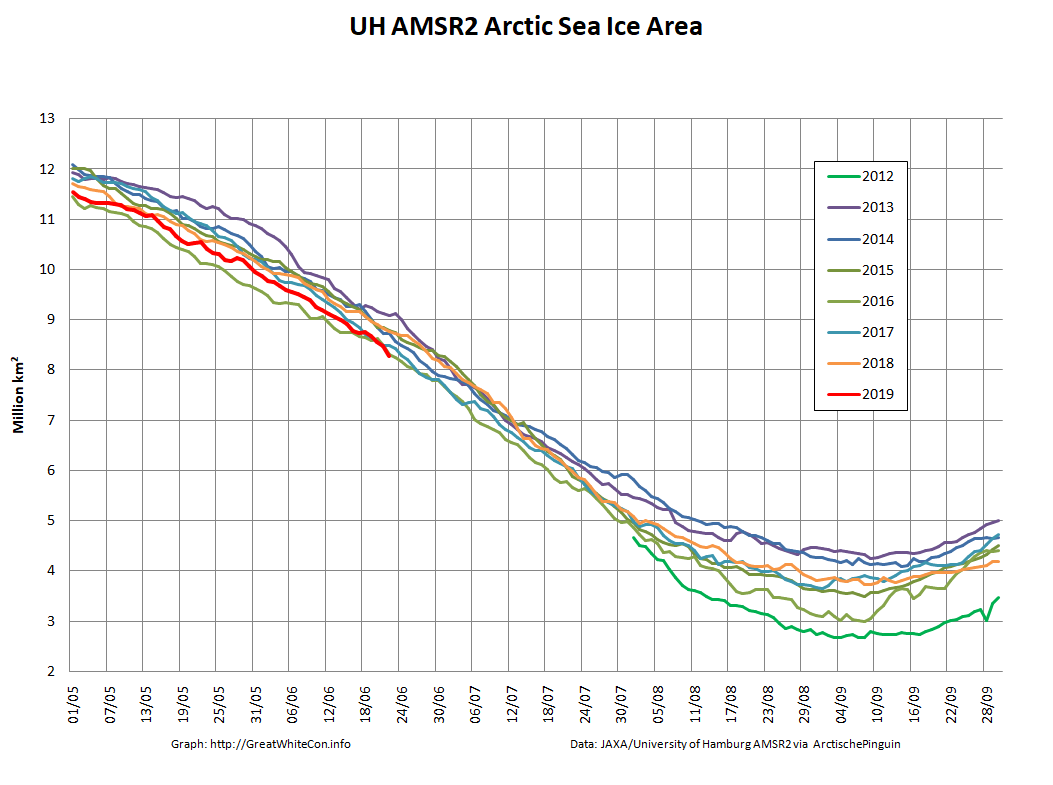
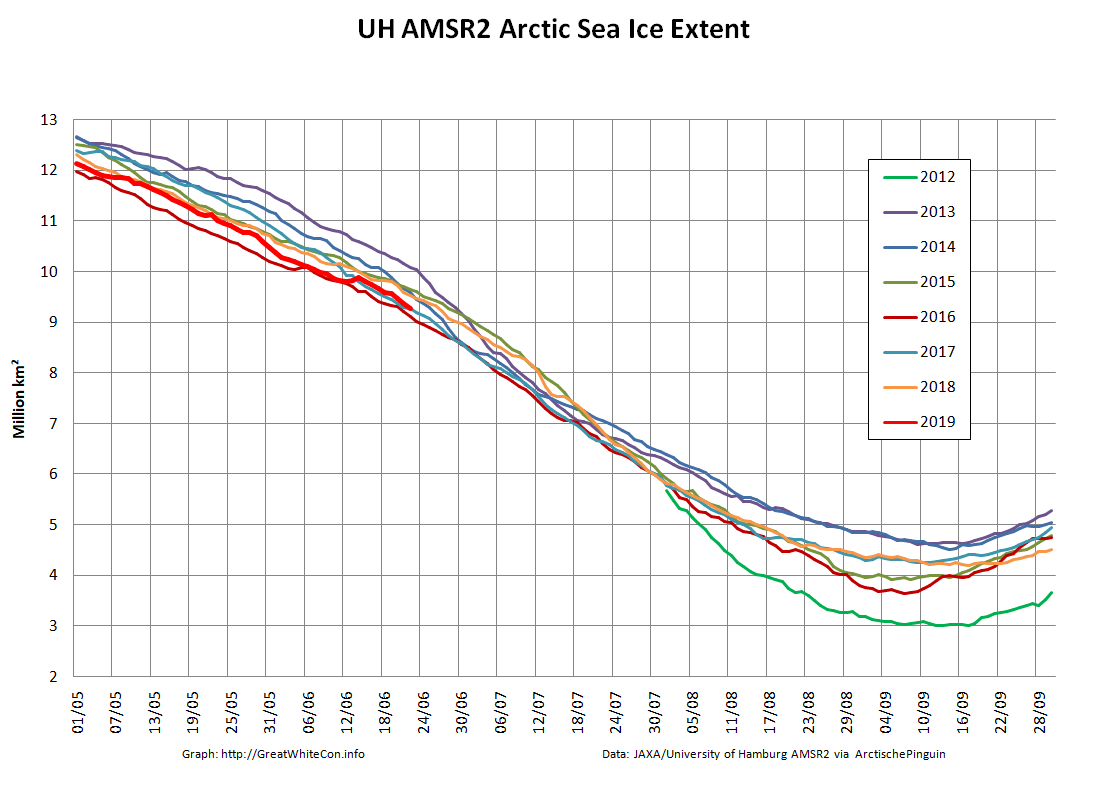
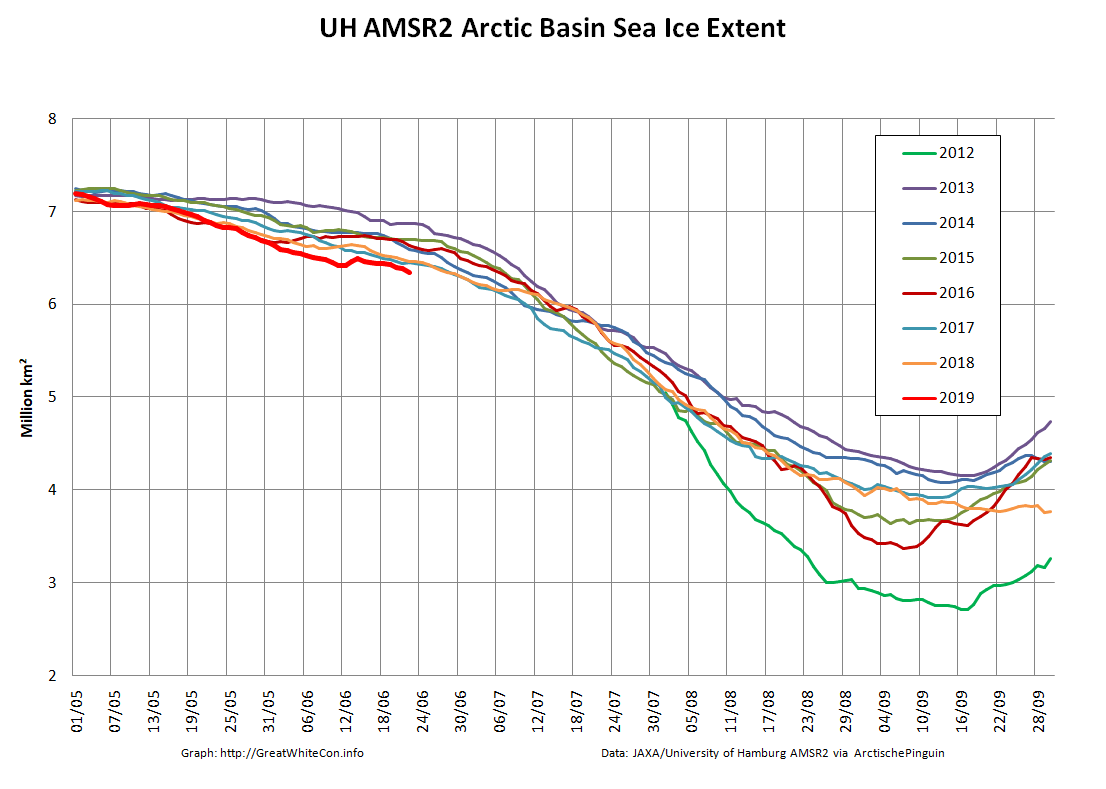
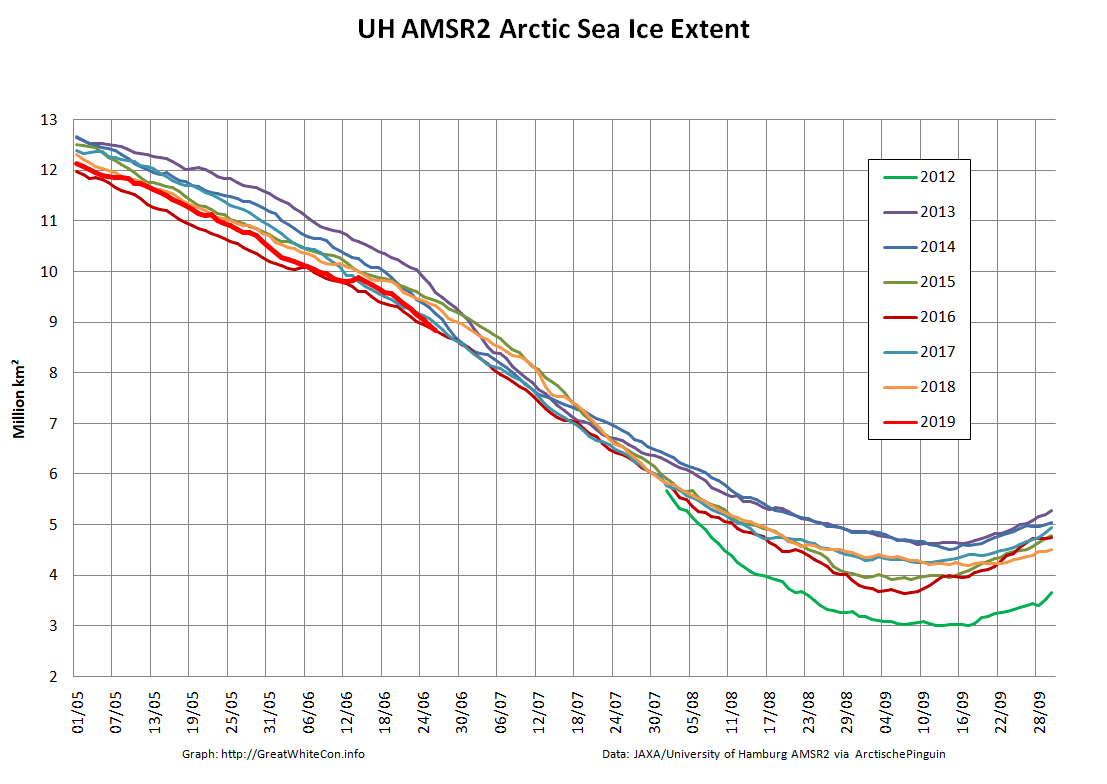
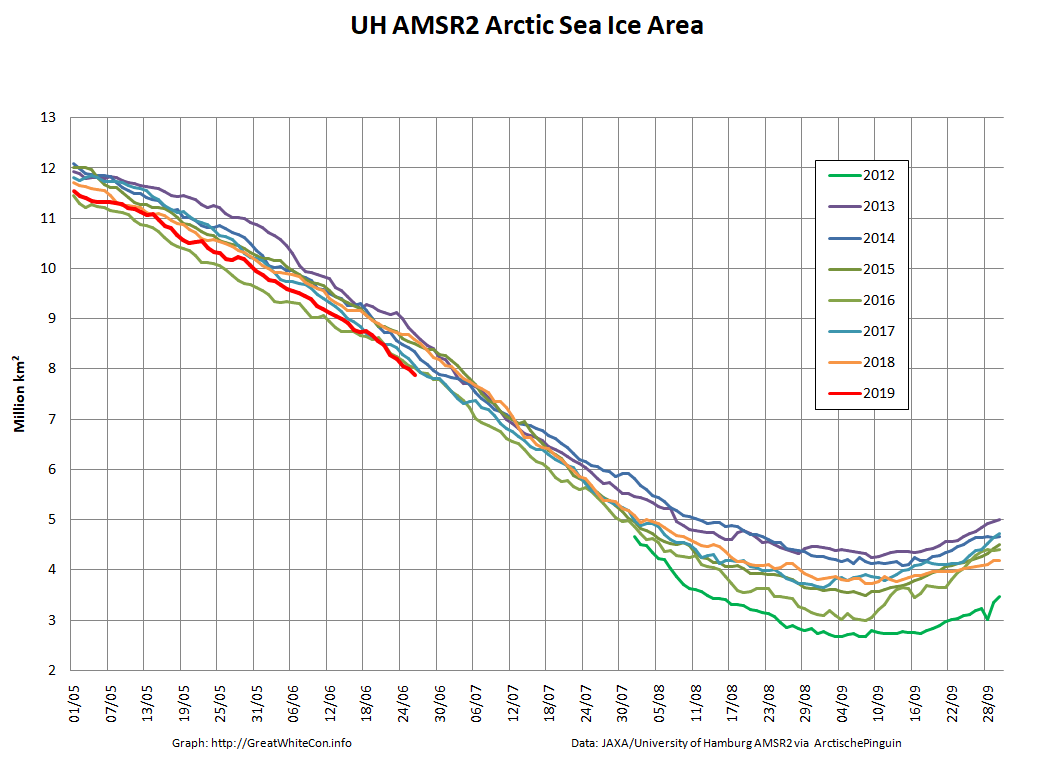
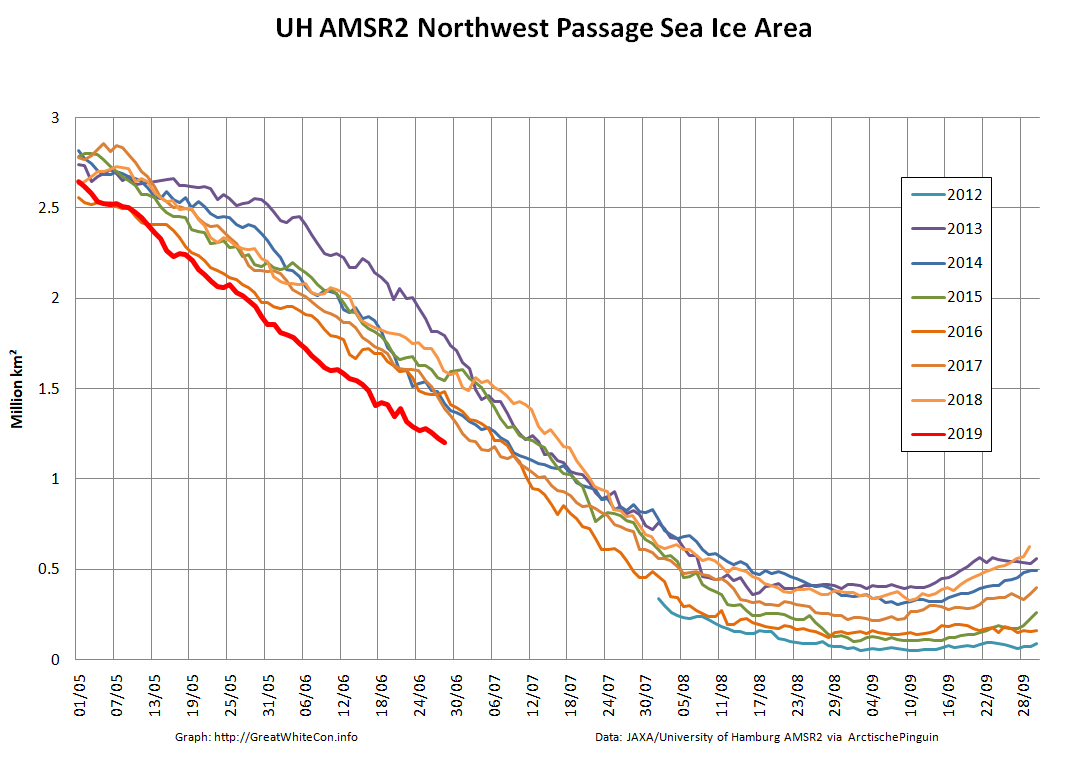
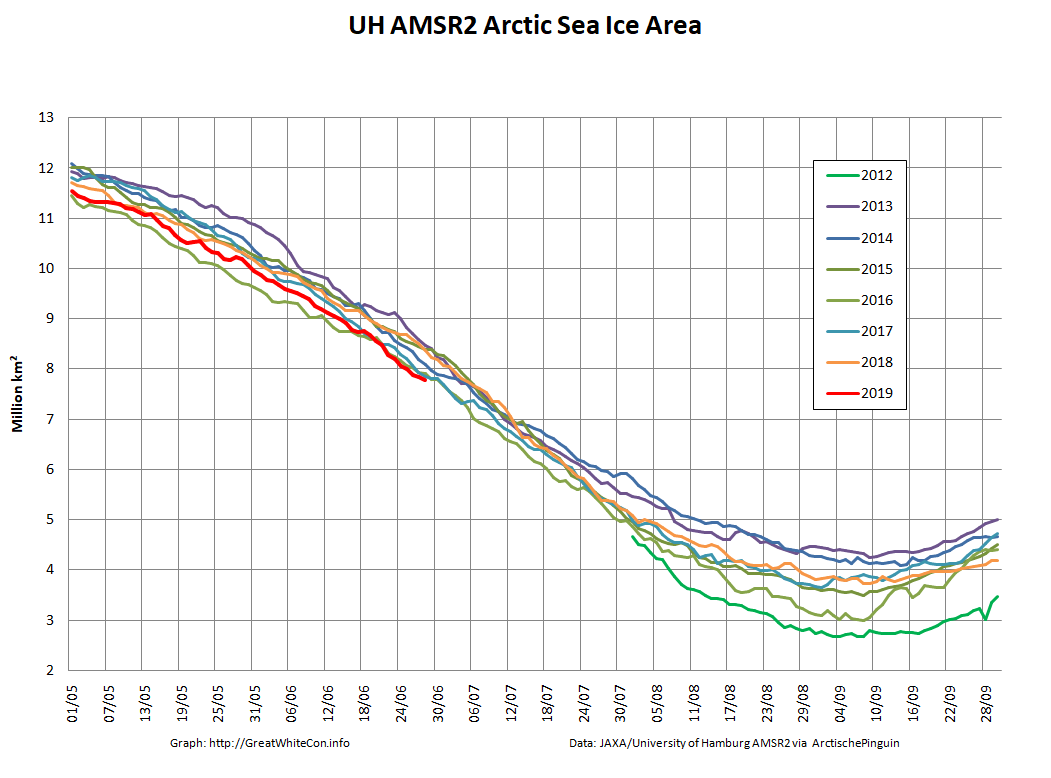
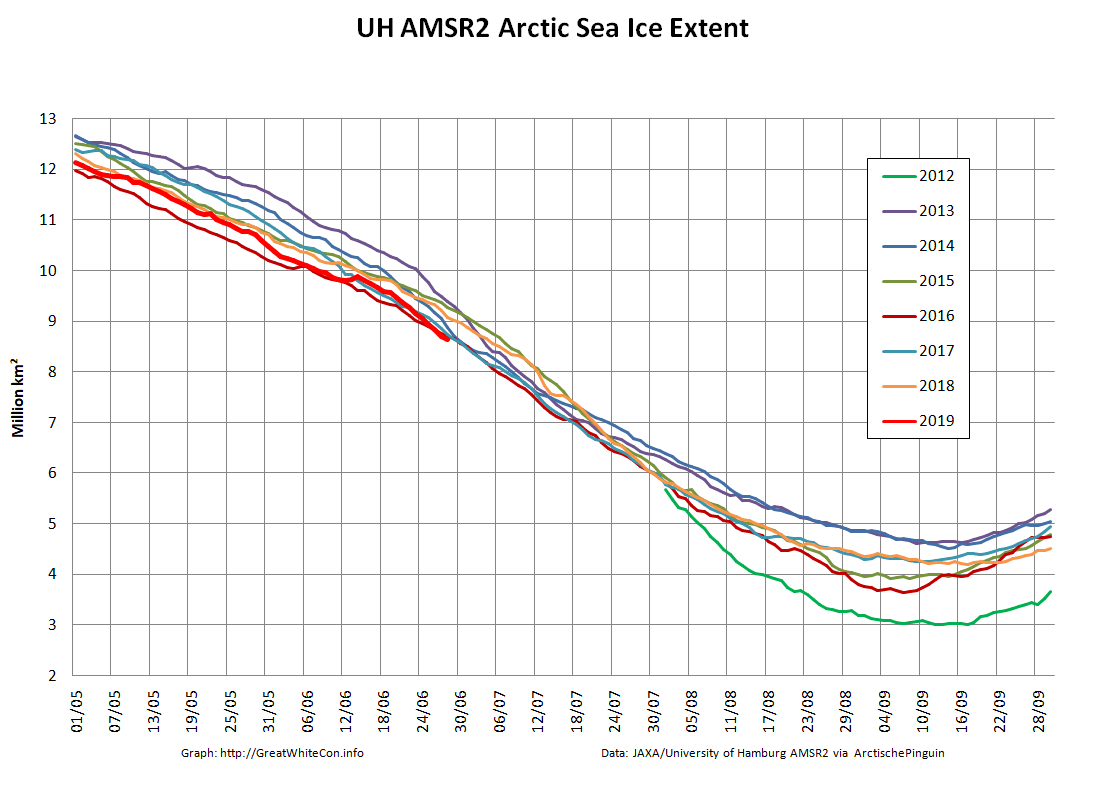
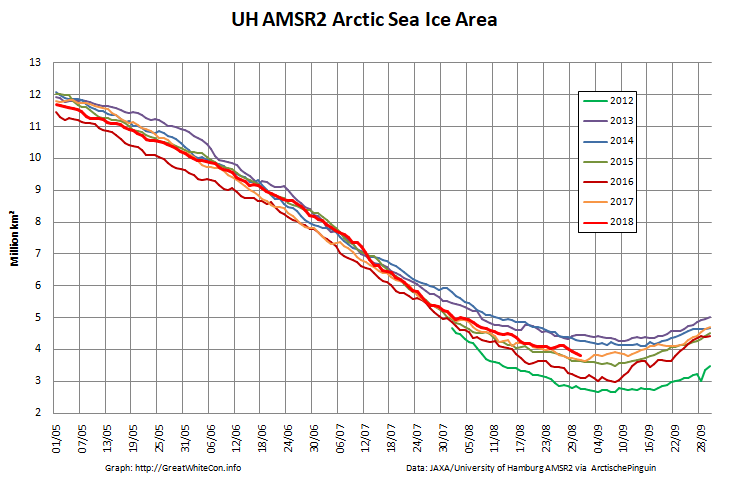
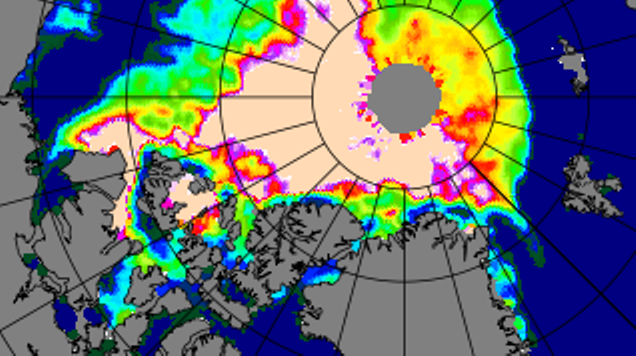
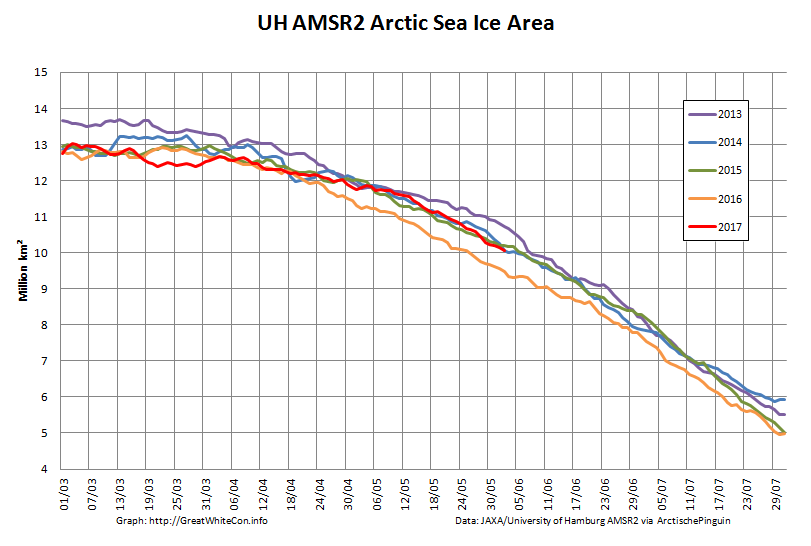
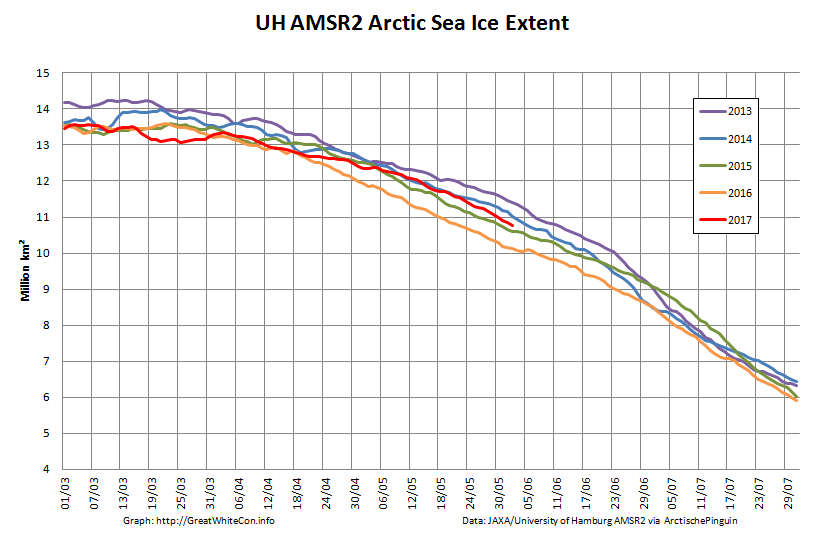
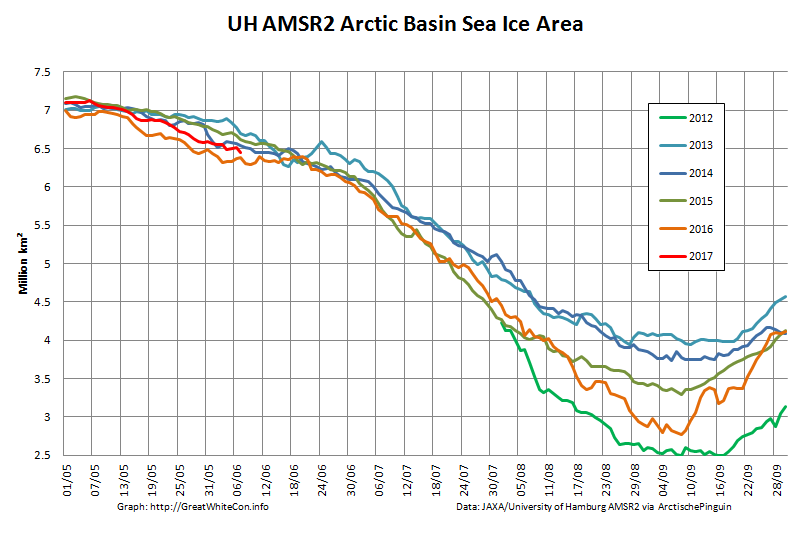
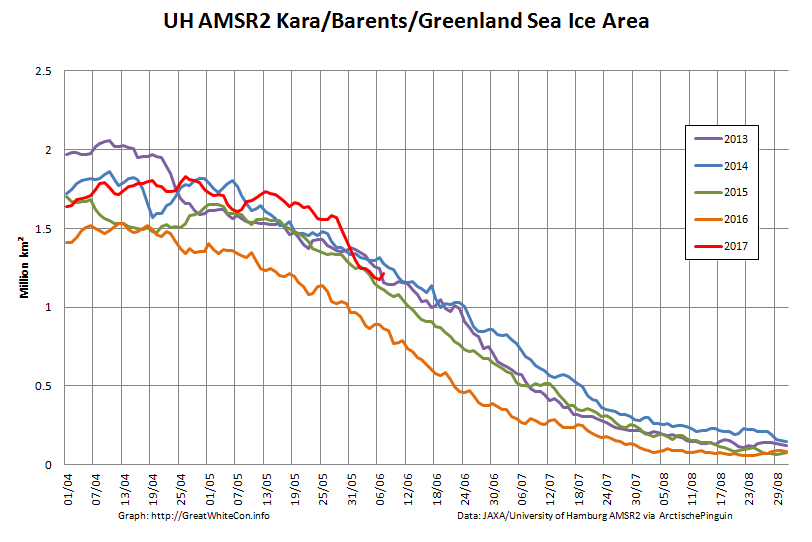
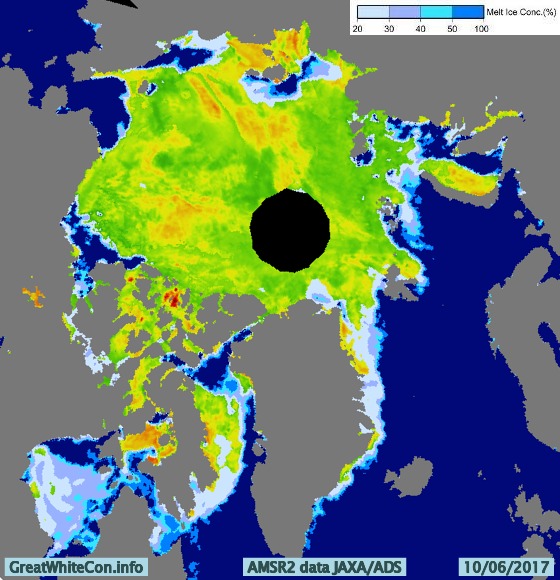
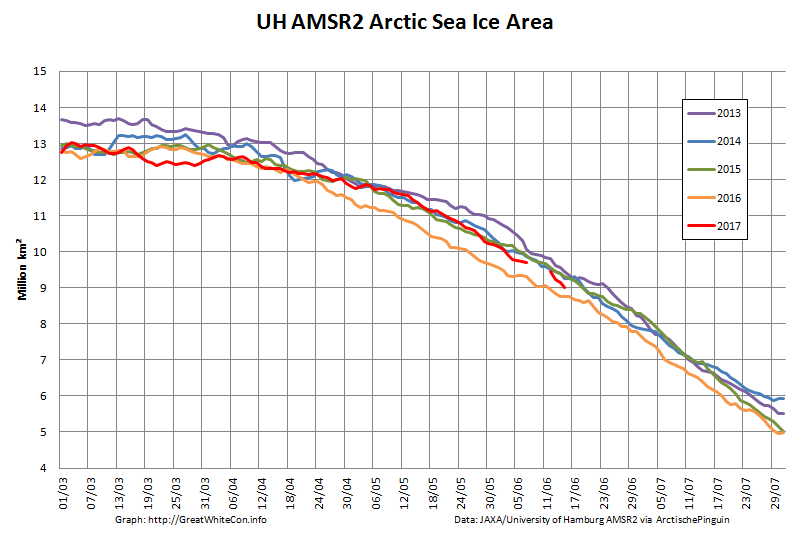
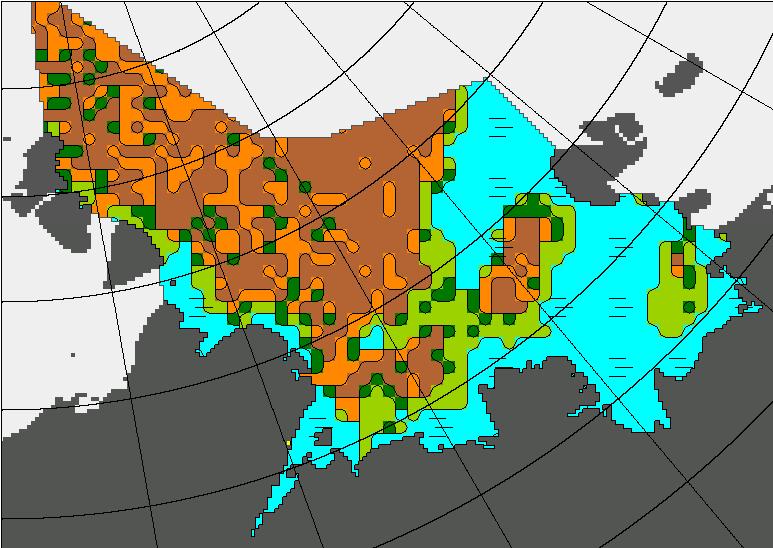
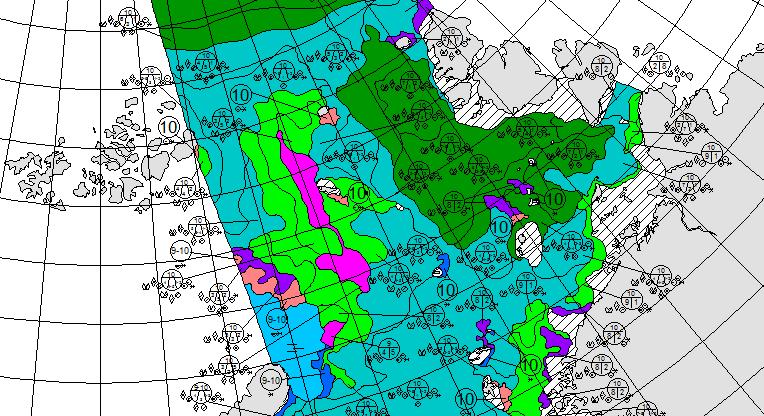
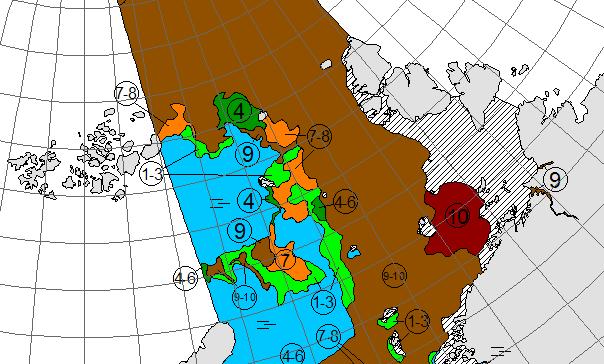
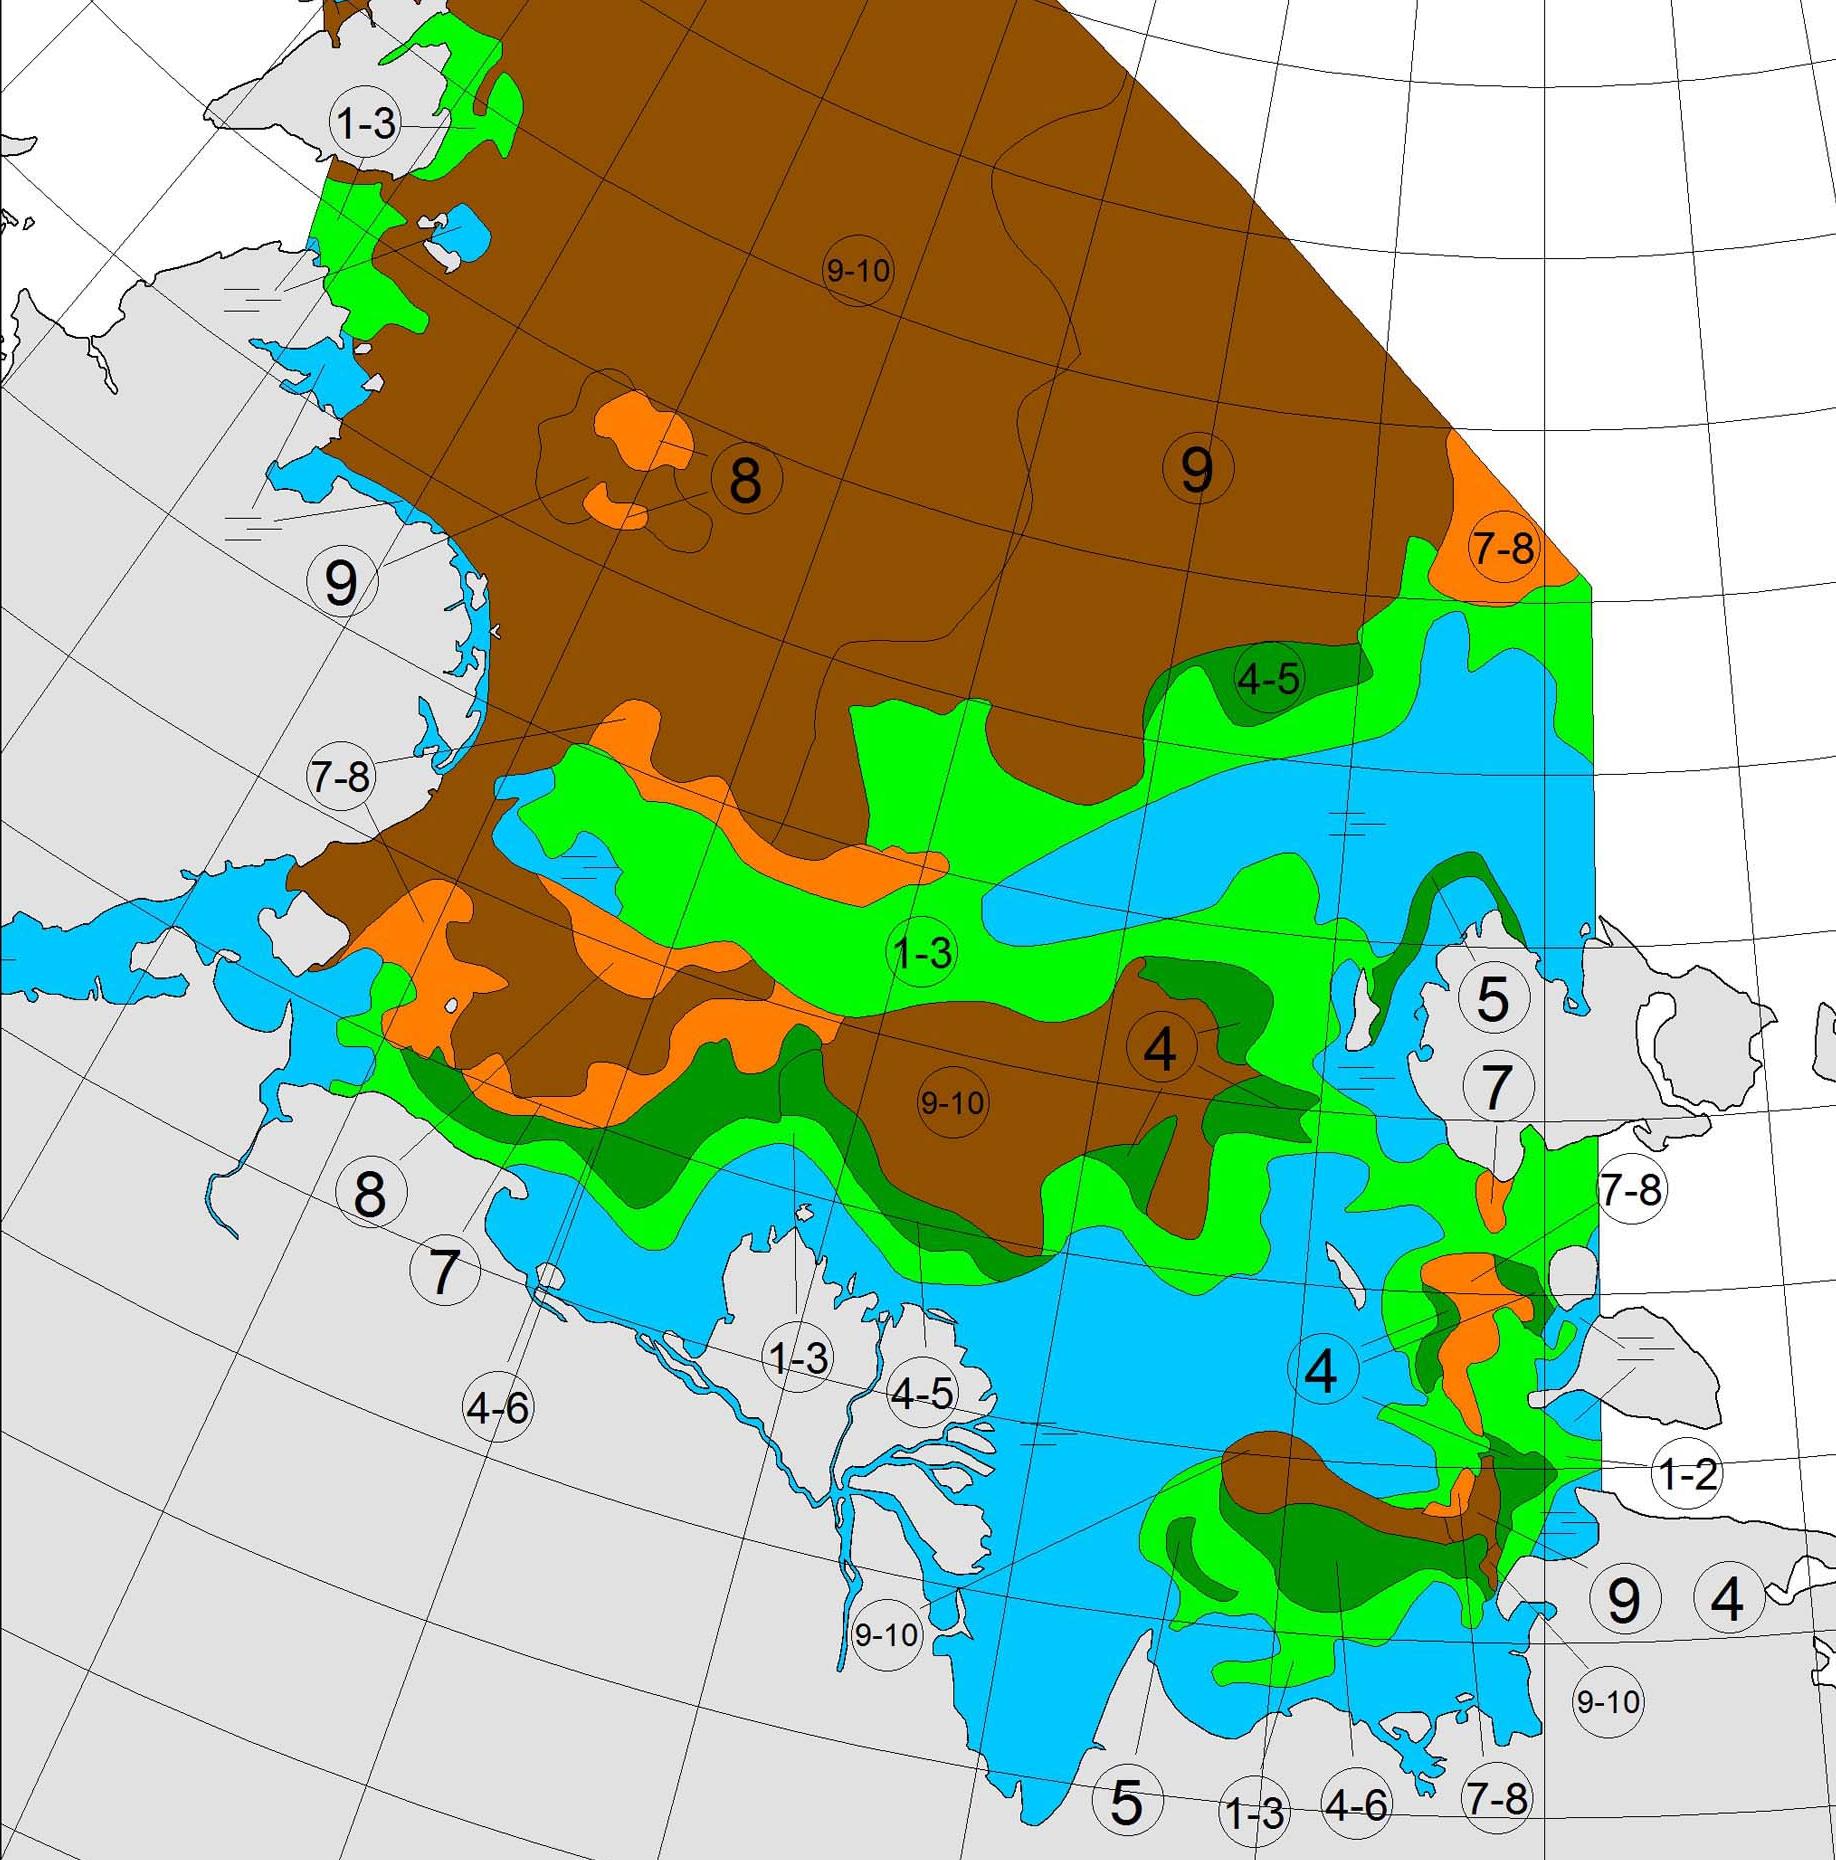
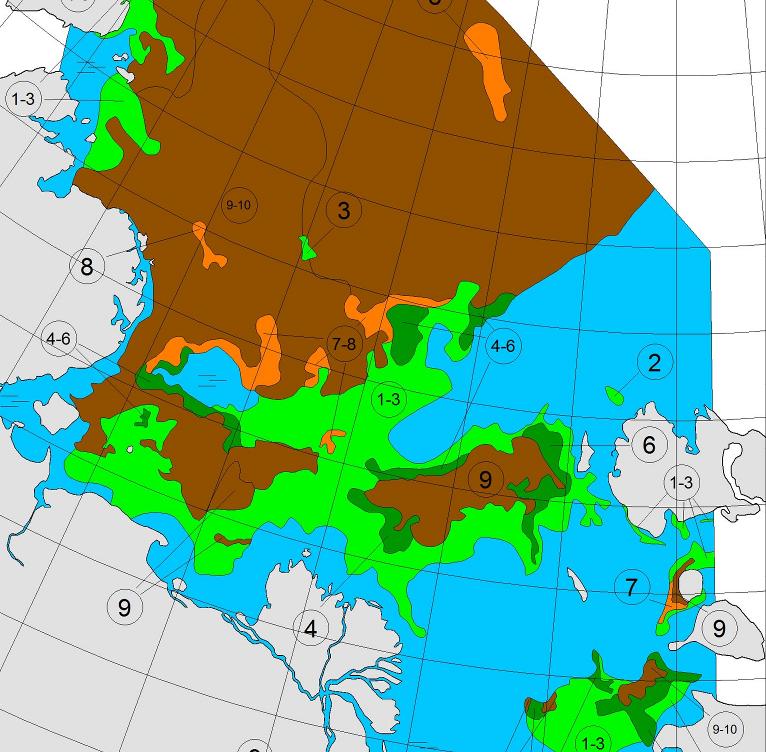
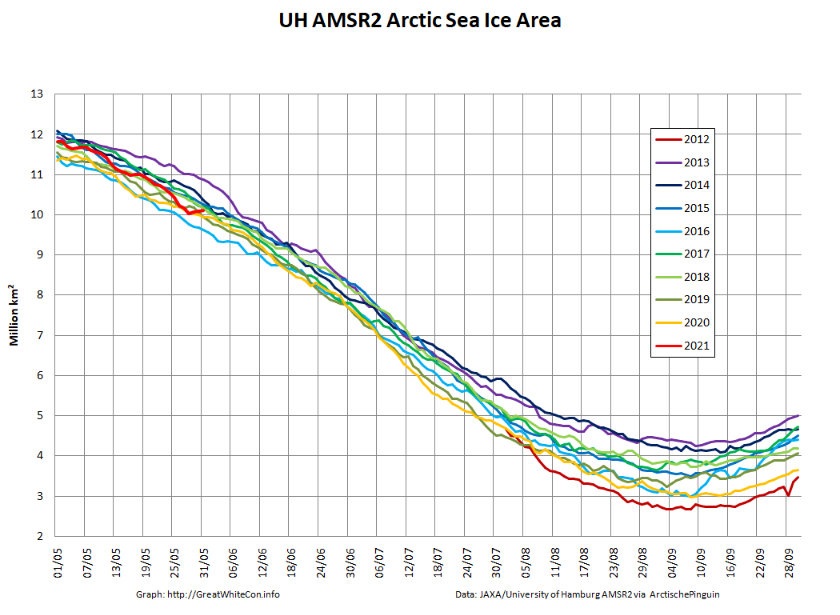
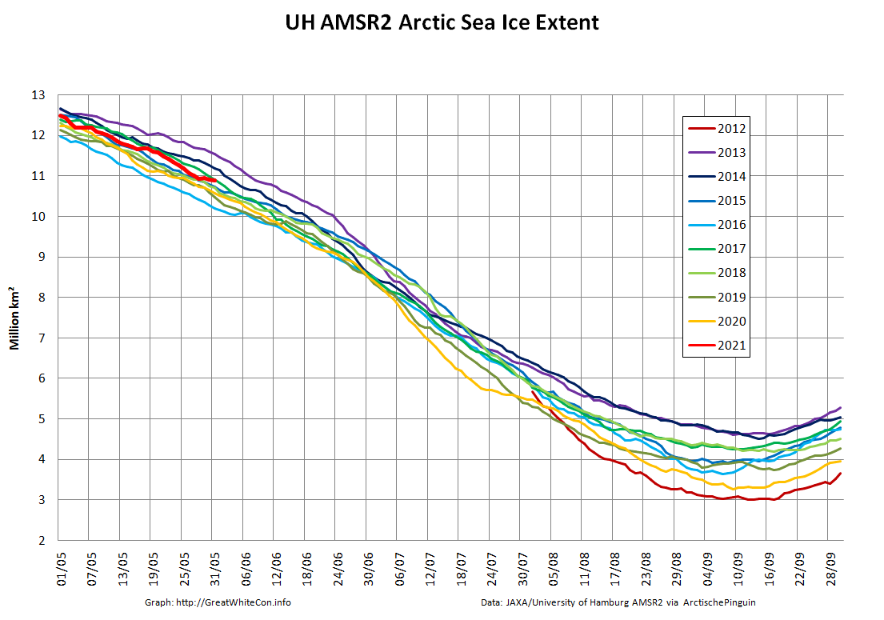
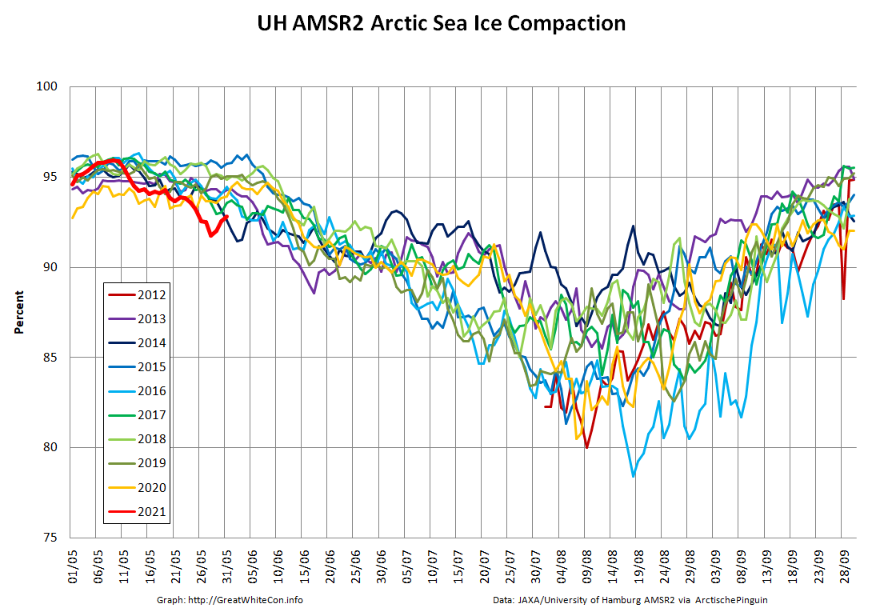
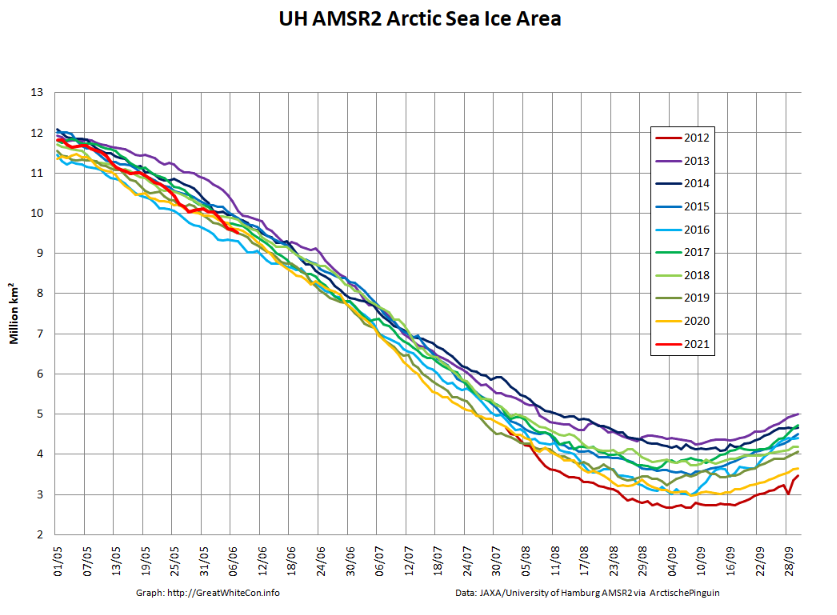
Let’s also take a look at the high resolution AMSR2 metrics for the end of May 2021:

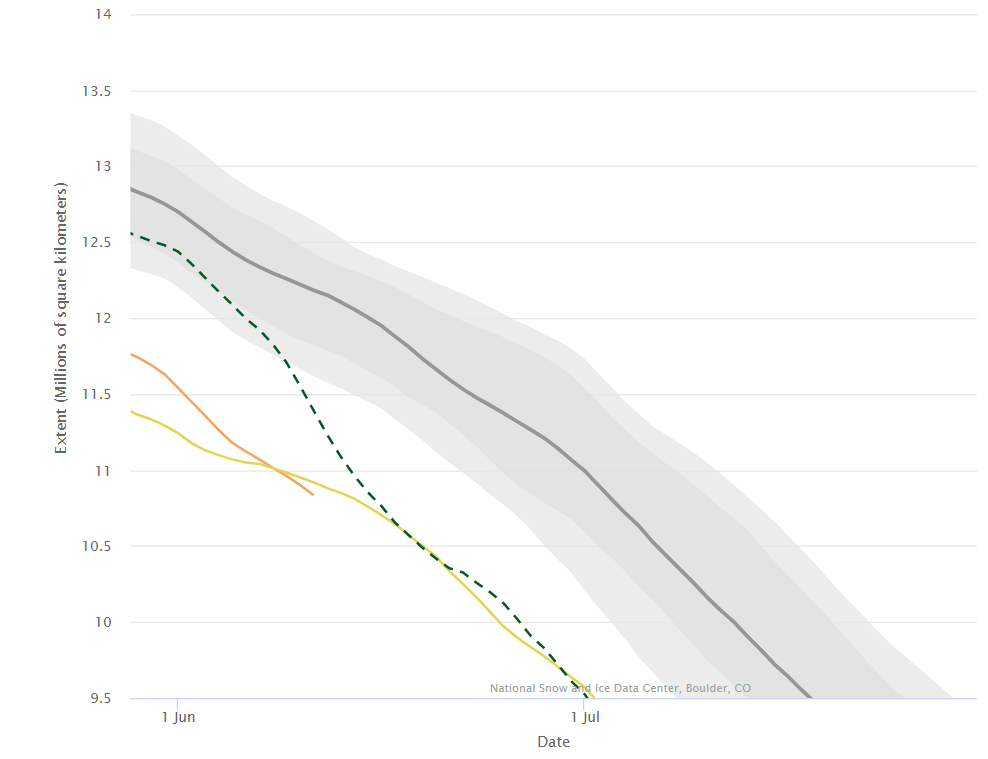
Thanks to the recent “brief hiatus” in areal decline, Arctic wide compaction is no longer in record territory:

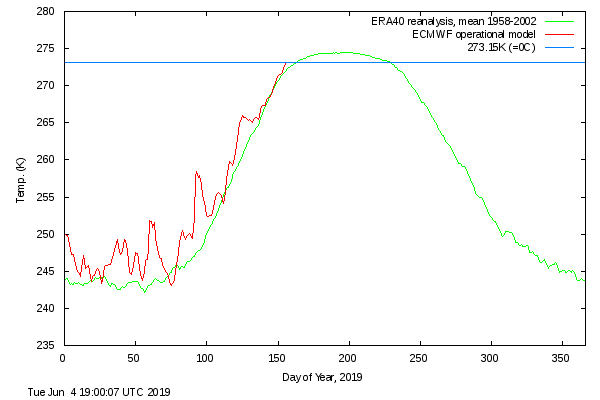
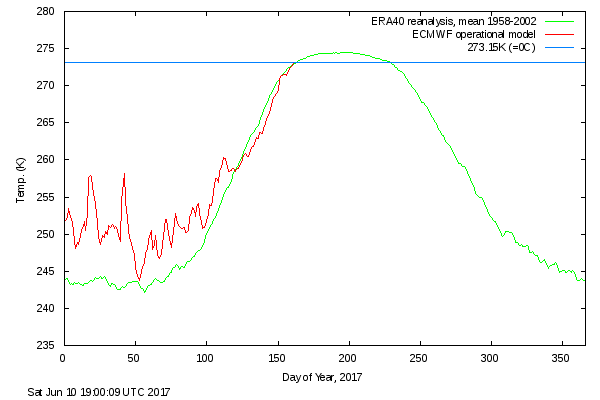
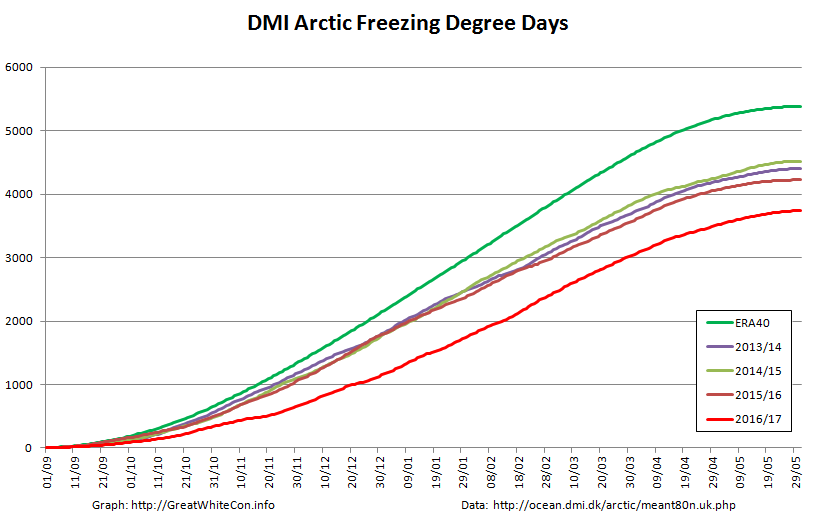
Finally, for the moment at least, here is the Danish Meteorological Institute’s high Arctic temperature data in the form of a graph of freezing degree days:

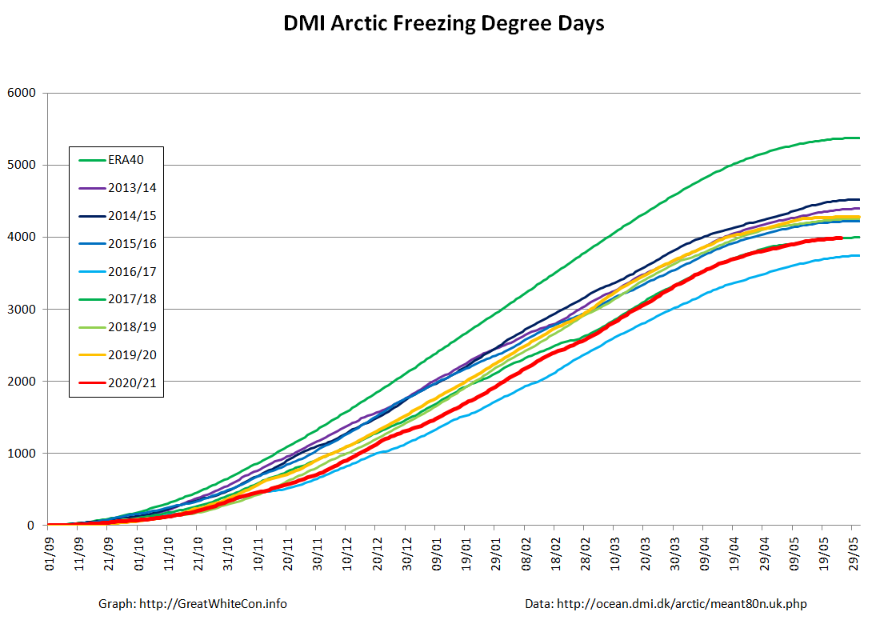
For some reason the data file still doesn’t include data to the end of May, but things won’t change much by then. Over the winter as a whole only 2016/17 was significantly warmer.

Let the 2021 Arctic sea ice summer melting season officially begin!
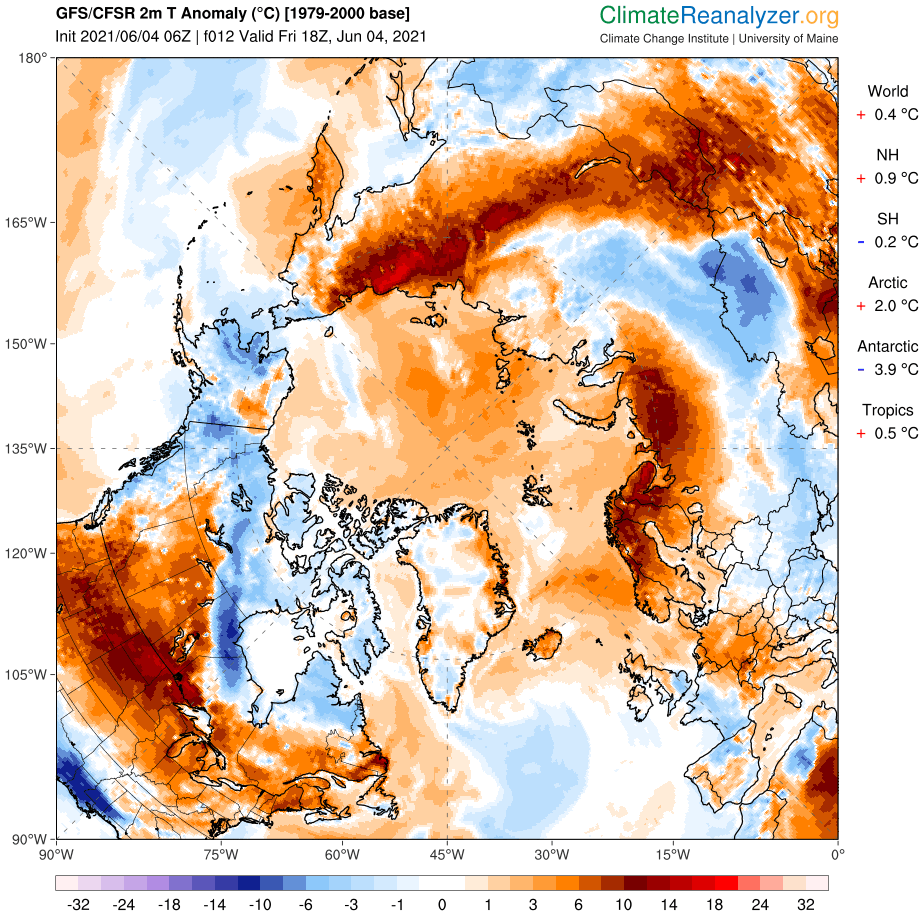
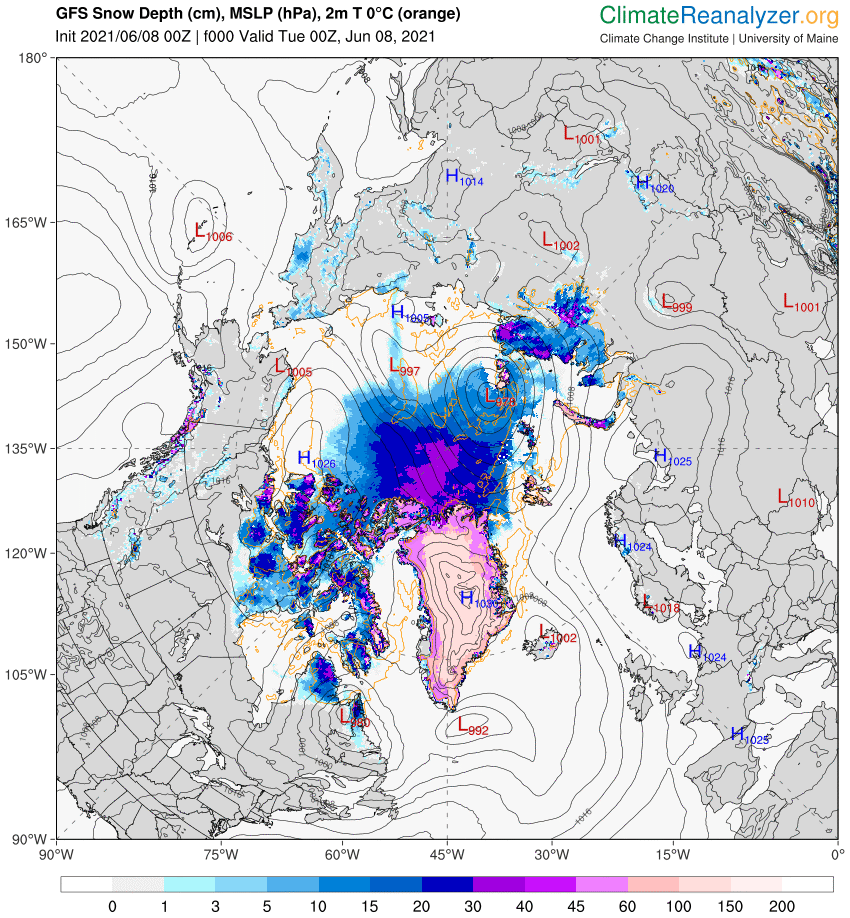
[Edit – June 4th]

Perhaps unsurprisingly the GFS forecast from four days ago hasn’t quite worked out as predicted. The Arctic as a whole is certainly on the warm side, with a +2 C anomaly at this moment:

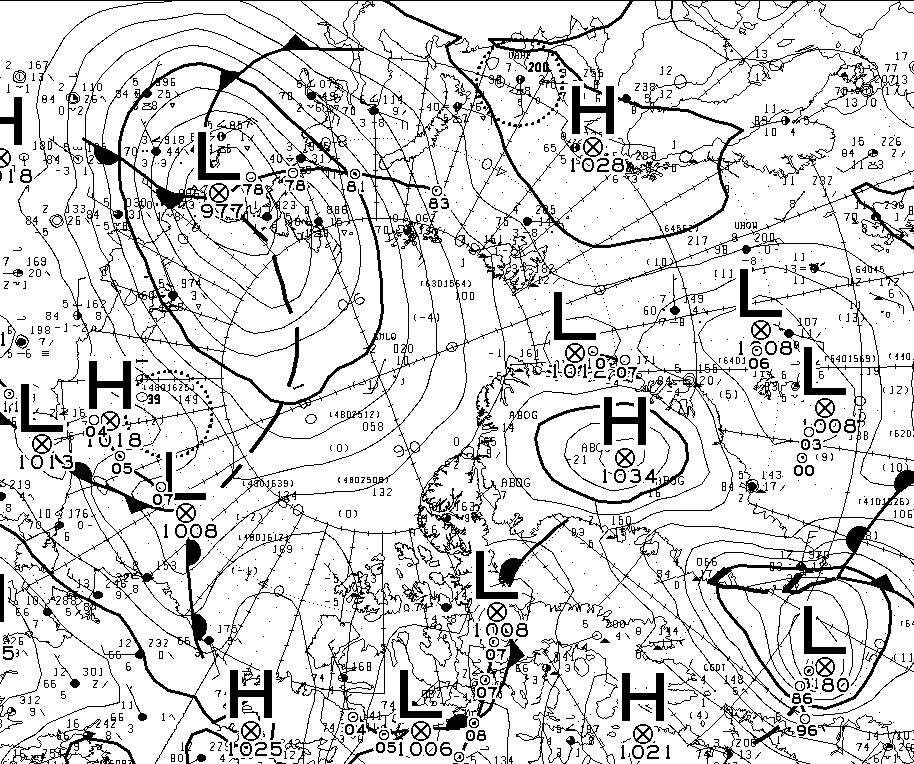
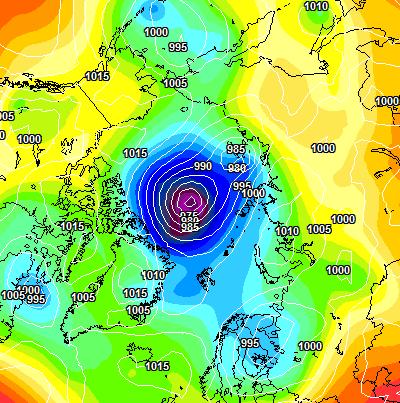
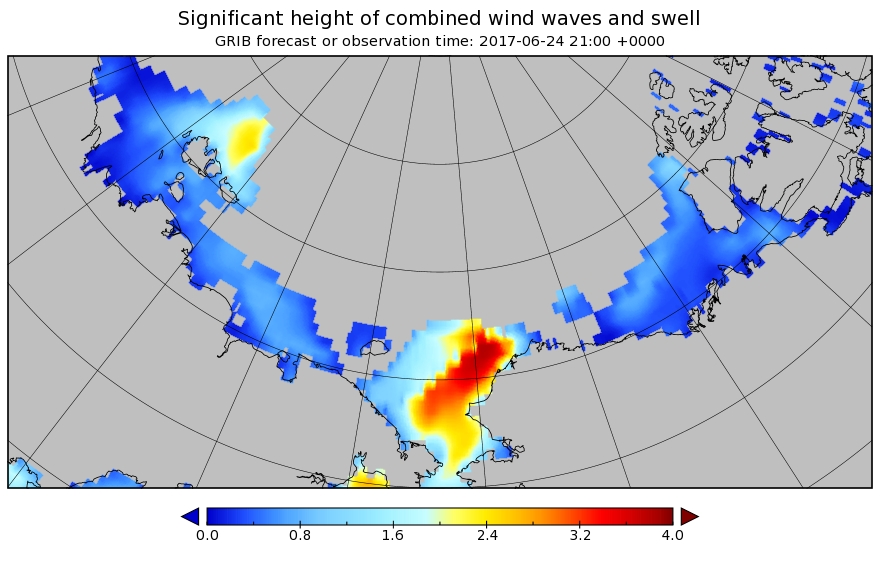
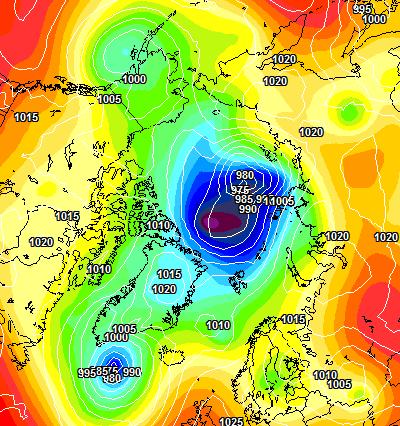
However the 966 hPa MSLP cyclone predicted for Monday is now forecast to be a mere 978 hPa:

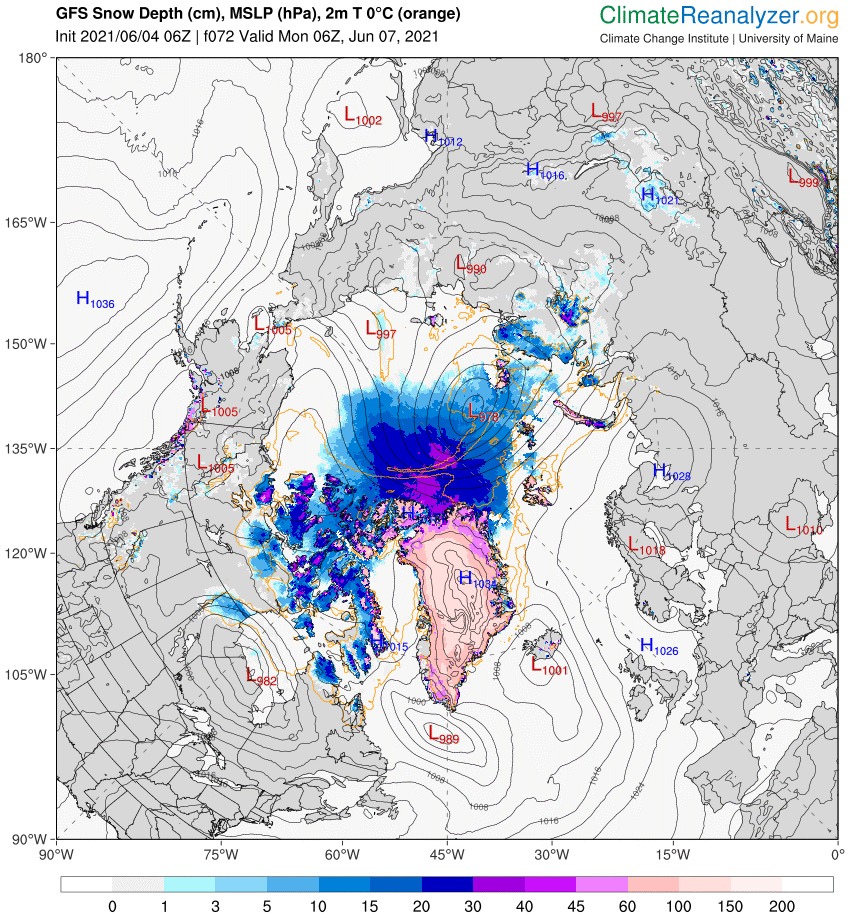
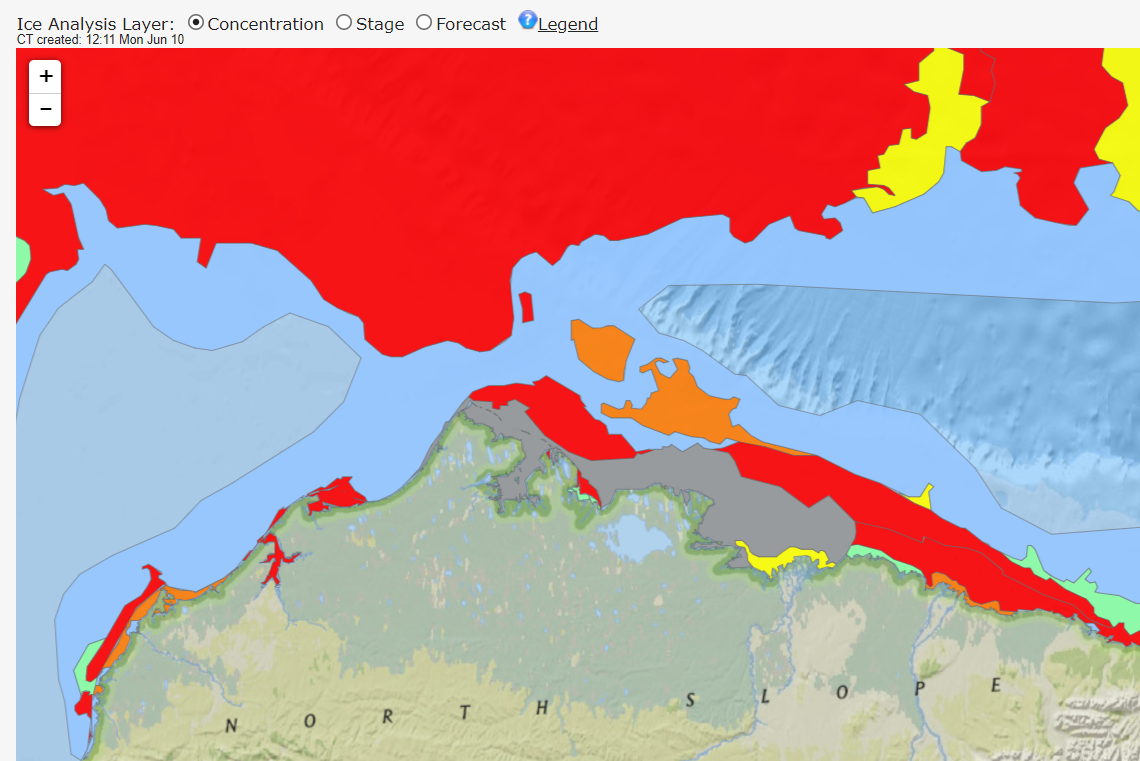
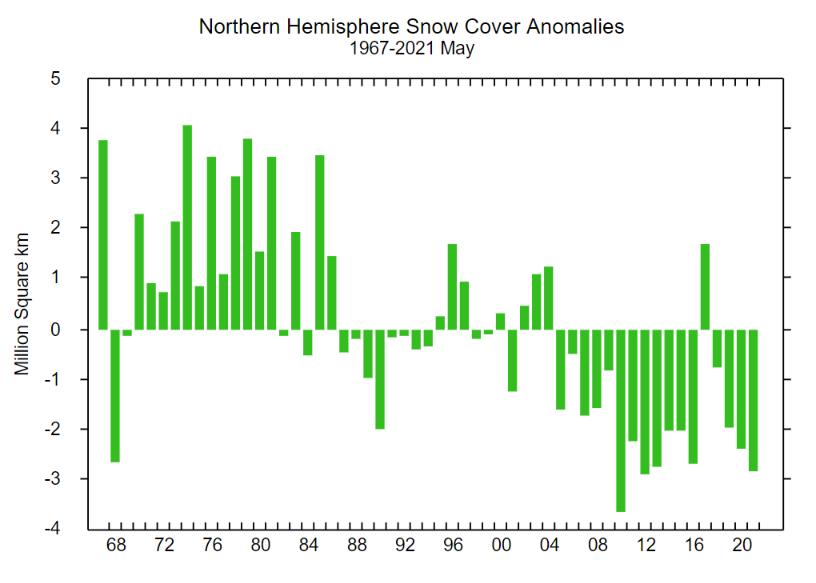
With 3 days to go there is a reasonable chance of it verifying in the “New Arctic” of 2021. As you can see from the map above a large area of the Central Arctic has now lost its snow cover. This is confirmed by the Rutgers Snow Lab northern hemisphere data for May:

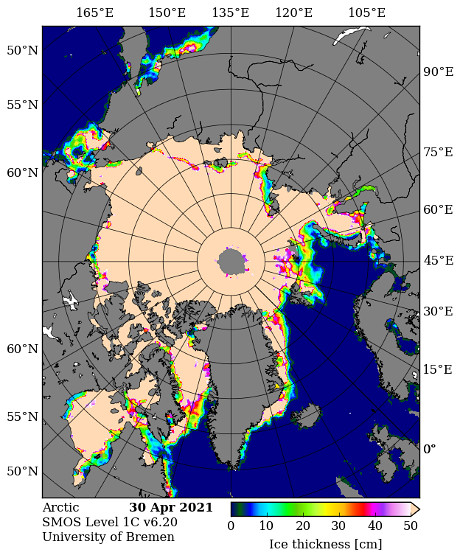
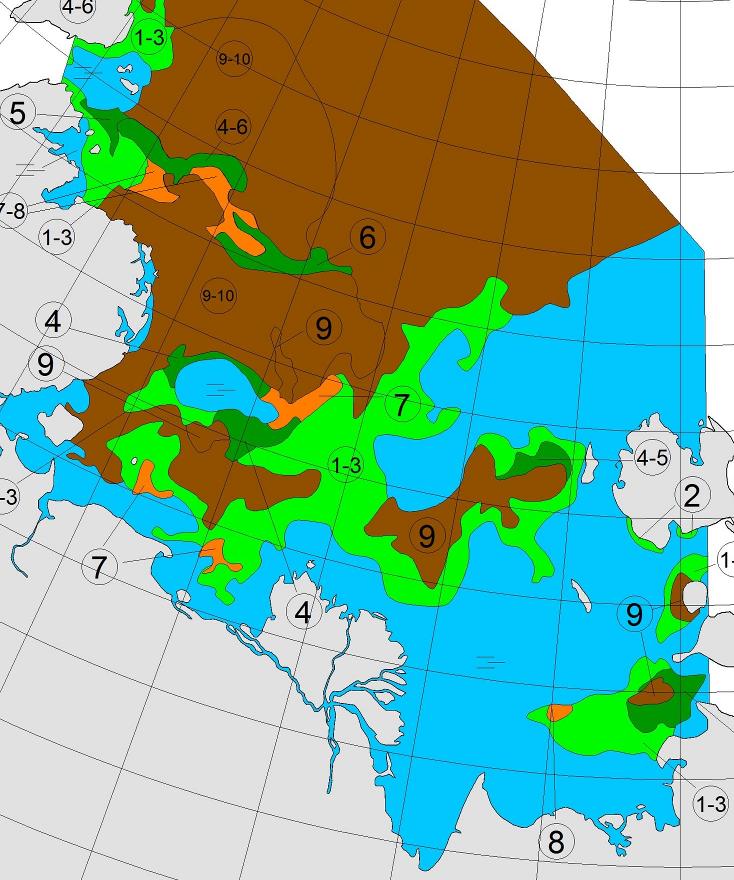
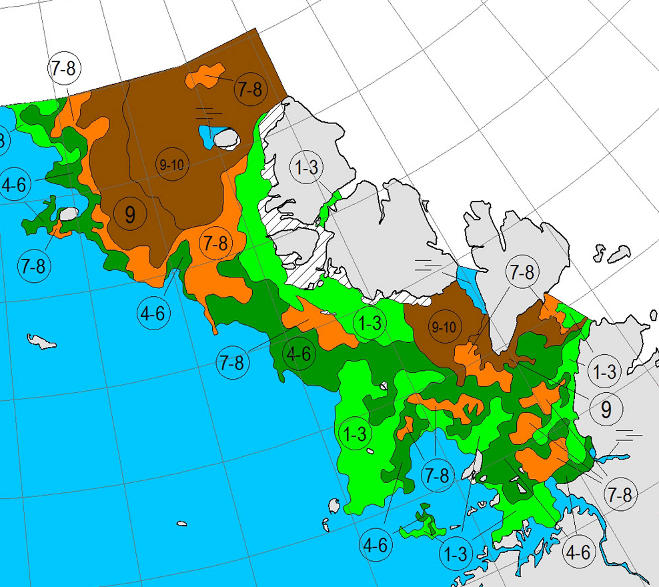
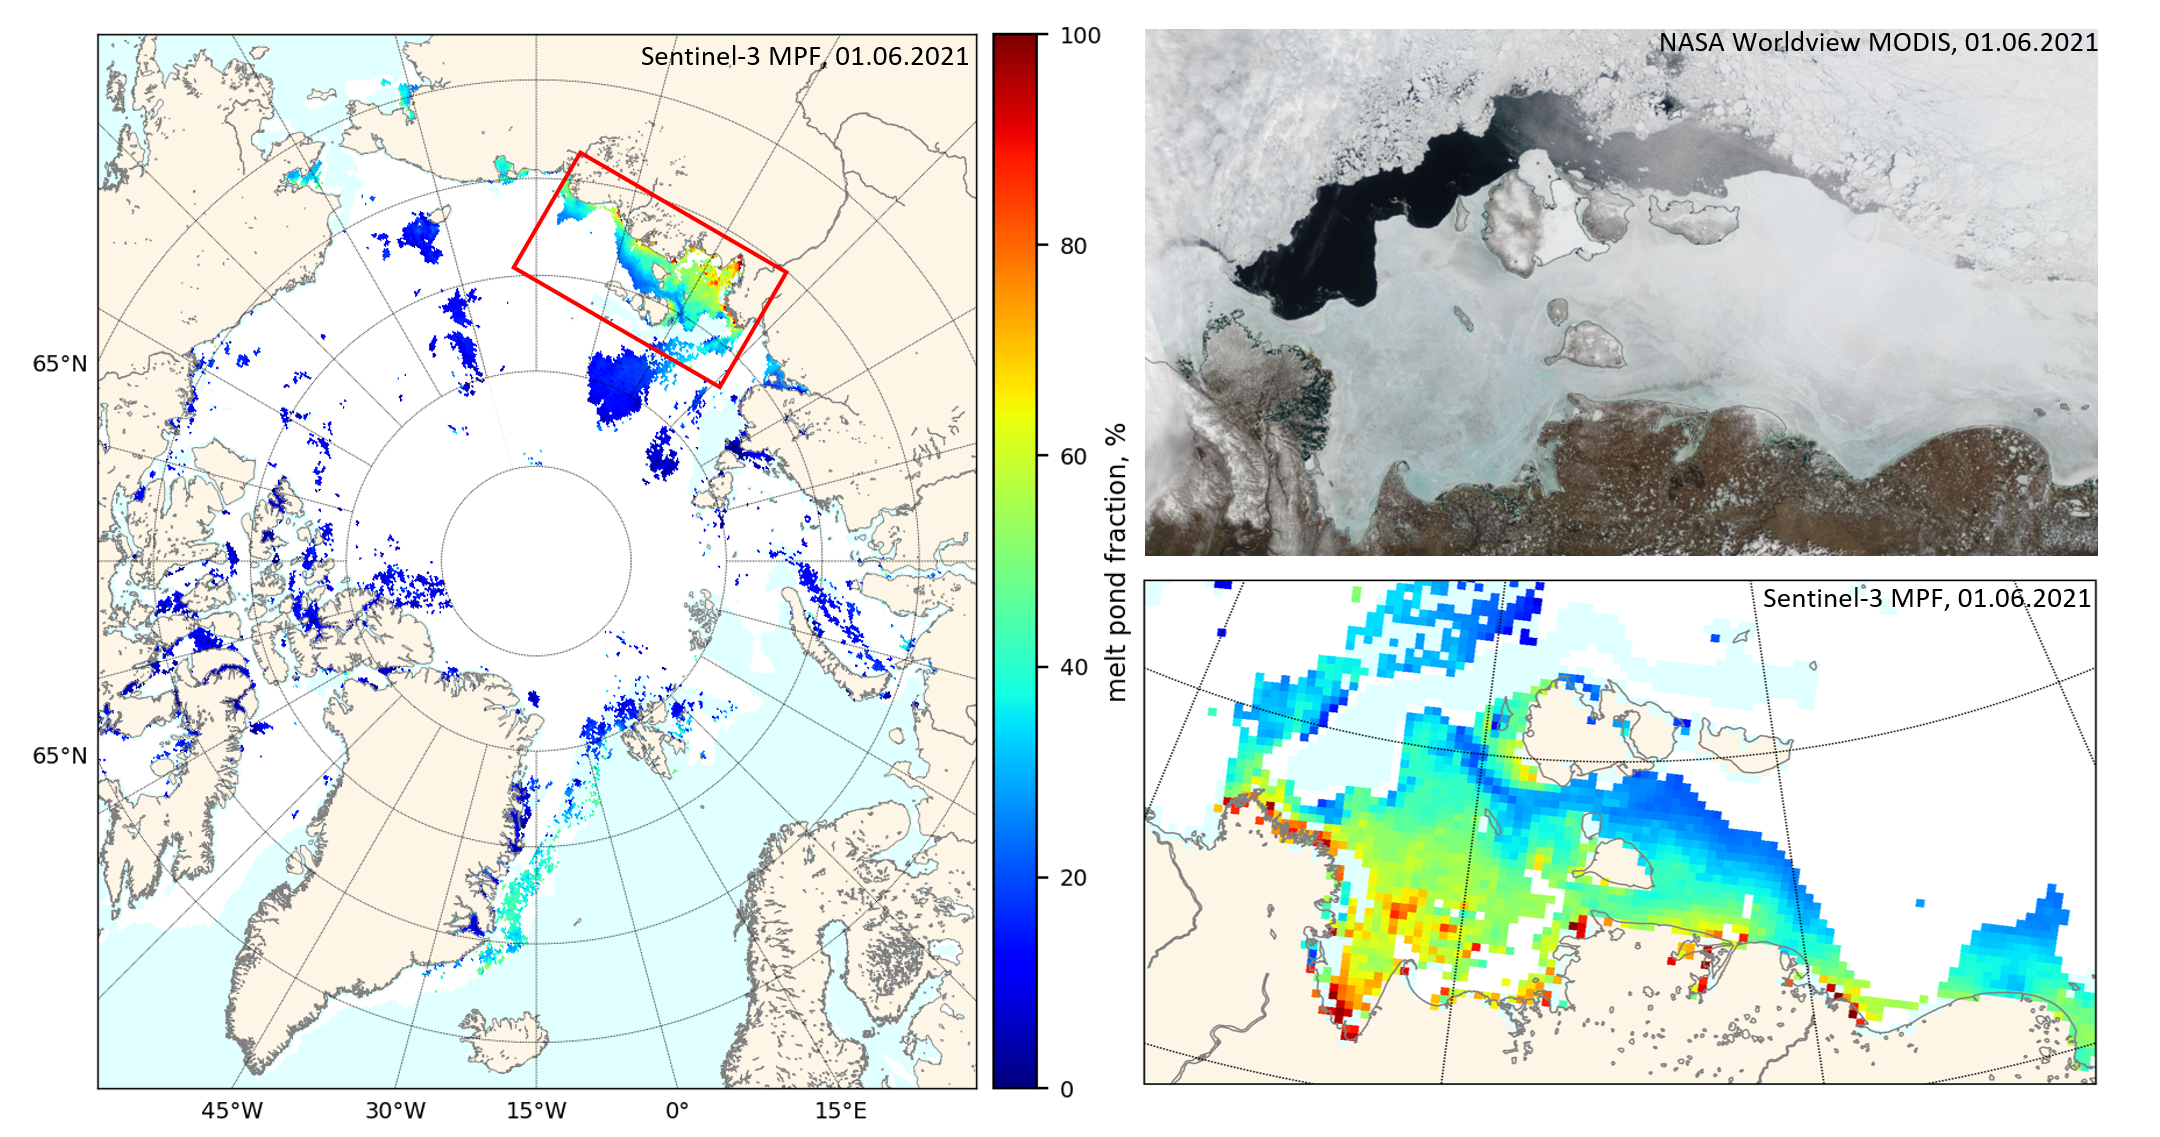
A new Sentinel 3 melt pond fraction product from the University of Bremen confirms that on the fast ice in the Laptev & East Siberian Seas snow cover has departed and melt ponds have arrived:

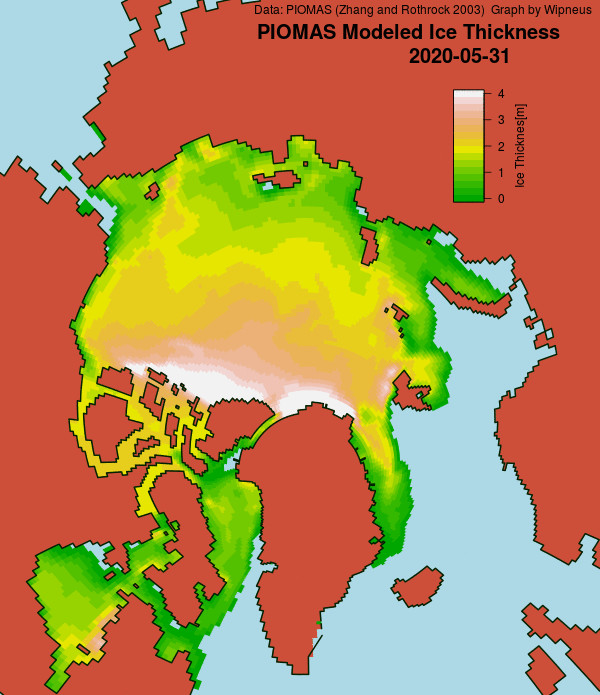
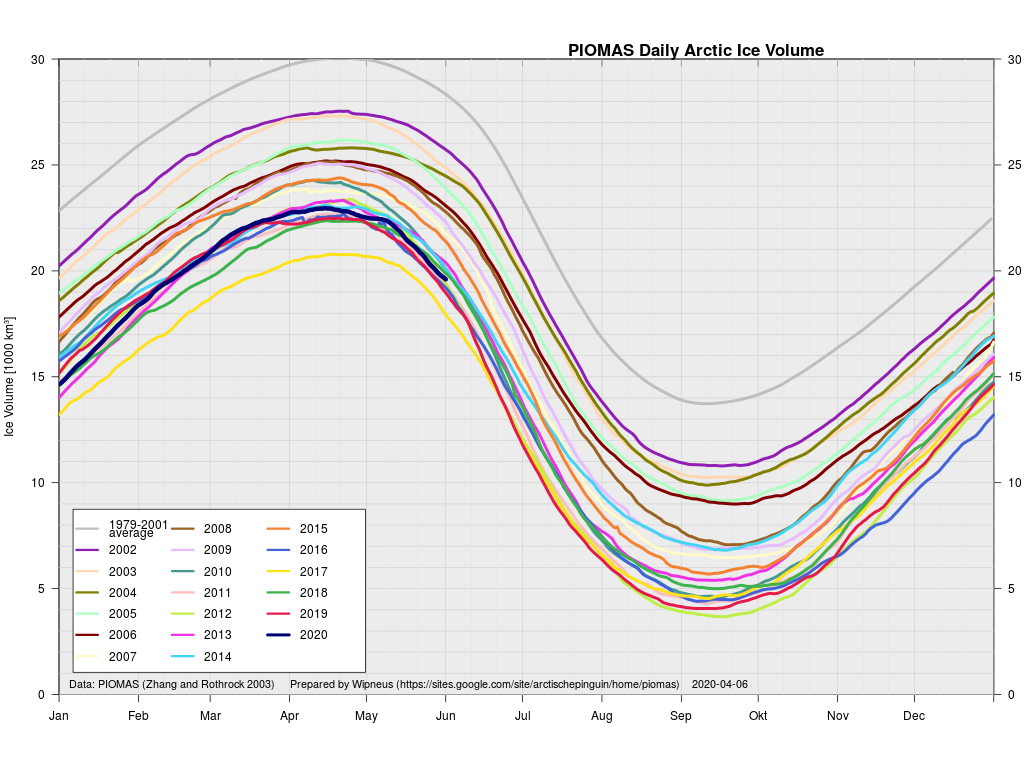
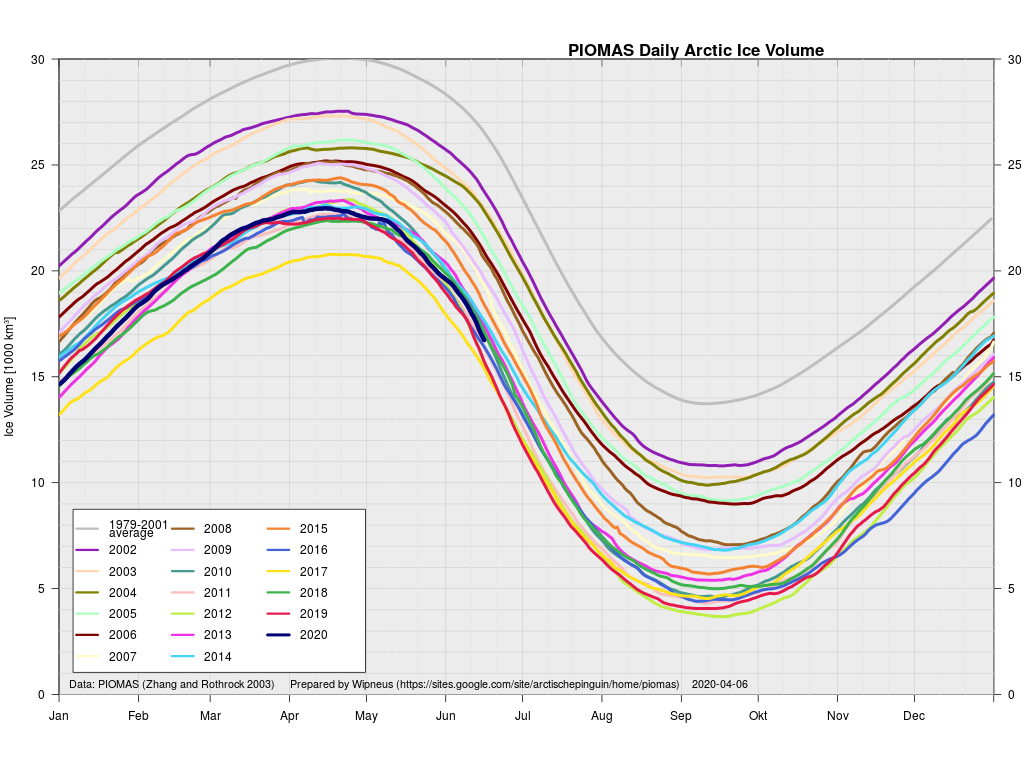
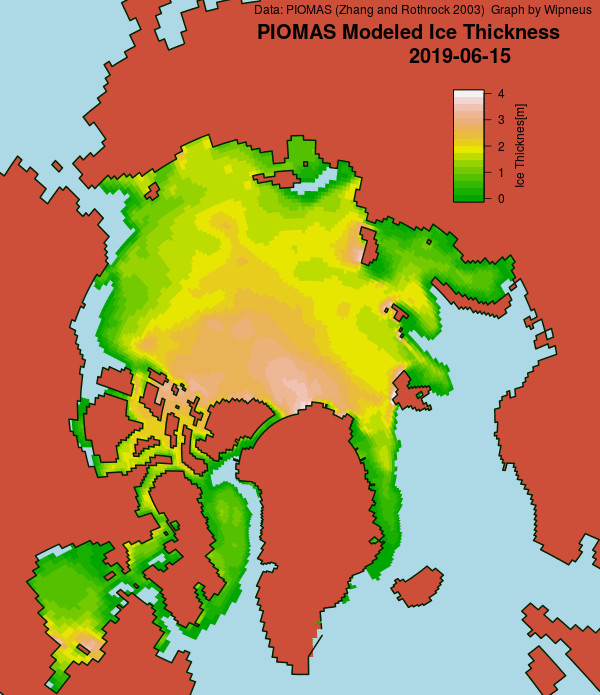
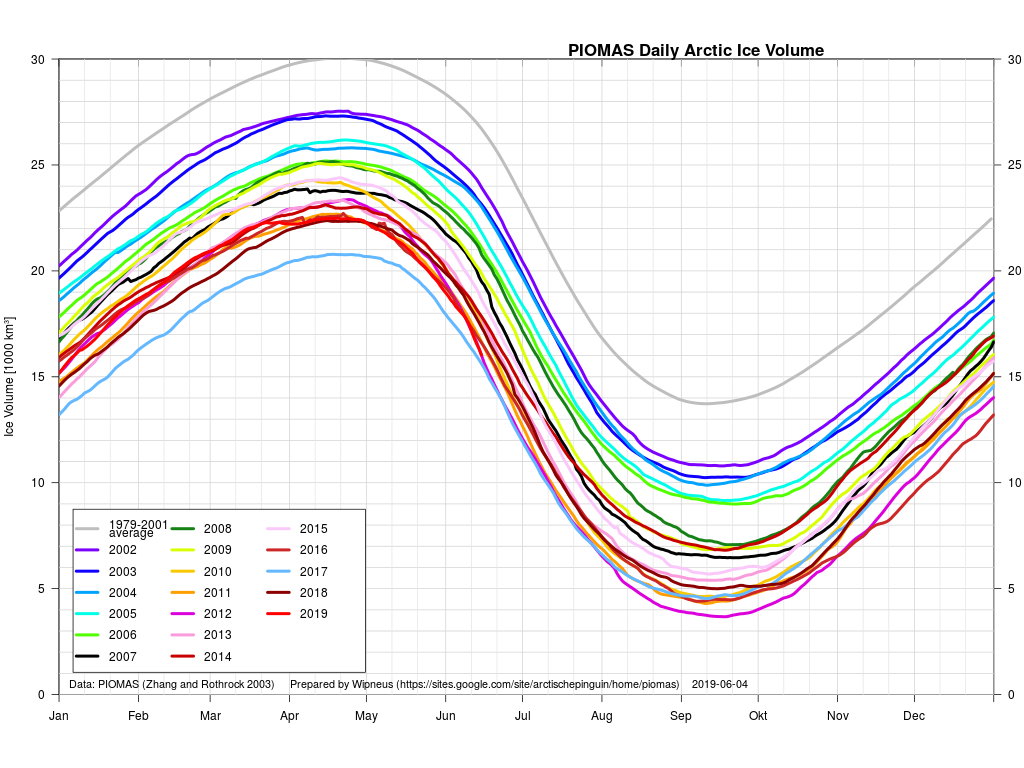
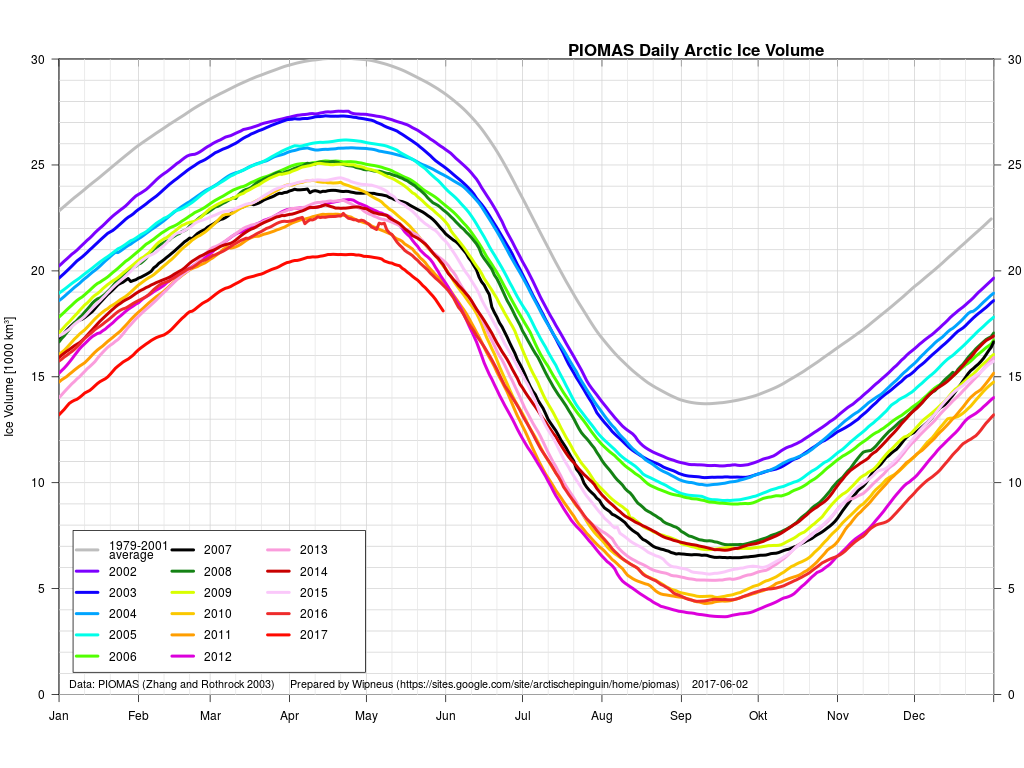
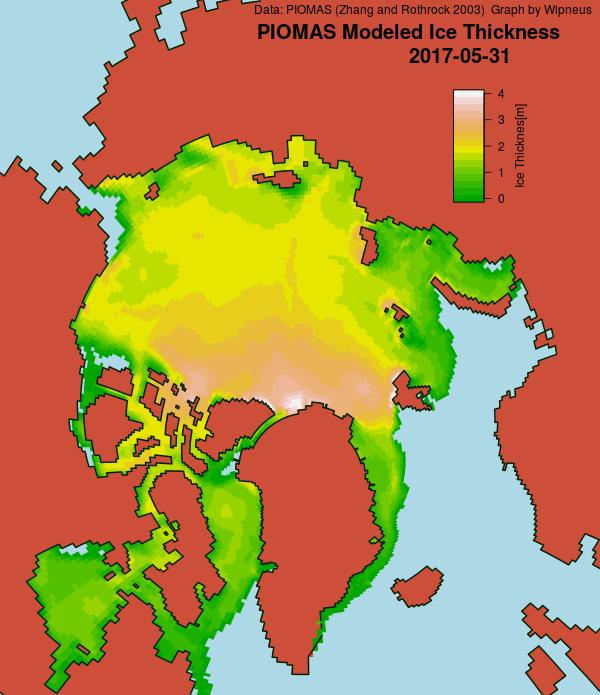
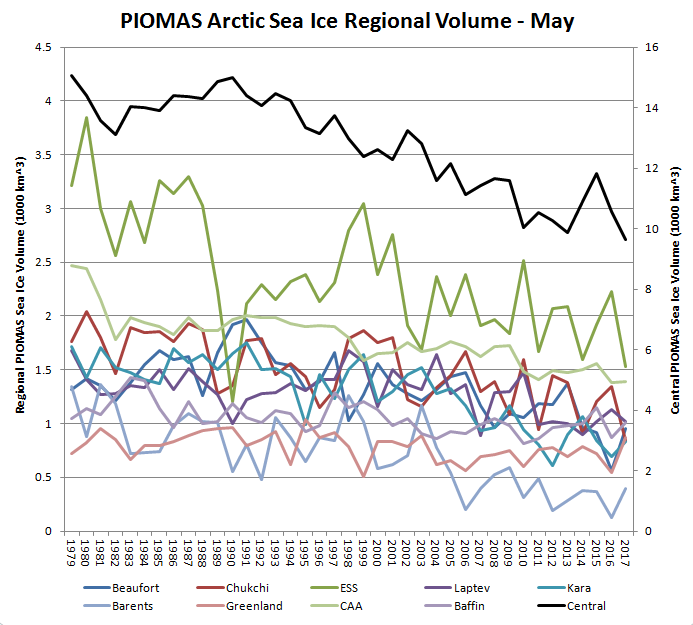
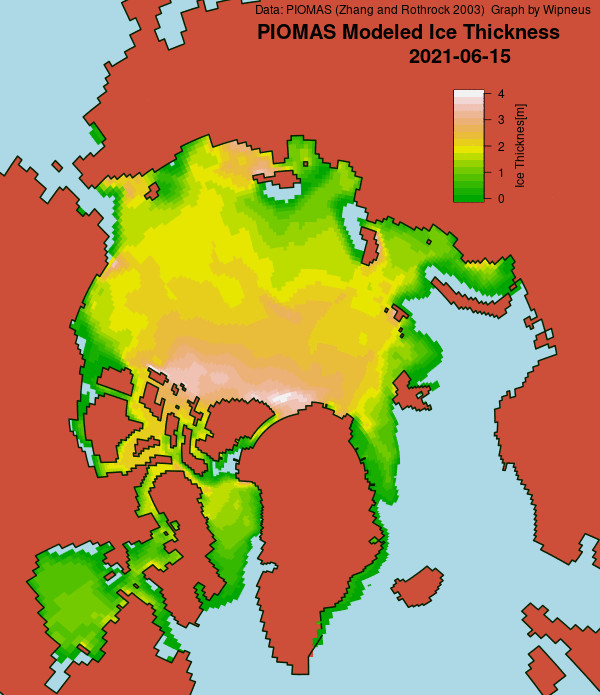
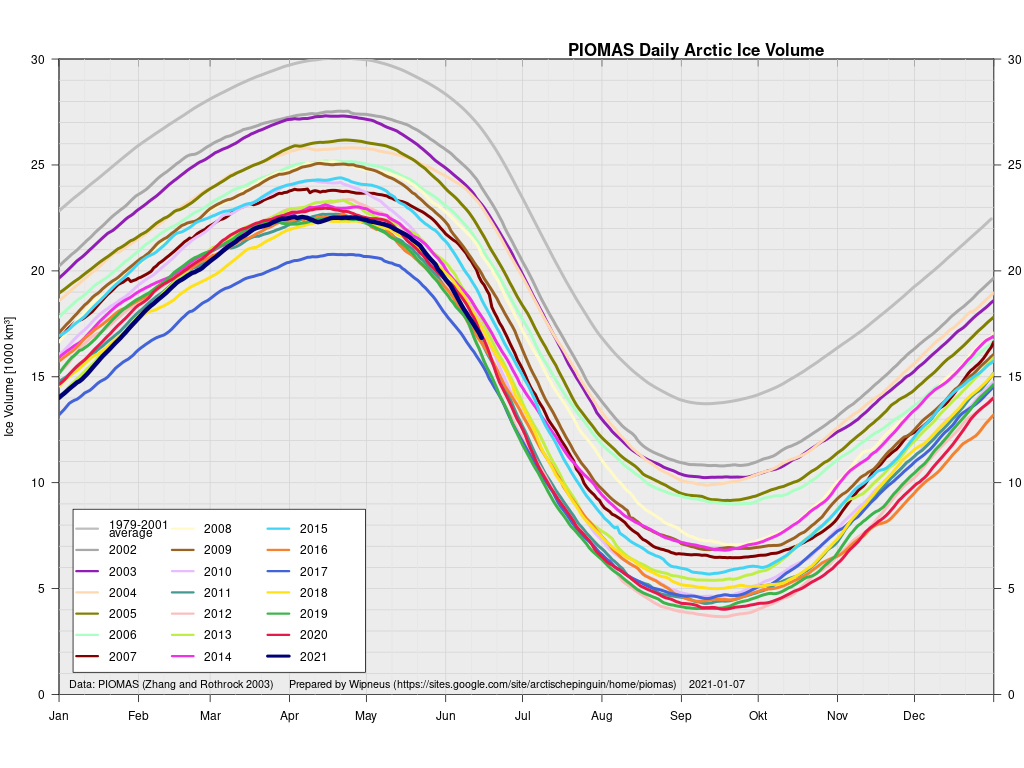
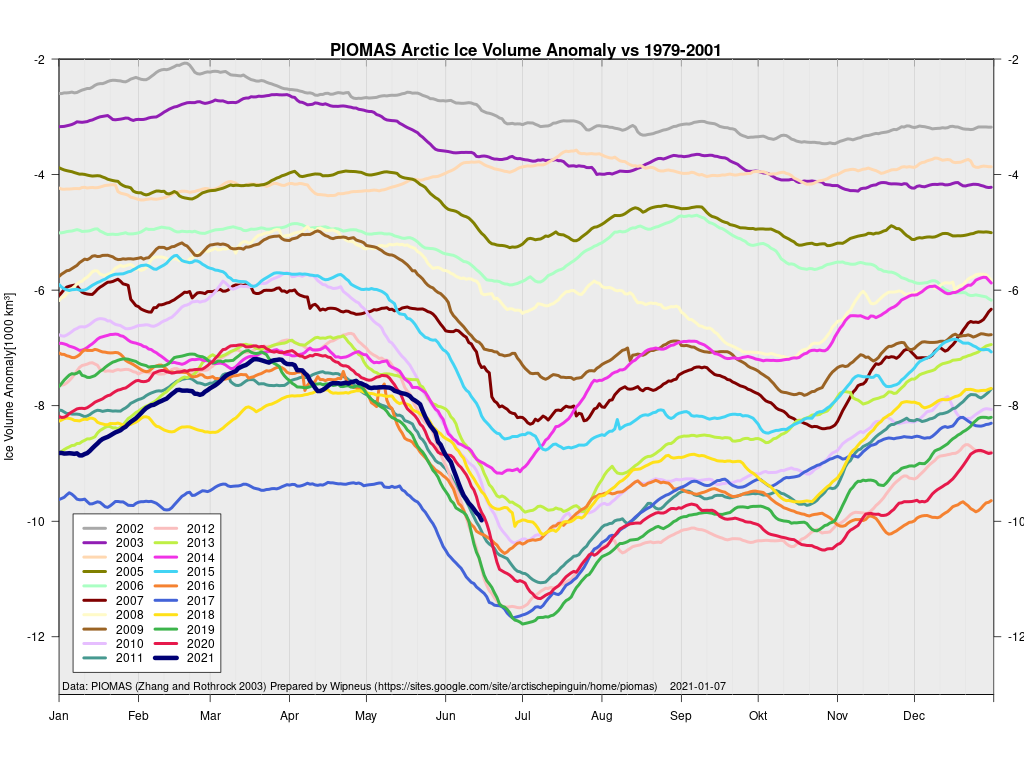
In other news Wipneus has released the latest PIOMAS gridded thickness and volume data on the Arctic Sea Ice Forum:

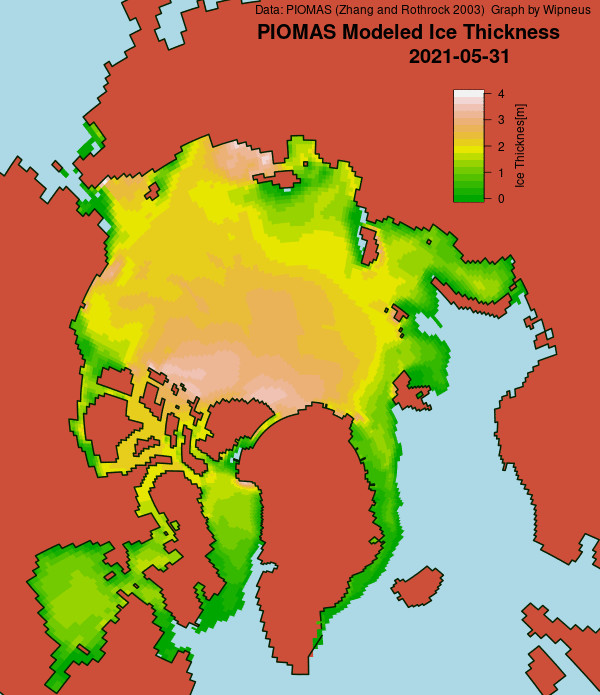
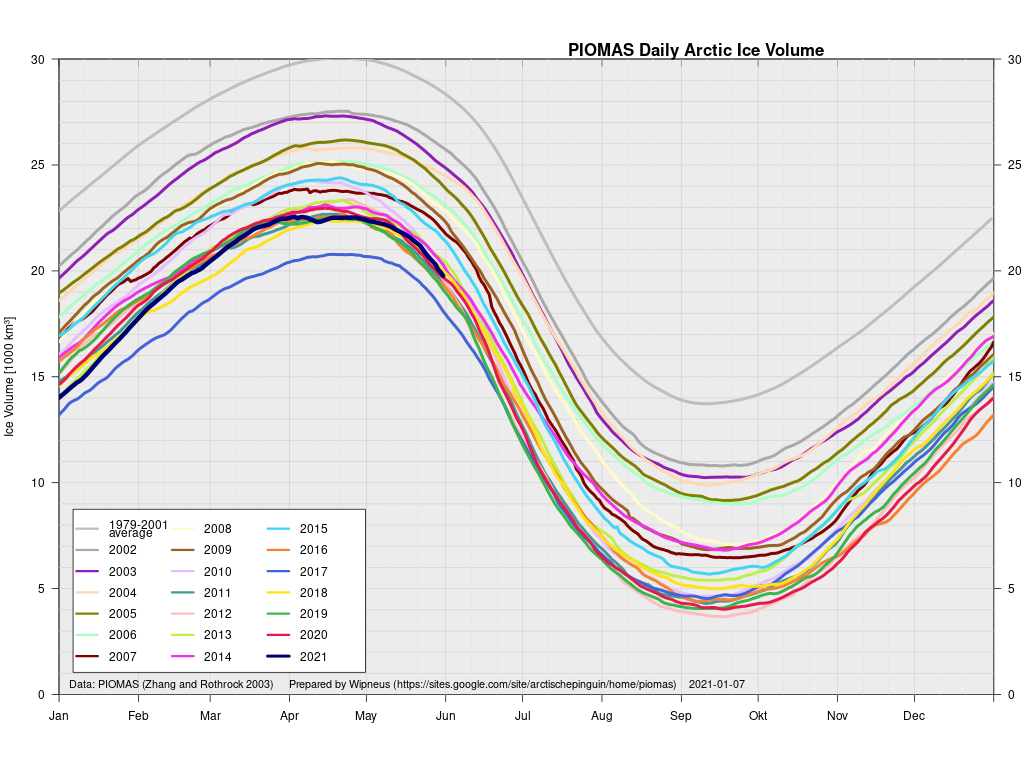
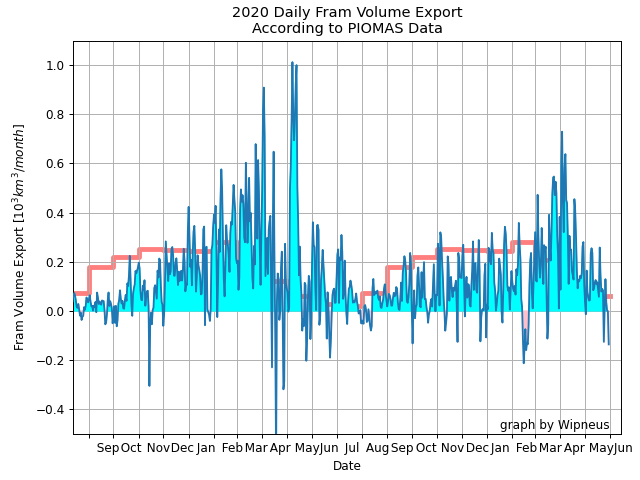
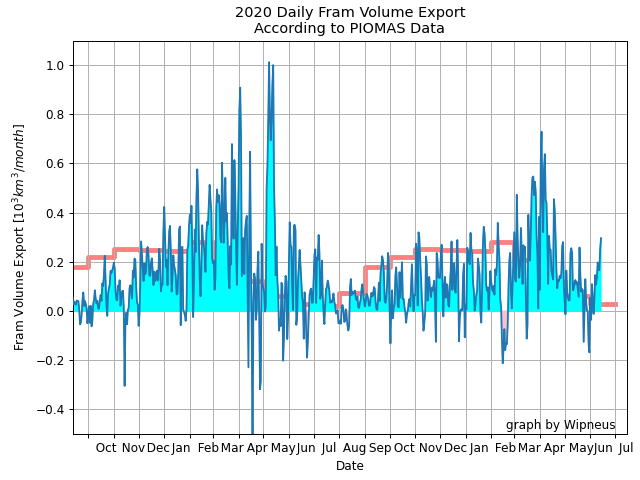
For some strange reason 2021 volume at the end of May is almost identical to 2012 and 2020! Plus of course there’s the modelled volume export from the Central Arctic via the Fram Strait:

[Edit – June 6th]

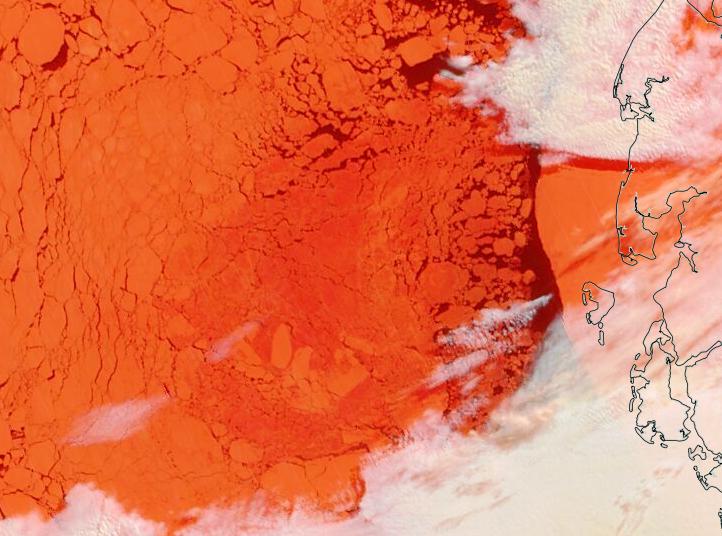
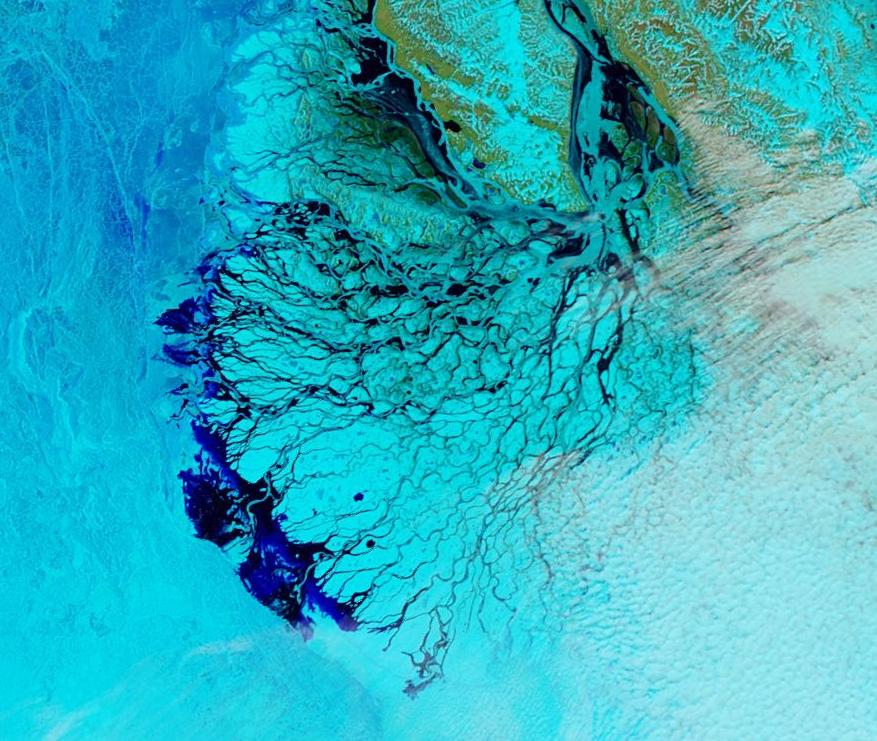
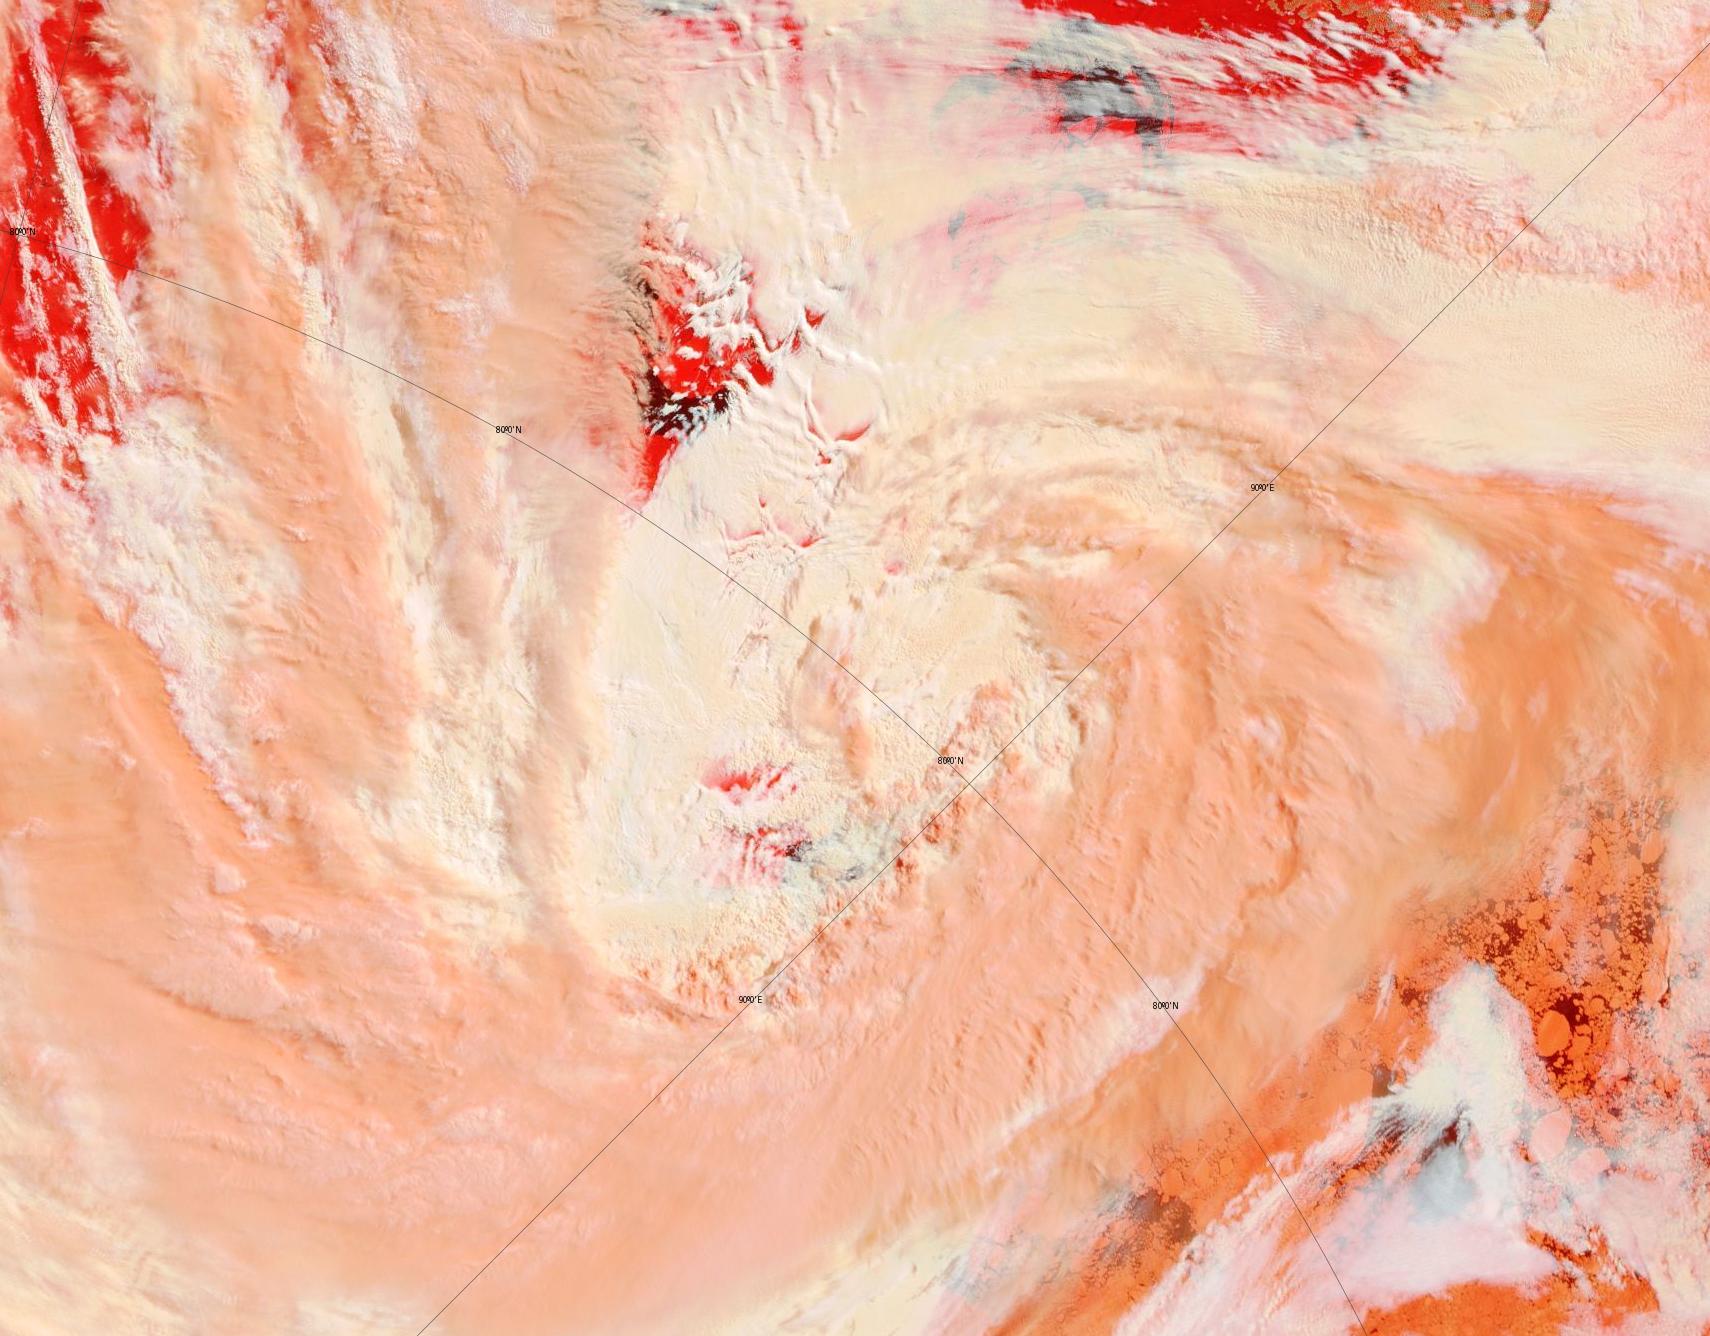
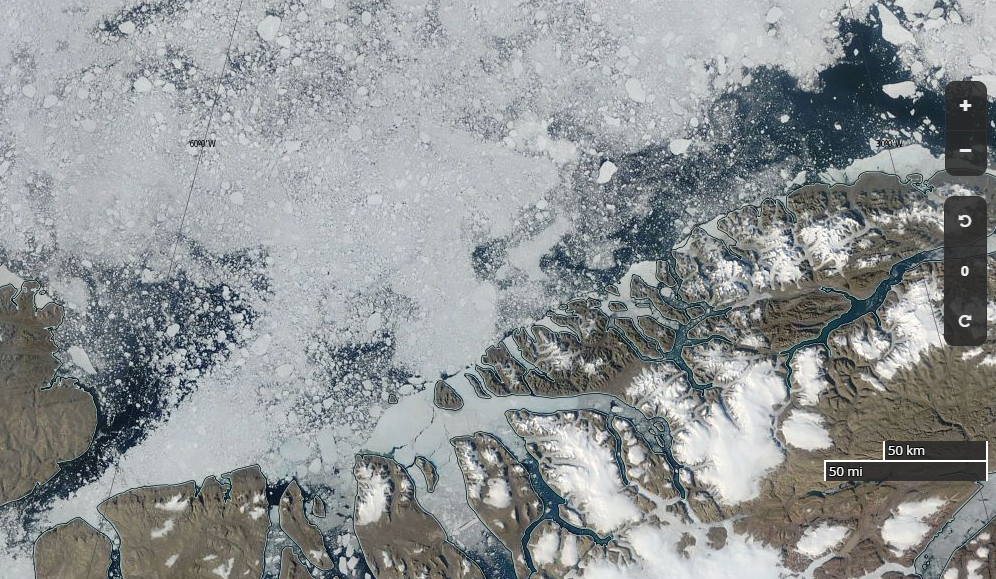
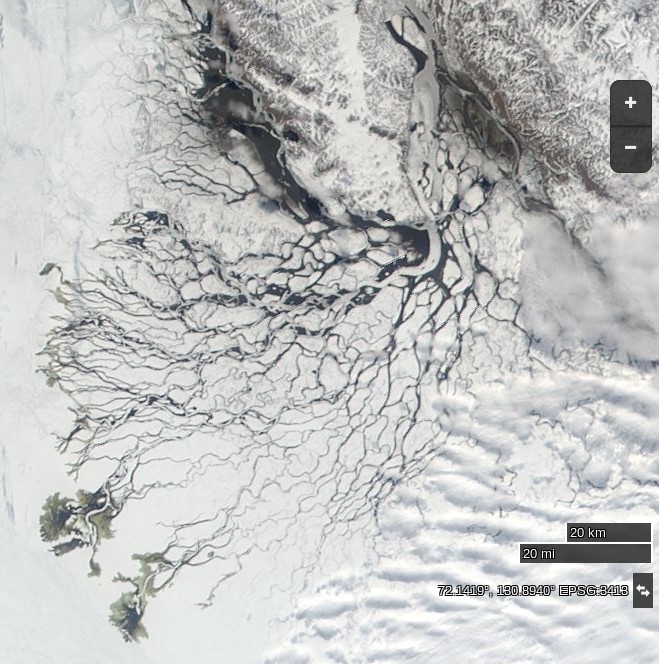
This “false colour” image reveals that there’s virtually no snow cover left on land, and this “false colour” image reveals that the land-fast ice in the East Siberian Sea is now awash with melt ponds:

[Edit – June 8th]

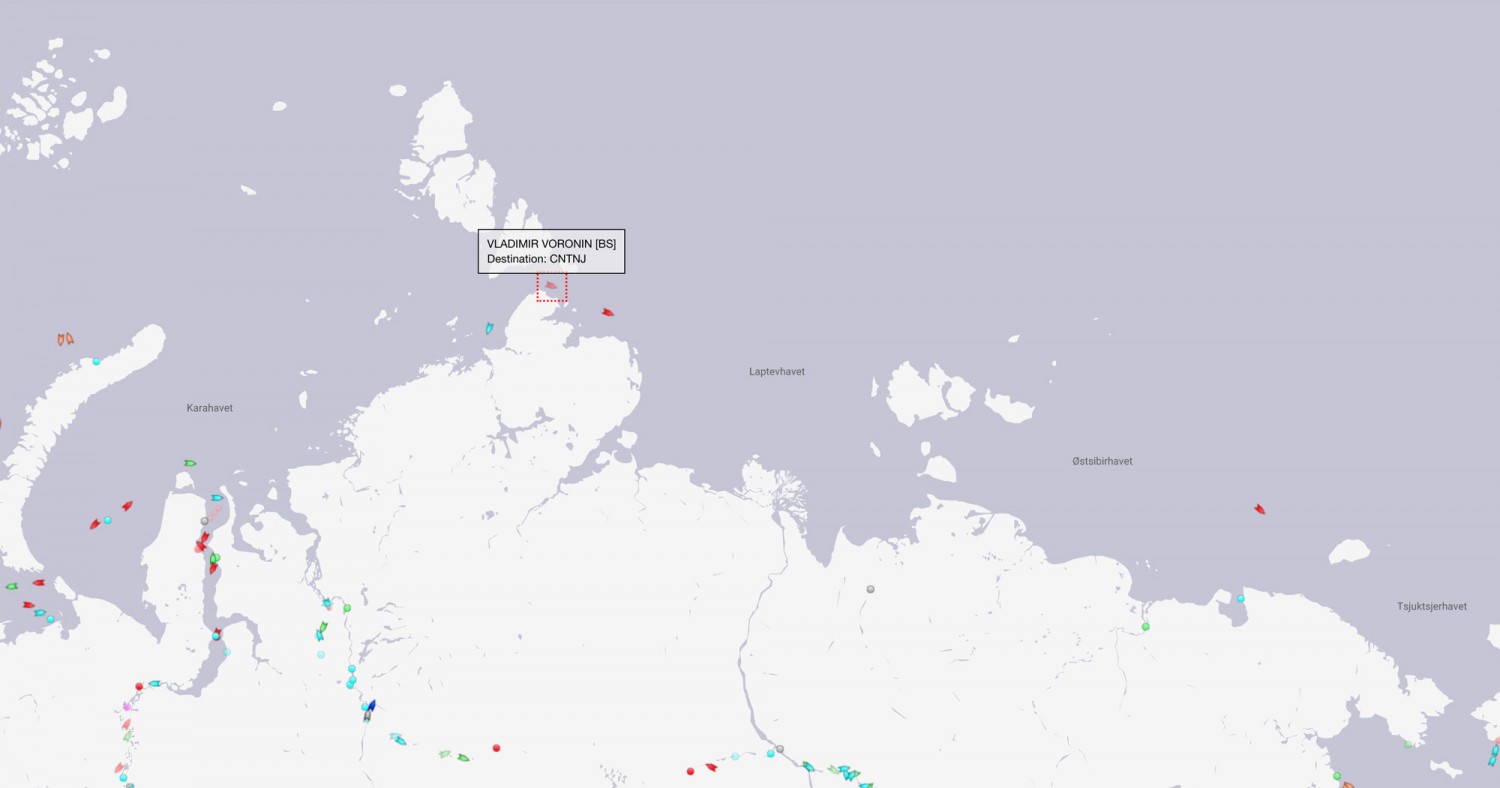
The forecast low pressure area appears to have bottomed out near the Severnaya Zemlya islands with a 978 hPa MSLP:

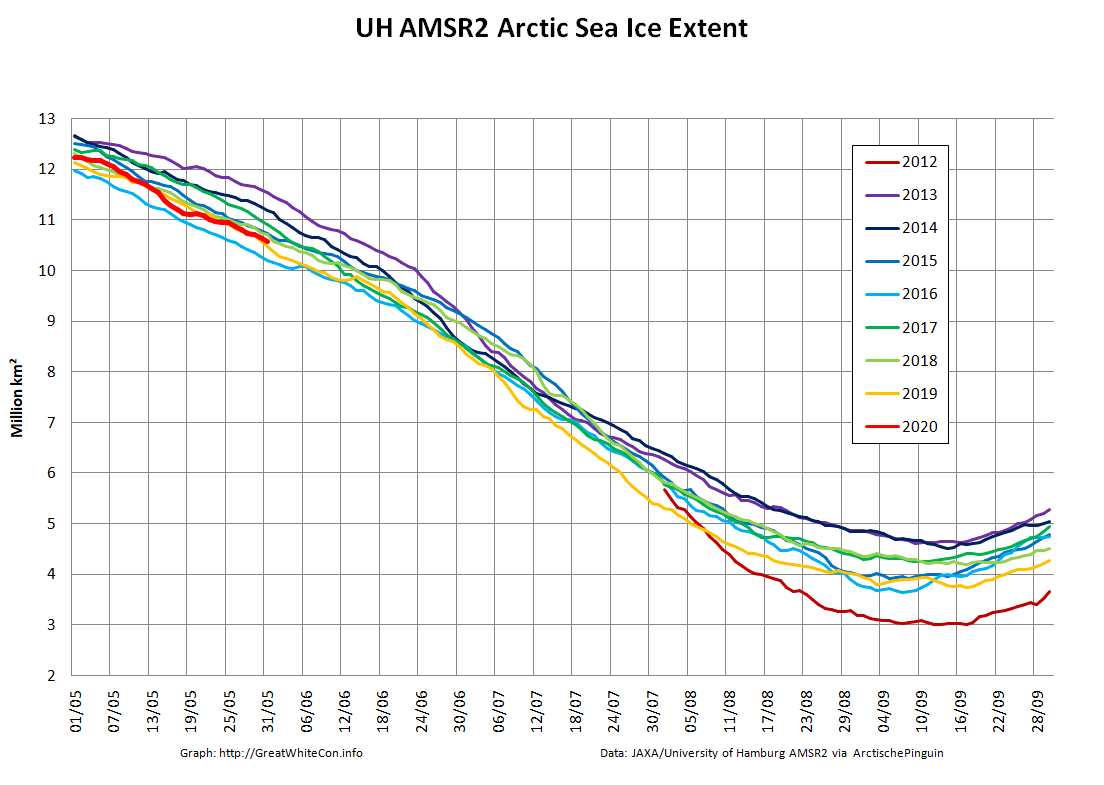
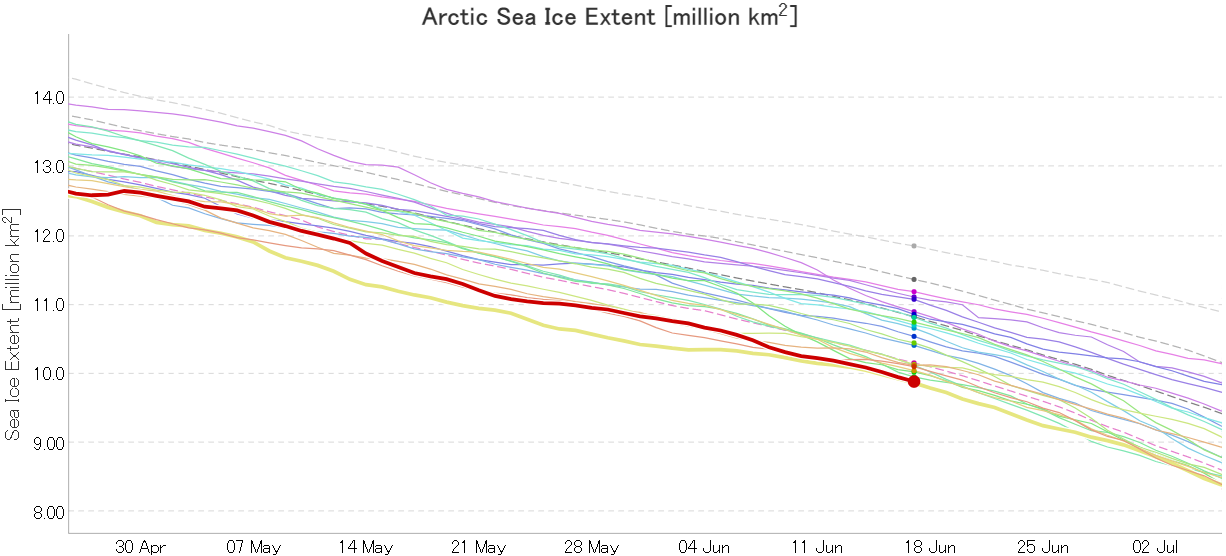
High resolution AMSR2 Arctic sea ice area is now 2nd lowest for the date after 2016:

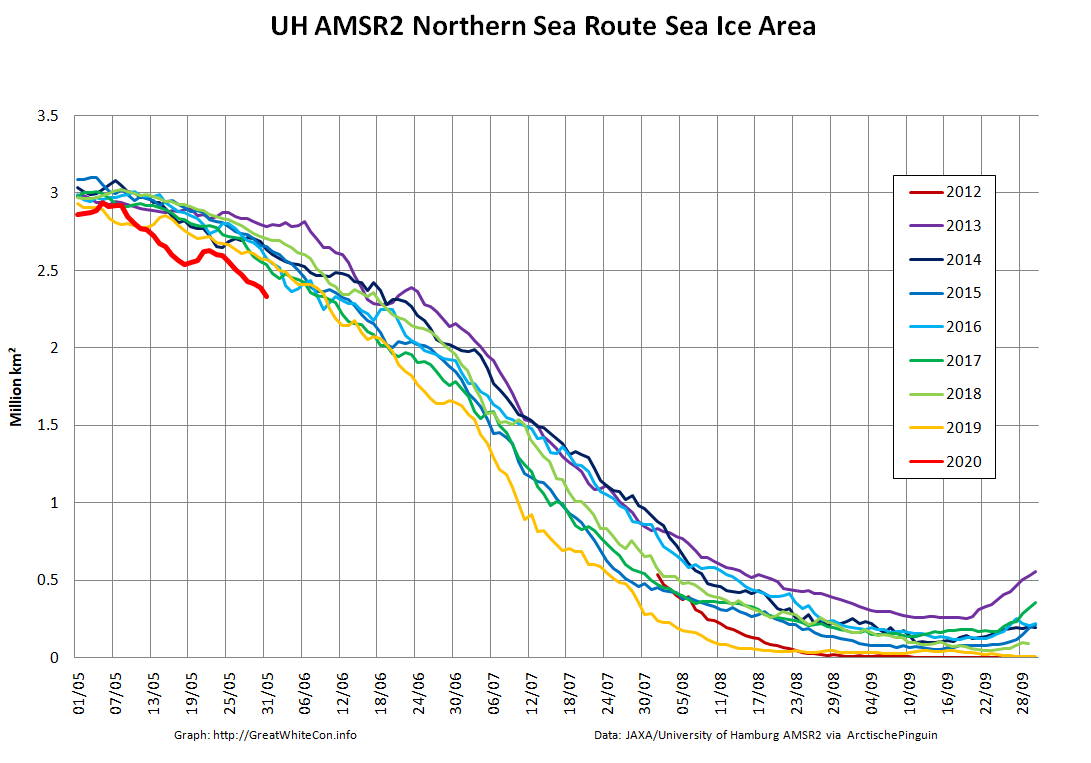
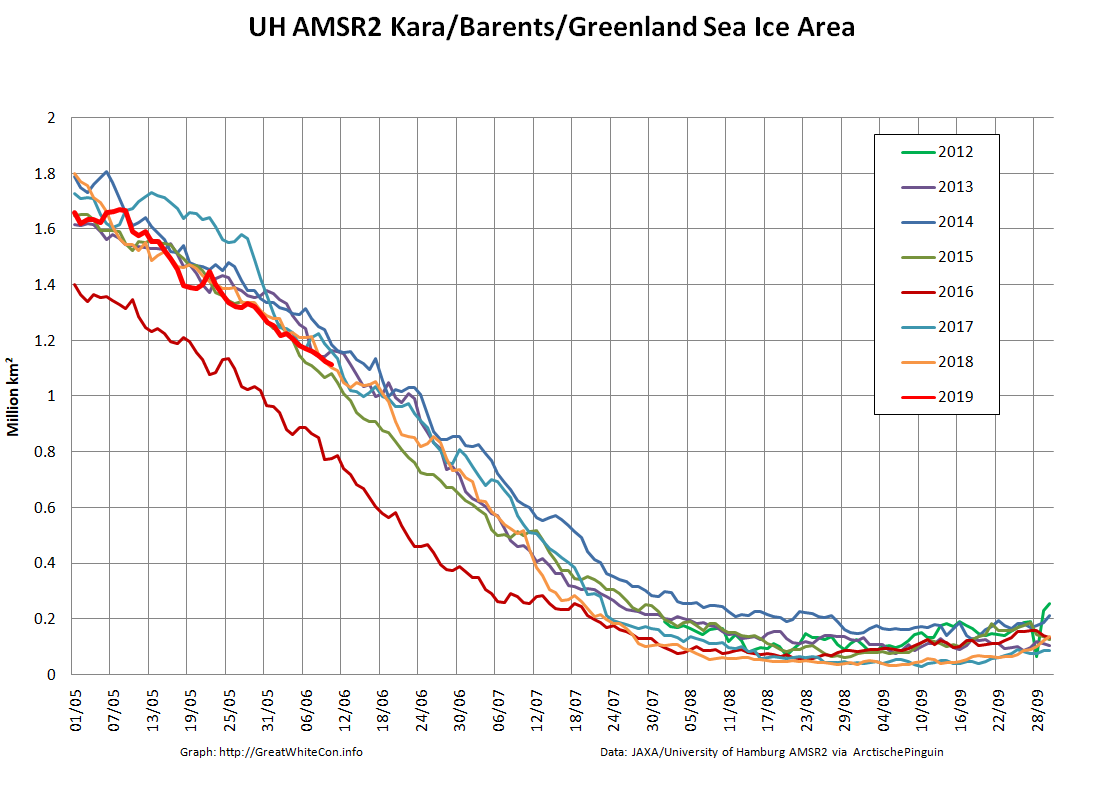
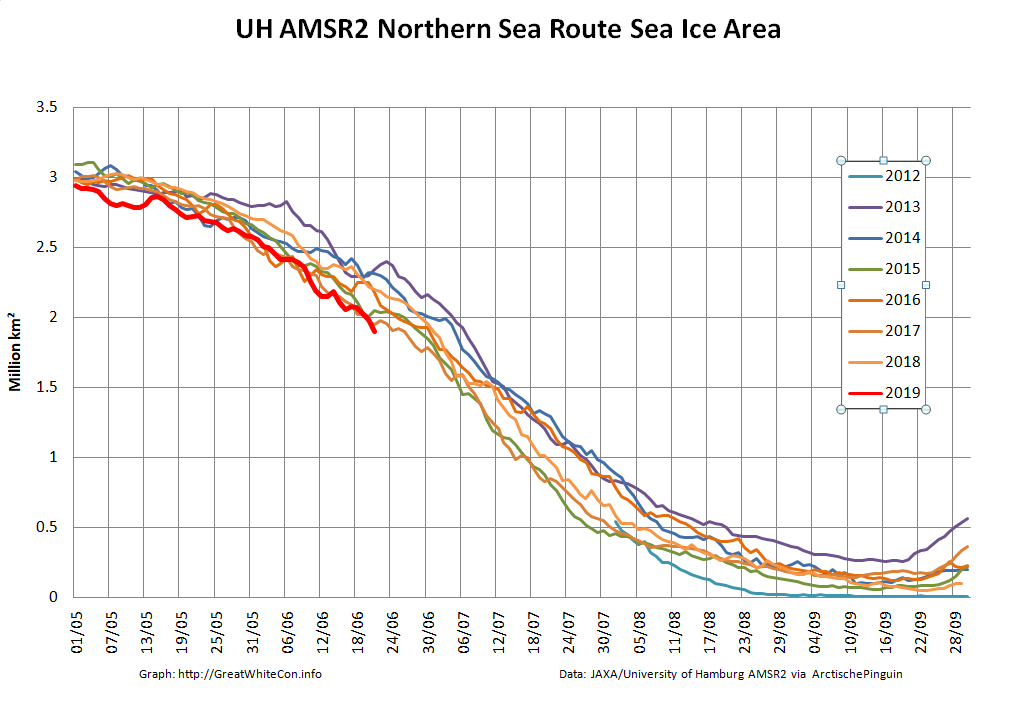
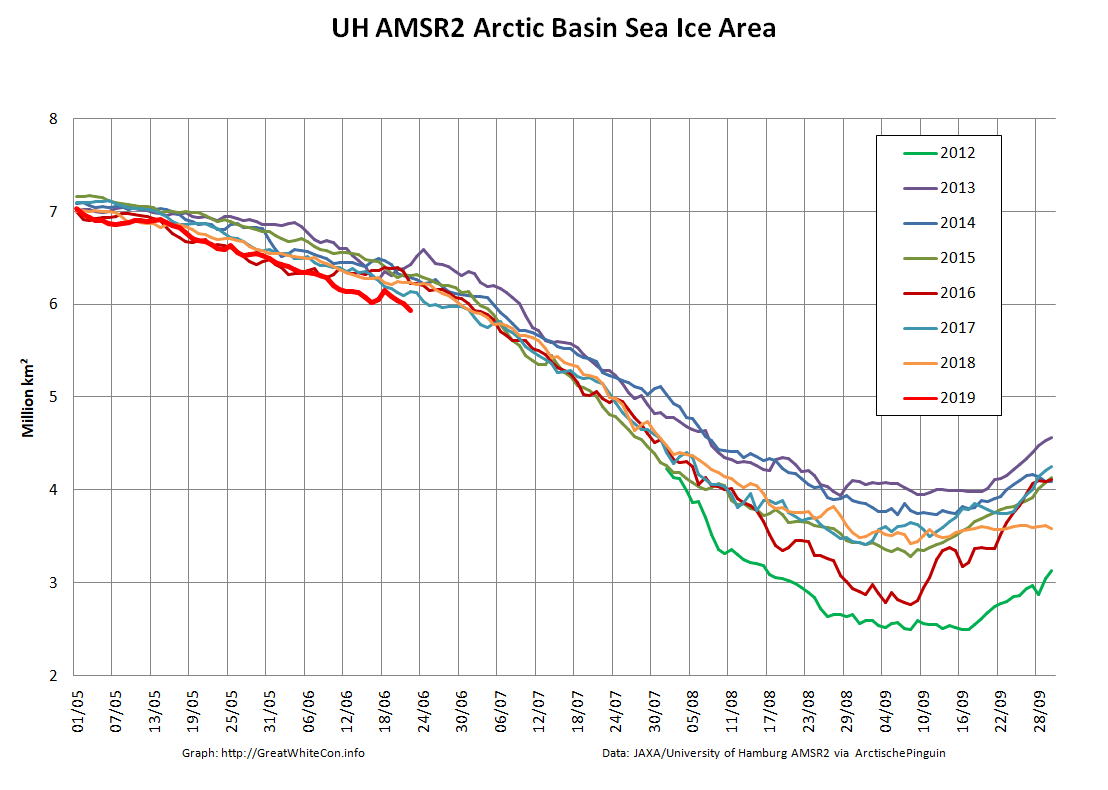
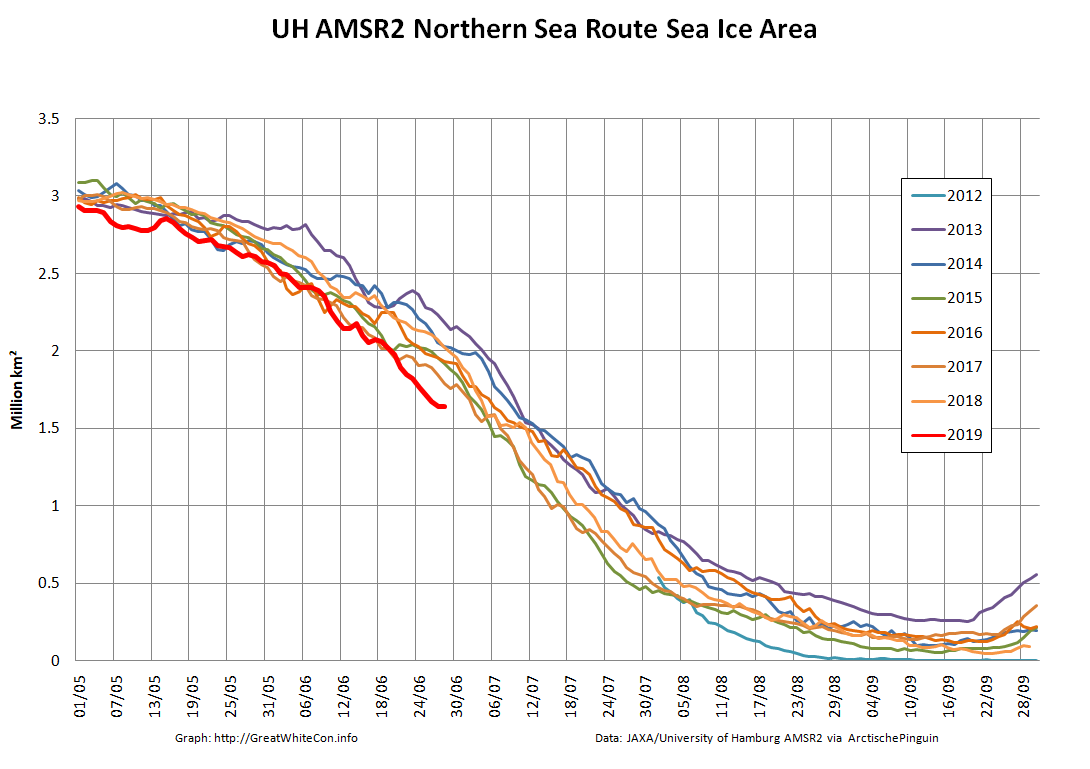
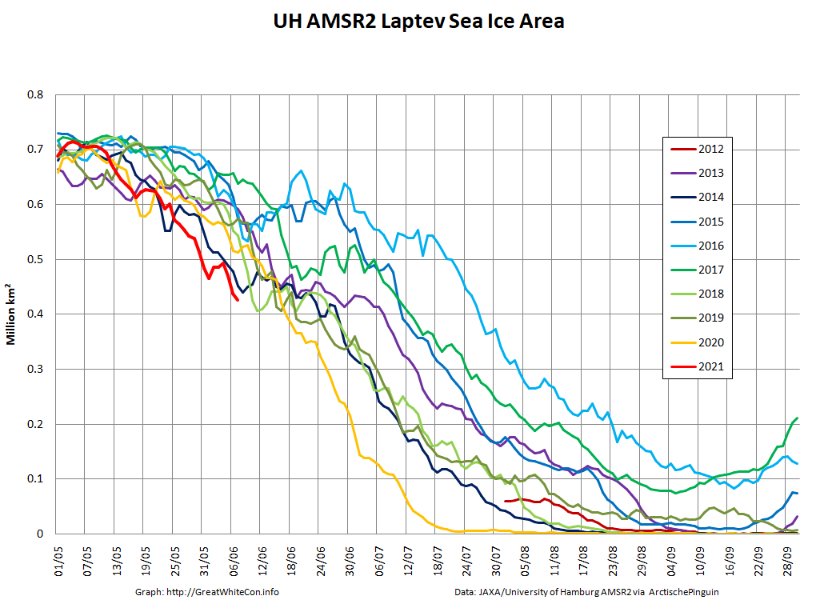
Laptev sea ice area is still lowest for the data, and looks as though it will retain that position for a while:

[Edit – June 9th]

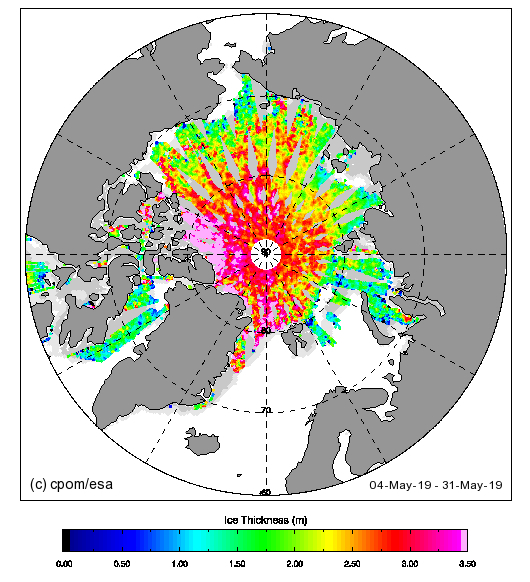
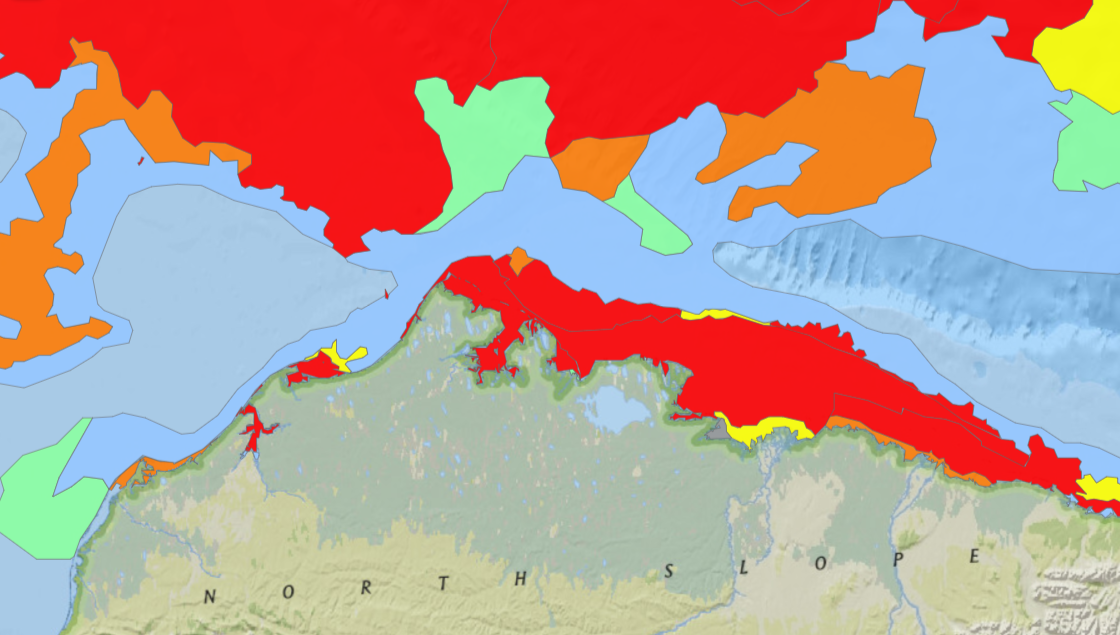
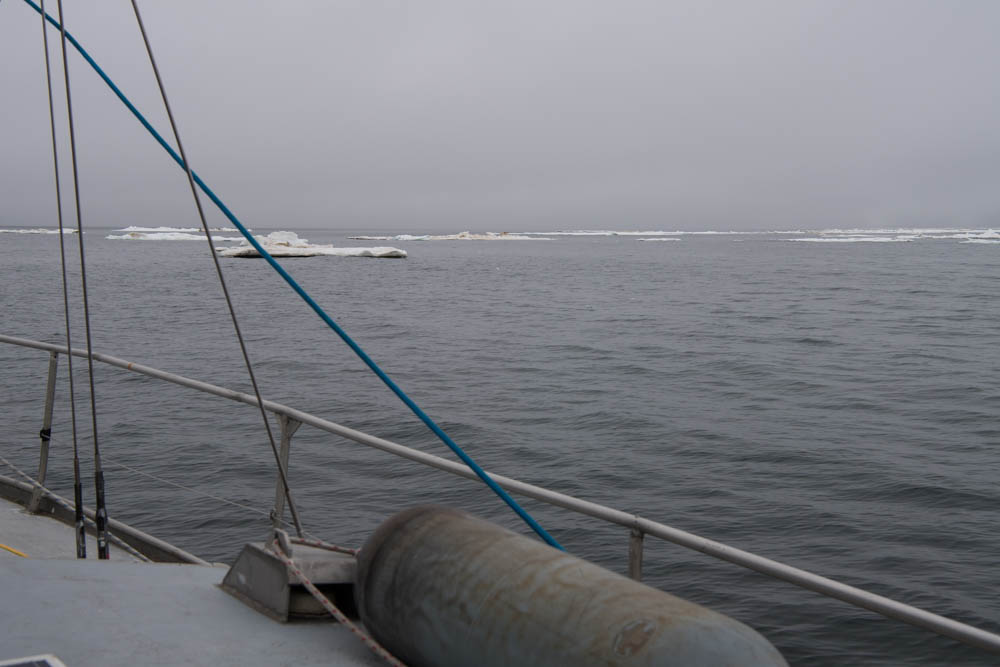
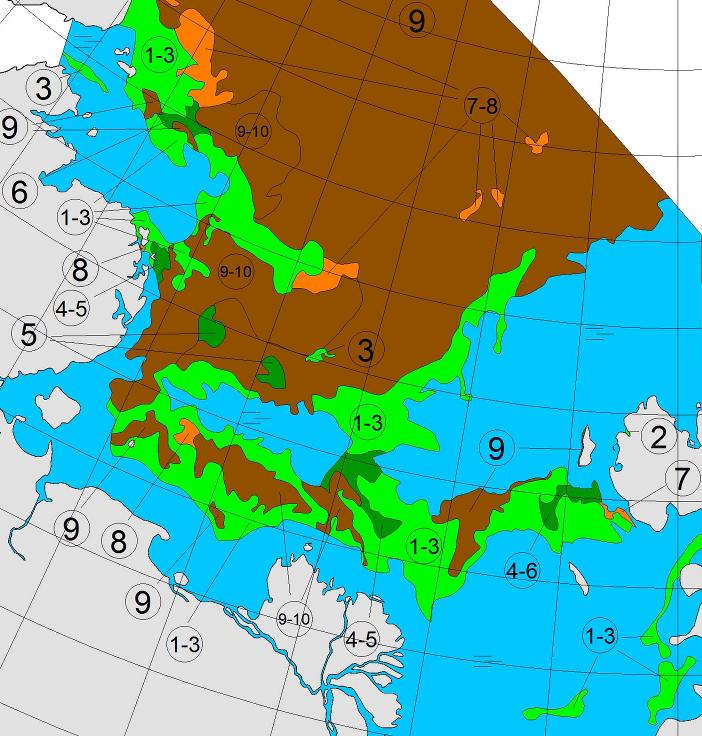
The effect of the recent heat and wind on the remaining sea ice in the Laptev Sea is now all too apparent:

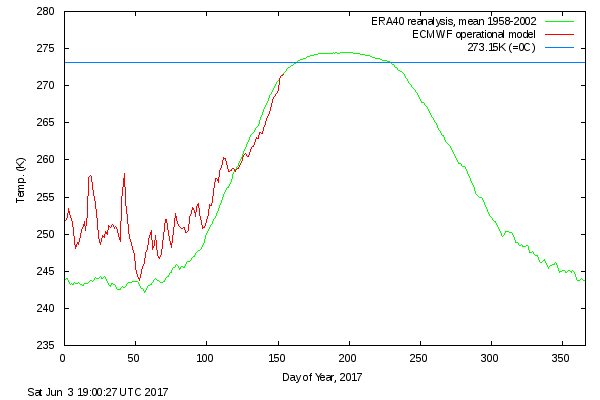
It’s also evident in the DMI >80N temperature graph, which has now reached sea ice “melting point” ahead of the climatology:

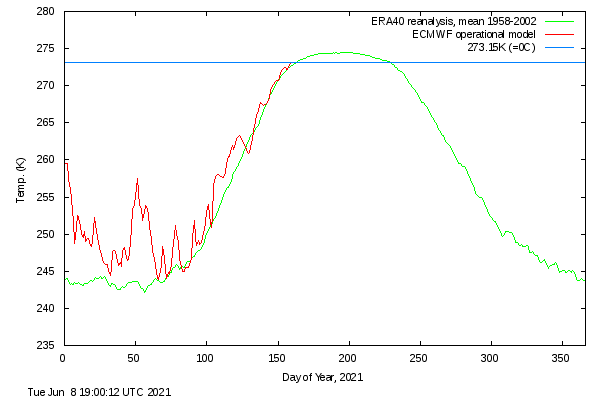
Note that the blue line is actually above the “freezing point” of salty Arctic sea water.
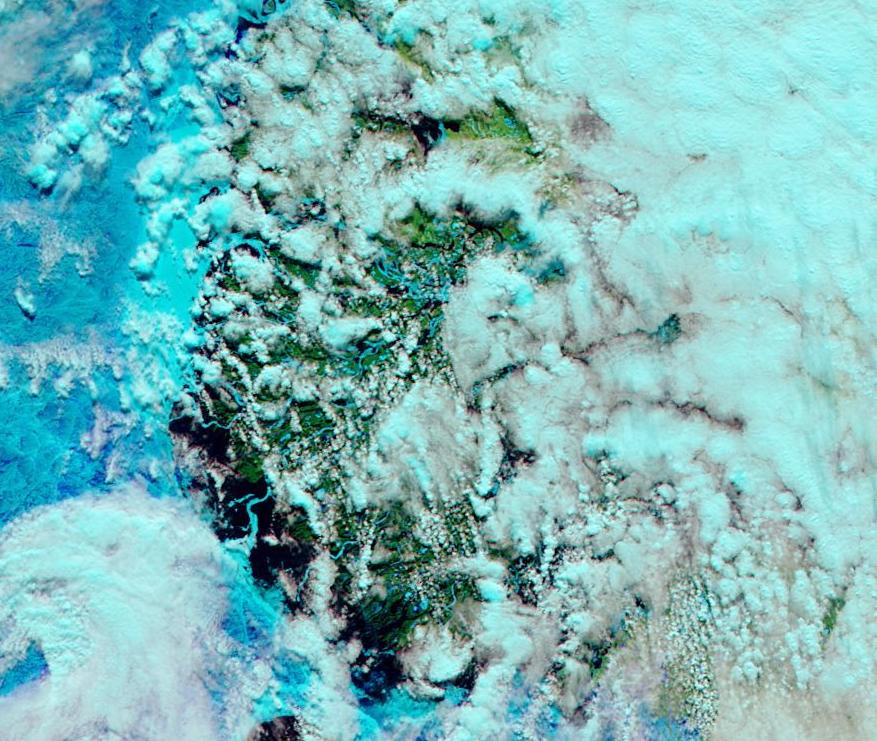
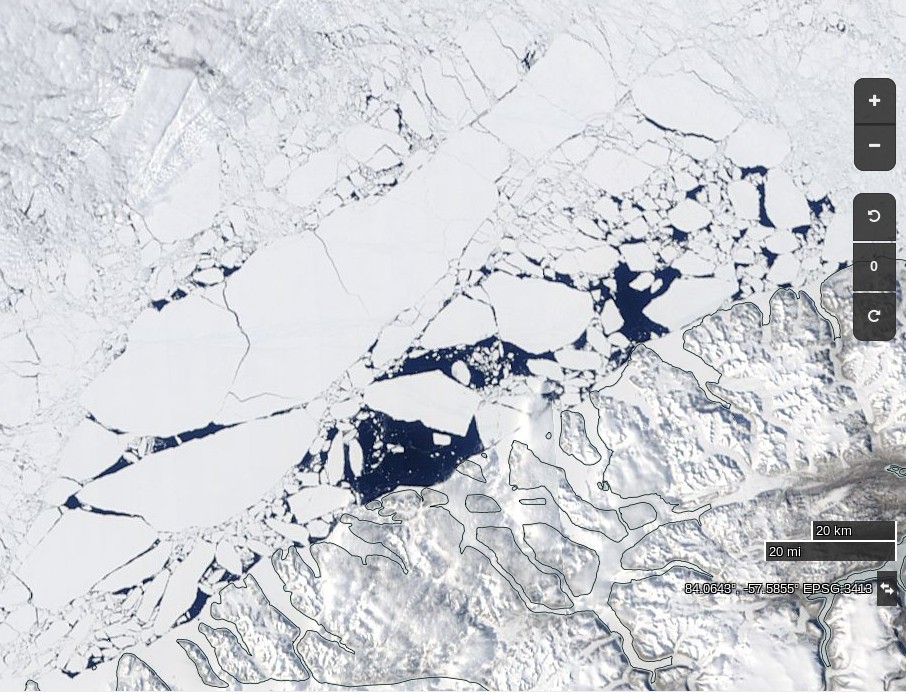
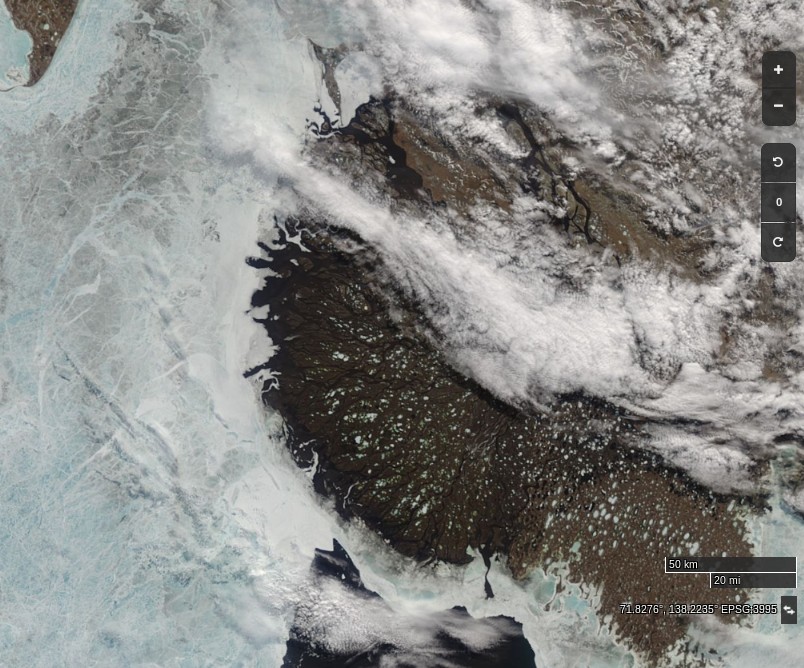
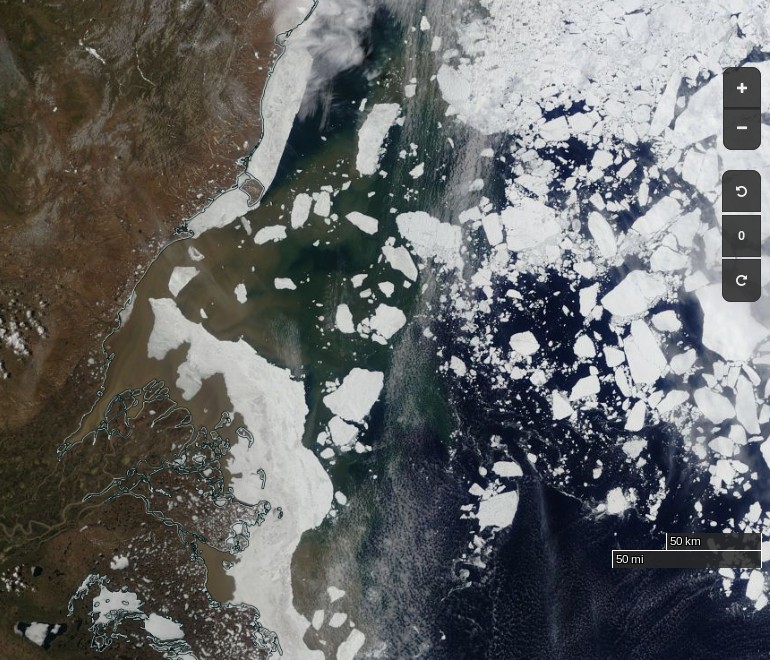
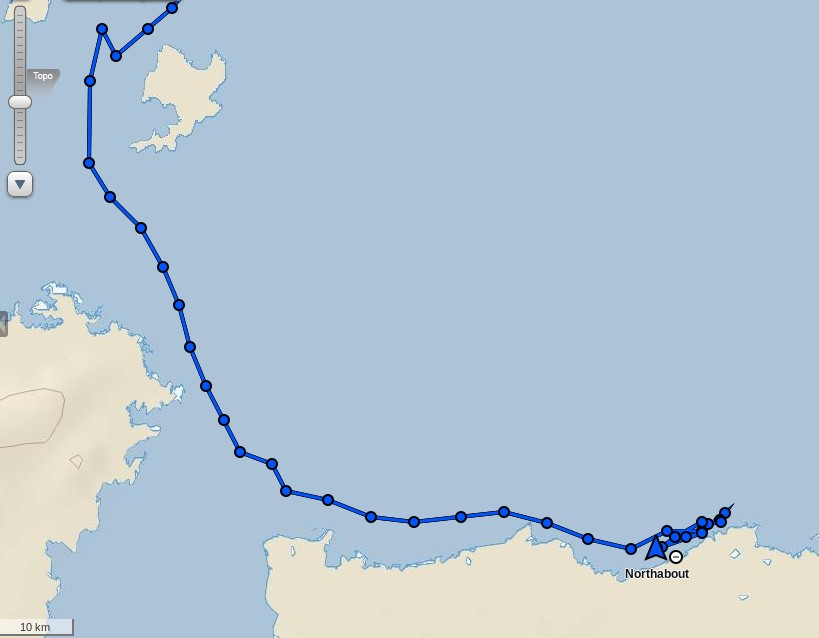
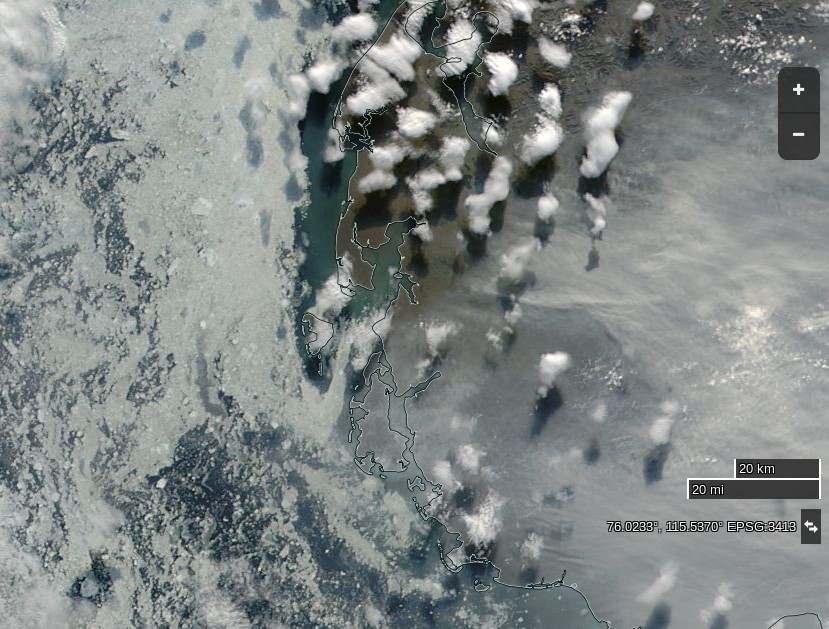
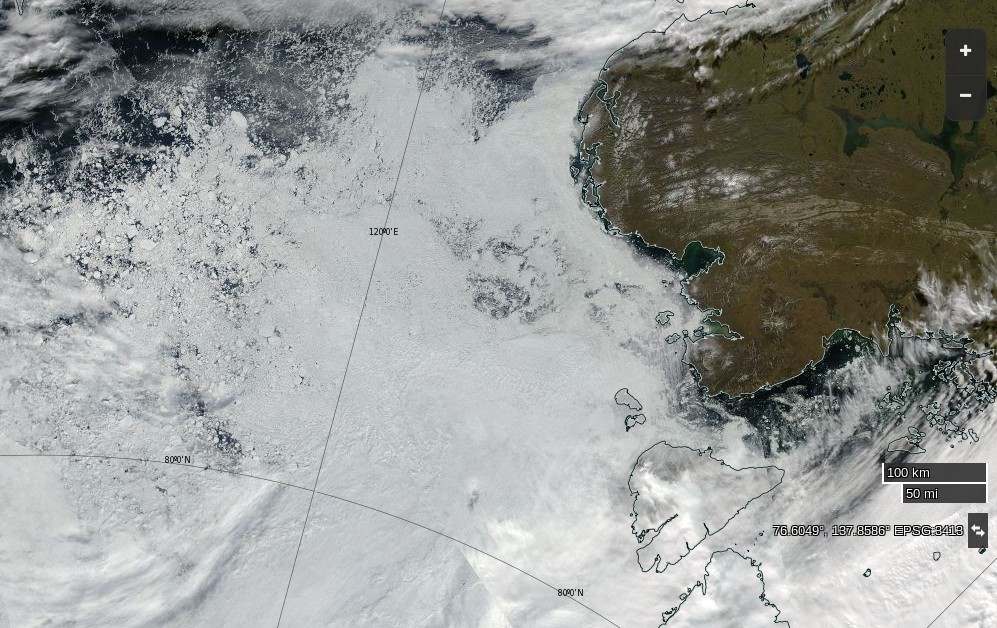
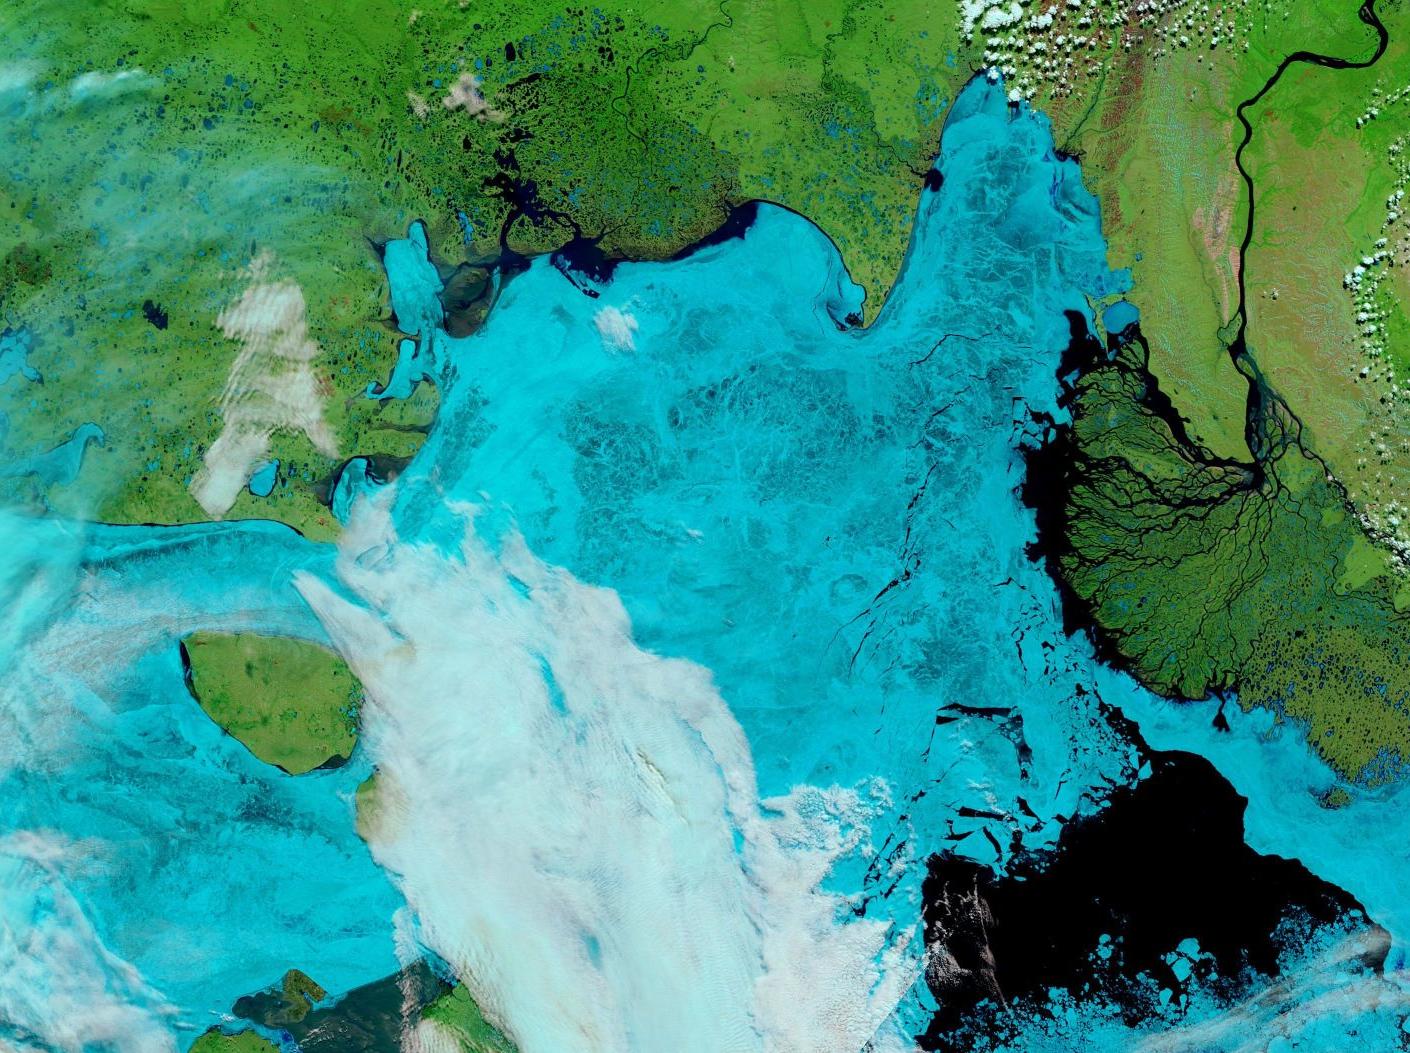
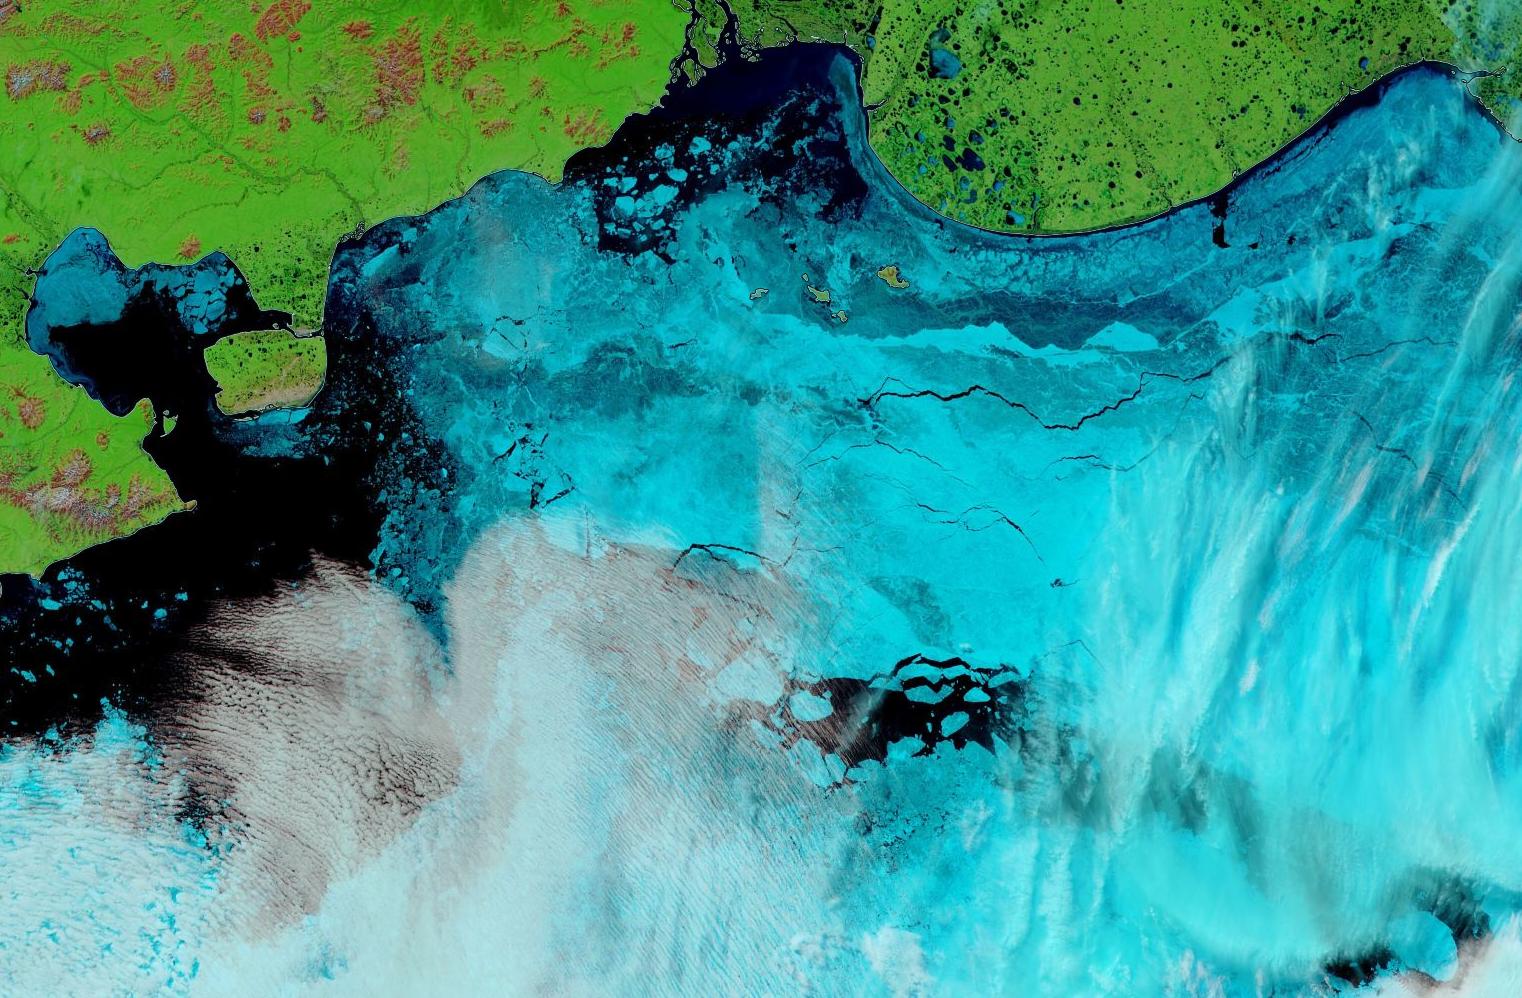
[Edit – June 13th]

Fairly clear skies over the Laptev Sea and the western East Siberian Sea, revealing wall to wall melt ponds and the land-fast ice starting to break up near the coast as well as on the edge of the now open ocean:

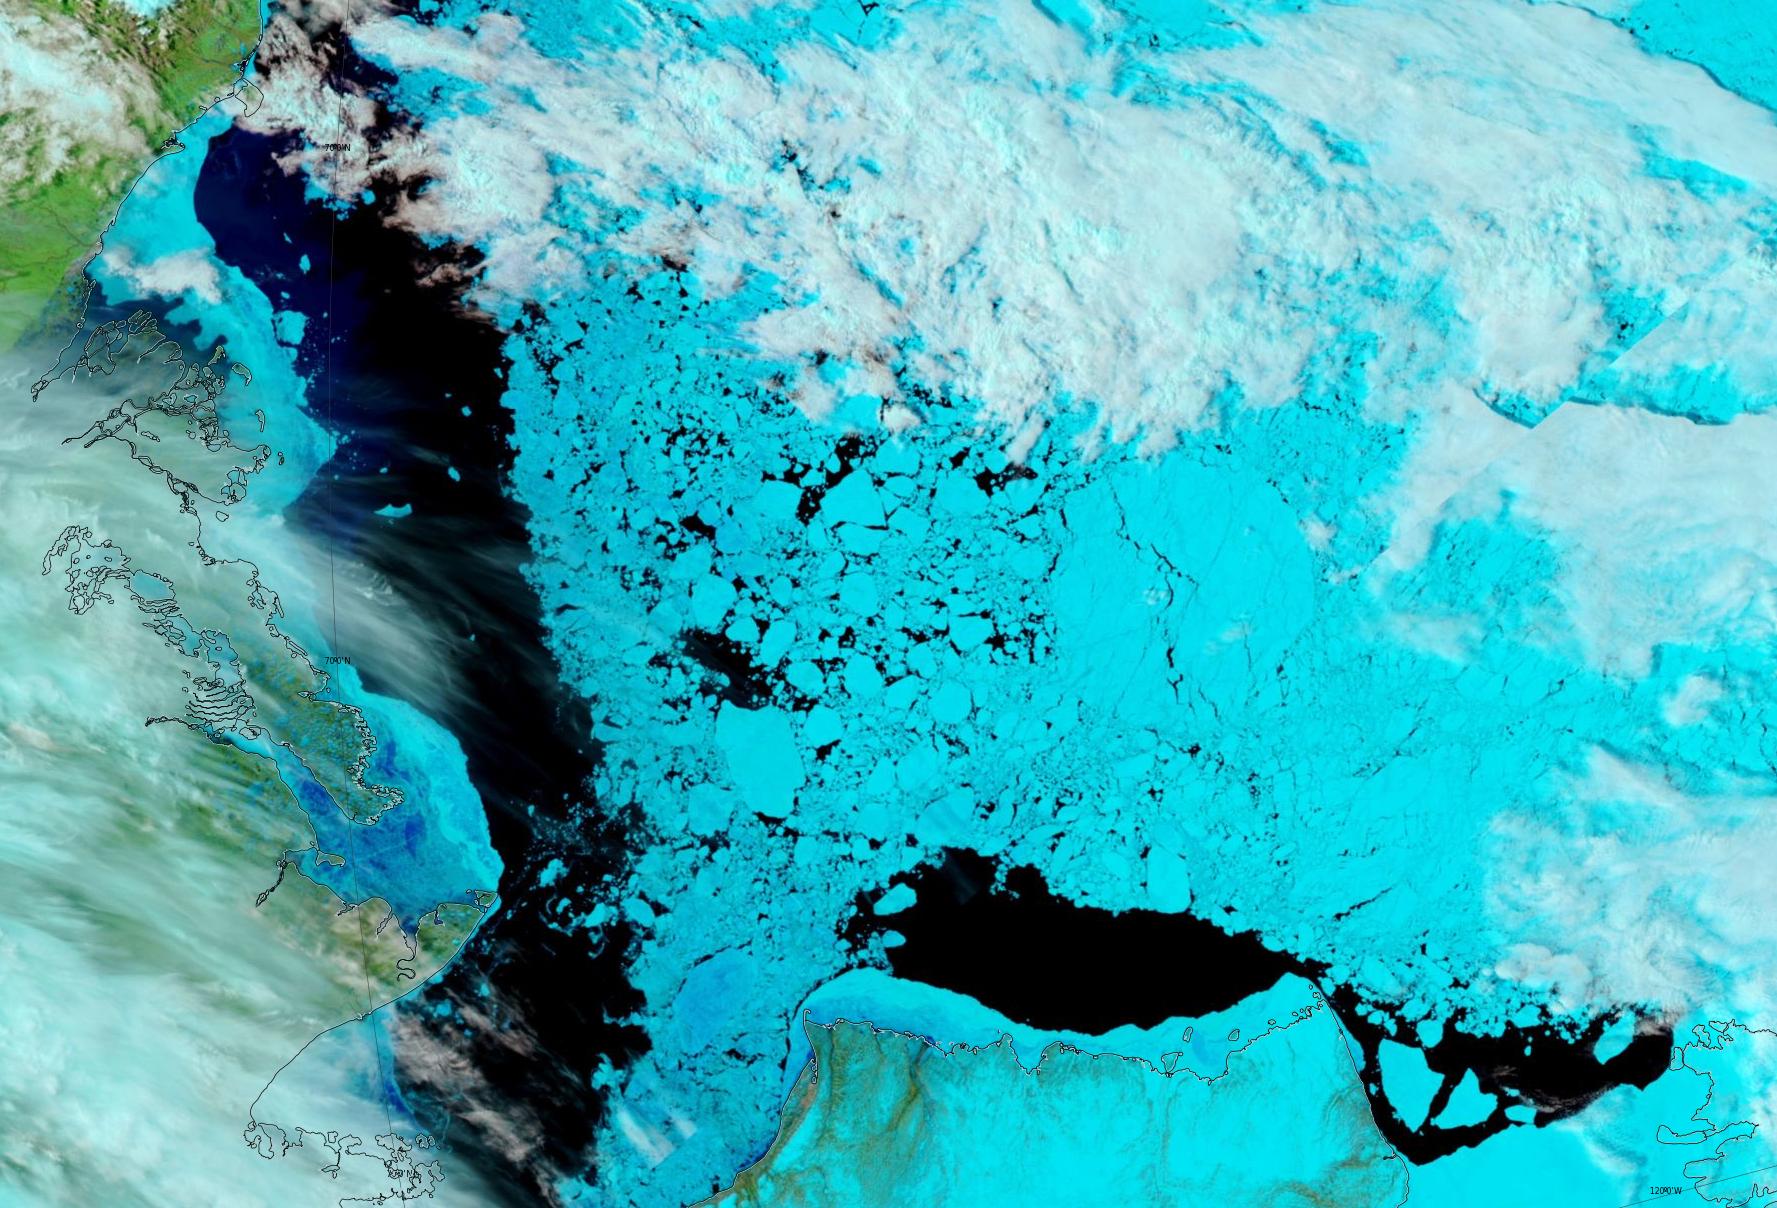
Plus yesterday’s view of the Beaufort Sea, revealing fast ice breaking up in the western entrance to the McClure Strait:
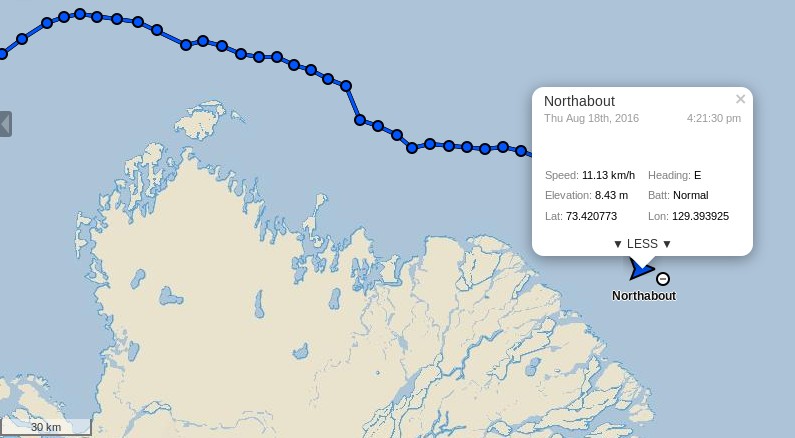
[Edit – June 18th]

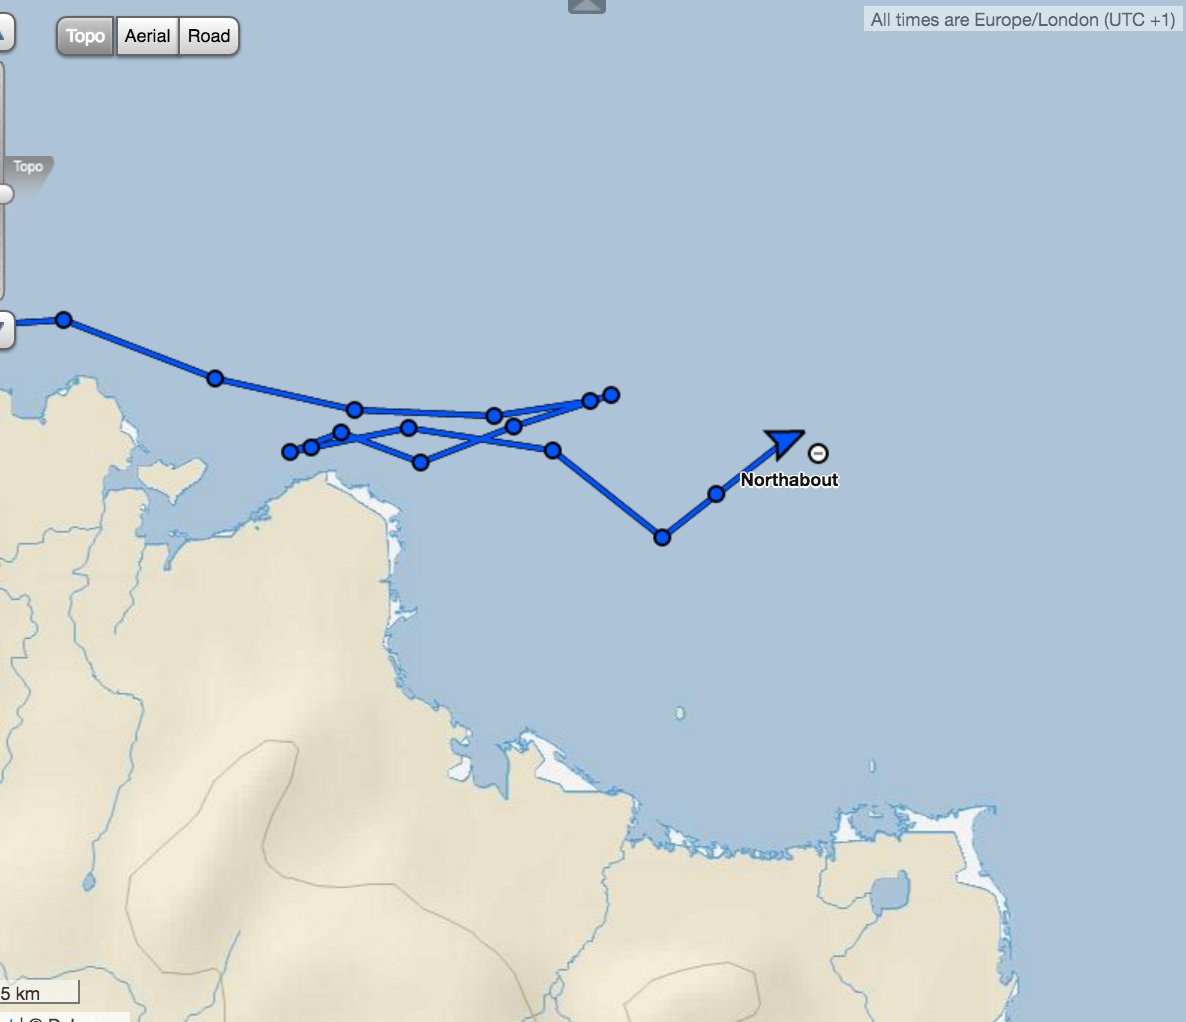
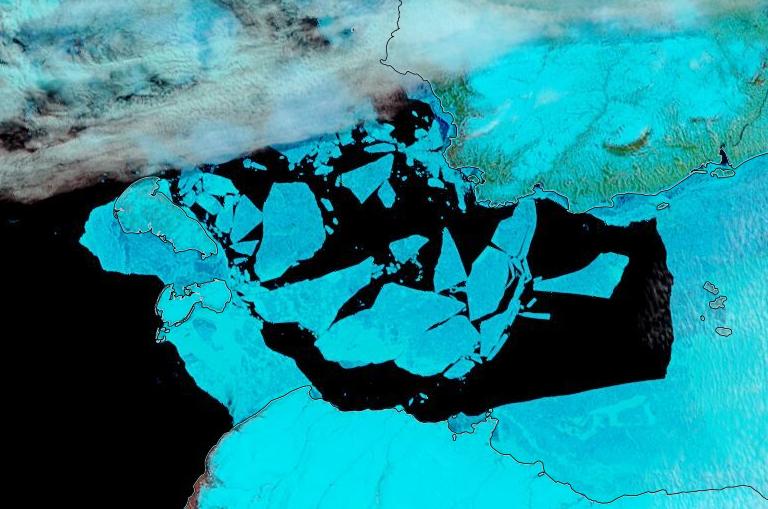
A clearish view of the Laptev Sea today, revealing assorted cracks in a variety of locations:

[Edit – June 20th]

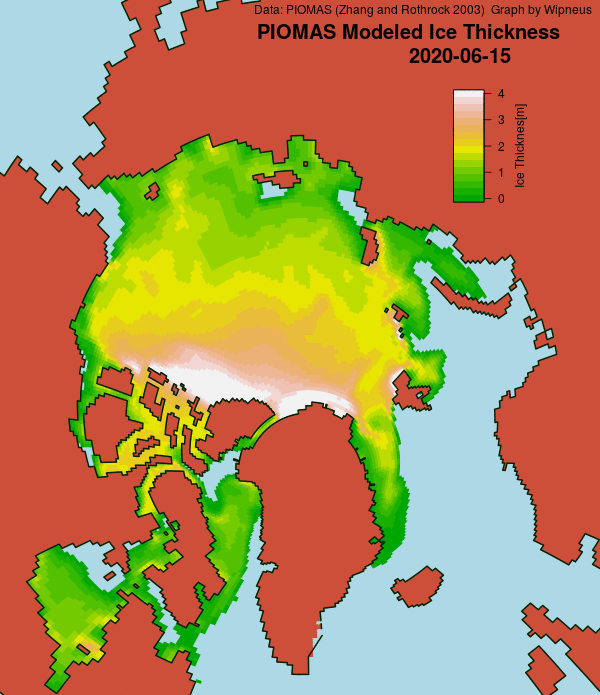
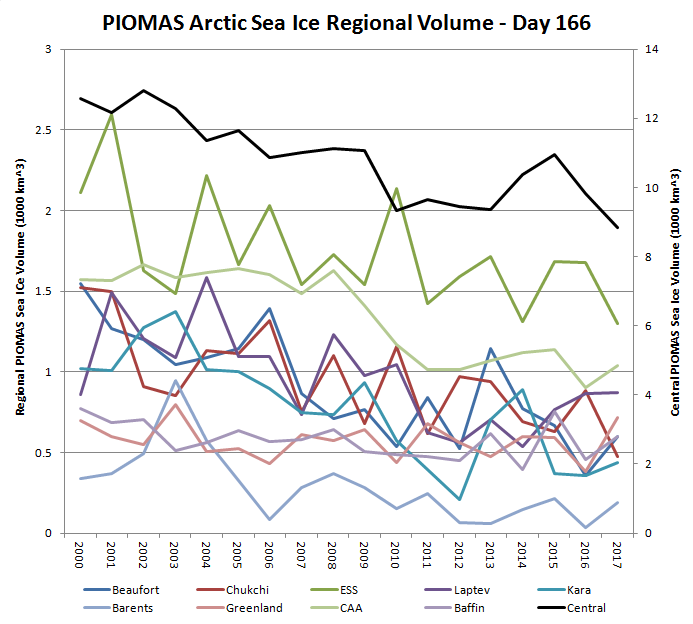
The latest mid-month PIOMAS thickness/volume numbers have been released:

[Edit – June 23rd]

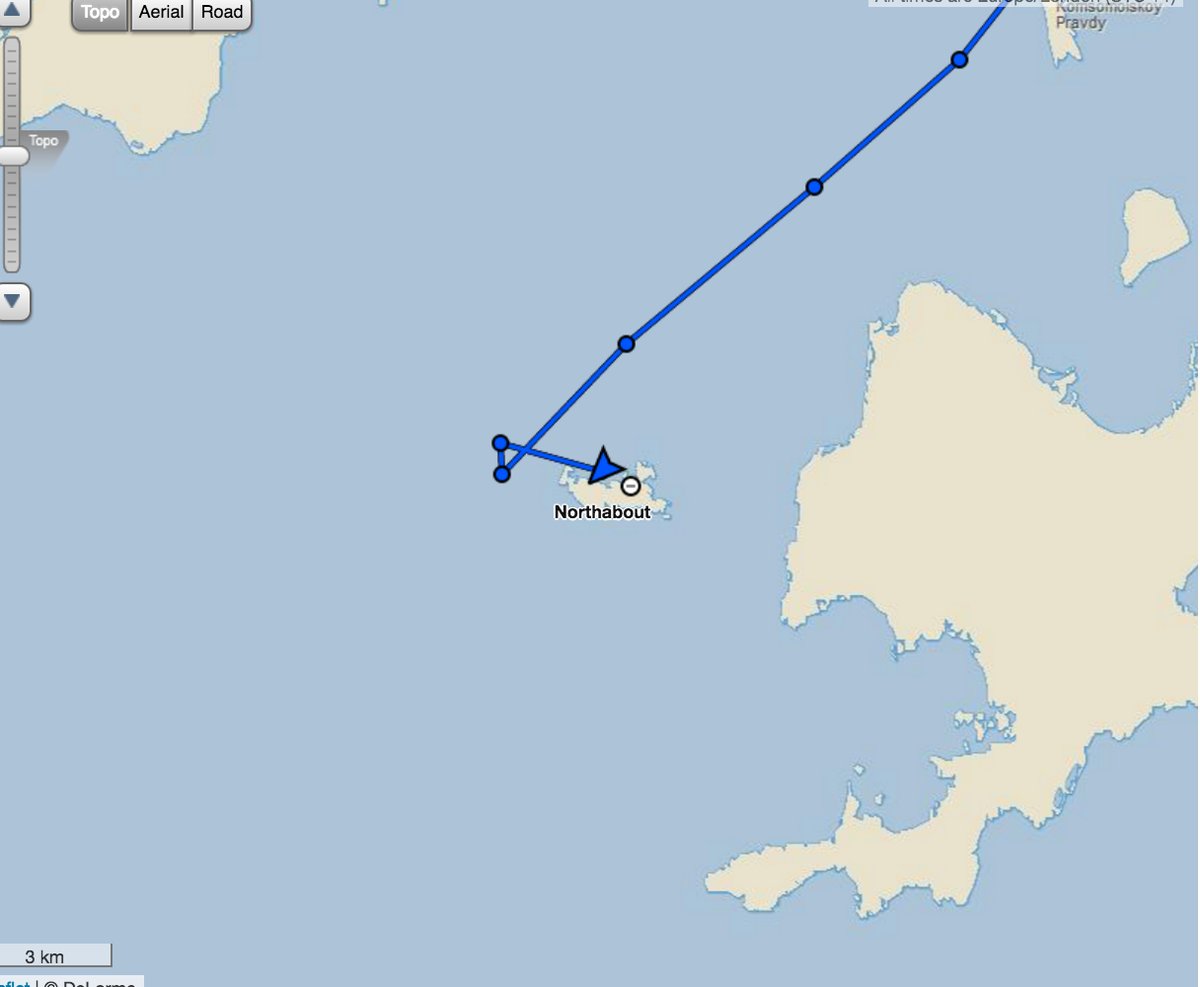
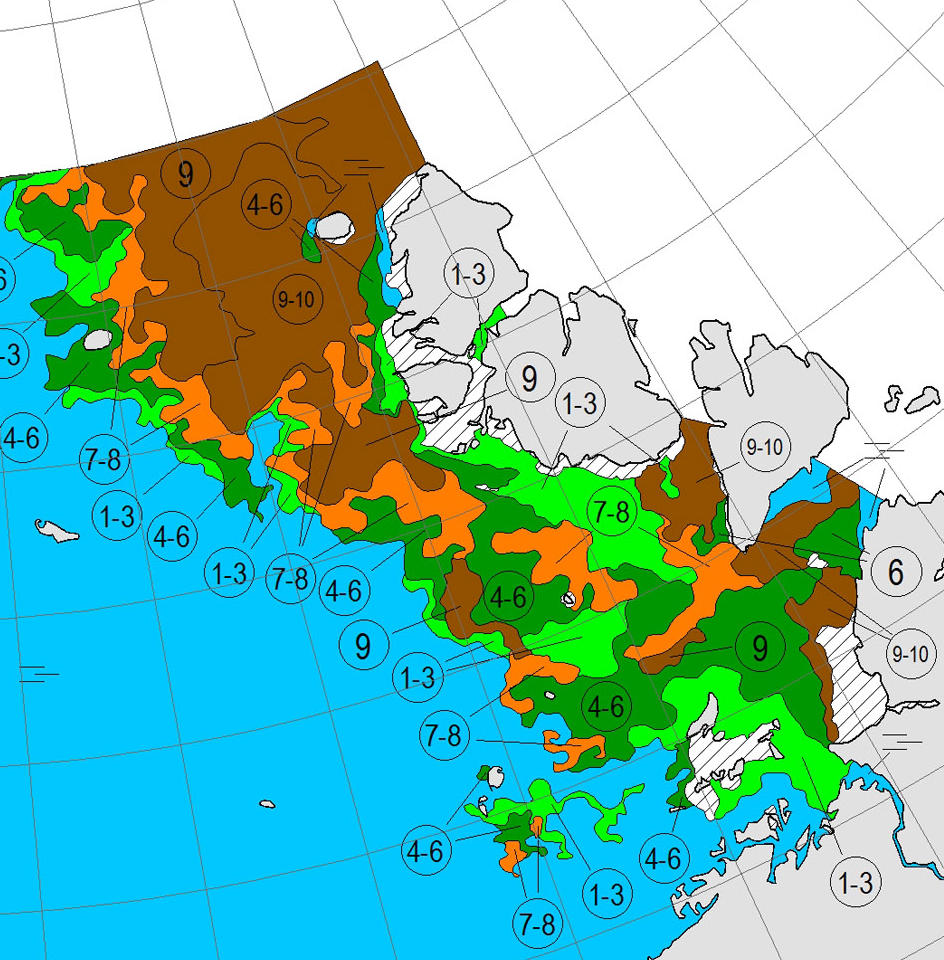
The skies over the Vilkitsky Strait have been cloudy for a few days. However a fairly clear view yesterday reveals that breakup is well under way in what is usually one the last areas along the Northern Sea Route to become navigable:

[Edit – June 26th]

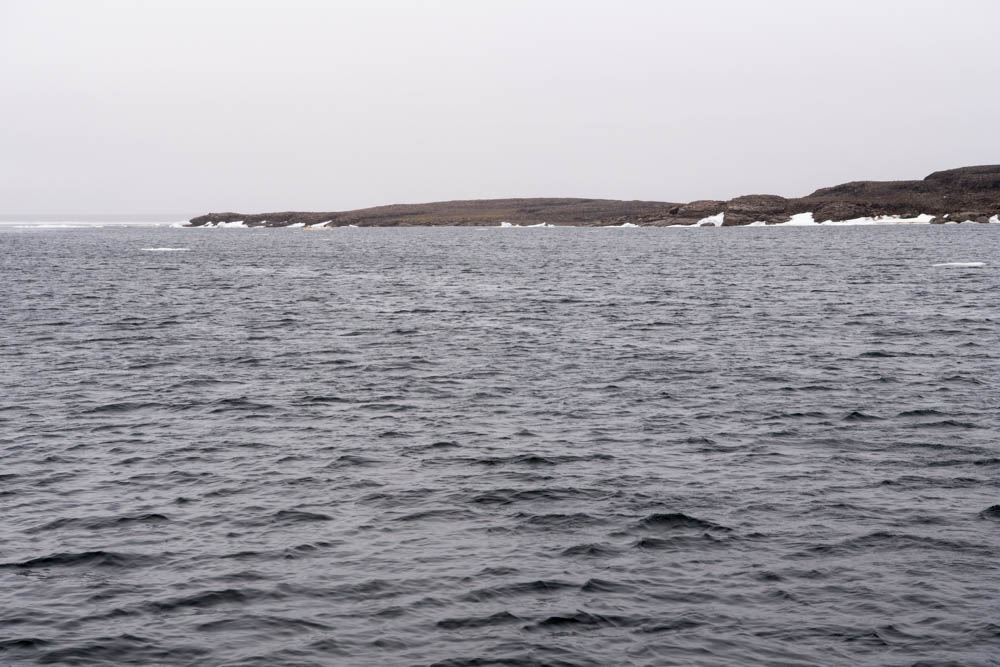
The land-fast ice in the East Siberian Sea has started to disintegrate en masse:

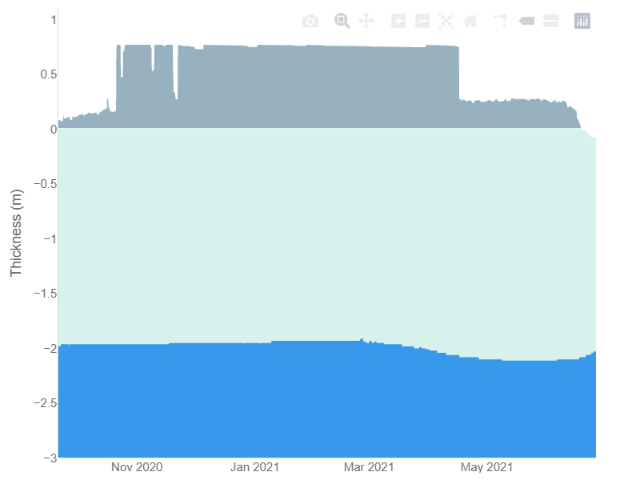
Data from ice mass balance buoy 441910, currently located at 76.1 N, 151.1 W in the Beaufort Sea, reveals the onset of both surface and bottom melt:

Watch this space!

Month in Review – Arctic Science Edition

Inspired by my recent visits to Judith Curry’s blog this post will bring you links to the latest learned journal articles about Arctic sea ice. Together with occasional excursions into older and wider Arctic papers.

Judith’s “Week in Review” articles seem to last for a month, so this one will probably last for at least a year!

First up is an article apparently written by a regular reader of this humble web site! A University of Alaska article at phys.org begins:

In August 2016 a massive storm on par with a Category 2 hurricane churned in the Arctic Ocean. The cyclone led to the third-lowest sea ice extent ever recorded. But what made the Great Arctic Cyclone of 2016 particularly appealing to scientists was the proximity of the Korean icebreaker Araon.

For the first time ever, scientists were able to see exactly what happens to the ocean and sea ice when a cyclone hits. University of Alaska Fairbanks researchers and their international colleagues recently published a new study showing that sea ice declined 5.7 times faster than normal during the storm. They were also able to prove that the rapid decline was driven by cyclone-triggered processes within the ocean.

Note that it didn’t take us 5 years to write about the cyclone in question. Our article catchily entitled “The Great Arctic Cyclone of 2016” was published on August 13th 2016:

A storm is brewing in the Arctic. A big one! The crew of the yacht Northabout are currently sailing along the western shore of the Laptev Sea and reported earlier today that “The sea is calm. Tomorrow a gale 8. But this moment is perfect”.

That perfect moment will not last long.

I interviewed polar explorer David Hempleman-Adams about the succeeding moments once Northabout had returned to the UK. It seems riding out the cyclone was the most frightening experience he had ever had.

The University of Alaska article references the following peer reviewed paper:

Role of Intense Arctic Storm in Accelerating Summer Sea Ice Melt: An In Situ Observational Study

The next on my list of must read papers comes complete with a video:

Continue reading Month in Review – Arctic Science Edition

Facts About the Arctic in May 2021

It’s May Day 2021, and just for a change we’re going to start the month off with a pretty picture!

Parts of the Laptev Sea are starting to look distinctly “warm” in the infra-red. Here’s a “false colour” image taken by the Terra satellite during a gap in the clouds:

We have reached the time of year when the SMOS “thin ice thickness” readings start being affected by surface melt, but let’s take a look anyway:

That area of the Laptev certainly appears to be either thin or melting.

Meanwhile on the Canadian side of the Arctic the fast ice off the Mackenzie Delta is starting to get damp, even though the river itself still looks to be fairly well frozen:

It will also be interesting to follow the progress of this large floe as it heads towards oblivion through the Fram Strait:

Continue reading Facts About the Arctic in May 2021

Facts About the Arctic in June 2020

As is our current habit this month’s report begins with the high resolution Arctic sea ice area and extent graphs based on the University of Hamburg’s AMSR2 concentration maps:

Area and extent are currently vying for second place with 2019 on the “lowest for the date” leader board, a little behind 2016 at this point in the 2020 melting season.

However following the extremely warm spring in Siberia, the sea ice area along the assorted sea that comprise the Northern Sea Route is well below all previous years in the AMSR2 record:

Another effect of the sweltering Siberian spring is evident in the melt ponds visible below the clouds across the southernmost parts of the Laptev Sea:

NASA Worldview “false-color” image of the Laptev Sea on June 1st 2020, derived from the MODIS sensor on the Aqua satellite

plus the East Siberian Sea and Chaunskaya Bay:

NASA Worldview “false-color” image of the East Siberian Sea on June 1st 2020, derived from the MODIS sensor on the Terra satellite

[Edit – June 4th]

The May 31st PIOMAS gridded thickness numbers have been released, and Wipneus has crunched the numbers:

Here too is the latest volume graph:

According to the Polar Science Center’s May 2020 update:

Average Arctic sea ice volume in May 2020 was 21,500 km3. This value is 1700 km3 above the record minimum value of 19,800 km3 set in 2017, making it the sixth lowest on record. Monthly ice volume was 39% below the maximum in 1979 and 25% below the mean value for 1979-2019. May 2020 ice volume falls 0.8 standard deviations above the trend line. Daily volume anomalies for May progressed at a fairly normal pace for recent years. Average ice thickness is in the middle of the pack for the more recent years. Ice thickness anomalies for May 2020 relative to 2011-2018 continue the April pattern and show relatively thin ice along the Russian Coast and thicker than normal sea ice in the Barents sea. There are some fairly strong positive anomalies in the eastern Beaufort and north of Greenland. This anomaly pattern is likely due to the very strong positive Arctic-Oscillation index pattern that occurred during the Winter of 2020.

There looks to be a lot of anomalously thick ice waiting to melt out on the Atlantic periphery, and it will be interesting to see how the thicker ice in the eastern Beaufort Sea fares as the melting season progresses.

As also suggested by the area graph above, the Northern Sea Route is going to be open early in 2020. In fact a ice hardened tanker has already begun its journey through, unsupported by an icebreaker:

It was the “Christophe de Margerie” that on the 19th May kickstarted this year’s shipping season across the eastern part of the Northern Sea Route. The vessel owned and operated by Russian shipping company Sovcomflot loaded up liquefied natural gas in Sabetta and is due to arrive in the Chinese port of Jingtang on the 11th June. It was the earliest east-bound shipment on the route ever for this kind of vessel.

Shipments in the Northern Sea Route 27th May 2020. Map by MarineTraffic

By 27th May, the ship had made it almost to Wrangel Island, information from ship tracker service MarineTraffic shows. The “Christophe de Margerie” is accompanied by nuclear powered icebreaker “Yamal”.

In the wake of the almost 300 meter long vessel now follows the “Vladimir Voronin”, a vessel that is operated by company Teekay. The “Vladimir Voronin” on the 25th May left Sabetta and was on May 27th located in the Vilkitsky Strait north of the Taymyr Peninsula.

The ”Vladimir Voronin” is not accompanied by icebreaker. The “50 Let Pobedy” that escorted the ship out of Sabetta and eastwards towards the Vilkitsky Strait has now returned and appears to be on its way back to Sabetta.

[Edit – June 17th]

The mid month PIOMAS gridded thickness numbers have just been released. Here’s the thickness map:

and the volume graph:

In addition JAXA extent is now in a “statistical tie” with 2019 in the “lowest for the date” competition:

Watch this space!

Facts About the Arctic in June 2019

In my humble opinion summer in the Arctic summer starts on June 1st, so let’s check the current sea ice situation in the once frozen North. For details of the preconditioning of the ice during the Arctic spring see “Melt Pond May“, where I concluded that:

Compared with 2016 at the same time of year I am compelled to say that with June 1st just around the corner the 2019 summer melting season is primed to progress more quickly.

Currently extent is significantly below 2012, albeit somewhat above 2016 at the same time of year. And what of melt ponds? In 2012 there was evidence of less snow cover over land and more surface water on the ice on the Siberian side of the Arctic. Other than that Arctic sea ice in 2019 looks to be in worse shape than in 2012.

And how have things progressed over the last few days? Take a look at this:

Our “Arctic Basin” metric encompasses the Central Arctic plus the Beaufort, Chukchi, East Siberian and Laptev Seas. It is currently headed into uncharted waters. The effect on overall Arctic sea ice extent is also readily visible:

This year both the CPOM version of CryoSat-2 thickness and the University of Bremen’s SMOS thickness maps are continuing to be published during the melting season:

Take them with a large pinch of salt at this time of year!

Finally, for the moment at least, liquid water is starting to seep out of the Lena Delta:

NASA Worldview “false-color” image of the Lena Delta on June 3rd 2019, derived from the MODIS sensor on the Aqua satellite

For comparison purposes please also take a look at the same date in 2016:

NASA Worldview “false-color” image of the Lena Delta on June 3rd 2016, derived from the MODIS sensor on the Aqua satellite

and the previous date in 2012:

NASA Worldview “false-color” image of the Lena Delta on June 2nd 2012, derived from the MODIS sensor on the Aqua satellite

[Edit – June 4th]

A significant area of the Laptev Sea ice is now turning a much darker shade of blue using the band 7-2-1 false colour combination:

NASA Worldview “false-color” image of the Laptev Sea on June 4th 2019, derived from the MODIS sensor on the Terra satellite

In addition the DMI >80N temperature metric has reached the zero Celsius line well ahead of schedule:

[Edit – June 5th]

The May PIOMAS numbers have been released! Here is the Wipneus generated state of play on May 31st:

and here is the all too familar multi-year graph:

[Edit – June 10th]

As reported in this year’s Northwest Passage article:

Any early bird traversing the Northwest Passage from west to east could now sail through open water around Point Barrow, along the Alaskan and Canadian coast and into the Amundsen Gulf:

Arctic Basin sea ice extent is still descending through uncharted territory:

and Basin area currently looks poised to follow suit:

[Edit – June 11th]

There’s a beautifully clear view of the Siberian coast today, with vast areas of melt ponds visible on VIIRS false colour:

NASA Worldview “false-color” image of the Laptev & East Siberian Seas on June 11th 2019, derived from the VIIRS sensor on the Suomi satellite

The Arctic Basin area has indeed taken a nosedive into uncharted territory:

By way of comparison sea ice area on the Atlantic periphery is in amongst the recent pack, thanks to the almost continual drift in that direction over last winter:

[Edit – June 13th]

High resolution AMSR2 extent has been in a “statistical tie” with 2016 for a few days:

However the NSIDC’s 5 day average extent has reached a clear new low for the date, in the satellite record at least:

[Edit – June 14th]

Especially for AJBT, here’s the Slater Probabilistic Ice Extent prediction for August 3rd:

and here’s the current DMI >80N temperature graph:

Finally, for the moment at least, there is not very much fast ice left at Utqiaġvik:

[Edit – June 15th]

The sea ice in the Laptev Sea is starting to break up:

NASA Worldview “false-color” image of the Laptev Sea on June 15th 2019, derived from the MODIS sensor on the Terra satellite

As is the fast ice in the Beaufort Sea:

NASA Worldview “false-color” image of the Beaufort Sea on June 14th 2019, derived from the MODIS sensor on the Terra satellite

Meanwhile the MSLP of the cyclone currently spinning over Severnaya Zemlya was down to 976 hPa at 06:00 UTC this morning:

NASA Worldview “false-color” image of the Kara Sea on June 15th 2019, derived from the MODIS sensor on the Terra satellite

An early morning image from the Utqiaġvik webcam:

Especially for Mateo (see below) here’s the current high resolution Arctic Basin sea ice area:

and extent:

Note that the recent cyclones have caused a temporary jump in sea ice extent, but not in area.

[Edit – June 17th]

The Lincoln Sea has turned noticeably bluer on MODIS bands 7-2-1 false colour:

NASA Worldview “false-color” image of the Lincoln Sea on June 17th 2019, derived from the MODIS sensor on the Aqua satellite

[Edit – June 19th]

The sea ice off the Lena Delta has started to collapse:

NASA Worldview “false-color” image of the Laptev Sea on June 19th 2019, derived from the MODIS sensor on the Aqua satellite

Meanwhile the clear water off Point Barrow is opening up further:

Finally, for the moment at least, here is the current view from the Utqiaġvik (Barrow as was) sea ice webcam:

P.S. The mid month PIOMAS numbers have been released, and Wipneus has worked his usual magic:

2019 sea ice volume is currently in a “statistical tie” with 2012, in 2nd place behind 2017:

[Edit – June 22nd]

The fast ice in the Vilkitsky Strait has started to break up:

NASA Worldview “false-color” image of the Vilkitsky Strait on June 22nd 2019, derived from the MODIS sensor on the Terra satellite

Sea Ice area along the Northern Sea Route is currently the lowest for the date in the AMSR2 ere:

In addition the June 2019 Sea Ice Prediction Network report has been released. Here’s the summary:

Again, as in previous years, the spread in the dynamical models are larger compared with statistical models. Overall, the heuristic method has the lowest projected September sea-ice extent value with a median at 4.09 million square kilometers, and the dynamical models have the highest number with the median at 4.56 million square kilometers.

[Edit – June 23rd]

Arctic wide sea ice area is now lowest for the date in the high resolution AMSR2 record, although extent has yet to follow suit:

If you exclude the peripheral seas, which are all largely ice free by mid September in this day and age, the picture is extremely stark:

A brief glimpse through the clouds reveals that the North Pole is now starting to feel the recent heat:

NASA Worldview “false-color” image of the North Pole on June 22nd 2019, derived from the MODIS sensor on the Terra satellite

[Edit – June 27th]

Arctic wide sea ice extent is now lowest for the date in the high resolution AMSR2 record:

Here’s Arctic wide sea ice area, which is still well below the rest of the pack:

[Edit – June 29th]

As the end of the month draws near let’s take a look at sea ice area along a couple of the famous sea routes above the Arctic Circle. First of all here’s the Northern Sea Route, comprising the Kara, Laptev, East Siberian and Chukchi Seas:

Next here’s the Northwest Passage, comprising the Chukchi and Beaufort Seas plus the channels of the Canadian Arctic Archipelago and Baffin Bay:

For completeness here too are the current Arctic wide area and extent numbers:

Watch this space!

The Great Arctic Cyclone of 2018?

Our title for today refers back to the Great Arctic Cyclone of August 2012. There has been some speculation over on the Arctic Sea Ice Blog about whether a similar event is about to occur this year.

It’s later in the season of course, but as is our wont we always look at the waves first. Here is the current WaveWatch III forecast for the evening of August 31st UTC:

Significant_height_of_combined_w in multi_1.glo_30mext.20180827_00039

Mean_period_of_swell_waves_order in multi_1.glo_30mext.20180827_00039

In summary the forecast shows some very large waves with a substantial period for inside the Arctic Circle directed straight at the ice edge. Let’s follow the forecast over the next few days carefully shall we?


[Edit – August 30th]

The latest wave forecast for tomorrow evening isn’t as extreme as 3 days ago. Note the change in the significant height scale:

Significant_height_of_combined_w in multi_1.glo_30mext.20180830-06Z_00013

Mean_period_of_swell_waves_order in multi_1.glo_30mext.20180830-06Z_00013

Nonetheless the height and period are still very significant!


[Edit – August 31st]

Here’s the latest forecast for 6 PM this evening (UTC):

Significant_height_of_combined_w in multi_1.glo_30mext.20180831_00007

Mean_period_of_swell_waves_order in multi_1.glo_30mext.20180831_00007

Note how the open water across almost the entire map is full of what in the Arctic counts as a long period swell. That means that the forecast for 2 days later looks like this:

Mean_period_of_swell_waves_order in multi_1.glo_30mext.20180831_00023

Significant_height_of_combined_w in multi_1.glo_30mext.20180831_00023

Less height but with a longer period. All of which means that the sea ice north of the Atlantic Ocean isn’t about to receive a short sharp shock. It has a sustained battering lasting several days to look forward to.


[Edit – September 1st]

The barrage of assorted swells has begun. Here’s the “hindcast” from midnight last night UTC:

Significant_height_of_combined_w in multi_1.glo_30mext.20180901_00001

Mean_period_of_swell_waves_order in multi_1.glo_30mext.20180901_00001

Now lets take a look at tomorrow’s forecast for the Laptev Sea. This is for 09:00 UTC:

Significant_height_of_combined_Laptev.20180901_00012

Mean_period_of_swell_waves_Laptev.20180901_00012

Note once again the change of scale on the wave/swell height map. Nevertheless a 3+ meter swell heading over into the East Siberian Sea isn’t something you see every day.

Now were into September the 2018 annual minimum extent can’t be too far away. Extent decline appears to have stalled. However “high res” AMSR2 area is currently falling fast, for the time of year at least:

Arctic-Area-2018-08-31


[Edit – September 2nd]

Here are the swell and period forecasts at midnight for round about now, 09:00 UTC:

Significant_height_of_combined_Laptev.20180902_00004

Mean_period_of_swell_waves_Laptev.20180902_00004

Significant_height_of_combined_Barents.20180902_00004

Mean_period_of_swell_waves_Barents.20180902_00004

All the seas between Greenland and the New Siberian Islands are awash with swells with a period of 8 second or greater. This is most unusual, to put it mildly!


[Edit – September 3rd]

Here’s the WaveWatch III “hindcast” from midnight last night UTC for the Russian side of the Arctic Ocean:

Significant_height_of_combined_NSR.20180903_00001

Mean_period_of_swell_waves_NSR.20180903_00001

There are still significant swells almost everywhere you look.


[Edit – September 4th]

Using the same scales as yesterday, here’s today’s hindcast from midnight:

Significant_height_of_combined_w in multi_1.glo_30mext.20180904_00001

Mean_period_of_swell_waves_order in multi_1.glo_30mext.20180904_00001

There’s still plenty of action in the Arctic Ocean!


[Edit – September 5th]

Feel free to debate whether it merits the “Great” prefix, but this is how the early September 2018 Arctic cyclone has panned out. According to this morning’s Environment Canada synopsis the cyclone is centred near the coast of the Laptev Sea and is down to a MSLP of 977 hPa:

CMC_SLP-20180905-00Z

Here’s another WaveWatch III hindcast from midnight UTC:

Significant_height_of_combined_w in multi_1.glo_30mext.20180905_00001

Mean_period_of_swell_waves_order in multi_1.glo_30mext.20180905_00001


[Edit – September 6th]

Need I say more?

Significant_height_of_combined_NSR.20180906_00001

Mean_period_of_swell_waves_NSR.20180906_00001


[Edit – September 7th]

The swell in the Fram Strait an Barents Sea is diminishing, but the period in the Laptev Sea is increasing now:

Significant_height_of_combined_NSR.20180907_00001

Mean_period_of_swell_waves_NSR.20180907_00001


[Edit – September 8th]

All the wave activity in the Laptev Sea is diminishing. Here’s the hindcast from midnight:

Significant_height_of_combined_NSR.20180908_00001

Mean_period_of_swell_waves_NSR.20180908_00001

Meanwhile things are warming up in the Chukchi and Beaufort Seas. Here’s the forecast for midnight tonight:

Significant_height_of_combined_Pacific.20180908_00009

Mean_period_of_swell_waves_Pacific.20180908_00009


[Edit – September 9th]

Here’s the hindcast for this morning’s swell in the Beaufort Sea:

Significant_height_of_combined_Atlantic.20180909_00001

Mean_period_of_swell_waves_Pacific.20180909_00001

This is currently a long way into the future and hence may not verify in practice. However any pulse of swell is currently forecast for September 13th:

Significant_height_of_combined_Atlantic.20180909_00047

Mean_period_of_swell_waves_Pacific.20180909_00047

Could Northabout Circumnavigate Greenland in 2018?

Our regular reader(s) may recall our extended coverage on the plucky little yacht Northabout‘s ultimately successful attempt to circumnavigate the Arctic Ocean in the summer of 2016?

Many were the skeptics who said she stood no chance of finding a way through some “thick sea ice” apparently blocking her path across the Laptev Sea, but they were proved wrong:

As a thought experiment in the summer of 2018 we’re now thinking the unthinkable. If she put her mind to it could Northabout circumnavigate Greenland in 2018? Let’s take a look at the evidence shall we? The allegedly “oldest, thickest Arctic sea ice” north of Greenland isn’t there any more this summer:

Nord-Aqua-721-2018-08-19

Kap-Morris-Jesup-Terra-2018-08-19

The research icebreaker Polarstern has already inspected the open waters off Kap Morris Jesup, the most northerly tip of Greenland:

Polarstern-2018-08-19-2200

What’s more the waters of the Lincoln Sea currently look no more tricky to traverse than the Laptev Sea in August 2016:

Lincoln-Terra-2018-08-19

In conclusion, for the moment at least, what’s the theoretical solution to our 2018 thought experiment?

Here’s another thought to ponder as well. I don’t suppose it’s in the Alfred Wegener Institute’s PS115 mission plan, but do you suppose Polarstern could circumnavigate Greenland at the moment?


[Edit – August 23rd]

The University of Bremen used not to publish their Arctic sea ice “thinness” maps in summer. However now they do, so here’s a close up of Northern Greenland for August 22nd:

SMOS-Zoom-20180822


[Edit – August 26th]

First of all here’s one of our occasional sea ice motion videos:

This one reveals the open water north of Greenland in February as well as the much longer event in August. Next here’s a Sentinel 1B synthetic aperture radar image of the Kap Morris Jesup area from yesterday:

S1B_MorrisJesup_20180825T1700

Meanwhile thanks to a heads up from Treform2 on the Arctic Sea Ice Forum comes evidence that on the other side of the Lincoln Sea the last remnants of the Ward Hunt Ice Shelf are “disintegrating”:

S1B_WardHunt_20180824T1442

Facts About the Arctic in June 2017

After a comparatively cool May, surface air temperatures in the high Arctic are back up to “normal”:

DMI-meanT_20170603

The condition of the sea ice north of 80 degrees is far from normal however. Here’s what’s been happening to the (normally) land fast ice north west of Greenland:

NASA Worldview “true-color” image of the sea ice north west of Greenland breaking up on June 2nd 2017

Further south surface melt has set in across the southern route through the Northwest Passage:

NASA Worldview “false-color” image of the Coronation Gulf on June 1st 2017, derived from the MODIS sensor on the Terra satellite

Whilst the gap with previous years has narrowed during May, PIOMAS Arctic sea ice volume is still well below all previous years in their records:

piomas-graph-201705

The PIOMAS gridded thickness graph suggests that a large area of thick ice is currently sailing through the Fram Strait to ultimate oblivion:

piomas_gridded_thickness_20170531

Here’s the latest AMSR2 Arctic sea ice area graph:

UH-Arctic-Area-2017-06-02

and just in case melt ponds are now affecting those numbers here is extent as well:

UH-Arctic-Extent-2017-06-02

The rate of decrease is inexorably increasing! 2012 extent is currently still well above that of 2017, but those positions may well be reversed by the end of June? Here’s NSIDC’s view on the matter:

Charctic-20170602


[Edit – June 8th]

As requested by Tommy, here’s the current Arctic Basin sea ice area:UH-Basin-Area-2017-06-07

This includes the Beaufort, Chukchi, East Siberian and Laptev Seas along with the Central Arctic. It excludes the Atlantic periphery, which currently looks like this:UH-Atlantic-Area-2017-06-07


[Edit – June 10th]

At long last a clear(ish) image of water from the Lena Delta spreading out across the fast ice in the Laptev Sea:

NASA Worldview “true-color” image of the Lena Delta on June 10th 2017, derived from the MODIS sensor on the Terra satellite

Compare and contrast with June 1st last year:

and June 10th 2012:

NASA Worldview “true-color” image of the Lena Delta on June 10th 2012, derived from the MODIS sensor on the Terra satellite


[Edit – June 11th]

DMI’s daily mean temperature for the Arctic area north of the 80th northern parallel has reached zero degrees Celsius almost exactly on the climatological schedule:

DMI-meanT_20170610

We calculate our freezing degree days on the basis of the freezing point of Arctic sea water at -1.8 degrees Celsius. On that basis this winter’s grand total of 3740 was reached on June 1st:

DMI-FDD-20170531

Despite the “coolish” recent weather total FDDs are way below the climatology and other recent years. Consequently there’s a lot less sea ice in the Arctic left to melt at the start of this Central Arctic melting season than in any previous year in the satellite record. However whilst there are some melt ponds visible in the Arctic Basin on MODIS, in that respect 2017 is lagging behind both last year and 2012.

Here’s the latest JAXA surface melt map:AM2SI20170610A_SIT_NP


[Edit – June 13th]

JAXA/IJIS/ADS Arctic sea ice extent for 2017 is now above 2012:

VISHOP_Extent-20170612

Meanwhile there are finally signs of some surface melt on the fast ice in the Laptev Sea:

NASA Worldview “false-color” image of the Laptev Sea on June 13th 2017, derived from the MODIS sensor on the Aqua satellite


[Edit – June 14th]

An animation of the latest Arctic sea ice age data from Mark Tschudi:

Further confirmation that in 2017 the older, thicker ice is gathered together on the Atlantic side of the Arctic Ocean.


[Edit – June 15th]

The Mackenzie River melt waters have now breached the fast ice off the delta:

NASA Worldview “true-color” image of the Mackenzie on June 14th 2017, derived from the MODIS sensor on the Terra satellite


[Edit – June 16th]

Thanks to the sterling work of Wipneus on the Arctic Sea Ice Forum, here’s a regional breakdown of PIOMAS Arctic Sea Ice volume for the month of May:

PIOMAS-Regions-2017-05

Note the caveat – “No checks, but the data looks plausible”.


[Edit – June 17th]

The AMSR2 data feed from the University of Hamburg suffered from a “brief hiatus” a few days ago, but is now back in action:

UH-Arctic-Area-2017-06-15

UH-Arctic-Extent-2017-06-15

Yesterday’s data still hasn’t arrived, but it certainly looks as though 2017 extent will soon drop below 2016.


[Edit – June 18th]

The PIOMAS mid month volume update has arrived. The gap between 2012 and 2017 is closing fast:

piomas-2017-D166

Here’s the regional breakdown:

PIOMAS-Regions-2017-D166


[Edit – June 23rd]

Here is the ECMWF MSLP forecast for 96 hours time:

ECMWF-20170623+96h-400

A sub 970 hPa cyclone is starting to enter the realms of realistic possibility, and also forecast are some significant waves in the Chukchi Sea and the expanding 2017 “Laptev Bite”:

Significant_height_of_combined_w in multi_1.glo_30mext.20170623_00016


[Edit – June 27th]

The forecast cyclone was nowhere near as deep as predicted. According to the analysis by Environment Canada it bottomed out at 980 hPa yesterday:

Synopsis-20170626-00Z-Crop


[Edit – June 29th]

O-Buoy 14 is currently firmly embedded in the fast ice of Viscount Melville Sound, deep in the heart of the Northwest Passage. Here’s the view from the buoy’s camera:

OBuoy14-20170629-1201

and here’s the view from space:

Melville-Terra-2017-06-29

Watch this space!

Northabout Meets Some Serious Sea Ice

Having rounded Cape Chelyuskin yesterday Northabout has now come across some serious sea ice in the Laptev Sea. The crew are posting regular updates on conditions. Here’s a recent example:

DSC_1030

Having anchored against some land-fast ice overnight Northabout is on the move once again:

Northabout-20160810

Not before indulging in some strenuous early morning exercise though!


[Edit – August 11th]

Northabout made further progress yesterday and anchored last night in the shelter of Ostrov Volodarskiy:

Northabout-20160811

There seems to have been less sea ice in attendance than the night before!

Northabout-Anchorage-20160810

Northabout is now approaching the area in which the most recent AARI forecast suggests there will be sea ice all the way to the coast:

ICEFRC_LAP_20160809_72

Will the hoped for winds have done their work by tomorrow?


[Edit – August 13th]

Northabout spent yesterday trying to find a way south. Ultimately they failed, reporting that:

The wind and sea state were really picking up. Our options were few. Wind and tide against us, really shallow water of 5m , small bergy bits in the water to miss. NO shelter whatsoever. Do we make our way back the 40 miles where we knew a good anchor spot ? At this rate it would take us 11 hours, using up precious diesel. In the end a nice large floe came into sight, so we gingerly approached, and my comrades made the boat secure. It would protect us from the sea state like a pontoon, and protect us from the mass of ice coming our way. My watch finishes at 12 and I got into my pit at 3.30am.

To our surprise, the floe was moving at 1.3 knots, so up again to move. The strong winds were driving huge belts of pack ice our way, we didn’t want to be caught up against the shore. So, off towards our anchorage, and then a nice large ‘Stamukha’ appeared. Russian for ice that has grounded on the bottom, so not moving. Another mooring. This time it felt safe, so a good couple of hours sleep,

This morning it looks like they are still anchored to that Stamukha:

Northabout-20160813-1000

Here’s a picture of their anchorage the previous night:

and moving pictures of Northabout mooring to the “stamukha”.

Here’s the latest AARI sea ice chart:

AARI-Laptev-20160812

which still shows a considerable length of the coast of the Taymyr Peninsula beset by 9/10 concentration sea ice. However Sentinel 1A imaged that coast just before midnight last night. Here’s what it revealed:

S1A_20160812T233250_Overview

S1A_20160812T233250_Closeup

So near and yet still so far for Northabout?


[Edit – August 13th PM]

Stop Press! Northabout has now passed Ostrov Andreya and turned south:

Northabout-20160813-1600

If last night’s Sentinel 1A images are to be believed the worst is now behind the Polar Ocean Challenge team, until the winds of the forthcoming “Great Arctic Cyclone” of 2016 arrive at least? Here’s the current ECMWF forecast for early Monday morning, courtesy of MeteoCiel:

ECMWF-20160813+48


[Edit – August 14th]

After inspecting a possible route to the east of Ostrov Severnyy, the crew of Northabout have decided that:

We have had to go and find shelter tonight. A huge storm on the way, and high wind, in shallow waters with masses of ice driving your way, is no place to hang around to see what might happen.

So, now at anchor, all tired, excited after today, and looking forward to the next hurdle – I think! As I write, the wind is gusting 30 knots, so clever to run for shelter.

Northabout-20160814-1000


[Edit – August 15th]

The Sentinel image from last night isn’t very clear, and today’s MODIS images are rather cloudy so here’s one from yesterday:

NASA Worldview “true-color” image of the western Laptev Sea on August 14th 2016, derived from the MODIS sensor on the Aqua satellite

It shows that the winds had already opened up a fairly ice free channel past Ostrov Severnyy, and also the smoke that Northabout’s crew reported smelling yesterday:

Staying at Anchor for another night behind Ostrov Severnyy – Air 9C water 5C 76 53N 112 E 30 knot winds from SW 15.40 UTC 22.40 local time

Well, as predicted from the Grib files, winds slowly increased throughout last night to 35 and gusting much higher. Also, as predicted, the temp rose to an amazing 17 degrees today! In the morning, I also got the distinct smell of wood smoke. Maybe a forest fire 500 miles south and the smell drifted with the wind. At one point, we slipped the anchor, so good we had an anchor watch and wise to find shelter, no ice, 7m of depth, surrounded by land but still bouncing about like a cork.

In the wake of the cyclone they are sailing south again today, apparently unhindered by sea ice:

Northabout-20160815-1630


[Edit – August 16th]

Northabout has made good progress overnight:

Northabout-20160816-1130

The skies are clear this morning over the south-west Laptev Sea:

NASA Worldview “false-color” image of the south-western Laptev Sea on August 16th 2016, derived from the MODIS sensor on the Terra satellite

The next question is which side of Ostrov Bol’shoy Begichev will Northabout pass? All the indications are that the answer will be to the east.

Whilst we wait for that to be confirmed, here is some video footage of Northabout passing Ostrov Andreya on August 13th:

P.S. Here’s the latest AARI ice chart for the Laptev Sea:

AARI-Laptev-20160815


[Edit – August 18th]

Northabout has encountered yet more sea ice. According to the “Crew Blog” of Ben Edwards:

Over night we’d sailed into ice. I know, I said we shouldn’t be troubled by ice for a bit, I was wrong. The ice on its own wasn’t too bad, the thing was we had fog as well. The fog was terrible, we could barely see five meters in front of the prow and the ice just kept on coming. After a bit the fog went, thankfully, the ice didn’t. Eight hours later when I’m back on watch we still had ice and even better, we had to divert to avoid a sandbank. Then the fog came back, typical. Luckily after another two and a half hours the ice began to clear a bit, for now.

Despite the ice, fog and sandbank Northabout is still making good progress across the Laptev Sea, and is currently sailing past the delta of the Lena River:

Northabout-20160818-1630


Previous Polar Ocean Challenge articles:

Non Fiction:

Northabout Bides Her Time

Northabout’s Great Adventure

Fiction:

Is the Polar Ocean Challenge About to End in Disaster?

Northabout Bides Her Time

The Polar Ocean Challenge team in Northabout report that they have experienced some heavy seas during their crossing of the Kara Sea:

I had an interesting watch this morning. Just crawled out of bed, rocking and rolling getting ready. I even put my second thermals on, checked the log to see what was happening. clipped on before leaving the saloon, and clipped on behind the wheel.

Just sitting down, put my leg up for stability and a wave came across the boat. Didn’t see it or hear it. For a fraction of a second, my whole body was under water, and it was only my leg stopping me going out of the side, and hopefully my tether would have stopped me going over completely.

I actually had a mouth full of sea water which was novel. Nikolai thought it was hilarious. I’m just very pleased it was me and not one of the lighter ladies.

Here’s brief video showing some slightly smaller waves:

Their live tracking map reveals that they have passed Ostrov Troynoy and are now heading east in the general direction of the Nordenskiöld Archipelago:

Northabout-2016-07-29-1000

The latest sea ice map of the north eastern Kara Sea reveals some open water in the Vilkitsky Strait, but as yet no way through for a small yacht like Northabout:

AARI_ICEANL_20160729_KARA-Crop

A bit further afield the University of Hamburg’s AMSR2 imagery reveals the current ice conditions along the rest of the Northern Sea Route:

Arc_20160728_res3.125_LARGE

All in all it doesn’t look as though Northabout’s crew will beaming videos back to us from the Laptev Sea over the next few days, but never say “never” in the Arctic!


[Edit – July 30th 2016]

Somewhat tongue in cheek David Hempleman-Adams reports from the Kara Sea:

N76 20 E083 28 Pressure 998 water temp 4 outside temp 5 cloud 6/8 sea state 3 winds 15 knots.

Making steady progress east. I always love it when we click over degree of longitude. Of course, they are pretty close together up here. ( I have been dreaming of the 180 long), for weeks.

The winds will slowly take us north east today and tomorrow. Hopefully find our island with the Palm trees and wait for the Ice to break up. Looking forward to seeing an Ice update today and see if this storm has changed anything. Fingers crossed.

Northabout-2016-07-30_0945

The Vilkitsky Strait is covered in thick clouds this morning, so here once again is the view from on high using passive microwaves:

Northabout-AMSR2-2016-07-29

Today’s sea ice update is that concentration in the Nordenskiöld Archipelago and Vilkitsky Strait seems to be falling fast. Visual confirmation of that is eagerly awaited.


[Edit – July 30th 2016 PM]

10 days out of Murmansk, and there’s visual confirmation of some sea ice at long last! An extract from today’s Polar Ocean Challenge update:

Making steady progress East. We had the latest ice charts for the Vilkitskogo straight. Still blocked and the Laptev still blocked, but big changes from the last set of charts, and encouraging.

Nikolai and Dennis are having bets. Nikolai thinks it will be free on his birthday, the 9th Aug, and Dennis on his, 6th Aug . Either way, would mean a few days rest. We are heading for a small sheltered Island. Different to the first choice, as the ice from the North has come down and blocked it, so trying for another Island closer to shore and closer to the straight. So if anything dramatic changed quickly, we would be close to react. Ie, A strong southerly taking the ice from the shore.

Saw our first ICE today on my watch, just an hour ago. What is slightly worrying, it didn’t show up on the Radar. It’s probably good for the big icebergs, but not low ice in the water. I think we will see a lot more of that before the trip is out. You can’t beat that old eyeball.

Northabout-1stIce-2016-07-30


[Edit – July 31st]

In a brief update this morning the crew of Northabout report they are:

Anchored! for rest repairs and to wait for favourable ice conditions in the NE passage and for the new ice charts. Proper shipslog update coming later with some photos (which take ages to upload) But for now we’re getting a bit of a rest & having a cuppa.

Northabout-2016-07-31_0530

They have found some shelter in the convoluted coastline of Ostrov Pilota Makhotkina, just off the shores of Siberia and within striking distance of their exit from the Kara Sea:

Makhotkina-2016-07-31_0530

As Reggie points out below, the sea ice in the Vilkitsky Strait broke up remarkably early this year. Here’s his view from June 23rd:

NASA Worldview “false-color” image of the Vilkitsky Strait on June 23rd 2016, derived from the VIIRS sensor on the Suomi satellite

and if you watch our latest Northern Sea Route animation carefully you’ll note that the ice was already mobile at the beginning of June:

In actual fact the Vilkitsky Strait never became blocked with land-fast ice last winter. Compare this ice chart from the Russian Arctic and Antarctic Research Institute for May 4th 2016:

AARI-Kara-20160504

with this one from July 2nd 2013:

AARI-Kara-20130702

Three years ago the island where Northabout is now sheltering was still encased in land fast ice at the beginning of July, as was the Vilkitsky Strait itself. By August 25th when the yacht Tara passed around Cape Chelyuskin into the Laptev Sea on her own Polar circumnavigation the Strait looked like this:


[Edit – August 1st]

The latest video from the crew of Northabout reveals them anchoring off Ostrov Pilota Makhotkina:

The skies have cleared over the Vilkitsky Strait this morning! Here’s a “false colour” image from the MODIS instrument aboard the Aqua satellite:

NASA Worldview “false-color” image of the Vilkitsky Strait on August 1st 2016, derived from the MODIS sensor on the Aqua satellite

On “true colour” images sea ice looks white, and so do clouds. Using a different set of wavelengths reveals the ice in pale blue, with the clouds still white. Northabout remains anchored, and it’s easy to see why!


[Edit – August 2nd]

The latest AARI ice charts are out, but don’t reveal a way through to the Laptev Sea for Northabout just yet:

AARI-Kara-20160802

Here’s a fairly cloud free satellite image of what lies ahead:

NASA Worldview “true-color” image of the Laptev Sea on August 2nd 2016, derived from the MODIS sensor on the Aqua satellite

The crew of Northabout report that some of that ice has made its way into their anchorage:

Whilst at anchor we have a respite from our normal watch routine and it is replaced with Anchor Watch, which is an hour and half slot, mine is from 12.30am to 2am. The other crew and Northabout are in a deep slumber, perfect quiet interspersed with gentle snoring from contented crew! Last night was an exception, as the wind picked up and changed direction, resulting in some bits of drifting ice coming into the bay, ‘crashing’ into the boat at about 4am, giving all the crew an alarming wake up call. There was no danger, it was simply the deafening noise of ice and aluminium in the still of the night! Dennis was soon on the job with the ice poles, keeping all at bay!


[Edit – August 8th]

As Bill points out below, Northabout is now heading in the direction of Vilkitsky Strait:

Northabout-20160808-1700

Perhaps they’ve had an early look at the latest AARI ice charts of the Laptev Sea? The Northern Sea Route Administration web site is still displaying the ones from August 5th, which showed the route blocked by 9/10 ice coverage in places:

AARI-Laptev-20160805

Satellite imagery at visual frequencies is rather cloudy again today:

NASA Worldview “false-color” image of the Laptev Sea on August 8th 2016, derived from the VIIRS sensor on the Suomi satellite

but there’s still no obvious way through to the East Siberian Sea that I can see.


[Edit – August 9th]

Northabout has just rounded Cape Chelyuskin and is now heading into the Laptev Sea!

Northabout-20160809-1750

Here’s the new ice chart for the Laptev Sea:

AARI-Laptev-20160809

A navigable strip does seem to be opening up around the coast, but there’s still a stubborn patch of 9/10 concentration sea ice blocking Northabout’s way.


Previous Polar Ocean Challenge articles:

Non Fiction:

Northabout’s Great Adventure

Fiction:

Is the Polar Ocean Challenge About to End in Disaster?