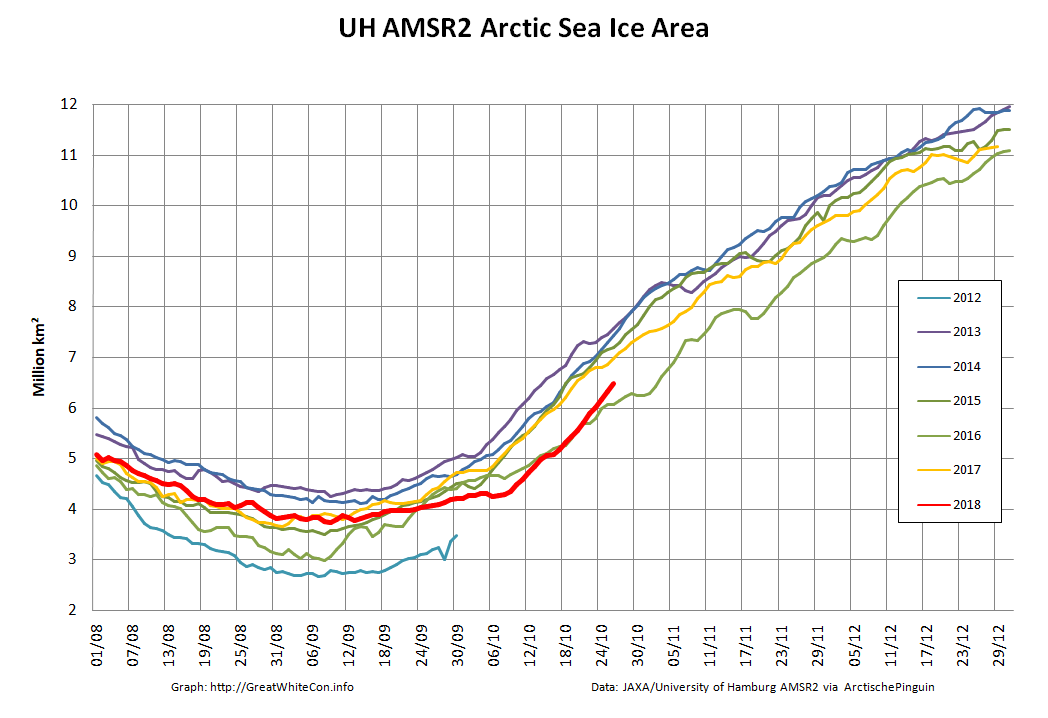
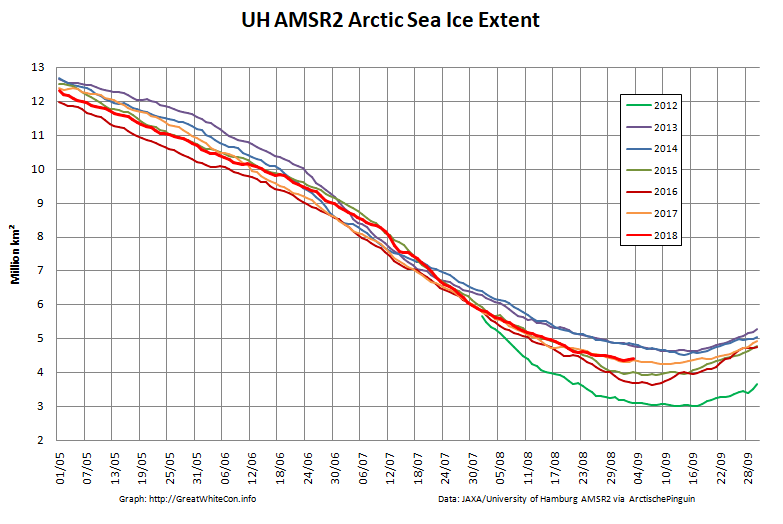
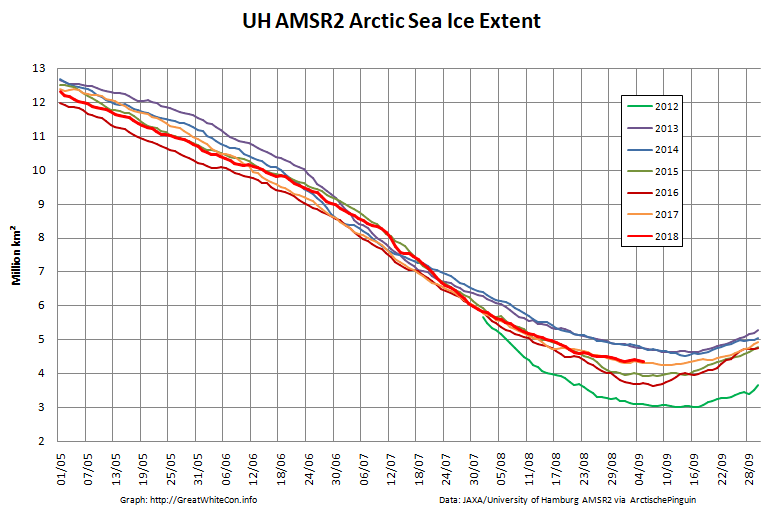
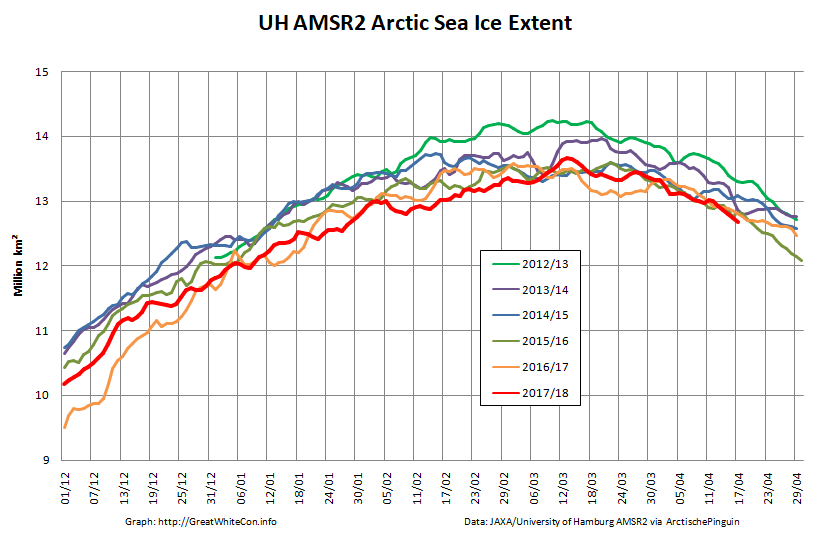
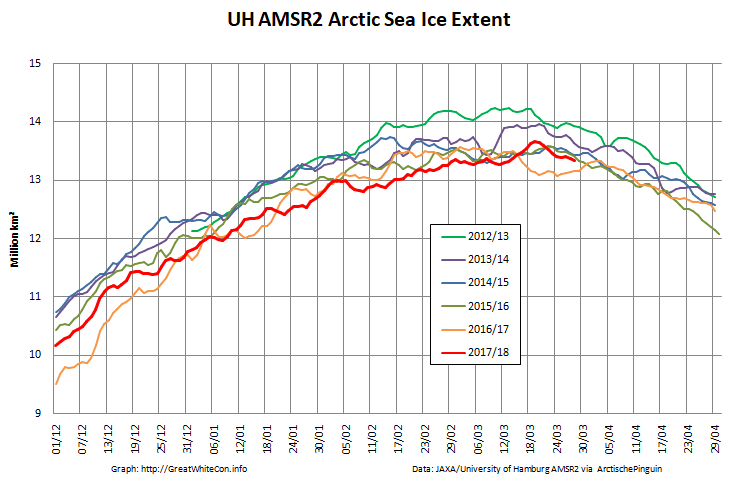
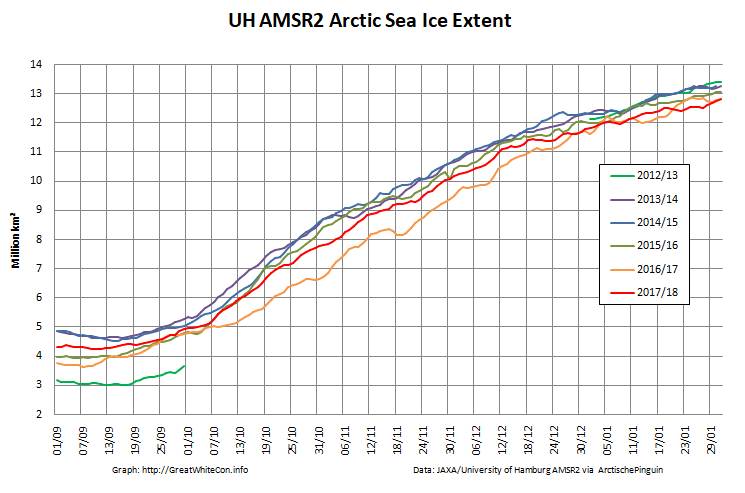
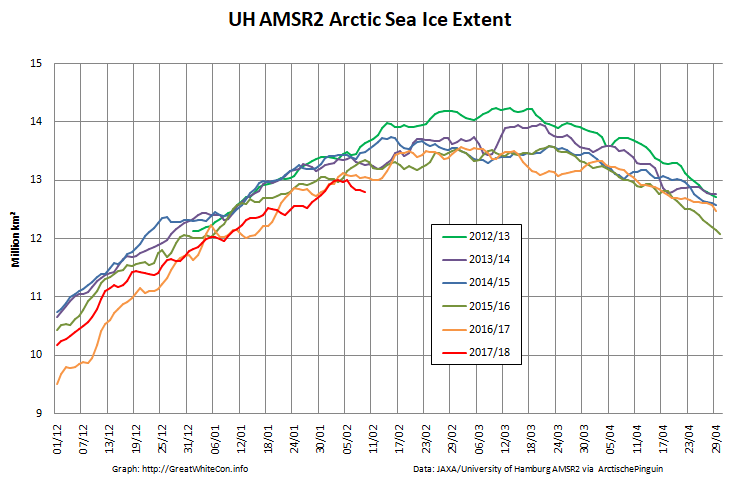
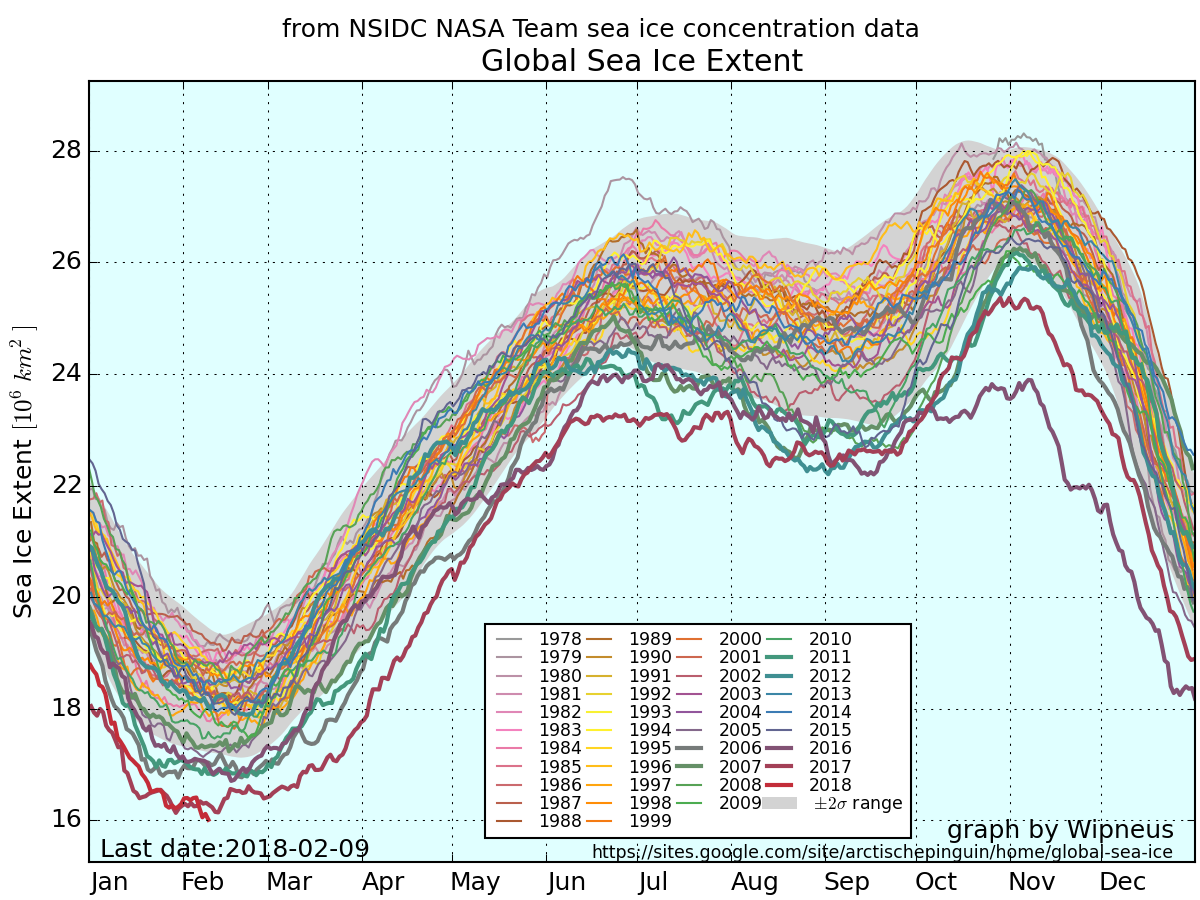
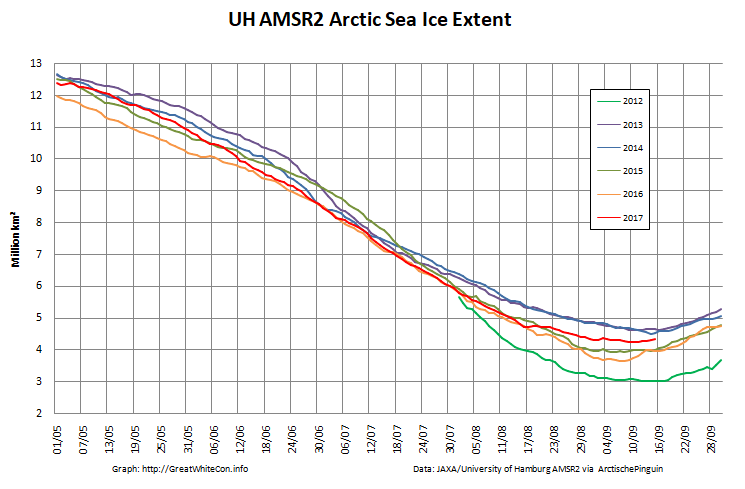
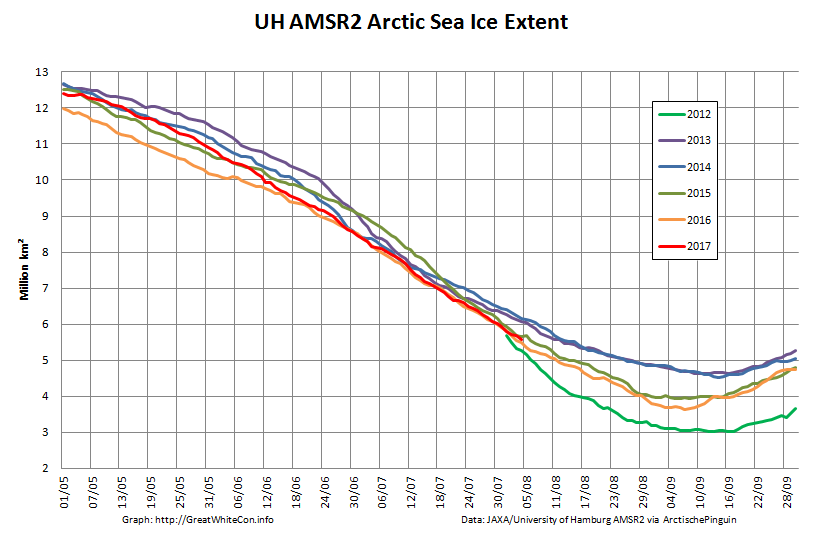
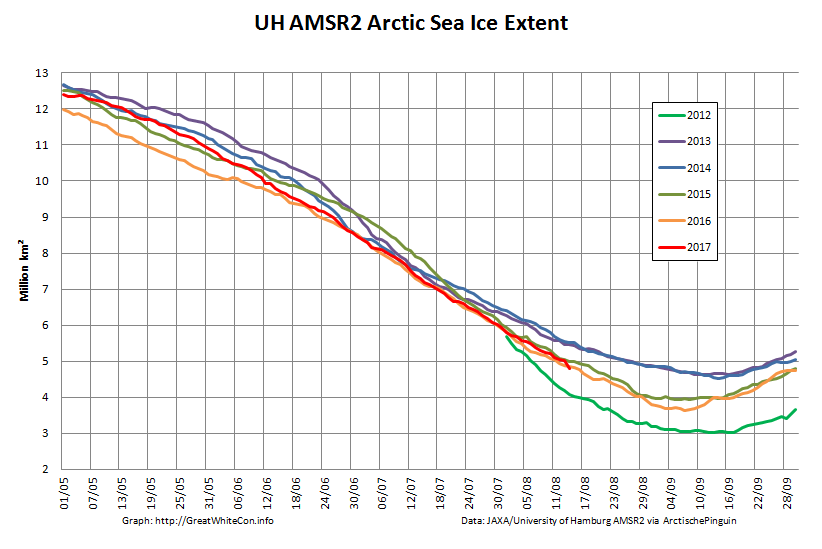
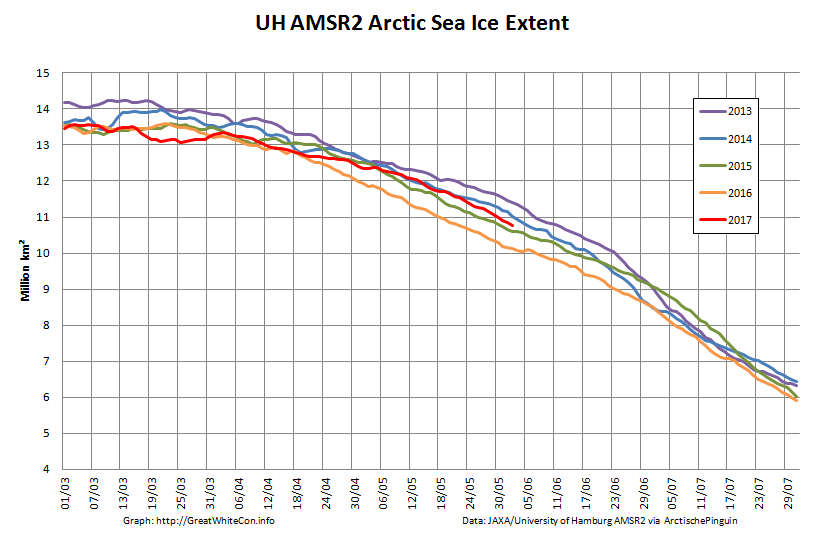
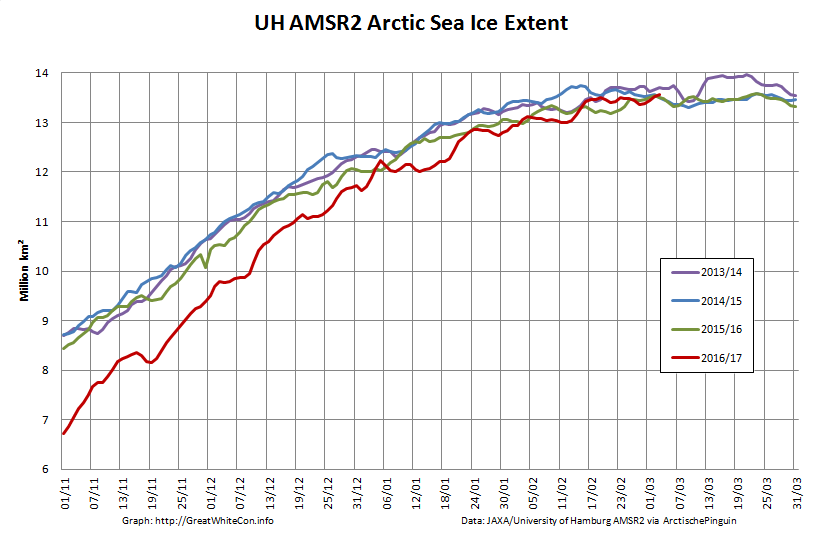
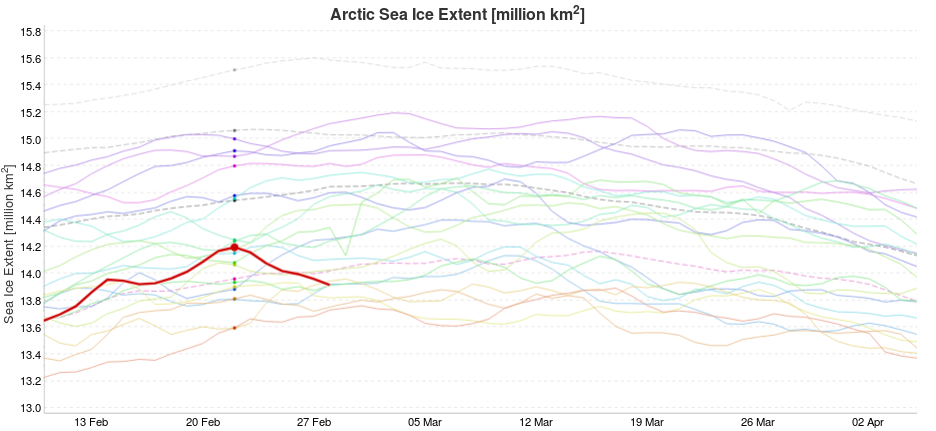
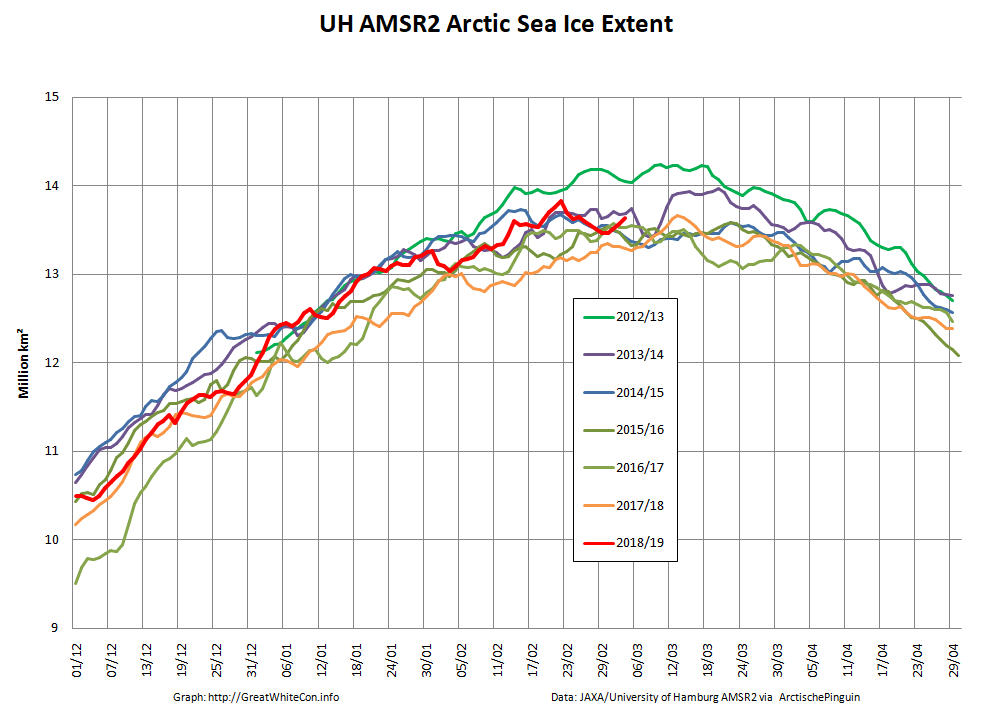
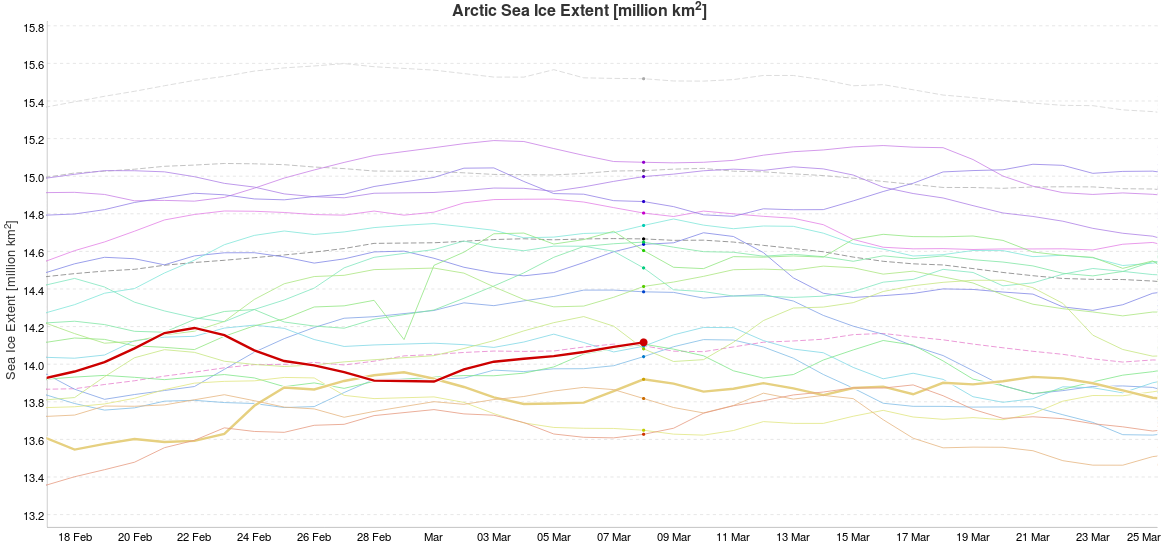
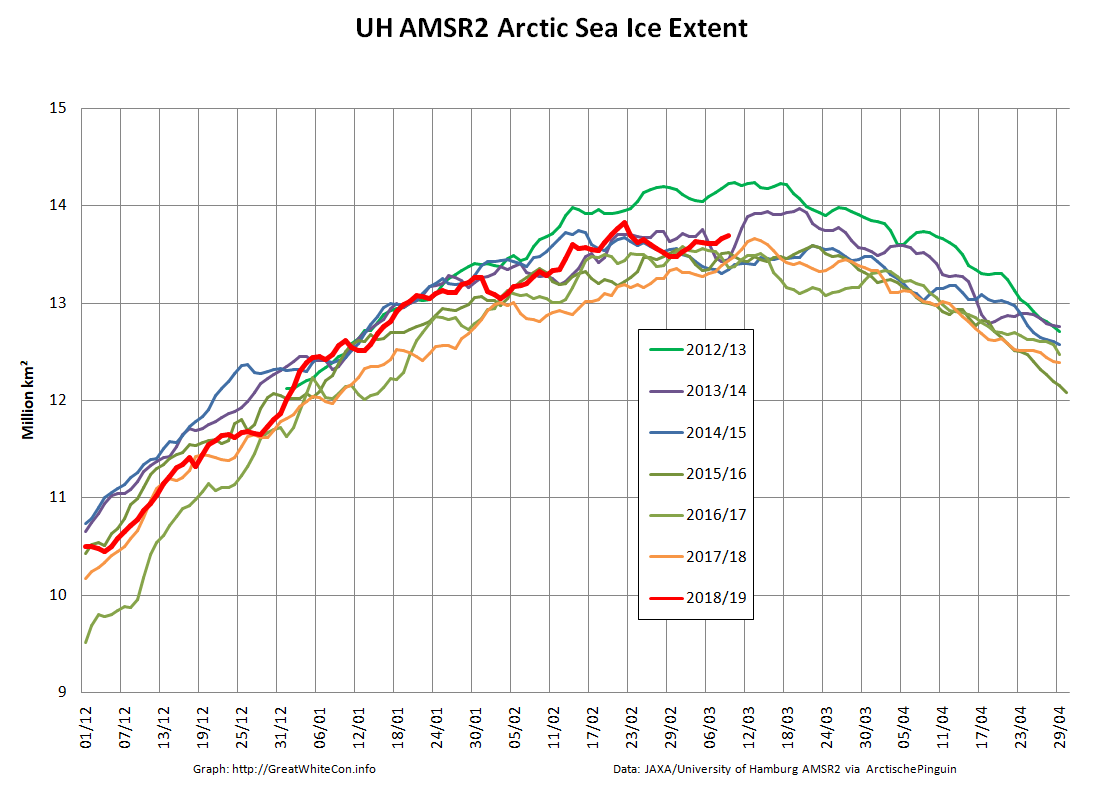
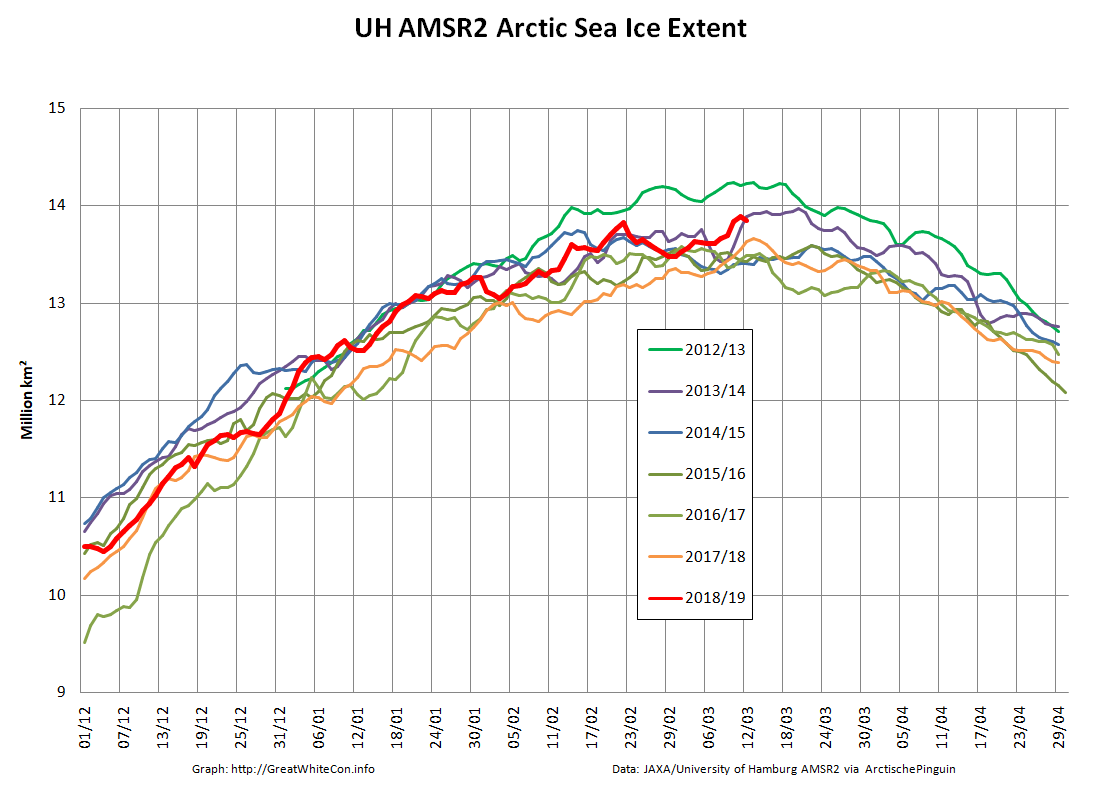
March 2019 has arrived, which in recent years has proved to be by far the likeliest month to contain the maximum extent of Arctic sea ice for the year. To begin with, here’s our favourite high resolution extent graph calculated by “Wipneus” from University of Hamburg/JAXA AMSR2 data:
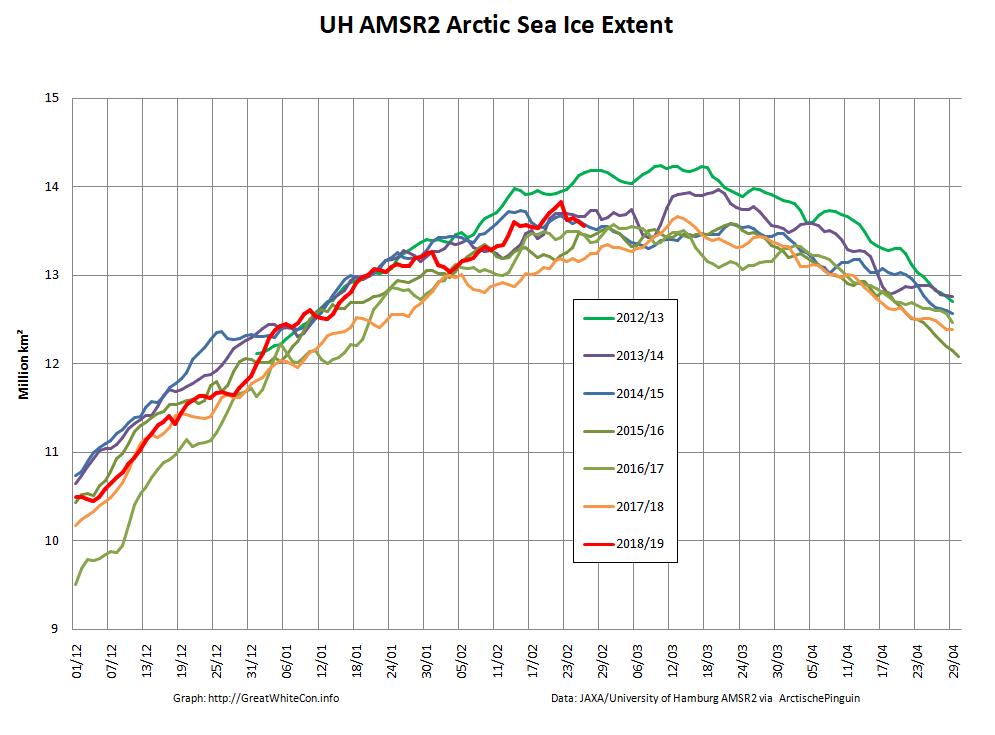
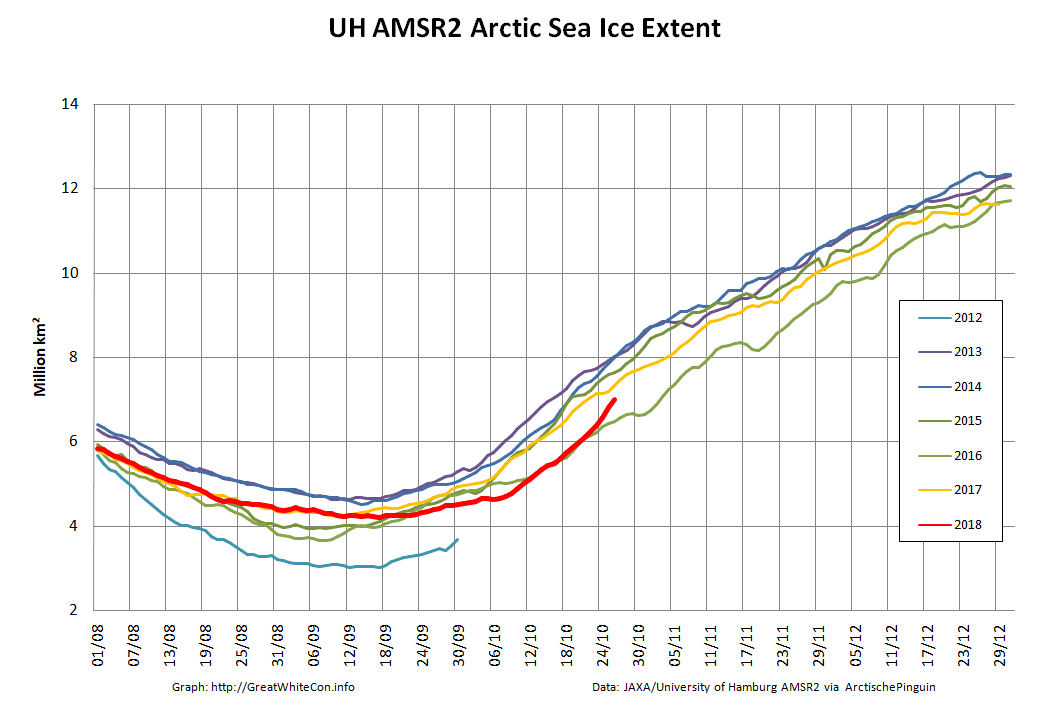
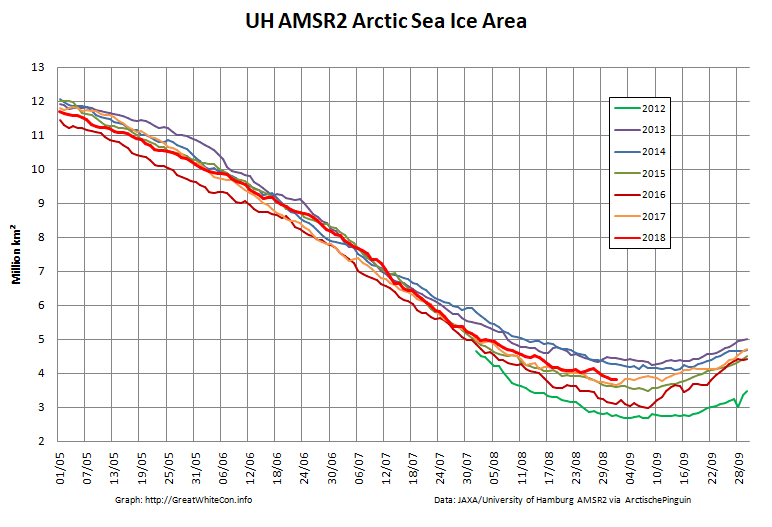
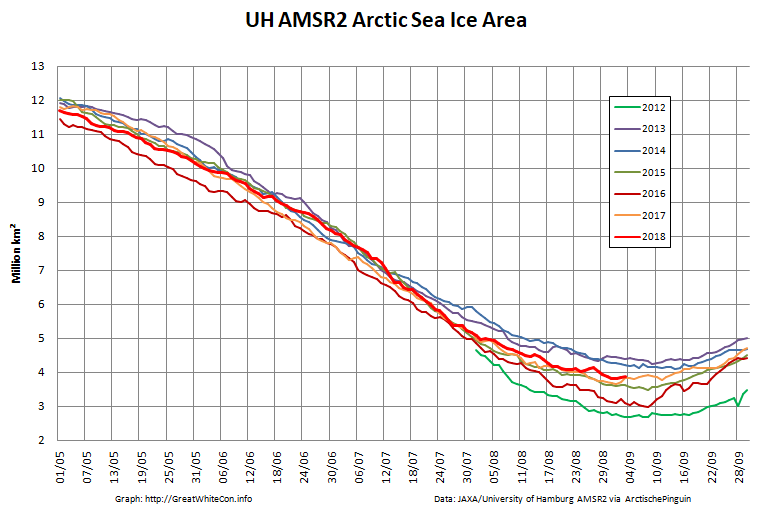
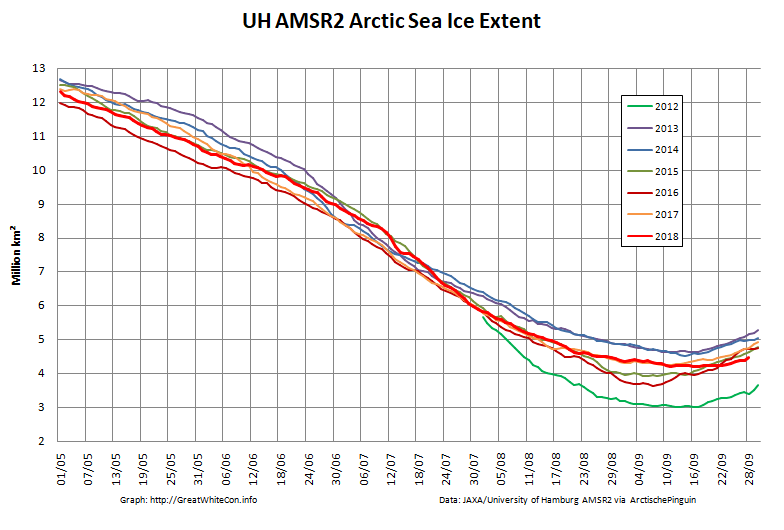
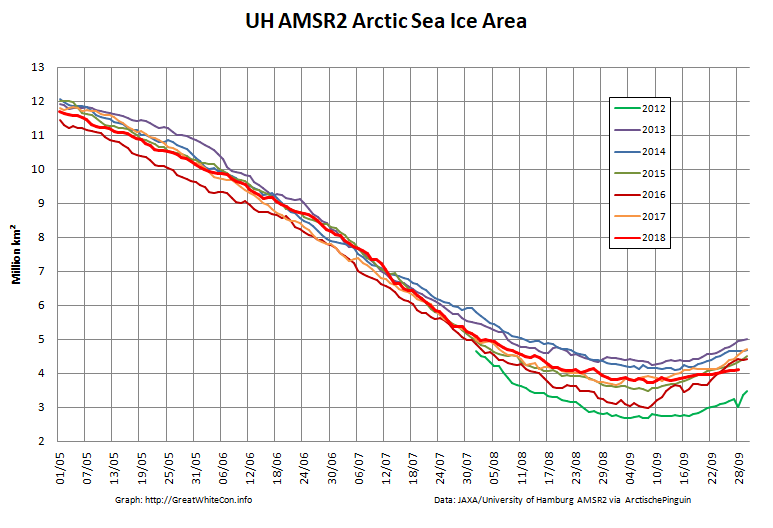
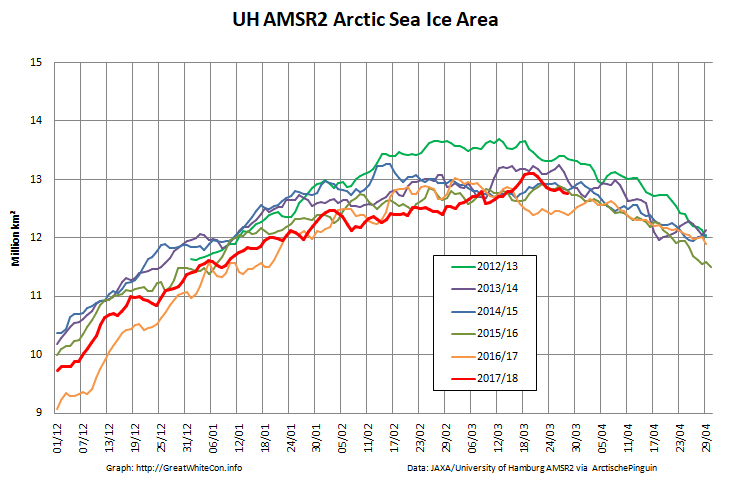
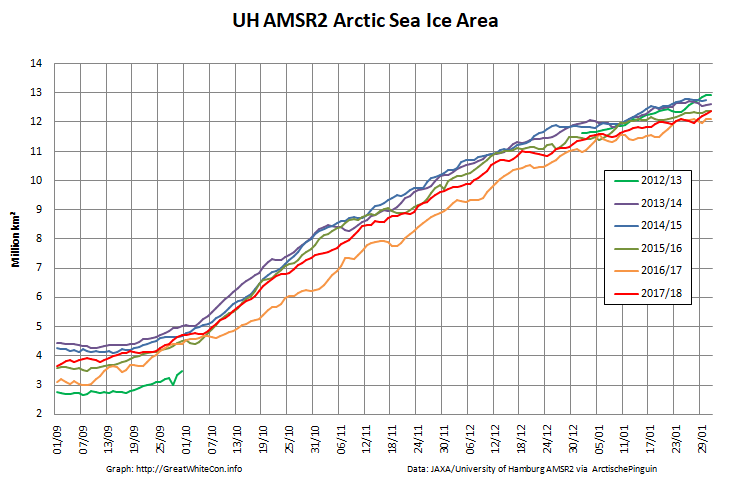
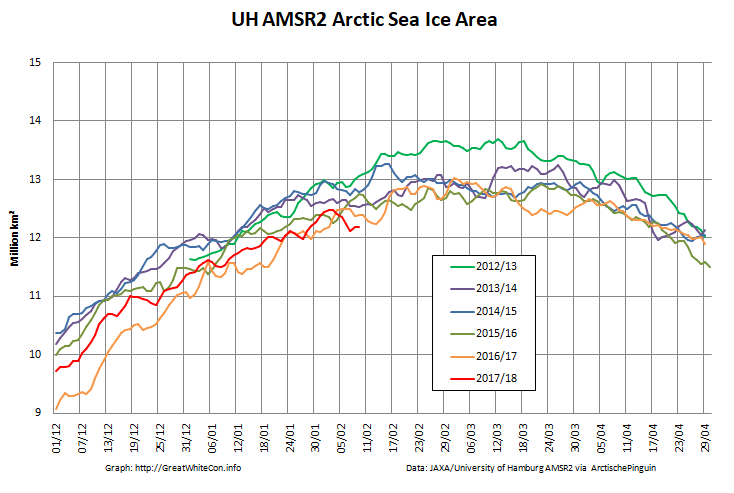
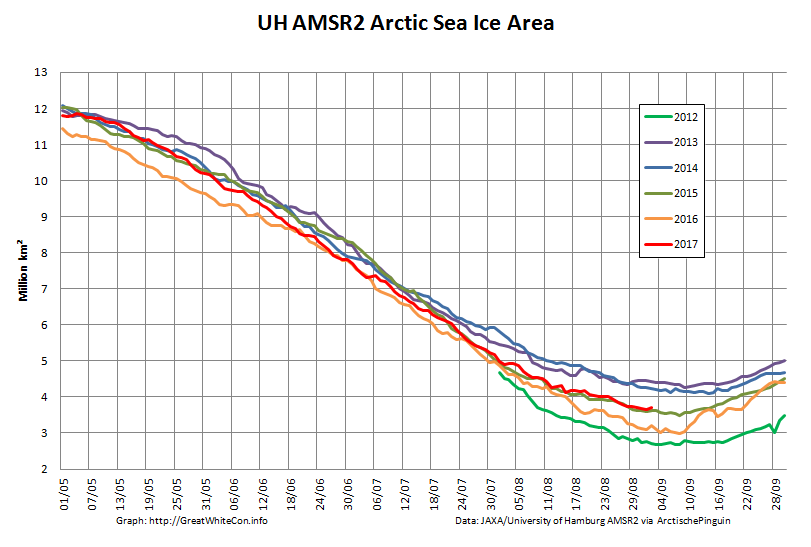
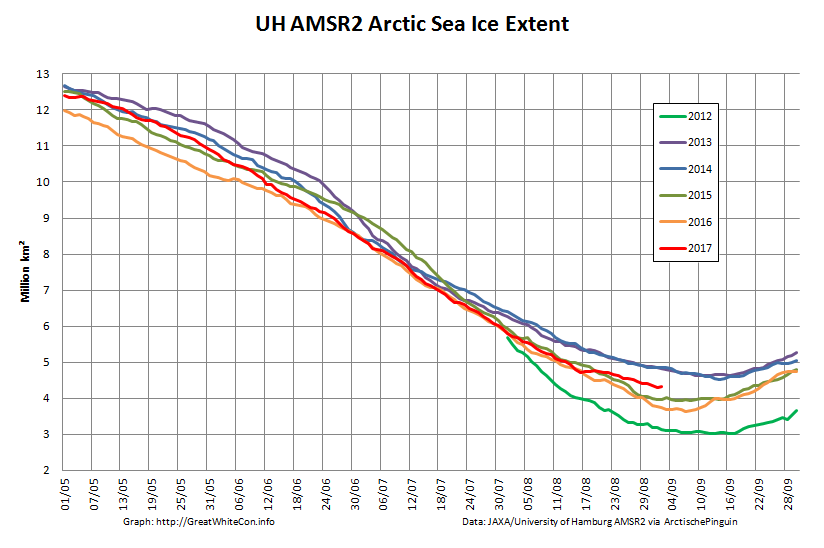
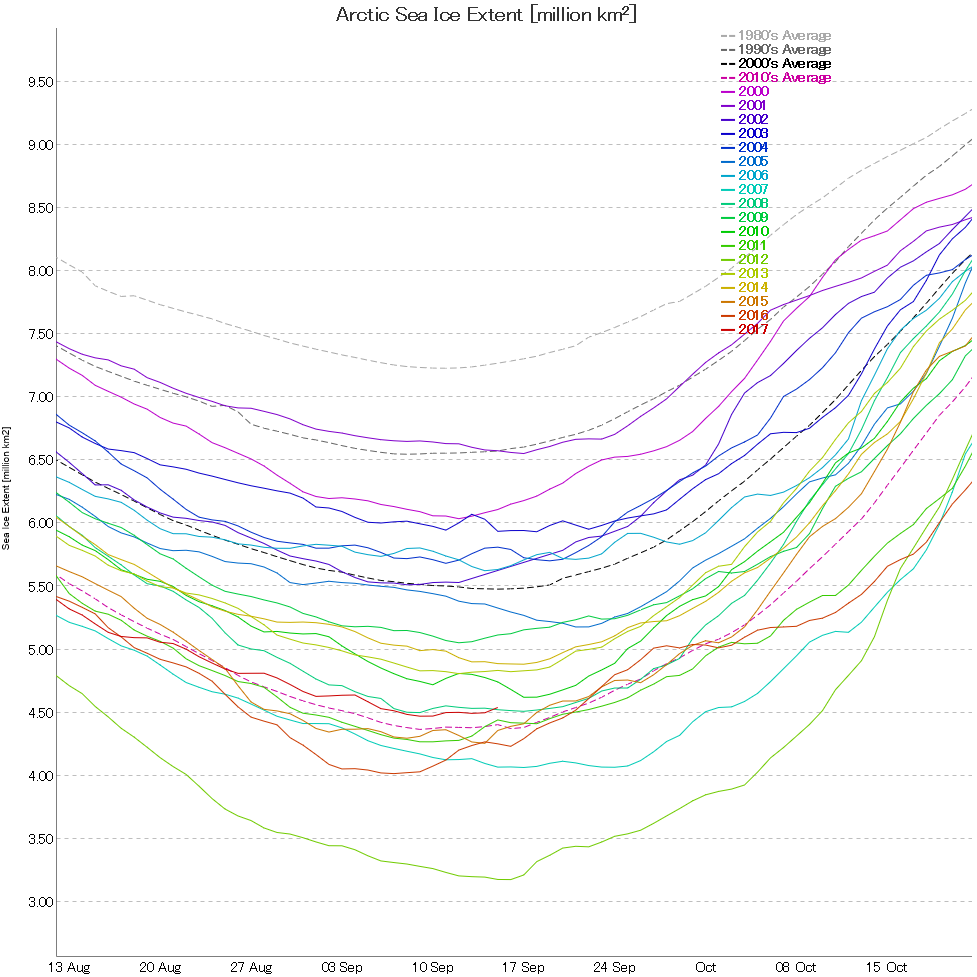
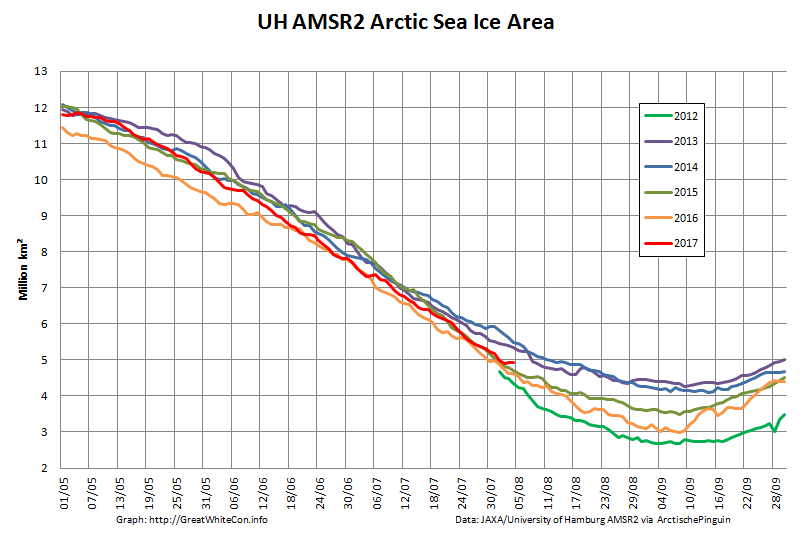
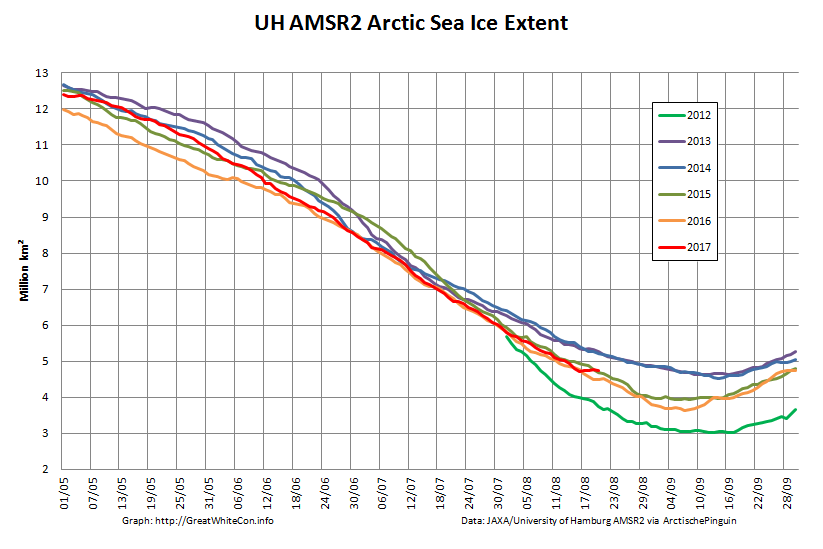
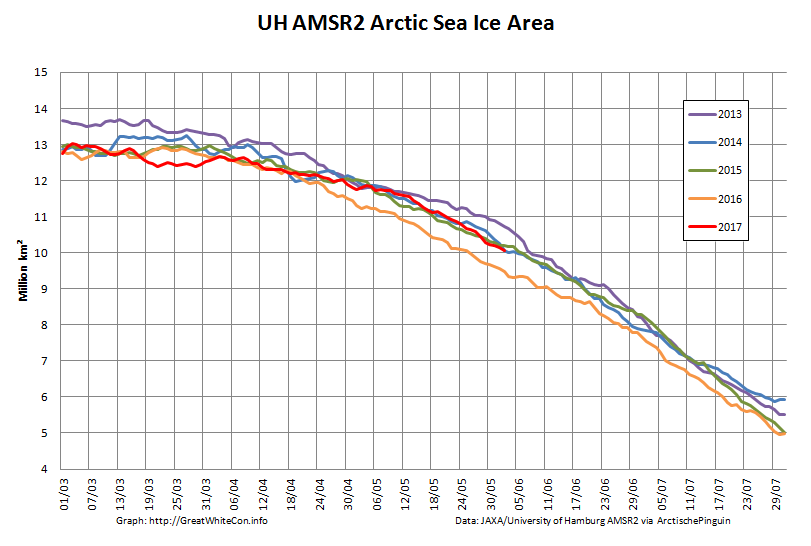
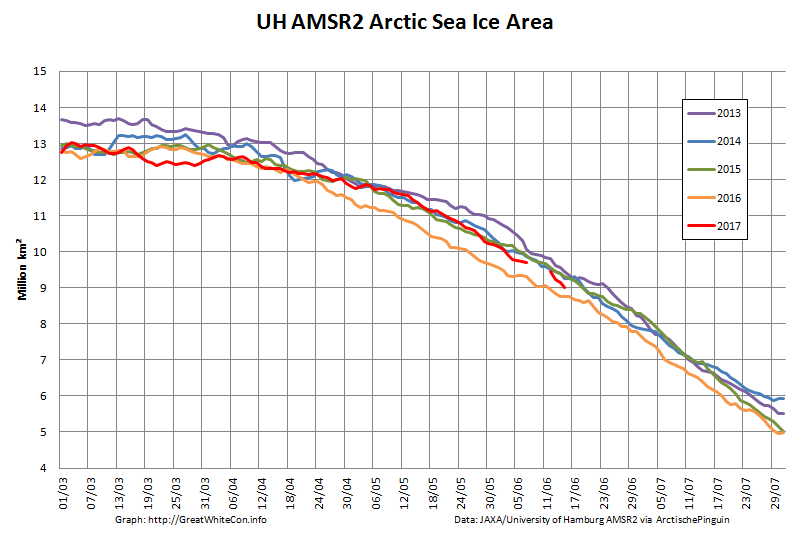
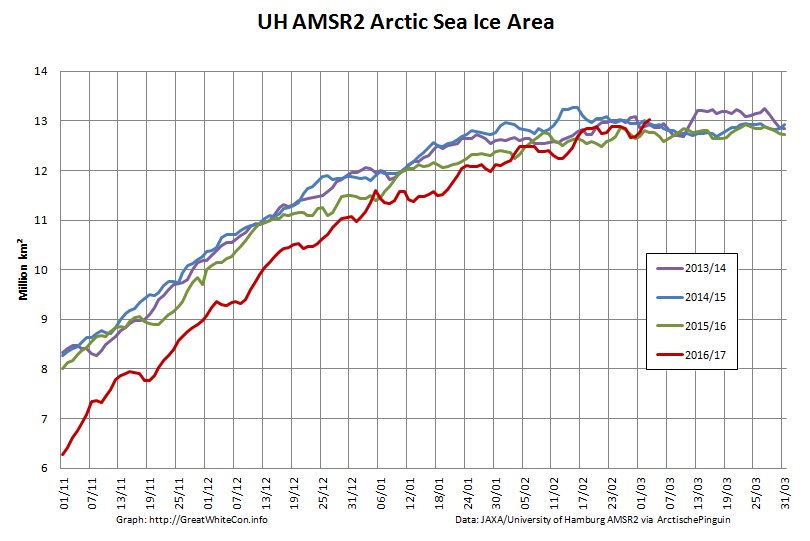
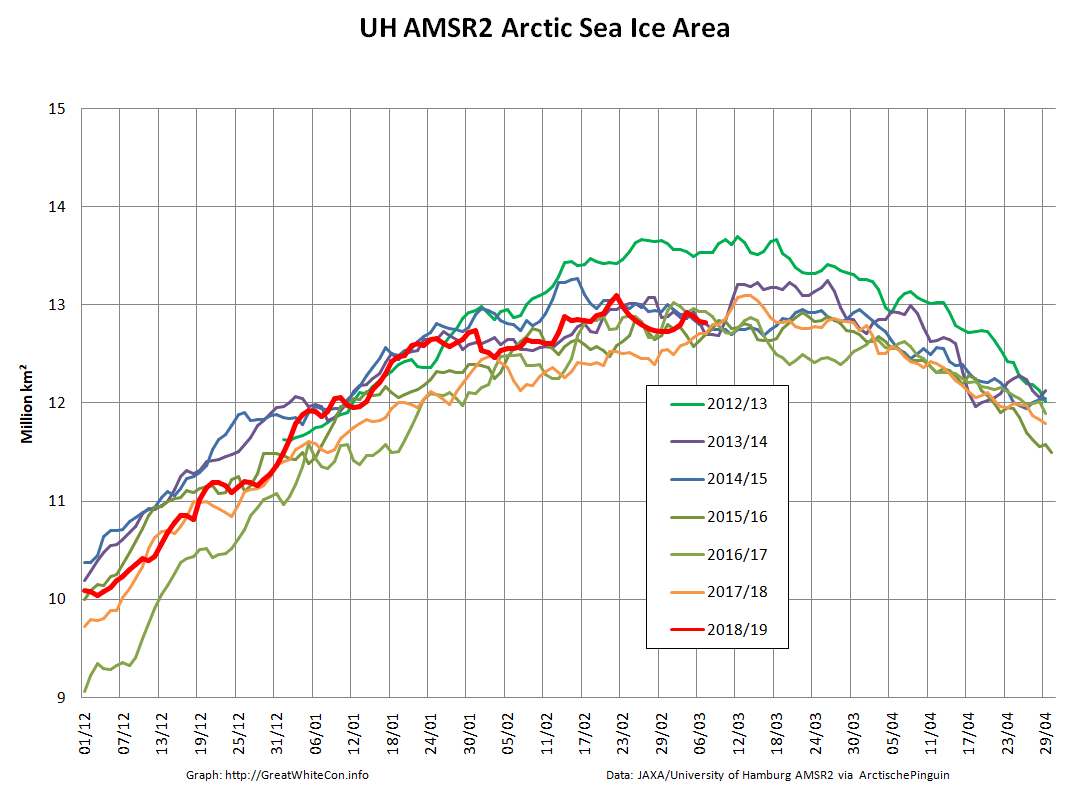
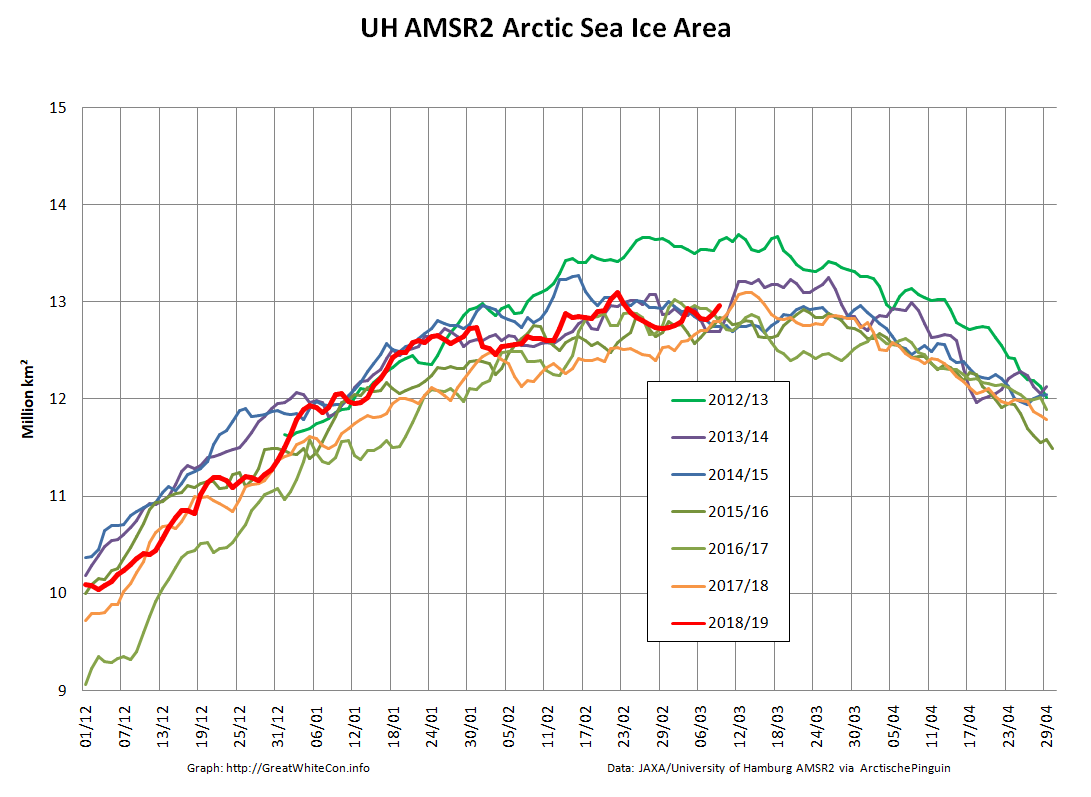
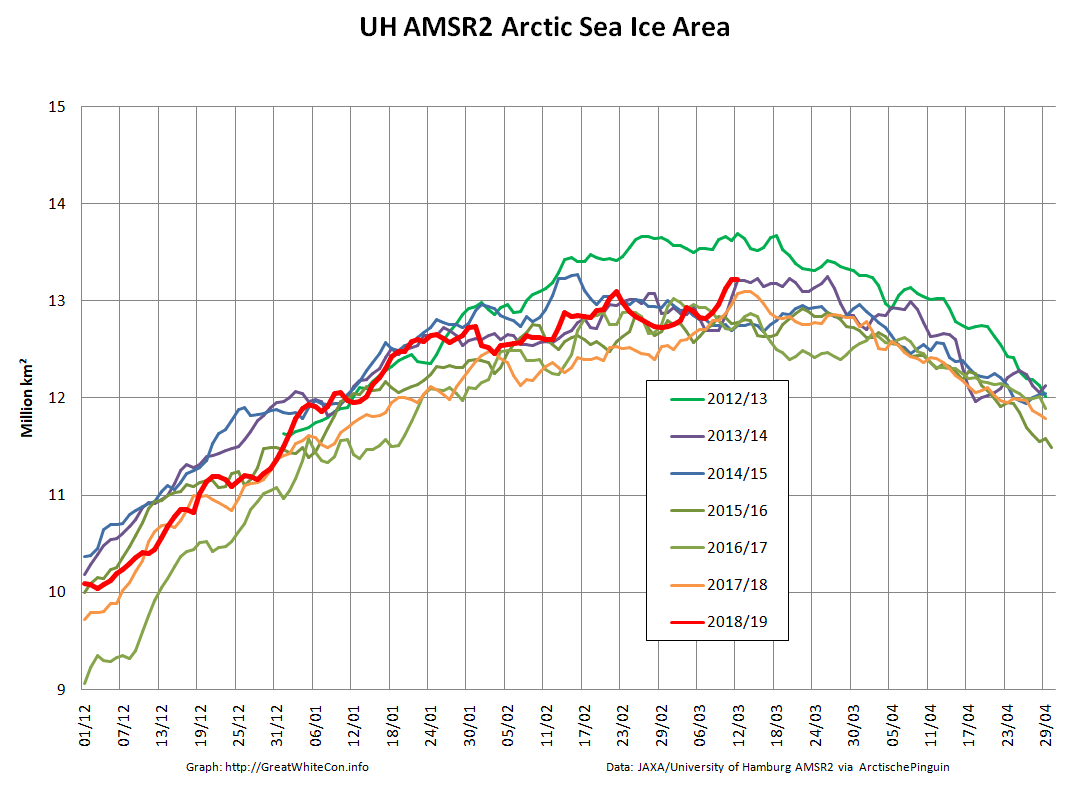
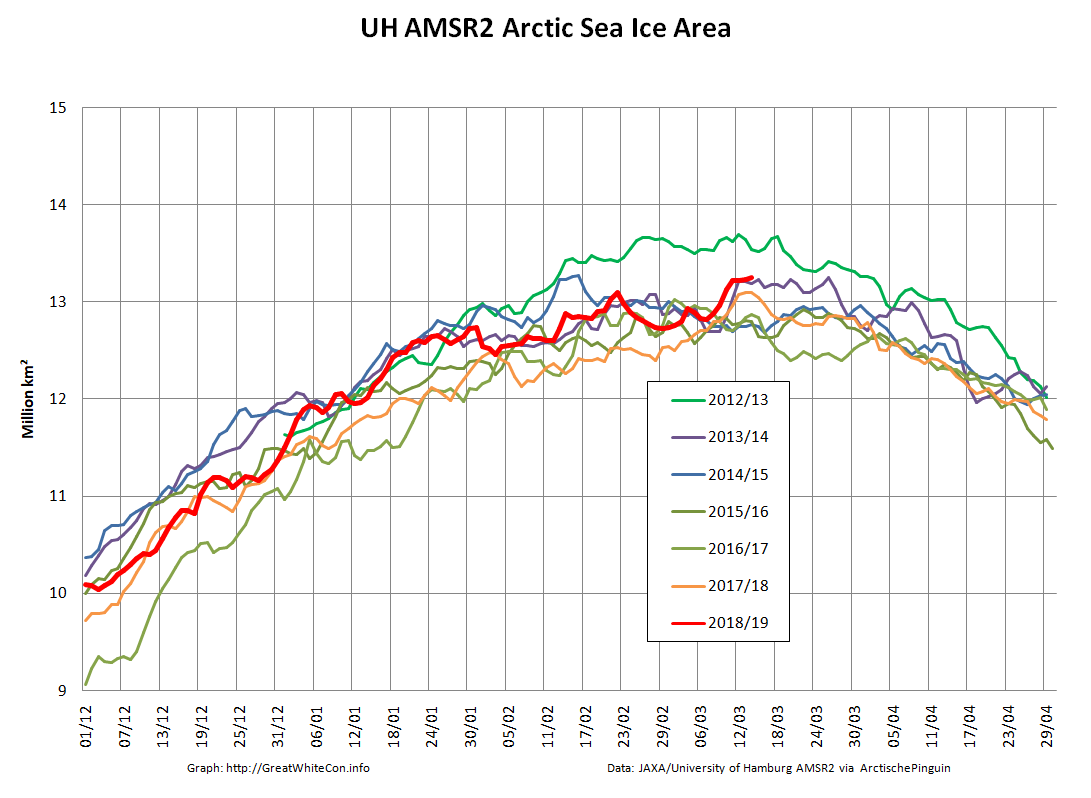
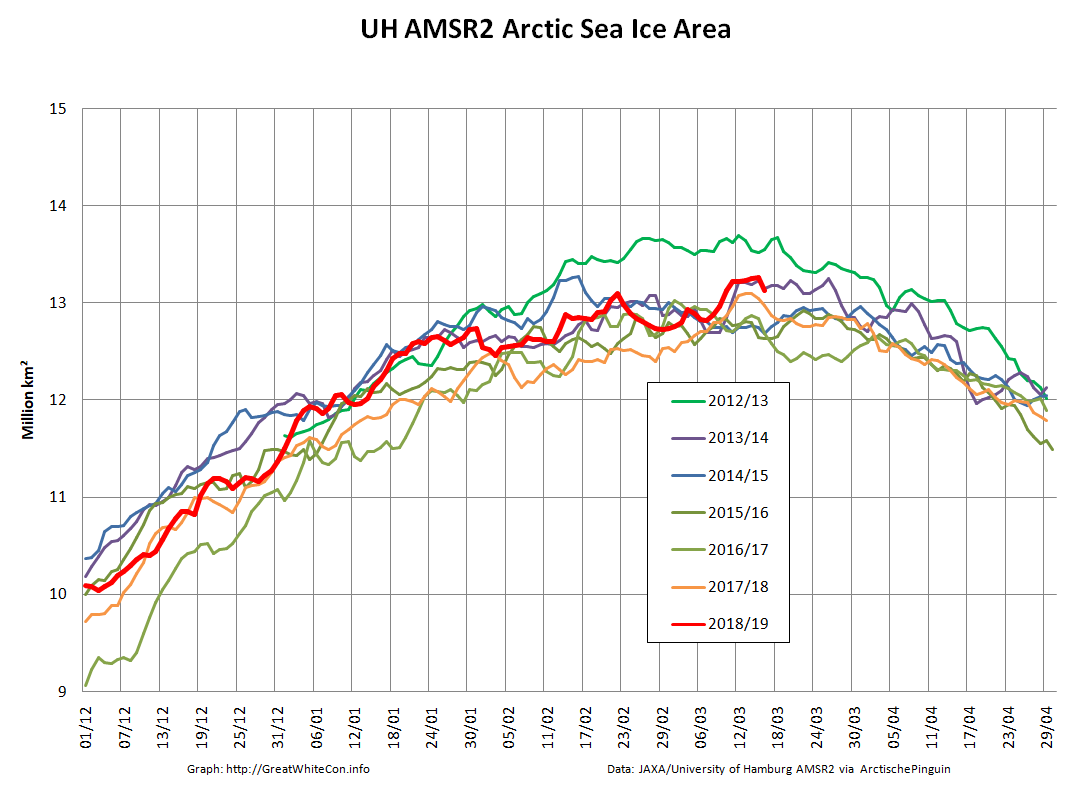
Hopefully you can plainly see the pronounced sharp peak towards the end of February 2019? The current maximum Arctic sea ice extent for 2019 is 13.83 million square kilometers on February 22nd. Here’s Arctic sea ice area for good measure:

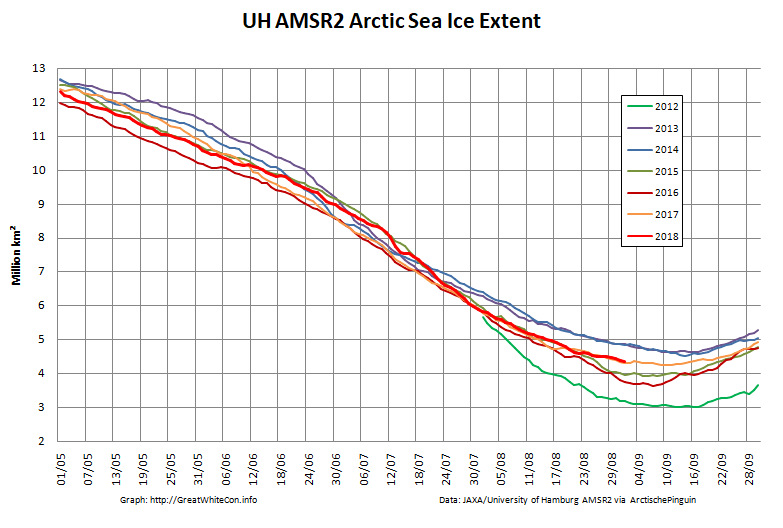
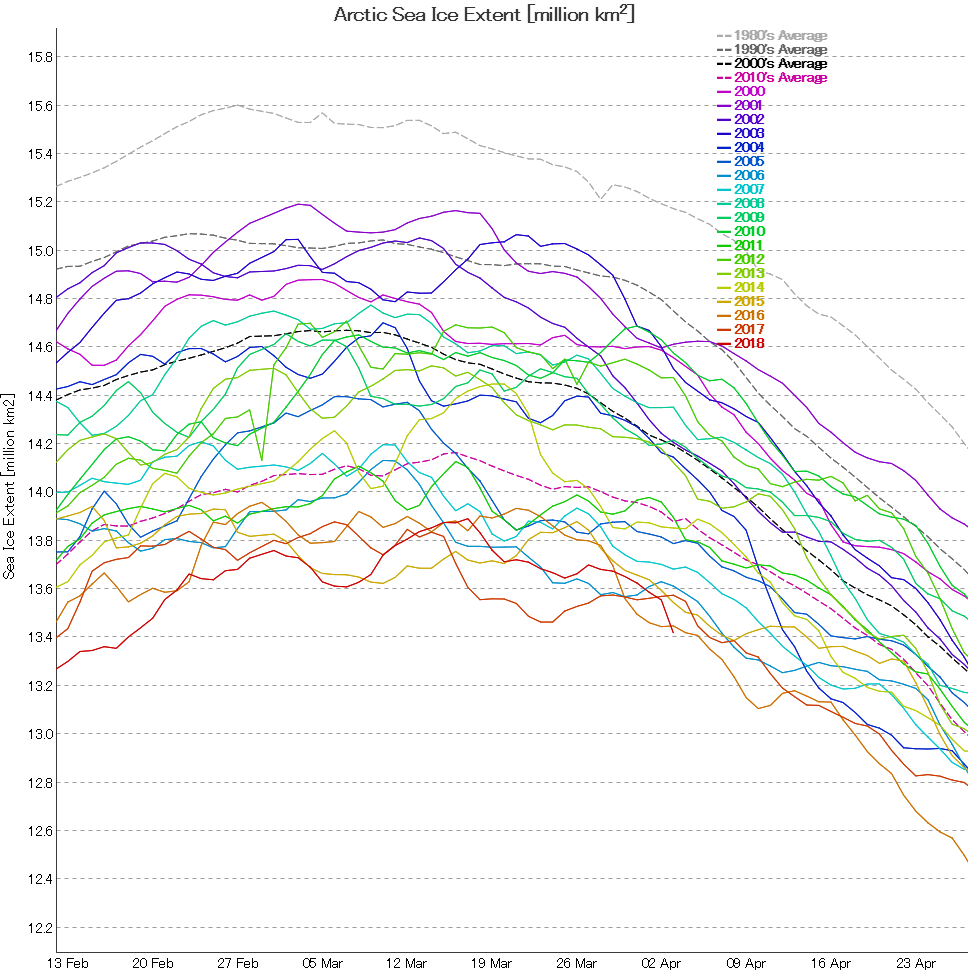
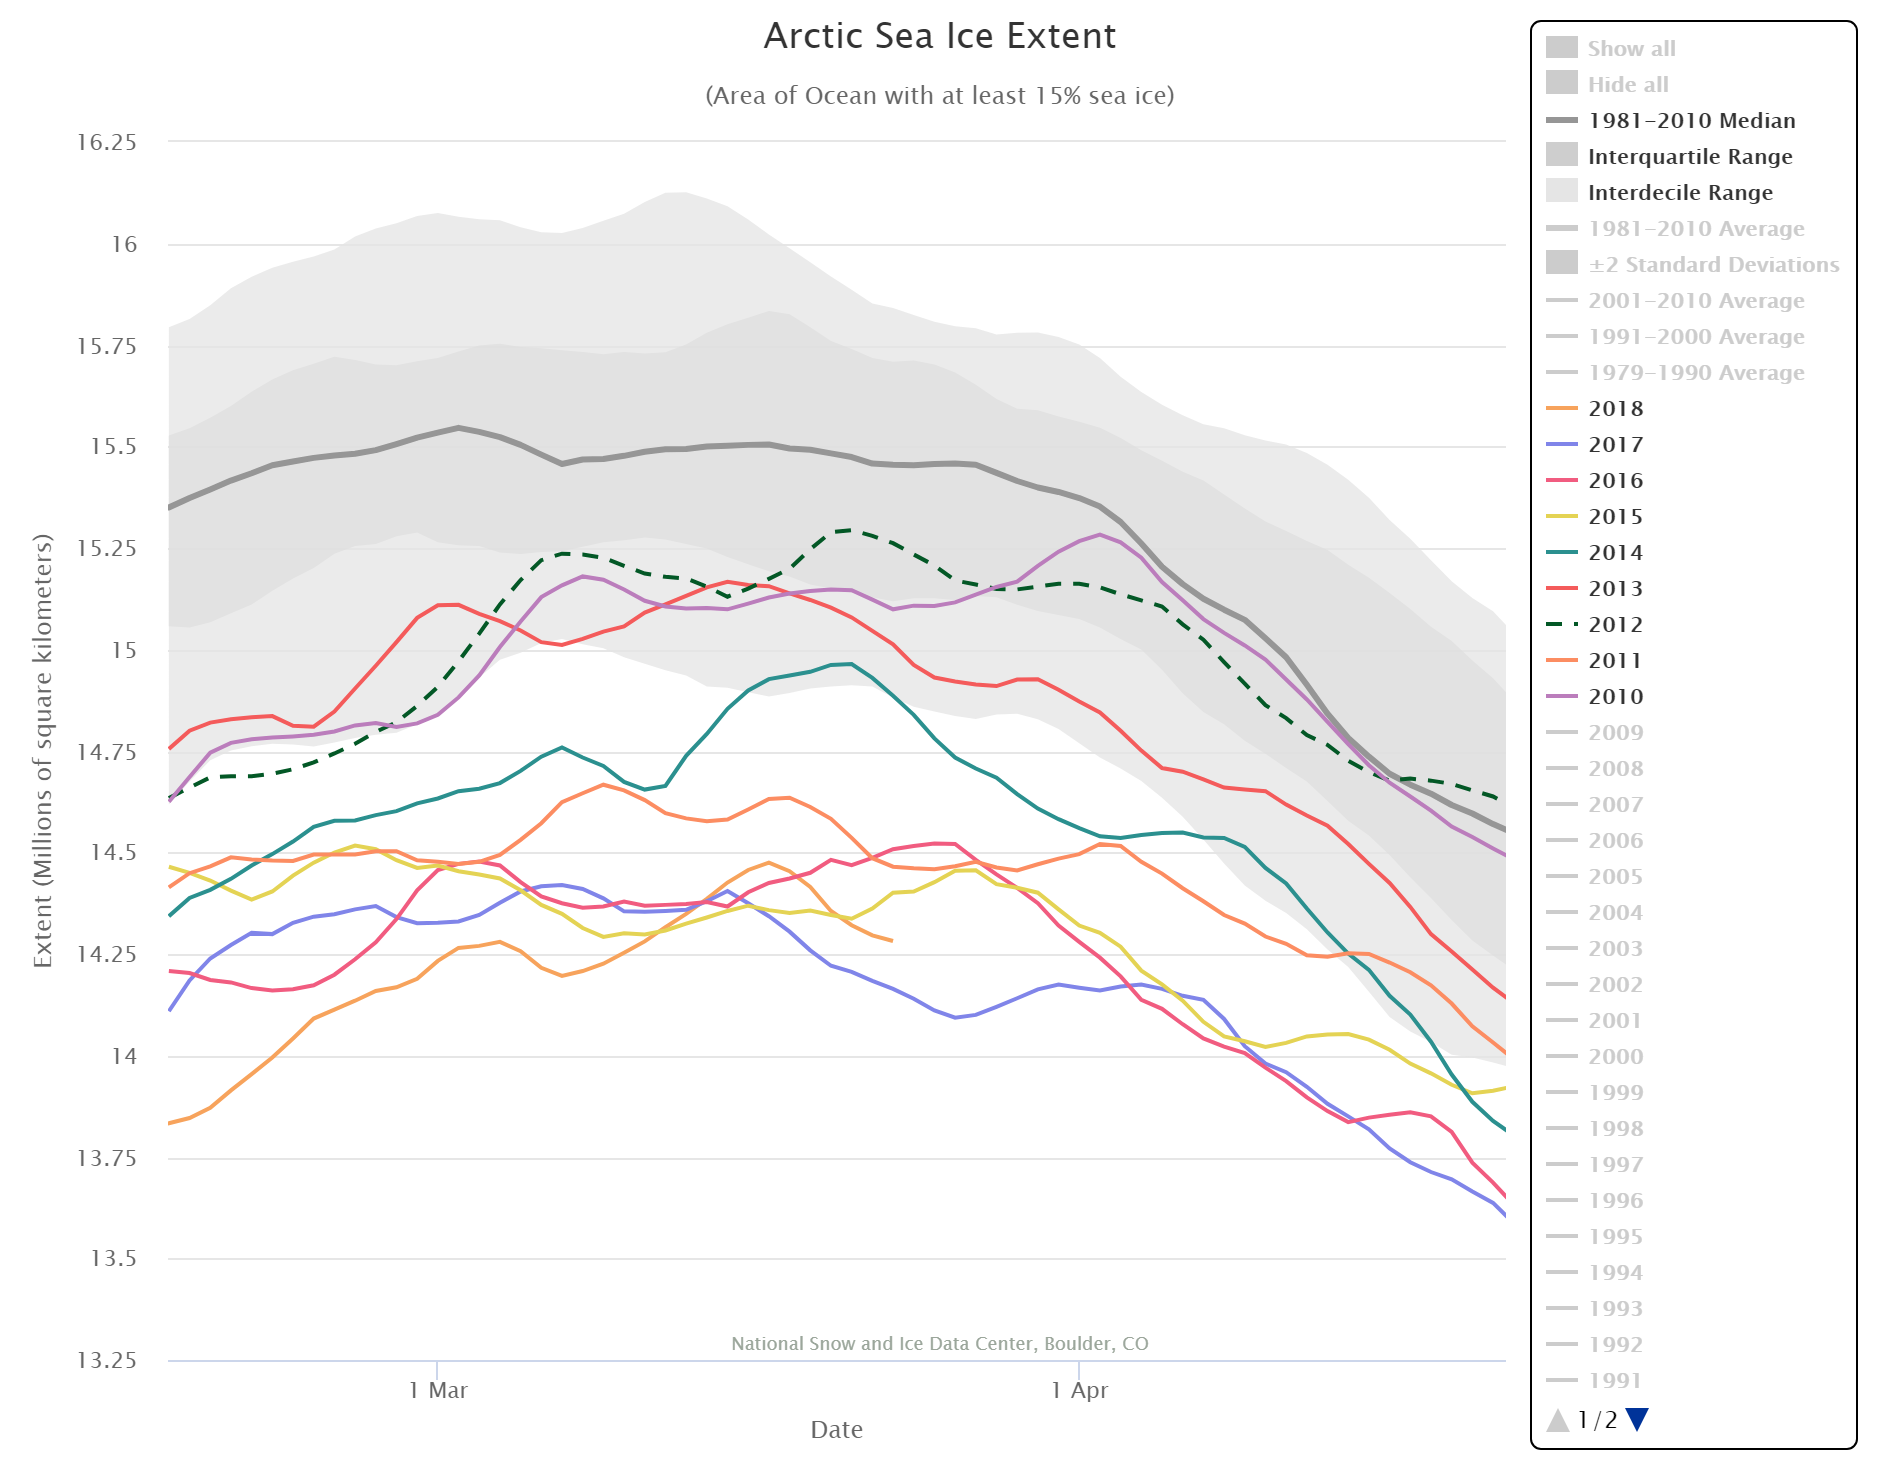
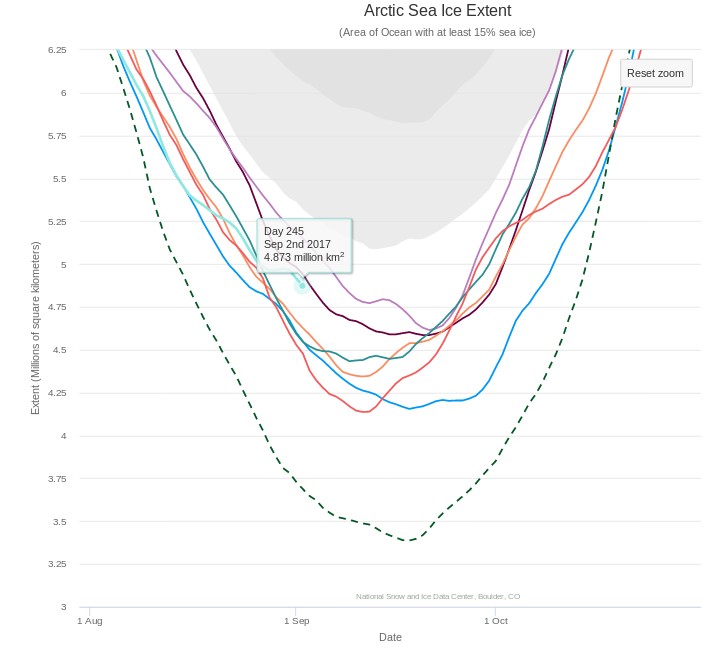
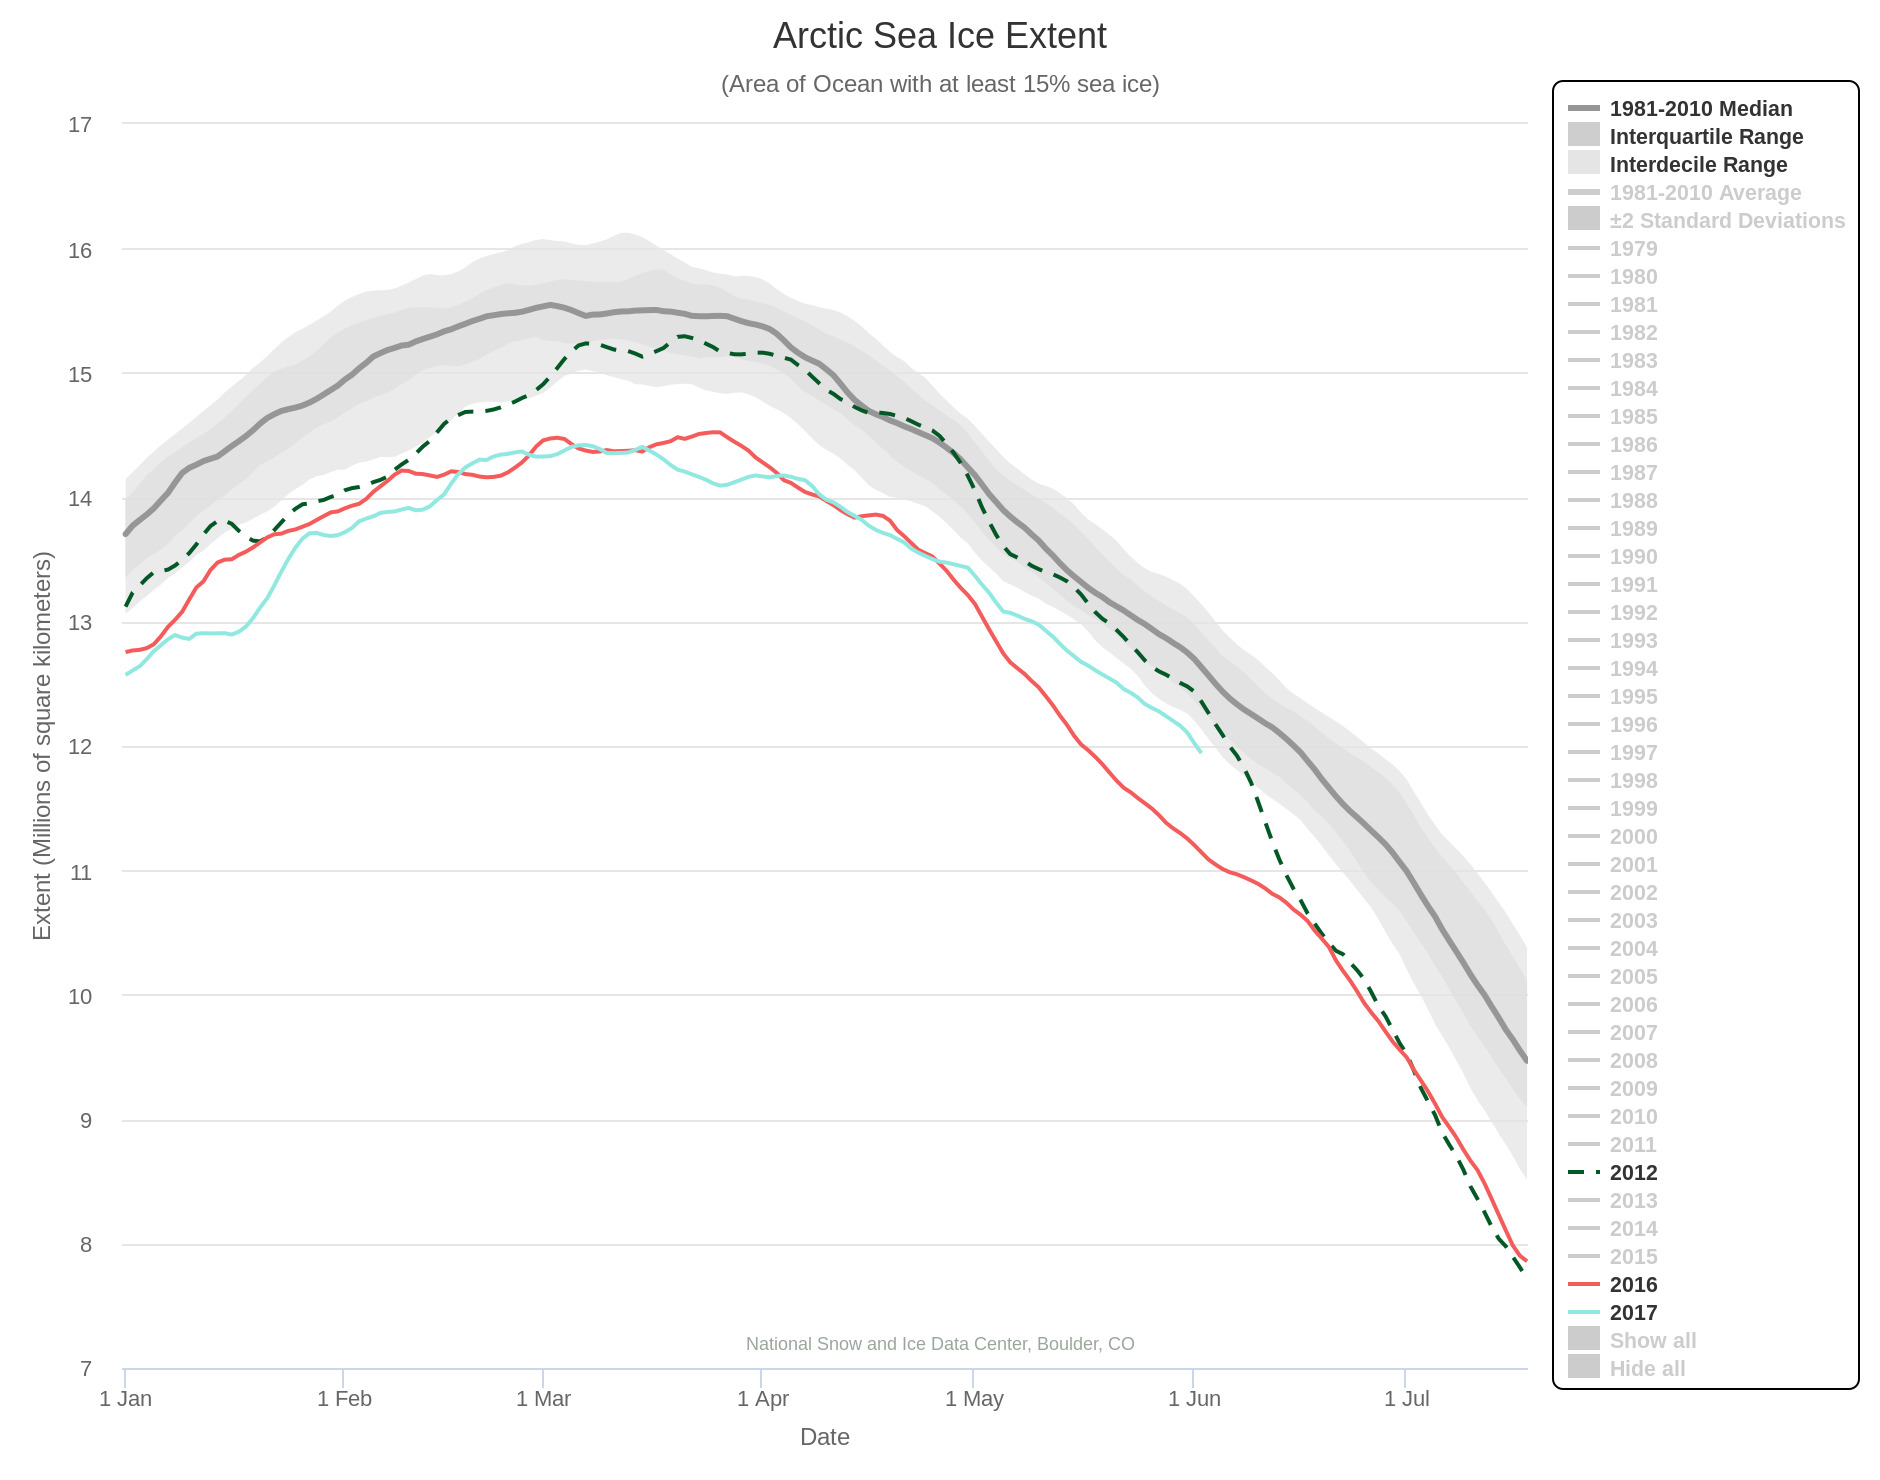
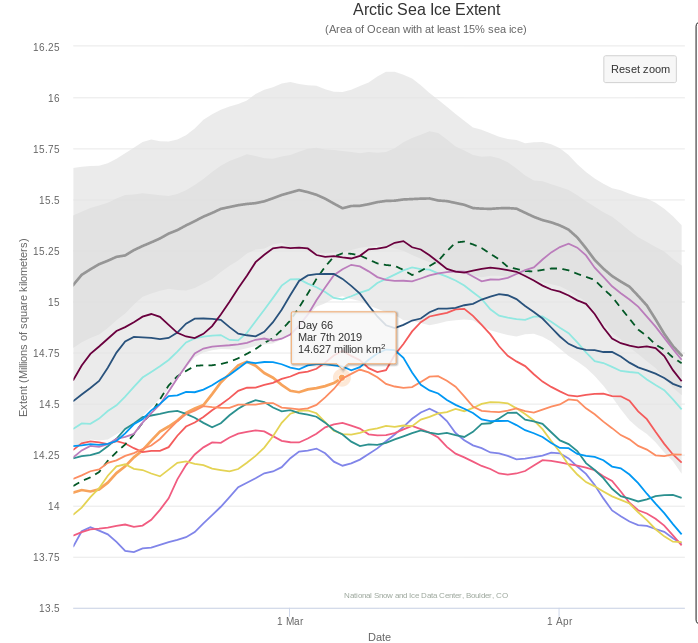
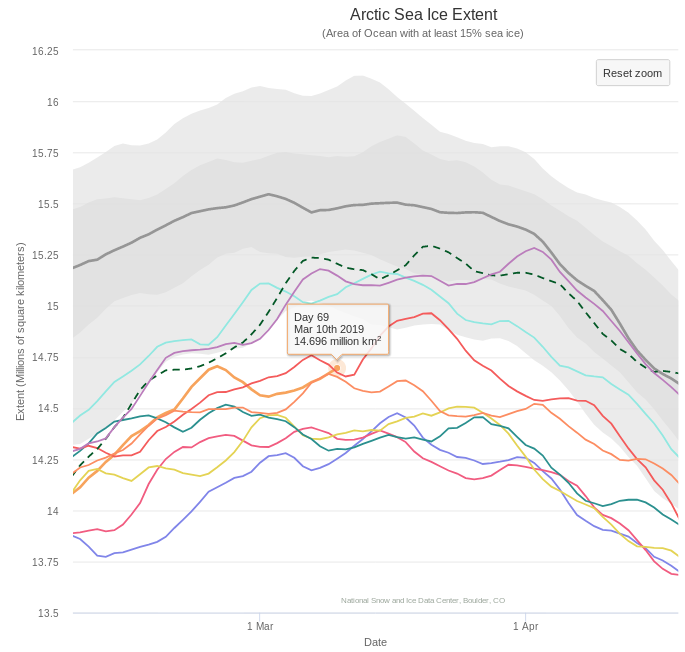
The current maximum area for 2019 is 13.10 million square kilometers, also on February 22nd. Here too is the NSIDC’s 5 day averaged extent:

This reveals a current maximum extent for 2019 of 14.705 million square kilometers on February 24th.
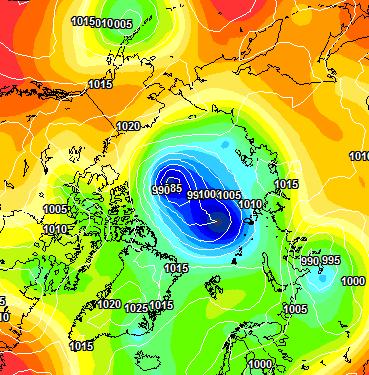
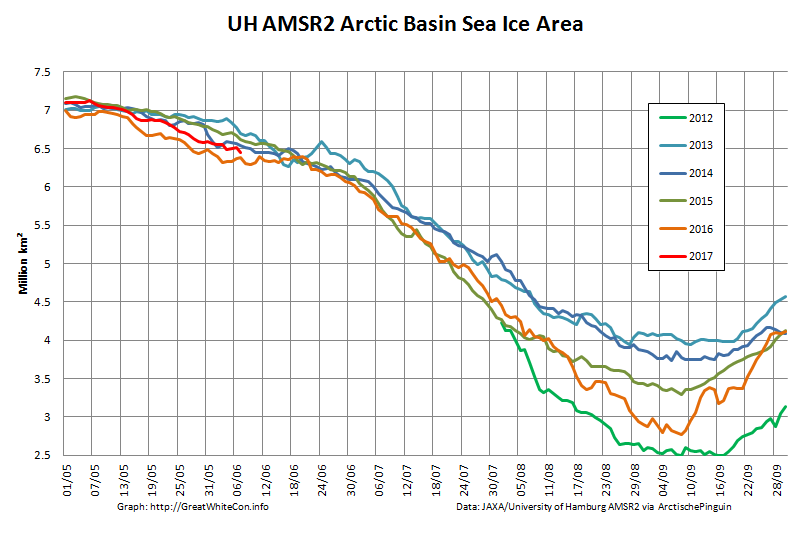
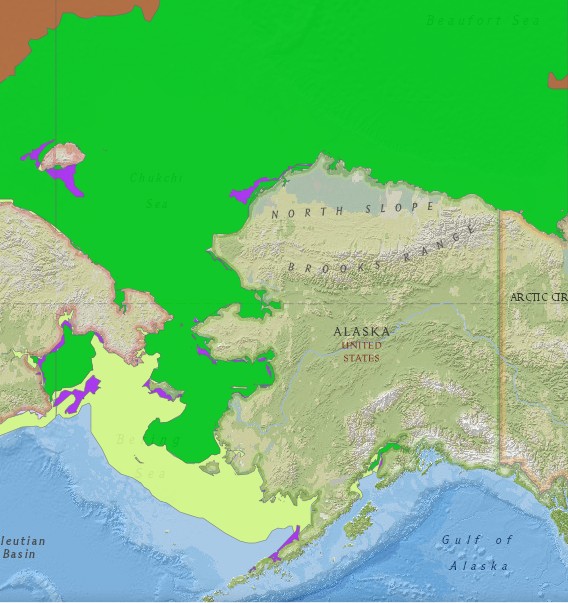
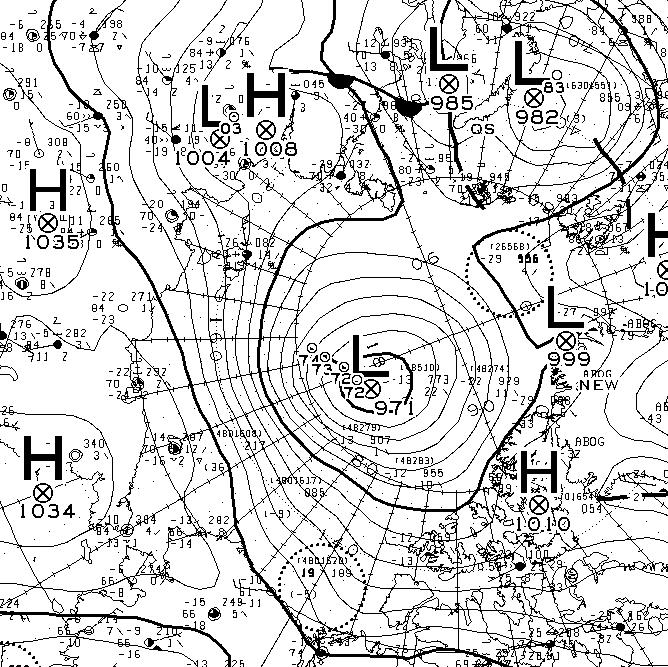
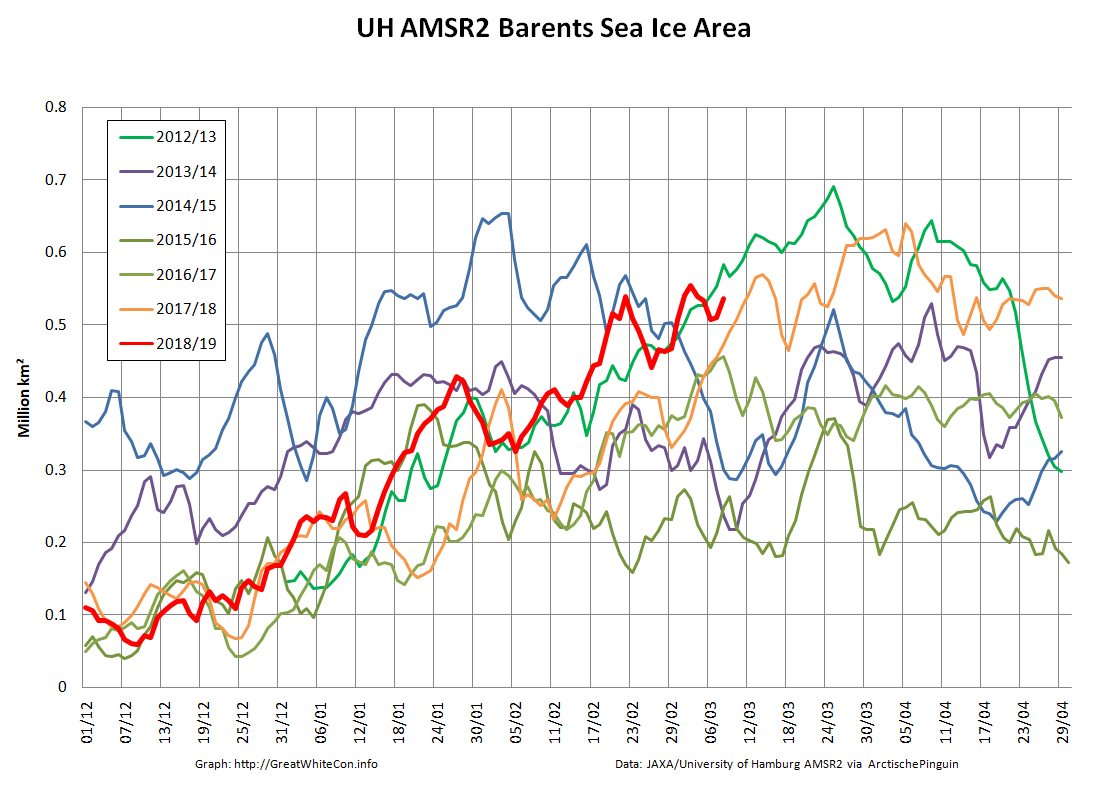
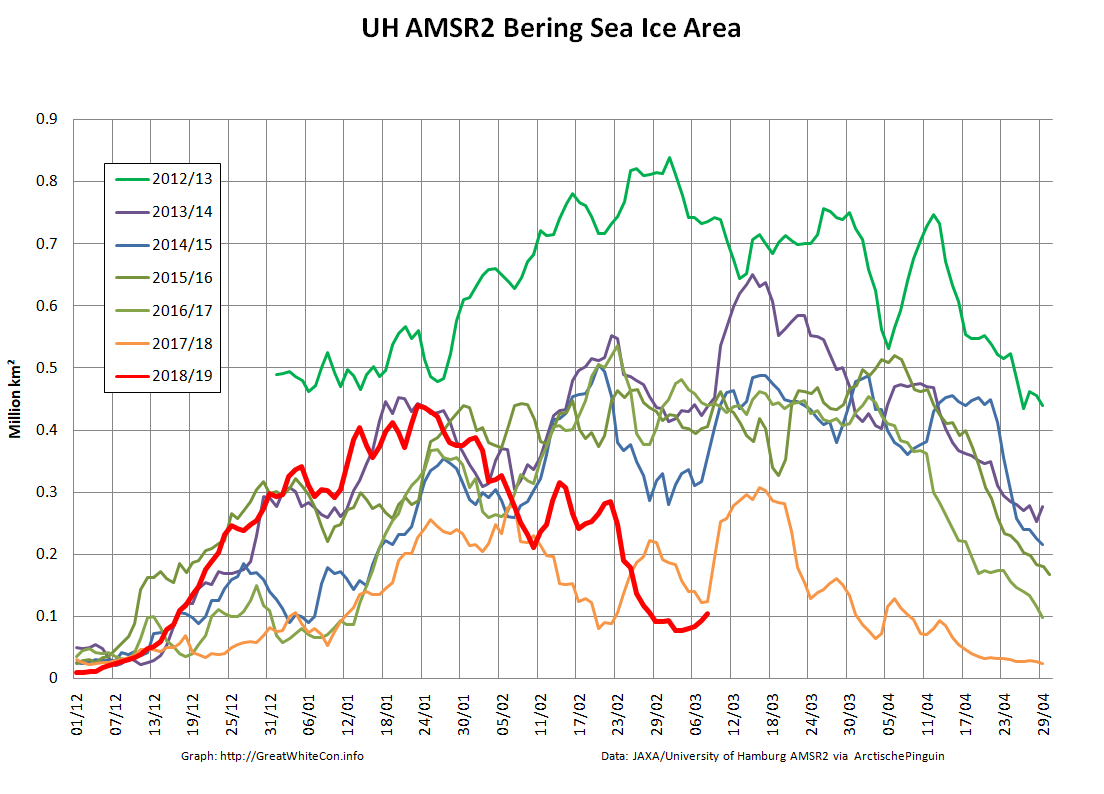
At this juncture you may well be wondering what the cause of that sudden sharp peak might be? Here’s your starter for ten:
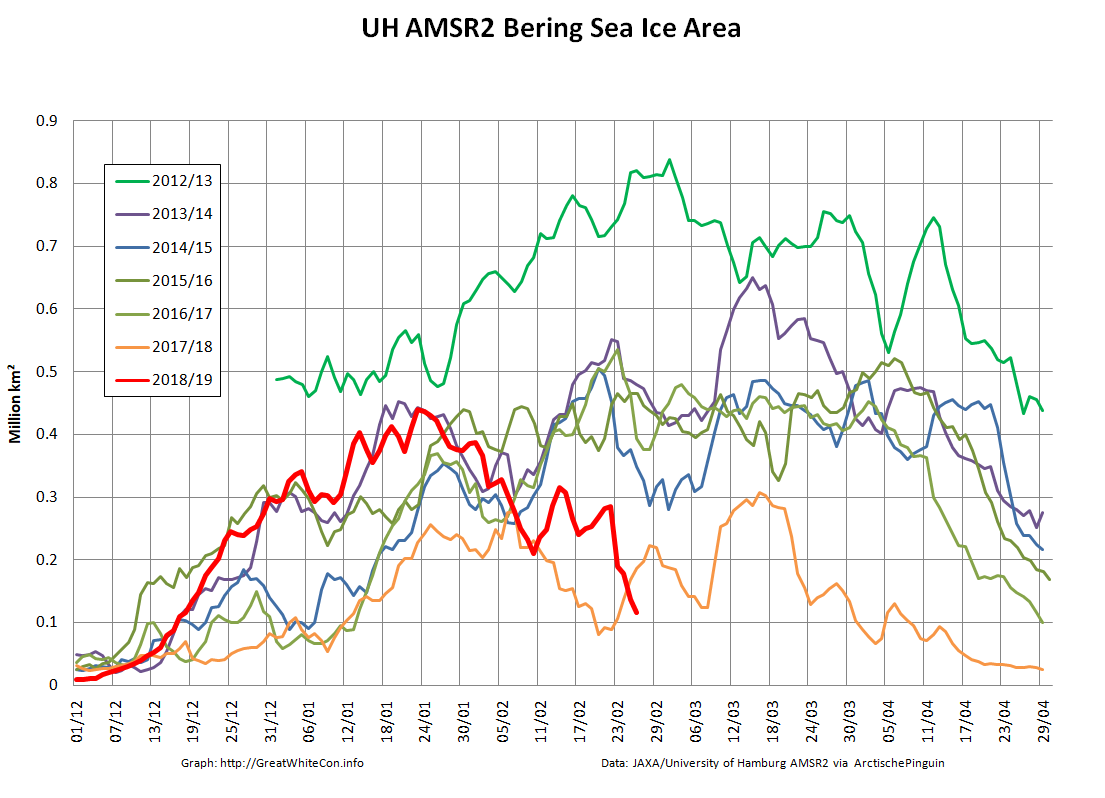
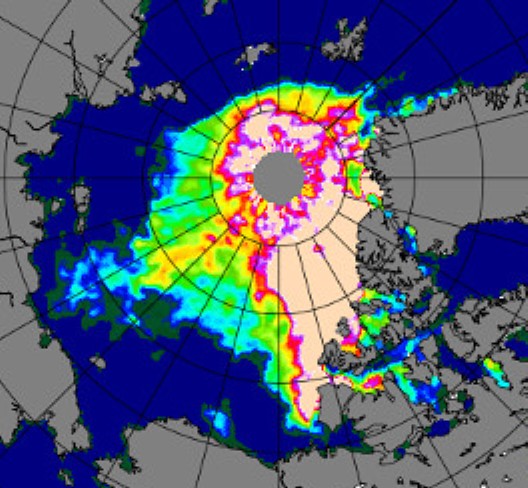
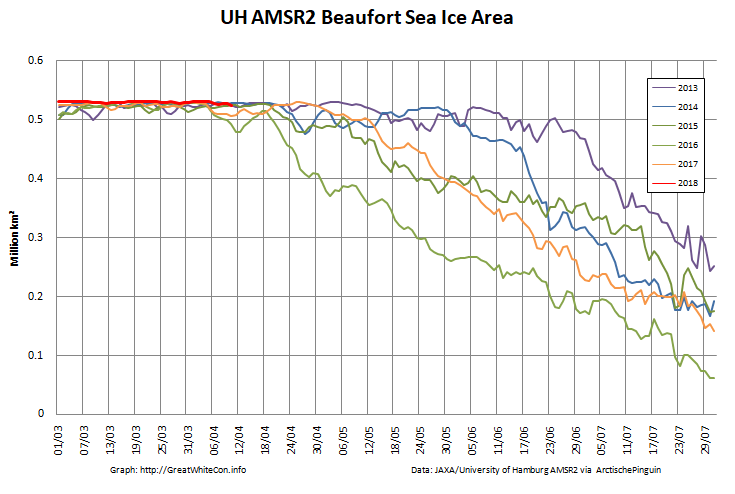
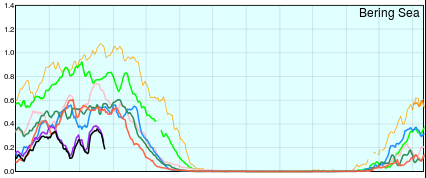
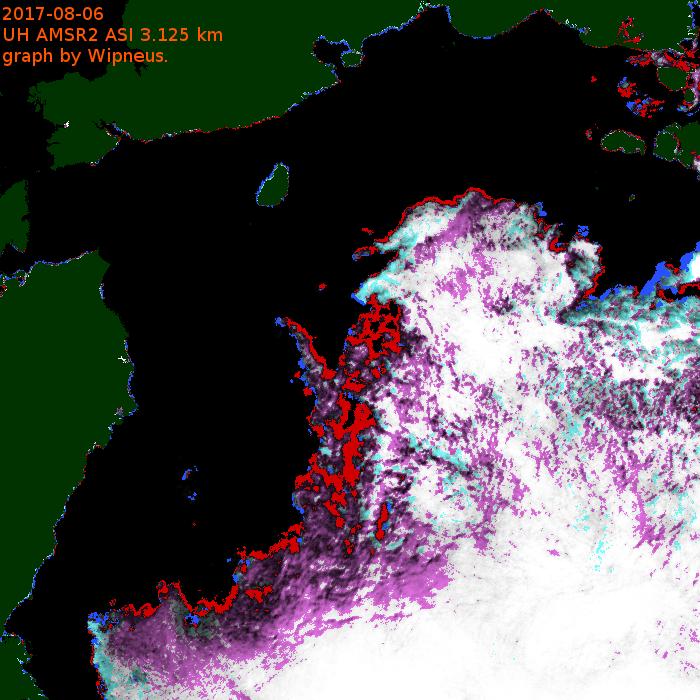
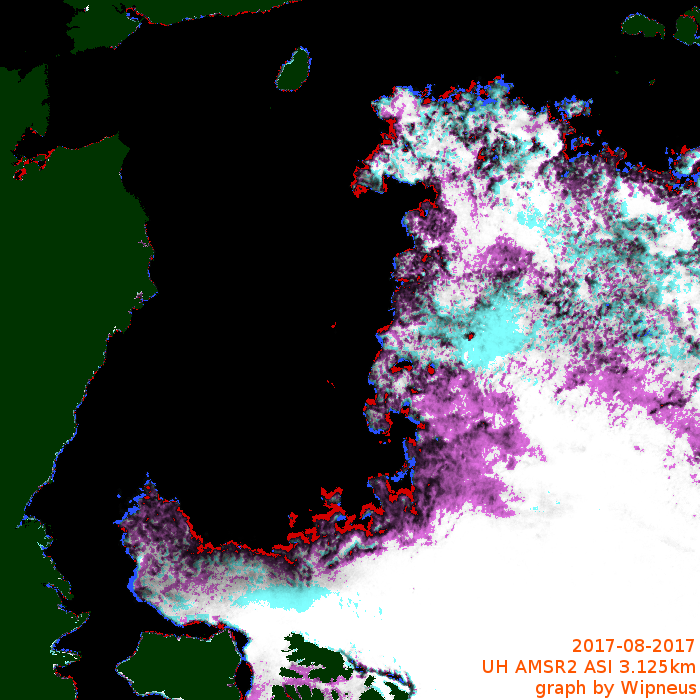
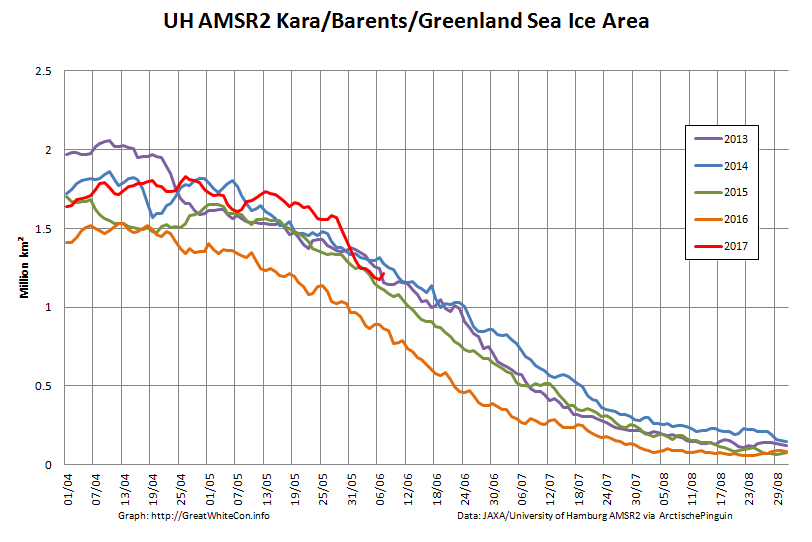
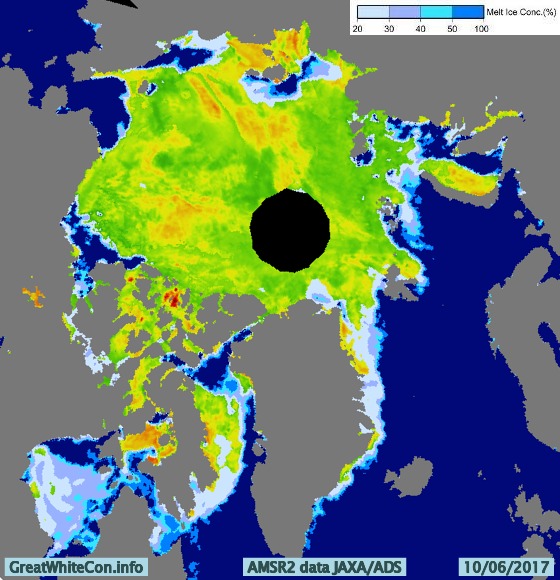
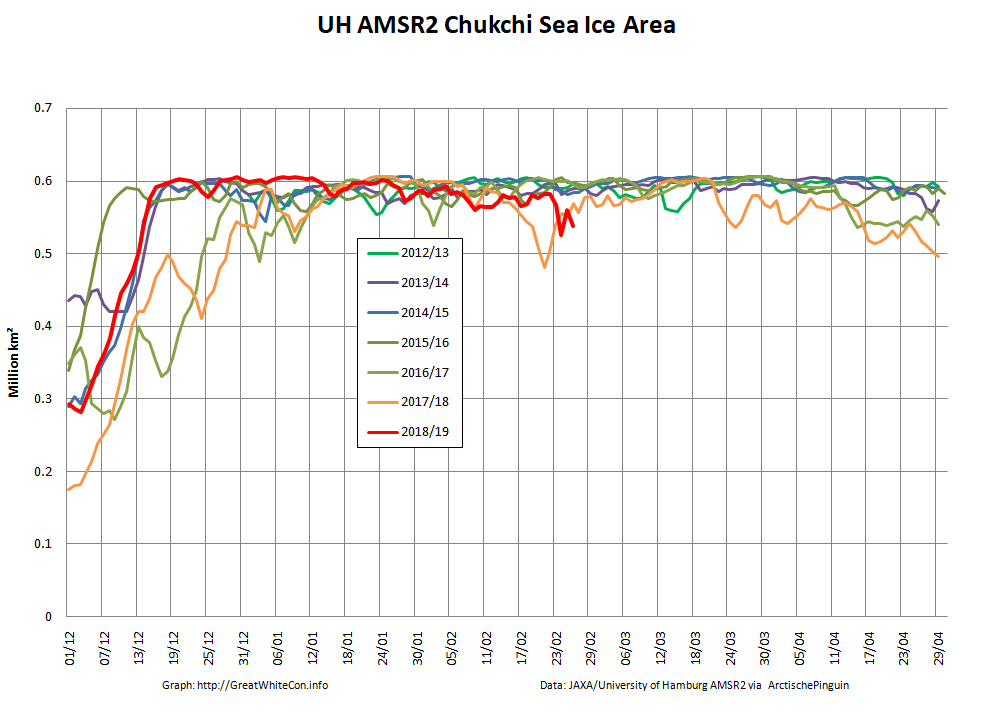
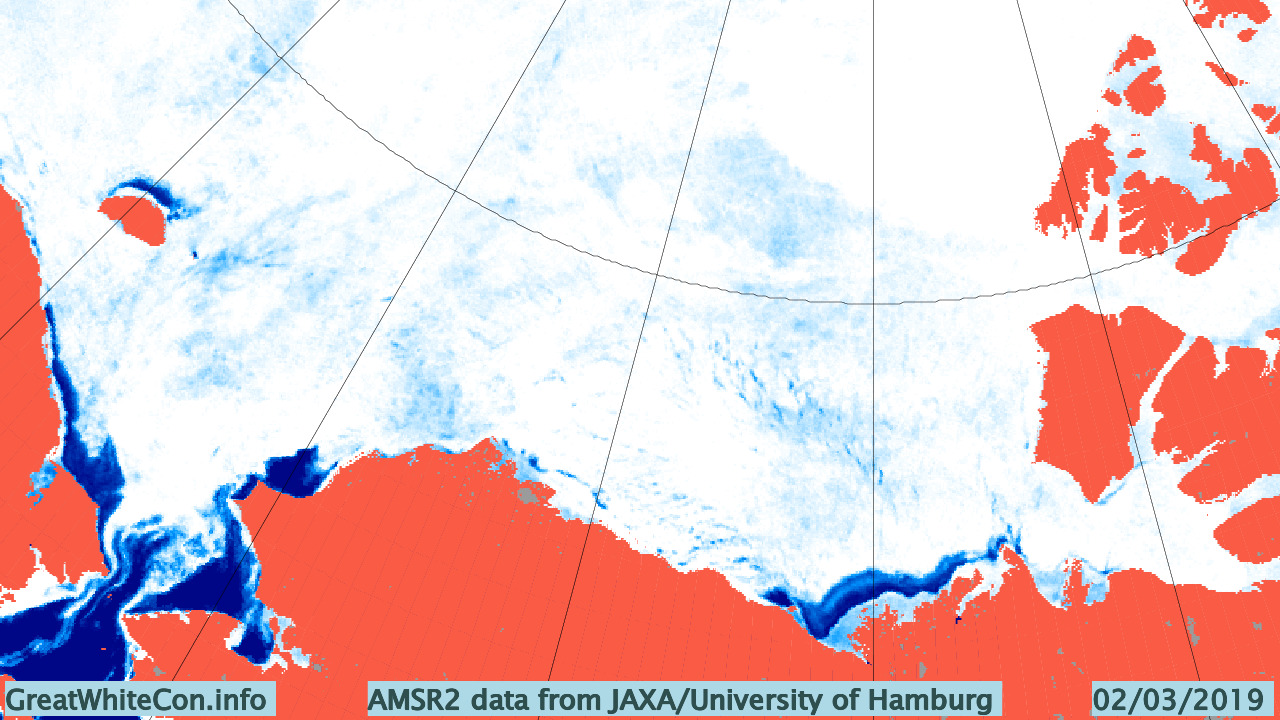
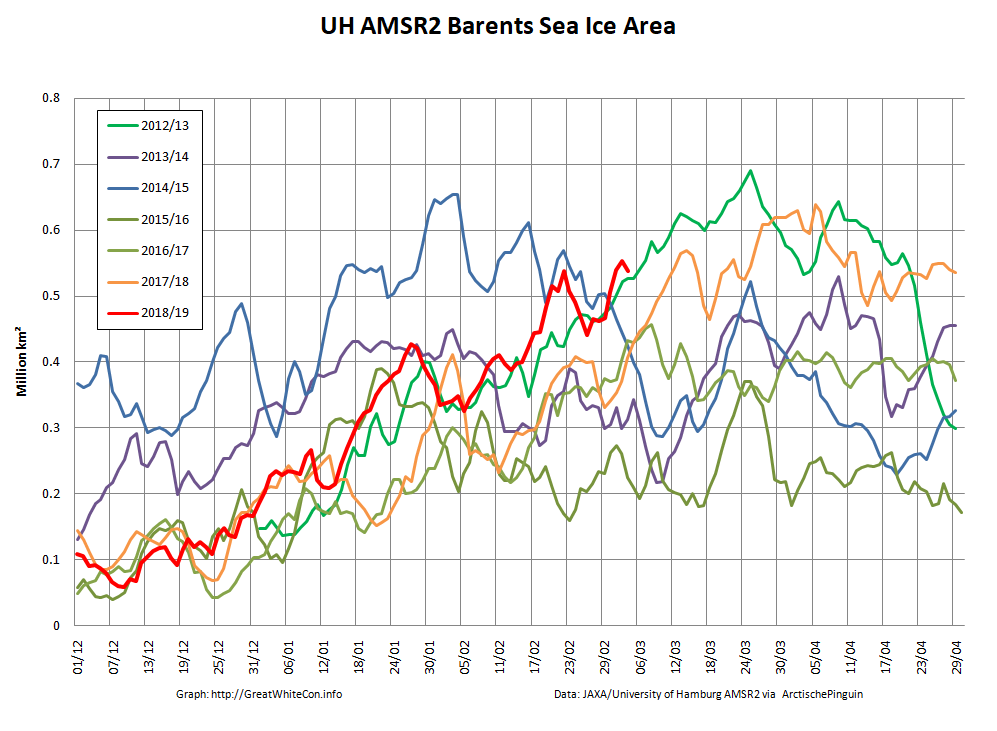
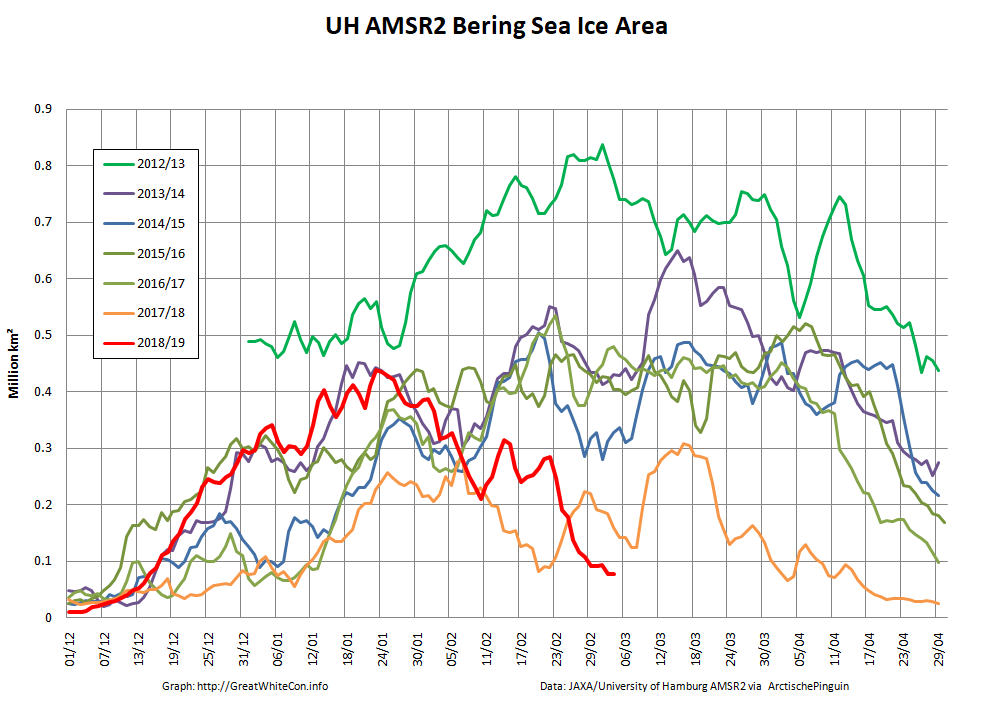
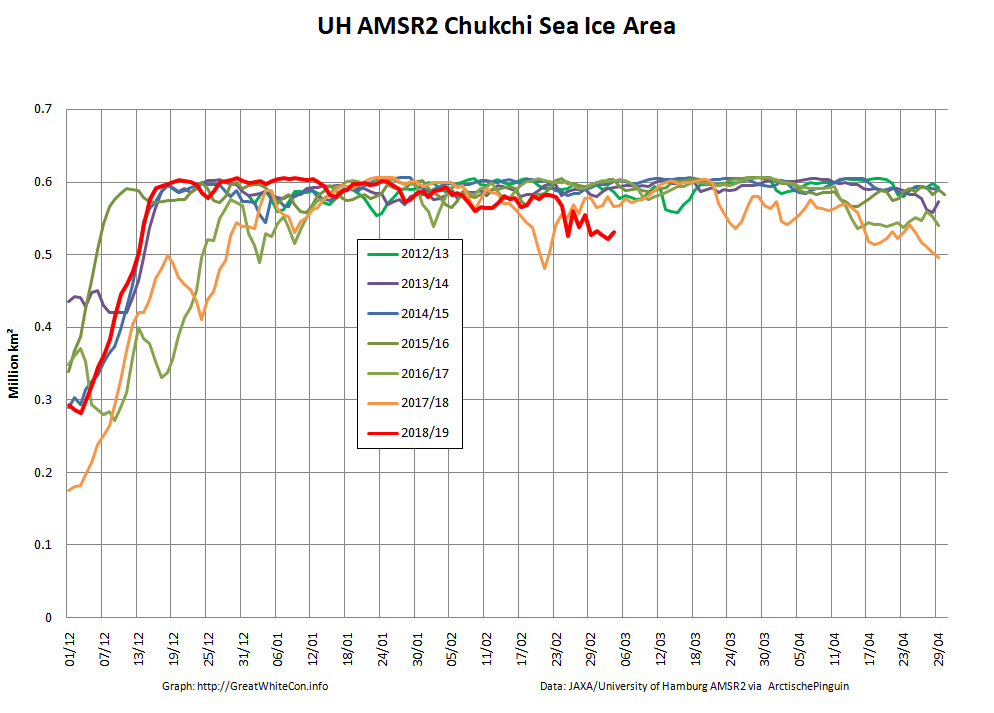
Whilst overall Arctic sea ice area is unremarkable for the current decade, sea ice area in the Bering Sea is remarkable low for the time of year! What’s more much like last year the Chukchi Sea is not currently full to overflowing with sea ice, and is also lowest for the date in the AMSR2 satellite records:
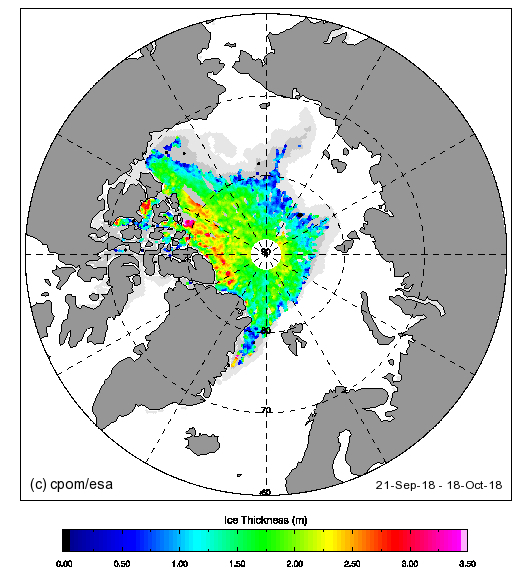
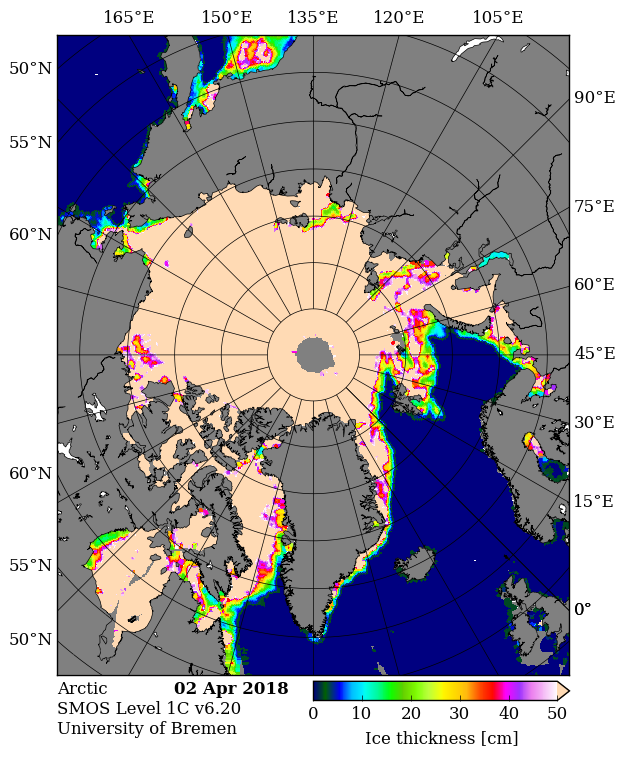
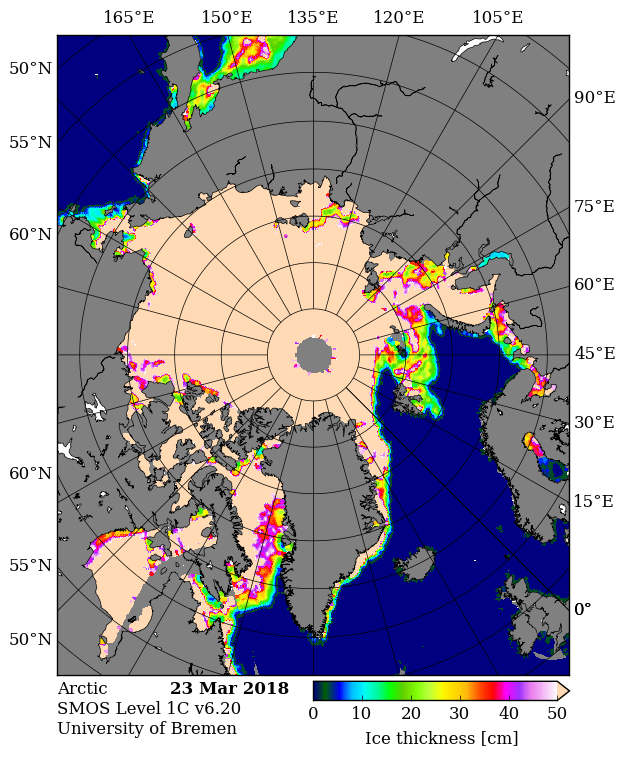
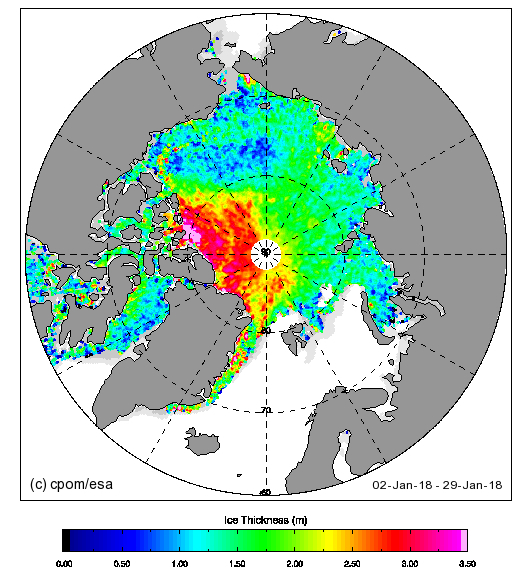
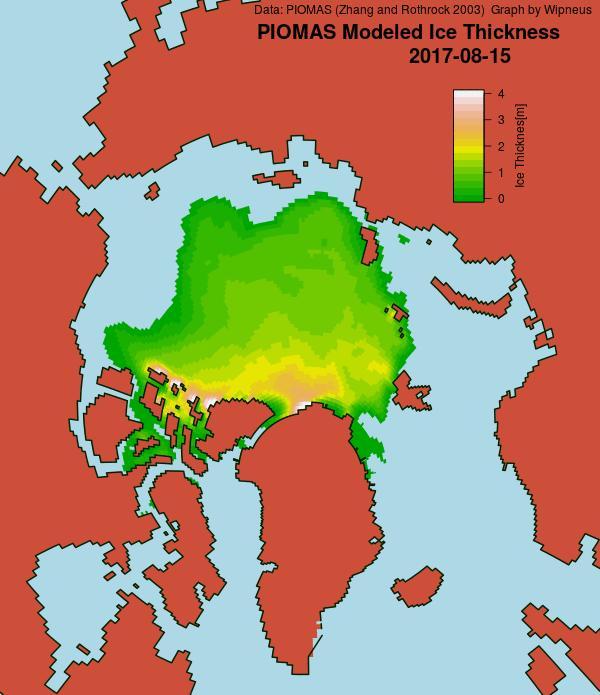
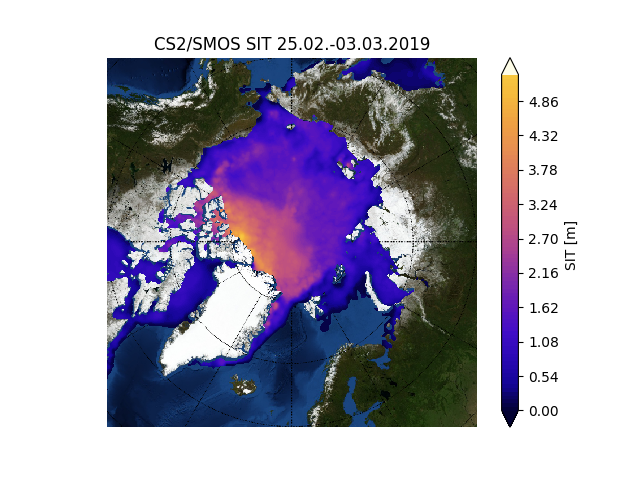
I’ve also been experimenting with the new gridded CryoSat-2/SMOS thickness data from the Finnish Meteorological Institute, which reveals this:
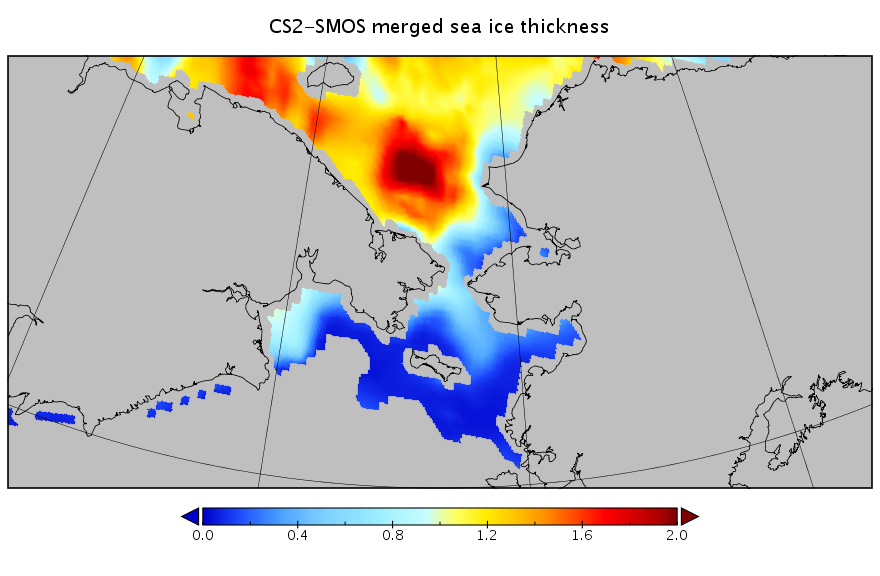
That’s a weekly overview dated February 24th, but it does perhaps explain how such a large area of sea ice could melt so swiftly?
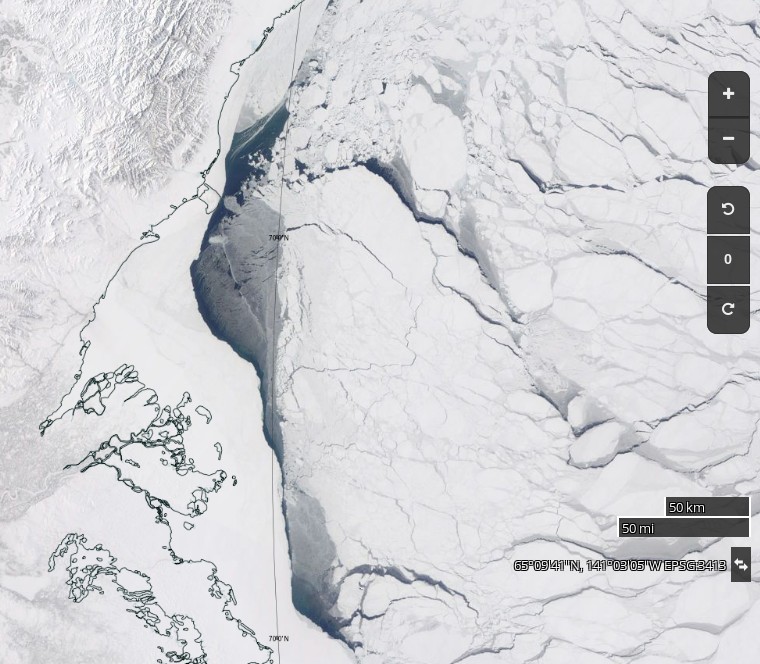
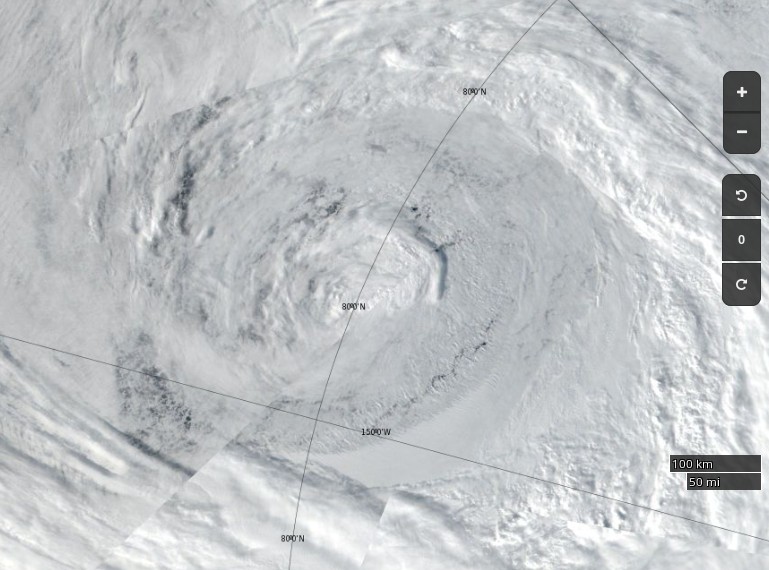
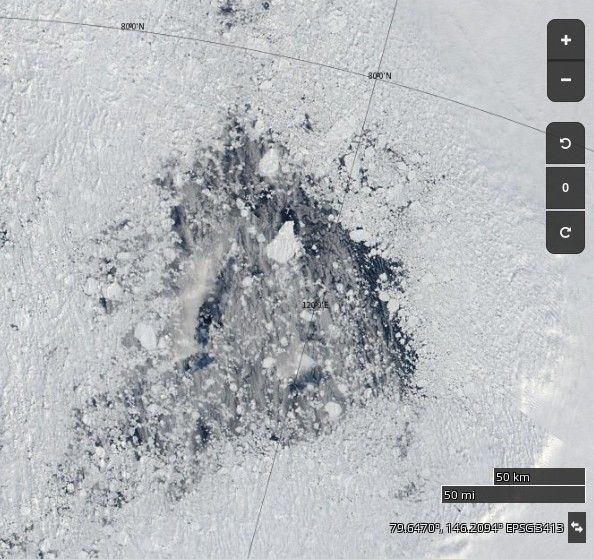
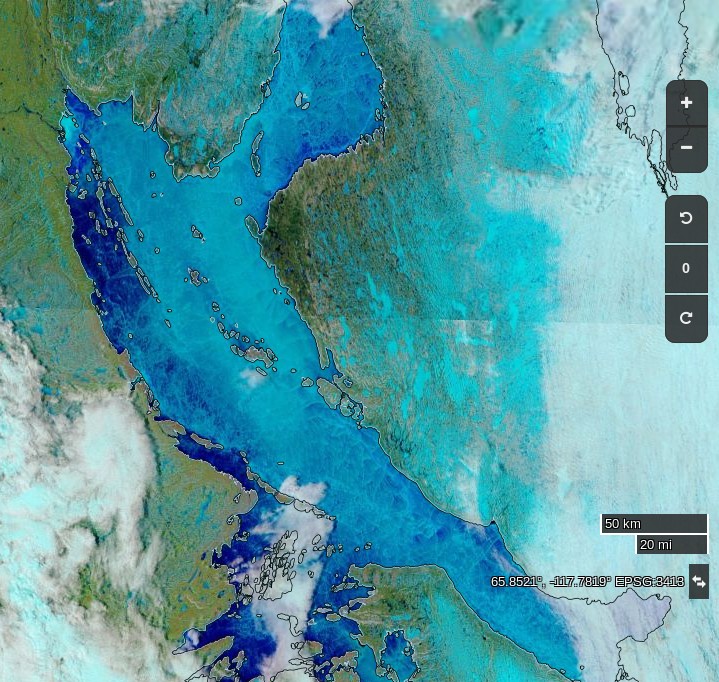
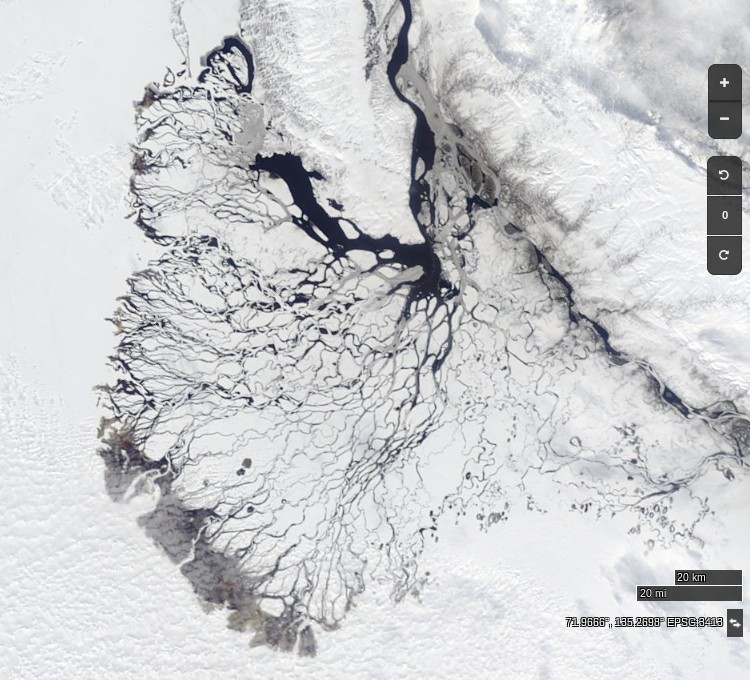
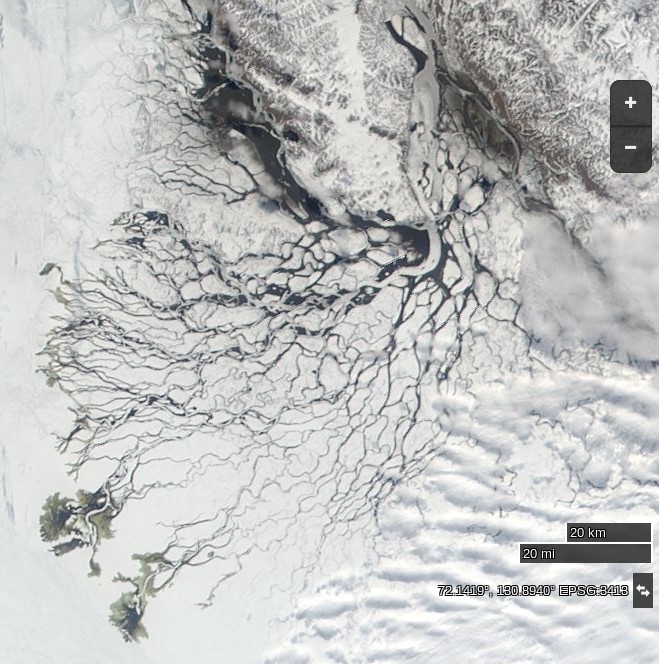
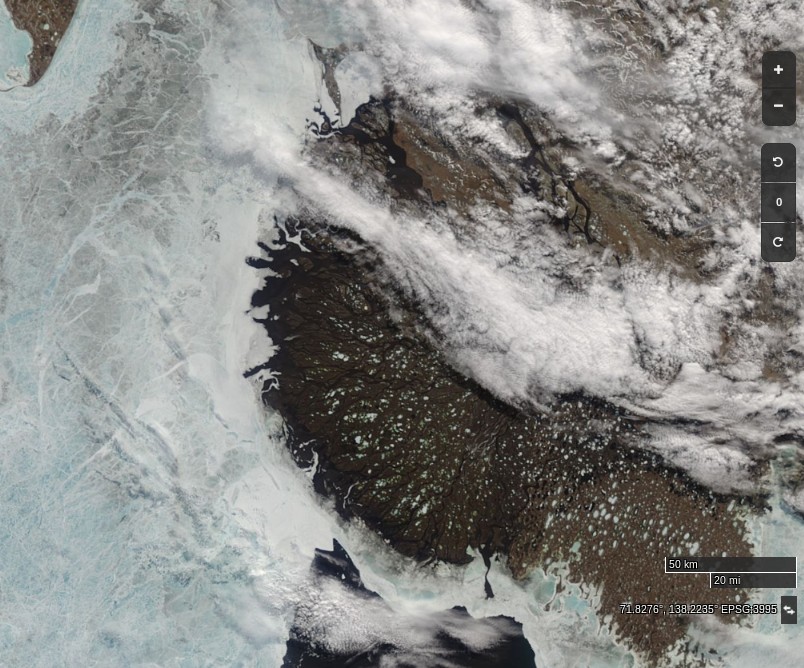
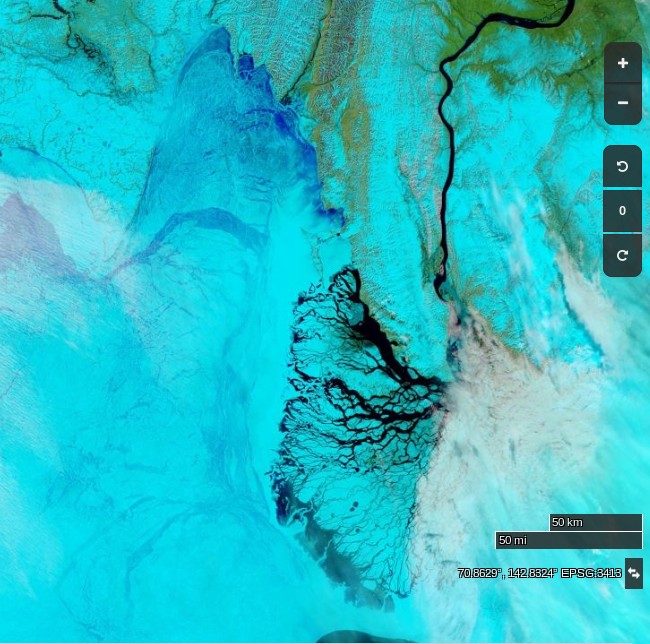
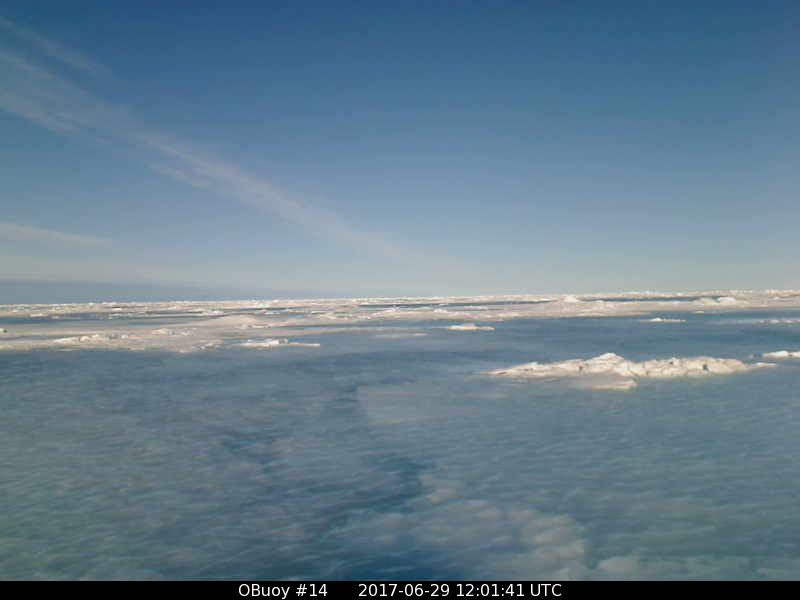
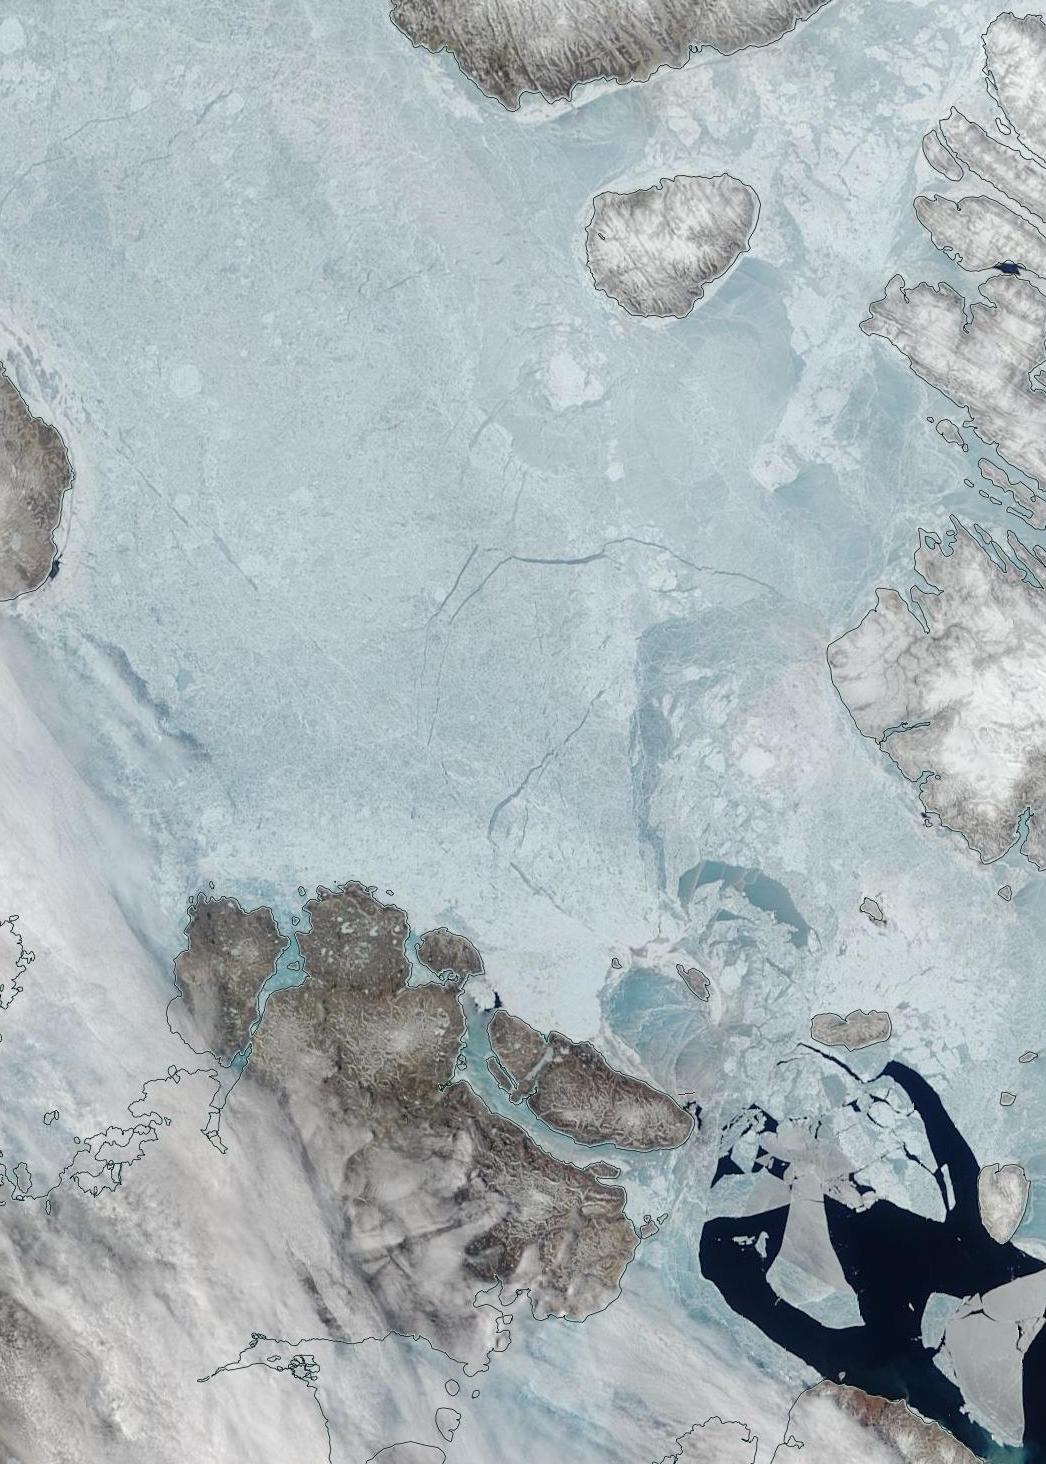
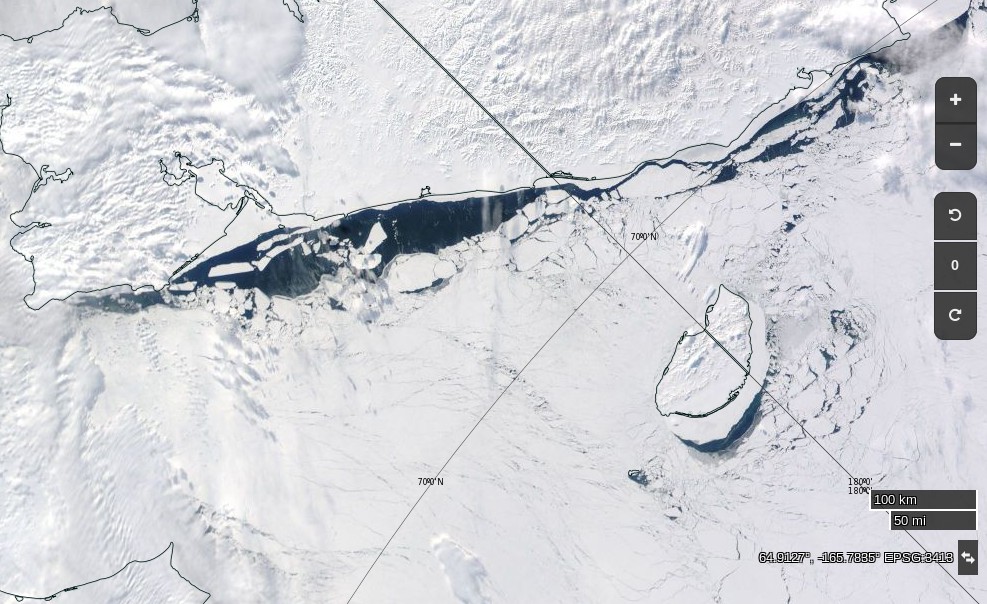
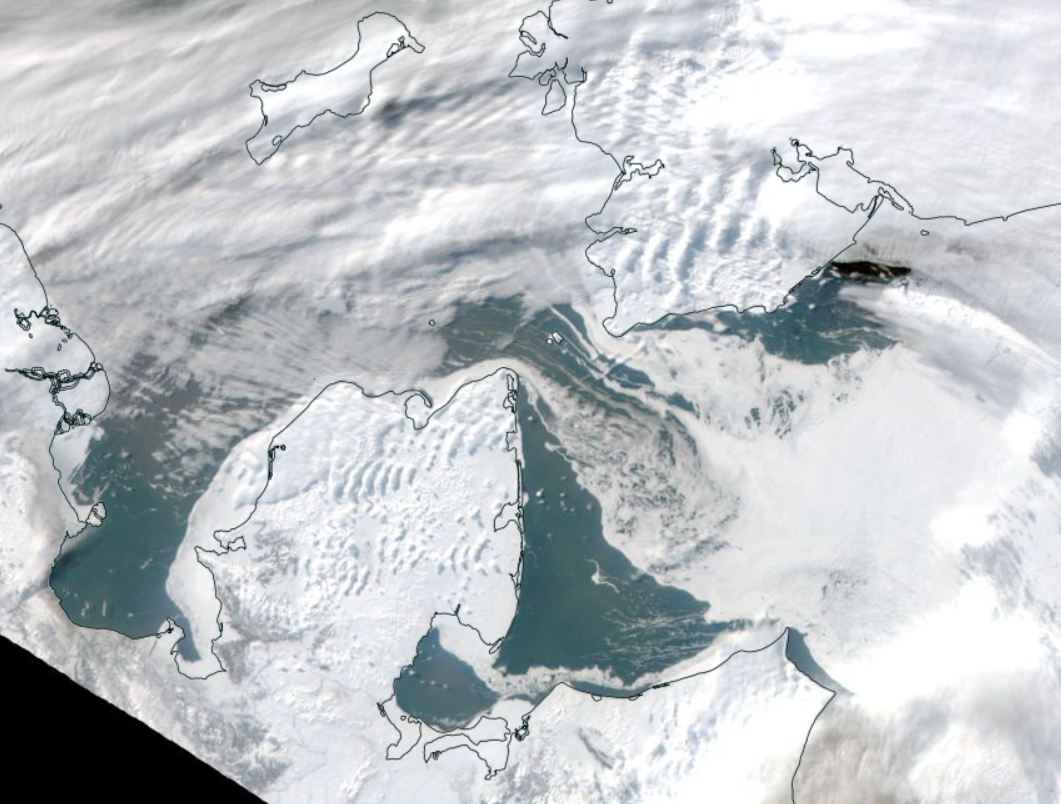
As luck would have it the skies are reasonably clear over the Bering Strait this morning (UTC). Here’s Terra’s view from on high of the current situation:
The “low resolution” version of JAXA extent has fallen once again today:
Do you suppose that the current maximum of 14.19 million square kilometers on February 22nd will hold until All Fools’ Day and beyond?
An animation of recent movements of sea ice in the Bering and Chukchi Seas:
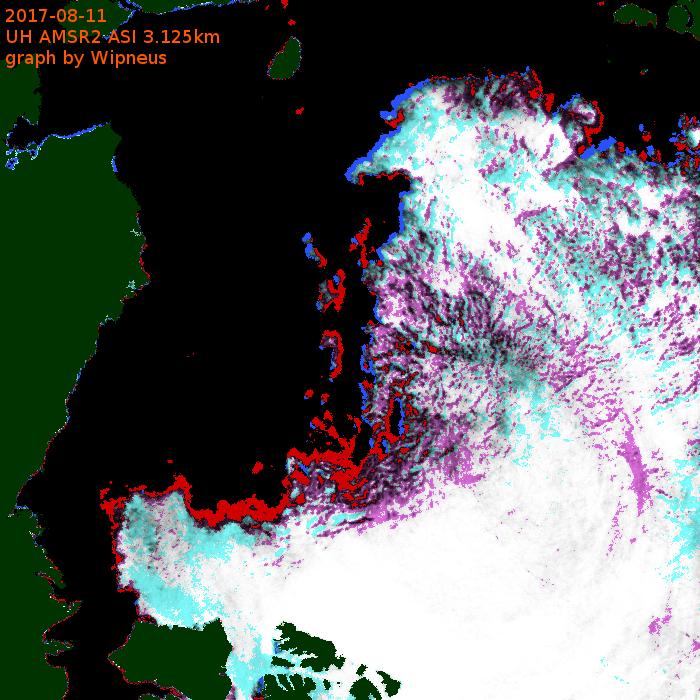
Note the recent spread of open water across the southern Chukchi Sea.
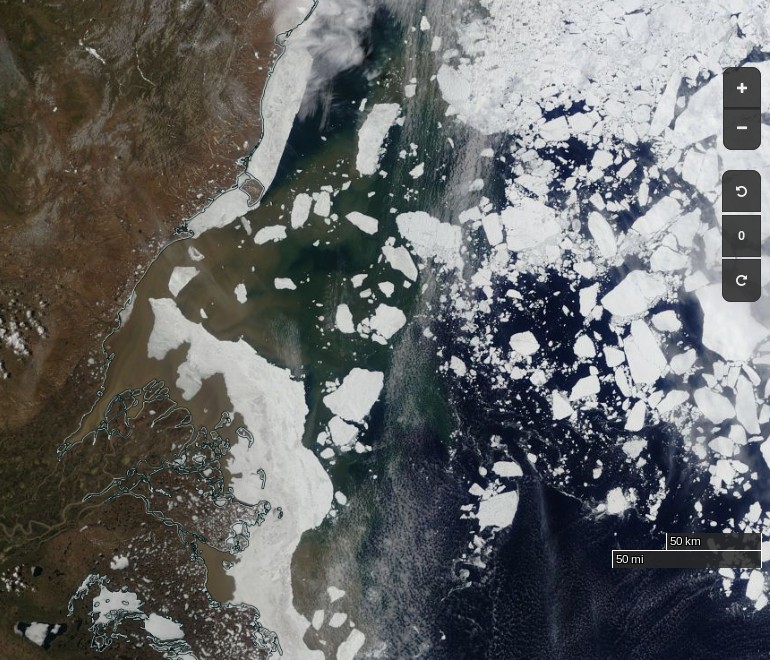
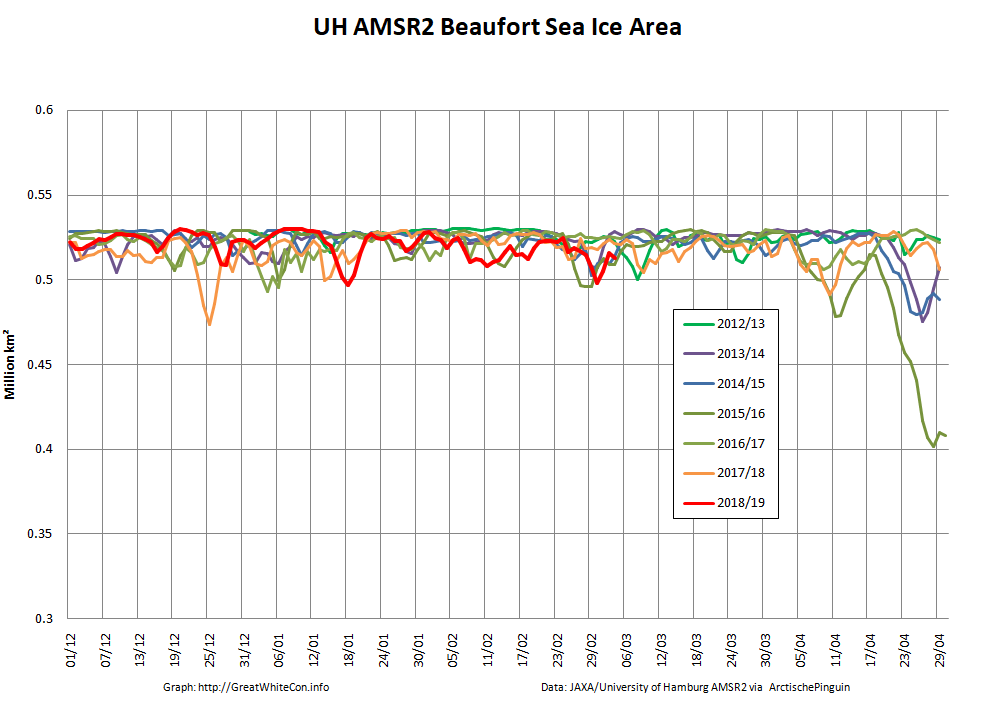
Another angle on the Chukchi Sea, plus significant areas of open water now becoming evident in the Beaufort Sea:
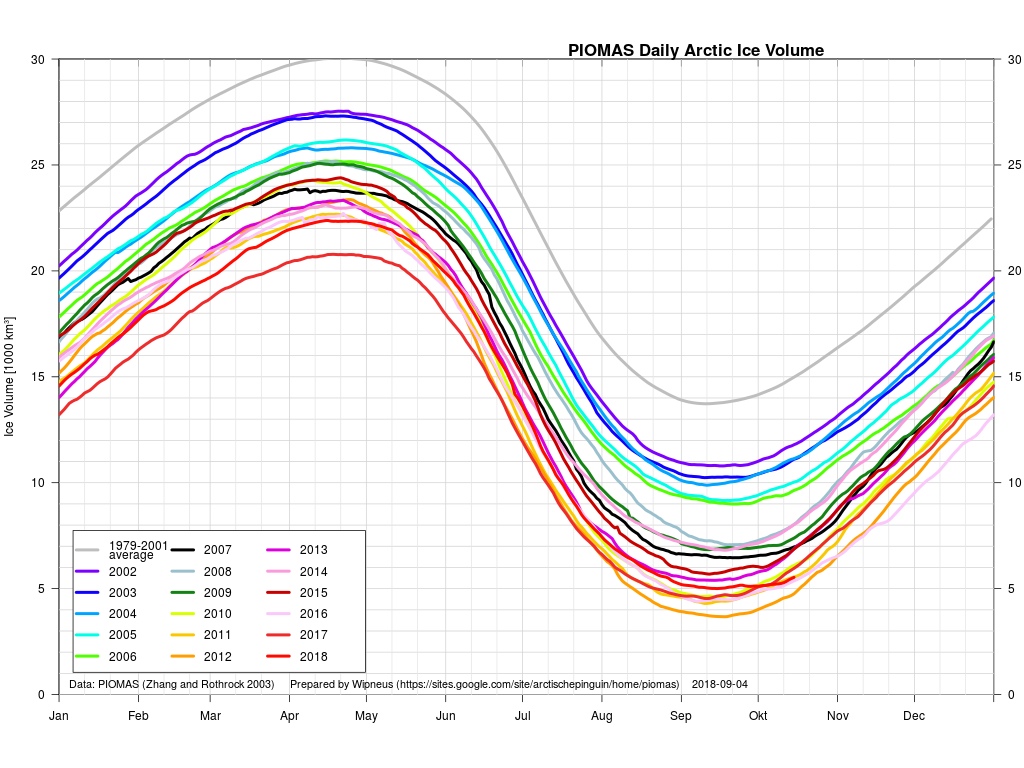
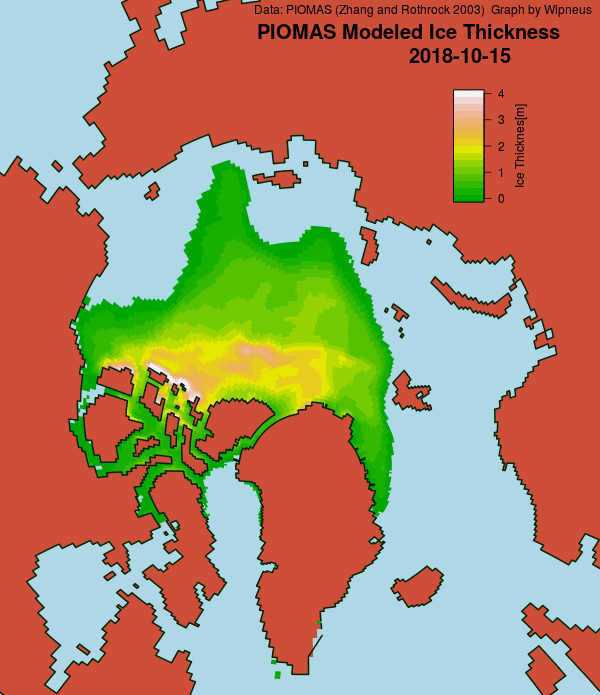
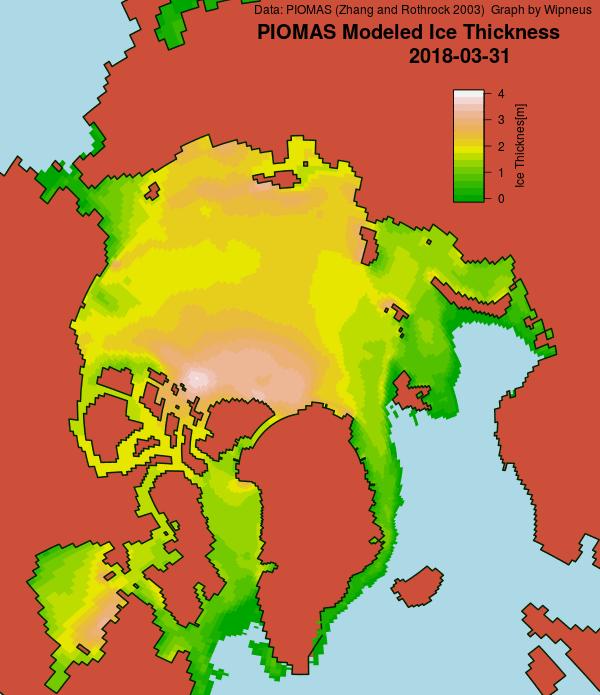
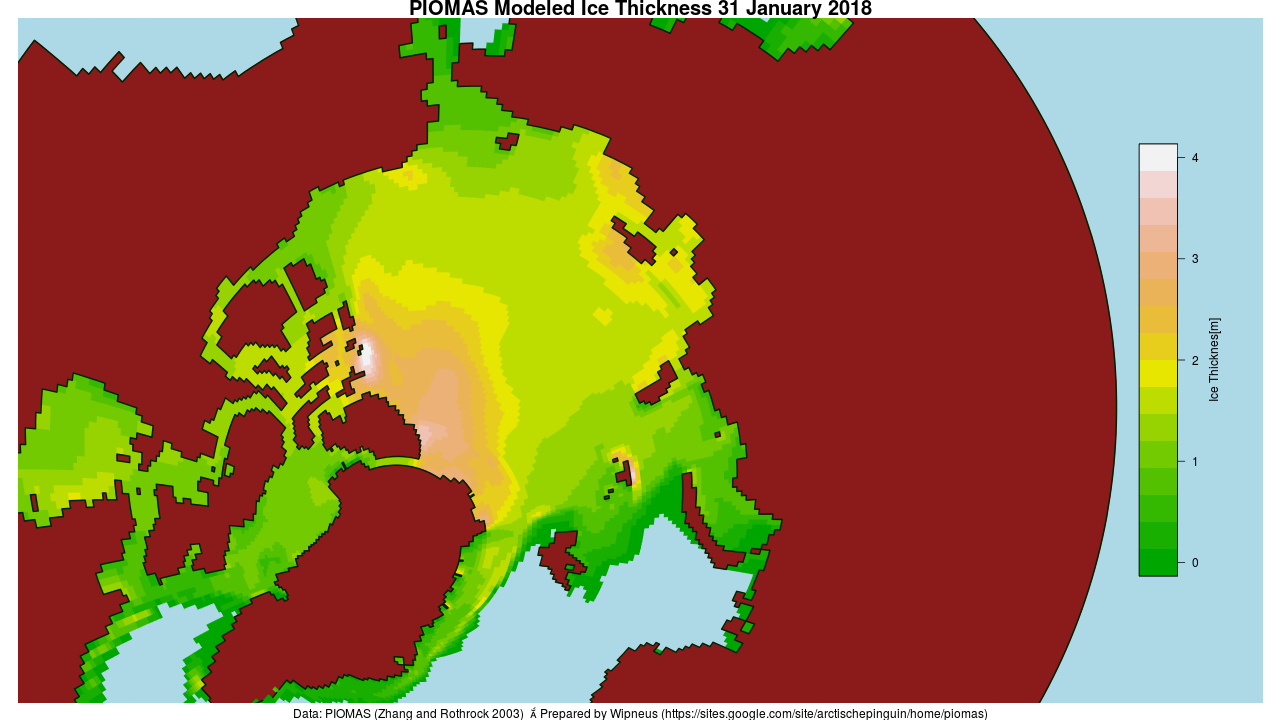
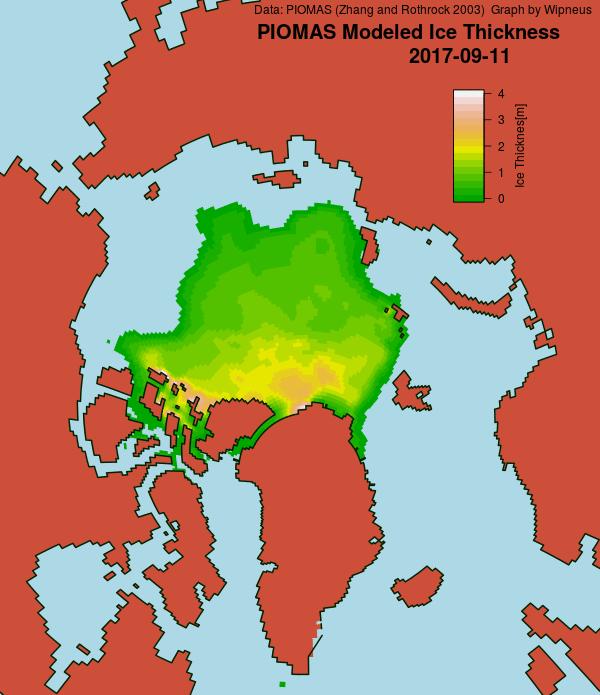
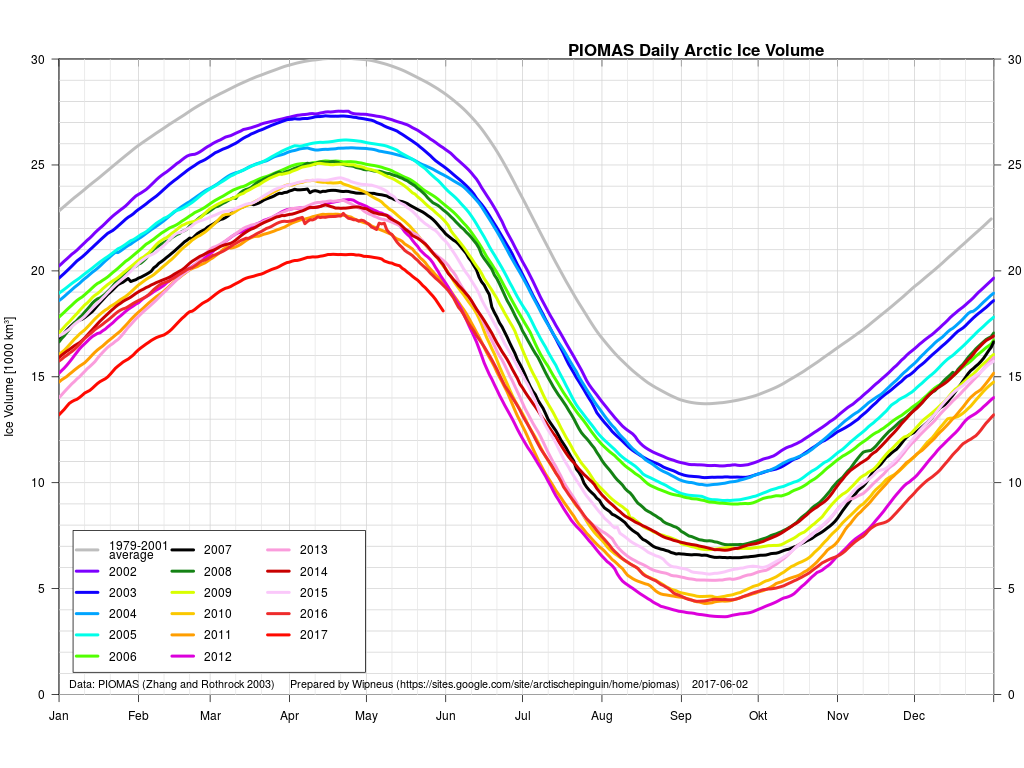
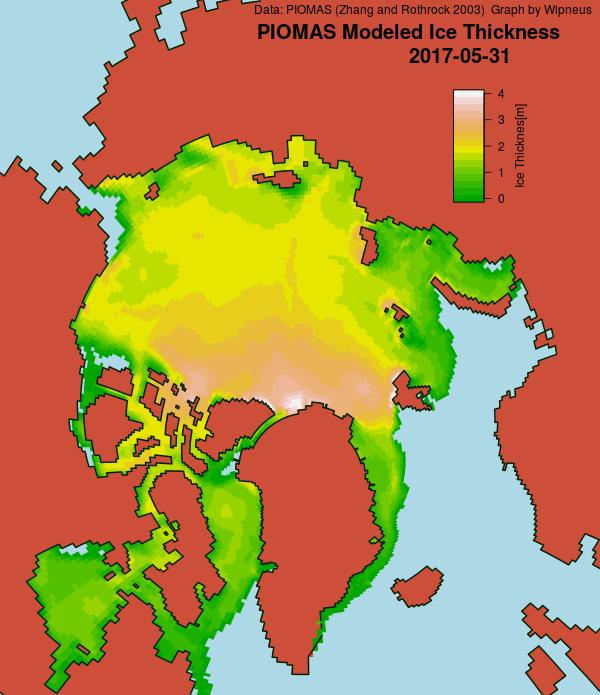
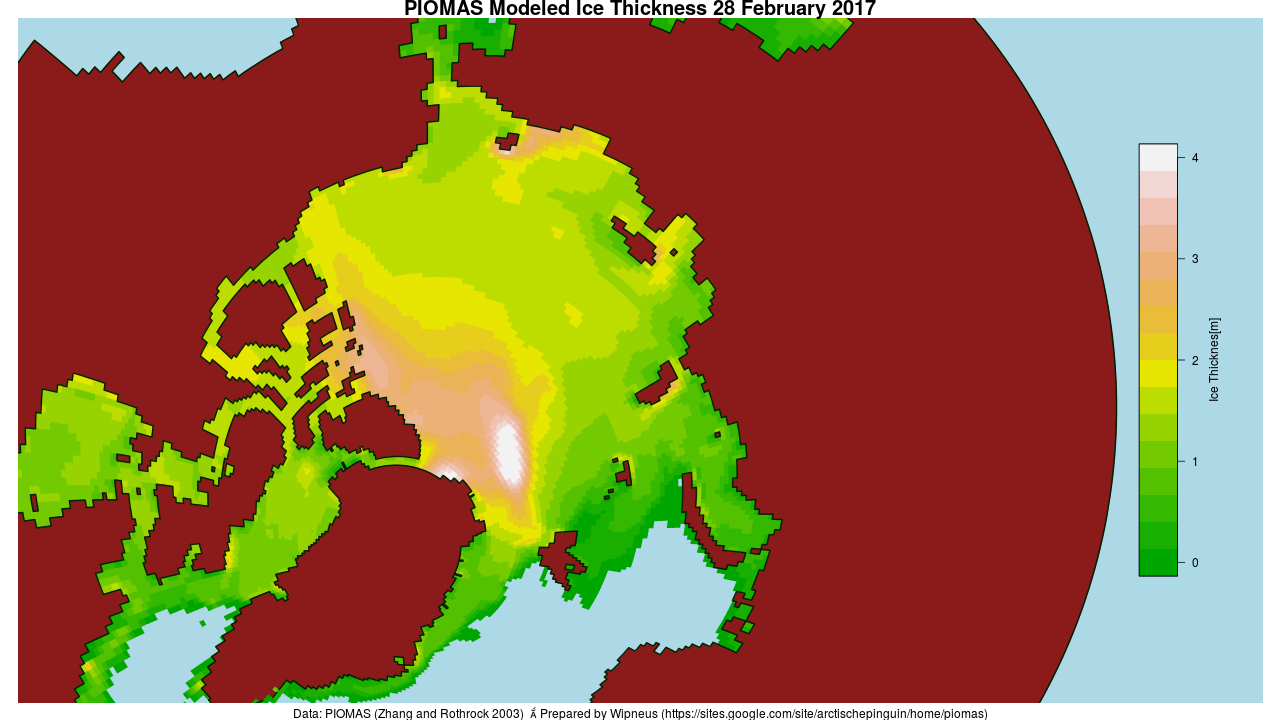
Some alternative views on Arctic sea ice thickness:
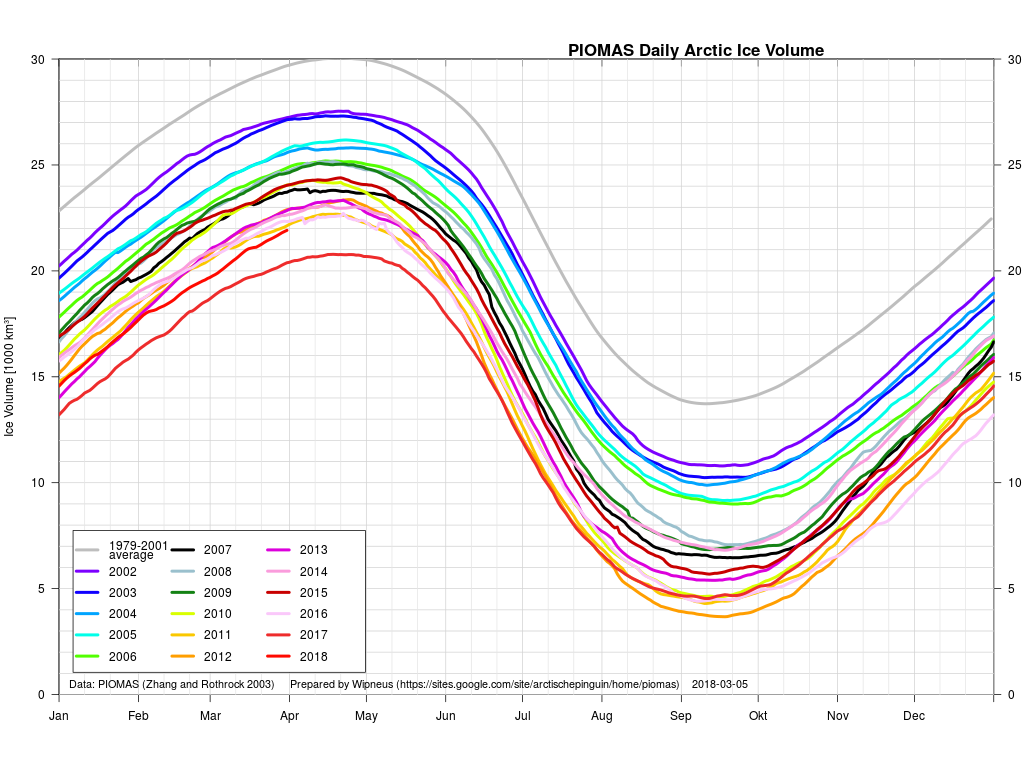
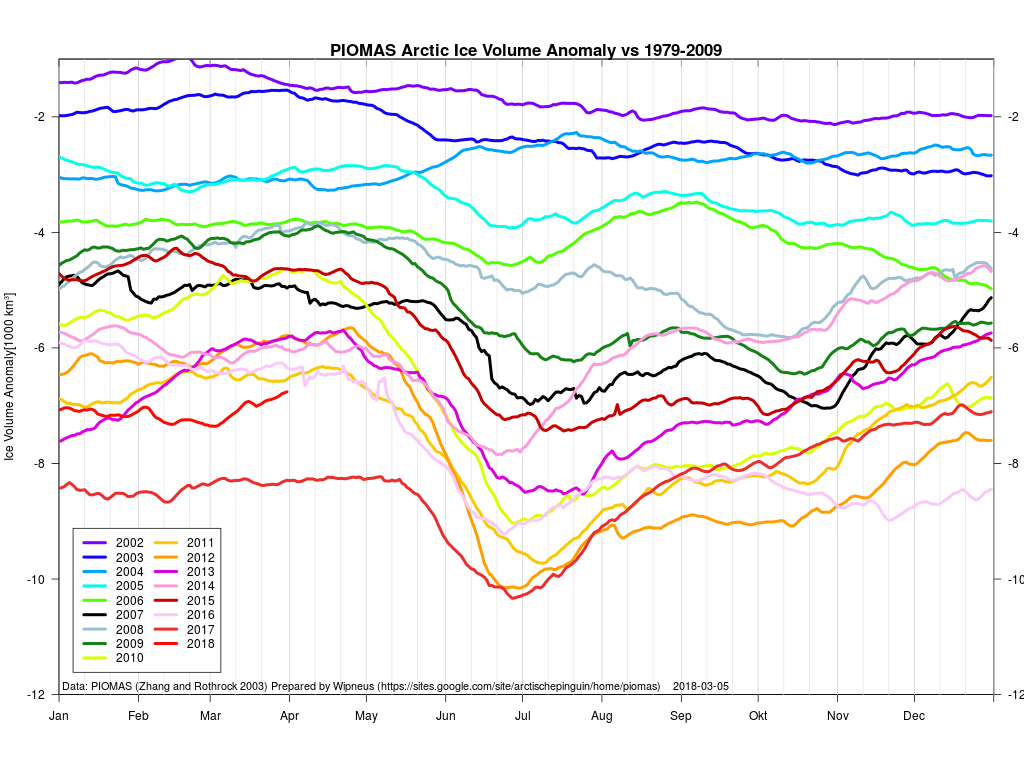
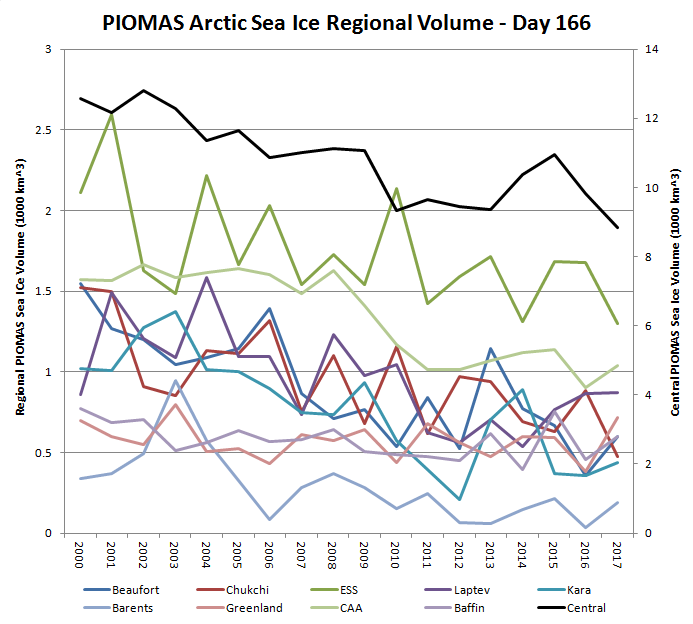
PIOMAS via Wipneus:
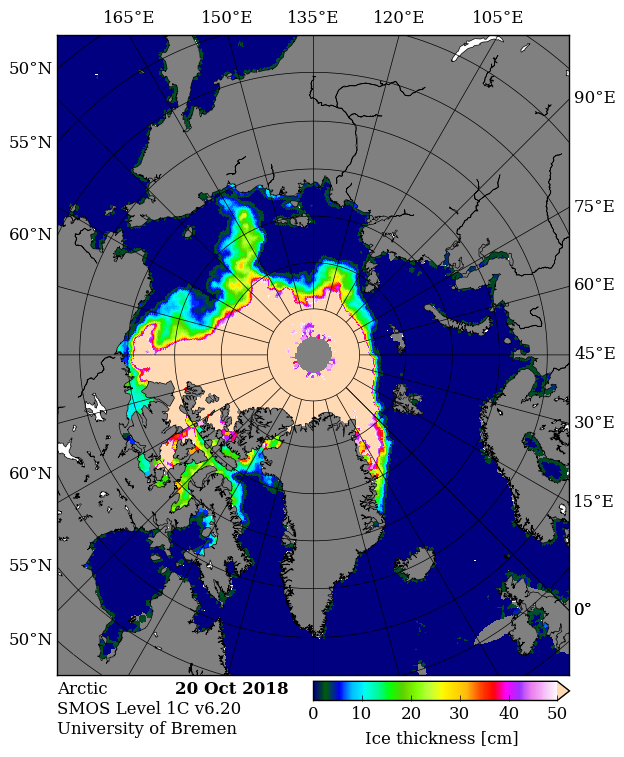
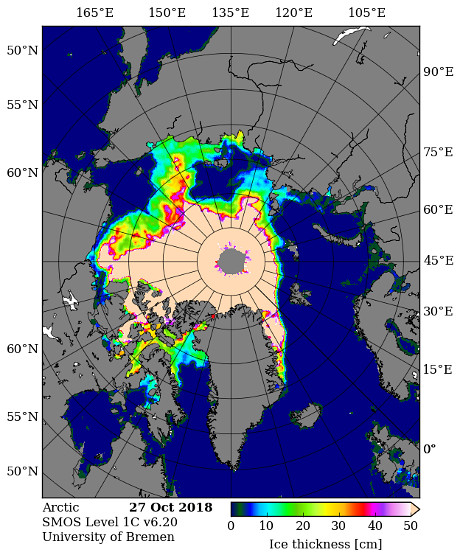
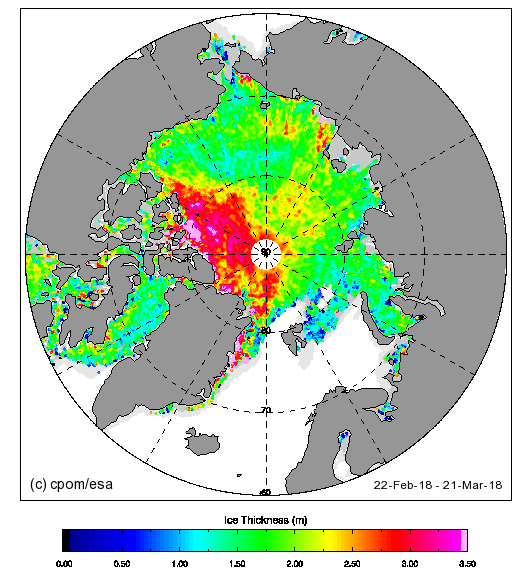
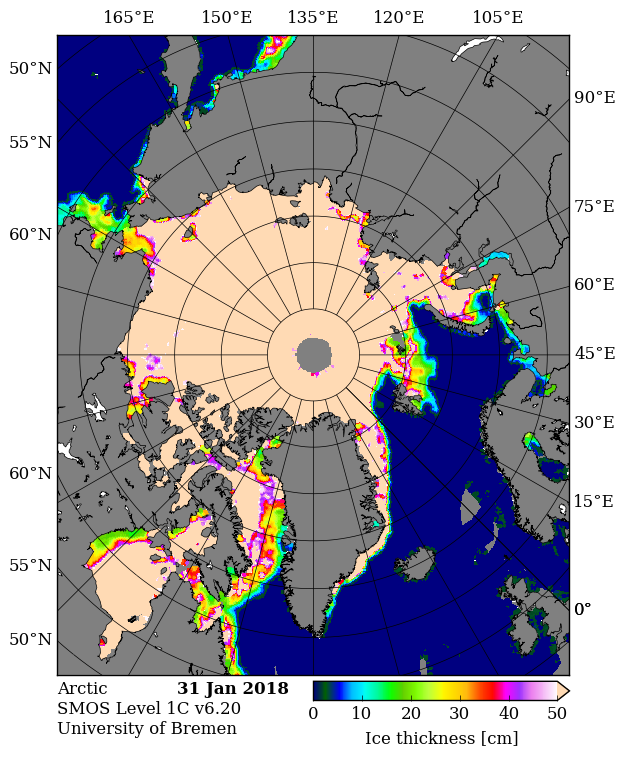
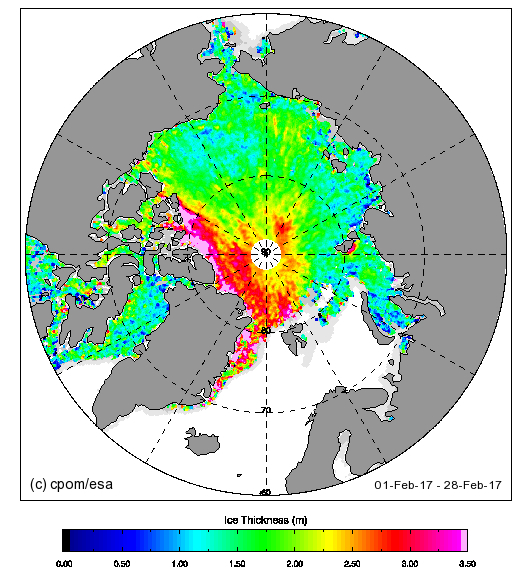
Blended CryoSat-2/SMOS:
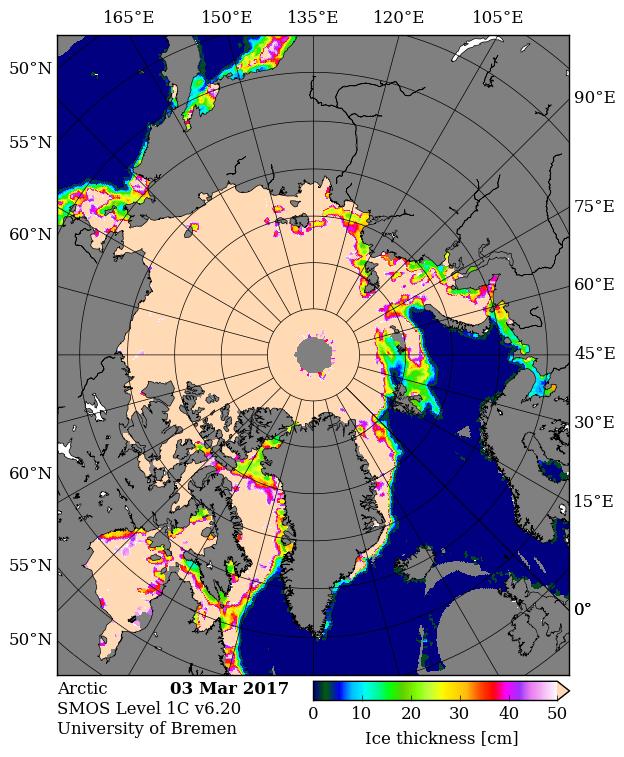
plus close ups of the Bering/Chukchi area:

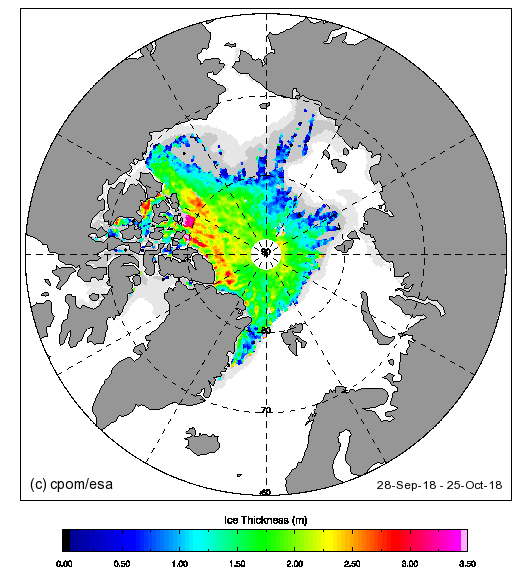
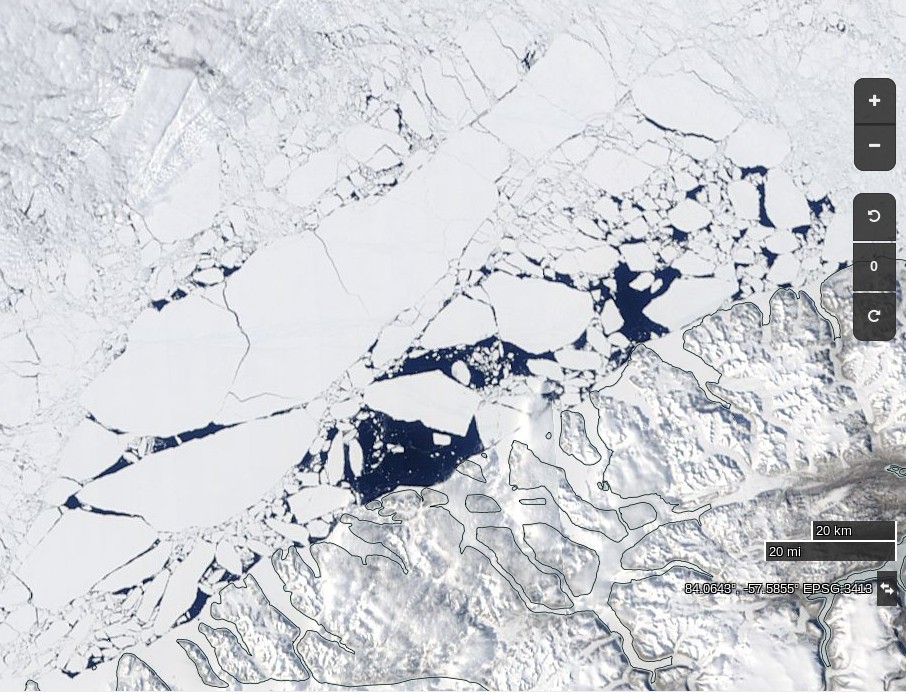
and the Atlantic periphery:
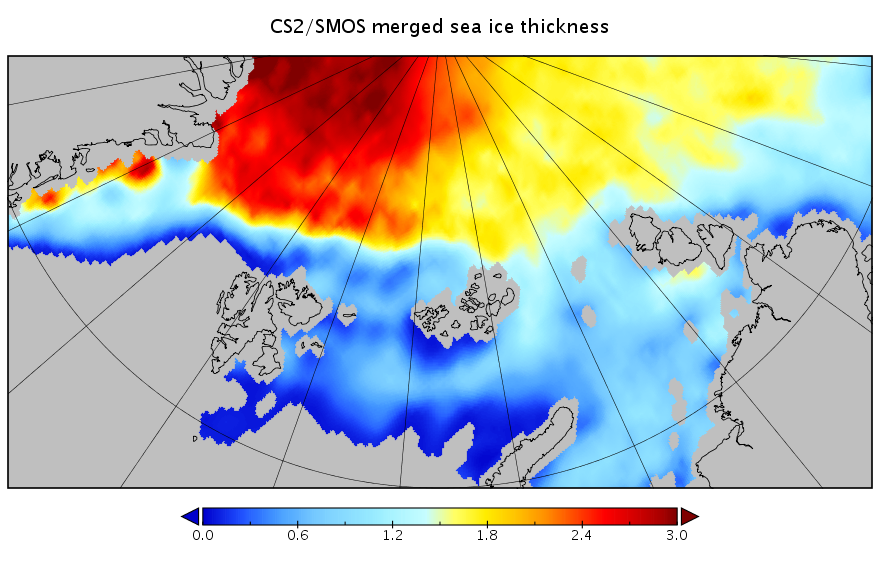
Please note the change of scale.
Arctic sea ice extent is currently rebounding:
although not in all the peripheral seas:
High resolution AMSR2 area and extent both declined today:


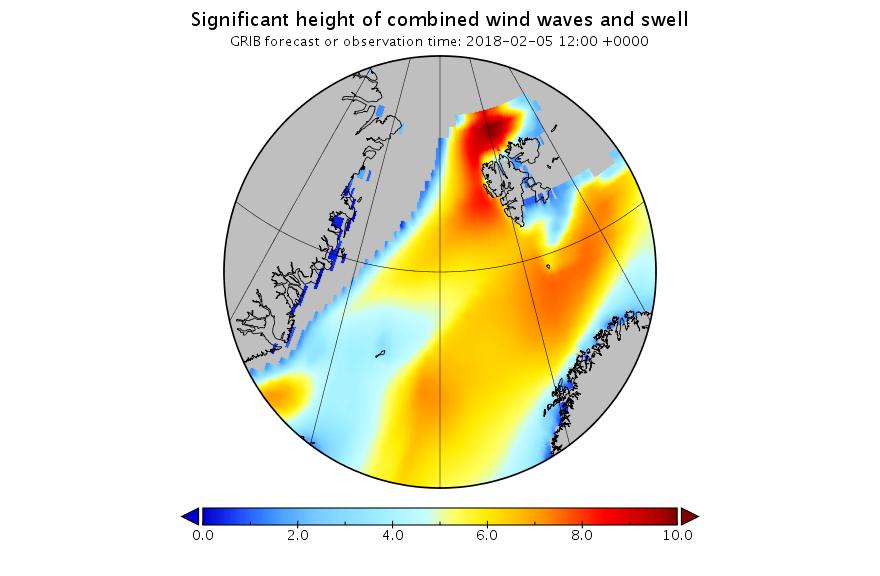
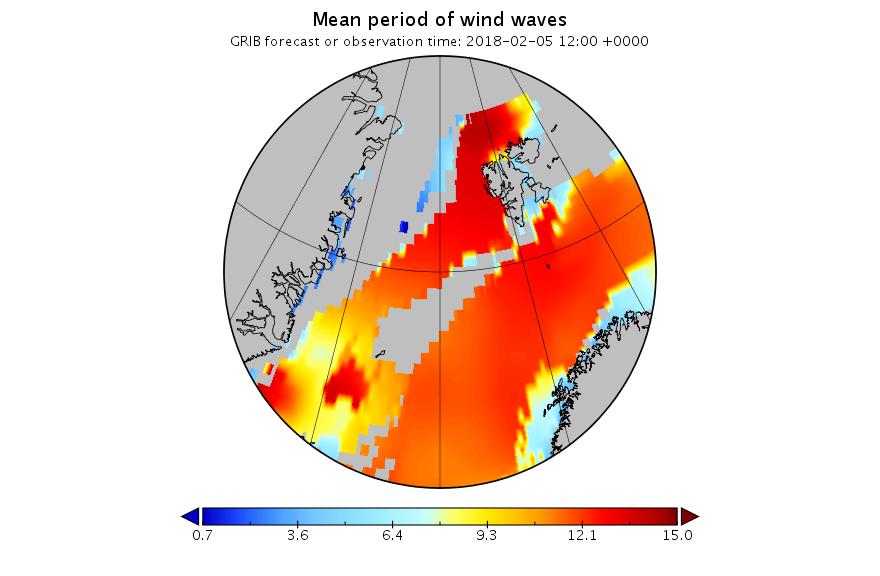
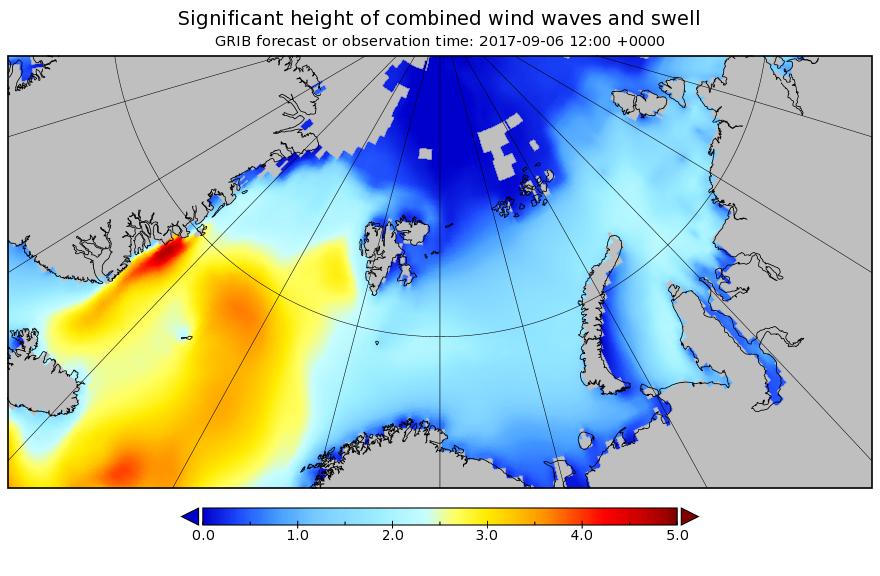
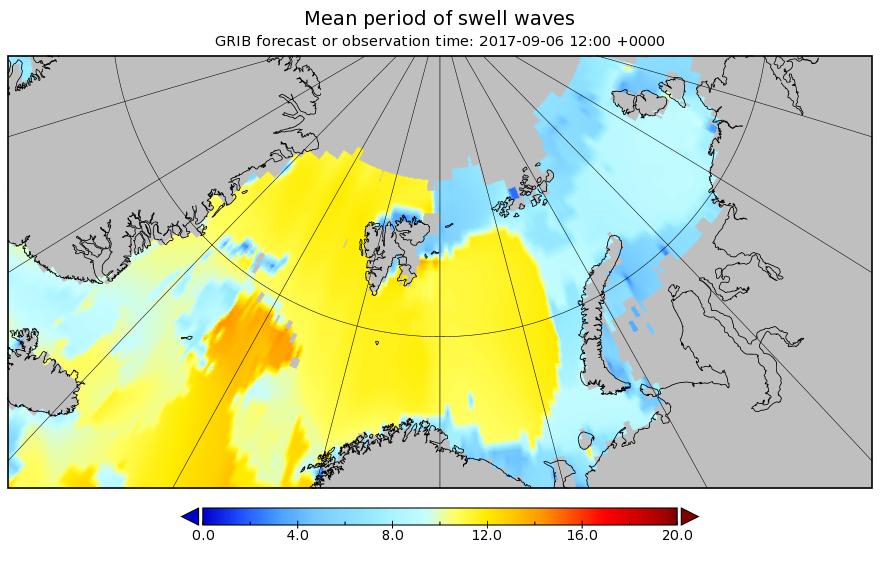
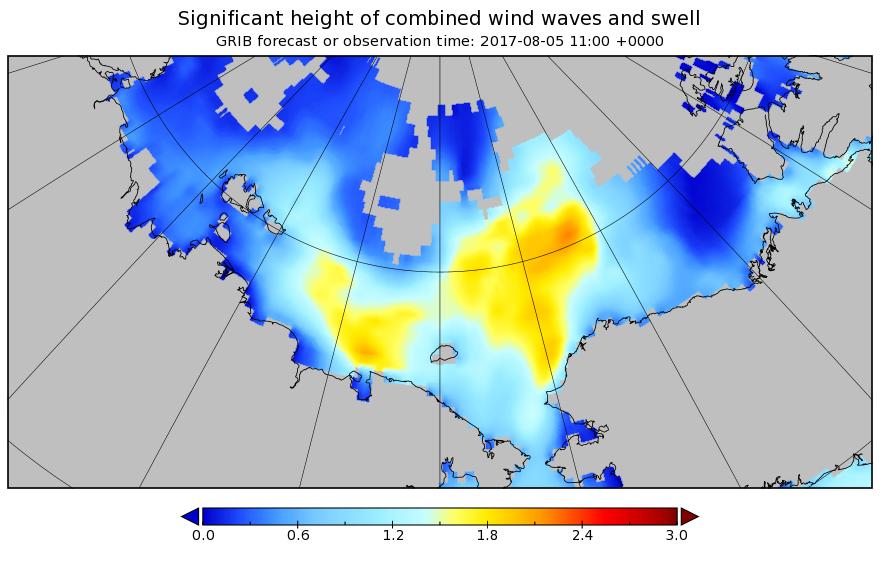
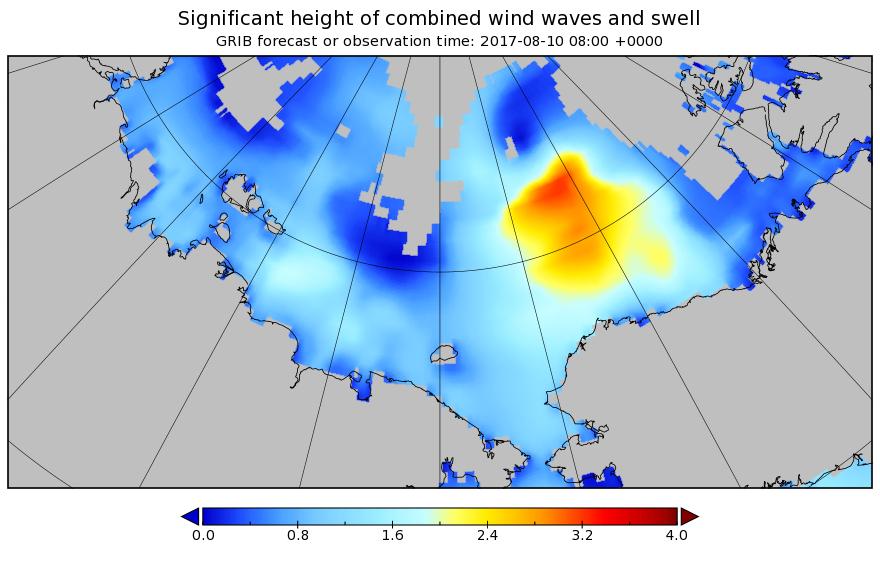
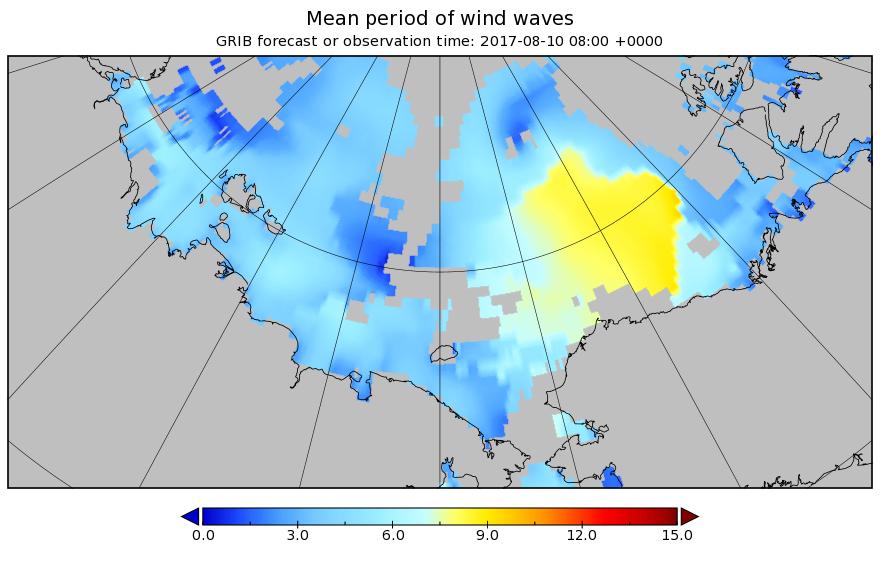
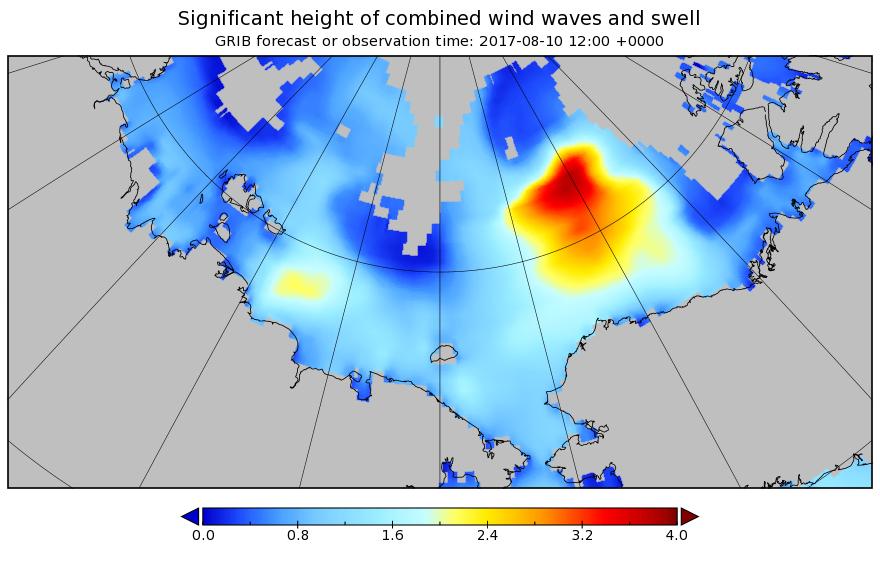
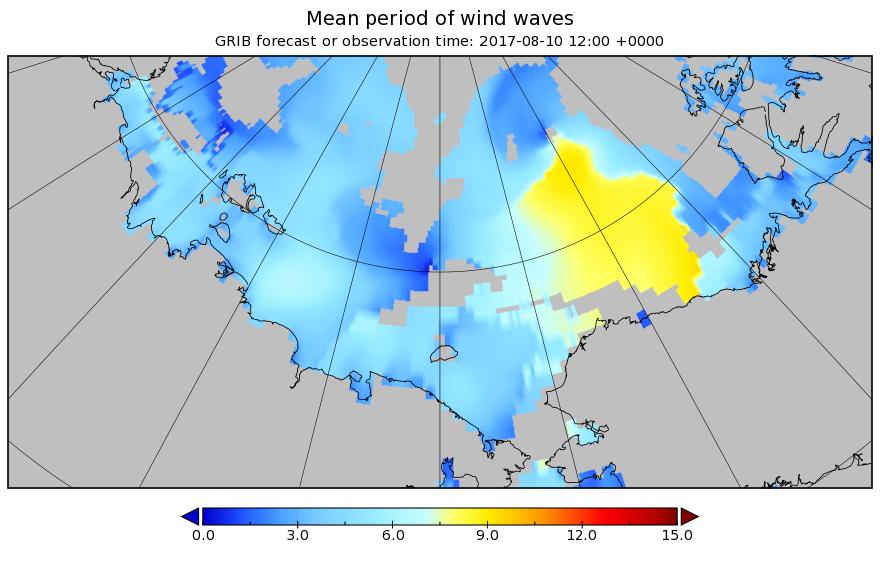
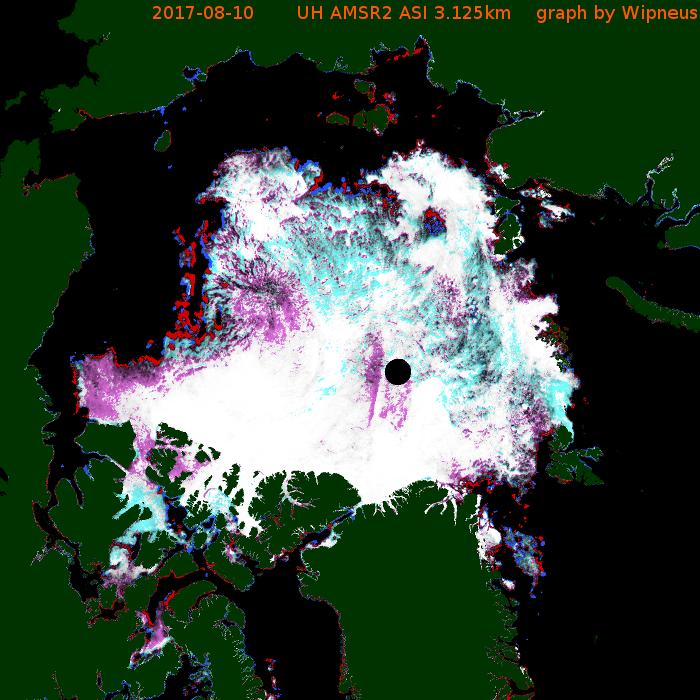
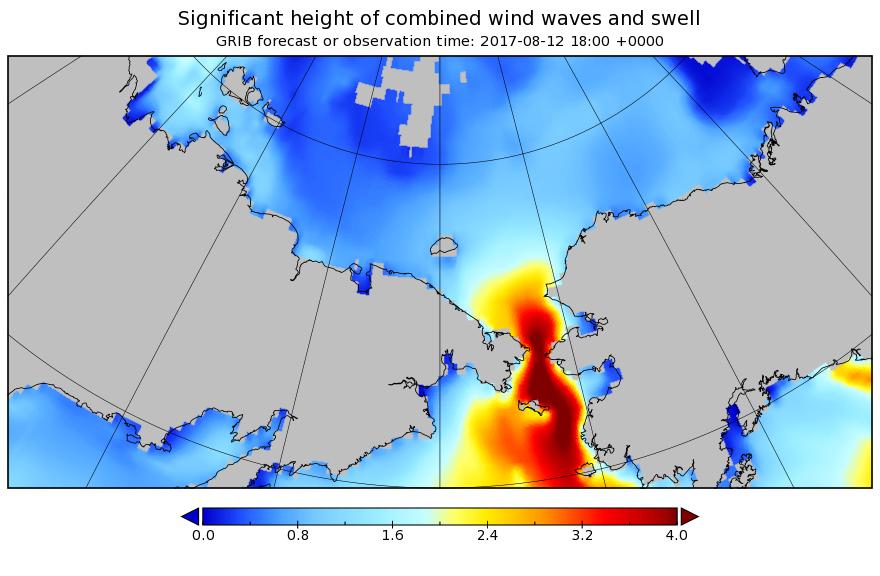
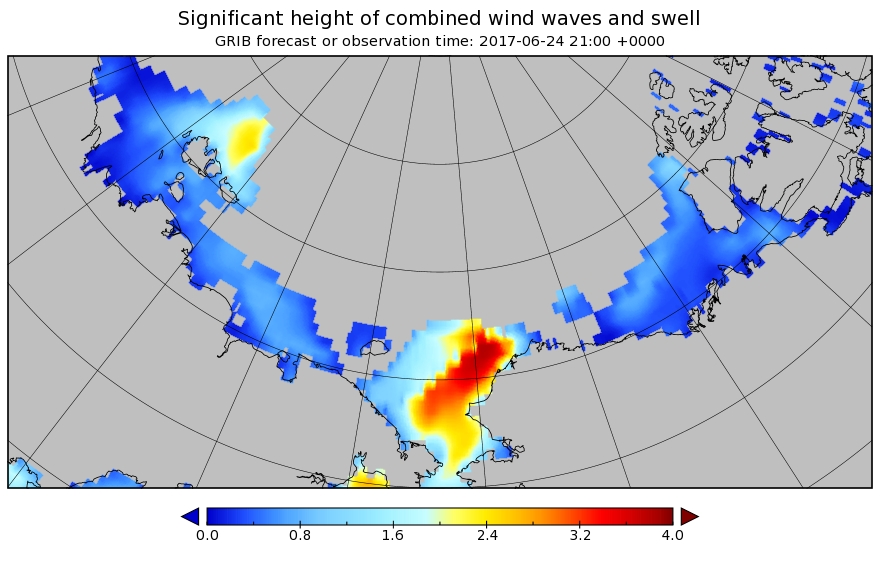
Long distance swells are already reaching the Bering Sea, with much more to come:

Wipneus’ trusty Raspberry Pi hasn’t crunched the high res AMSR2 numbers yet, so let’s take a look at some other extent metrics.
Here’s JAXA’s “low res” AMSR2 numbers:
Here too is the NSIDC’s 5 day average:
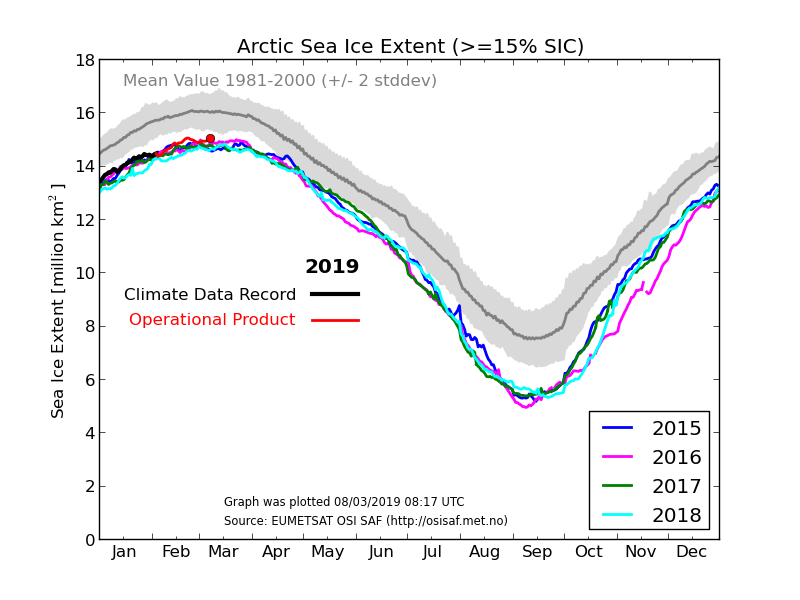
By special request from Michael Ohere for the first time is the DMI’s take on Arctic sea ice extent:
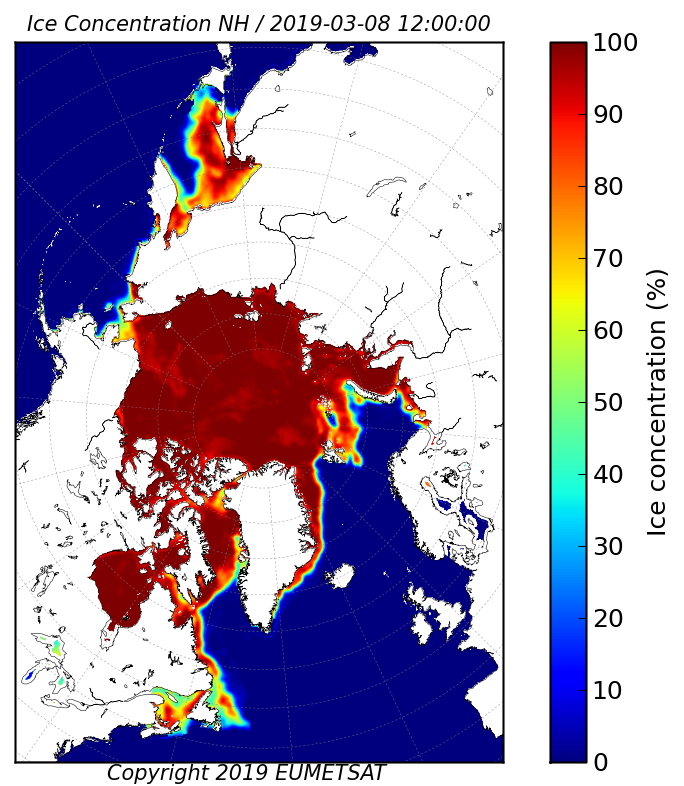
In addition, here is the underlying sea ice concentration data from the OSI-SAF:
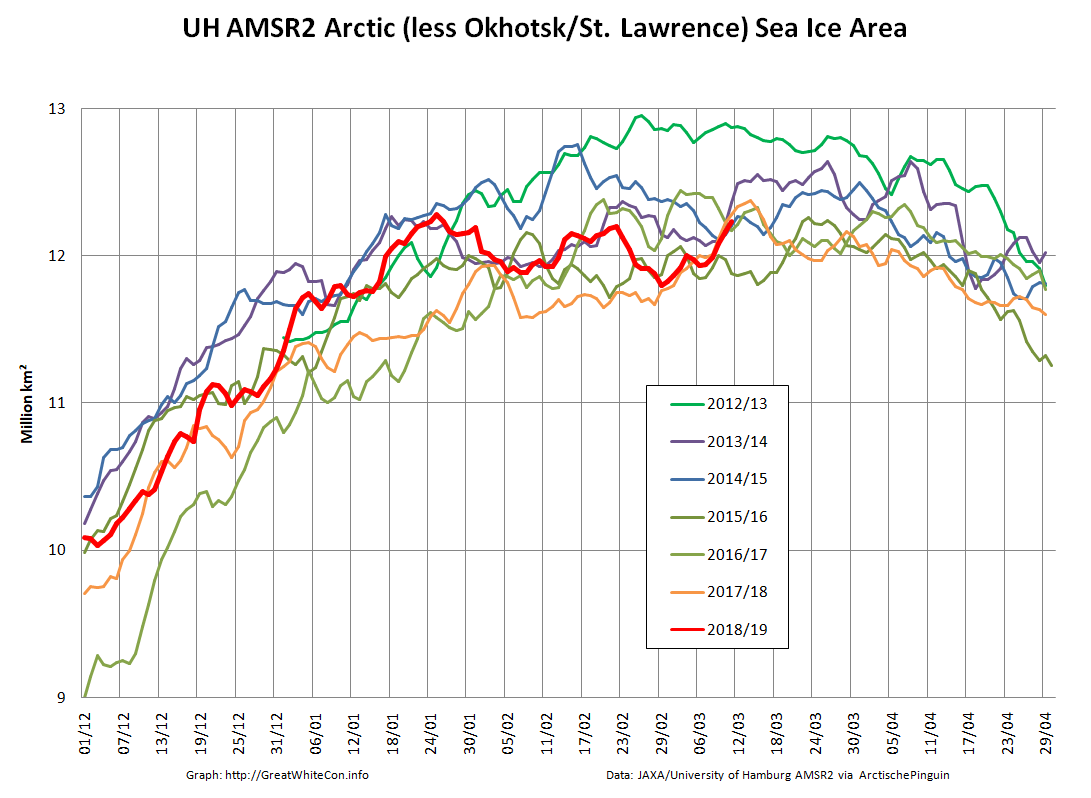
Since Michael is also asserting that there currently exists “the greatest February Arctic sea ice extent (according to DMI) in your blog’s history”, here’s Arctic sea ice area excluding the extremely peripheral Okhotsk and St. Lawrence regions:

P.S. Wipneus’ Pi has processed the AMSR2 data now, and area shows another, more modest, decline today:
In addition, here is the underlying sea ice concentration data from the University of Hamburg:

Both area and extent increased today:


including increases on both the Atlantic:
and Pacific sides of the Arctic:
Both area and extent are still moving inexorably upwards:
The late February maximum still holds, on the high resolution numbers at least. The JAXA/VISHOP web site is down at the moment, so we’ll have to wait for an update to that particular metric, as well as a post weekend update to the NSIDC’s Charctic chart.
P.S. Jaxa is still down this afternoon, but here’s the latest from the NSIDC:
Arctic wide area and extent have blasted past their respective late February maxima:


However Arctic sea ice area excluding the Okhotsk and St. Lawrence peripheral regions has still not exceeded the maximum formed on January 25th:
This morning’s data reveal the first decline in extent for several days:
The (extremely!) tentative new maximum Arctic sea ice extent for 2019 is 13.89 million square kilometers on March 12th.
JAXA is back!

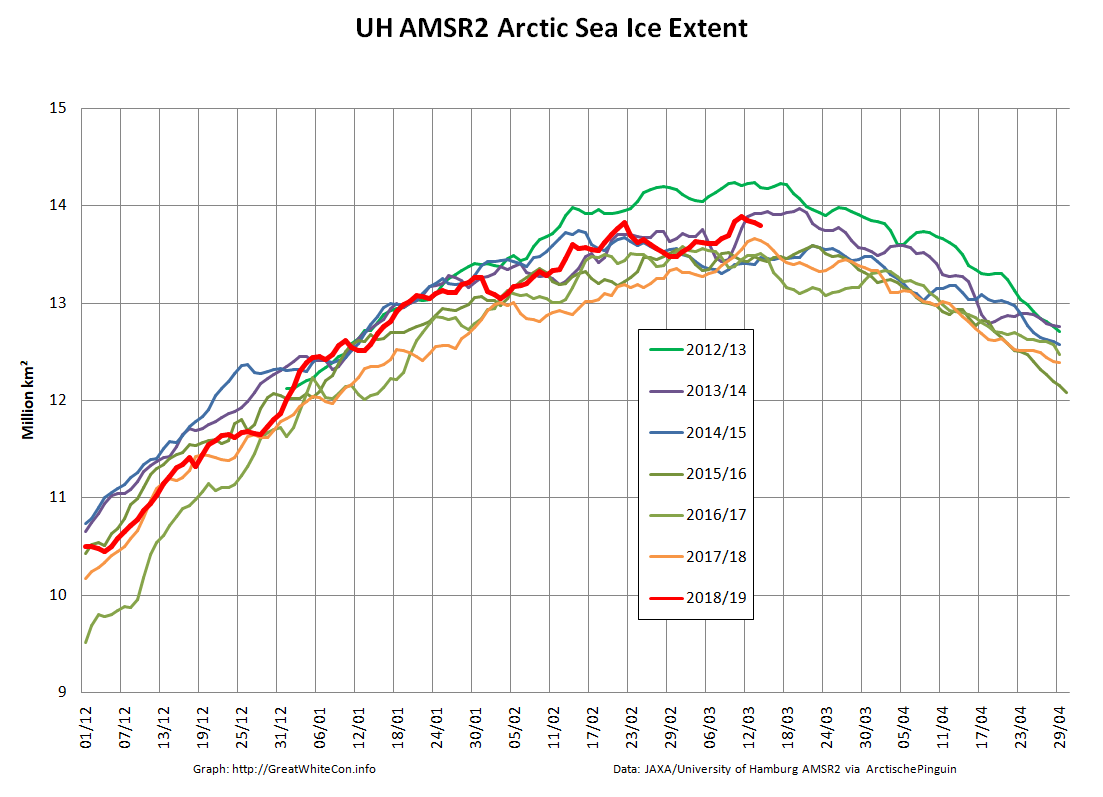
UH AMSR2 confirms that extent is still declining:


Arctic sea ice extent continues to decline, whilst area is still flatlining:
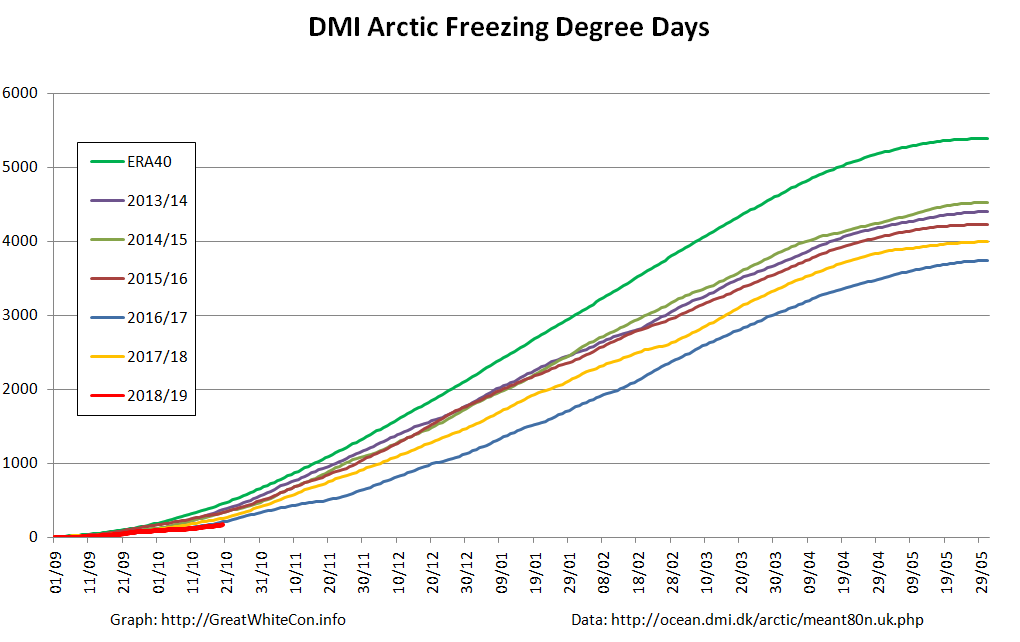
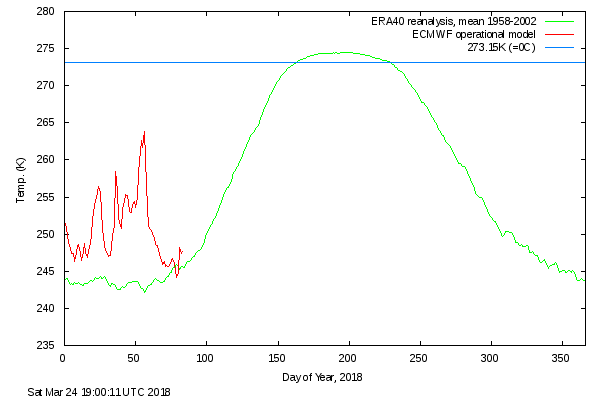
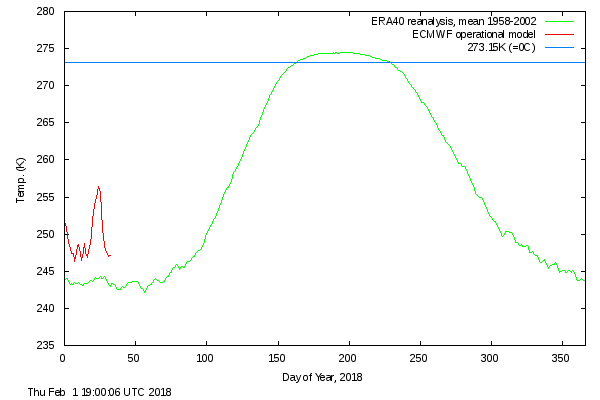
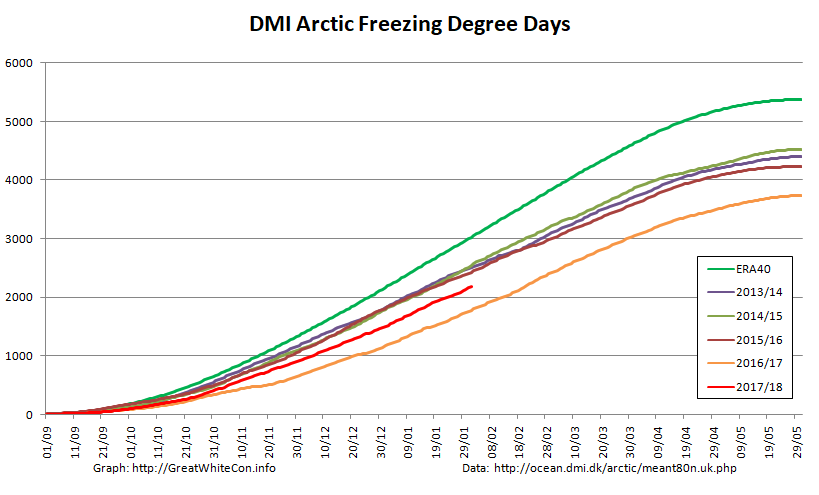
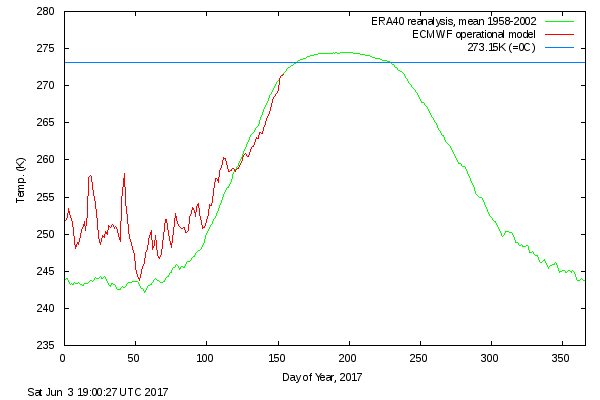
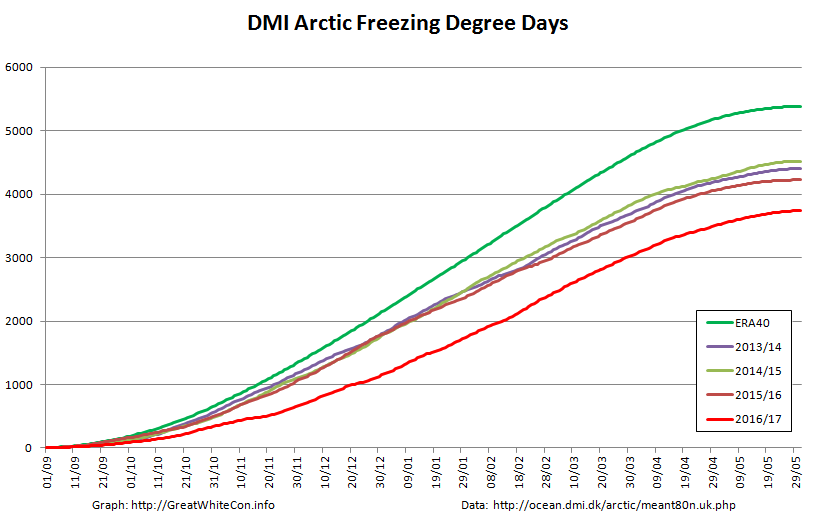
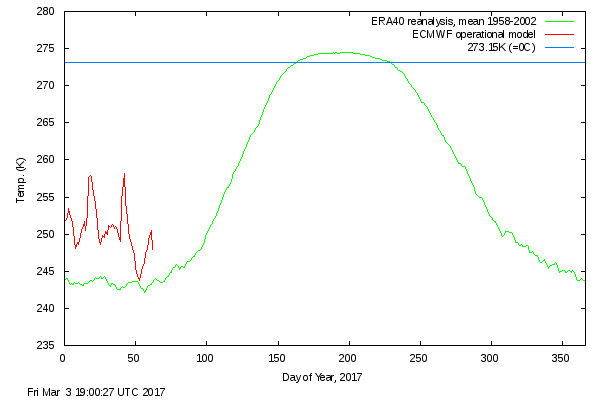
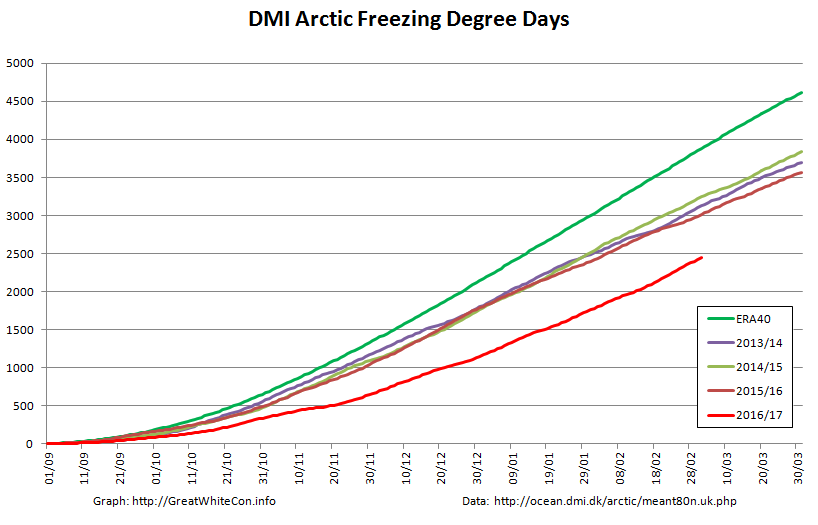
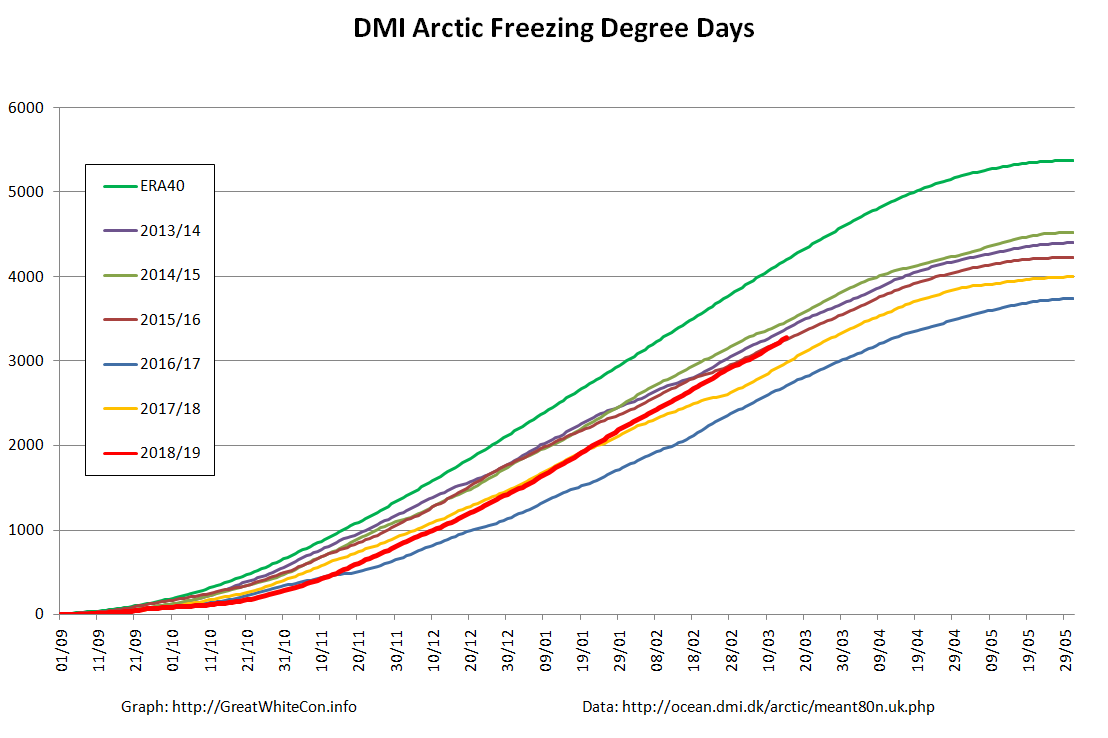
Meanwhile a look at freezing degree days based on the DMI’s dubiously weighted data for north of 80 degrees reveals the story of the freezing season. A historically warm start, but now back in amongst the pack of the 2010s:
It looks as though there’ll be no going back from this. Arctic sea ice area is finally following extent’s decline in no uncertain terms:

Barring exceedingly unforeseen circumstances after this year’s “double top” that leaves the 2019 Arctic sea ice maximum extent numbers as follows:
UH/Wipneus AMSR2 – 13.89 million square kilometers on March 12th
JAXA/VISHOP AMSR2 – 14.27 million square kilometers on March 12th
NSIDC 5 day SSMIS – 14.78 million square kilometers on March 13th
Arctic sea ice area has fallen off the proverbial cliff over the last few days. There can now be no doubt that the 2019 maximum extent has been reached:


That being the case, all other Arctic sea ice discussion for the month of March can now take place over at:
Facts About the Arctic in March 2019
The NSIDC have provisionally confirmed this year’s maximum extent:
On March 13, 2019, Arctic sea ice likely reached its maximum extent for the year, at 14.78 million square kilometers (5.71 million square miles), the seventh lowest in the 40-year satellite record, tying with 2007. This year’s maximum extent is 860,000 square kilometers (332,000 square miles) below the 1981 to 2010 average maximum of 15.64 million square kilometers (6.04 million square miles) and 370,000 square kilometers (143,000 square miles) above the lowest maximum of 14.41 million square kilometers (5.56 million square miles) set on March 7, 2017. Prior to 2019, the four lowest maximum extents occurred from 2015 to 2018.
The date of the maximum this year, March 13, was very close to the 1981 to 2010 median date of March 12.
Please note this is a preliminary announcement of the sea ice maximum. At the beginning of April, NSIDC scientists will release a full analysis of winter conditions in the Arctic, along with monthly data for March.