On several previous occasions “Snow White” and I have documented Ron Clutz’s misuse of MASIE Arctic sea ice extent data on his “Science Matters” blog. We agree with Ron that science matters, so on several occasions we have attempted to direct his attention to my interview with NASA/NSIDC scientist Walt Meier. Walt’s words of wisdom included:
Year-to-year comparisons and trend estimates will be more accurate in the passive microwave data than in MASIE.
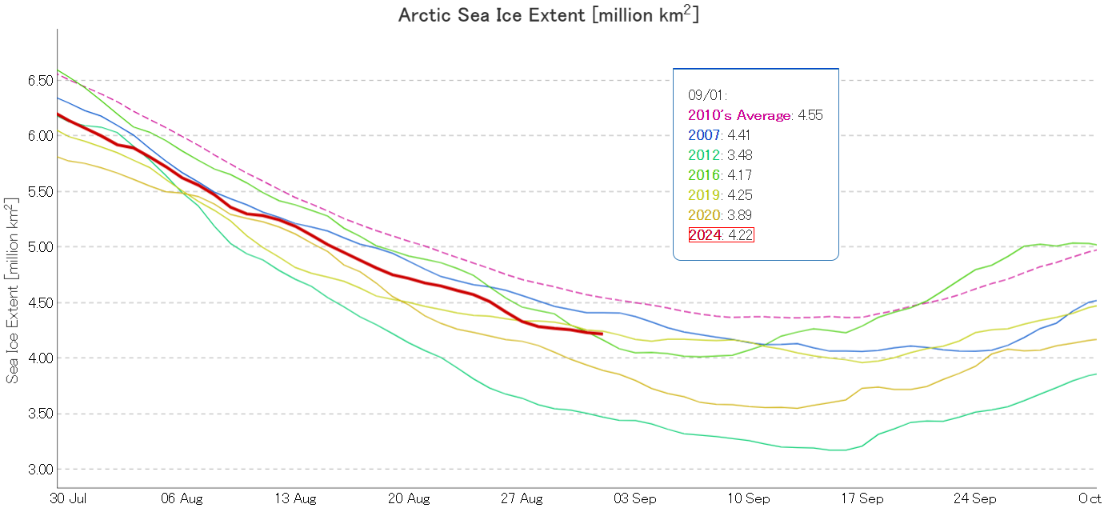
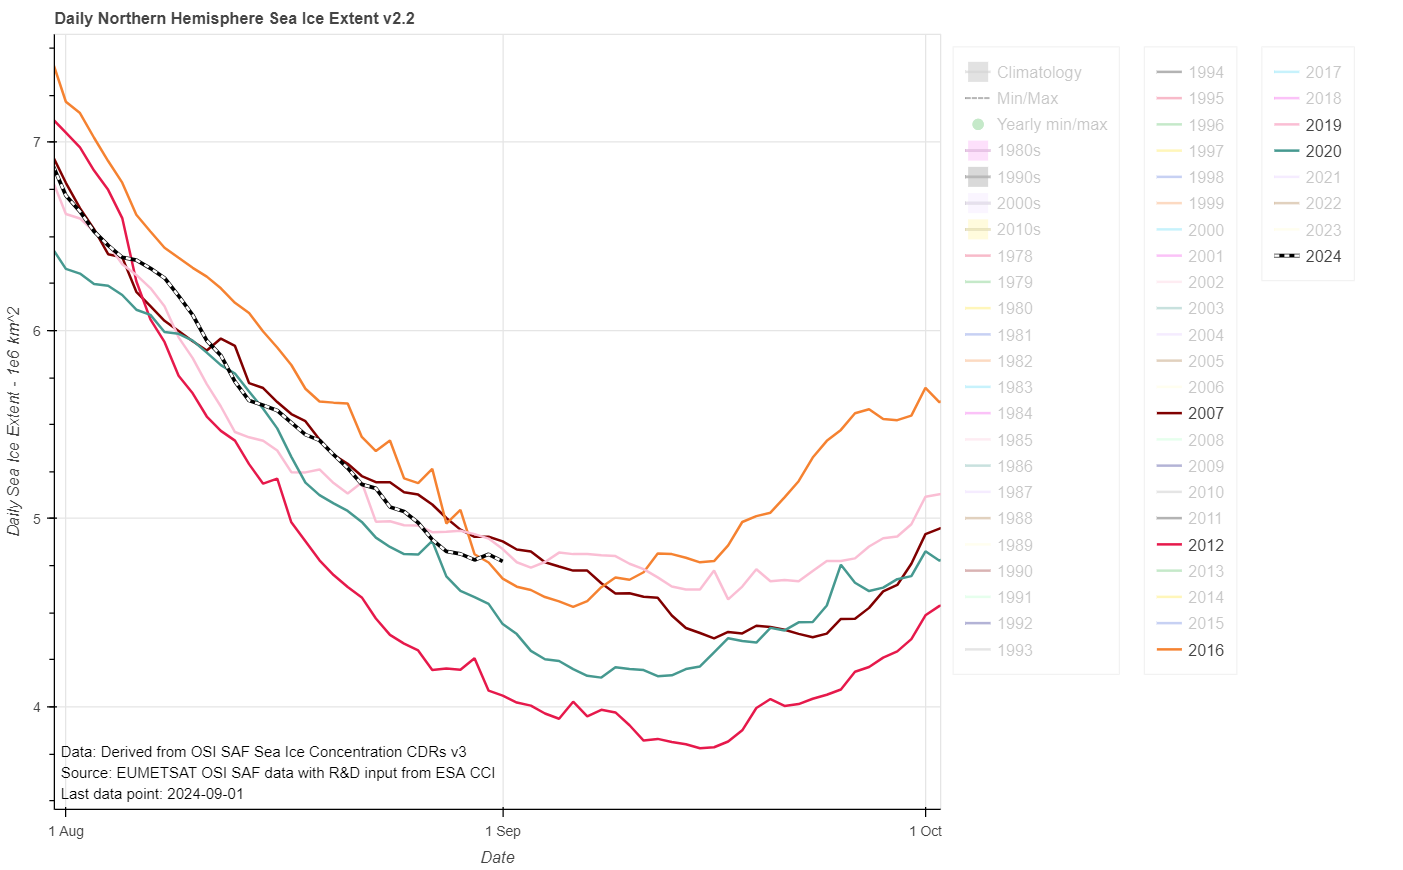
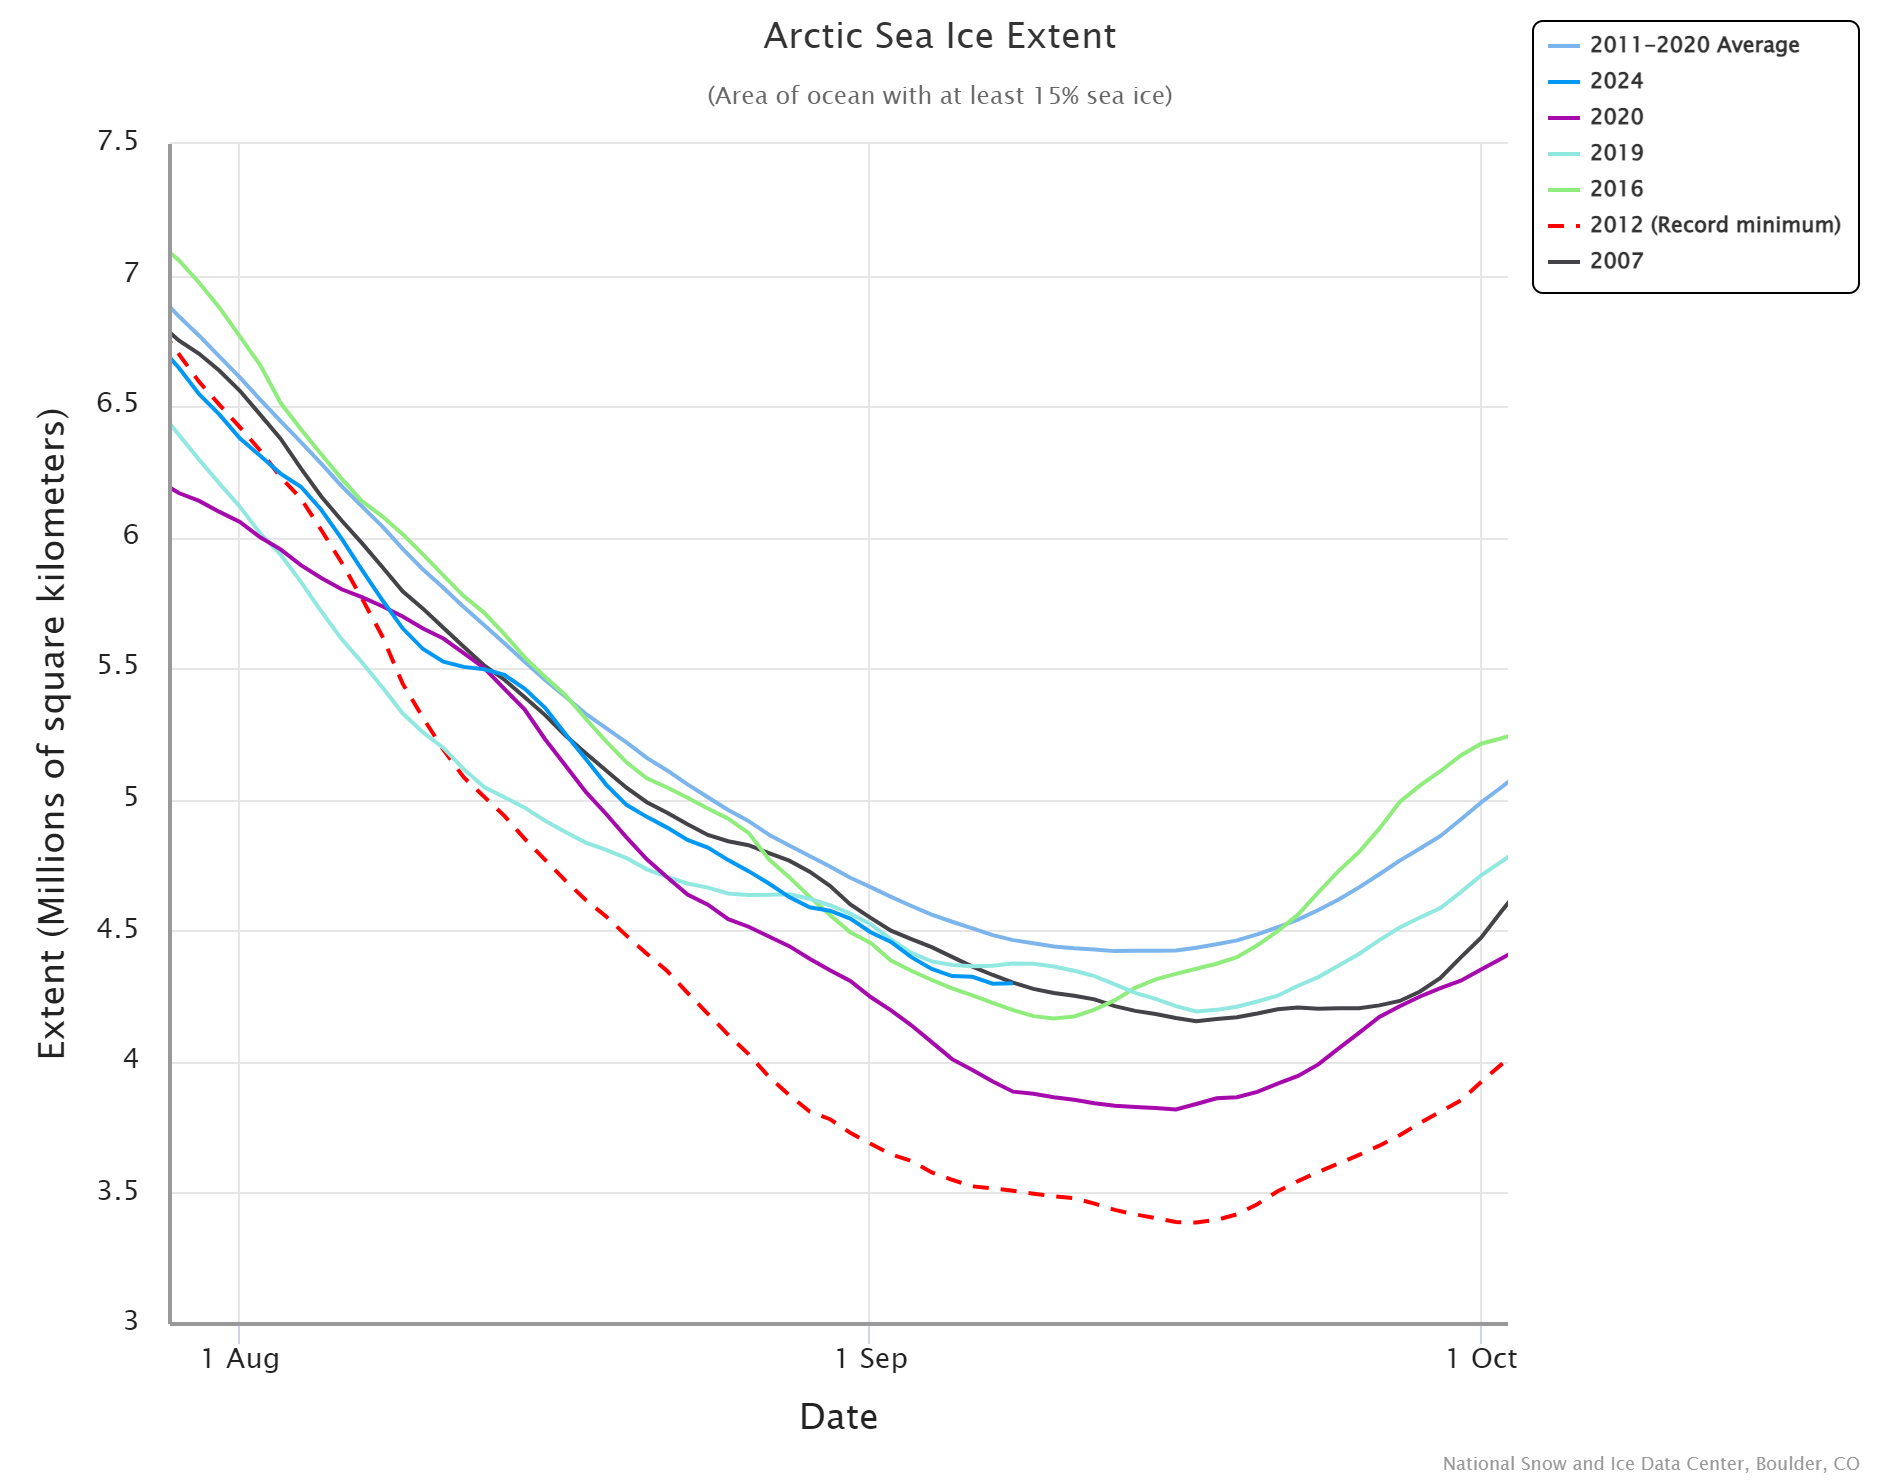
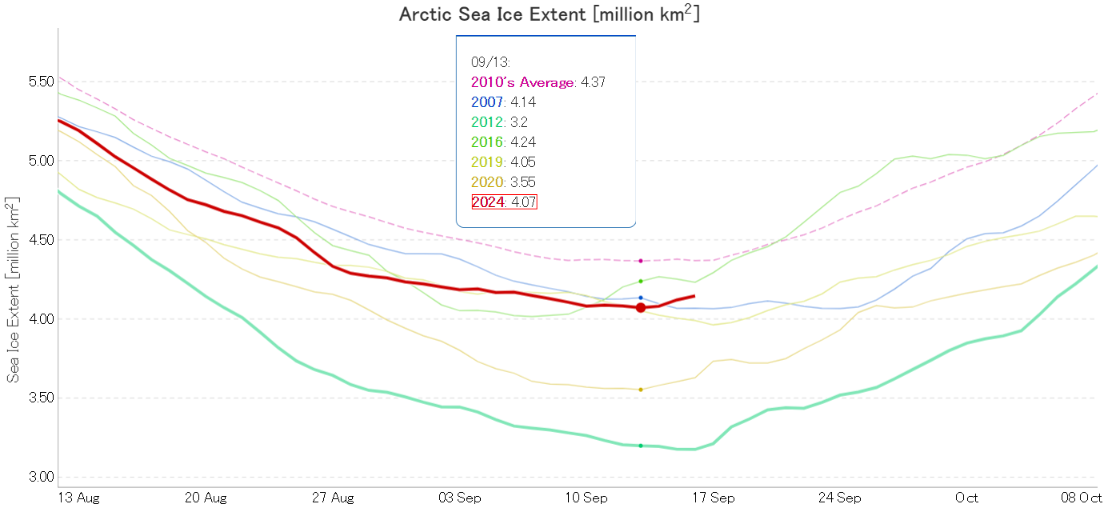
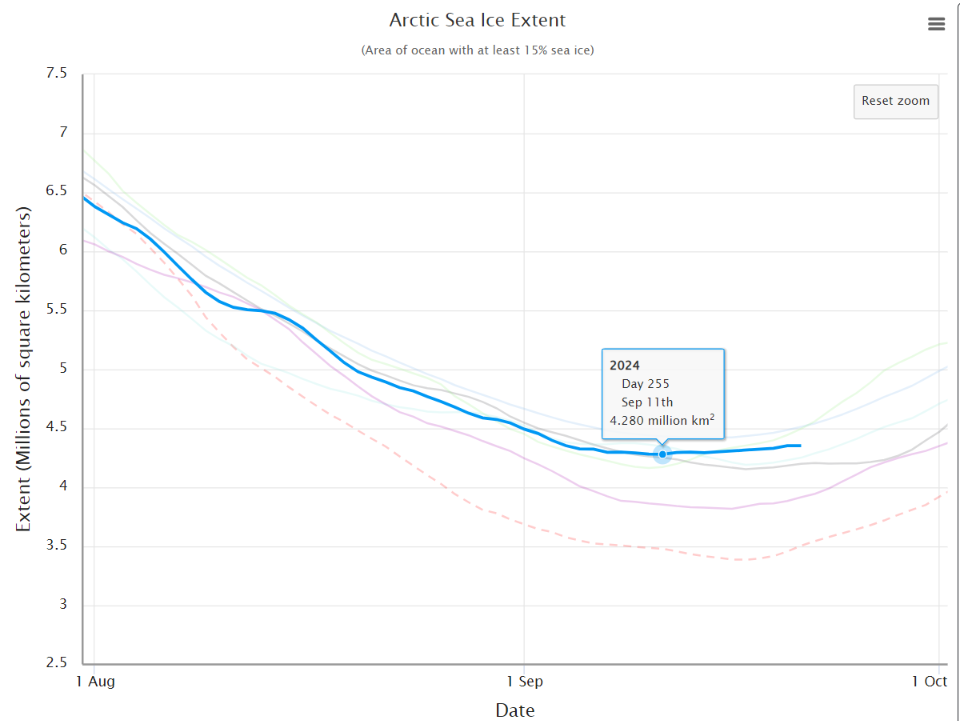
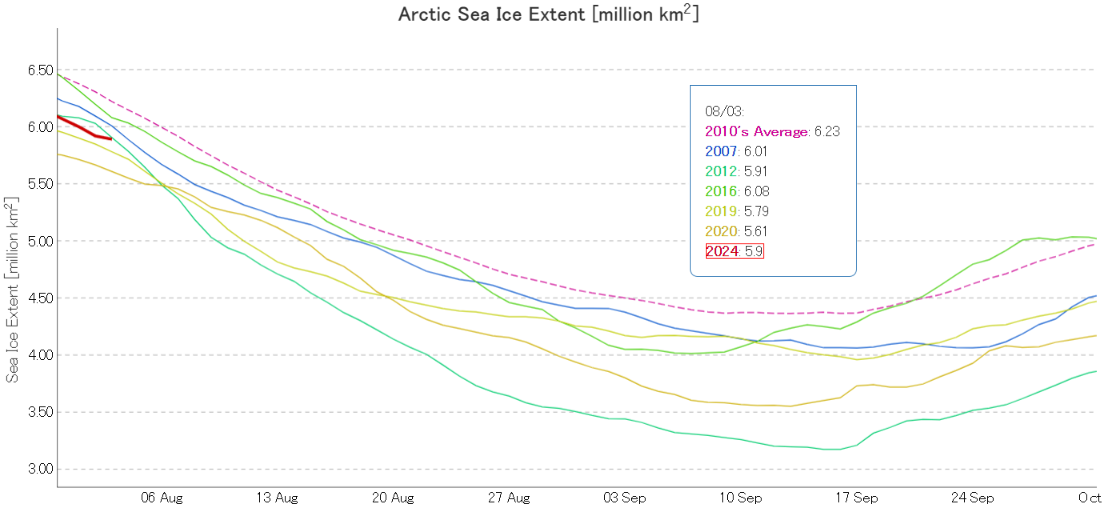
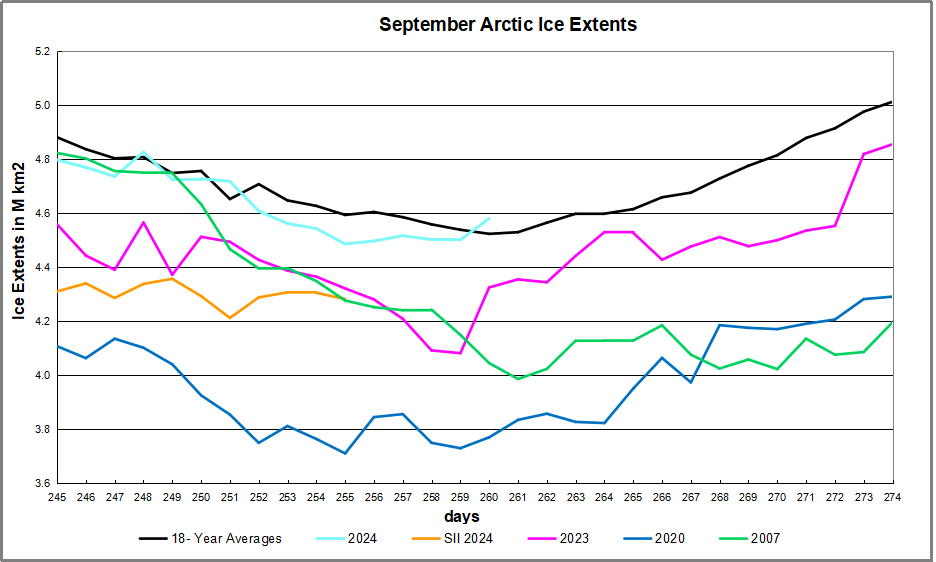
It will probably not surprise you to learn that Ron has not learned anything from our repeated efforts. In his article entitled “2024 Arctic Ice Beats 2007 by Half a Wadham” earlier today Ron proudly displays this graph:
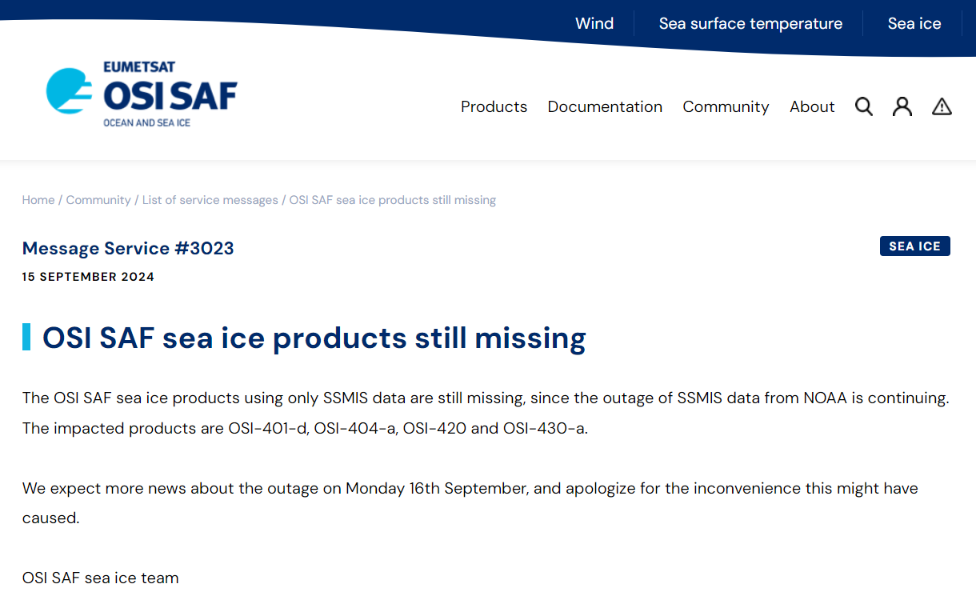
You will note that Ron does not provide details of his data source. However I have recently noted a sudden lack of SSMIS passive microwave data emanating from NOAA. The OSI SAF reported it this way on September 12th:
Dear OSI SAF Sea Ice Concentration User,
Due to missing input data, we have not been able to generate L2 products, corresponding to F-16 / F-17 / F-18 since Sep 11 19:36 UTC.
We apologize for any inconvenience.
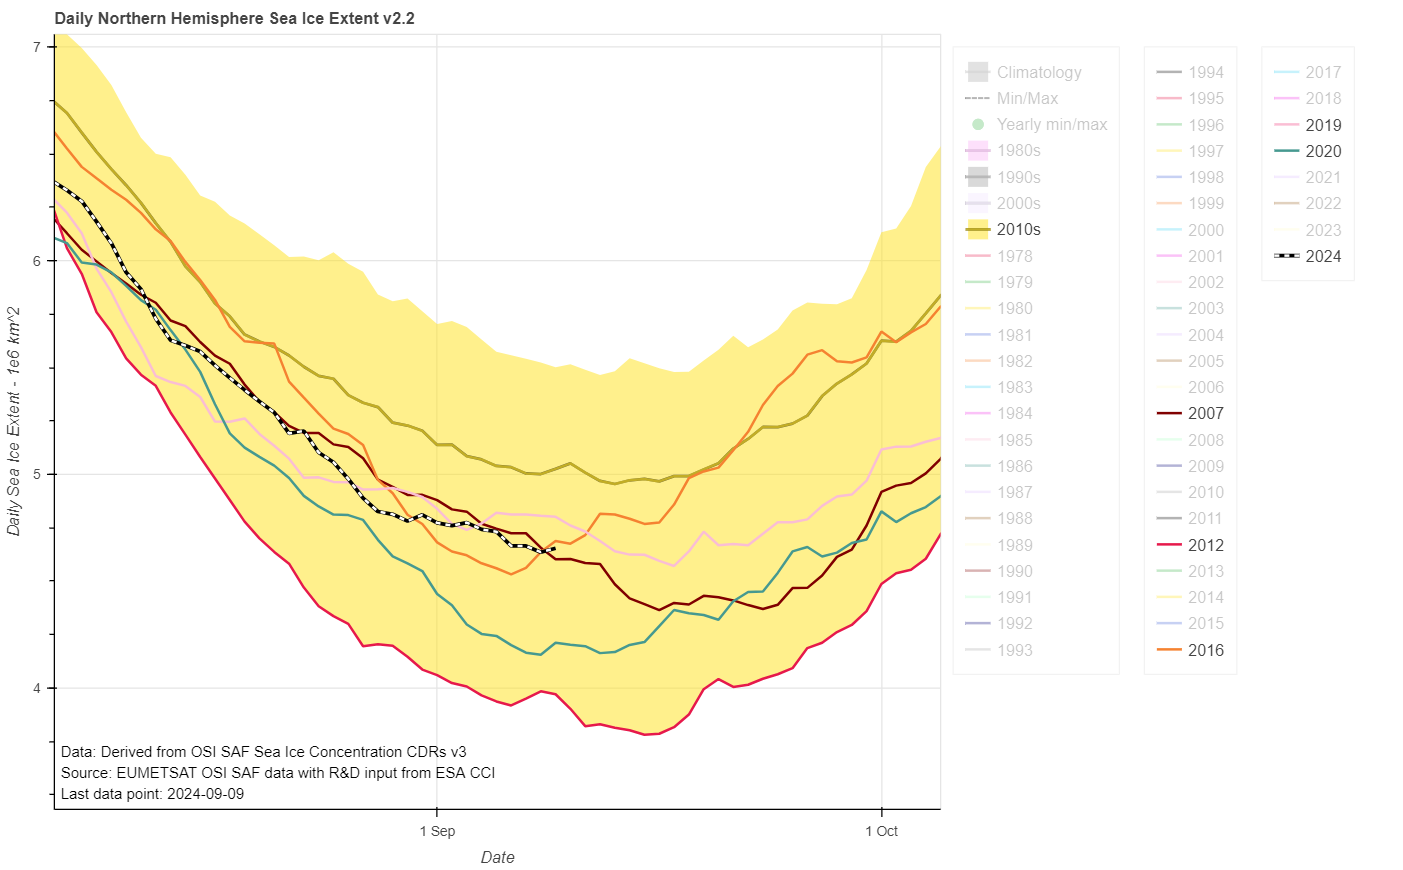
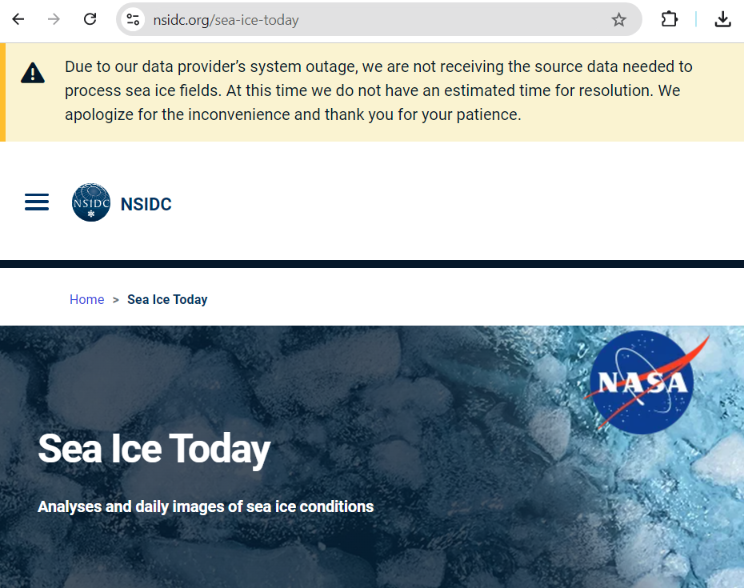
The NSIDC’s sea ice home page puts it this way today:
Now day 260 of 2024 is September 16th, so it seems safe to assume that Ron is erroneously using his favourite MASIE metric for year to year comparisons yet again. In his article Ron states that:
SII was reporting deficits as high as 0.5M km2 (half a Wadham) compared to MASIE early in September. For some reason, that dataset has not been updated for the last five days.
It appears as though Ron has also not yet learned how to find NSIDC’s sea ice home page on the world wide interweb!
I added this hopefully helpful comment below Ron’s article. For some strange reason it is yet to emerge from his moderation queue:
Our regular reader(s) will not be surprised to learn that my helpful comment yesterday is no longer in Ron’s moderation queue, but is now languishing underfoot on his cutting room floor.
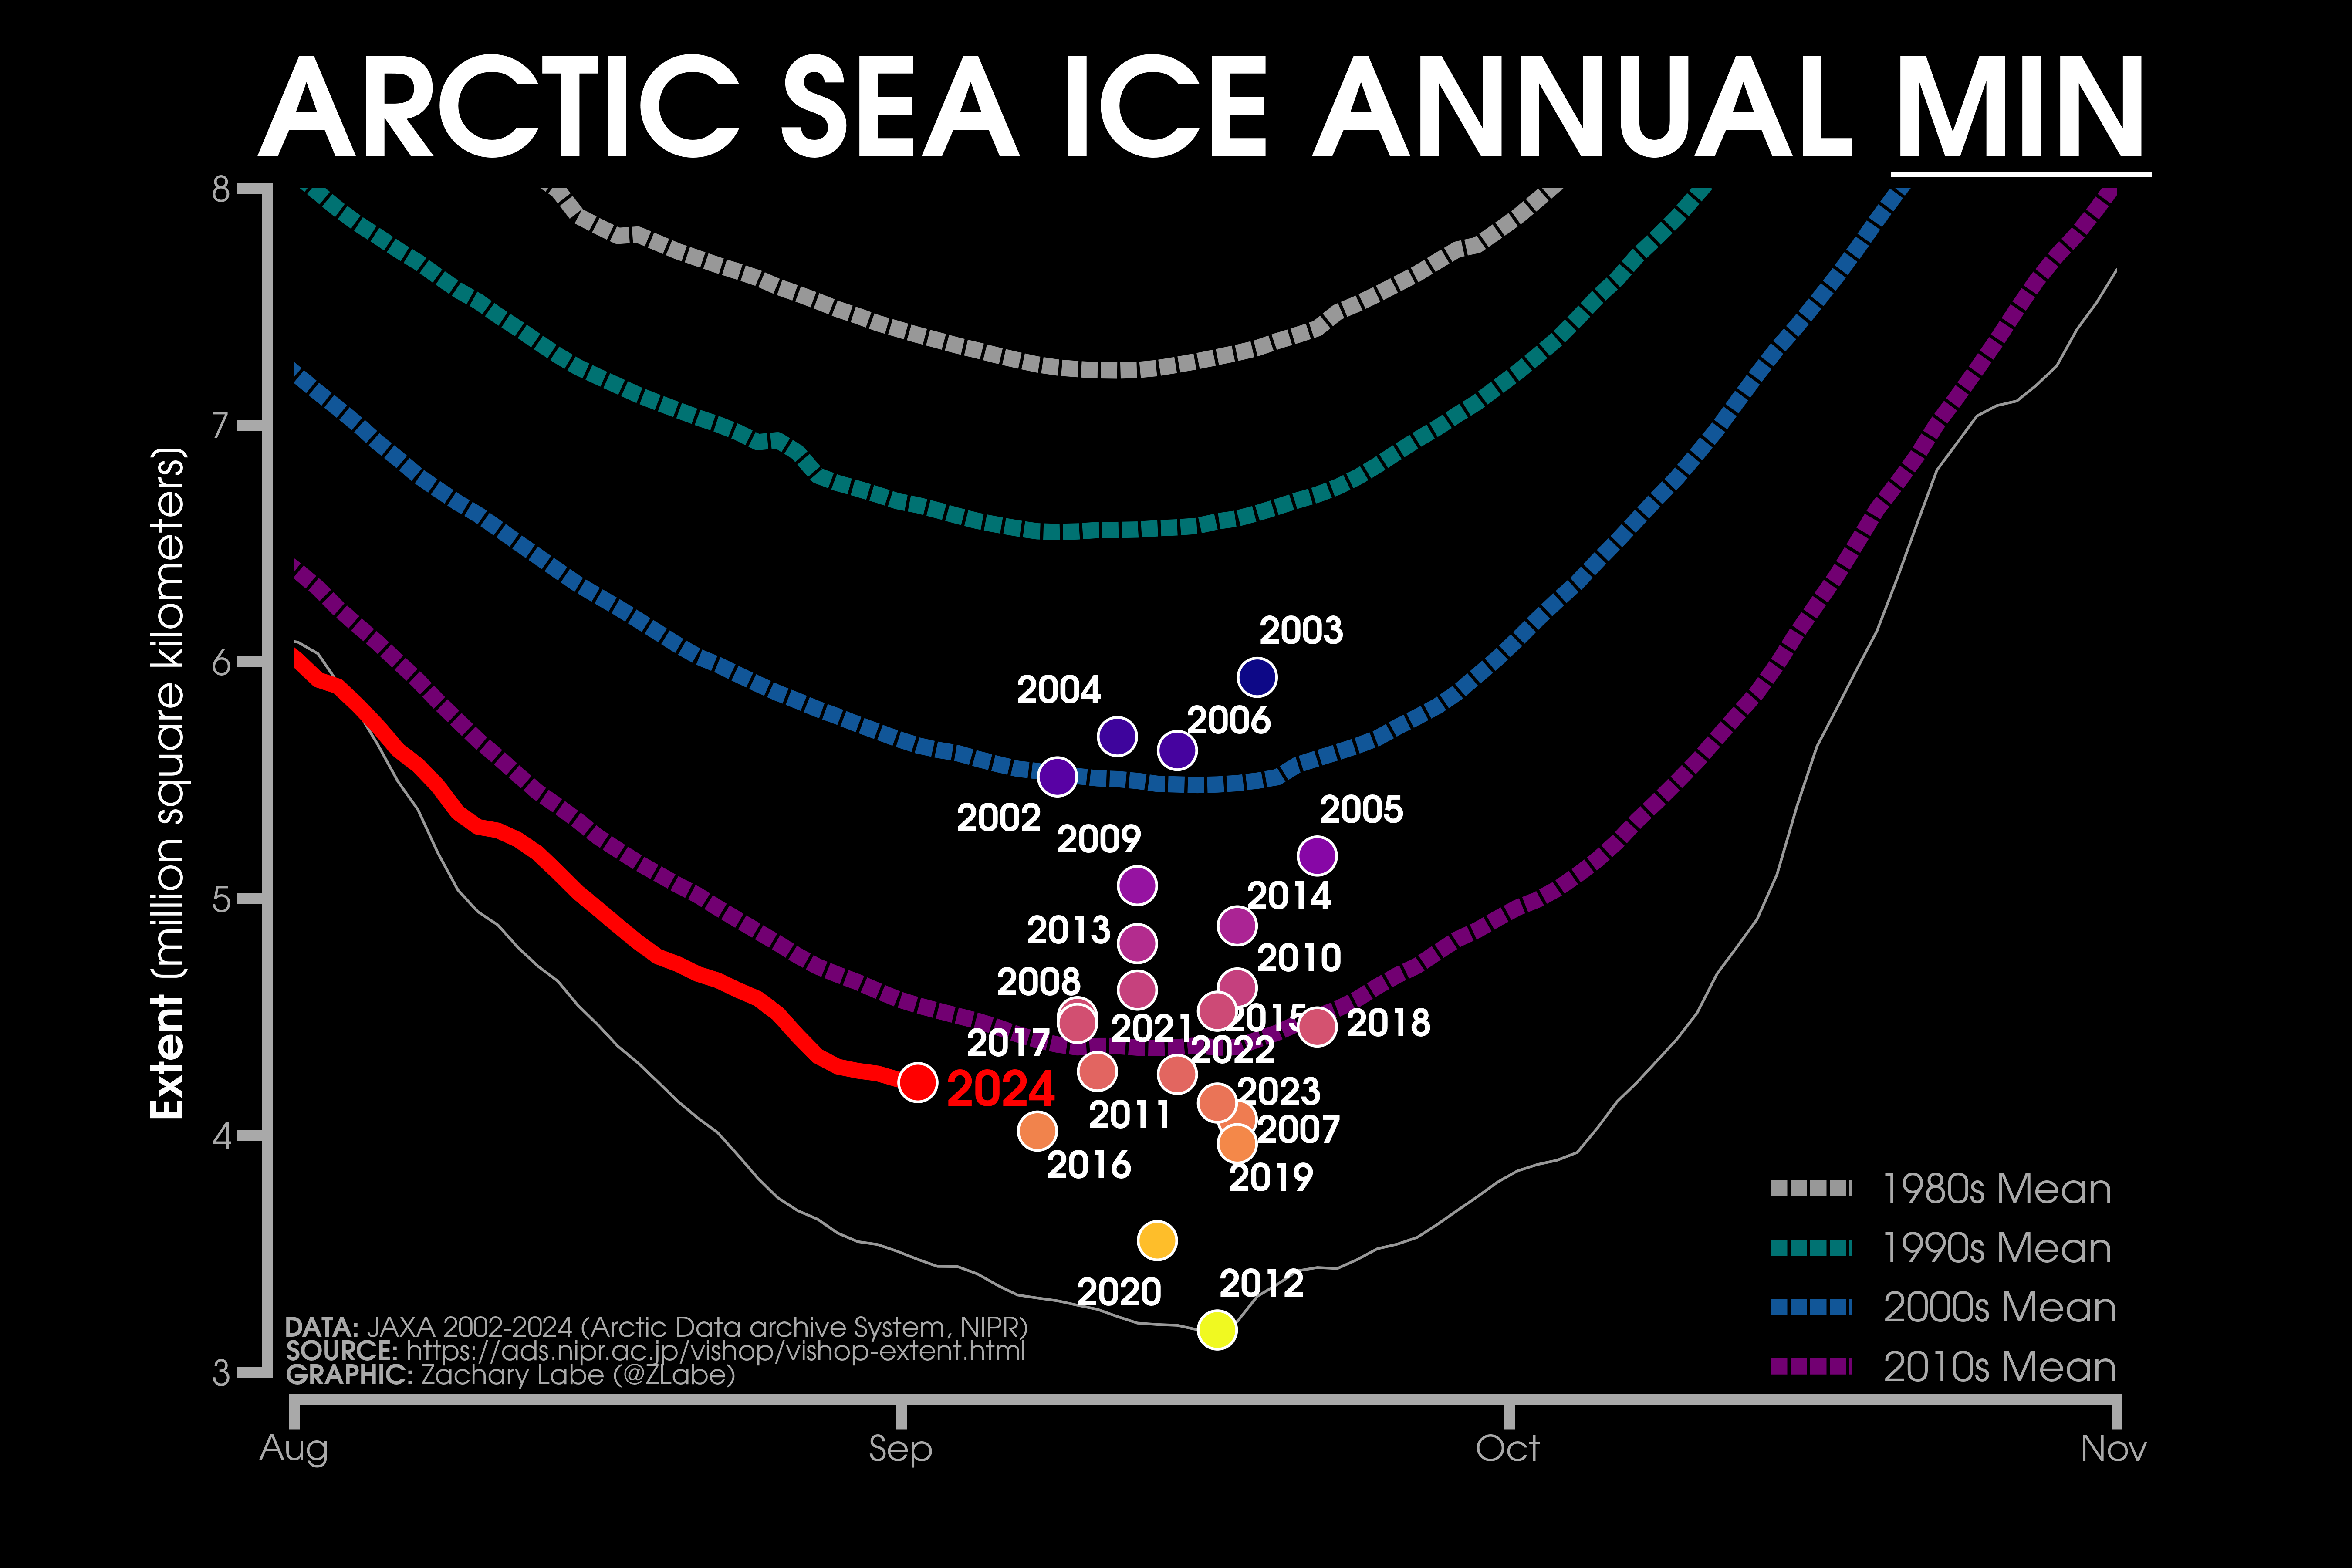
Ron has written another Arctic article using the graph reproduced above. This one is entitled: “2024 Arctic Ice Abounds at Average Daily Minimum“. In it Ron assures his flock of faithful followers that:
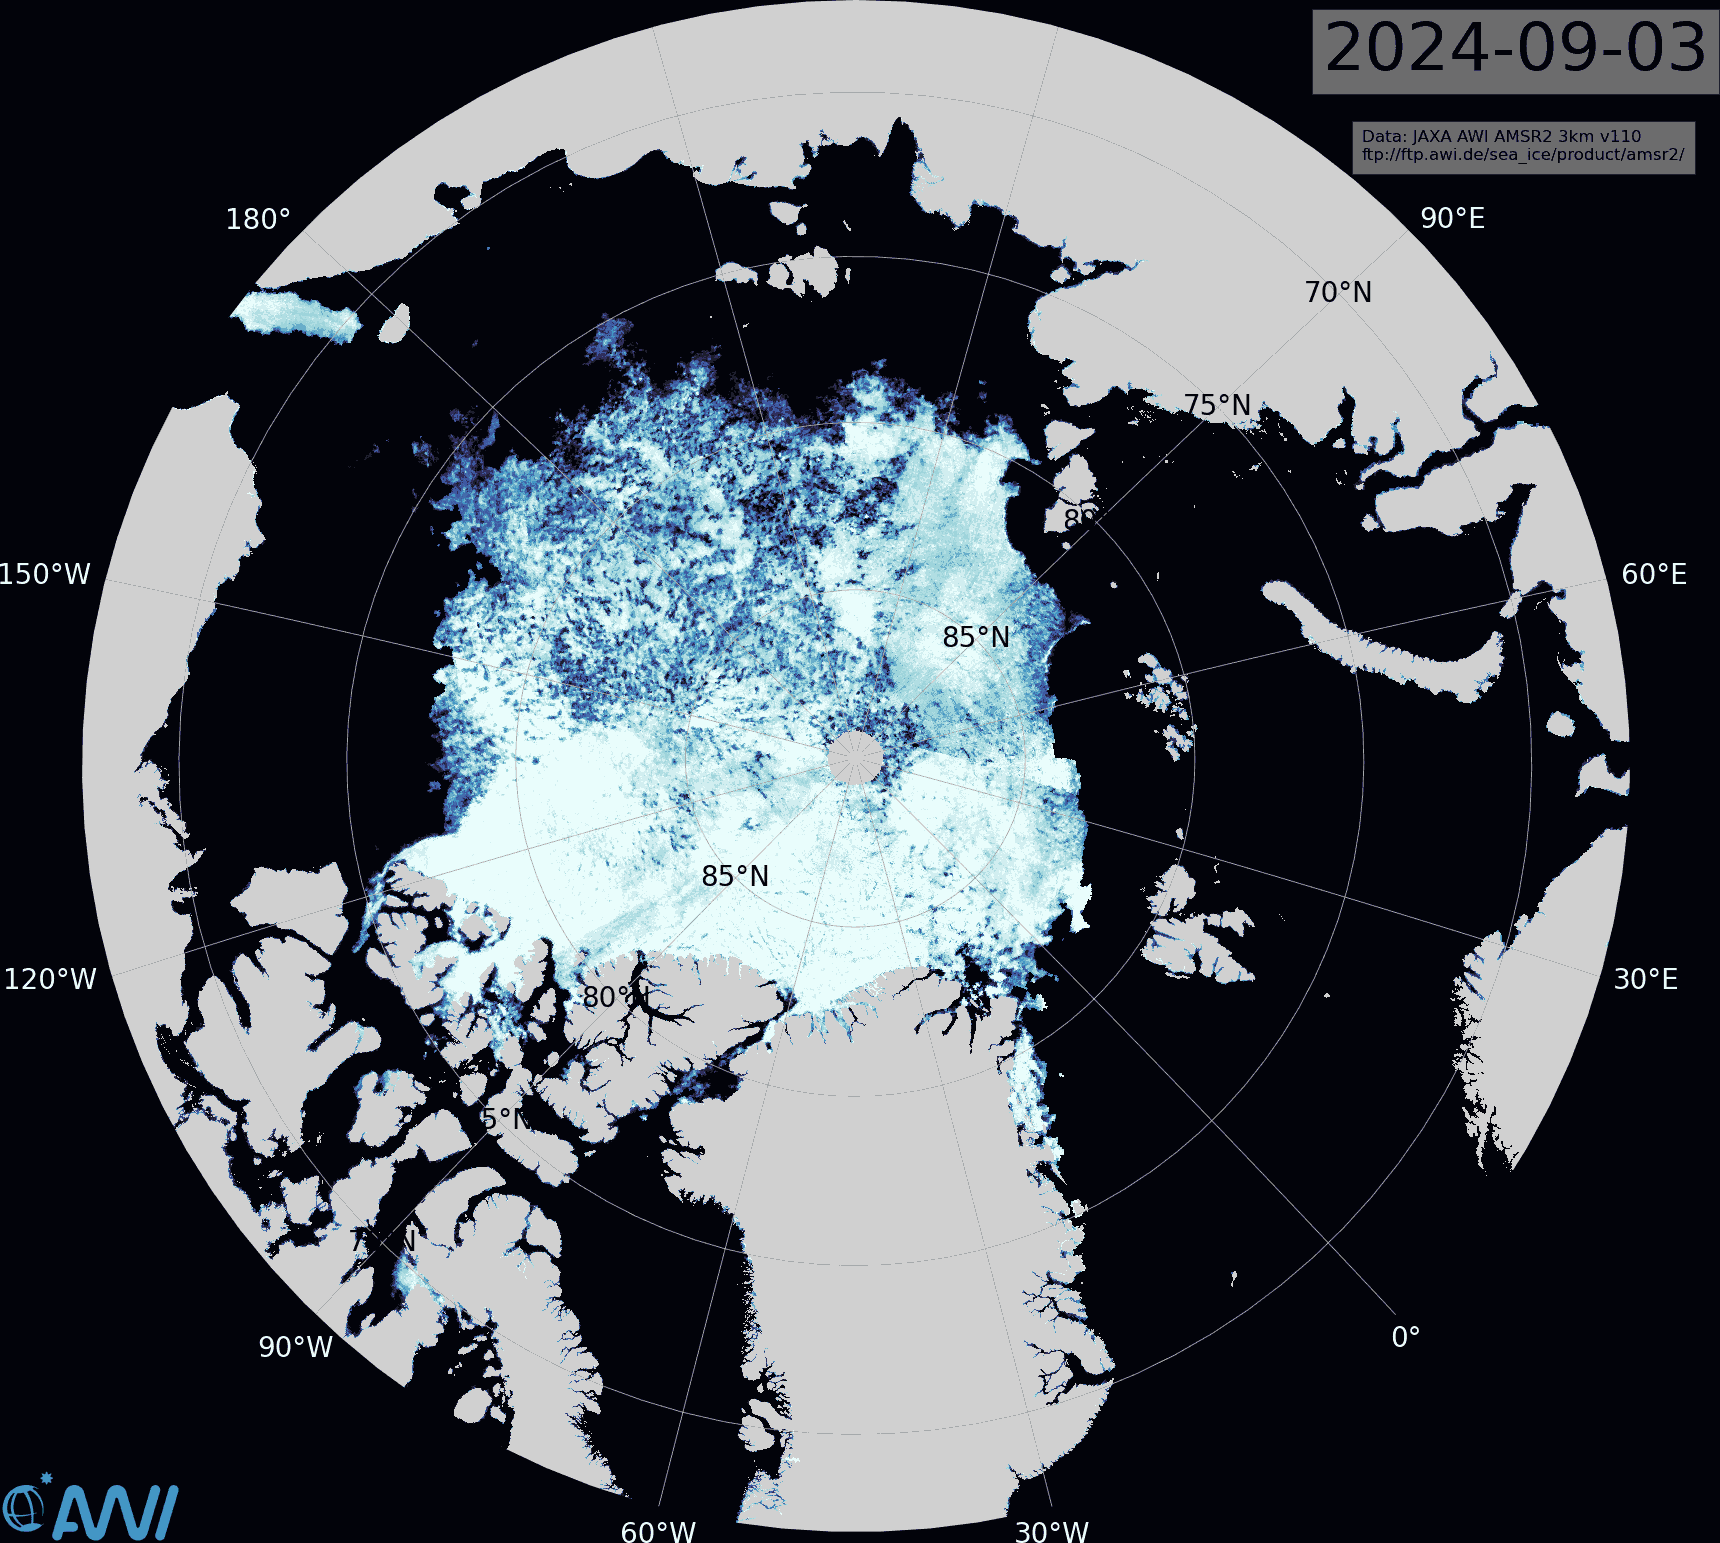
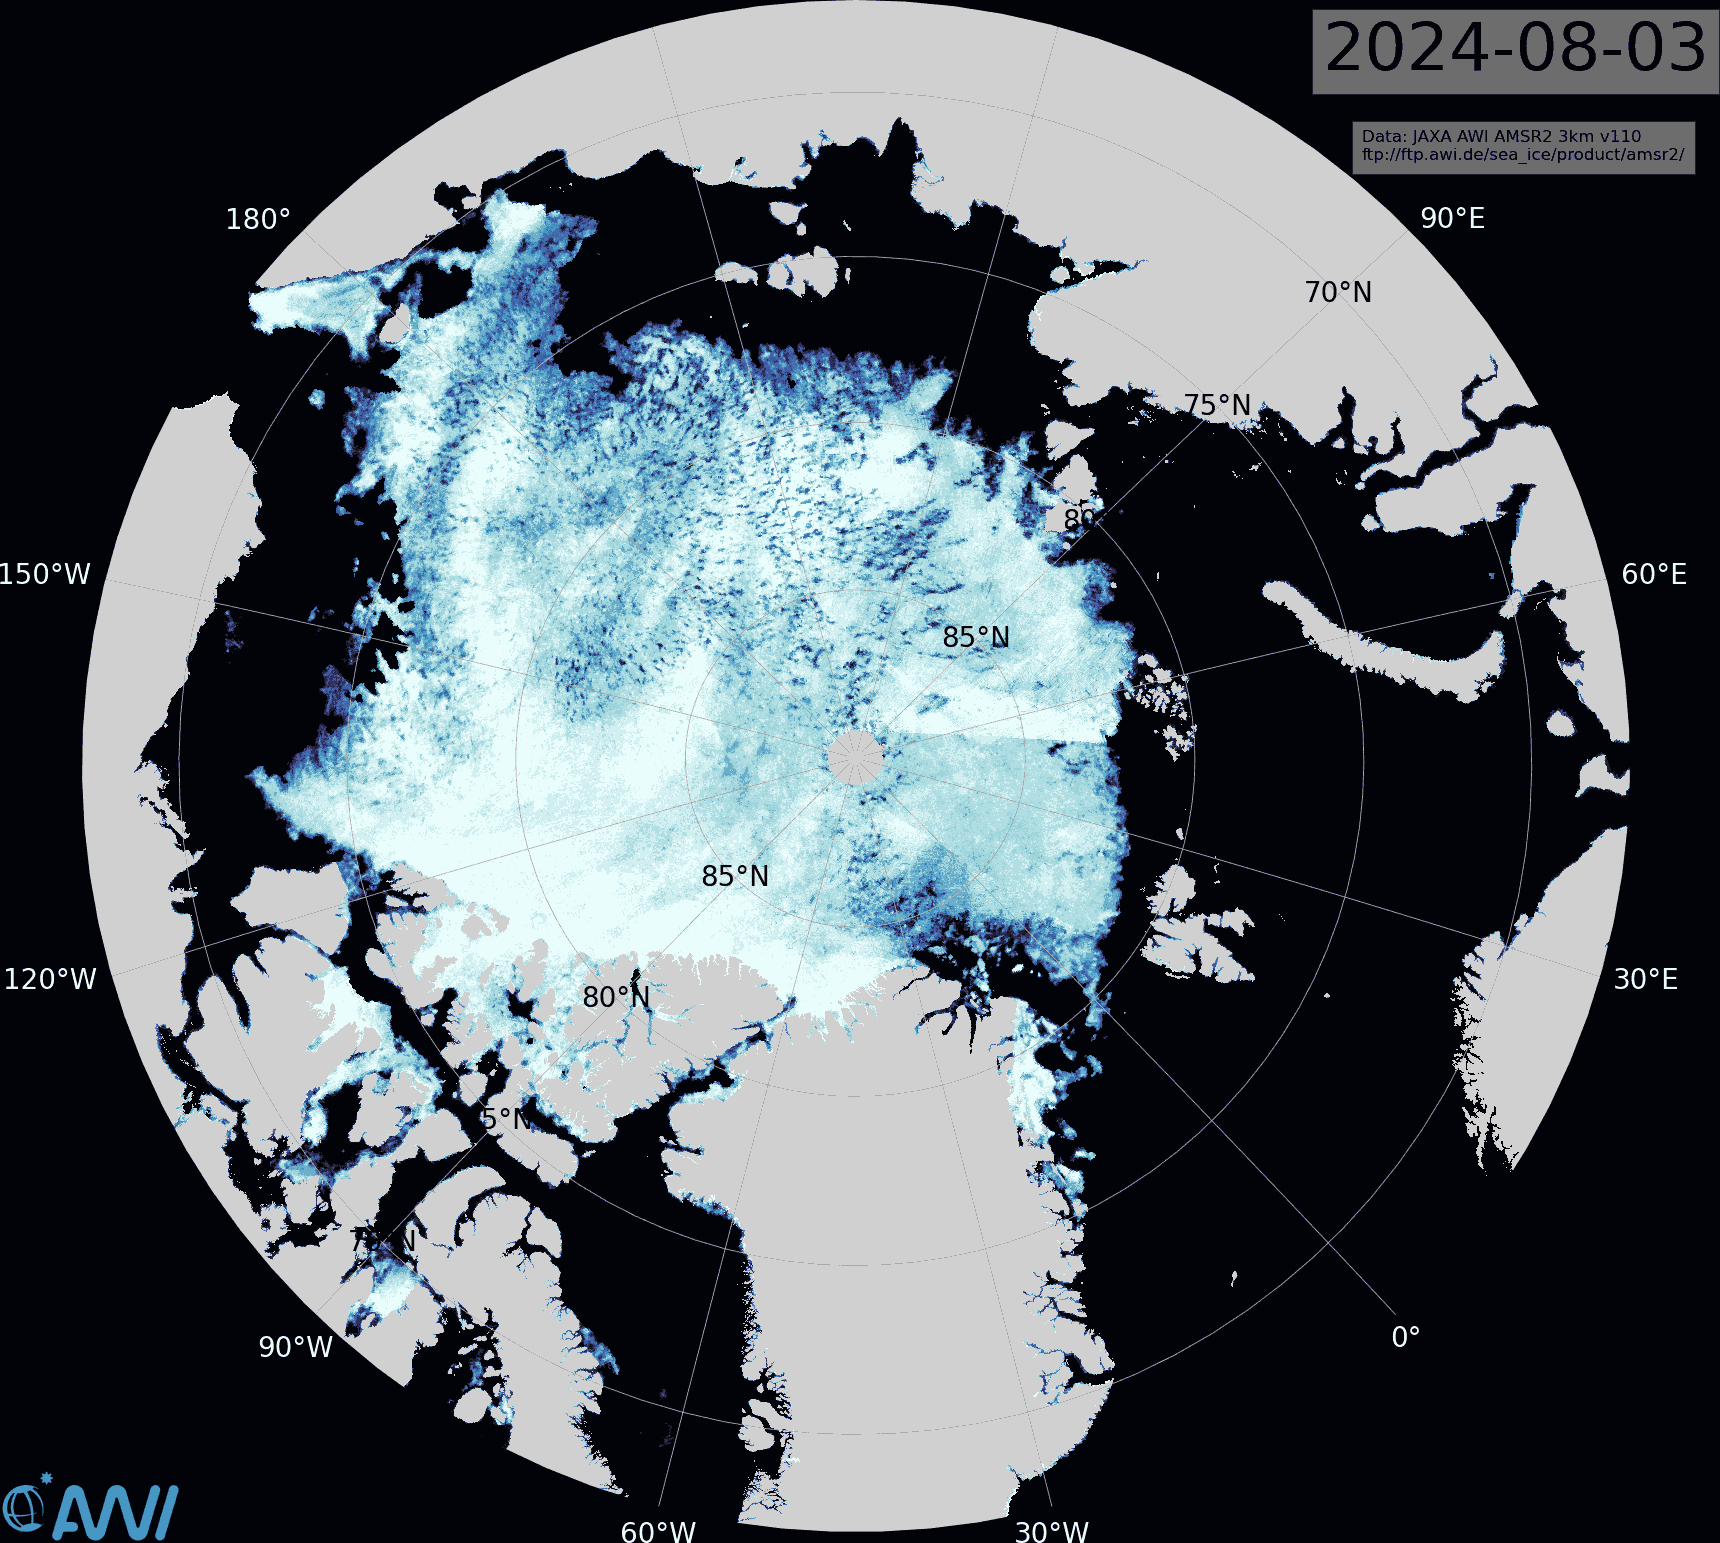
We are close to the annual Arctic ice extent minimum, which typically occurs on or about day 260 (mid September). Some take any year’s slightly lower minimum as proof that Arctic ice is dying, but the image above shows the Arctic heart is beating clear and strong.
Over this decade, the Arctic ice minimum has not declined, but since 2007 looks like fluctuations around a plateau.
Ron has also changed his phraseology regarding the recent SSMIS data outage. This time it reads:
For some reason, apparently data access issues, that dataset has not been updated for the last five days.
“Snow White” felt compelled to leave Ron another helpful comment concerning his new words of Arctic wisdom:
Watch this space!