Tag Archives: Chukchi Sea

Facts About the Arctic in April 2022

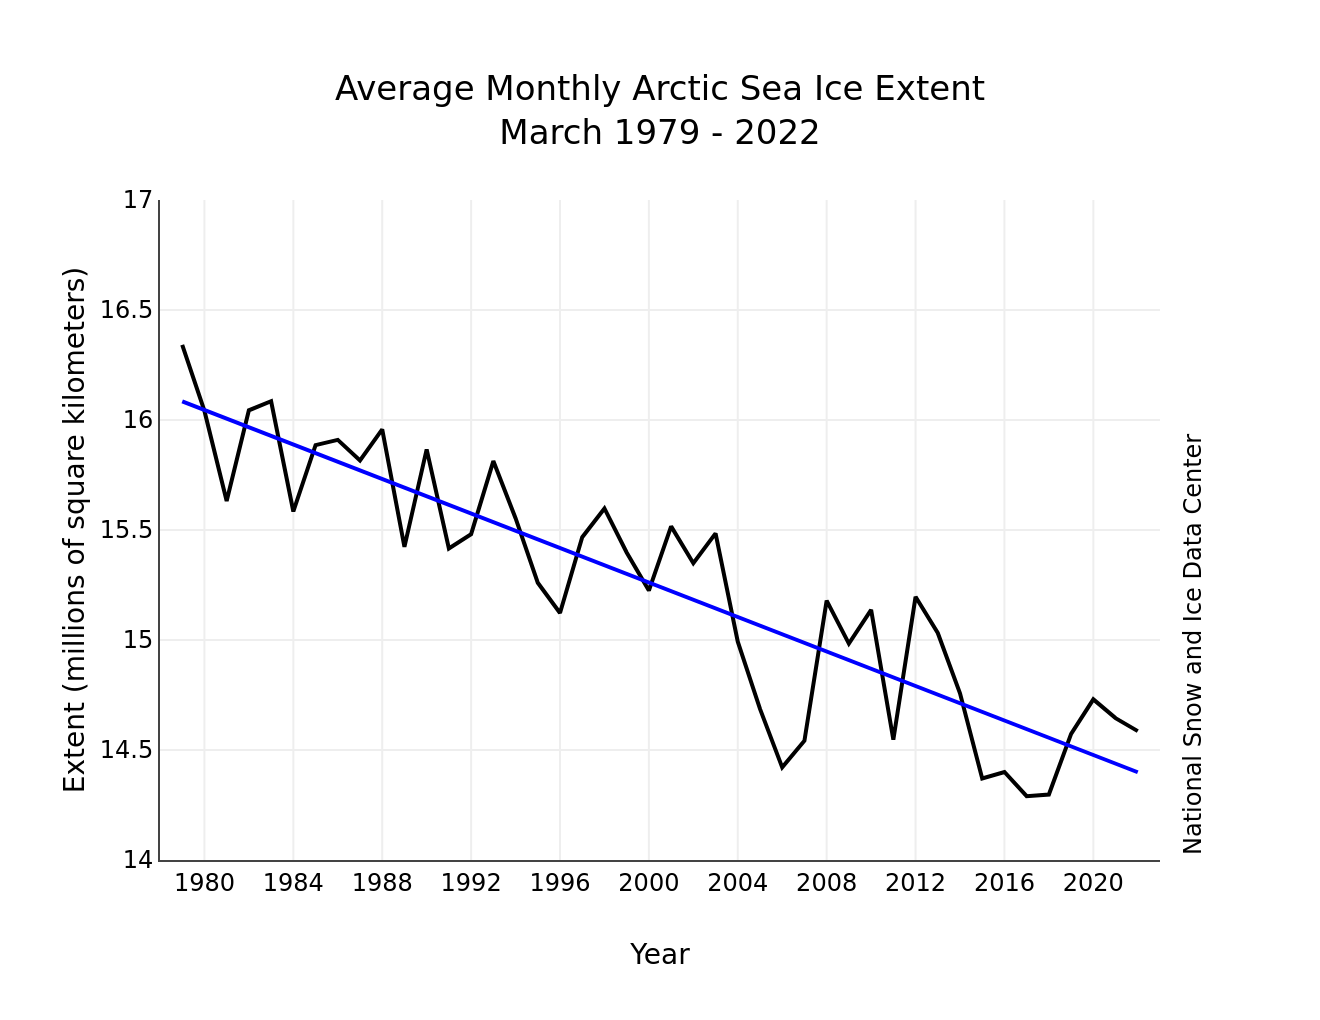
The April edition of the NSIDC’s Arctic Sea Ice News summarises March 2022 as follows:

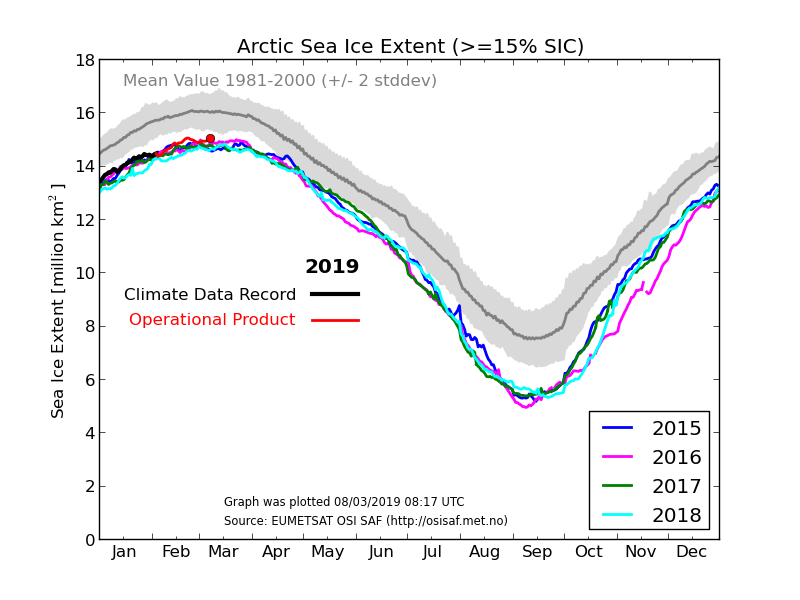
Average Arctic sea ice extent for March 2022 was 14.59 million square kilometers (5.63 million square miles), ranking ninth lowest in the satellite record…

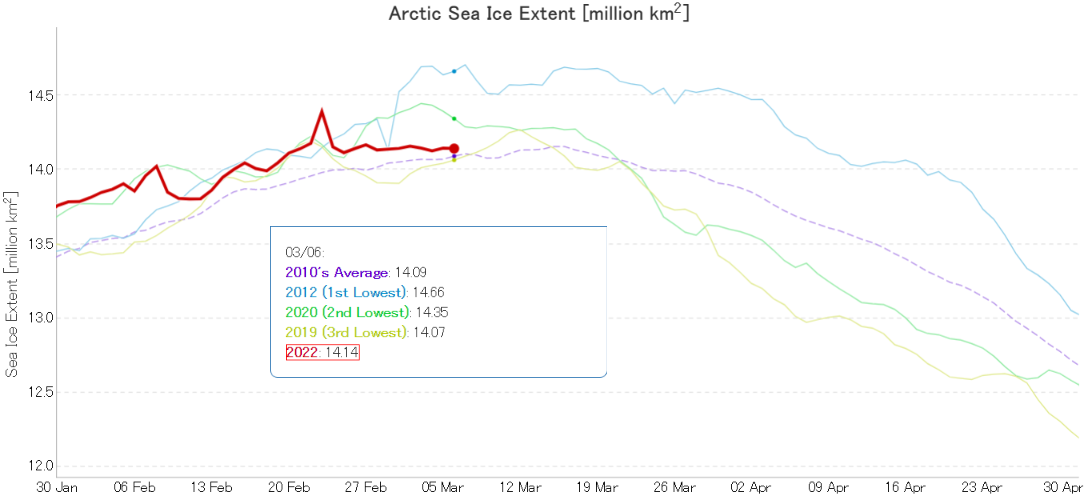
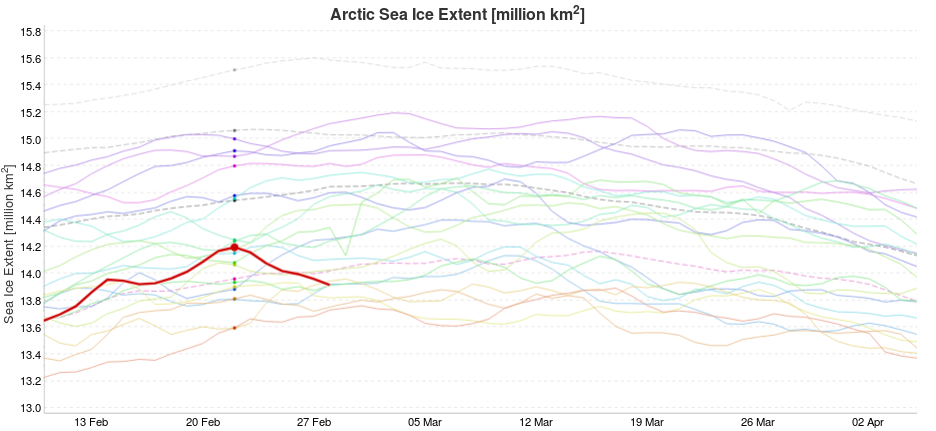
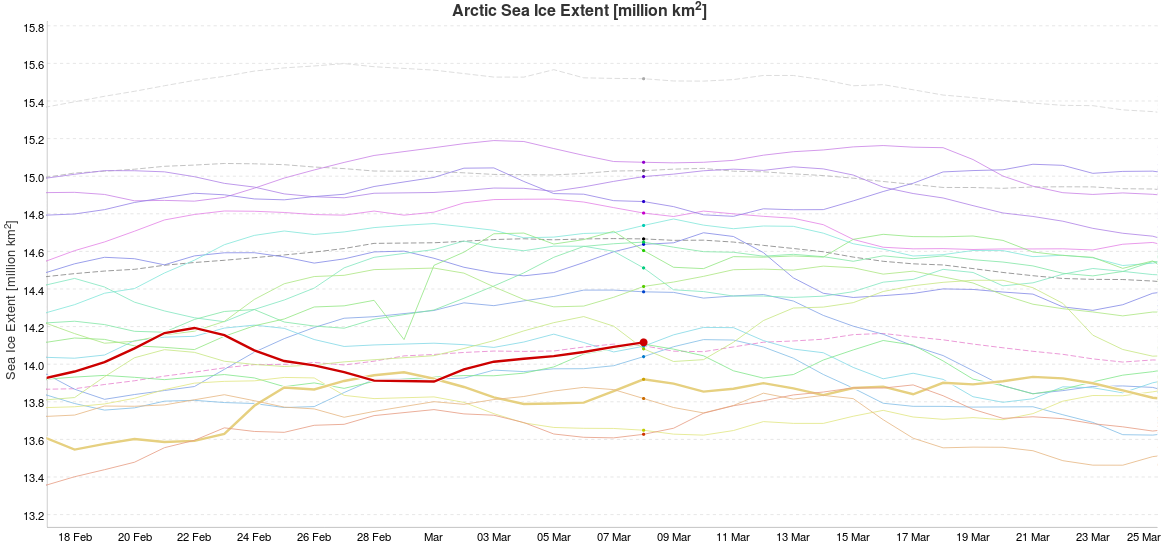
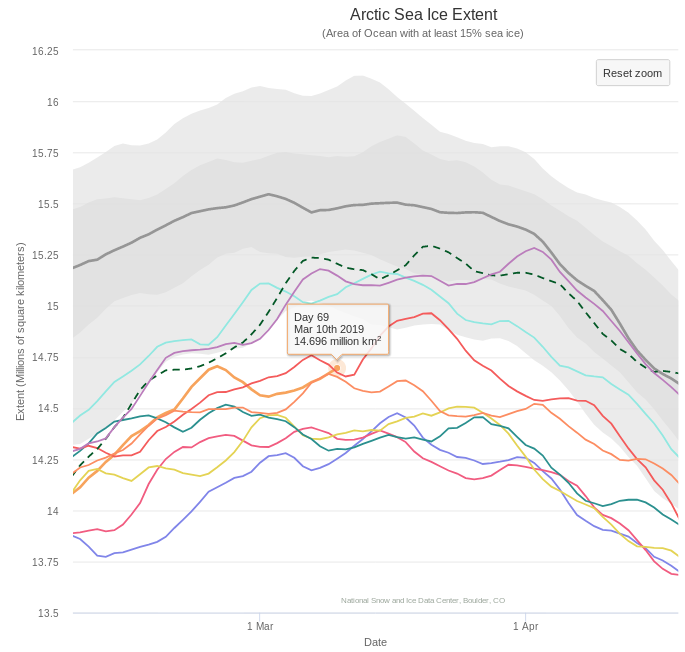
The total decline, after a series of small ups and downs, was only 250,000 square kilometers (96,500 square miles):

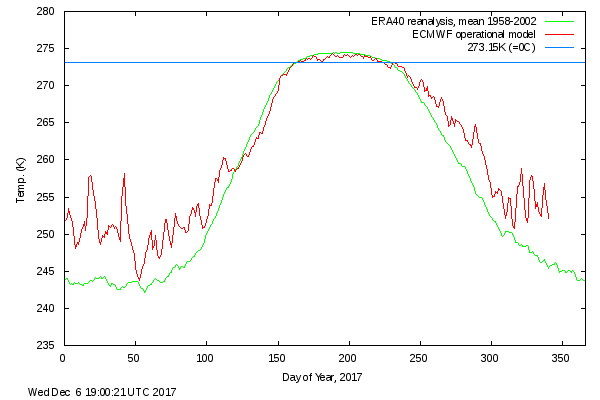
Counter to what might be expected given the very slow rate of sea ice loss over the month as a whole, air temperatures at the 925 millibar level (about 2,500 feet above the surface) were above average over all of the Arctic Ocean:

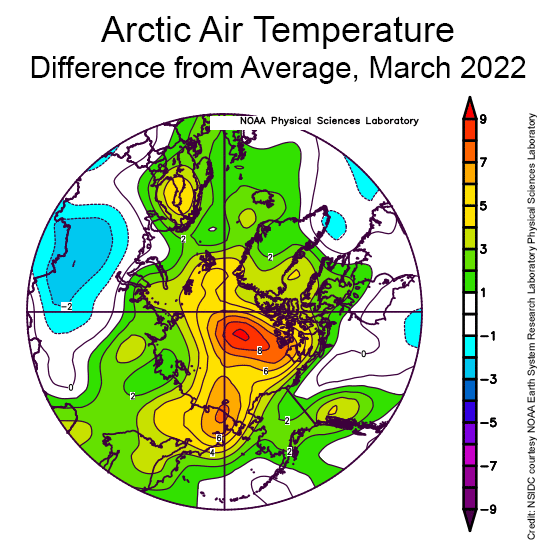
March temperatures were up to 9 degrees Celsius (16 degrees Fahrenheit) higher than average north of the Canadian Arctic Archipelago, up to 6 degrees Celsius (11 degrees Fahrenheit) above average in the East Siberian Sea, but up to 5 degrees Celsius (9 degrees Fahrenheit) above average over a wide area.

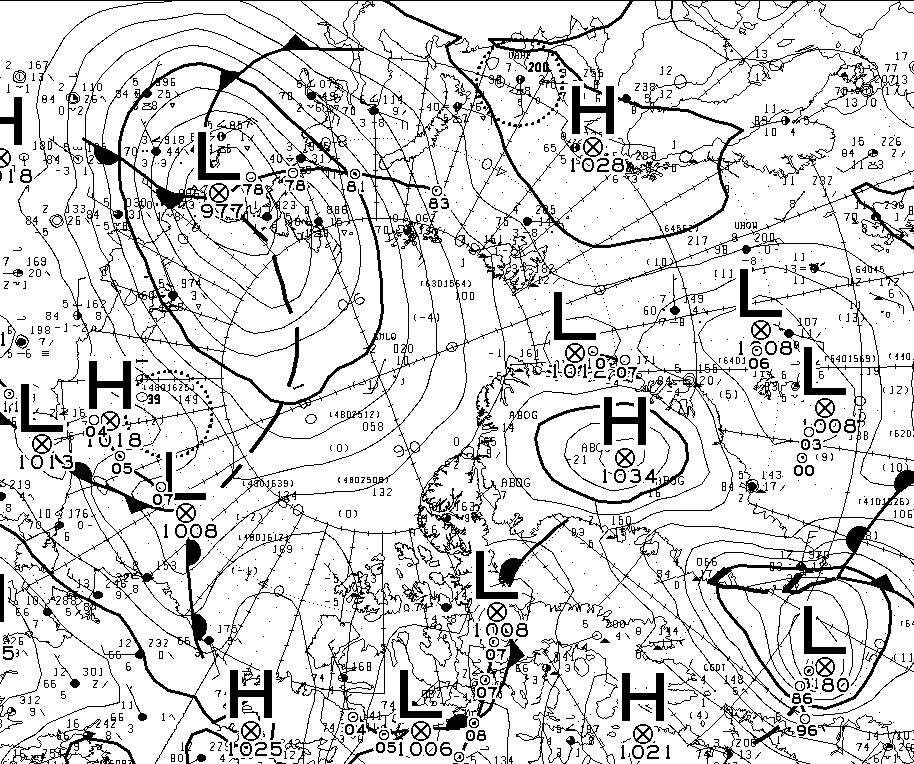
The key features of the sea level pressure pattern were high pressure (an anticyclone) over the central Arctic Ocean, a trough of low pressure extending into the Barents Sea, and an unusually high pressure over Northern Europe:

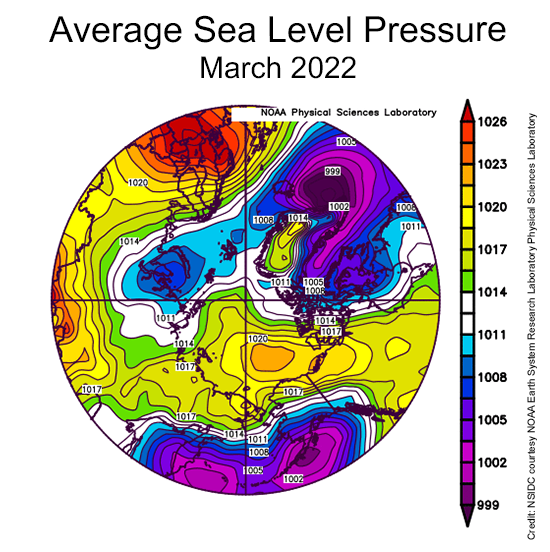
While having an anticyclone over the central Arctic Ocean is quite typical for this time of year, the combination of the high pressure over northern Europe and the pressure trough to the west led to a strong pressure gradient, leading to strong winds from south through the Norwegian and Barents Seas…

This can be tied to the extreme warm event over the Arctic Ocean seen in the middle of the month, associated with strong water vapor transport and the passage of several strong cyclones.

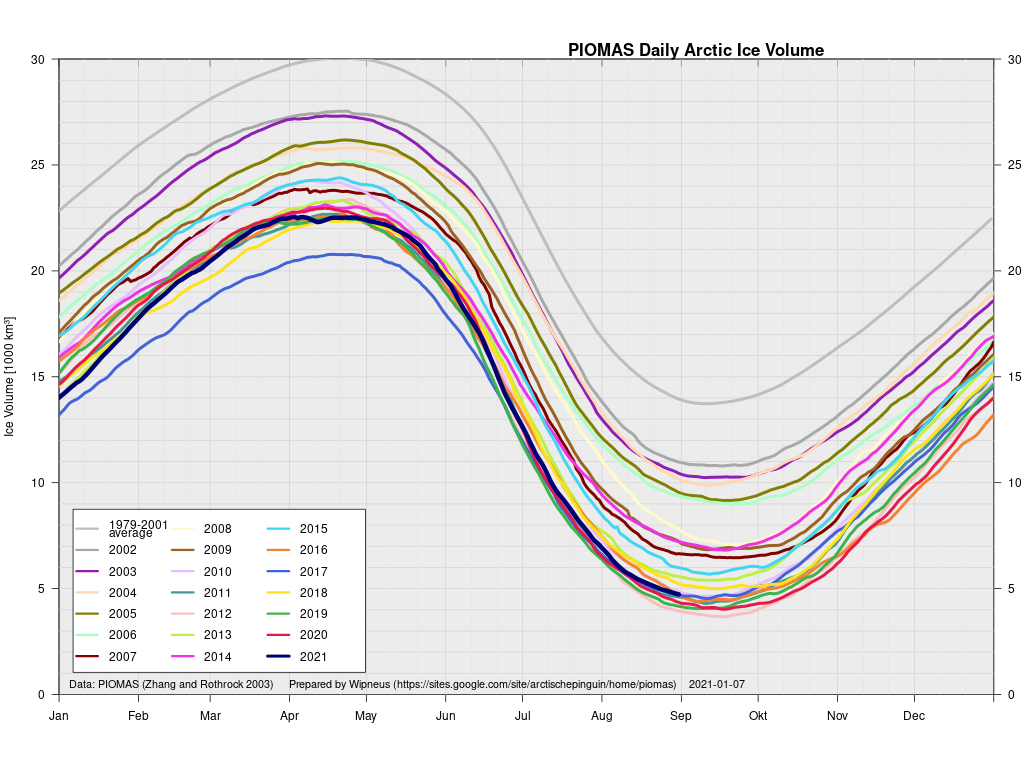
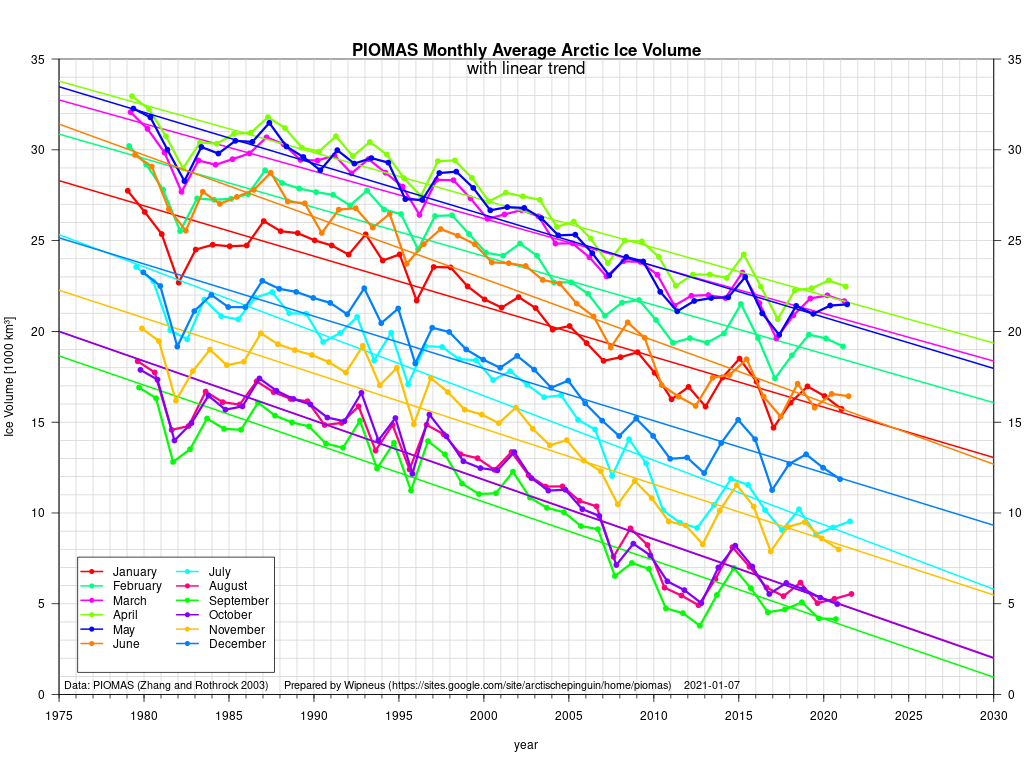
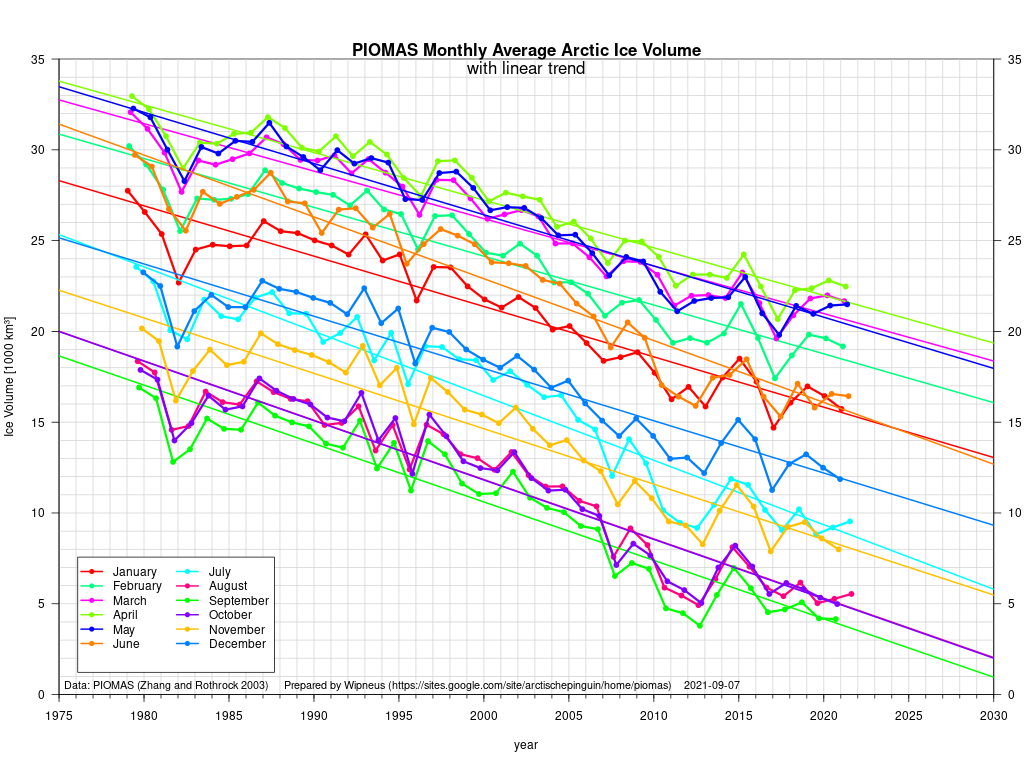
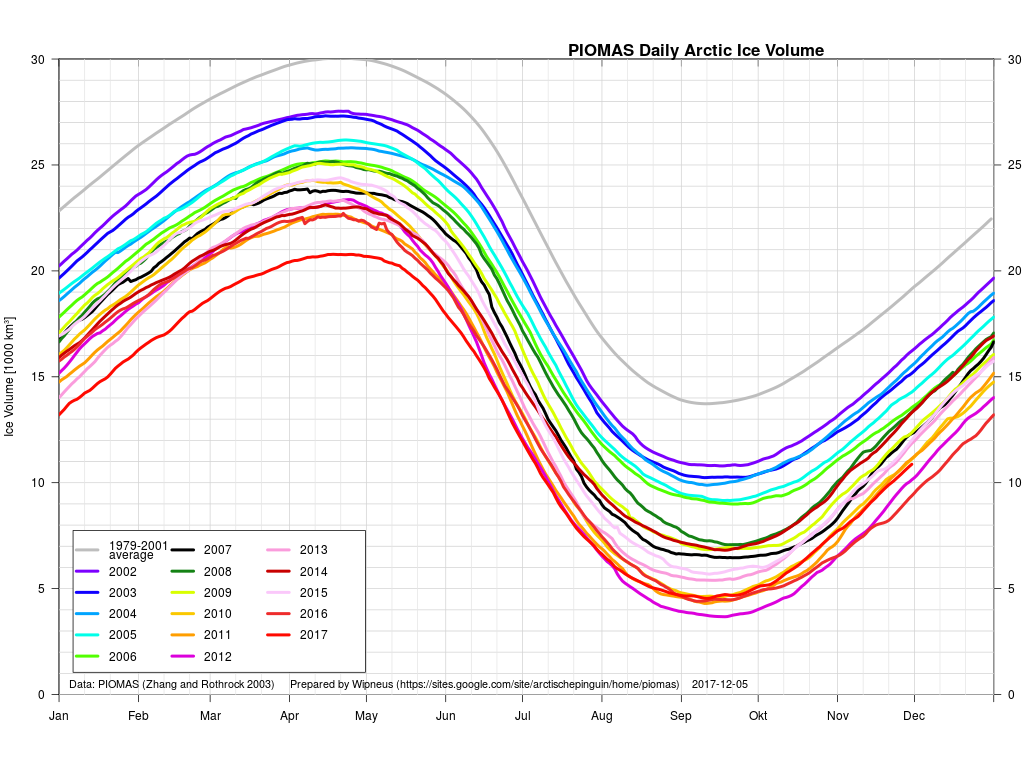
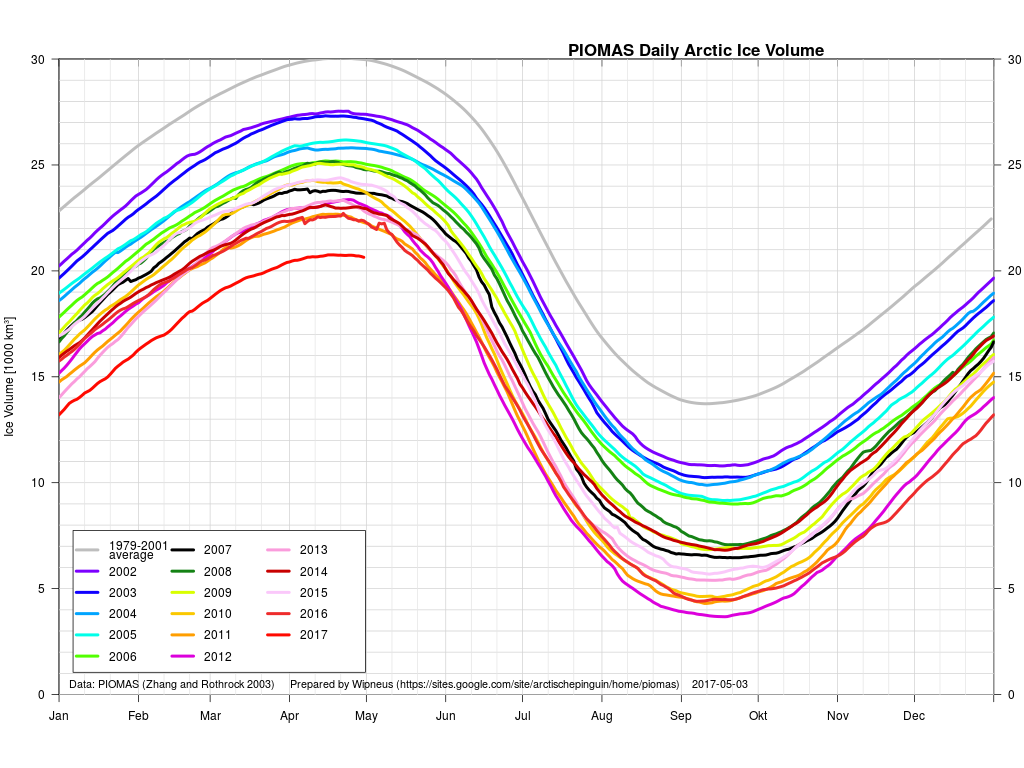
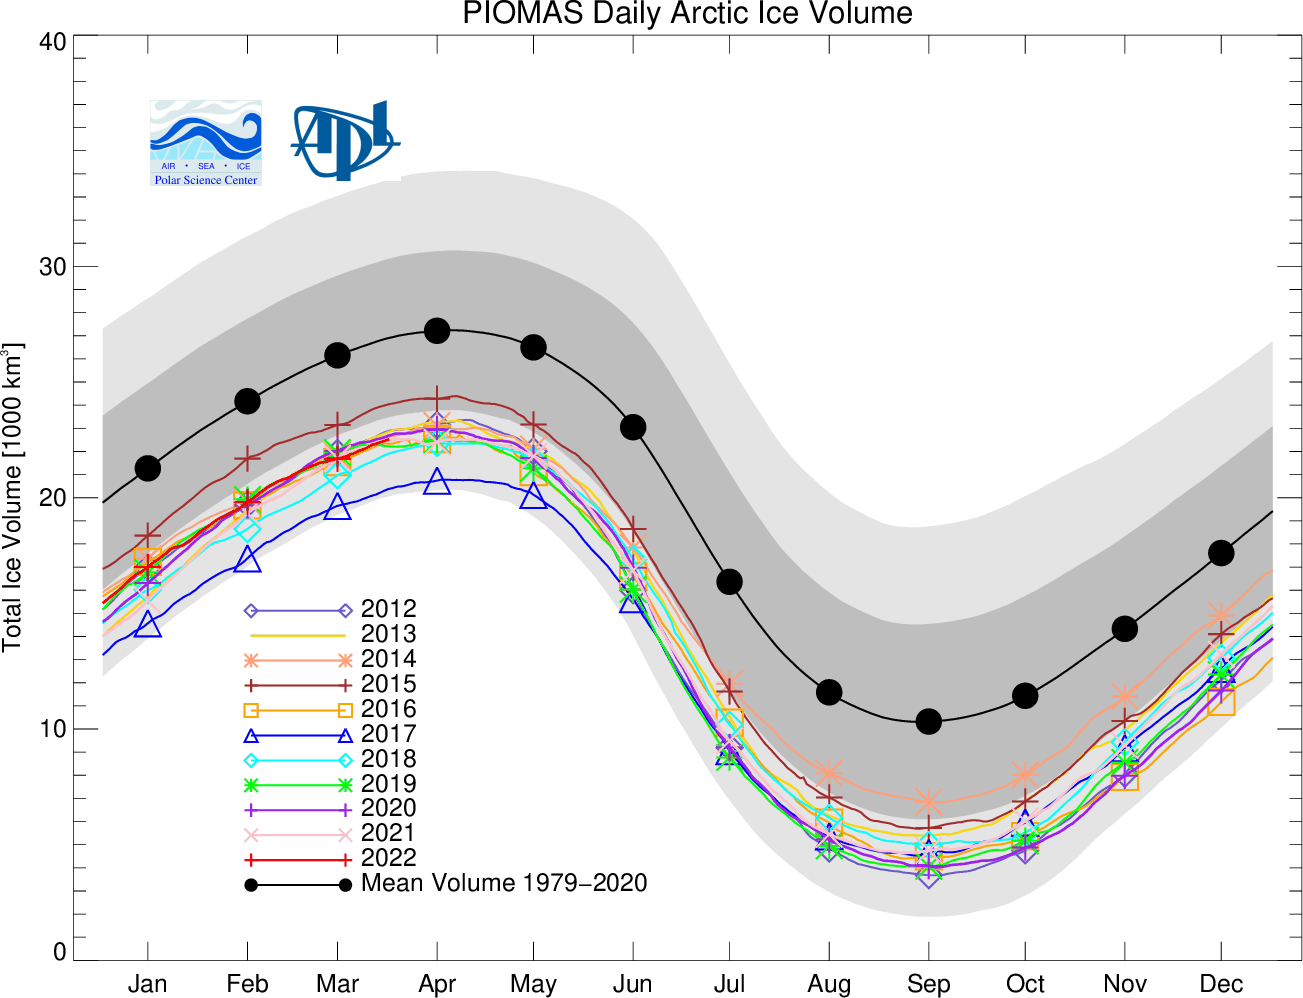
The Polar Science Center at the University of Washington has also released the PIOMAS volume data for March 2022:

Average Arctic sea ice volume in March 2022 was 21,700 km3. This value is the 6th lowest on record for March,  about  2,200 km3 above the  record set in 2017.   Monthly  ice volume was 38% below the maximum in 1979 and 25% below the mean value for 1979-2021:

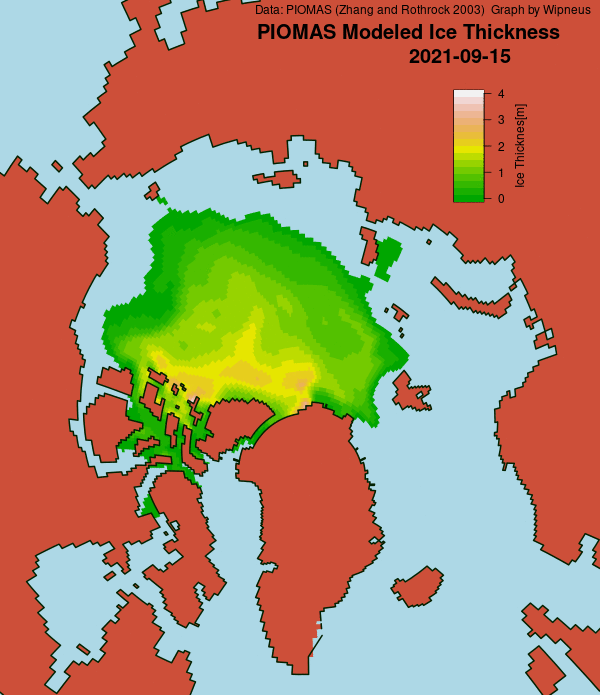
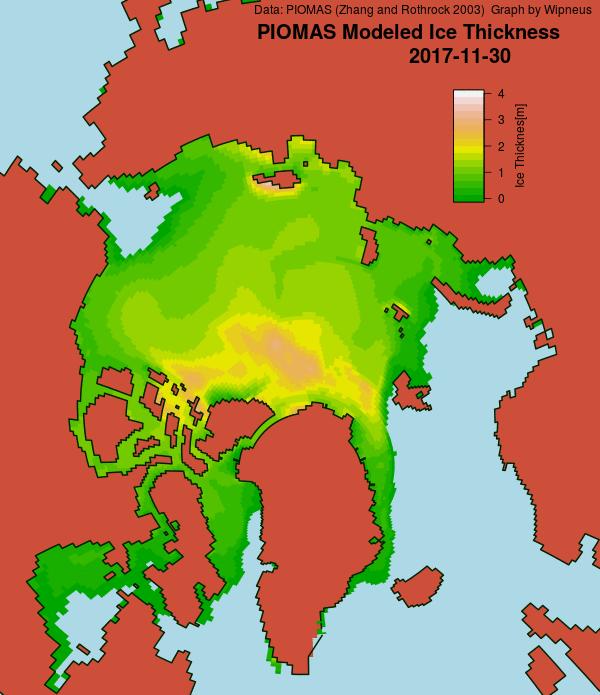
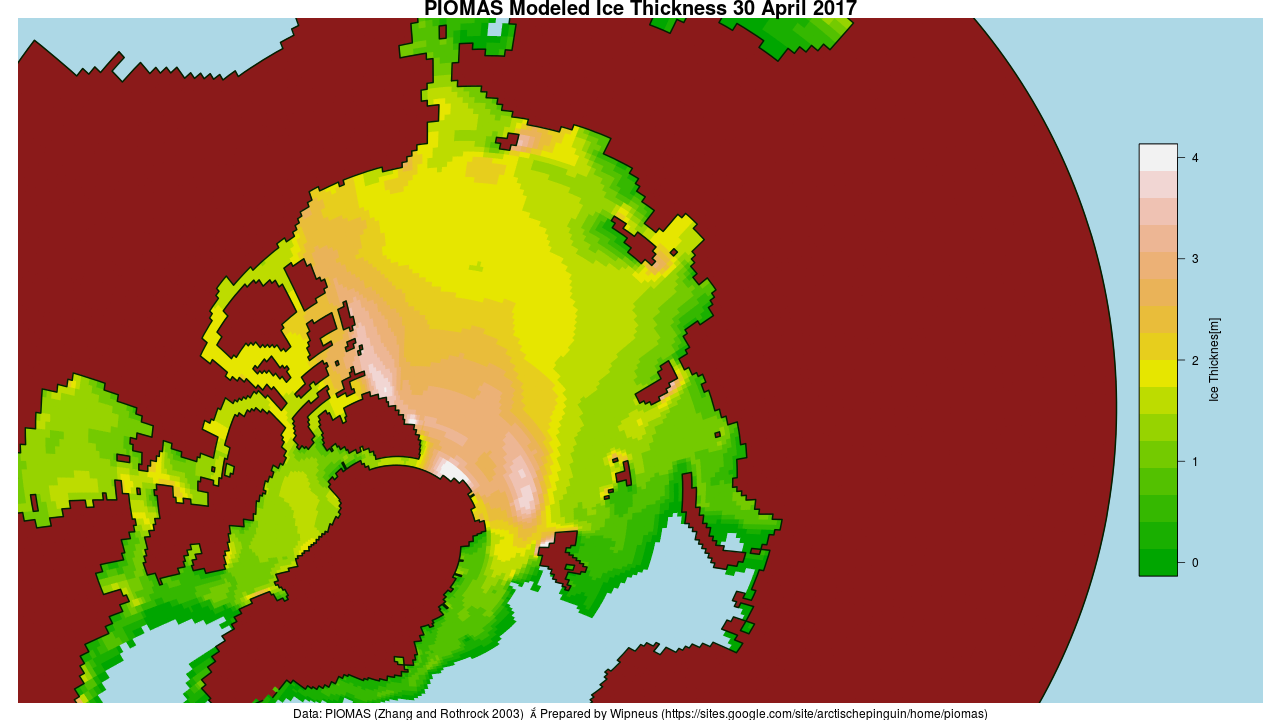
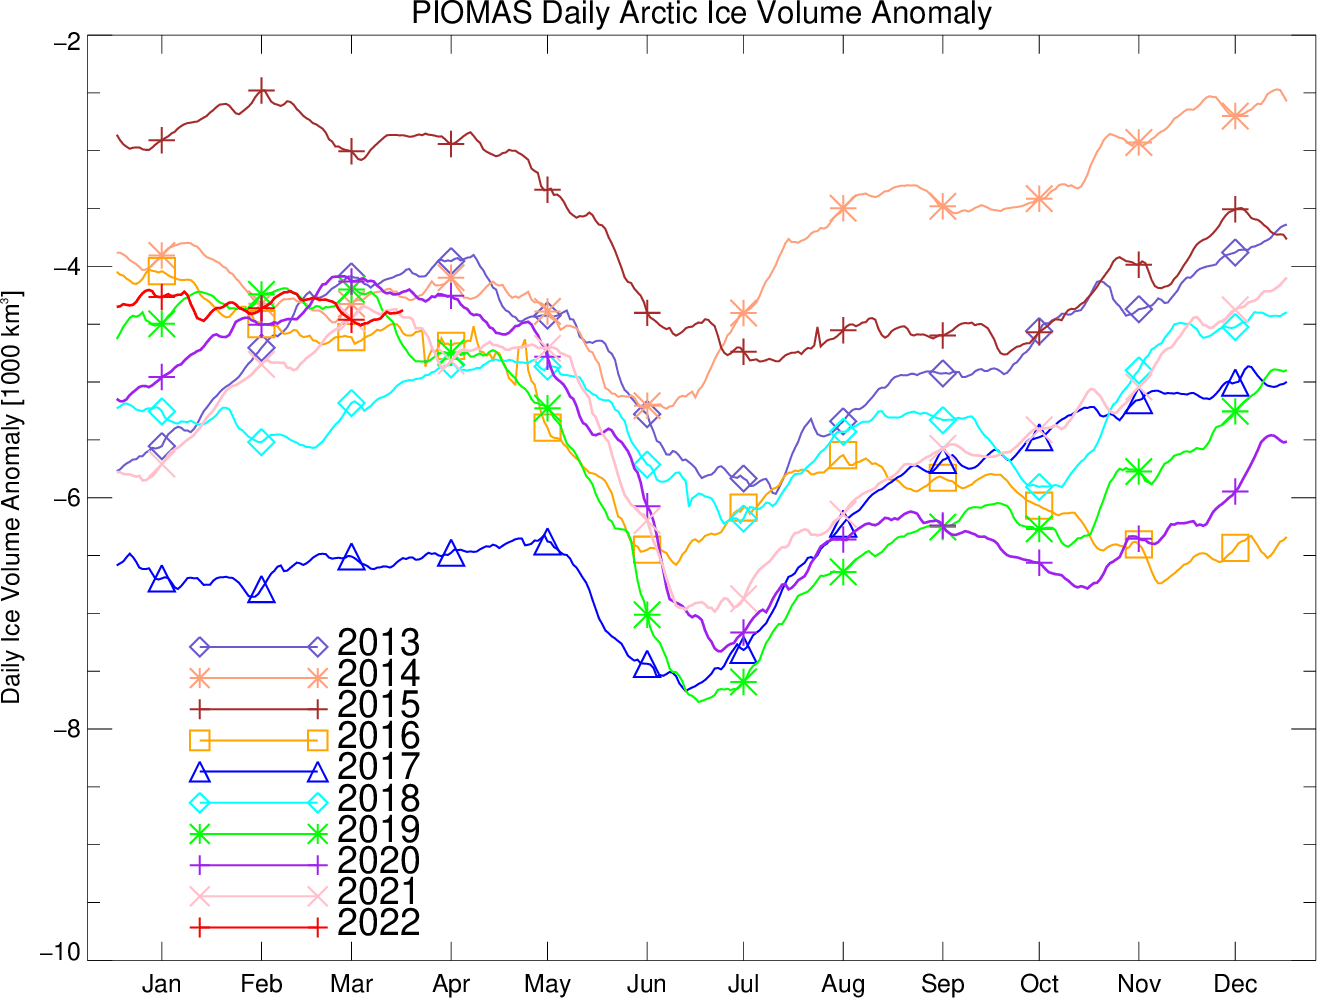
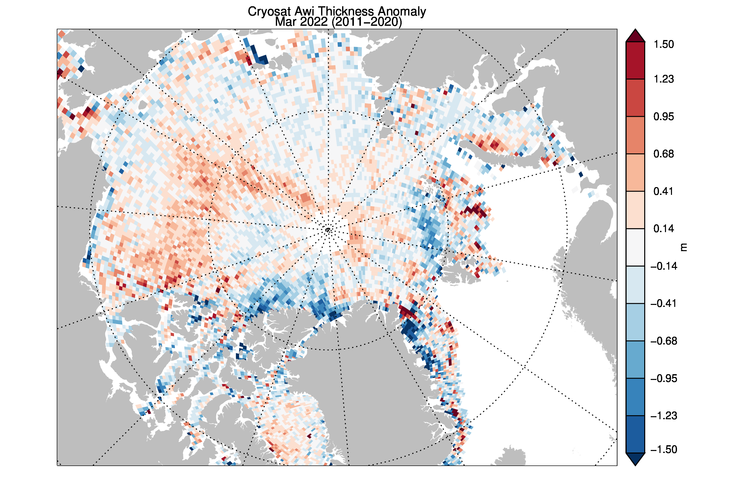
Ice growth anomalies for March 2022 continued to be at the upper end of the most recent decade with a mean ice thickness  (above 15 cm thickness) at the middle of  recent values:

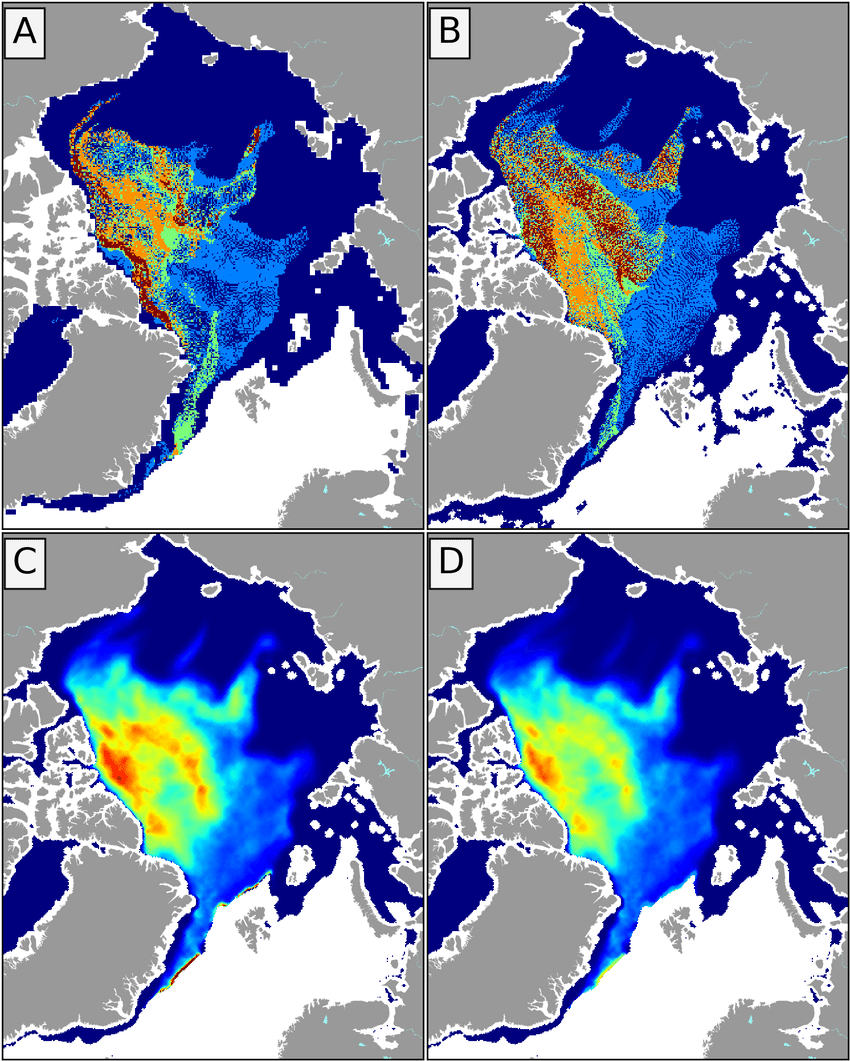
The ice thickness anomaly map for March 2022 relative to 2011-2020 divides the Arctic in two halves with positive anomalies in the “Western Arctic”  but negative anomalies in “Eastern Arctic”. A narrow band of negative anomalies remains along the coast of   North of Greenland but positive anomaly exists north of Baffin Island.

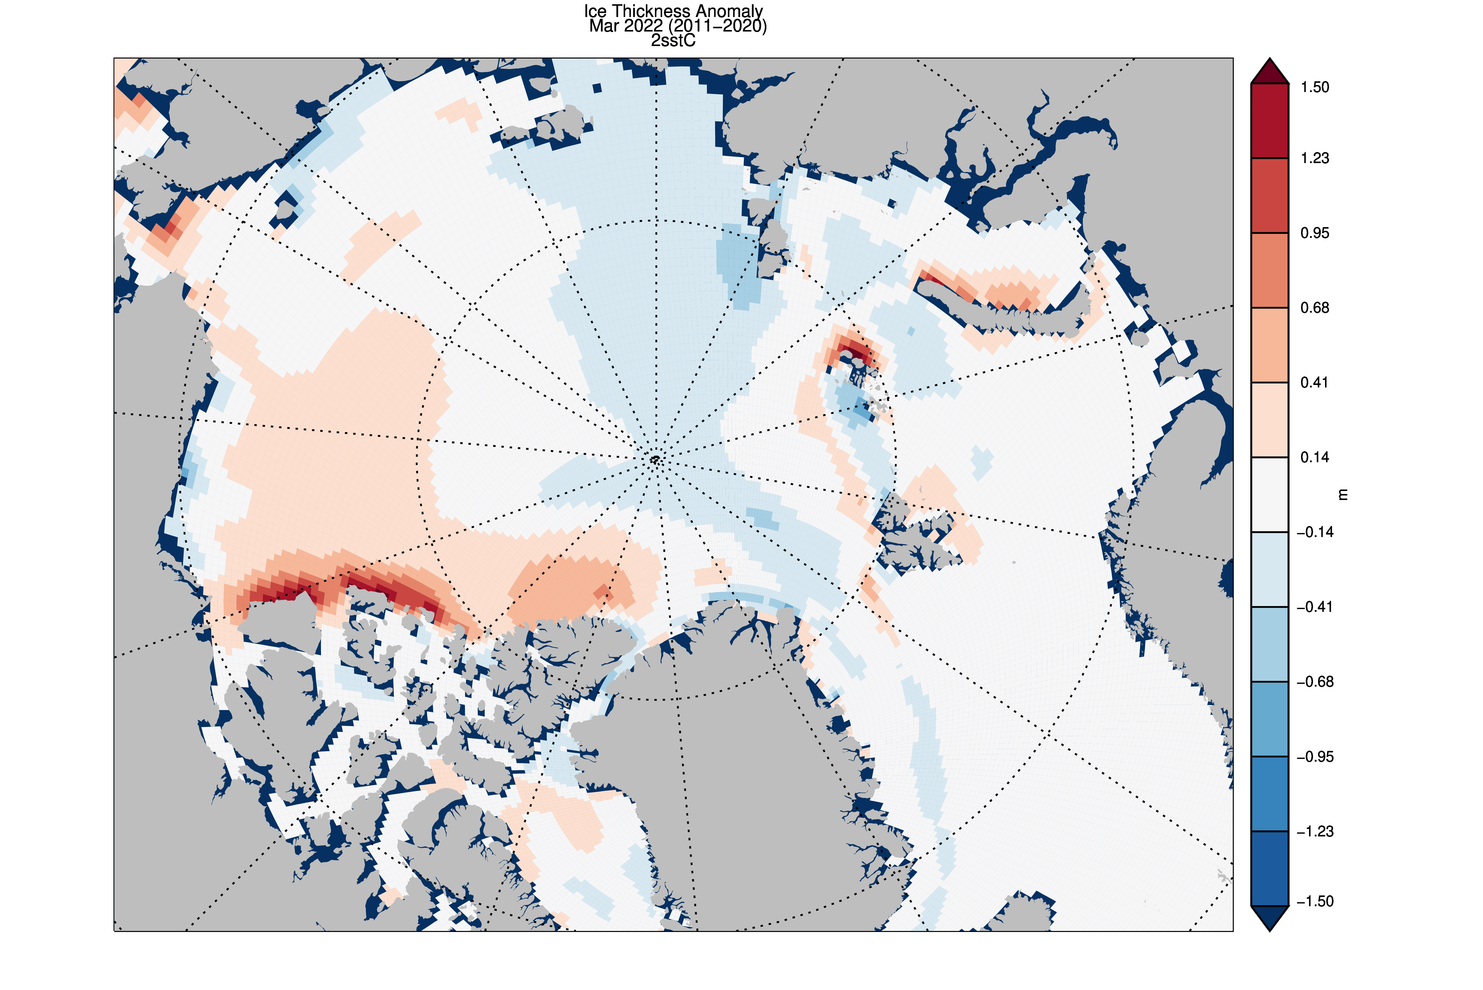
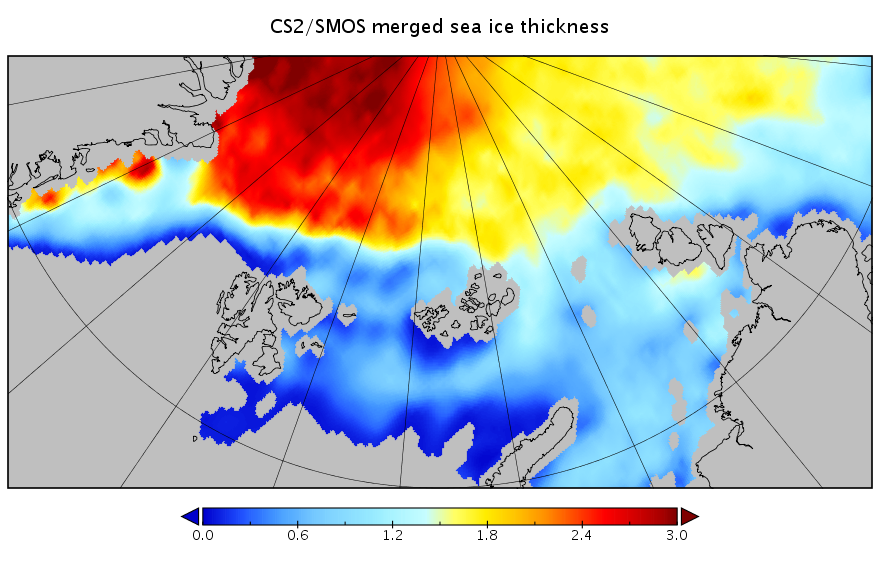
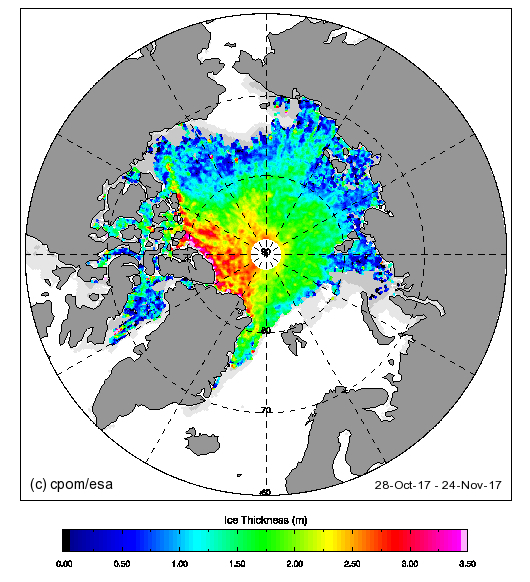
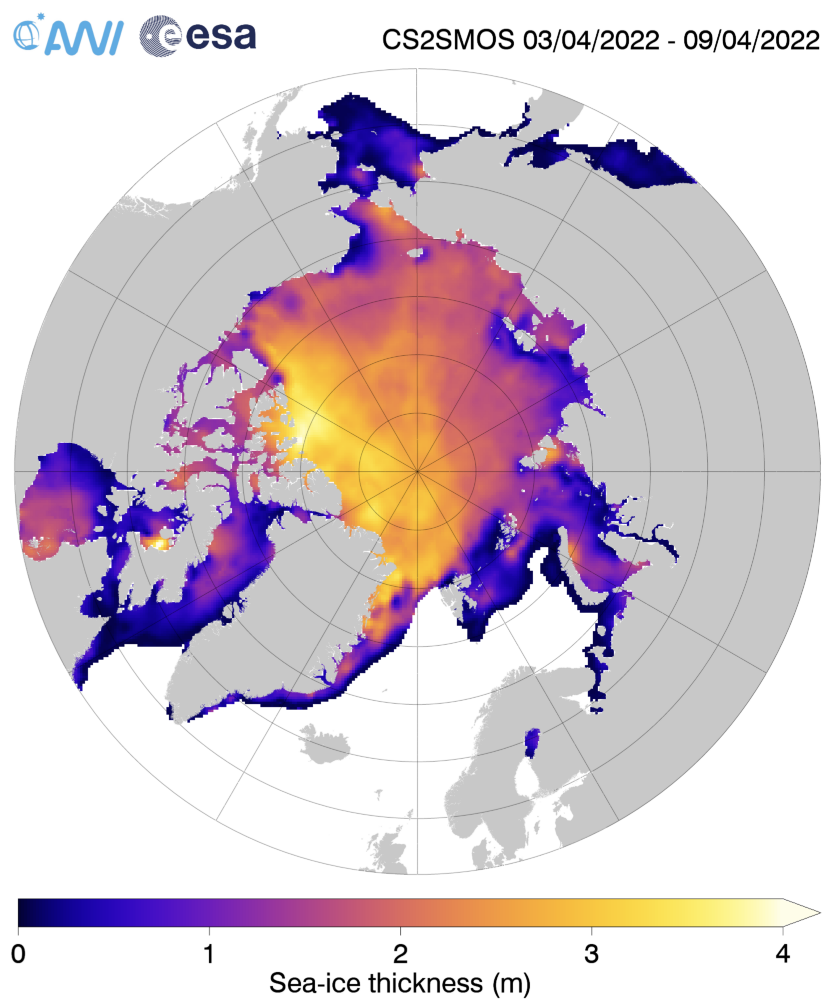
CryoSat 2 ice thickness shows an  similar pattern of sea ice thickness anomalies though the areas North of Greenland and Baffin Bay show substantial differences:

[Edit – April 10th]

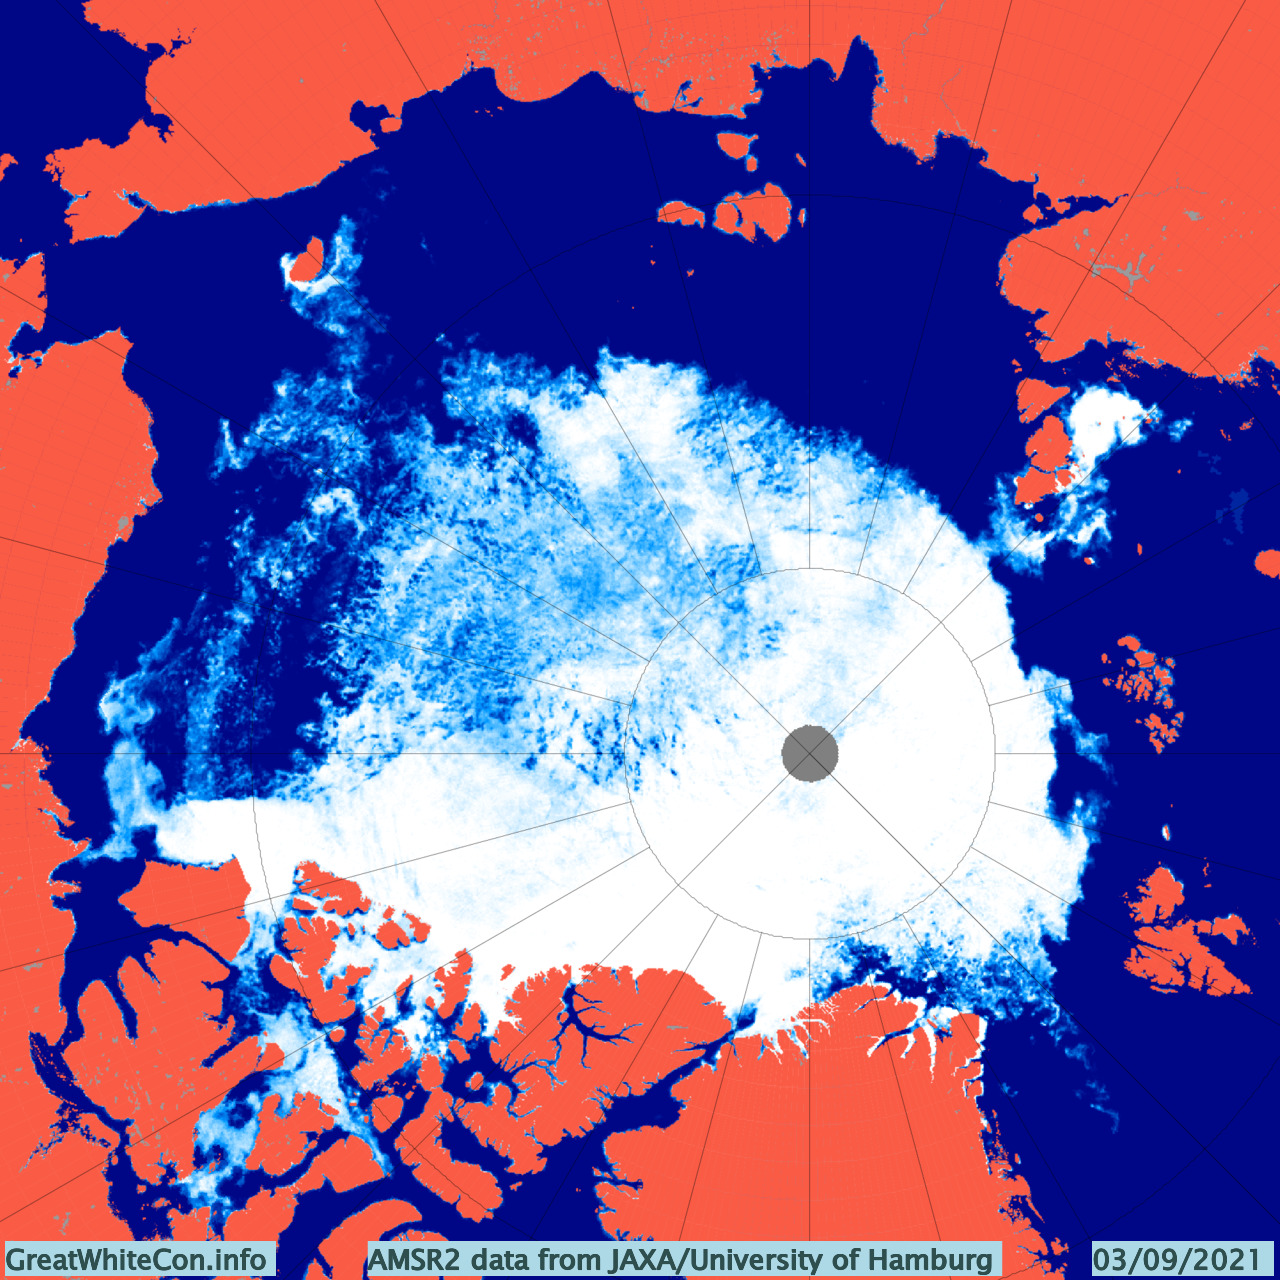
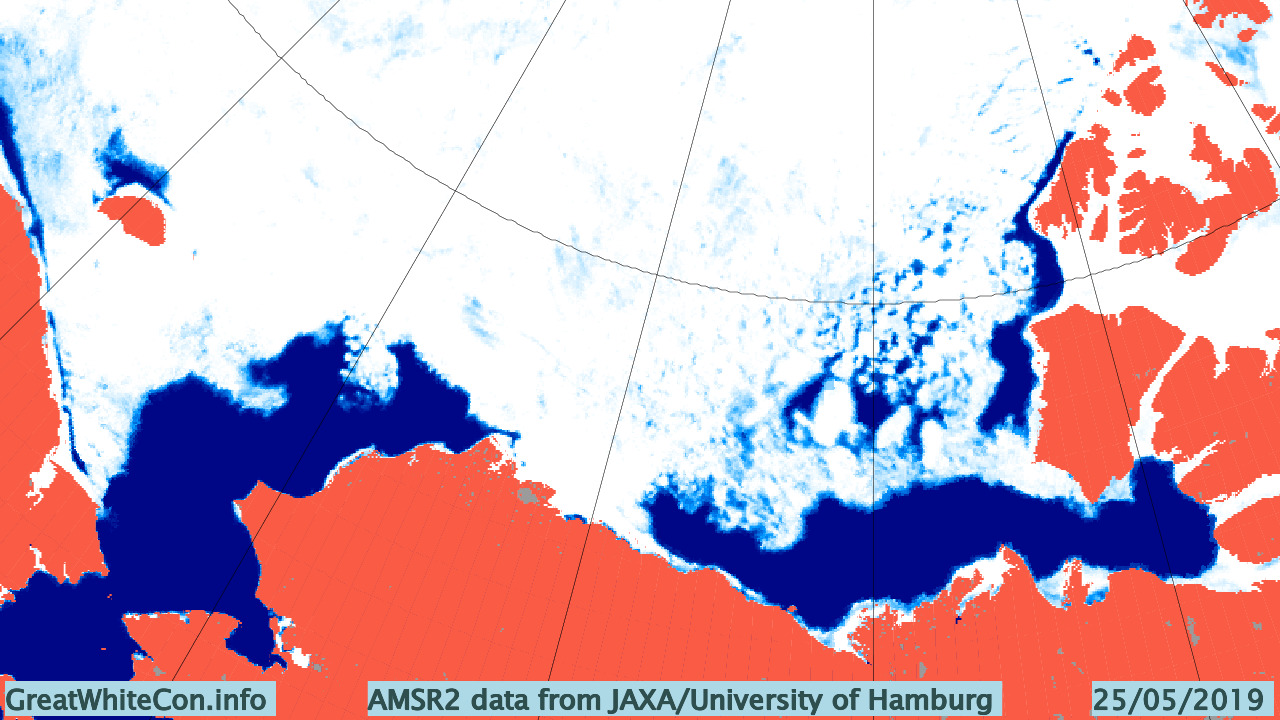
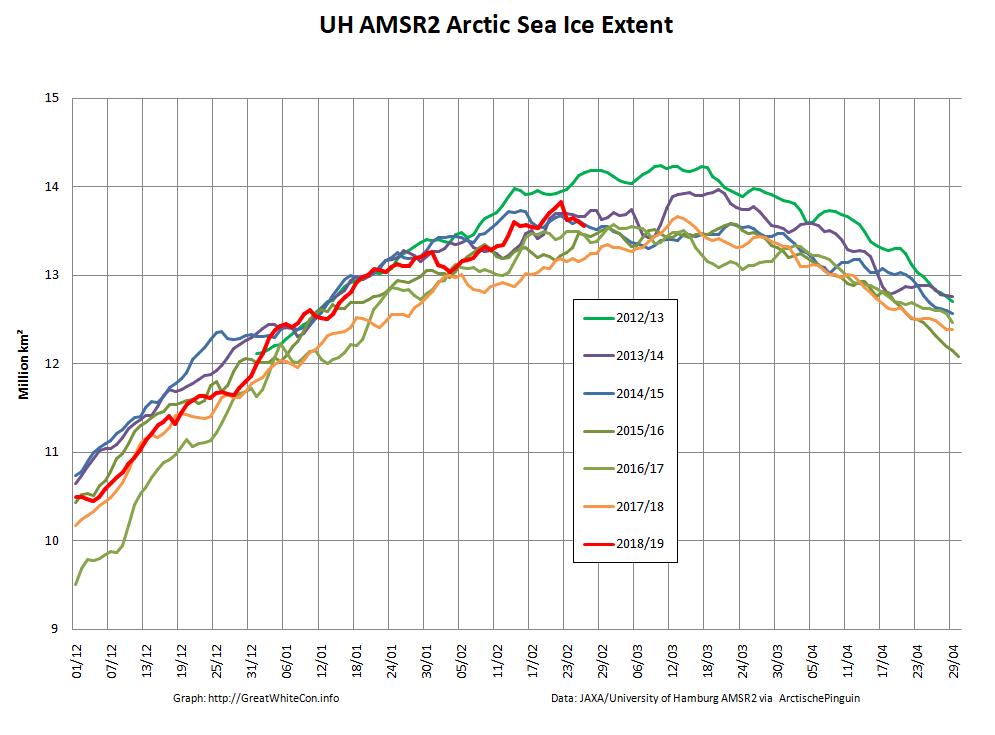
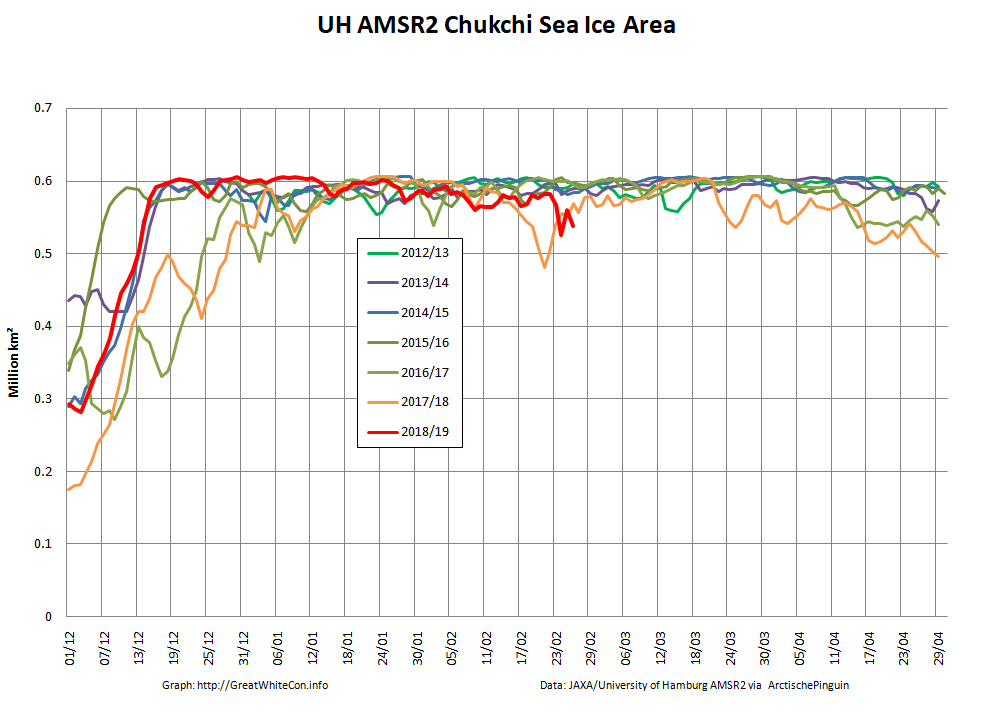
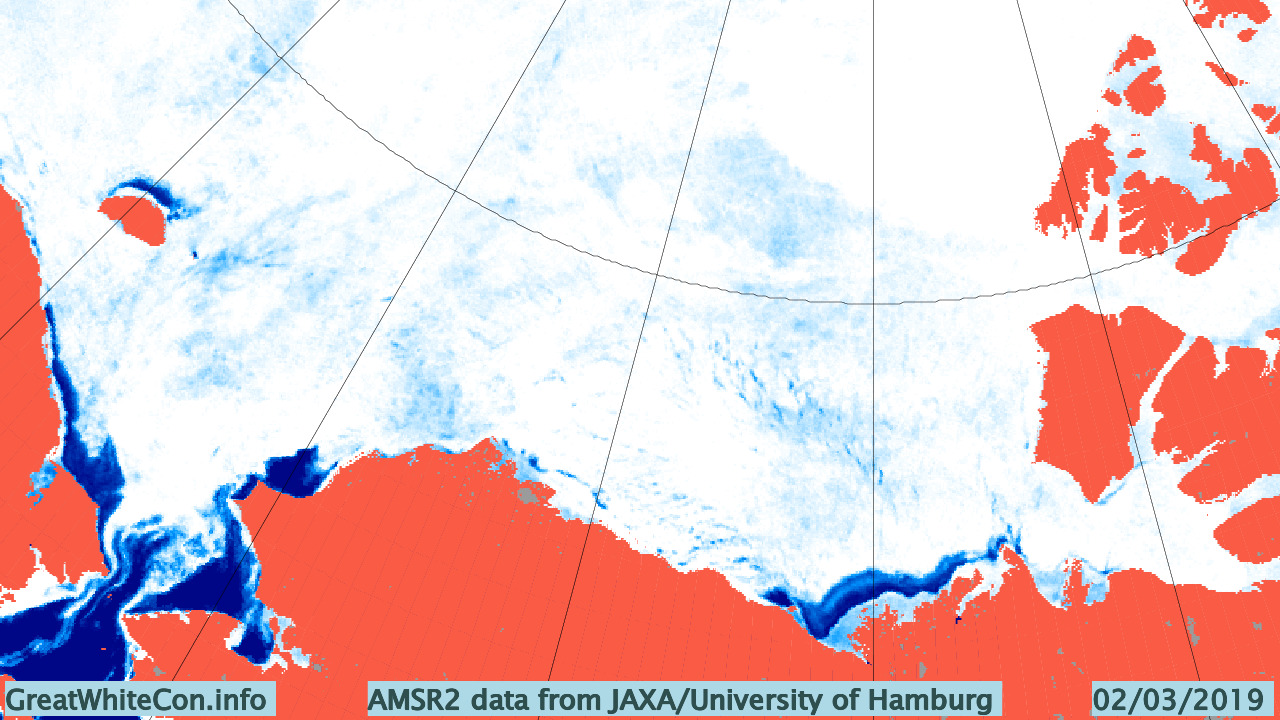
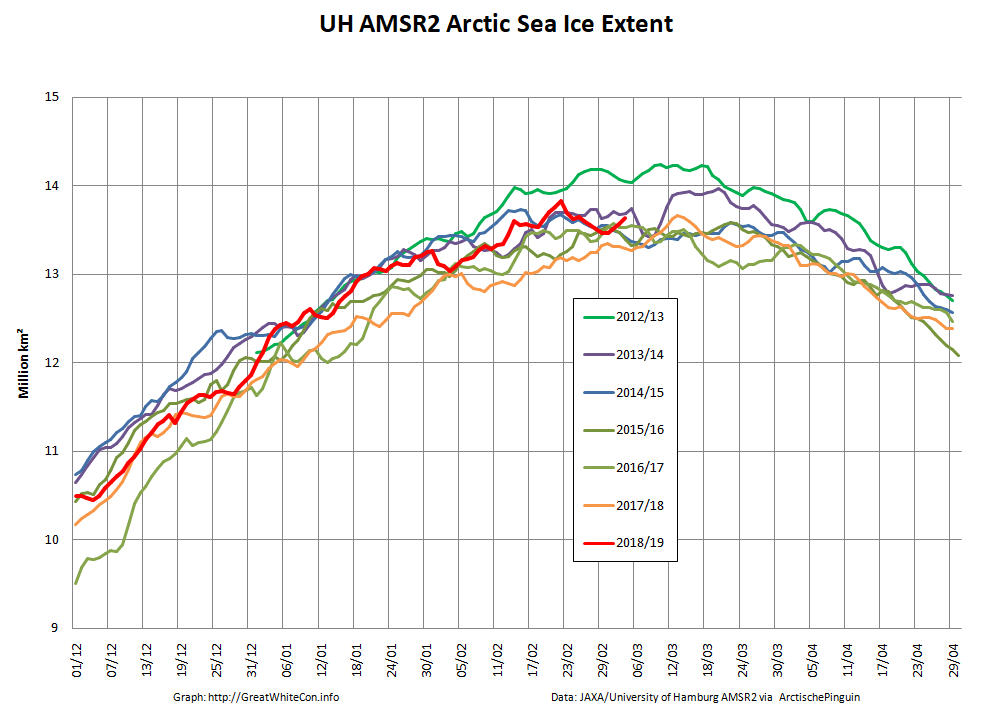
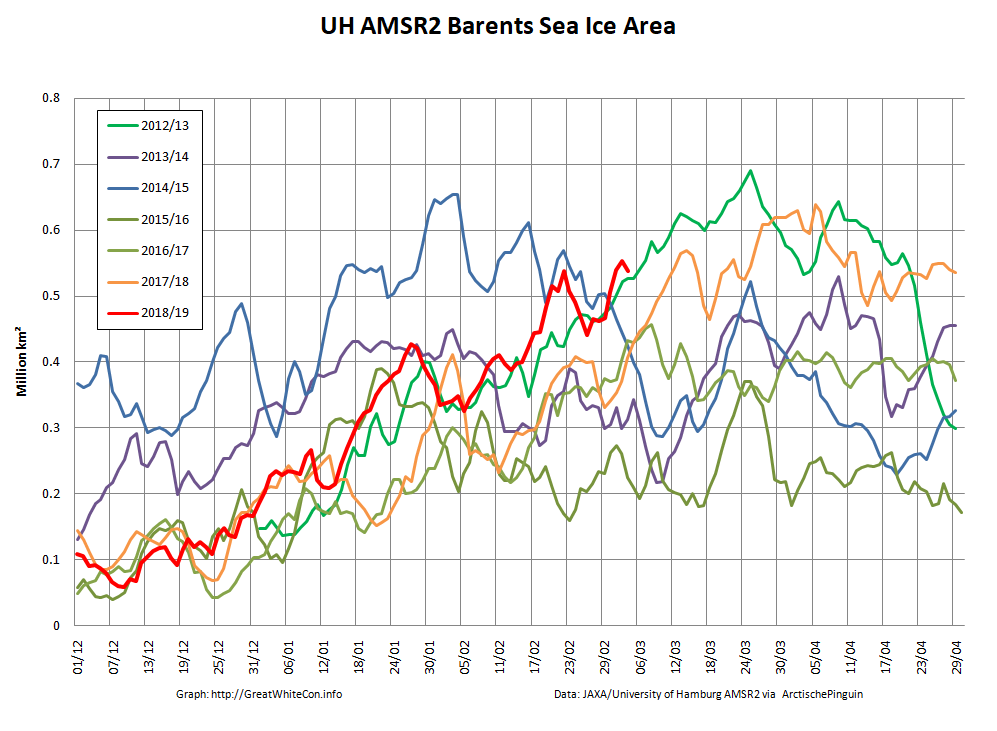
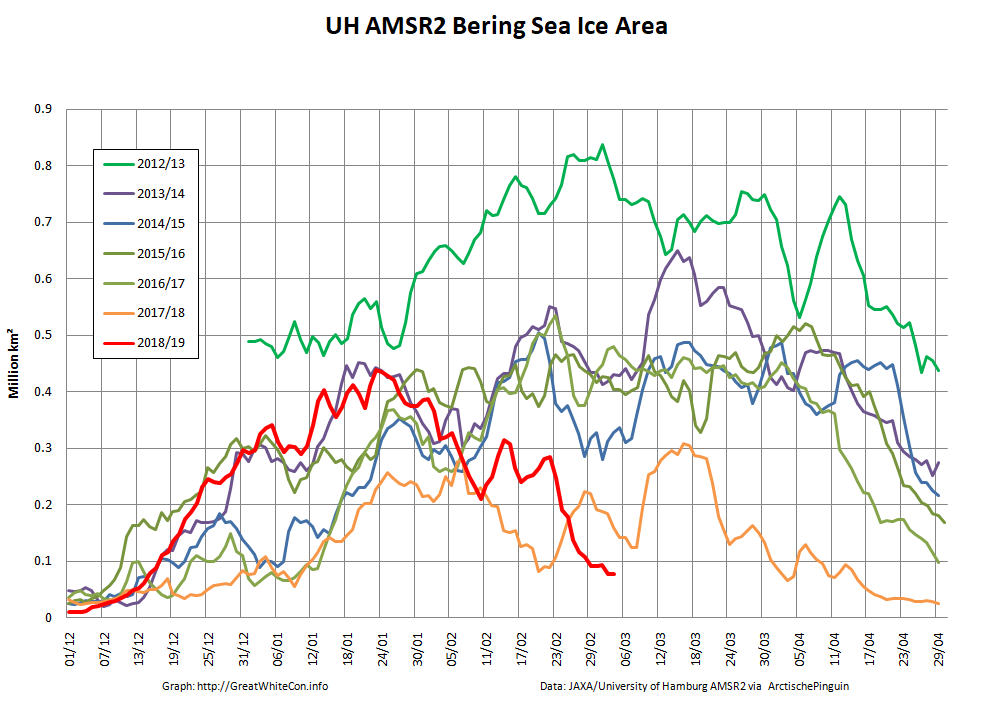
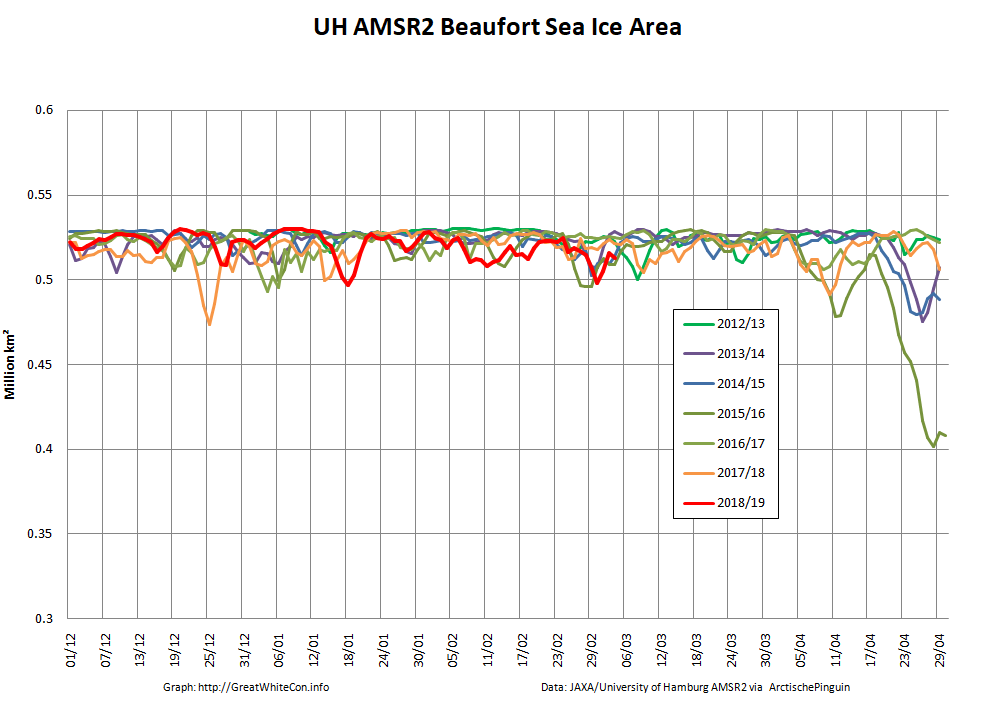
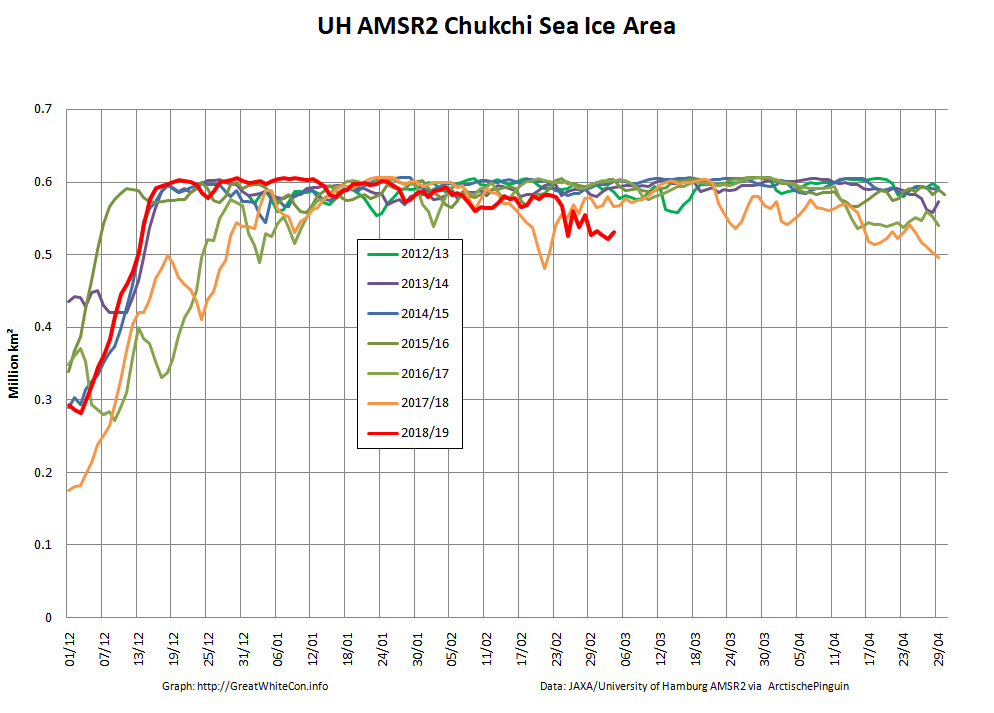
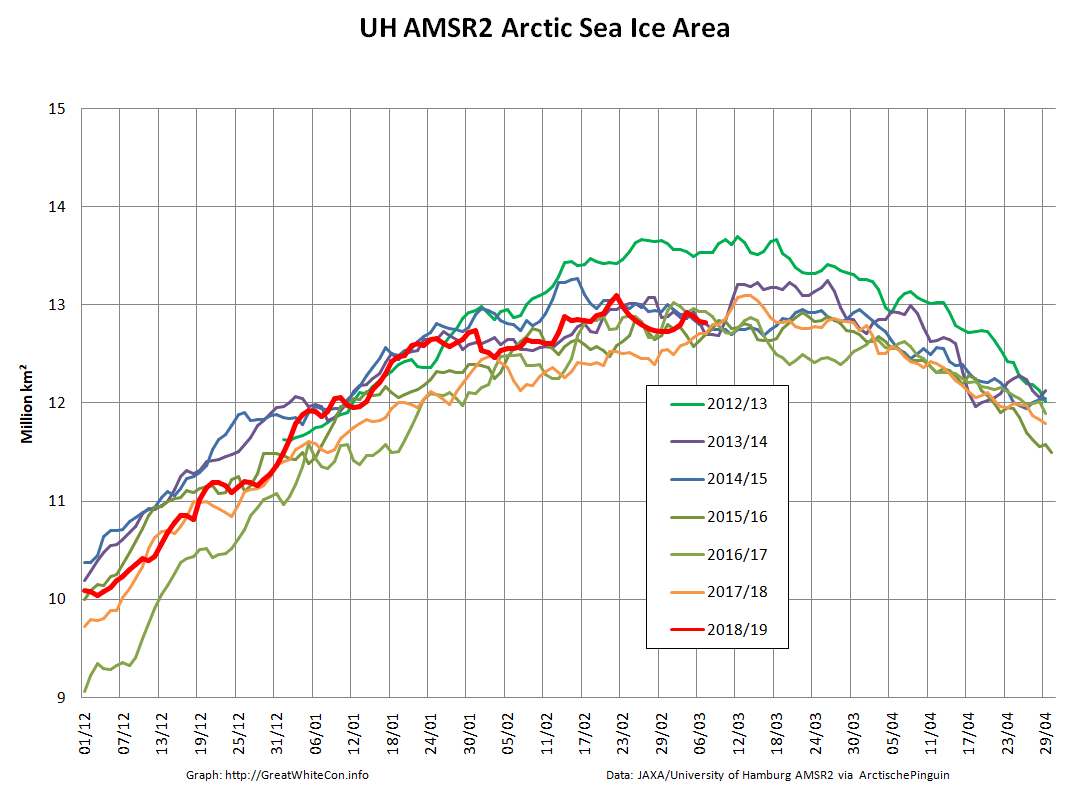
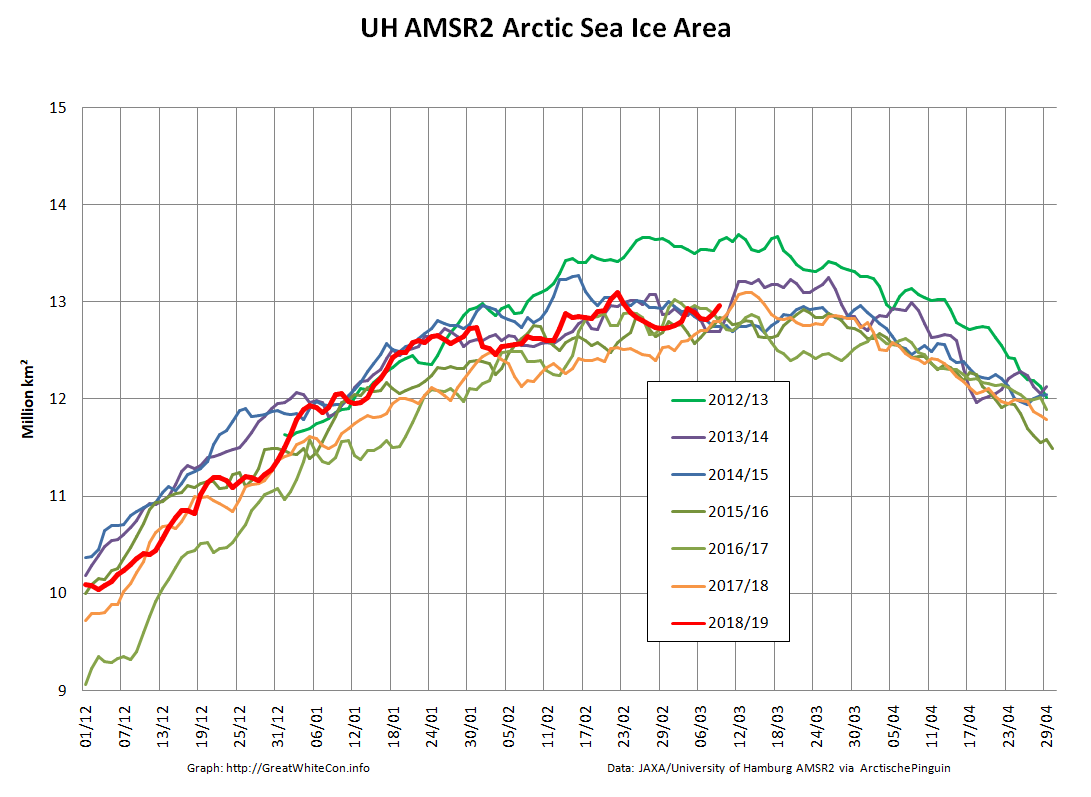
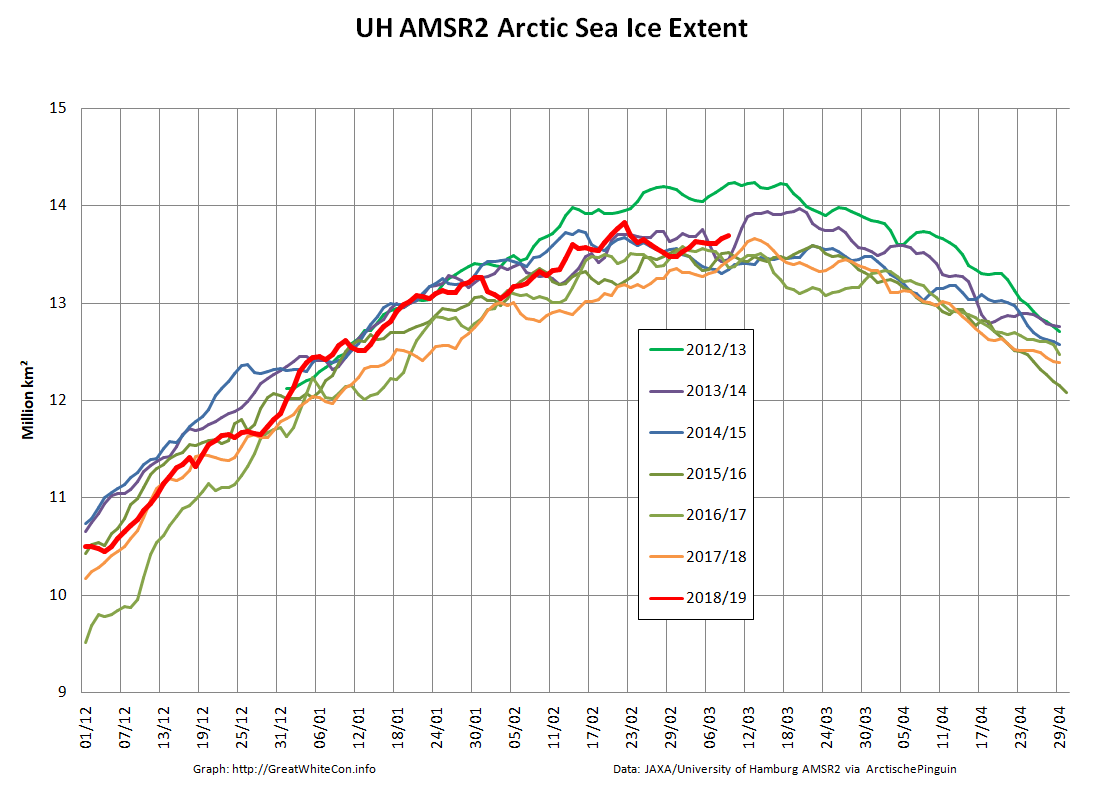
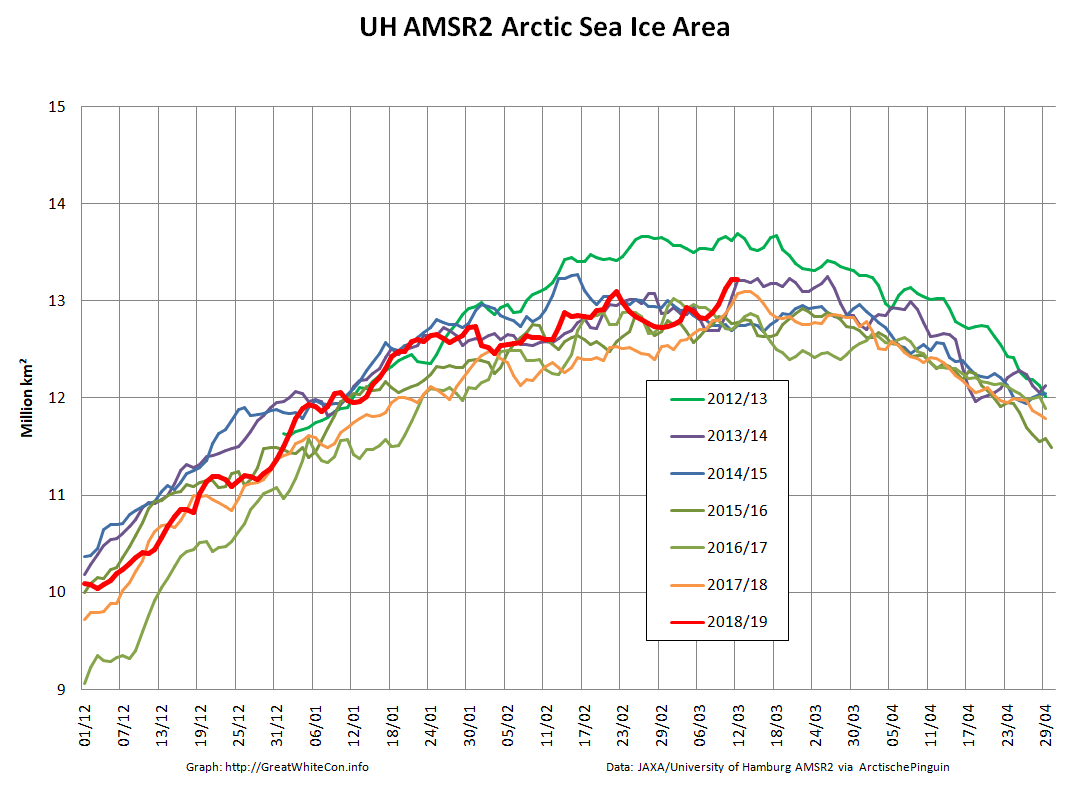
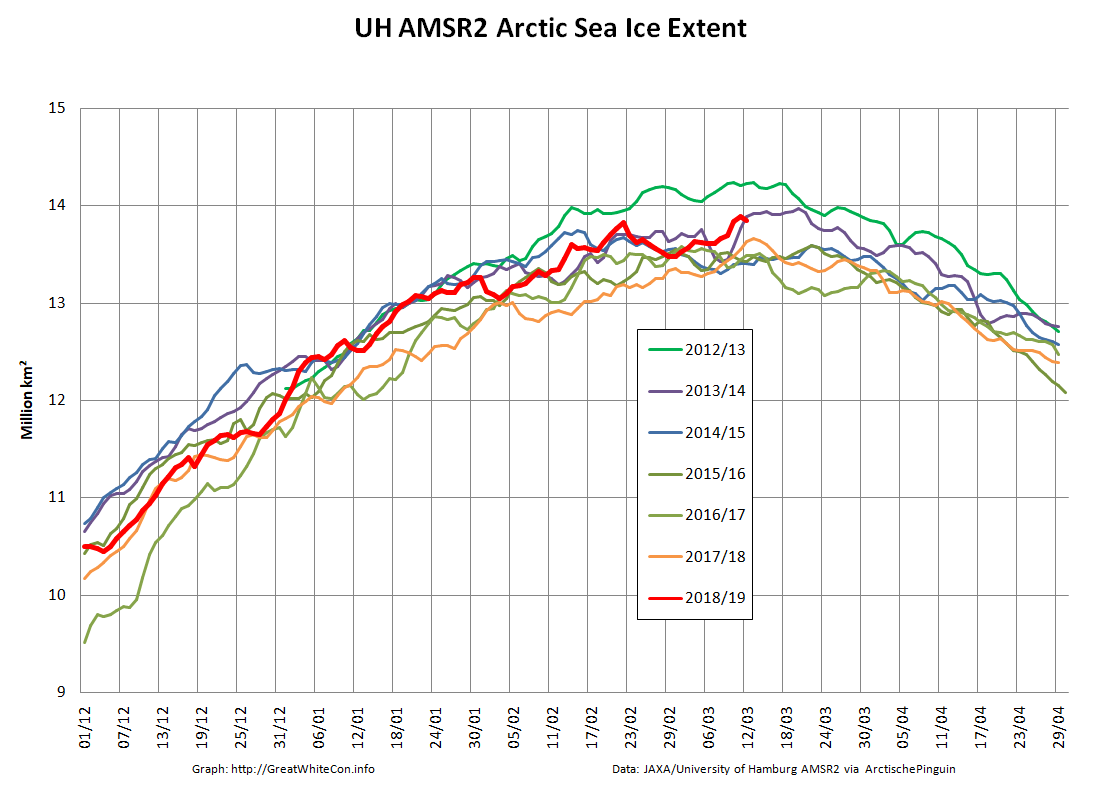
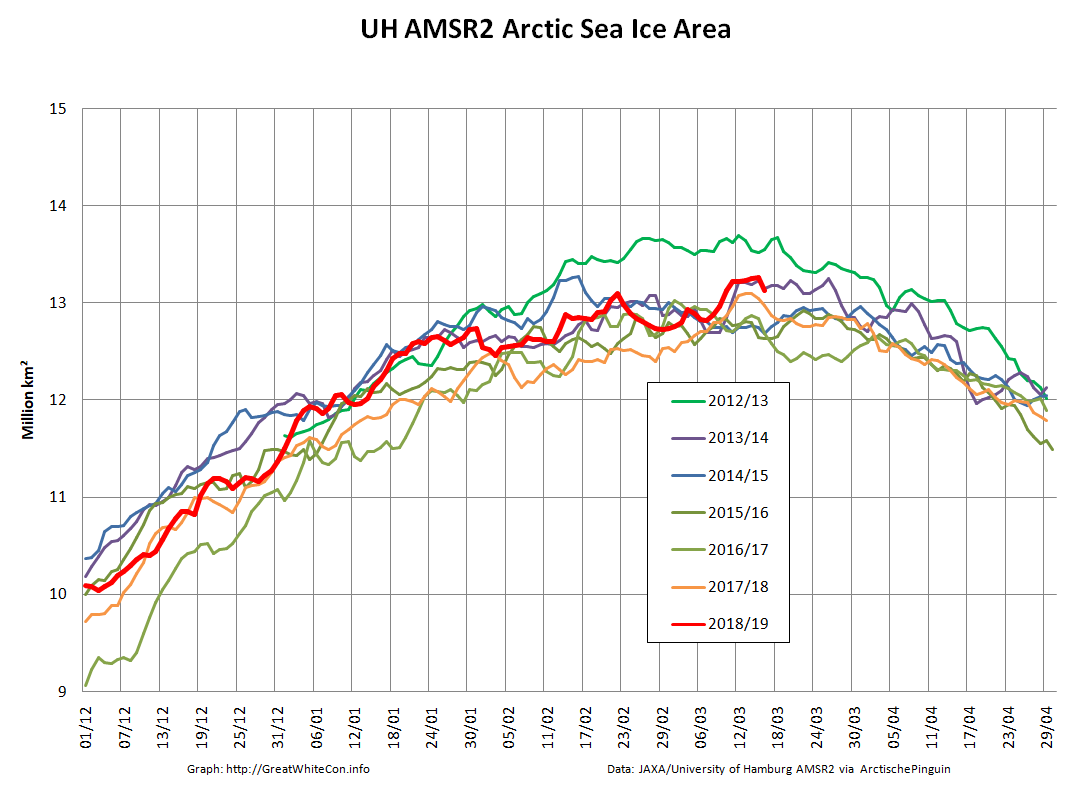
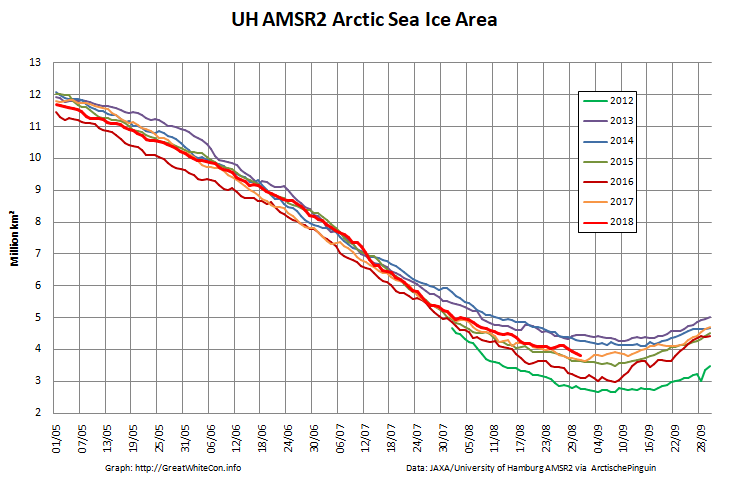
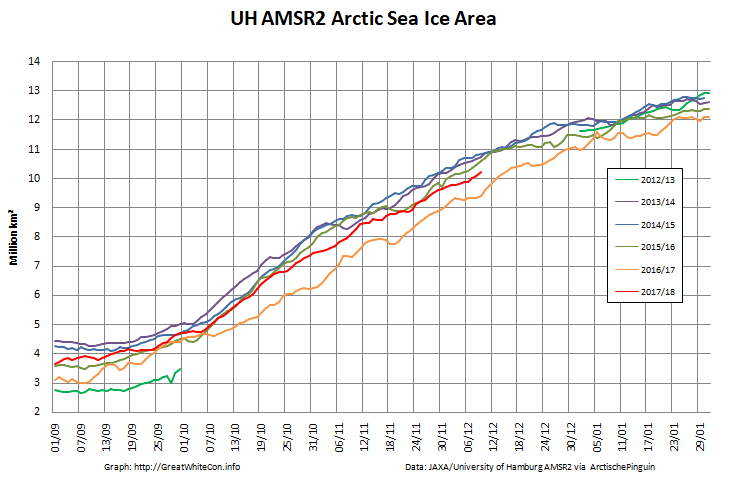
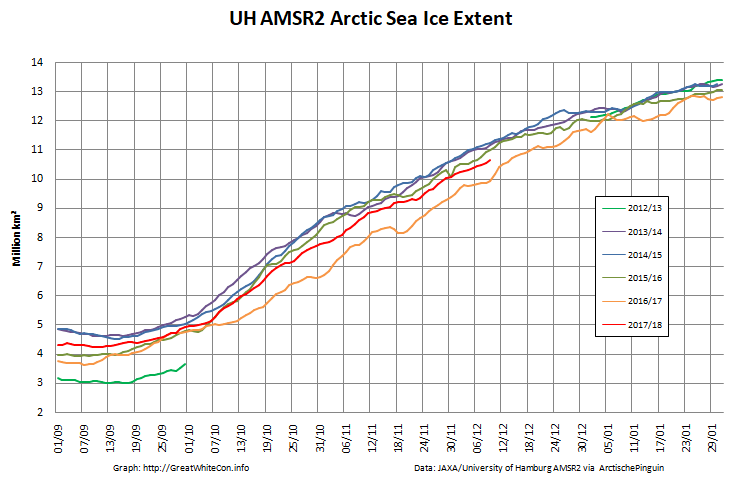
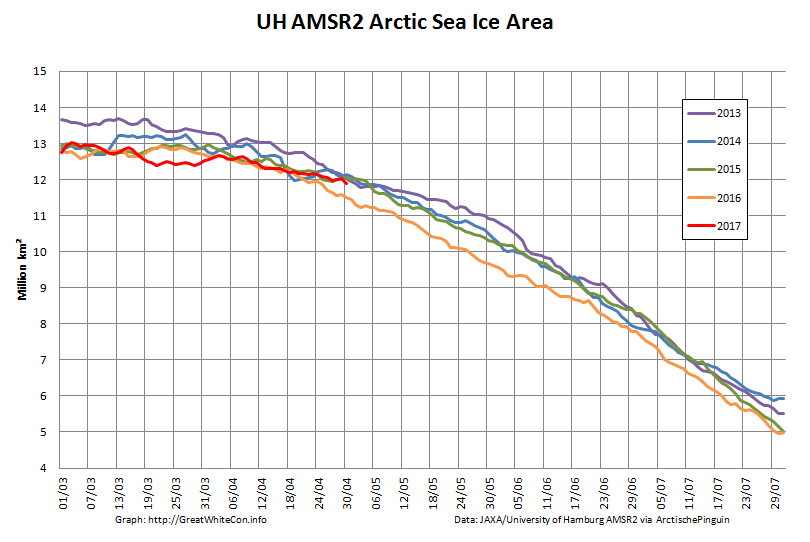
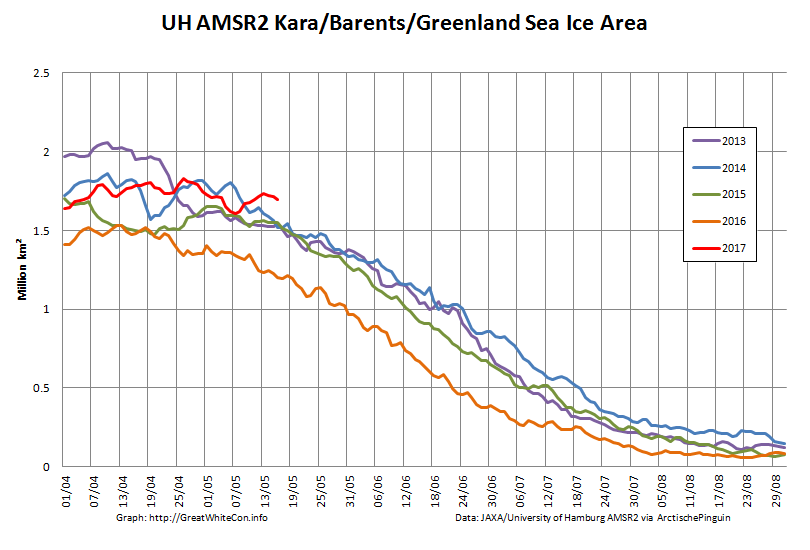
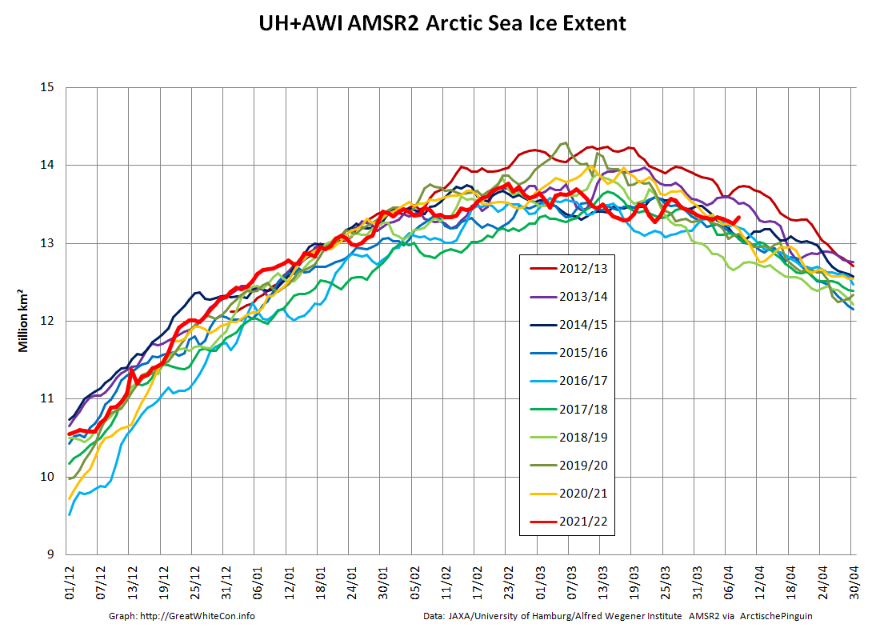
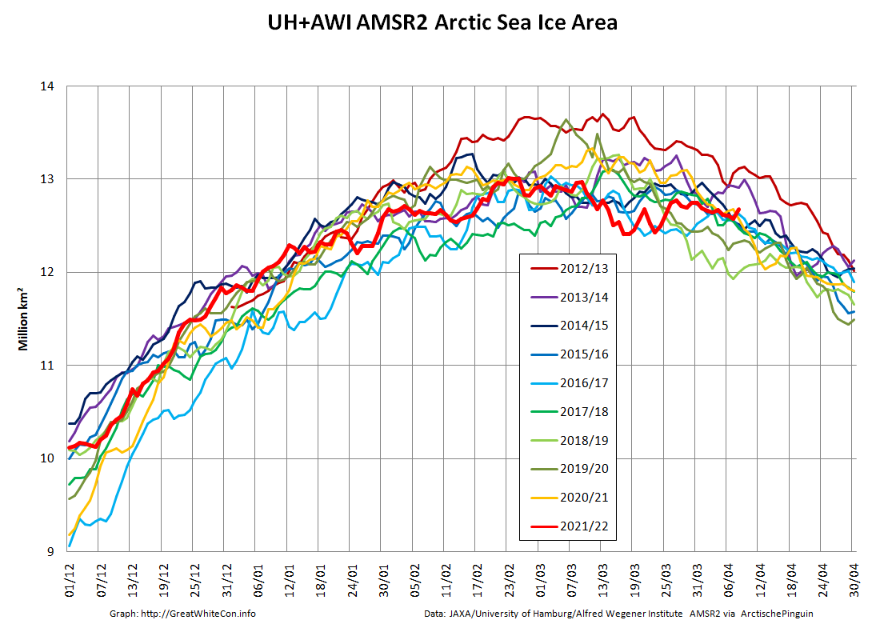
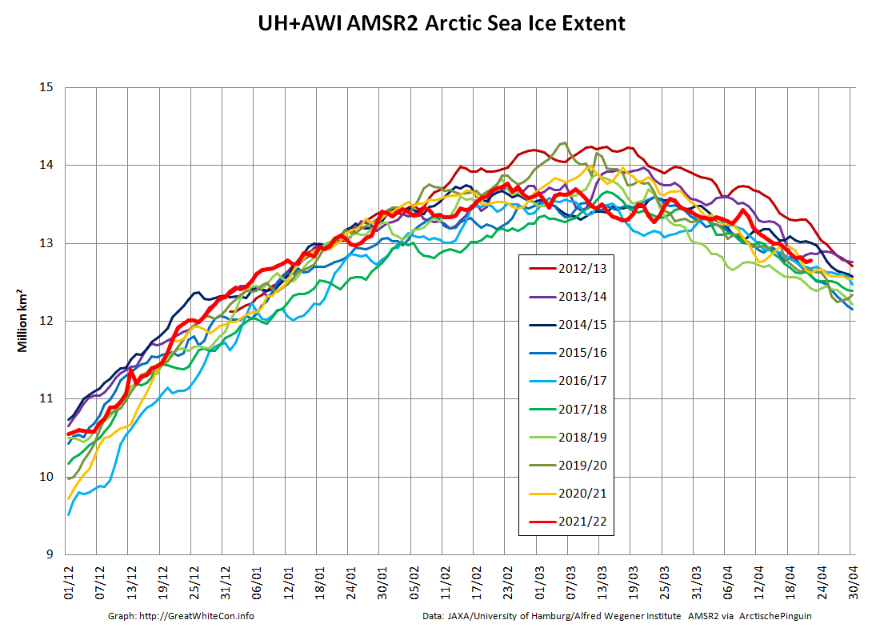
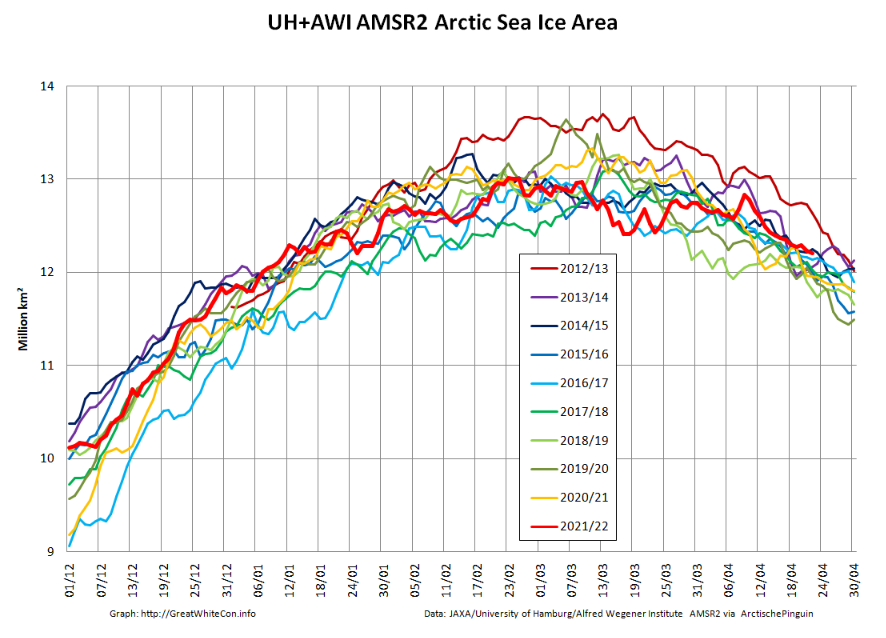
Here are the latest graphs of our favourite “high resolution” AMSR2 metrics, which combine recent data from the Alfred Wegener Institute with historical data from the University of Hamburg:


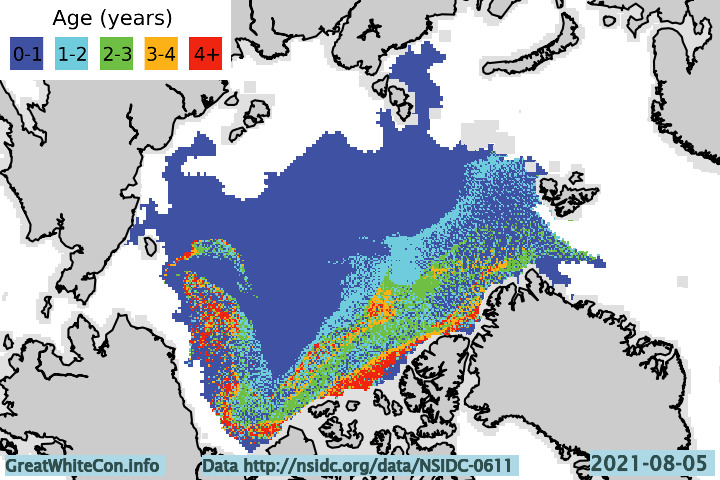
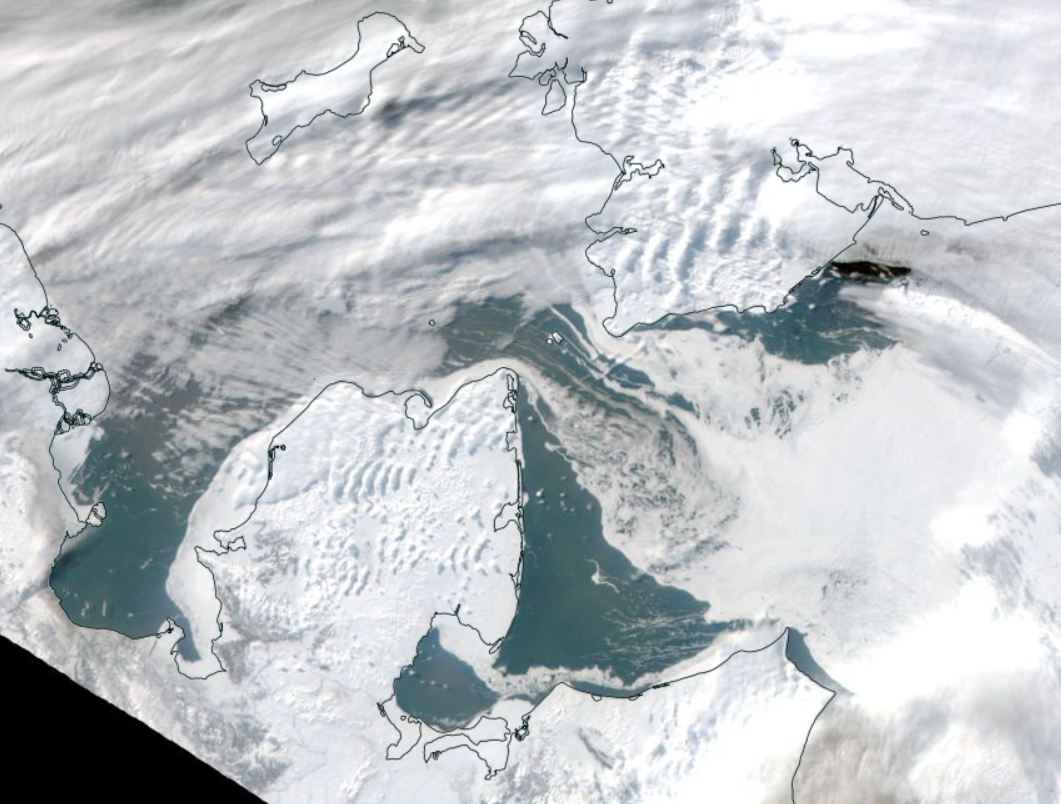
As you can see, there have indeed been a few ups and downs! Click the image below to see a 10 Mb animation of ice motion over the last few weeks:

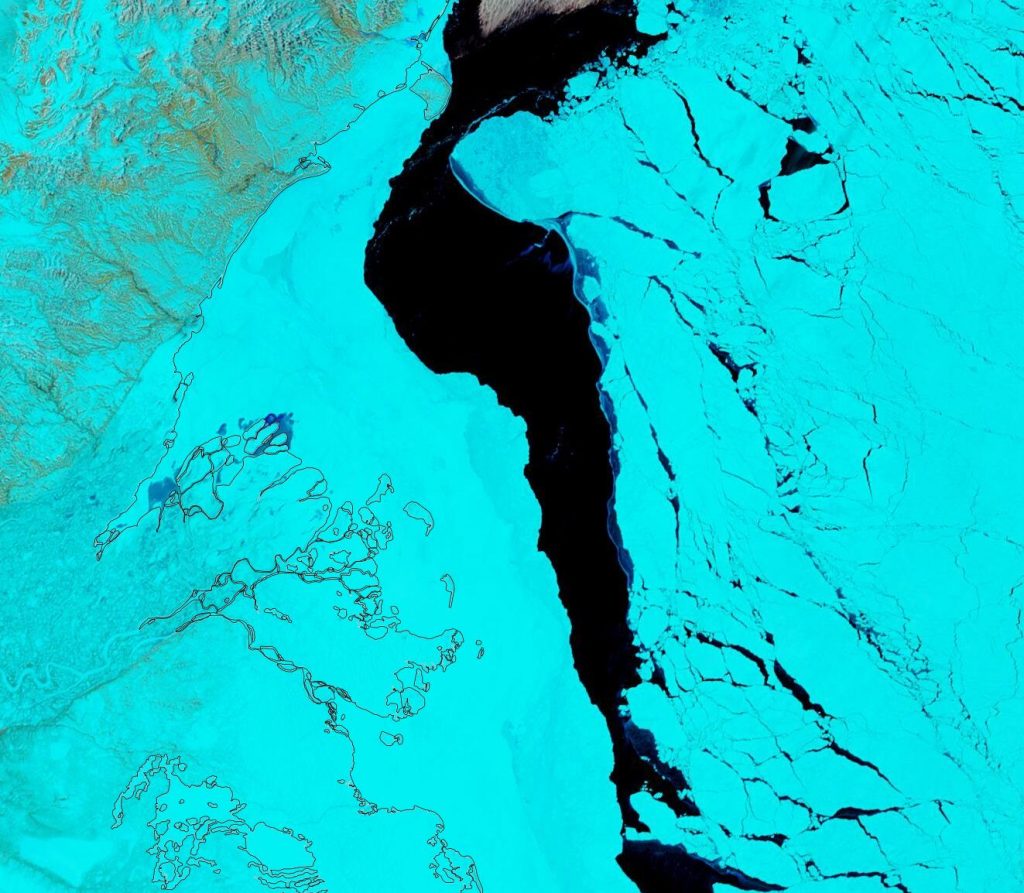
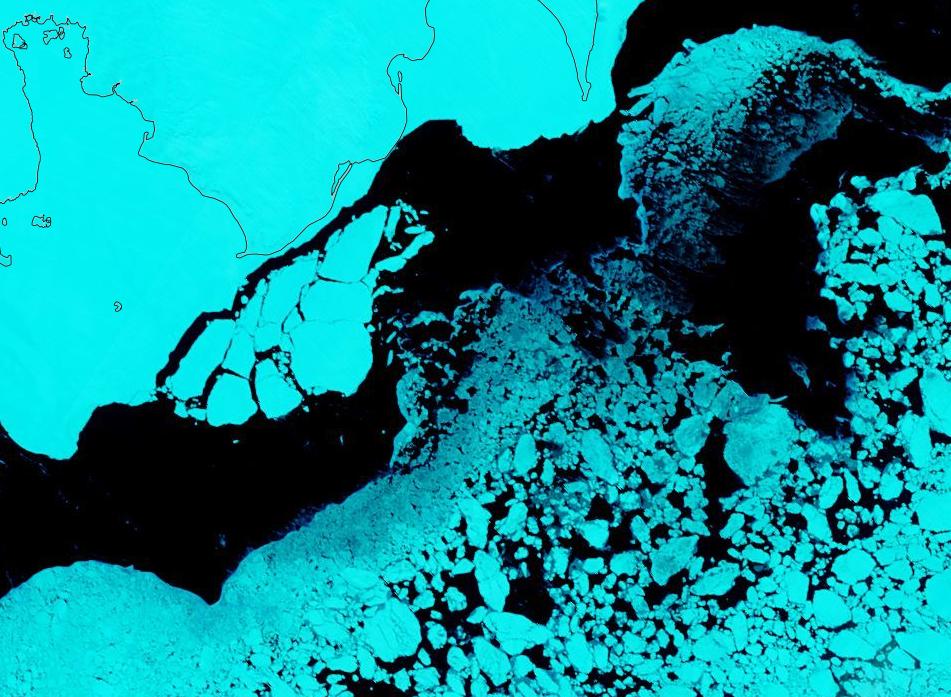
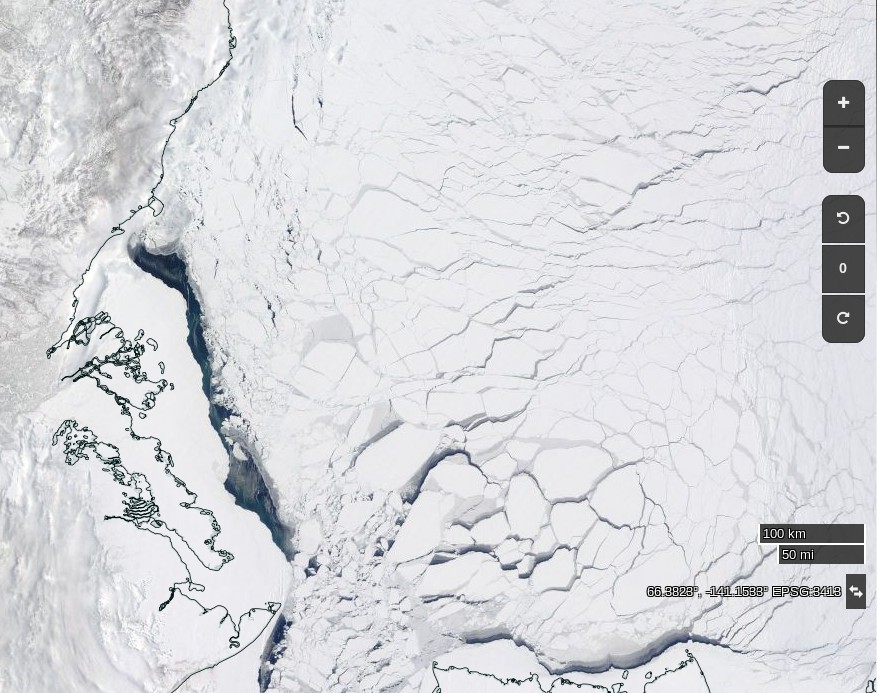
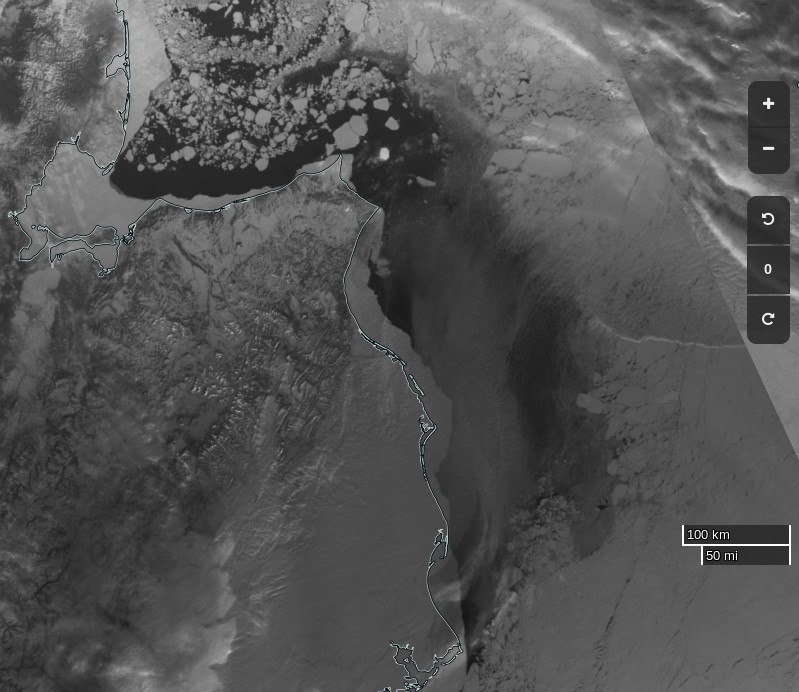
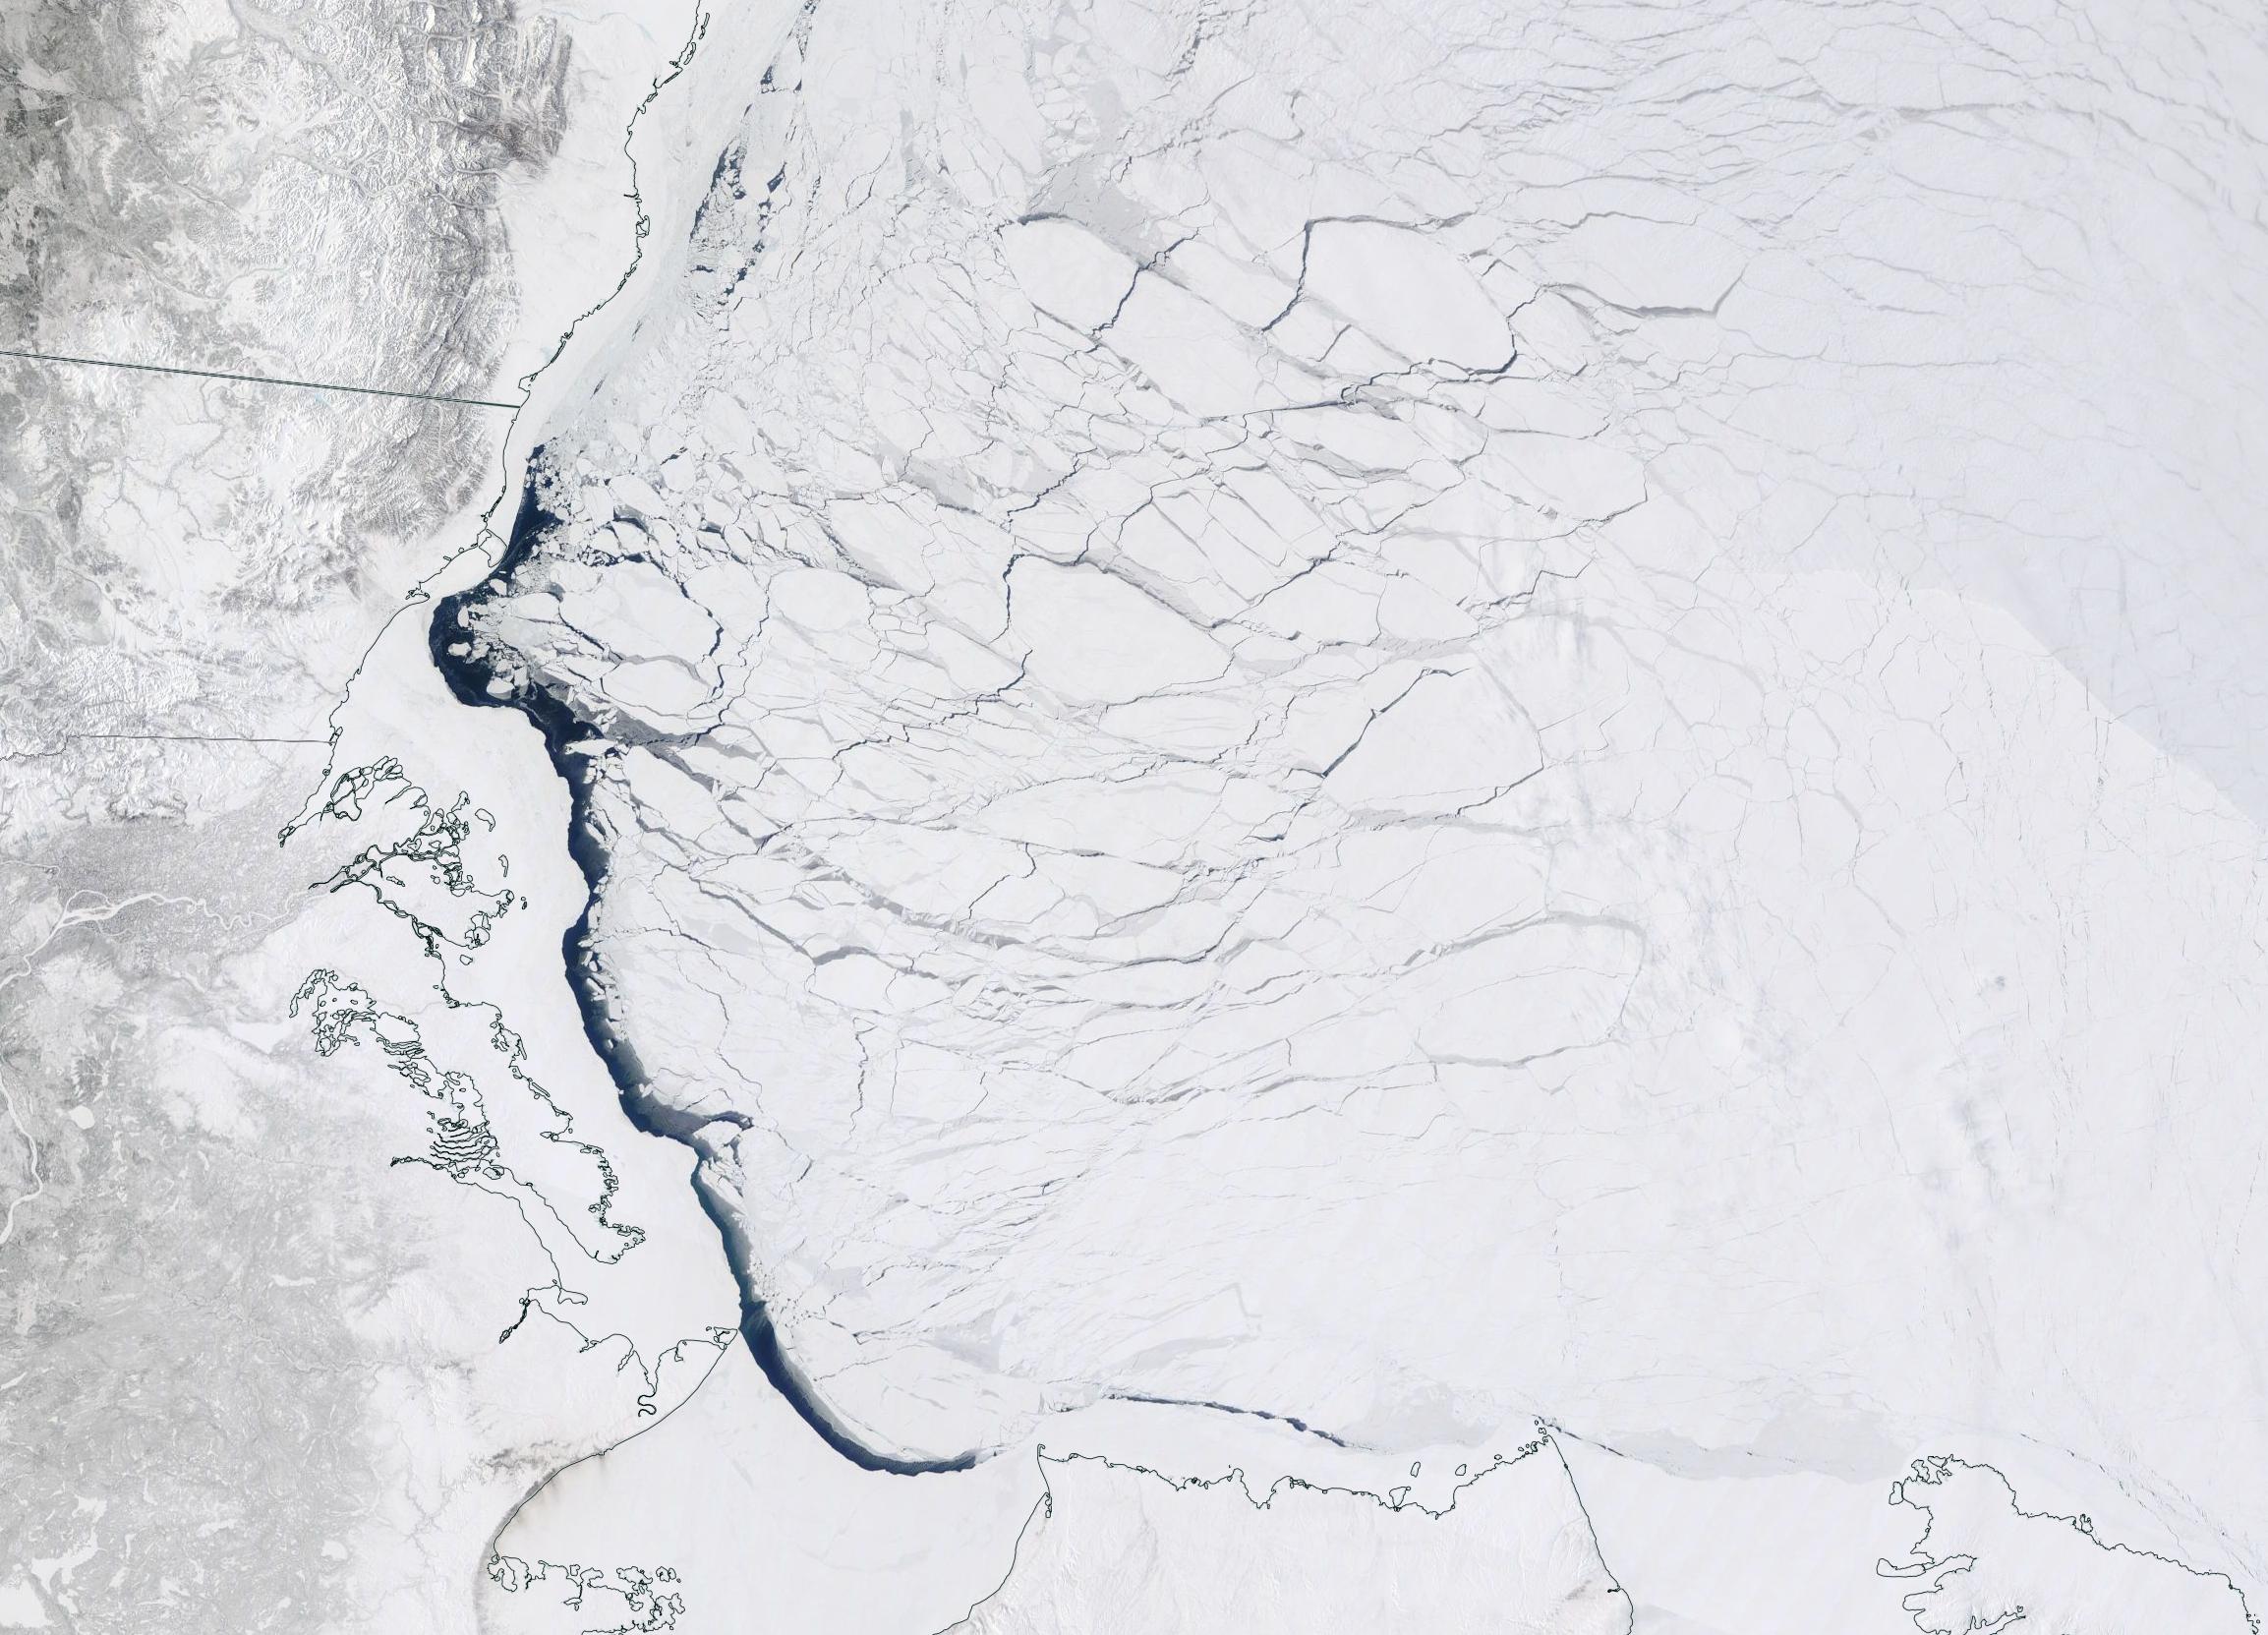
The obvious point to note at the moment is that there are currently long flaw leads on both the Siberian and Canadian sides of the Arctic Ocean. The animation also reveals episodes of open water in the Beaufort and Chukchi Seas, as well as north of Franz Josef Land and Svalbard.

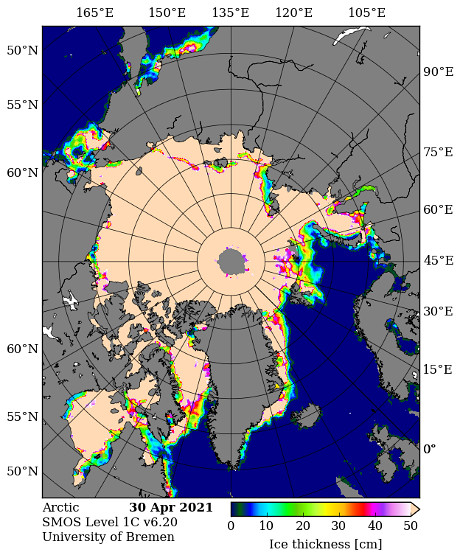
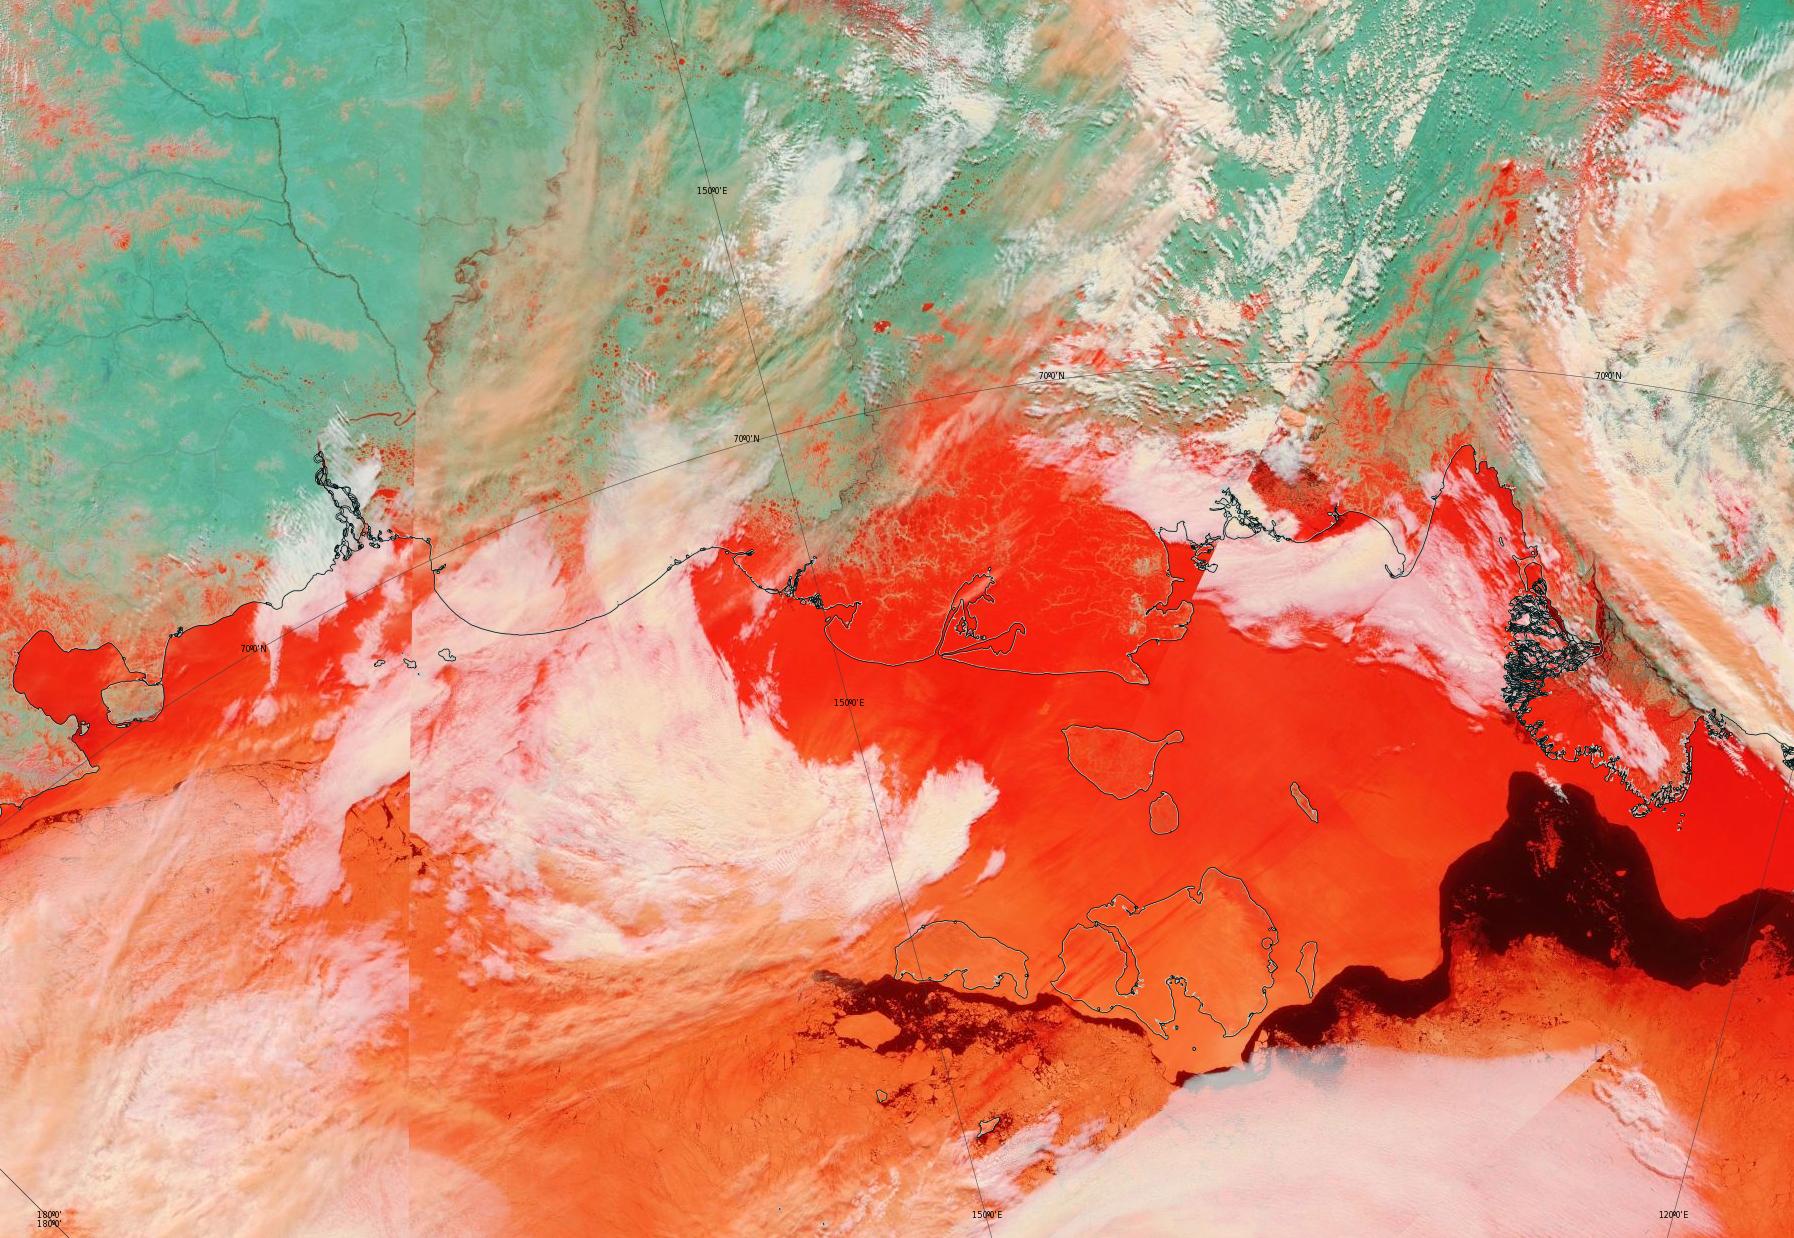
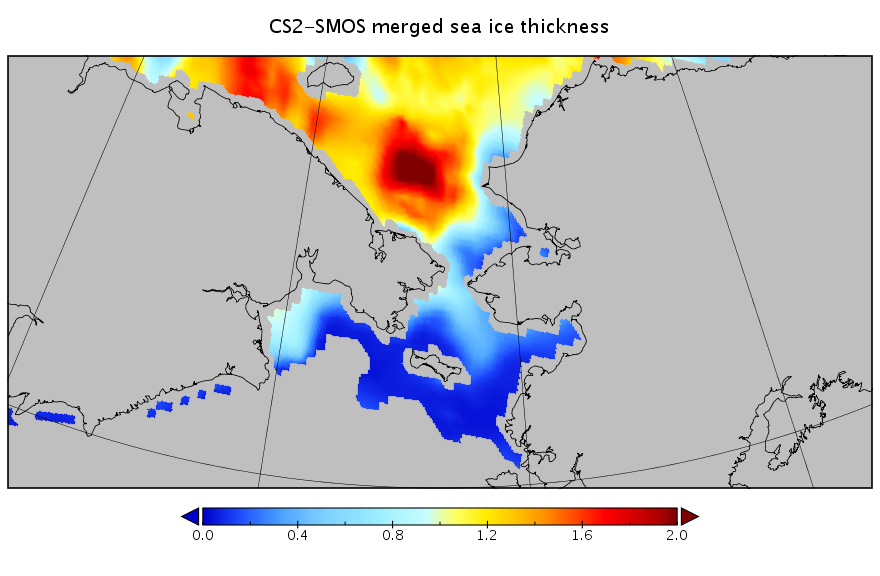
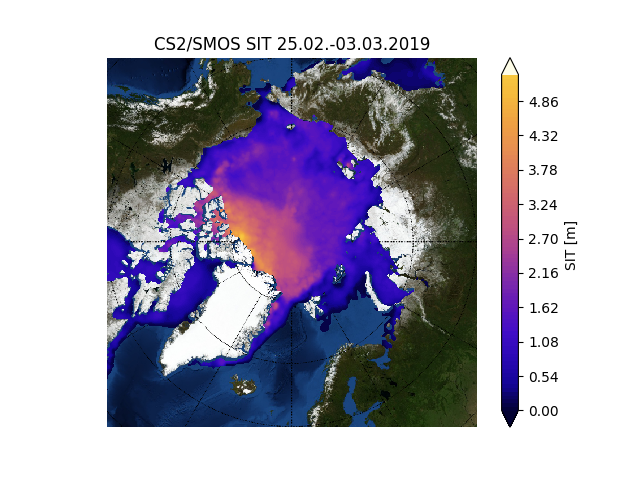
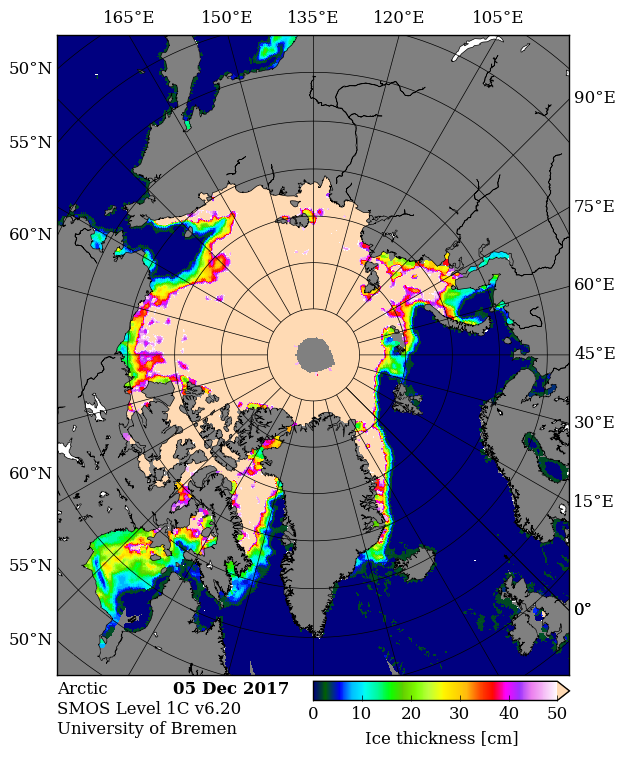
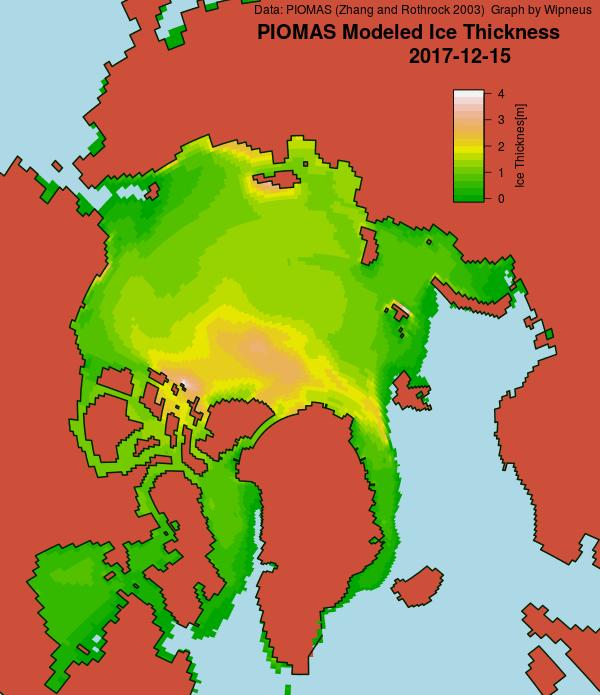
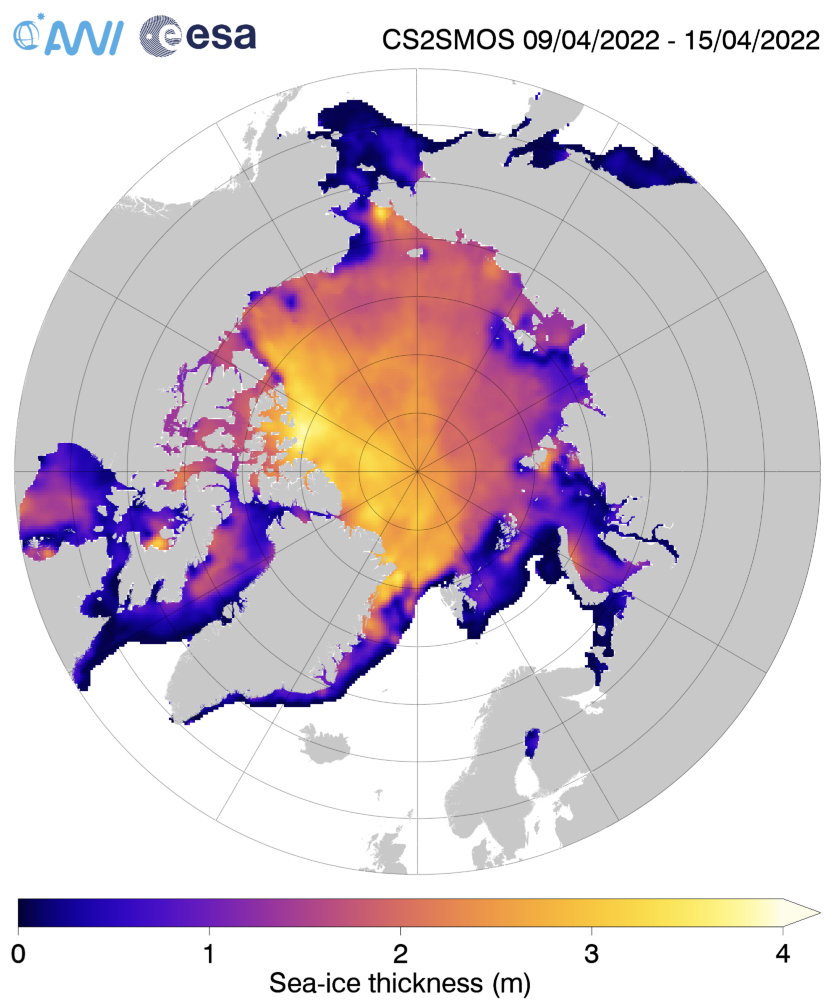
The ice in those areas is still very thin on the latest AWI CryoSat-2/SMOS sea ice thickness map:

[Edit – April 11th]

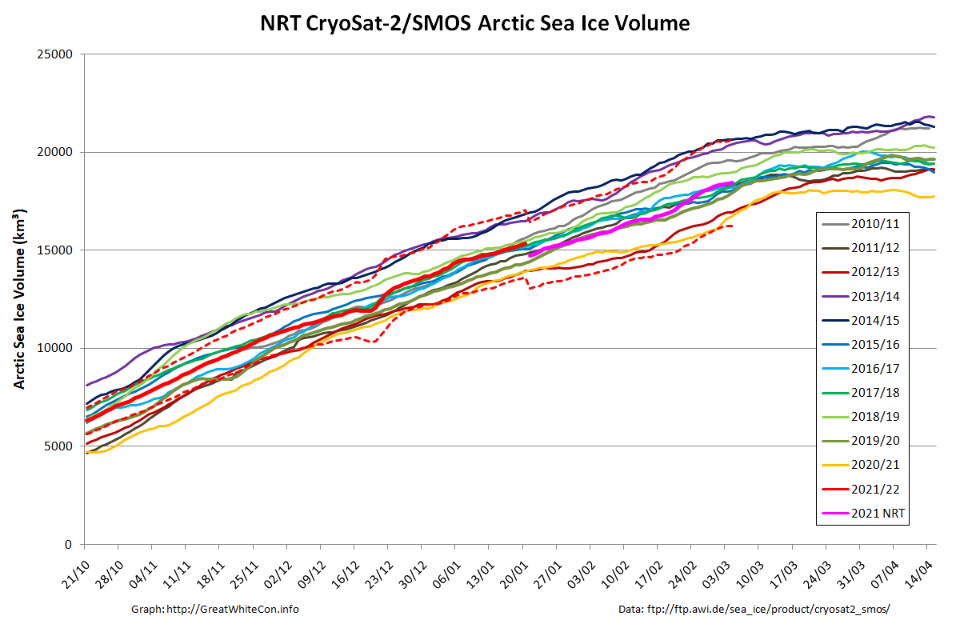
Here too is the latest AWI CryoSat-2/SMOS volume graph:

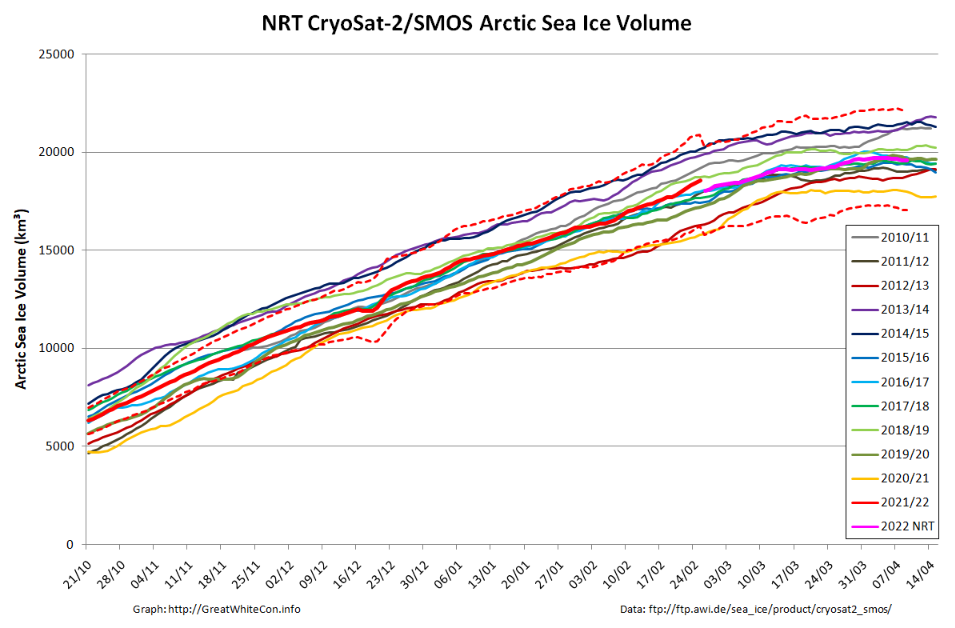
The reanalysed data is now showing something of a surge towards the end of February.

[Edit – April 23rd]

Here’s the last “near real time” AWI CryoSat-2/SMOS Arctic sea ice thickness map for Spring 2022:

The significantly thinner areas in the Beaufort and Chukchi Seas are even more pronounced than previously. Here also is the associated CS2/SMOS volume graph:

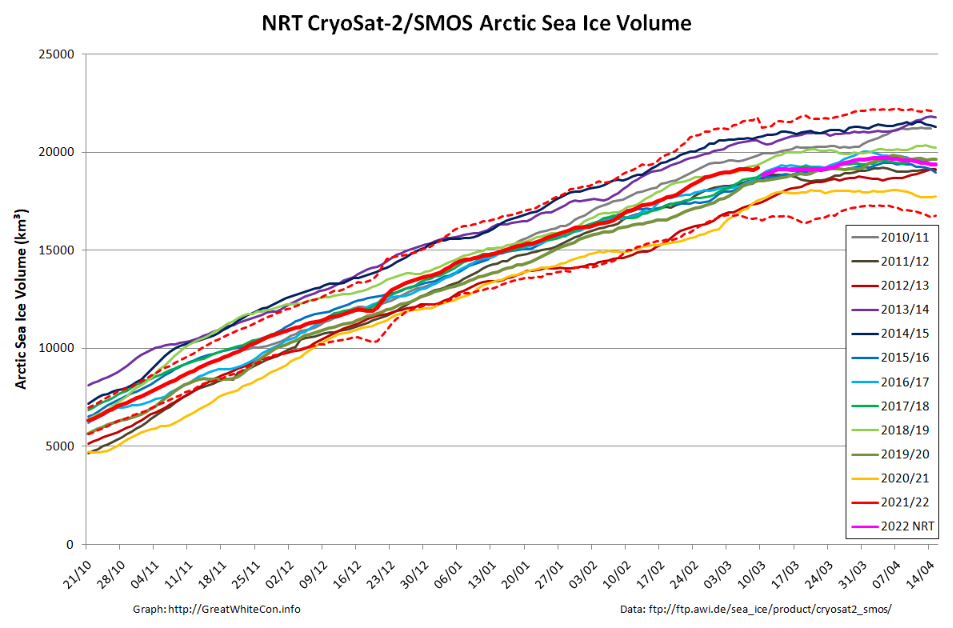
The 2022 maximum volume based on NRT data is 19719 km³ on April 5th. Expect that to be revised upwards when the reanalysed data is ultimately published.

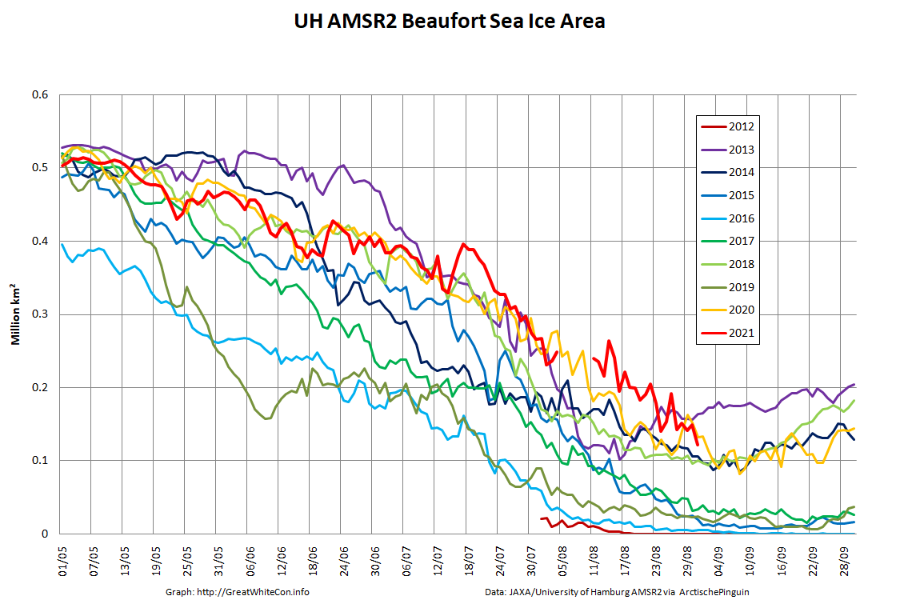
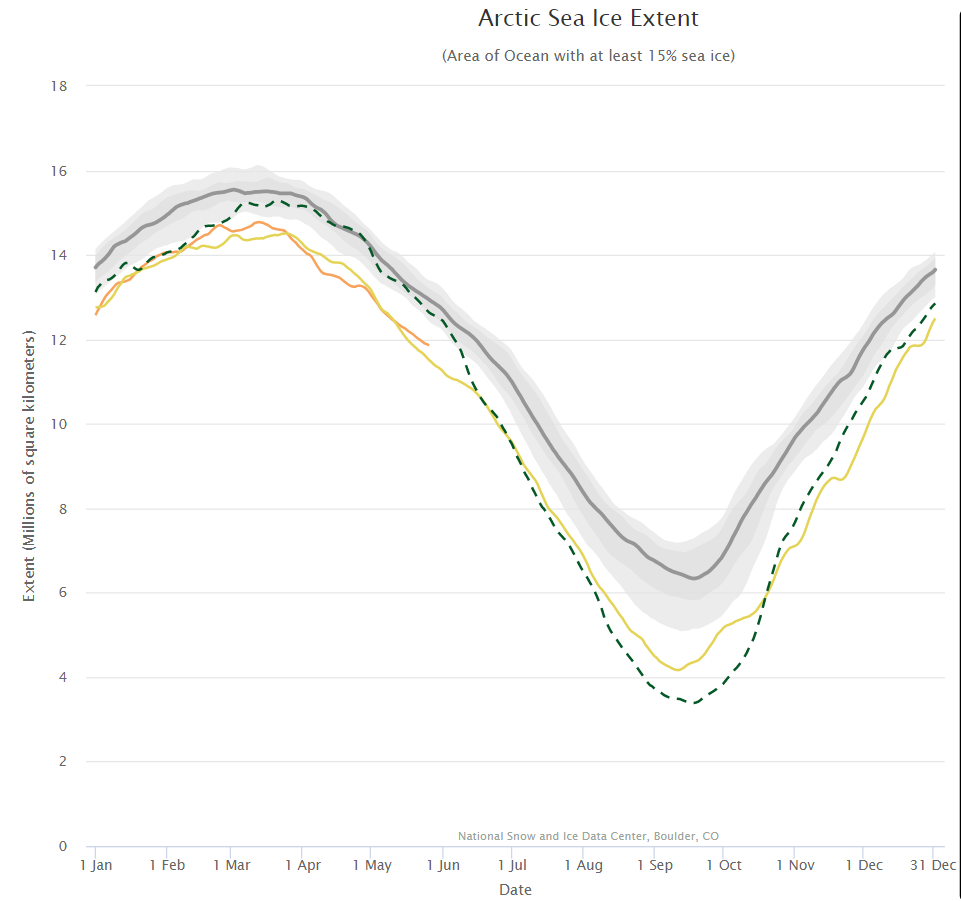
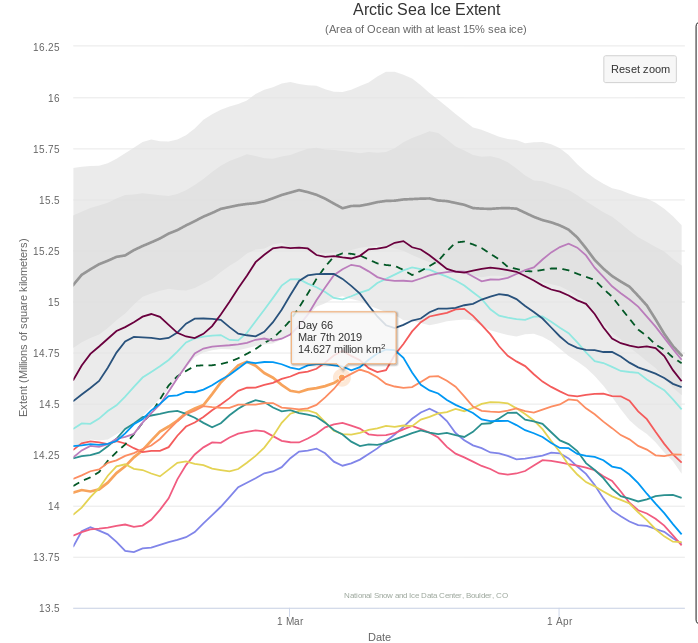
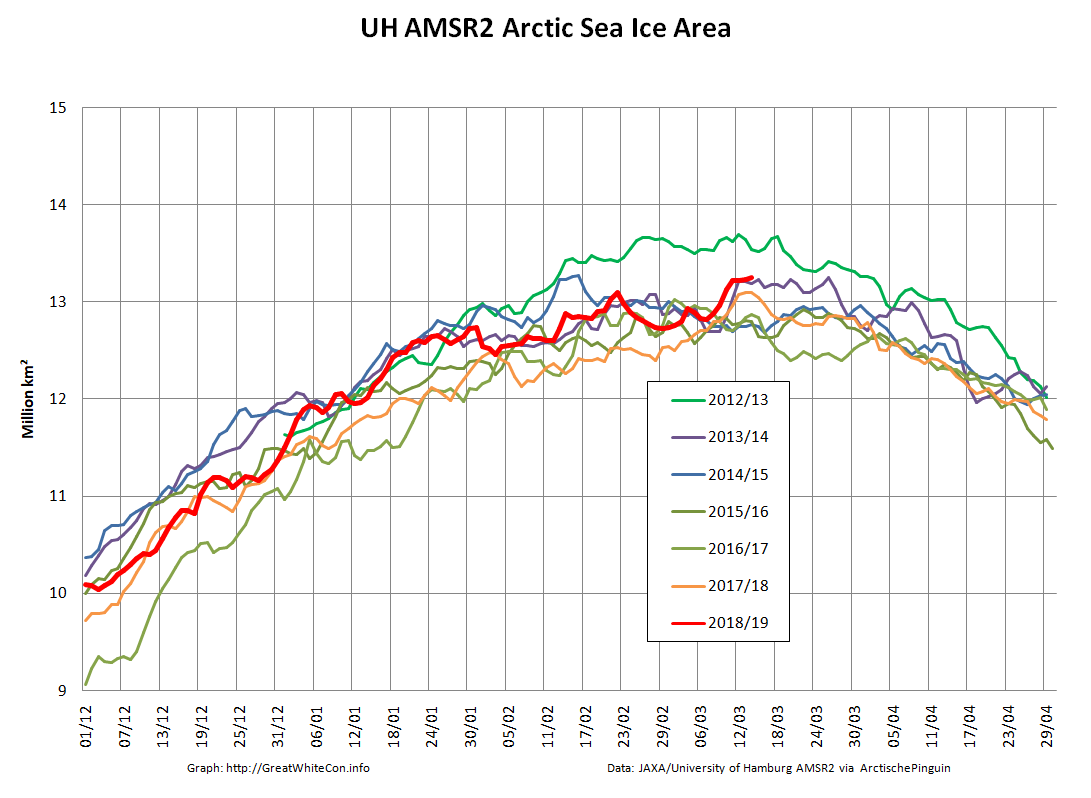
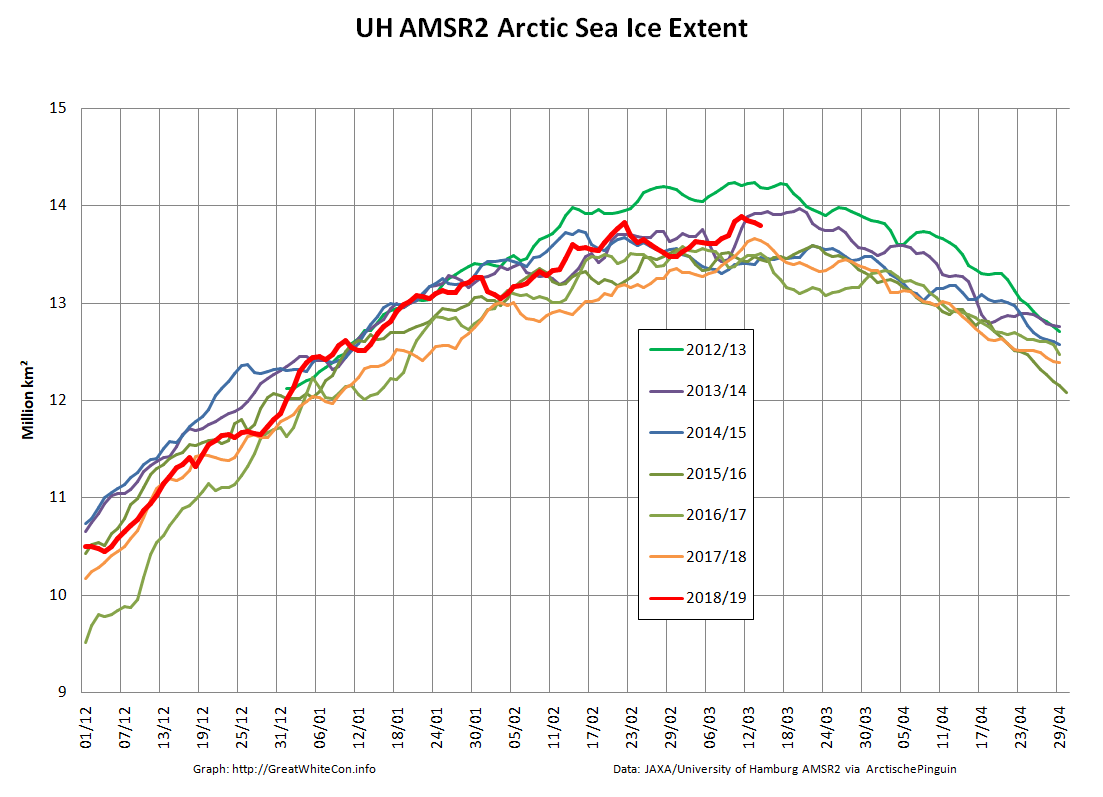
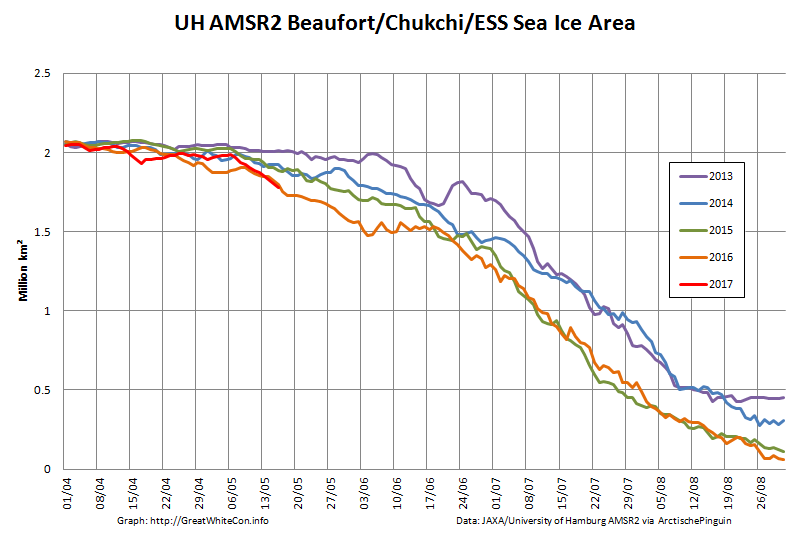
Going back to 2 dimensions, the assorted “ups and downs” now seem to have resolved into the melting season proper:

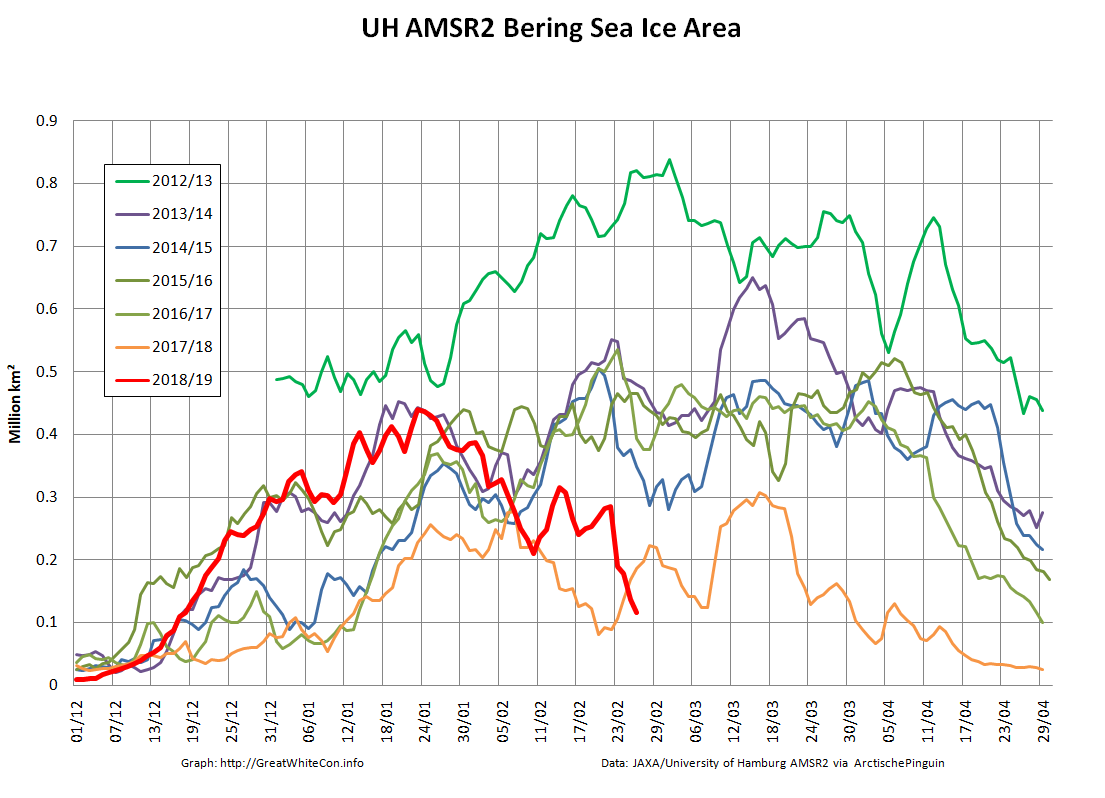
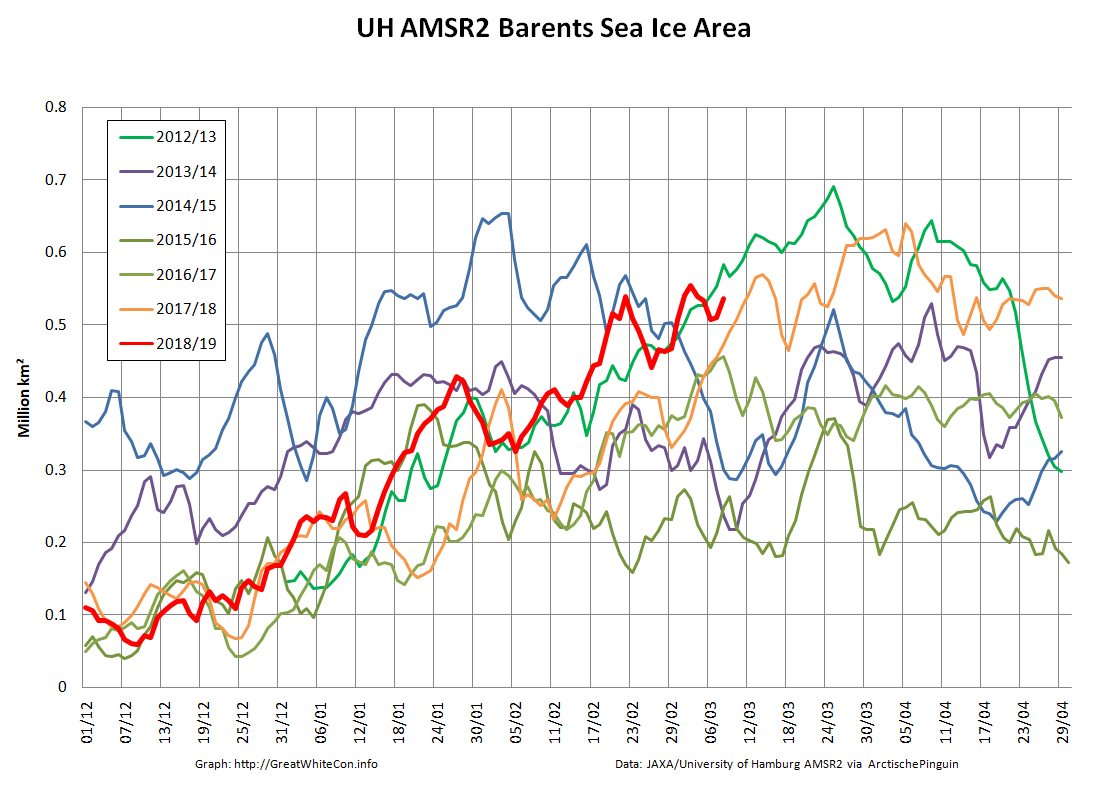
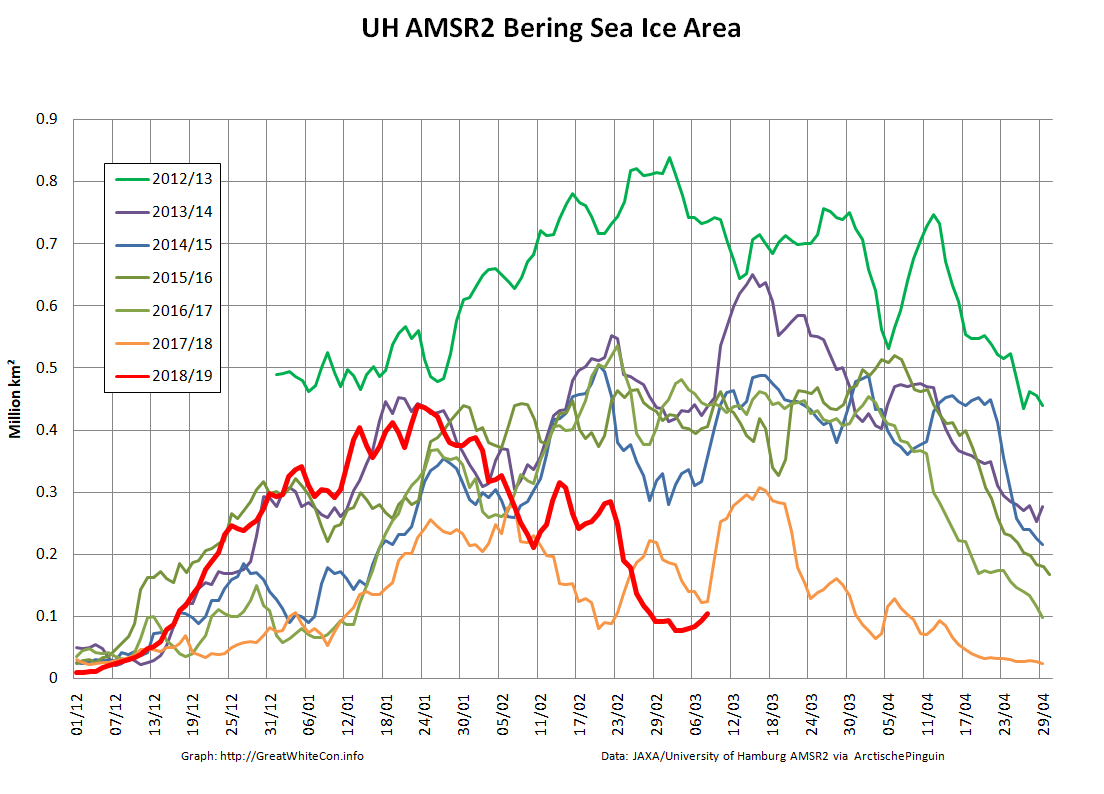
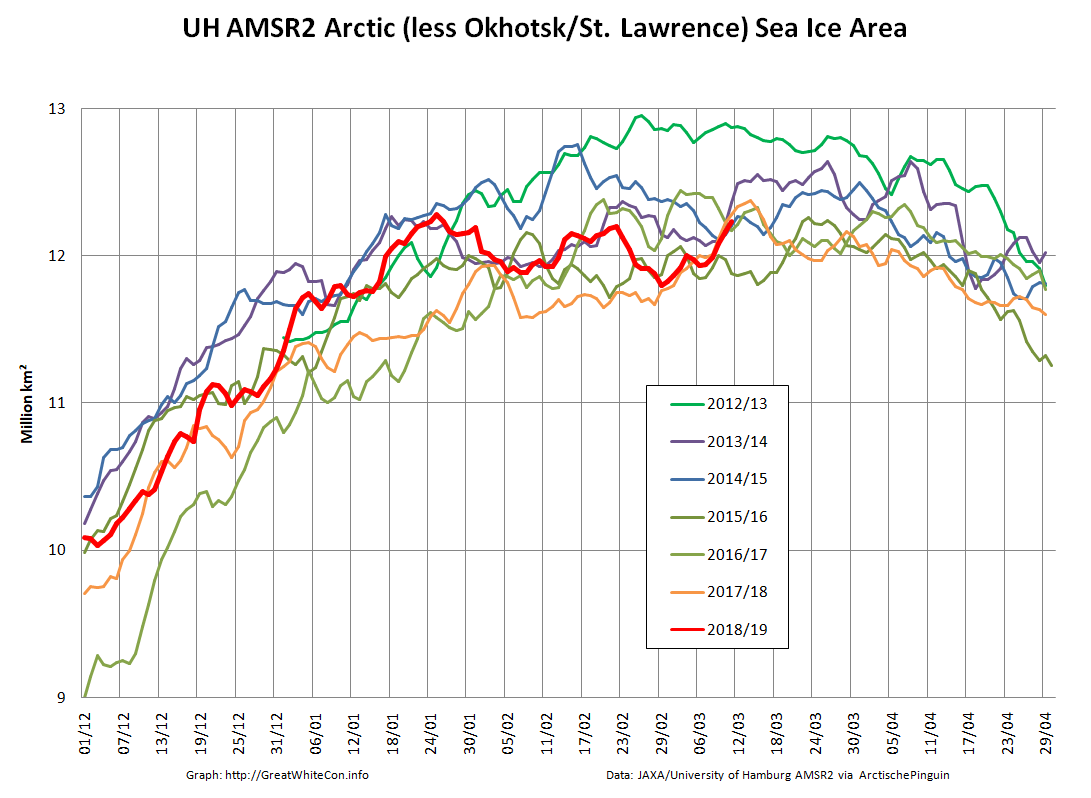
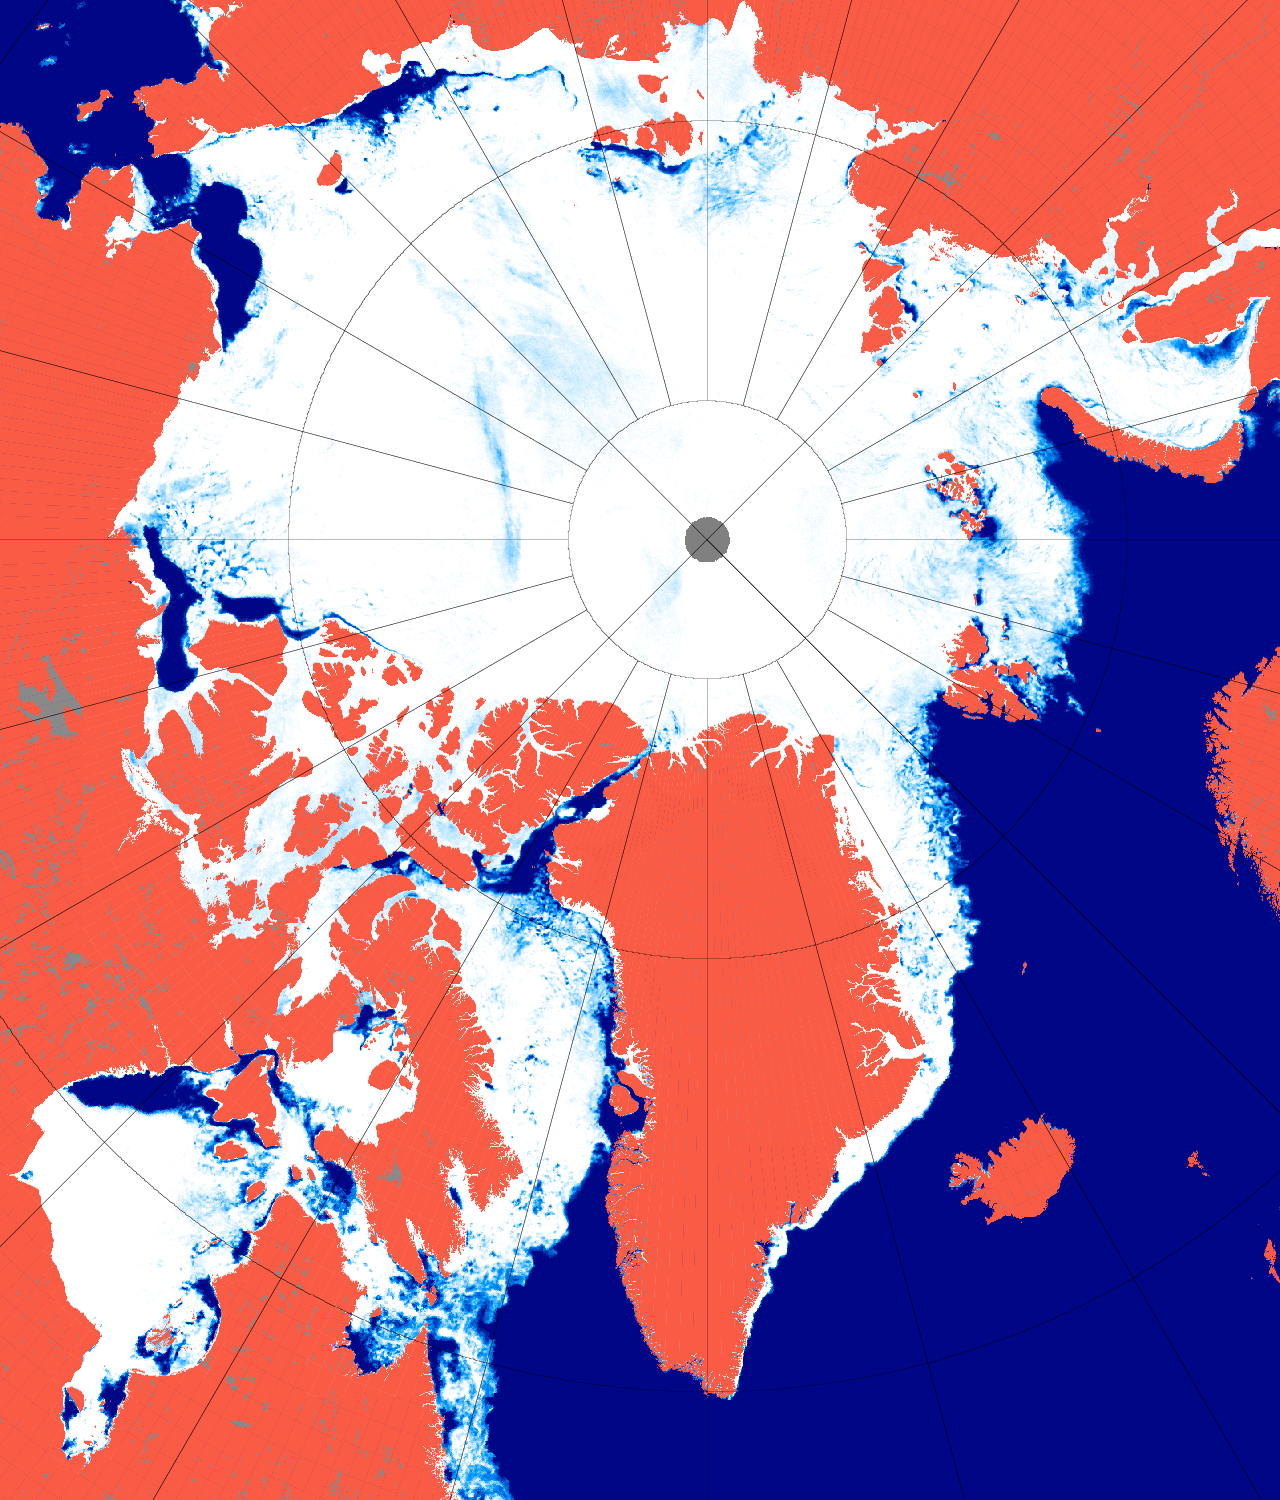
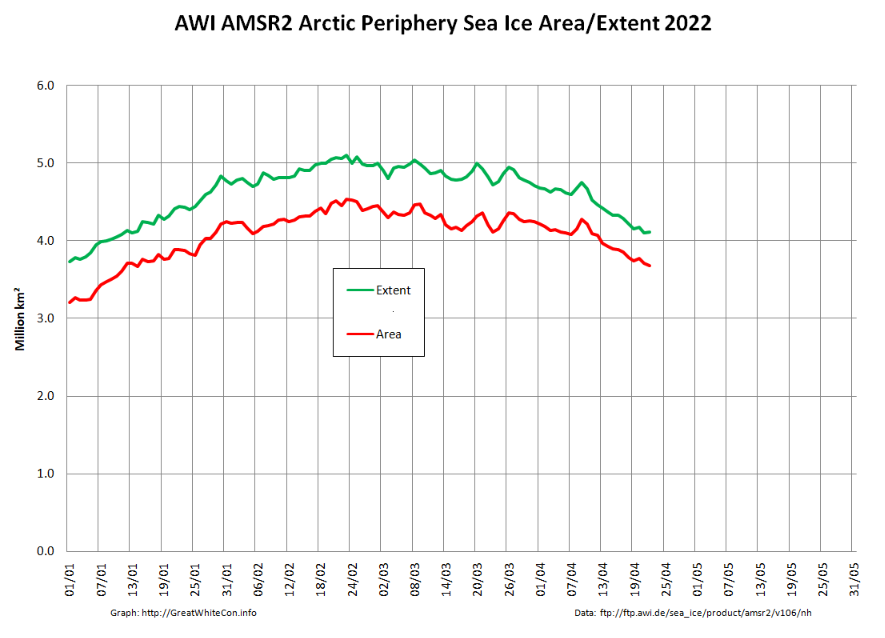
The peripheral sea have been responsible for most of the recent decline:

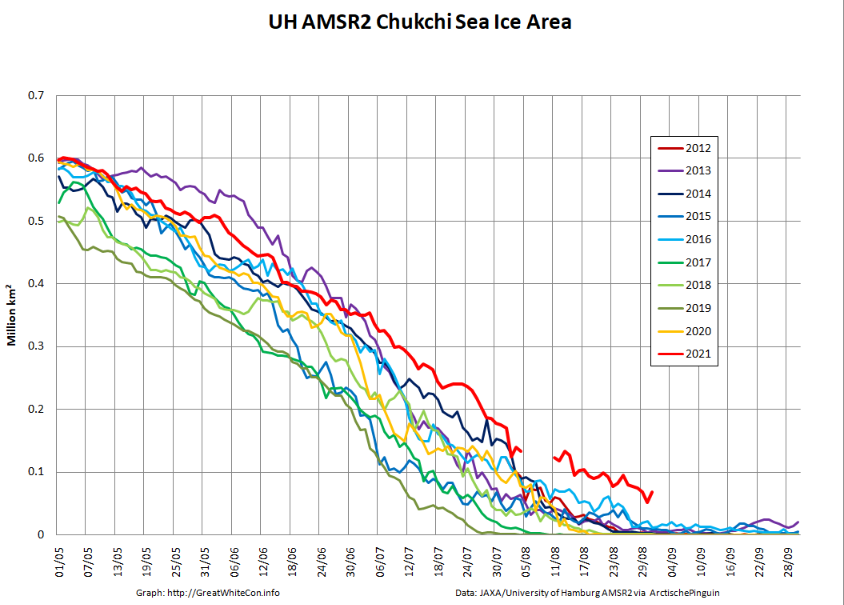
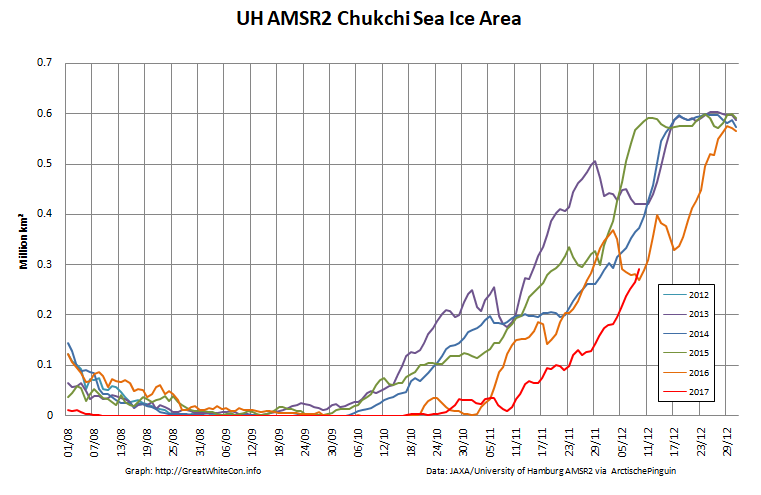
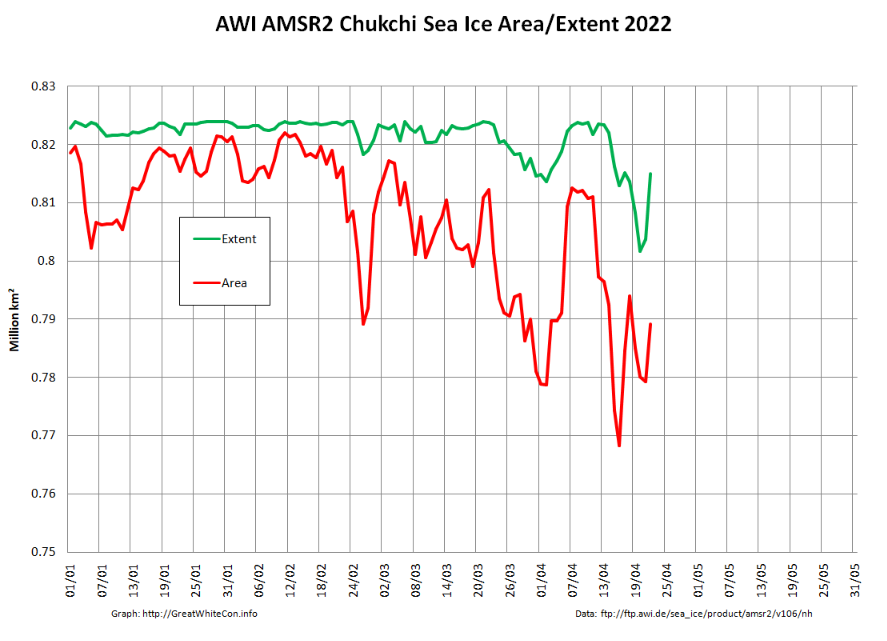
However as mentioned above, the Chukchi Sea has been experiencing some ups and downs of its own. Perhaps the sun is now high enough in the sky for the most recent “down” to stick around for the summer?

“True colour” image of the Chukchi Sea on April 21st from the MODIS instrument on the Terra satellite

[Edit – April 24th]

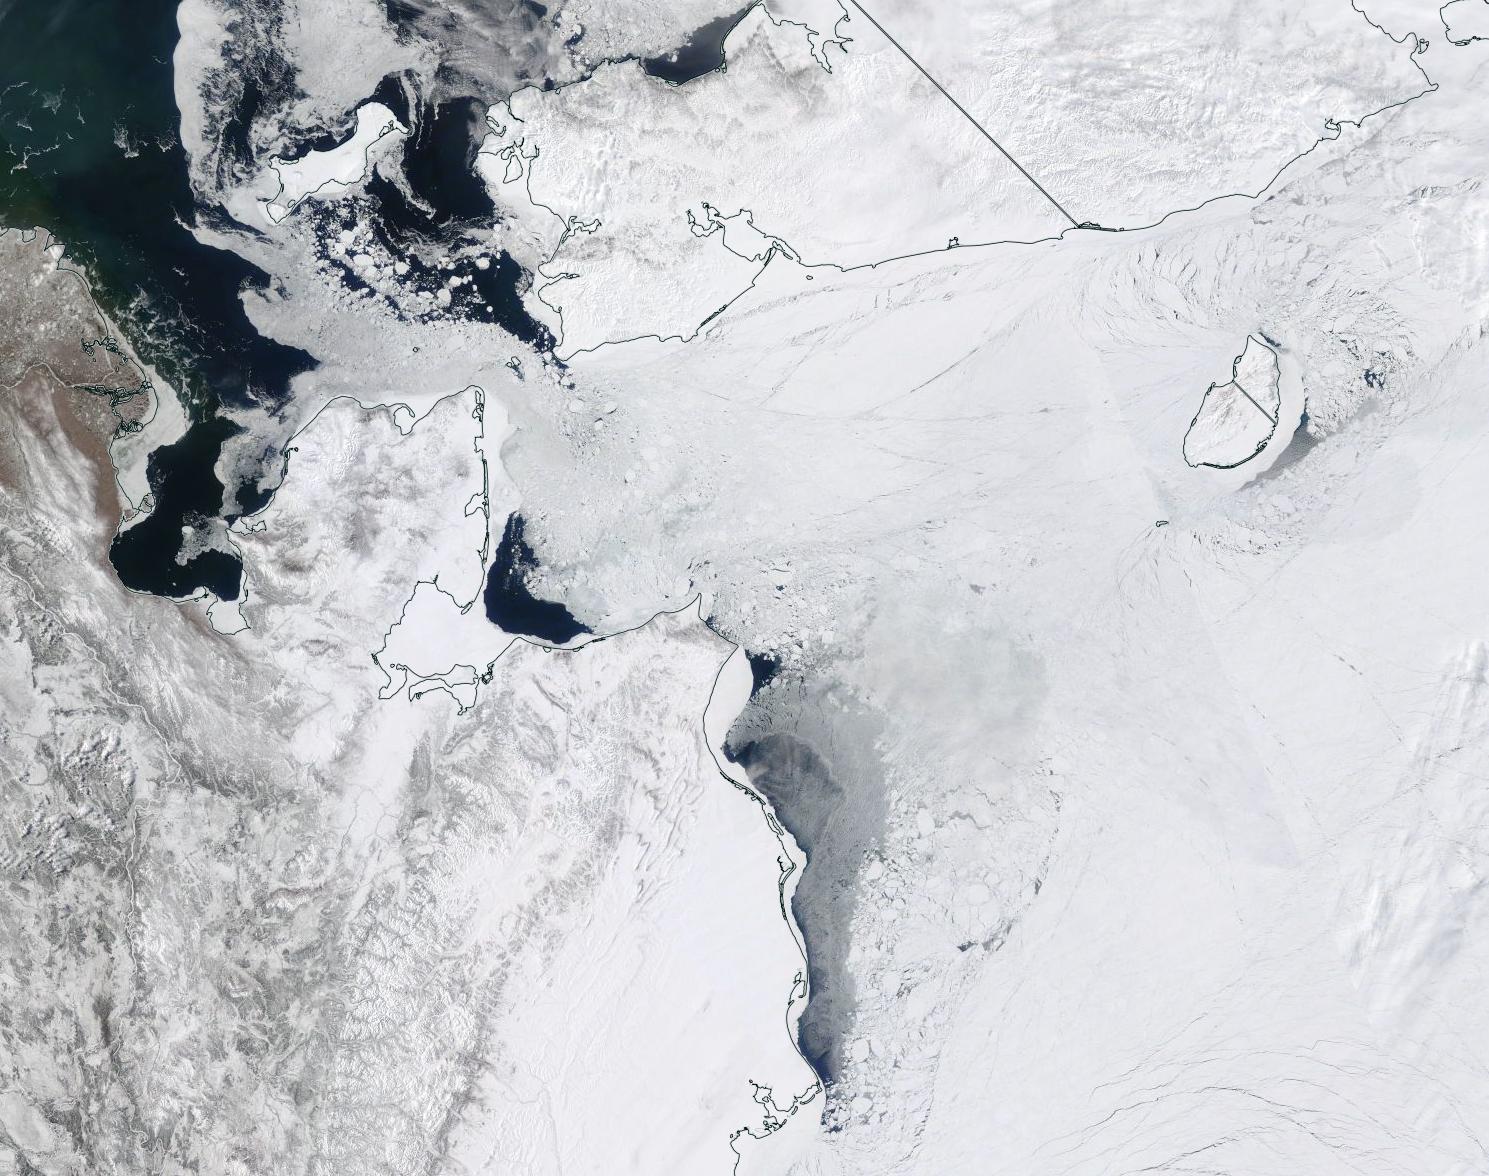
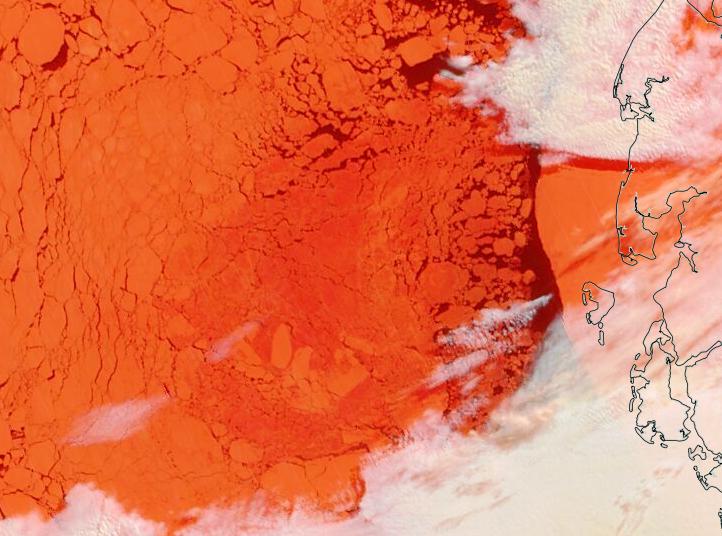
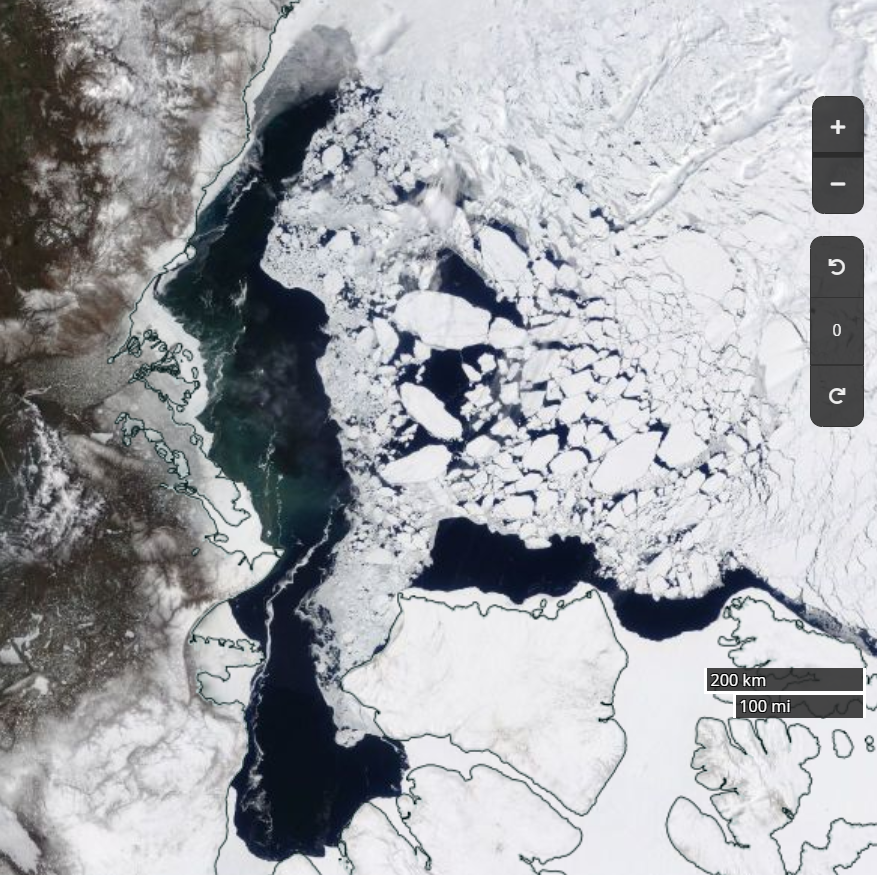
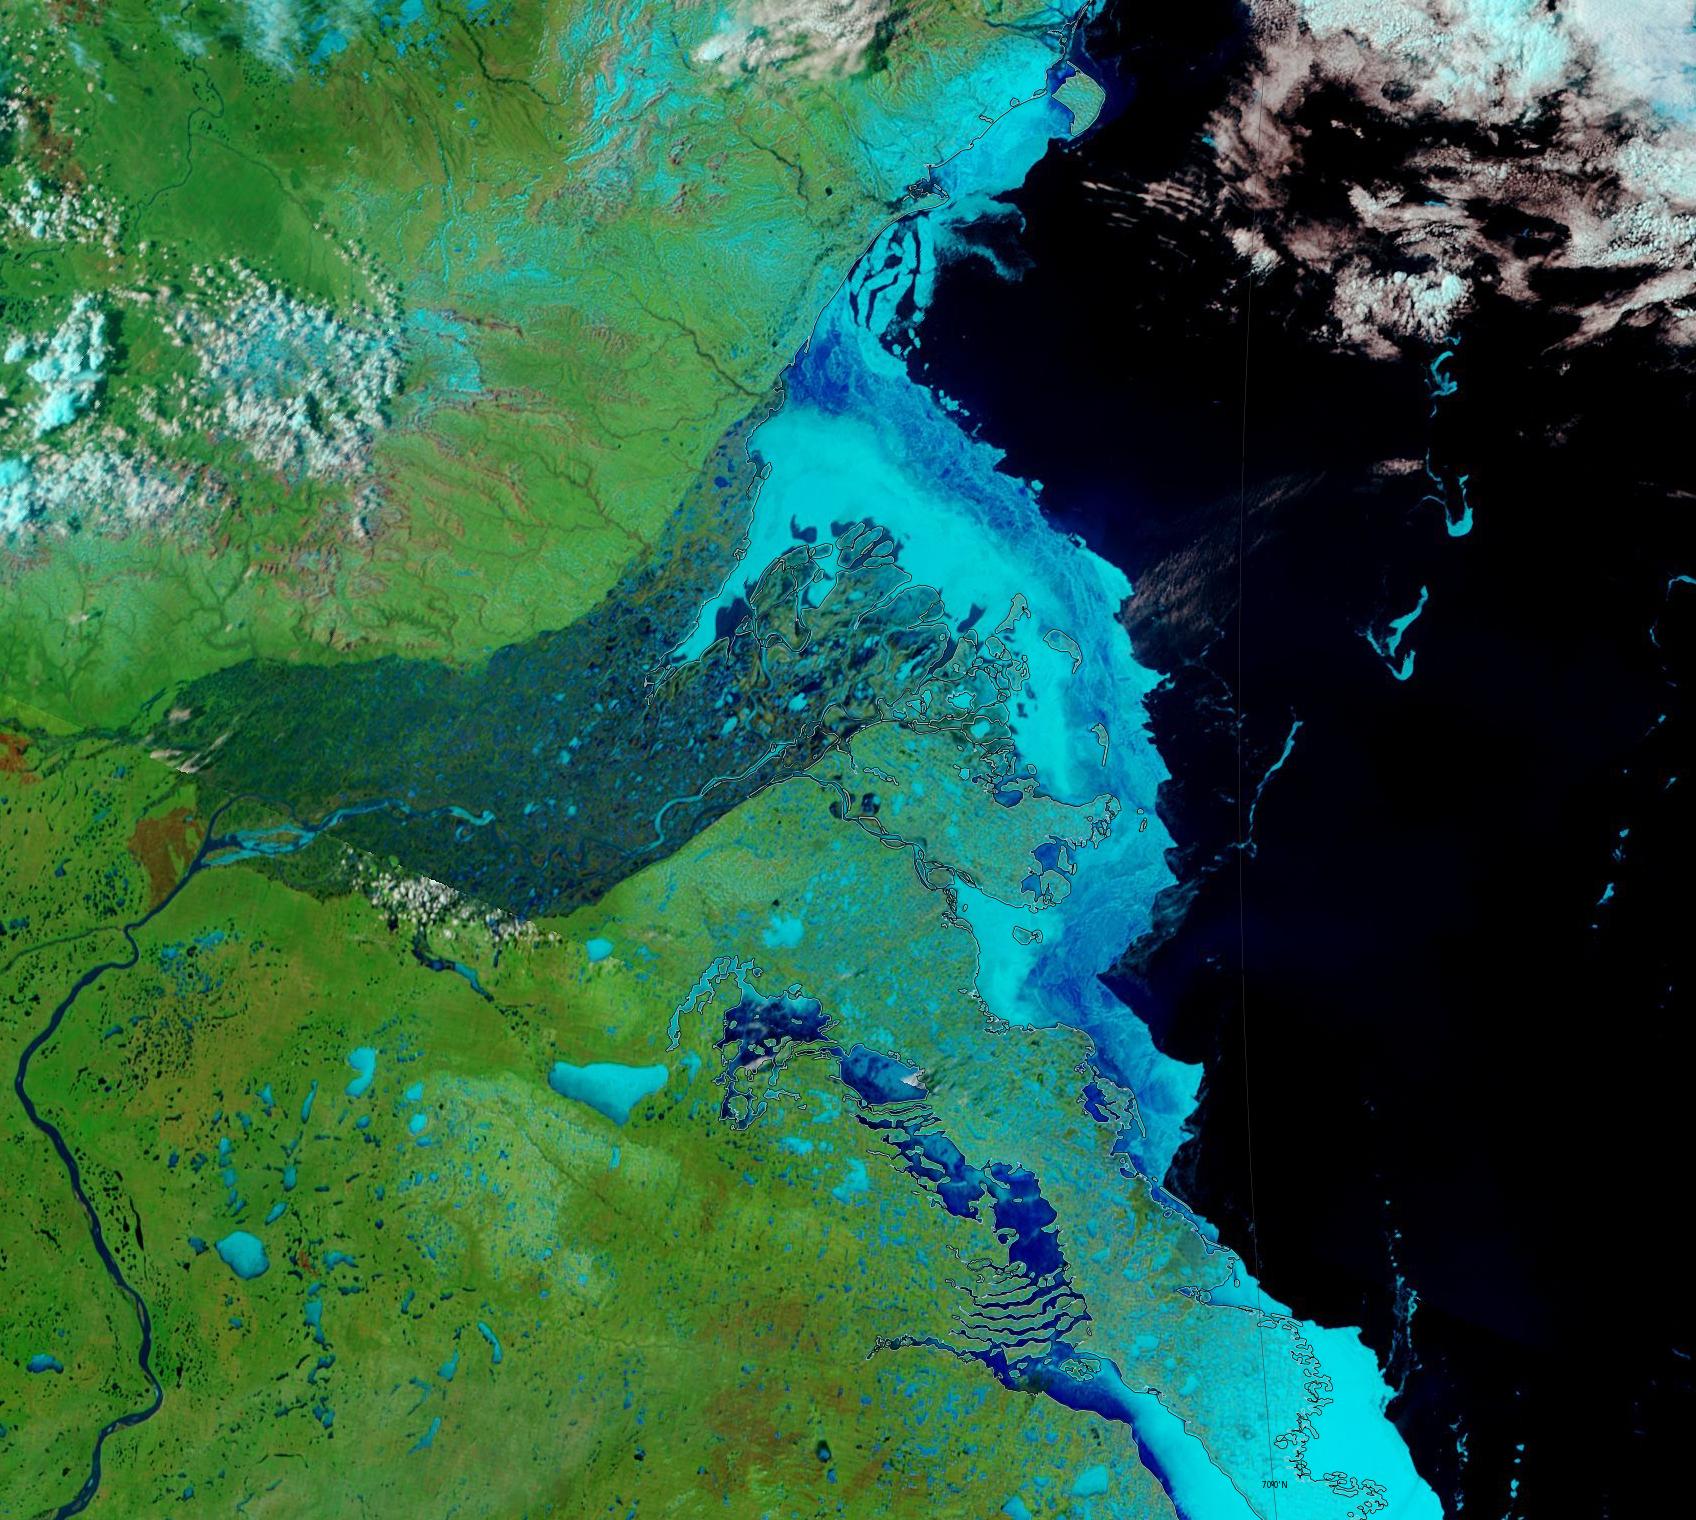
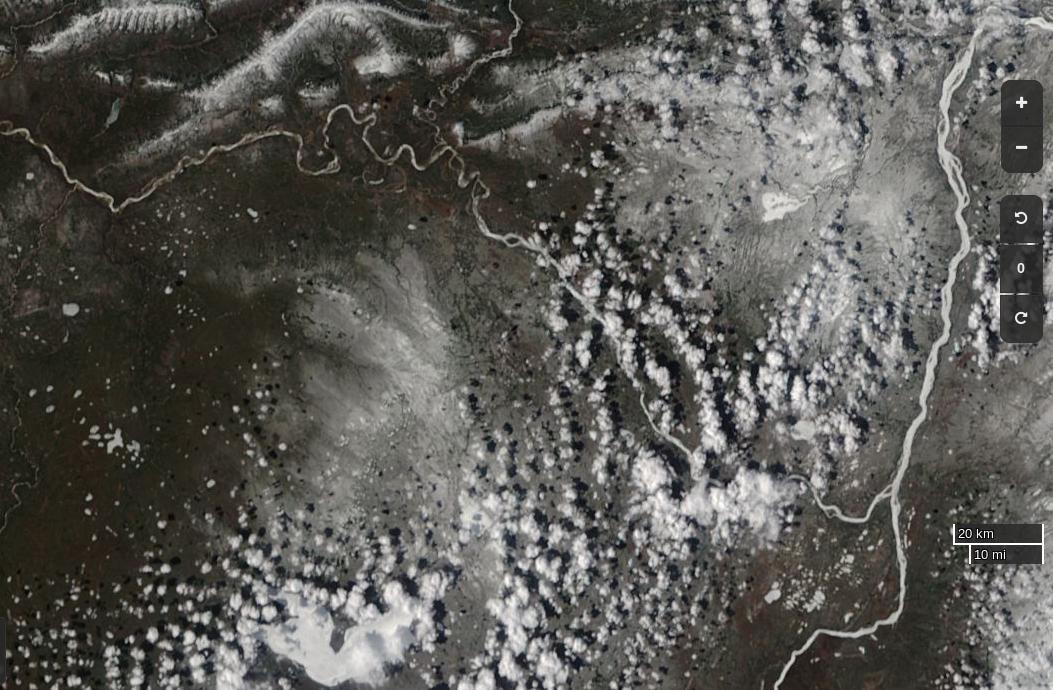
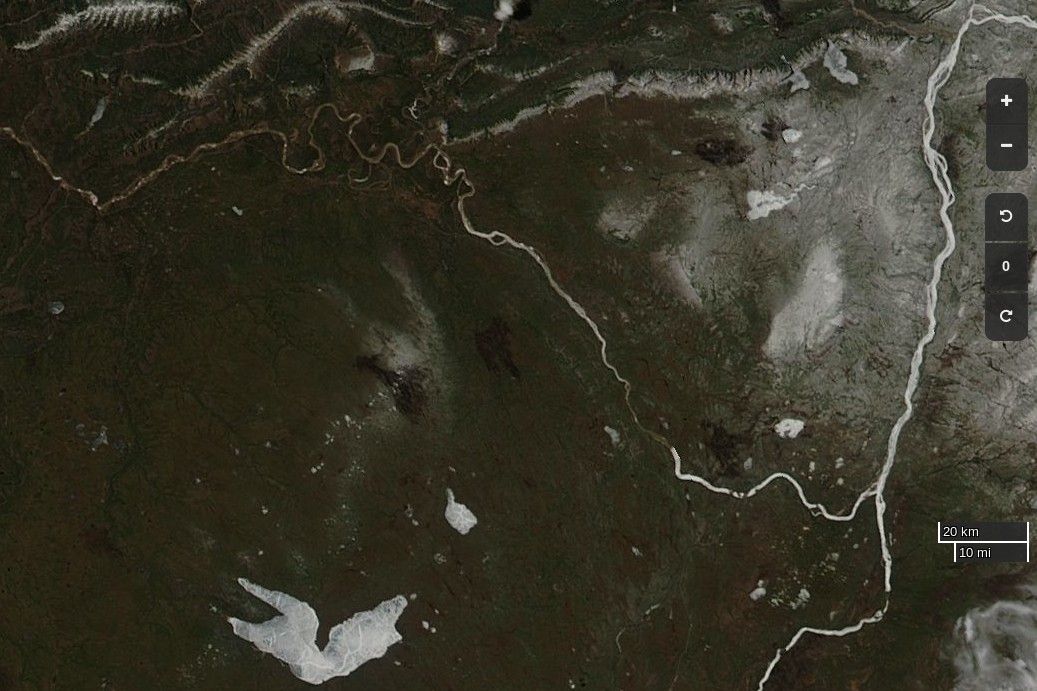
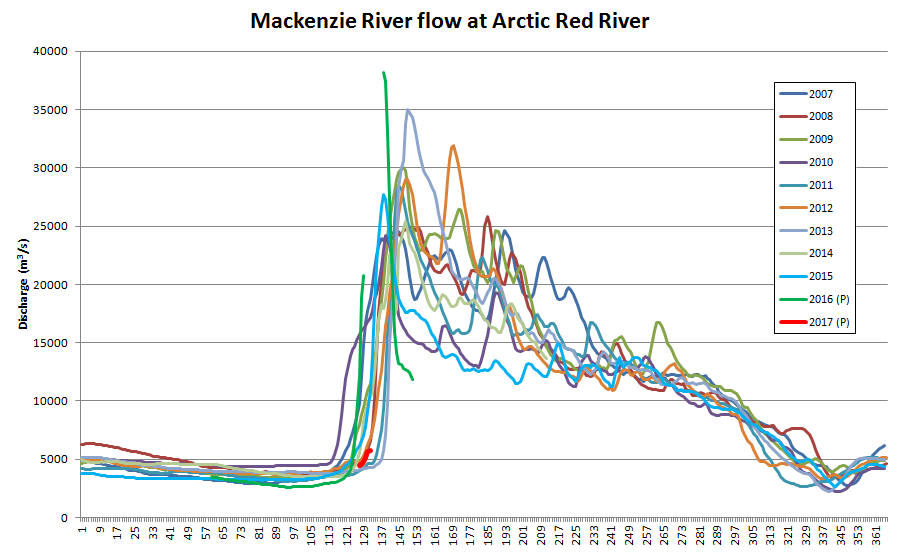
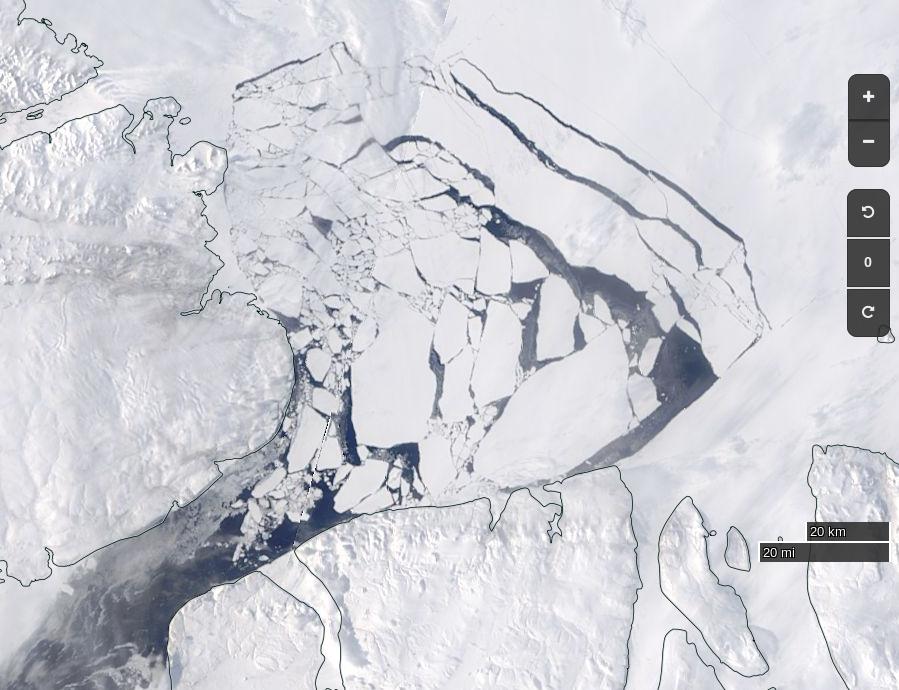
Over the last couple of days some open water has appeared in the Beaufort Sea off the Mackenzie Delta:

“True colour” image of the Beaufort Sea on April 23rd from the MODIS instrument on the Terra satellite

[Edit – April 25th]

Especially for Taylor, here’s the GFS Arctic snow depth forecast for 10 days into the future:

See in particular the Beaufort and Chukchi areas.

Please also see the new open thread for May 2022

Facts About the Arctic in March 2022

For detailed analysis of Arctic sea ice extent over the next few weeks please see the 2022 maximum extent thread. However to get the new open thread going here is the current JAXA/ViSHOP extent graph:

It’s looking more and more as though the real maximum for 2022 occurred close the false peak on February 23rd.

Arctic sea ice volume will keep increasing for a while longer. Here is the current AWI CryoSat-2/SMOS volume graph:

The recent “flat line” in extent is in part due to recent events on the Pacific periphery of the Arctic. Take a look at this animation of AMSR2 sea ice concentration:

The gap varies depending on how the wind blows, but there is still evidence of open water (or very thin ice) along the shore of the Beaufort and Chukchi Seas. Here’s the Mackenzie Delta and the adjacent Beaufort Sea on March 5th:

Continue reading Facts About the Arctic in March 2022

Facts About the Arctic in September 2021

A detailed dissection of the 2021 minimum of various Arctic sea ice extent metrics can be found on a dedicated thread. All other Arctic news in September will be found below.

Let’s start with a map of sea ice age at the beginning of August:

Firstly notice the absence of 3+ year old ice off the coast of north east Greenland. Also visible is a band of 4+ year old ice across the Pacific side of the Arctic Basin, which has slowed melting in the region and explains the following regional sea ice area graphs:


Next here’s the current AMSR2 concentration map:

There is currently a large area of open water in the Wandel Sea to the north of Greenland. There is also an arm of old ice across the Beaufort and Chukchi Seas which is still clearly visible, but also visible is the recent reduction in sea ice concentration in the region. By way of explanation, here’s another look at the thickness of an ice floe currently situated to the north of the Chukchi at 74.84 N, 164.29 W, as measured by an ice mass balance buoy:

As the 2021 melting season draws towards its conclusion the floe is experiencing rapid bottom melt. How much longer will this floe and others like it last? Will it survive to become an “old ice” dot on next year’s ice age maps?

[Edit – September 6th]

As Wipneus puts it on the Arctic Sea Ice Forum, “PIOMAS has updated the gridded thickness data up to the 31st of August”. Here’s the latest modelled thickness map, which shows the thickest remaining ice located north of the Canadian Arctic Archipelago rather than north of Greenland:

The accompanying volume graph shows 2021 in 7th lowest position, at 4.7 thousand km3:

Here too are the current PIOMAS volume trends for each month of the year:

The Swedish icebreaker Oden has recently been exploring the area between northern Greenland and the North Pole as part of the Synoptic Arctic Survey expedition:

Here are the measurements of water temperature it has recorded over the past few days:

Ranging between -0.4 °C and -1.0 °C it doesn’t look as though the 2021 refreeze will be starting in the Wandel Sea just yet.

[Edit – September 10th]

A picture of the sea ice at the North Pole from Ponant’s Le Commandant Charcot on September 6th:

[Edit – September 13th]

Here’s the latest NSIDC sea ice age map:

That shows plenty of old ice still left in the Beaufort Sea. However ice mass balance buoy 52460 now appears to floating free of its ice floe at 75.56 N, 165.99 W:

[Edit – September 14th]

“New ice” has started to appear in previously open water on the Canadian Ice Service charts. See area E south east of Resolute:

[Edit – September 21st]

In answer to Frozen Earth’s metaphorical prayer, Wipneus has just released the mid September PIOMAS gridded thickness numbers on the Arctic Sea Ice Forum. First of all the thickness map:

followed by the volume graph:

and the monthly volume trends:

Volume calculated from the thickness data currently show that 2021’s minimum was reached on September 7th at 4.64 thousand km3, which is the 8th lowest value in the Polar Science Center’s record.

[Edit – September 23rd]

NASA have just announced a new paper about clouds in the Arctic. Highly relevant given their recent overview of the 2021 melting season!

Clouds are one of the biggest wildcards in predictions of how much and how fast the Arctic will continue to warm in the future. Depending on the time of the year and the changing environment in which they form and exist, clouds can both act to warm and cool the surface below them.

For decades, scientists have assumed that losses in Arctic sea ice cover allow for the formation of more clouds near the ocean’s surface. Now, new NASA research shows that by releasing heat and moisture through a large hole in sea ice known as a polynya, the exposed ocean fuels the formation of more clouds that trap heat in the atmosphere and hinder the refreezing of new sea ice.

The findings come from a study over a section of northern Baffin Bay between Greenland and Canada known as the North Water Polynya. The research is among the first to probe the interactions between the polynya and clouds with active sensors on satellites, which allowed scientists to analyze clouds vertically at lower and higher levels in the atmosphere.

The approach allowed scientists to more accurately spot how cloud formation changed near the ocean’s surface over the polynya and the surrounding sea ice.

Watch this space!

The 2021 Arctic Sea Ice Minimum Extent

The results of the ARCUS Sea Ice Prediction Network August call have been released, and here is the outlook for the 2021 minimum September mean Arctic sea ice extent:

The median prediction for the mean sea ice extent during the month of September 2021 is 4.39 million km2. According to ARCUS:

As of 22 August 2021, the Arctic sea-ice extent was 5.58 (compared with 25 August 2020 value of 4.43) million square kilometers. Arctic sea-ice extent in 2021 remains well below the climatological median and has closely followed the 2012 values for much of the summer but has diverged to higher sea-ice extent starting in early August. The forecasts continue to support September 2021 mean sea-ice extent being well above the September 2020 value. July sea-ice retreat has been greatest in the Eurasian seas, particularly in the East Siberian Sea, making the 2021 ice edge well north of the long-term median edge in Eurasia. Sea ice retreated since the end of July along the northern coast of Alaska, although the ice edge is near its climatological position, which makes the Beaufort and Chukchi sea ice extent the largest at this time of year since 2006. A tongue of sea ice that has been present all summer continues to extend close to land in the Kara Sea, making the northeast passage likely to remain blocked for the first time in several years. Half the models which provide spatial data to the SIO predict that the tongue is likely to survive.

Now let’s take a look at a range of assorted extent measurements. Here’s the NSIDC’s 5 day average extent:

Continue reading The 2021 Arctic Sea Ice Minimum Extent

Facts About the Arctic in May 2021

It’s May Day 2021, and just for a change we’re going to start the month off with a pretty picture!

Parts of the Laptev Sea are starting to look distinctly “warm” in the infra-red. Here’s a “false colour” image taken by the Terra satellite during a gap in the clouds:

We have reached the time of year when the SMOS “thin ice thickness” readings start being affected by surface melt, but let’s take a look anyway:

That area of the Laptev certainly appears to be either thin or melting.

Meanwhile on the Canadian side of the Arctic the fast ice off the Mackenzie Delta is starting to get damp, even though the river itself still looks to be fairly well frozen:

It will also be interesting to follow the progress of this large floe as it heads towards oblivion through the Fram Strait:

Continue reading Facts About the Arctic in May 2021

Melt Pond May 2019

A couple of years ago I was asked to provide “a handful of things [you] will be keeping an eye on over the next few months to judge how ‘good’ or ‘bad’ the melt is going?”

My answer was, and remains:

5 fingers worth to start with? Not necessarily in order of time or importance!

1. How soon melt ponds and/or open water hang around in the Beaufort Sea this year. Things started very early [in 2016]:

https://GreatWhiteCon.info/2016/04/the-beaufort-gyre-goes-into-overdrive/

2. Ditto the Bering Strait and Chukchi Sea

3. Ditto the Laptev and East Siberian Seas

4. How many (and how deep, warm, wet) spring cyclones spin around the Arctic Ocean

5. How the snow melt progresses across Canada, Alaska and Siberia

Applying the same criteria this year, open water is already hanging around in the Beaufort Sea, as well as the Amundsen Gulf:

NASA Worldview “true-color” image of the Beaufort Sea on May 21st 2019, derived from the MODIS sensor on the Terra satellite

What’s more a cyclone is currently spinning in the area too:

With those prerequisites in place, how about my other criteria? Here’s the current northern hemisphere snow cover graph:

That suggests snow cover over land is close to recent lows, which is confirmed by the Rutgers University snow cover anomaly graph for April:

This year is anomalously low, but not by as much as 2012 and 2016. For completeness, here also is the current US National Ice Center snow cover map:

Moving on to melt ponds, there are plenty to be seen on the fast ice around the Mackenzie river delta:

NASA Worldview “false-color” image of the Mackenzie Delta on May 24th 2019, derived from the MODIS sensor on the Terra satellite

There also seem to be signs of some at a higher latitude off Ostrov Kotelny in the New Siberian Islands:

NASA Worldview “false-color” image of the Laptev Sea on May 23rd 2019, derived from the MODIS sensor on the Terra satellite

This year there is also a lot of open water in the Chukchi Sea, and almost no sea ice left in the Bering Sea:

Compared with 2016 at the same time of year I am compelled to say that with June 1st just around the corner the 2019 summer melting season is primed to progress more quickly.

The next obvious comparison to make is with the (in)famous year of 2012, which resulted in the lowest ever minimum extent in the satellite record. Firstly let’s look at the National Snow and Ice Data Center’s graph of Arctic sea ice extent:

Currently extent is significantly below 2012, albeit somewhat above 2016 at the same time of year. And what of melt ponds? In 2012 there was evidence of less snow cover over land and more surface water on the ice on the Siberian side of the Arctic:

NASA Worldview “false-color” image of the Eastern Arctic on May 25th 2012, derived from the MODIS sensor on the Terra satellite

Other than that Arctic sea ice in 2019 looks to be in worse shape than in 2012.

[Edit – May 27th]

We’ve established that the extent of Arctic sea ice at the end of May 2019 is less than in 2012, but something else to consider is whether that ice is currently thicker than in 2012, or not. Satellites can have a reasonable stab at measuring the area of sea ice, but the third dimension is much trickier. The European Space Agency’s CryoSat-2 satellite has been attempting to measure sea ice thickness since 2010, so let’s take at the conclusions it has reached:

Don’t forget to take a good long look at the associated uncertainties too:

Watch this space!

The 2019 Maximum Arctic Sea Ice Extent

March 2019 has arrived, which in recent years has proved to be by far the likeliest month to contain the maximum extent of Arctic sea ice for the year. To begin with, here’s our favourite high resolution extent graph calculated by “Wipneus” from University of Hamburg/JAXA AMSR2 data:

Hopefully you can plainly see the pronounced sharp peak towards the end of February 2019? The current maximum Arctic sea ice extent for 2019 is 13.83 million square kilometers on February 22nd. Here’s Arctic sea ice area for good measure:

The current maximum area for 2019 is 13.10 million square kilometers, also on February 22nd. Here too is the NSIDC’s 5 day averaged extent:

charctic-20170221

This reveals a current maximum extent for 2019 of 14.705 million square kilometers on February 24th.

At this juncture you may well be wondering what the cause of that sudden sharp peak might be? Here’s your starter for ten:

Whilst overall Arctic sea ice area is unremarkable for the current decade, sea ice area in the Bering Sea is remarkable low for the time of year! What’s more much like last year the Chukchi Sea is not currently full to overflowing with sea ice, and is also lowest for the date in the AMSR2 satellite records:

I’ve also been experimenting with the new gridded CryoSat-2/SMOS thickness data from the Finnish Meteorological Institute, which reveals this:

That’s a weekly overview dated February 24th, but it does perhaps explain how such a large area of sea ice could melt so swiftly?

As luck would have it the skies are reasonably clear over the Bering Strait this morning (UTC). Here’s Terra’s view from on high of the current situation:

Terra's view of the Bering Strait on March 1st 2019
Terra’s view of the Bering Strait on March 1st 2019

 
[Edit – March 1st PM]

The “low resolution” version of JAXA extent has fallen once again today:

Do you suppose that the current maximum of 14.19 million square kilometers on February 22nd will hold until All Fools’ Day and beyond?

 
[Edit – March 2nd]

An animation of recent movements of sea ice in the Bering and Chukchi Seas:


Note the recent spread of open water across the southern Chukchi Sea.

 
[Edit – March 3rd]

Another angle on the Chukchi Sea, plus significant areas of open water now becoming evident in the Beaufort Sea:


[Edit – March 5th]

Some alternative views on Arctic sea ice thickness:

PIOMAS via Wipneus:

Blended CryoSat-2/SMOS:

plus close ups of the Bering/Chukchi area:

and the Atlantic periphery:

Please note the change of scale.


[Edit – March 6th]

Arctic sea ice extent is currently rebounding:

although not in all the peripheral seas:


[Edit – March 7th]

High resolution AMSR2 area and extent both declined today:

Long distance swells are already reaching the Bering Sea, with much more to come:


[Edit – March 9th]

Wipneus’ trusty Raspberry Pi hasn’t crunched the high res AMSR2 numbers yet, so let’s take a look at some other extent metrics.

Here’s JAXA’s “low res” AMSR2 numbers:

Here too is the NSIDC’s 5 day average:

By special request from Michael Ohere for the first time is the DMI’s take on Arctic sea ice extent:

In addition, here is the underlying sea ice concentration data from the OSI-SAF:

Since Michael is also asserting that there currently exists “the greatest February Arctic sea ice extent (according to DMI) in your blog’s history”, here’s Arctic sea ice area excluding the extremely peripheral Okhotsk and St. Lawrence regions:

P.S. Wipneus’ Pi has processed the AMSR2 data now, and area shows another, more modest, decline today:

In addition, here is the underlying sea ice concentration data from the University of Hamburg:


[Edit – March 10th]

Both area and extent increased today:

including increases on both the Atlantic:

and Pacific sides of the Arctic:


[Edit – March 11th]

Both area and extent are still moving inexorably upwards:

The late February maximum still holds, on the high resolution numbers at least. The JAXA/VISHOP web site is down at the moment, so we’ll have to wait for an update to that particular metric, as well as a post weekend update to the NSIDC’s Charctic chart.

P.S. Jaxa is still down this afternoon, but here’s the latest from the NSIDC:


[Edit – March 13th]

Arctic wide area and extent have blasted past their respective late February maxima:

However Arctic sea ice area excluding the Okhotsk and St. Lawrence peripheral regions has still not exceeded the maximum formed on January 25th:


[Edit – March 14th]

This morning’s data reveal the first decline in extent for several days:

The (extremely!) tentative new maximum Arctic sea ice extent for 2019 is 13.89 million square kilometers on March 12th.


[Edit – March 15th]

JAXA is back!

UH AMSR2 confirms that extent is still declining:


[Edit – March 16th]

Arctic sea ice extent continues to decline, whilst area is still flatlining:

Meanwhile a look at freezing degree days based on the DMI’s dubiously weighted data for north of 80 degrees reveals the story of the freezing season. A historically warm start, but now back in amongst the pack of the 2010s:


[Edit – March 17th]

It looks as though there’ll be no going back from this. Arctic sea ice area is finally following extent’s decline in no uncertain terms:

Barring exceedingly unforeseen circumstances after this year’s “double top” that leaves the 2019 Arctic sea ice maximum extent numbers as follows:

UH/Wipneus AMSR2 – 13.89 million square kilometers on March 12th
JAXA/VISHOP AMSR2 – 14.27 million square kilometers on March 12th
NSIDC 5 day SSMIS – 14.78 million square kilometers on March 13th


[Edit – March 19th]

Arctic sea ice area has fallen off the proverbial cliff over the last few days. There can now be no doubt that the 2019 maximum extent has been reached:

That being the case, all other Arctic sea ice discussion for the month of March can now take place over at:

Facts About the Arctic in March 2019


[Edit – March 21st]

The NSIDC have provisionally confirmed this year’s maximum extent:

On March 13, 2019, Arctic sea ice likely reached its maximum extent for the year, at 14.78 million square kilometers (5.71 million square miles), the seventh lowest in the 40-year satellite record, tying with 2007. This year’s maximum extent is 860,000 square kilometers (332,000 square miles) below the 1981 to 2010 average maximum of 15.64 million square kilometers (6.04 million square miles) and 370,000 square kilometers (143,000 square miles) above the lowest maximum of 14.41 million square kilometers (5.56 million square miles) set on March 7, 2017. Prior to 2019, the four lowest maximum extents occurred from 2015 to 2018.

The date of the maximum this year, March 13, was very close to the 1981 to 2010 median date of March 12.

Please note this is a preliminary announcement of the sea ice maximum. At the beginning of April, NSIDC scientists will release a full analysis of winter conditions in the Arctic, along with monthly data for March.

The Great Arctic Cyclone of 2018?

Our title for today refers back to the Great Arctic Cyclone of August 2012. There has been some speculation over on the Arctic Sea Ice Blog about whether a similar event is about to occur this year.

It’s later in the season of course, but as is our wont we always look at the waves first. Here is the current WaveWatch III forecast for the evening of August 31st UTC:

Significant_height_of_combined_w in multi_1.glo_30mext.20180827_00039

Mean_period_of_swell_waves_order in multi_1.glo_30mext.20180827_00039

In summary the forecast shows some very large waves with a substantial period for inside the Arctic Circle directed straight at the ice edge. Let’s follow the forecast over the next few days carefully shall we?


[Edit – August 30th]

The latest wave forecast for tomorrow evening isn’t as extreme as 3 days ago. Note the change in the significant height scale:

Significant_height_of_combined_w in multi_1.glo_30mext.20180830-06Z_00013

Mean_period_of_swell_waves_order in multi_1.glo_30mext.20180830-06Z_00013

Nonetheless the height and period are still very significant!


[Edit – August 31st]

Here’s the latest forecast for 6 PM this evening (UTC):

Significant_height_of_combined_w in multi_1.glo_30mext.20180831_00007

Mean_period_of_swell_waves_order in multi_1.glo_30mext.20180831_00007

Note how the open water across almost the entire map is full of what in the Arctic counts as a long period swell. That means that the forecast for 2 days later looks like this:

Mean_period_of_swell_waves_order in multi_1.glo_30mext.20180831_00023

Significant_height_of_combined_w in multi_1.glo_30mext.20180831_00023

Less height but with a longer period. All of which means that the sea ice north of the Atlantic Ocean isn’t about to receive a short sharp shock. It has a sustained battering lasting several days to look forward to.


[Edit – September 1st]

The barrage of assorted swells has begun. Here’s the “hindcast” from midnight last night UTC:

Significant_height_of_combined_w in multi_1.glo_30mext.20180901_00001

Mean_period_of_swell_waves_order in multi_1.glo_30mext.20180901_00001

Now lets take a look at tomorrow’s forecast for the Laptev Sea. This is for 09:00 UTC:

Significant_height_of_combined_Laptev.20180901_00012

Mean_period_of_swell_waves_Laptev.20180901_00012

Note once again the change of scale on the wave/swell height map. Nevertheless a 3+ meter swell heading over into the East Siberian Sea isn’t something you see every day.

Now were into September the 2018 annual minimum extent can’t be too far away. Extent decline appears to have stalled. However “high res” AMSR2 area is currently falling fast, for the time of year at least:

Arctic-Area-2018-08-31


[Edit – September 2nd]

Here are the swell and period forecasts at midnight for round about now, 09:00 UTC:

Significant_height_of_combined_Laptev.20180902_00004

Mean_period_of_swell_waves_Laptev.20180902_00004

Significant_height_of_combined_Barents.20180902_00004

Mean_period_of_swell_waves_Barents.20180902_00004

All the seas between Greenland and the New Siberian Islands are awash with swells with a period of 8 second or greater. This is most unusual, to put it mildly!


[Edit – September 3rd]

Here’s the WaveWatch III “hindcast” from midnight last night UTC for the Russian side of the Arctic Ocean:

Significant_height_of_combined_NSR.20180903_00001

Mean_period_of_swell_waves_NSR.20180903_00001

There are still significant swells almost everywhere you look.


[Edit – September 4th]

Using the same scales as yesterday, here’s today’s hindcast from midnight:

Significant_height_of_combined_w in multi_1.glo_30mext.20180904_00001

Mean_period_of_swell_waves_order in multi_1.glo_30mext.20180904_00001

There’s still plenty of action in the Arctic Ocean!


[Edit – September 5th]

Feel free to debate whether it merits the “Great” prefix, but this is how the early September 2018 Arctic cyclone has panned out. According to this morning’s Environment Canada synopsis the cyclone is centred near the coast of the Laptev Sea and is down to a MSLP of 977 hPa:

CMC_SLP-20180905-00Z

Here’s another WaveWatch III hindcast from midnight UTC:

Significant_height_of_combined_w in multi_1.glo_30mext.20180905_00001

Mean_period_of_swell_waves_order in multi_1.glo_30mext.20180905_00001


[Edit – September 6th]

Need I say more?

Significant_height_of_combined_NSR.20180906_00001

Mean_period_of_swell_waves_NSR.20180906_00001


[Edit – September 7th]

The swell in the Fram Strait an Barents Sea is diminishing, but the period in the Laptev Sea is increasing now:

Significant_height_of_combined_NSR.20180907_00001

Mean_period_of_swell_waves_NSR.20180907_00001


[Edit – September 8th]

All the wave activity in the Laptev Sea is diminishing. Here’s the hindcast from midnight:

Significant_height_of_combined_NSR.20180908_00001

Mean_period_of_swell_waves_NSR.20180908_00001

Meanwhile things are warming up in the Chukchi and Beaufort Seas. Here’s the forecast for midnight tonight:

Significant_height_of_combined_Pacific.20180908_00009

Mean_period_of_swell_waves_Pacific.20180908_00009


[Edit – September 9th]

Here’s the hindcast for this morning’s swell in the Beaufort Sea:

Significant_height_of_combined_Atlantic.20180909_00001

Mean_period_of_swell_waves_Pacific.20180909_00001

This is currently a long way into the future and hence may not verify in practice. However any pulse of swell is currently forecast for September 13th:

Significant_height_of_combined_Atlantic.20180909_00047

Mean_period_of_swell_waves_Pacific.20180909_00047

The 2017/18 Festive Season in the Arctic

Christmas is coming, and Santa’s secret summer swimming pool has frozen over once again. However the same can’t be said for the Chukchi Sea! More on that in due course, but first let’s take a look at the PIOMAS volume graph at the end of November, courtesy of the wondrous Wipneus on the Arctic Sea Ice Forum:

piomas-trnd4-2017-11

2017 is currently third lowest, behind 2012 and 2016. Next let’s take a look at Wipneus’ PIOMAS Arctic sea ice thickness map:

PIOMAS-thk-20171130

followed by the University of Bremen’s SMOS Arctic sea ice thickness map:

20171205_hvnorth__l1c

Note the large area of pale blue open ocean still visible in the Chukchi Sea towards the top left of both maps.

For another perspective on Arctic sea ice thickness here’s the latest Cryosat-2 map, which currently is based on the month up to November 24th:

CS2-thk_28-2017-11-24

Finally, for the moment at least, here’s our very own Arctic Freezing Degree Days graph based on the DMI’s >80N data:

DMI-FDD-2017-12-06

2017 is currently occupying the wide open space between the astonishingly low numbers last year and all previous years in DMI’s record. Here’s their graph for 2017 so far:

DMI-meanT_2017-12-06


[Edit – December 10th]

Current Arctic sea ice area and extent derived from the University of Hamburg’s high resolution AMSR2 data:

UH-Arctic-Area-2017-12-09

UH-Arctic-Extent-2017-12-09

Plus the latest update on the Chukchi Sea situation:

UH-Chukchi-Area-2017-12-09


[Edit – December 20th]

Wipneus has released his mid month PIOMAS update for December:

piomas-trnd4-2017-12-15

PIOMAS-thk-dec152017

The Chukchi Sea is now mostly covered in sea ice, as is the Kara Sea. Volume is still 3rd lowest behind 2016 and 2012.

Whilst on the subject of sea ice thickness a related subject is sea ice age. Here’s a new paper on that topic:

A new tracking algorithm for sea ice age distribution estimation

Note that these assorted sea ice age maps are all for January 1st 2016!

Figure-6-Comparison-of-SIA-for-the-1-Jan-2016-calculated-with-the-following-combinations

Watch this space!

Facts About the Arctic in May 2017

Before we got on to the more usual Arctic metrics let’s bear in mind that the beginning of May is the time when the ice on the mighty Mackenzie River begins to break up, ultimately sending a surge of (comparatively!) warm water rushing into the Beaufort Sea. The patches of open water visible in the Beaufort Sea off the Mackenzie Delta in early April refroze, but have recently opened up once again:

NASA Worldview “true-color” image of the Beaufort Sea on May 2nd 2017, derived from the MODIS sensor on the Terra satellite

Meanwhile Northern Hemisphere snow cover is falling fast, albeit still above last year’s levels:

multisensor_4km_nh_snow_extent_20170502

Here’s the current view of the Liard River in northern Canada, with the Mackenzie River running bottom to top on the right hand side:

NASA Worldview “true-color” image of the Liard and Mackenzie Rivers on May 2nd 2017, derived from the MODIS sensor on the Terra satellite

The break-up of the Liard leads the Mackenzie, and taking a look at last year’s view of the same area it’s apparent that this year there’s somewhat more snow on the ground, and that this years Mackenzie break-up will therefore be a few days later than last year:

NASA Worldview “true-color” image of the Liard and Mackenzie Rivers on May 2nd 2016, derived from the MODIS sensor on the Aqua satellite

Whilst early melt in the Beaufort Sea is currently behind last year, the reverse is most certainly the case next door in the Chukchi Sea. The skies are rather cloudy there at the moment, but using the Suomi NPP day/night band to peer through the gloom reveals this:

NASA Worldview “day/night band” image of the Chukchi Sea on May 2nd 2017, derived from the VIIRS sensor on the Suomi satellite

Whilst sea coverage on the Pacific periphery has continued to fall, extent on the Atlantic side has not been following suit. Hence overall Arctic sea ice area is no longer lowest in the satellite record:

UH-Arctic-Area-2017-04-30

Finally, until the new PIOMAS numbers are released at least, here’s how DMI freezing degree days look at the moment:

DMI-FDD-20170502


[Edit – May 4th]

The April PIOMAS numbers have been published: Arctic sea ice volume is yet again by far the lowest on record:

PIOMAS-Volume-20170430

PIOMAS-thk-20170430


[Edit – May 5th]

Greenland ice sheet surface melt has started early this year:

greenland_melt_map_20170504

greenland_melt_plot_20170504


[Edit – May 12th]

The ice break-up of the Mackenzie River is now visible as increased flow at the junction with Arctic Red River just south of the delta:

Mackenzie River flow at Arctic Red River up to May 12th 2017

Meanwhile the sea ice in the Lincoln Sea north the Nares Strait is coming apart at the seams:

NASA Worldview “true-color” image of the Lincoln Sea on May 12th 2017, derived from the MODIS sensor on the Terra satellite


[Edit – May 17th]

May seems to be shaping up as month of two halves, both spatially and temporally. Here’s an overview of the current state of play:

Arc_20170516_res3.125

On the Pacific side of the Arctic sea ice area has been declining rapidly courtesy of the expanding areas of open water visible in the Beaufort, Chukchi and East Siberian Seas. It’s currently tracking below other recent years:

UH-Pacific-Extent-2017-05-16

However over on the Atlantic side area has been flatlining, and is currently above other recent years:

UH-Atlantic-Extent-2017-05-16

Ice mass balance buoy 2017A is now located near the boundary between the Beaufort and Chukchi Seas and as the melting season in that vicinity rapidly approaches it reveals that thermodynamic thickening has thus far achieved a mere 119 cm:2017A-2017-05-15

Arctic wide sea ice area has recently started to decline at an increasing rate:

UH-Arctic-Area-2017-05-16

During the second half of the month it will be interesting to see whether the forecast high temperatures produce significant melt ponding. If so it’s conceivable that 2017 area could drop below 2016 again by the beginning of June. There already signs of surface melt at places as far apart as Franklin Bay, Chaunskaya Bay and even the Great Bear Lake!

Watch this space!

References

Muhammad, P., Duguay, C., and Kang, K.-K.: Monitoring ice break-up on the Mackenzie River using MODIS data, The Cryosphere, 10, 569-584, doi:10.5194/tc-10-569-2016, 2016.

Rood S. B., Kaluthota S., Philipsen L. J., Rood N. J., and Zanewich K. P. (2017) Increasing discharge from the Mackenzie River system to the Arctic Ocean, Hydrol. Process., 31, 150–160. doi: 10.1002/hyp.10986.

Kwok, R., L. Toudal Pedersen, P. Gudmandsen, and S. S. Pang (2010), Large sea ice outflow into the Nares Strait in 2007, Geophys. Res. Lett., 37, L03502, doi:10.1029/2009GL041872.