World renowned climate scientist Roger Pielke Jr. has just published an interesting paper in the highly respected academic journal the New York Post. It is entitled:
When it comes to climate change, to invoke one of Al Gore’s favorite sayings, the biggest challenge is not what we don’t know, but what we know for sure but just isn’t so.
Two new studies show that the Earth’s climate is far more complex than often acknowledged, reminding us of the importance of pragmatic energy and climate policies.
One of them, led by researchers at China’s Tongji University, finds that after years of ice sheet decline, Antarctica has seen a “surprising shift”: a record-breaking accumulation of ice…
Roger then heads for the far north, where he assures his learned readers that:
A second new paper, a preprint now going through peer review, finds a similar change at the opposite end of the planet.
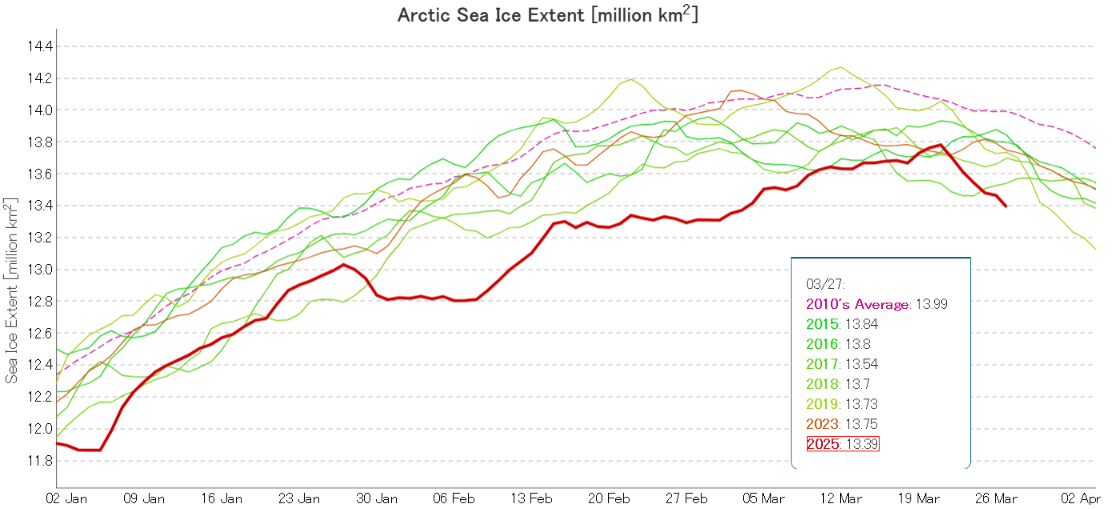
“The loss of Arctic sea ice cover has undergone a pronounced slowdown over the past two decades, across all months of the year,” the paper’s US and UK authors write.
They suggest that the “pause” in Arctic sea ice decline could persist for several more decades.
Together, the two studies remind us that the global climate system remains unpredictable, defying simplistic expectations that change moves only in one direction.
I feel compelled to point out to Roger that apart from the fact that they both include the word “ice”, Arctic sea ice and the Antarctic ice sheet are approximately as similar as chalk and cheese.
Roger neglects to provide NY Post readers with a reference or helpful link to the preprint he is referring to. However luckily for my own reader(s) I have already done so. Hence I am able to quote the authors’ own words, which read as follows:
According to these climate model simulations, this pause in the loss of Arctic sea ice could plausibly continue for the next 5-10 years.
I have already emailed the authors of the preprint asking them to justify their use of the term “pause”. I’ll let you know what they have to say on the matter in due course. In the meantime I suggest that Dr. Pielke consults an English dictionary. In pseudo code:
"pause" != "rebound"
I also suggest that he directs Post readers to more recent activity of yours truly’s virtual pen:
This year’s maximum extent is 1.31 million square kilometers below the 1981 to 2010 average maximum of 15.64 million square kilometers and 80,000 square kilometers below the previous lowest maximum that occurred on March 7, 2017:
Perhaps he also wouldn’t mind asking the Post’s online editor(s) to reveal this explanatory video to their viewers?
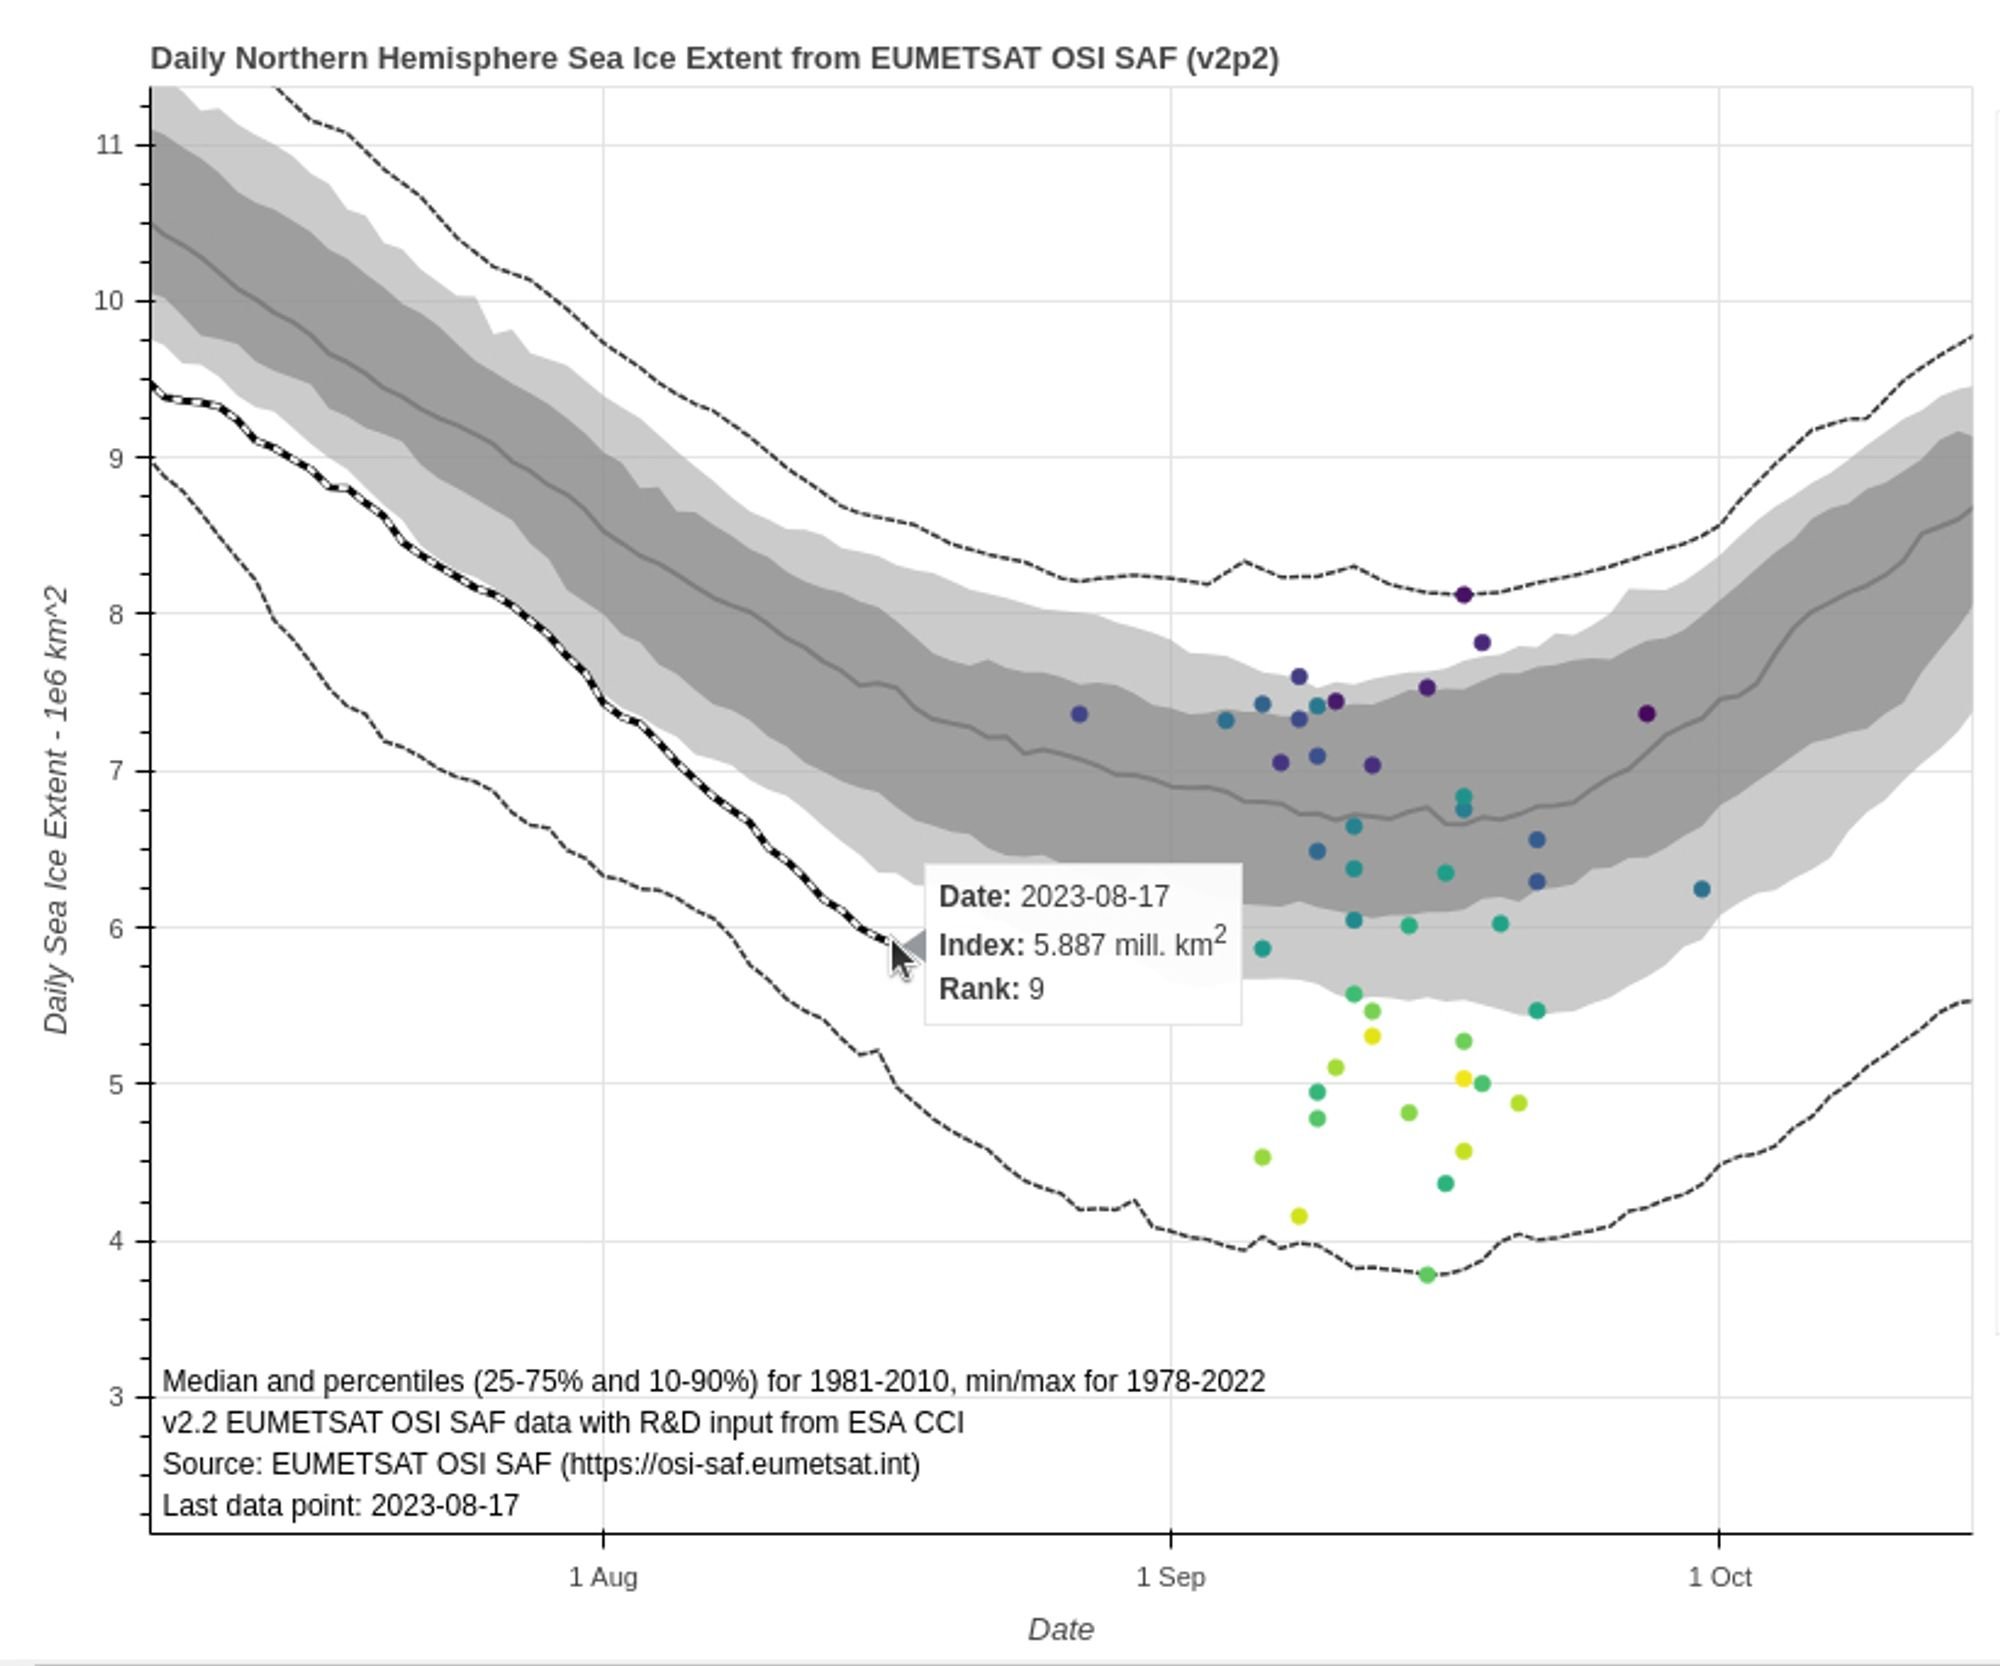
It’s that time of year again! Tony Heller has been asserting that “summer is over at the North Pole” for several weeks now, and the 2023 Arctic sea ice minimum extent will occur at some point over the next four or five weeks. The exact date and level will almost certainly vary from one extent metric to the next.
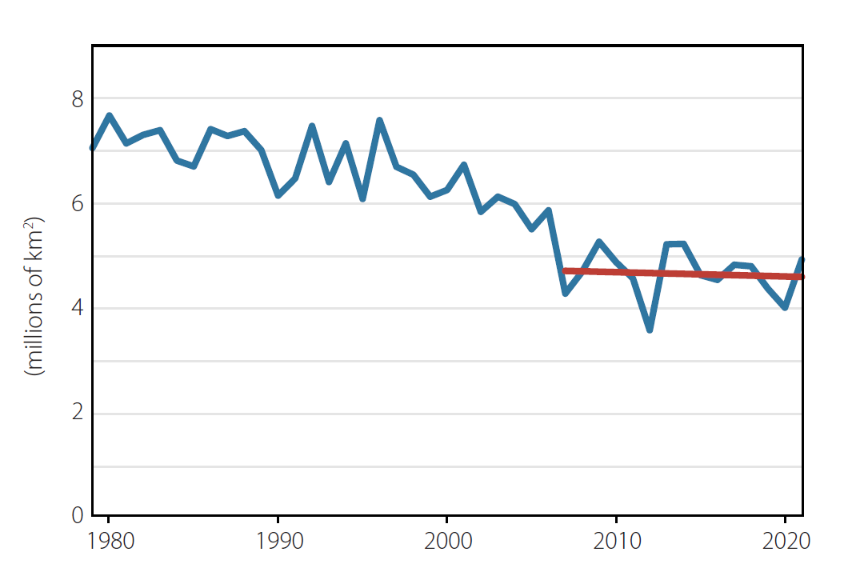
To get the minimum extent ball rolling, here’s Signe Aaboe’s graph of previous summer minima based on OSI SAF data:
Here too is Zack Labe’s equivalent, based on JAXA data:
I should of course add “in the satellite era”, but the title is pretty unwieldy as it is!
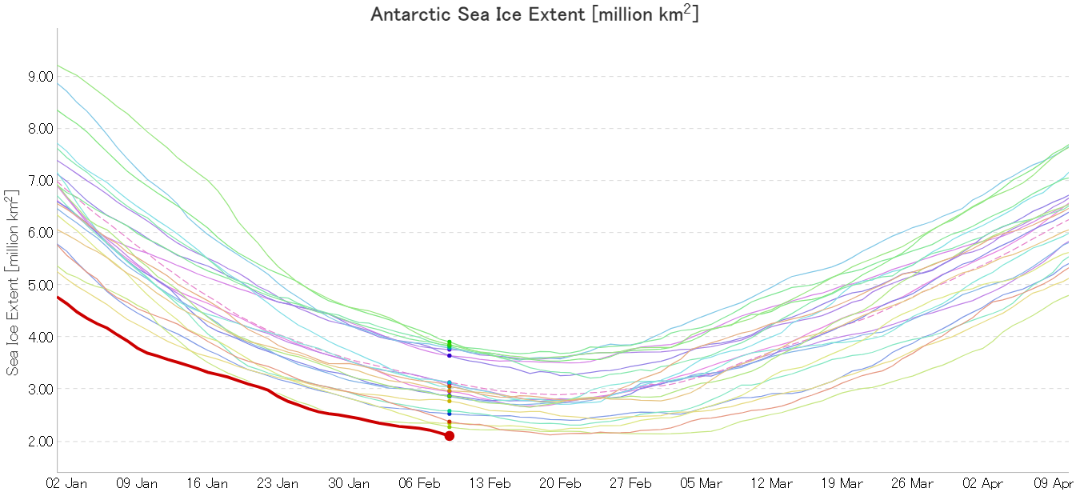
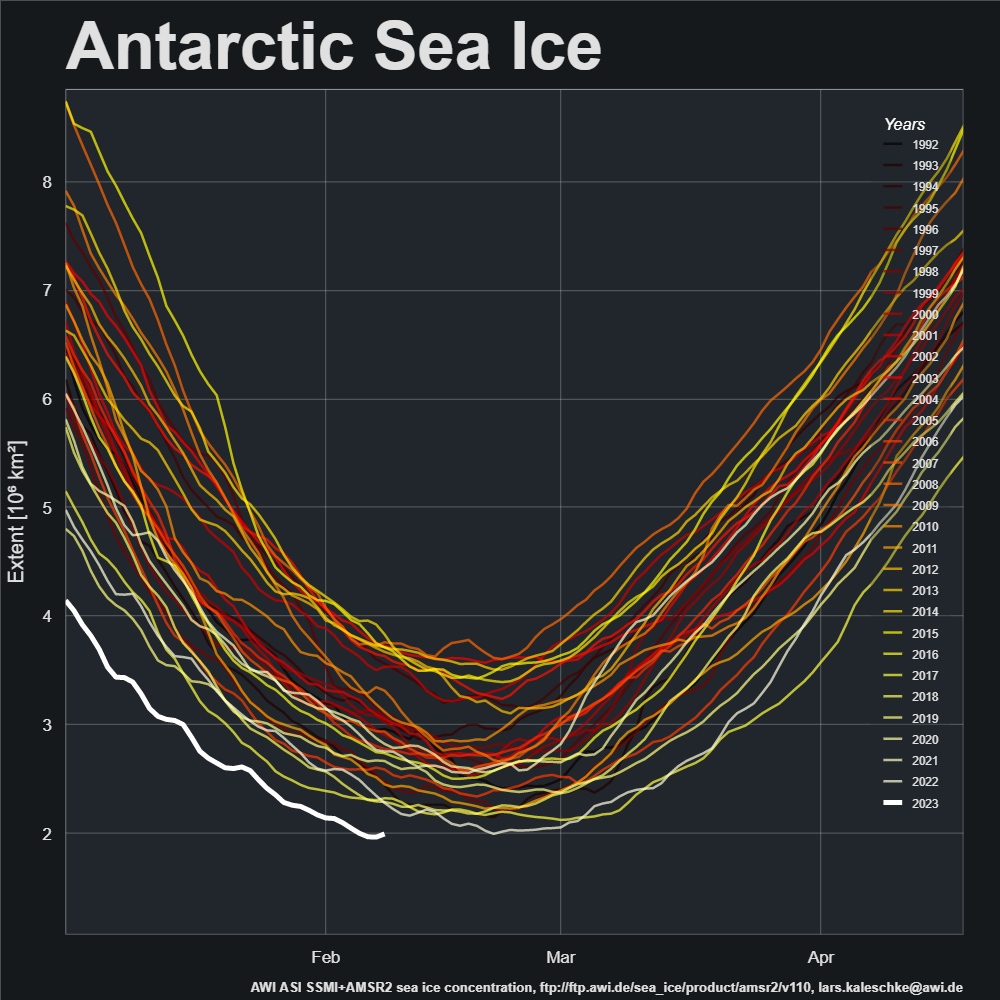
I was up early (UTC) to check the latest JAXA data, and sure enough that confirmed a new record minimum Antarctic sea ice extent of 2.11 million km² was reached yesterday:
Having added a note to that effect the Arctic open thread, Lars Kaleschke from the Alfred Wegener Institute pointed out over on Mastodon that the AWI had published a press release about the event this morning:
Let’s take a closer look at what the AWI had to say:
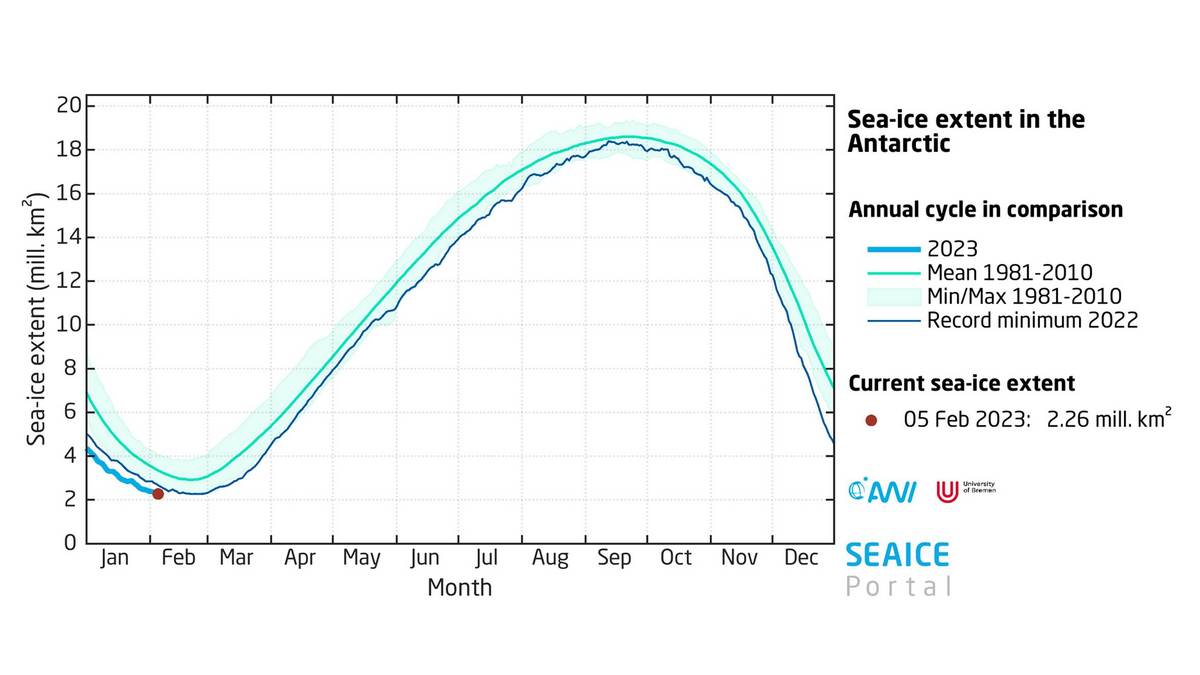
On 8 February 2023, at 2.20 million square kilometres, the Antarctic sea ice extent had already dropped below the previous record minimum from 2022 (2.27 million square kilometres on 24 February 2022). Since the sea ice melting in the Antarctic will most likely continue in the second half of the month, we can’t say yet when the record low will be reached or how much more sea ice will melt between now and then,” says Prof Christian Haas, Head of the Sea Ice Physics Section at the Alfred Wegener Institute, Helmholtz Centre for Polar and Marine Research (AWI), with regard to the current developments in the Antarctic. “The rapid decline in sea ice over the past six years is quite remarkable, since the ice cover hardly changed at all in the thirty-five years before. It is still unclear whether what we are seeing is the beginning of a rapid end to summer sea ice in the Antarctic, or if it is merely the beginning of a new phase characterised by low but still stable sea ice cover in the summer.”
Here’s how that news looks in the AWI’s official press release:
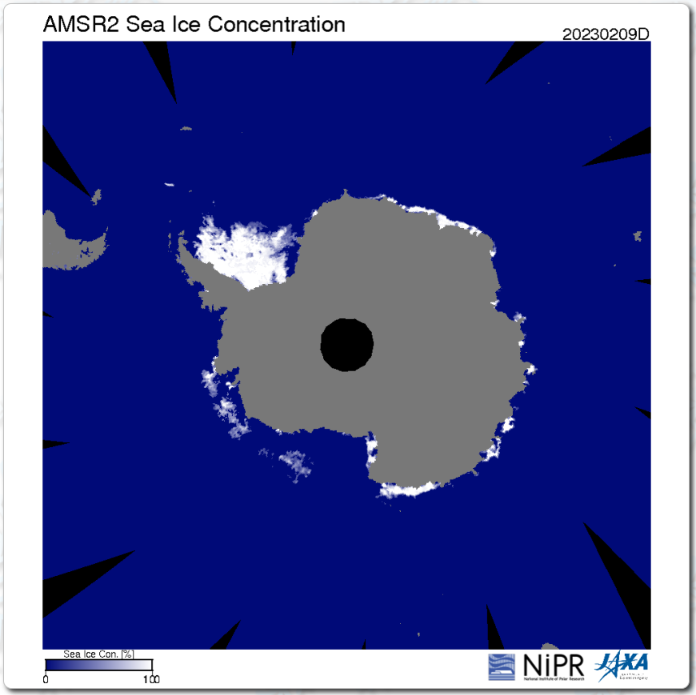
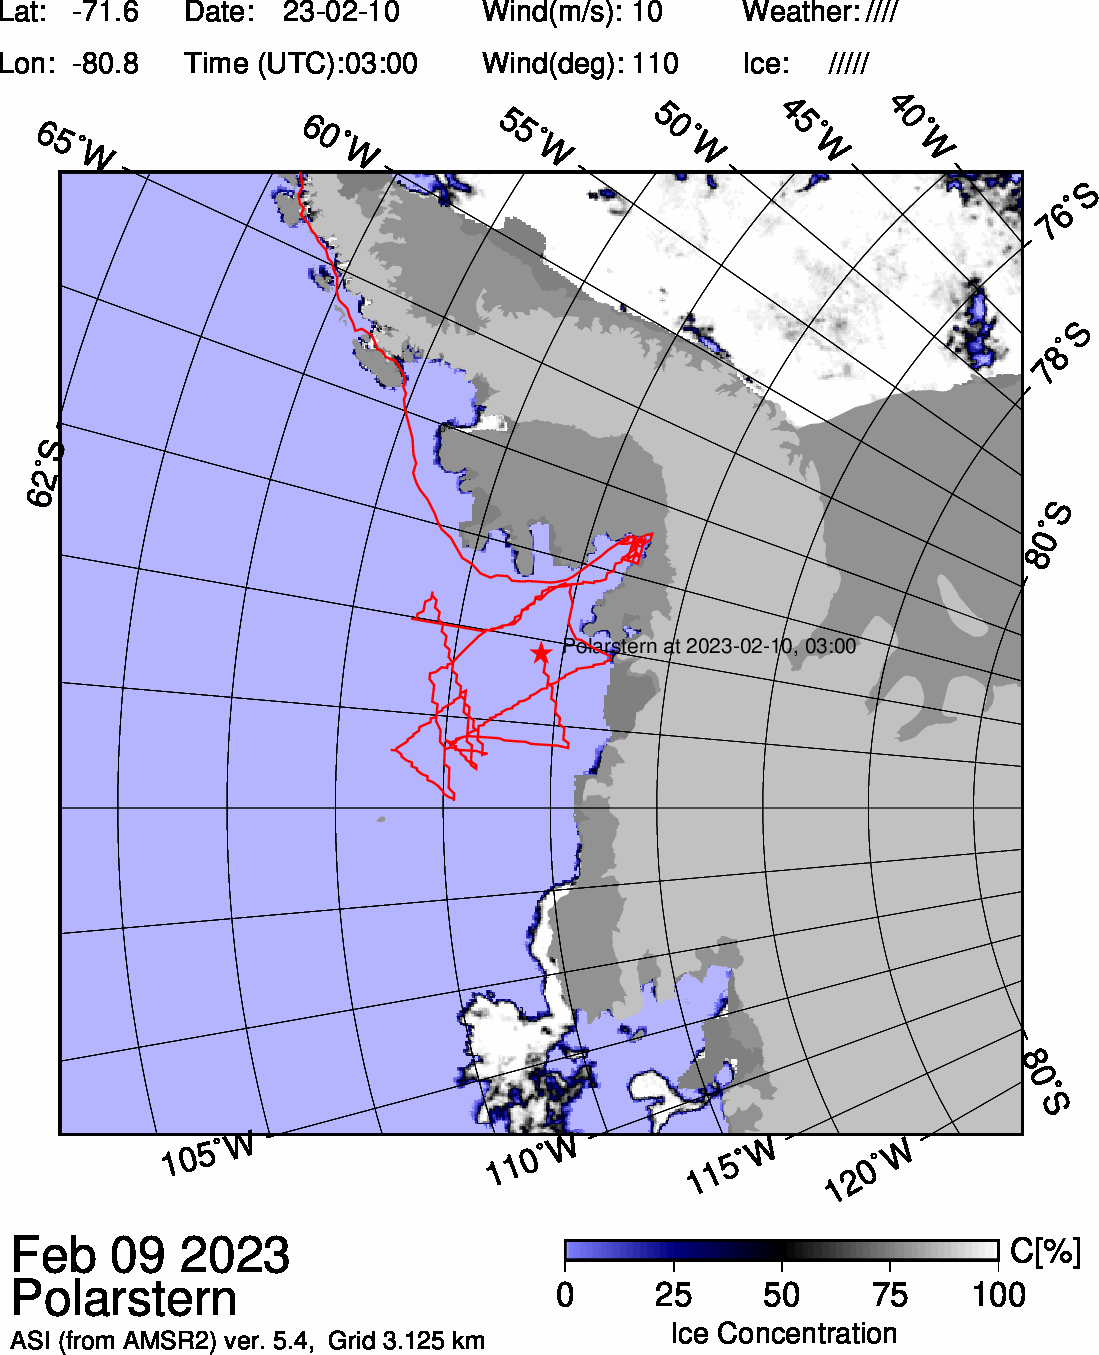
By way of prognostication here too is the current JAXA AMSR2 concentration map:
There are some low concentration areas which suggest further extent reductions still to come, despite the recent uptick in the high resolution graph.
Getting back to the AWI’s text:
The melting has progressed since December 2022, especially in the Bellingshausen and Amundsen Seas in the West Antarctic; the former is virtually ice-free. That is also where the research vessel Polarstern currently is, exploring the evidence left behind of past glacials and interglacials. According to expedition leader and AWI geophysicist Prof Karsten Gohl, who is now in the region for the seventh time, having first come in 1994: “I have never seen such an extreme, ice-free situation here before. The continental shelf, an area the size of Germany, is now completely ice-free. Though these conditions are advantageous for our vessel-based fieldwork, it is still troubling to consider how quickly this change has taken place.”
Polarstern in ice free Bellingshausen Sea, West Antarctica, in January 2023. (Photo: Daniela Röhnert)
Analyses of the current sea ice extent, conducted by the Sea Ice Portal team, show that, for the entire month of January 2023, the ice was at its lowest-ever extent recorded for the time of year since the beginning of record-keeping in 1979. The monthly mean value was 3.22 million square kilometres, ca. 478,000 square kilometres (an area roughly the size of Sweden) below the previous minimum from 2017. With regard to its long-term development, the Antarctic sea ice shows a declining trend of 2.6 percent per decade. This is the eighth consecutive year in which the mean sea-ice extent in January has been below the long-term trend.
But what has caused the current lack of Antipodean sea ice? The press release continues:
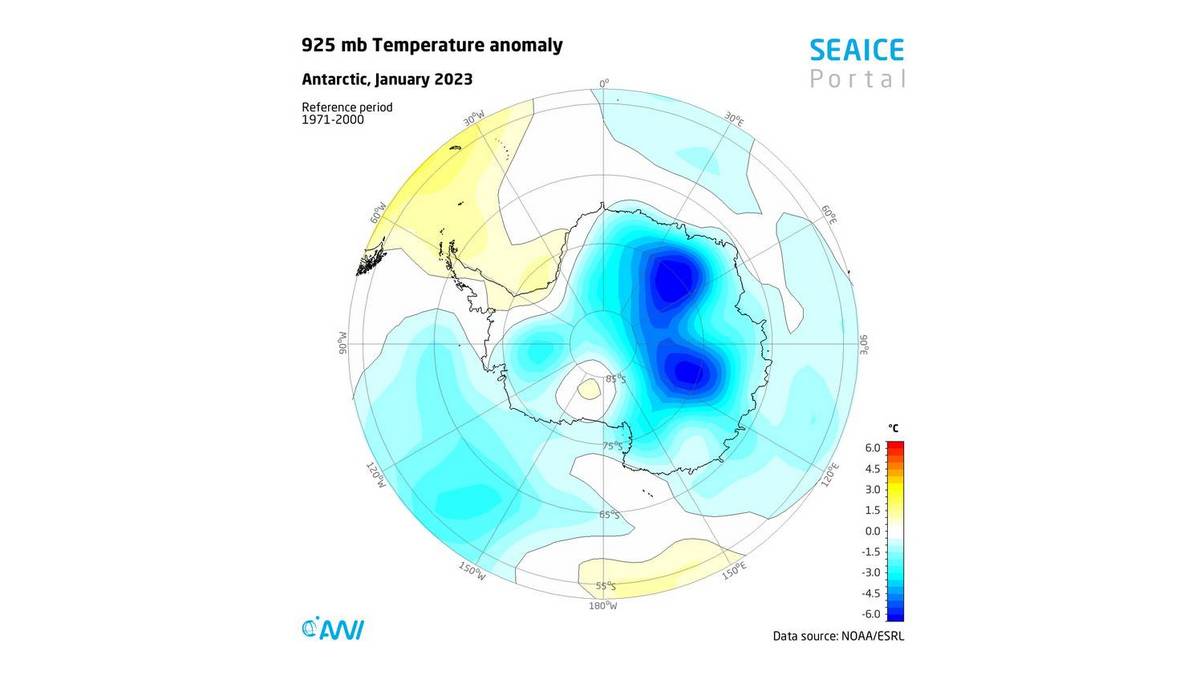
This intense melting could be due to unusually high air temperatures to the west and east of the Antarctic Peninsula, which were ca. 1.5 °C above the long-term average. In addition, the Southern Annular Mode (SAM) is in a strongly positive phase, which influences the prevailing wind circulation in the Antarctic. In a positive SAM phase (like today), a low-pressure anomaly forms over the Antarctic, while a high-pressure anomaly develops over the middle latitudes. This intensifies the westerly winds and causes them to contract toward the Antarctic. As a result, upwelling of circumpolar deep water on the continental shelf intensifies in the Antarctic, promoting sea-ice retreat. More importantly, it also intensifies the melting of ice shelves, an essential aspect for future global sea-level rise.
Air temperature anomalies in °C at 925 hPa pressure level in Antarctica in January 2023 compared to the long-term mean 1971-2000. (Graphic: meereisportal.de)
The press release concludes:
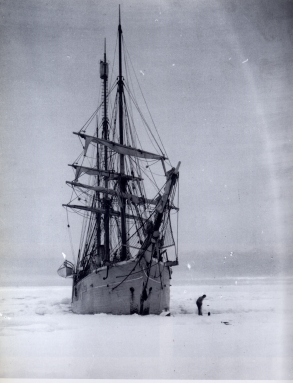
Historical records also reflect the tremendous changes. For example, in the Antarctic summer 125 years ago, the Belgian research vessel Belgica was trapped in the massive pack ice for more than a year – in exactly the same region where the Polarstern can now operate in completely ice-free waters. The photographs and diaries of the Belgica’s crew offer a unique chronicle of the ice conditions in the Bellingshausen Sea at the dawn of the industrial age, which climate researchers often use as a benchmark for comparison with today’s climate change.
Belgica became ice bound near Peter I island on February 28th 1898. On board was second officer Roald Amundsen. The leader of the expedition, Adrien de Gerlache, published a French language book about the voyage in 1902: “Quinze mois en Antarctique“.
Belgica ice bound in the Bellingshausen Sea
Finally, for the moment at least, here is the University of Bremen’s map of Polarstern’s current location and the sea ice concentration in the vicinity thereof:
[Edit – February 11th]
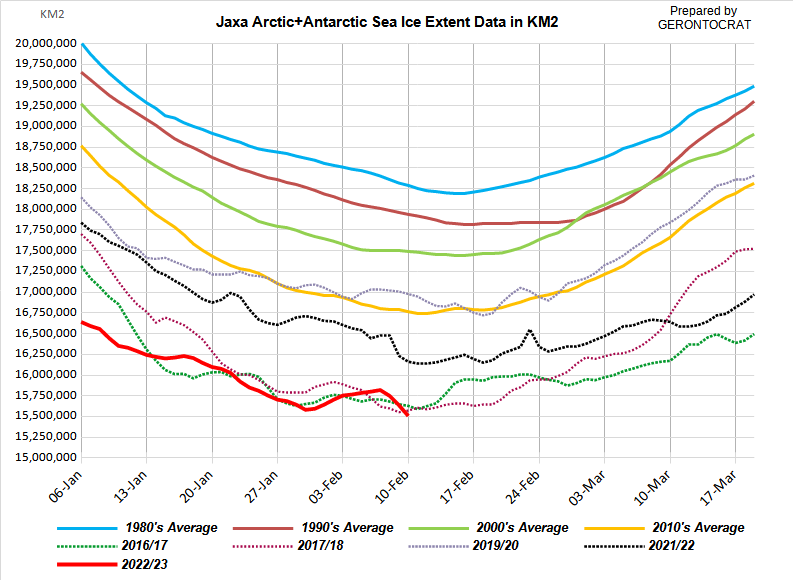
JAXA Antarctic sea ice extent is now down to 2.06 million km². Accompanied by a significant fall in Arctic extent, JAXA’s flavour of global sea ice extent has now also reached the lowest level ever recorded in the satellite era, at 15.51 million km² :
P.S. The NSIDC’s 5 day averaged extent hasn’t quite reached a record minimum yet:
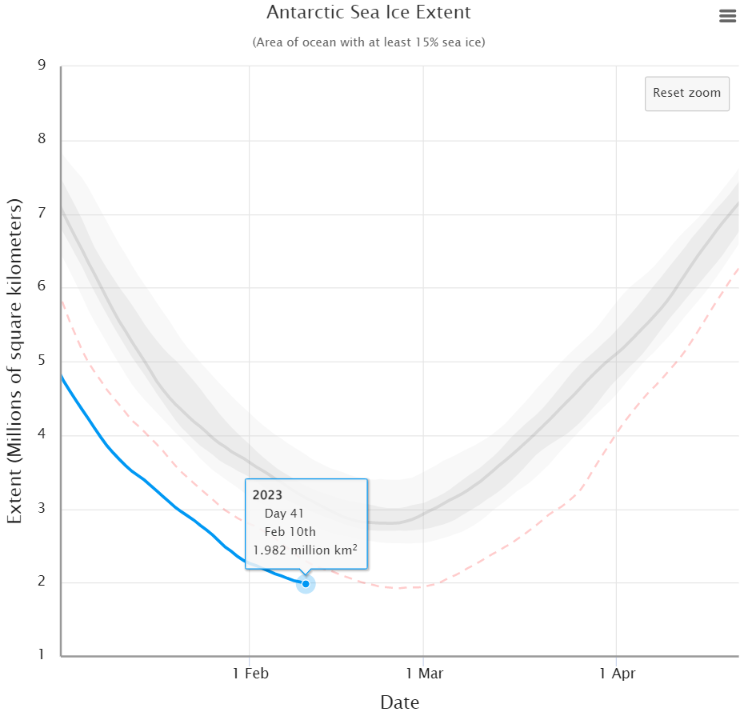
However their daily extent has reached a new satellite era record minimum:
The reality is that @NSIDC daily #Antarctic#SeaIce extent for February 10th is 1.90 million km².
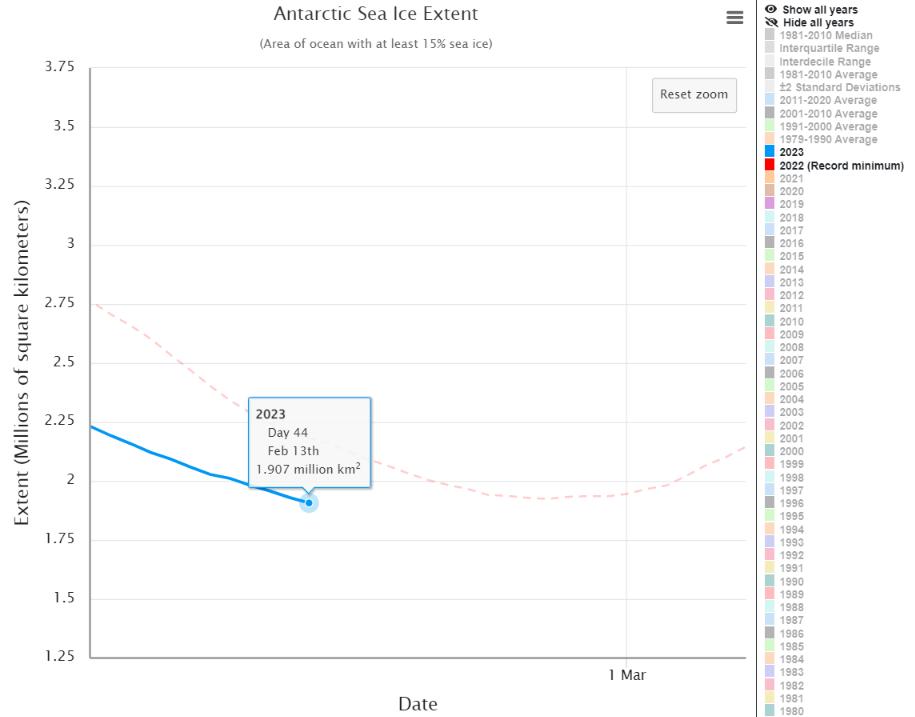
The NSIDC’s 5 day average Antarctic sea ice extent metric has duly reached a new record low level of 1.91 million km² :
P.S. The NSIDC has now published itsown article about the record minimum:
With a couple more weeks likely left in the melt season, the extent is expected to drop further before reaching its annual minimum. Much of the Antarctic coast is ice free, exposing the ice shelves that fringe the ice sheet to wave action and warmer conditions…
Extent has tracked well below last year’s melt season levels since mid-December. As noted in our previous post, a positive Southern Annular Mode has led to stronger-than-average westerly winds. Along with a strong Amundsen Sea Low, the weather conditions have brought warm air to the region on both sides of the Antarctic Peninsula. This has largely cleared out the ice cover in the Amundsen and Bellingshausen Seas, and reduced the sea ice extent in the northwestern Weddell Sea. Sea ice is patchy and nearly absent over a long stretch of the Pacific-facing coastline of Antarctica. Earlier studies have linked low sea ice cover with wave-induced stresses on the floating ice shelves that hem the continent, leading to break up of weaker areas.
Antarctic sea ice extent has been highly variable over the last several years. While 2022 and 2023 have had record low minimum extent, four out of the five highest minimums have occurred since 2008. Overall, the trend in Antarctic minimum extent over 1979 to 2023 is near zero. The current downward linear trend in the Antarctic minimum extent from 1979 to 2023 is 2,400 square kilometers per year, or 0.9 percent per decade, which is currently not statistically significant. Nevertheless, the sharp decline in sea ice extent since 2016 has fueled research on potential causes and whether sea ice loss in the Southern Hemisphere is developing a significant downward trend.
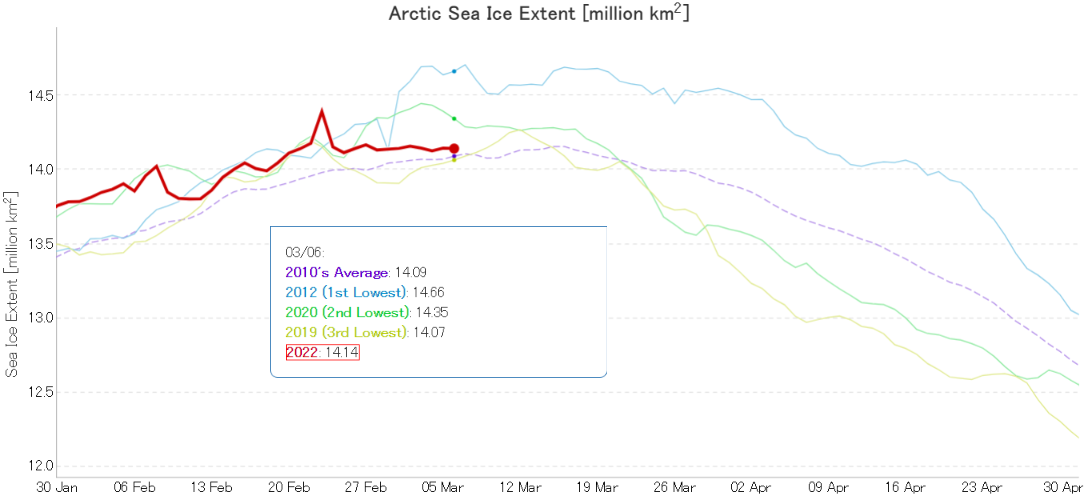
For detailed analysis of Arctic sea ice extent over the next few weeks please see the 2022 maximum extent thread. However to get the new open thread going here is the current JAXA/ViSHOP extent graph:
It’s looking more and more as though the real maximum for 2022 occurred close the false peak on February 23rd.
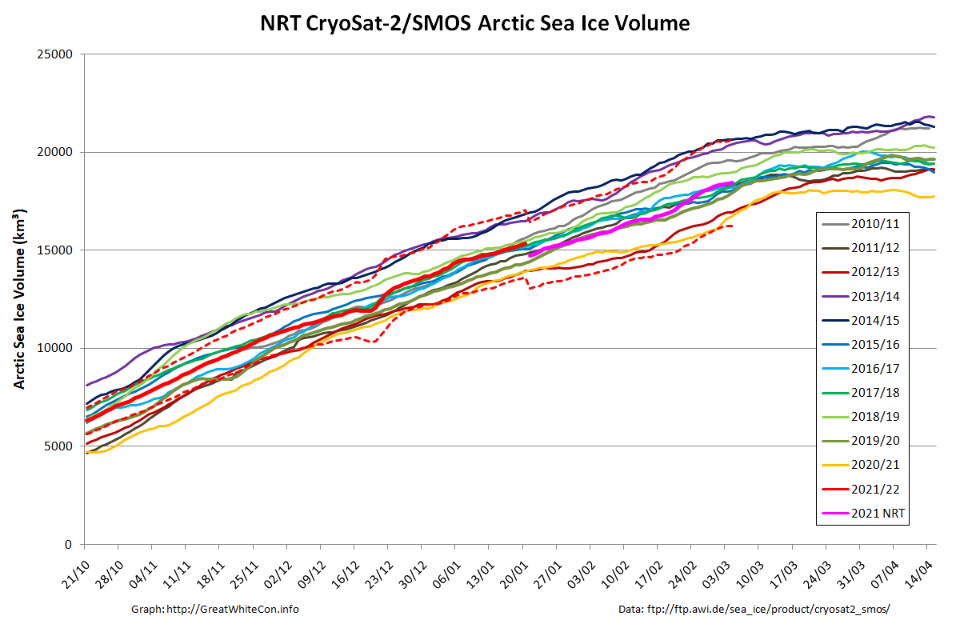
Arctic sea ice volume will keep increasing for a while longer. Here is the current AWI CryoSat-2/SMOS volume graph:
The recent “flat line” in extent is in part due to recent events on the Pacific periphery of the Arctic. Take a look at this animation of AMSR2 sea ice concentration:
The gap varies depending on how the wind blows, but there is still evidence of open water (or very thin ice) along the shore of the Beaufort and Chukchi Seas. Here’s the Mackenzie Delta and the adjacent Beaufort Sea on March 5th:
My apologies for the mixed metaphors in today’s title, but the news I bear is beyond bizarre.
In a press release earlier today The Global Warming Policy Foundation proudly announced that:
A new paper by an eminent meteorologist says that trends in polar sea-ice levels give little cause for alarm. The paper, by Professor J. Ray Bates has just been published by the Global Warming Policy Foundation.
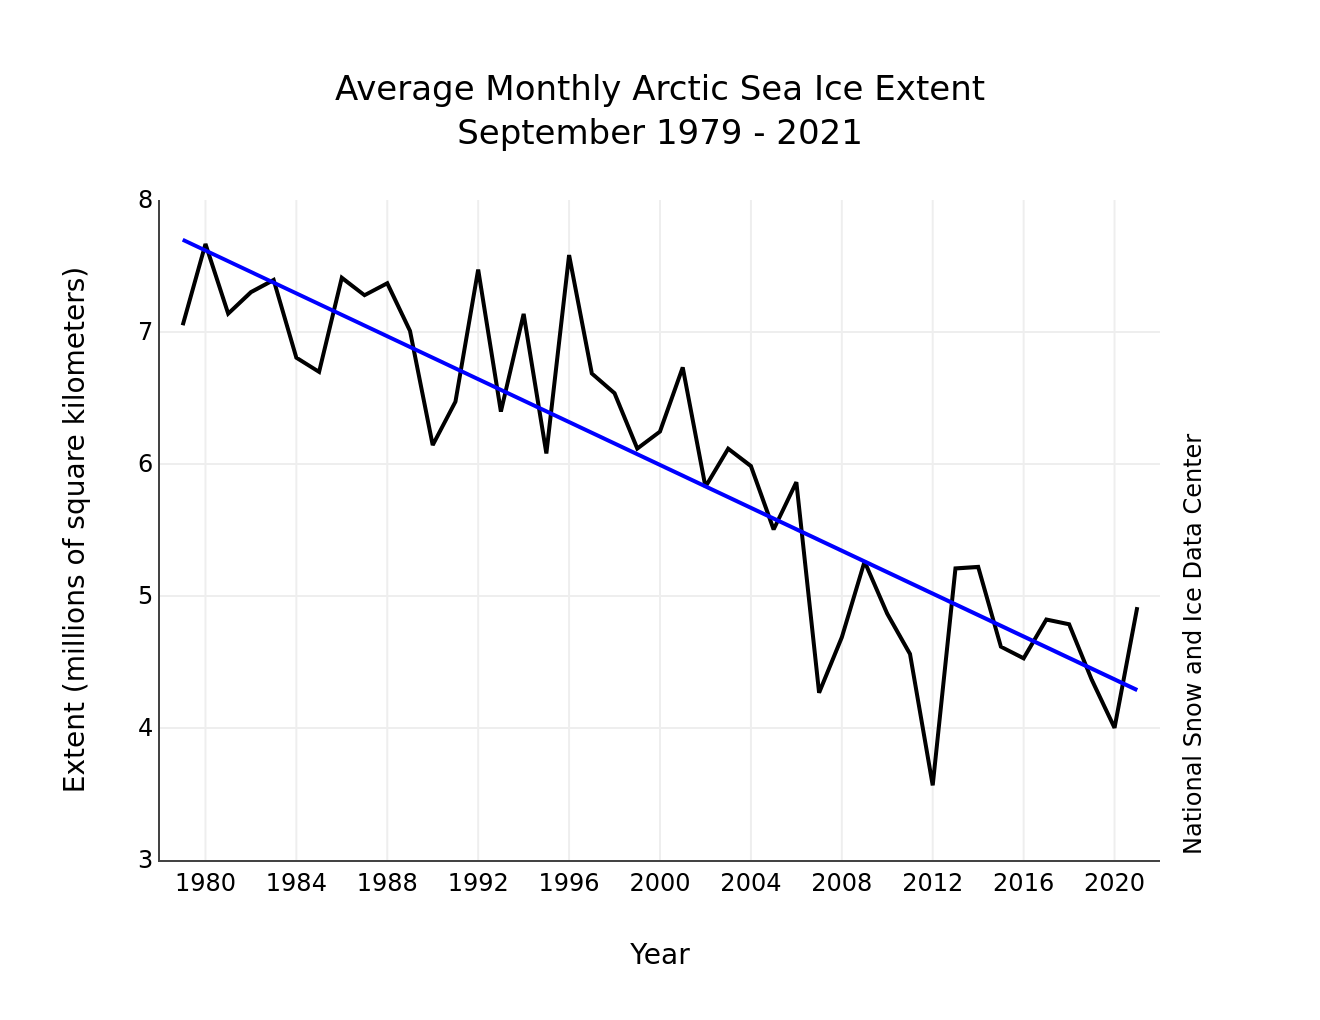
According to Professor Bates, climate model simulations indicate significantly decreasing sea ice levels in both hemispheres, with the greatest decreases occurring in September each year. However, the observed September trend in the Antarctic is actually slightly upwards, and while observed levels in the Arctic have fallen over the last 40 years, they have been quite stable since around 2007.
Professor Bates said:
“In 2007, Al Gore told us that Arctic sea ice levels were ‘falling off a cliff’. It’s clear now that he was completely wrong. In fact, the trends in sea-ice are an antidote to climate alarm.”
Professor Bates also says that little reliance should be placed on model simulations of future sea-ice decline:
“Climate models failed to predict the growth in Antarctic sea ice, and they missed the recent marked slowdown of sea-ice decline in the Arctic. It would be unwarranted to think they are going to get things right over the next 30 years.”
Professor Bates’ paper is published today, and can be downloaded here (pdf).
By all means download Ray’s “paper” from the link above and take a look at his introduction, which begins as follows:
The recent publication of the book Unsettled by Steven Koonin has led to the likelihood of increased scrutiny of the perception of a climate emergency,1 an idea which has become so widely established in recent years. Koonin, a former scientific advisor to the Obama administration, has demonstrated that what the public are being told by the media is not necessarily what the scientists are saying. He has also shown that what is being relayed in the national and UN climate assessments has often been written for the purpose of persuading rather than informing.
Unsettled clearly shows that important aspects of climate science, which the public have been persuaded to regard as beyond dispute are, in fact, quite unsettled.
Regular readers may recall that as soon as Steve’s book was published in machine readable format we established that it made no mention whatsoever of sea ice, whether of the Arctic or Antarctic variety.
Furthermore, when I attempted to debate that fact with Prof. Koonin he disappeared without trace before justifying that strange omission, beyond asserting that:
The topic is somewhat distant from ordinary folks’ perception.
It seems that Prof. Bates and the GWPF disagree with Prof. Koonin on this topic, since presumably their “paper” is addressed to ordinary folks? Ray even explicitly states that:
Although Unsettled covers a broad spectrum of climate topics, it does not treat in depth the issue of recent polar sea-ice trends, which are key indicators of changes in the global climate.
His “paper” goes on to assert in section 2 that:
Since the introduction of passive-microwave satellite observations in the late 1970s, polar sea-ice extent has been among the most accurately observed climate indicators. Sea-ice volume, on the other hand, is much more difficult to measure.
So far so good I suppose, but then we are told:
In December 2007, former US vice-president Al Gore, in his Nobel Peace Prize acceptance speech in Oslo, referred to scientific studies warning that the Arctic sea ice was ‘falling off a cliff’. He highlighted forthcoming model results that projected largely ice-free Arctic summers in ‘as little as seven years’. He repeated this warning two years later at the 2009 COP15 climate meeting in Copenhagen.
Gore’s claim was based on a study by researchers from the US Naval Postgraduate School, who used a regional model of the sea ice–ocean system in the Arctic, constrained using observational data for the 12-year period 1996–2007, and concluded that the Arctic would be nearly ice-free in summer by 2016 (plus or minus three years).
Prof. Bates seems blithely unaware that we thoroughly debunked this nonsense many moons ago. What Prof. Wieslaw Maslowski, one of those pesky “researchers from the US Naval Postgraduate School”, actually said in December 2007 was:
If we project this trend ongoing for the last 10–15 years, we probably will reach zero in summer some time mid next decade.
Reiterate for the benefit of those who seem unable to understand either English or Mathematics that a “projection” is not the same thing as a “prediction”.
preferring instead a version of his own construction, which looks like this:
Ray then confidently asserts that:
The current slowdown in the rate of sea-ice loss was not expected, and the reasons for it are uncertain.
Sadly Ray’s exhaustive list of references fails to mention this learned journal article from 2011 by authors from the University of Washington and Los Alamos National Laboratory, which not only anticipated such a “slow transition” but also offered reasons for it:
Given the strong thickness–growth feedback of sea ice (Bitz and Roe 2004), where in a warming climate we can expect the thicker MY ice to thin at a greater rate than the thinner FY ice, and the fact that the ratio of MY to FY ice entering into the MY ice category each year is decreasing, it is likely that the difference between FY and MY ice survival ratios will decrease in a warming climate. If this occurs, the Arctic sea ice system would move toward a regime of decreased memory and decreased sensitivity to climate forcing…
There is of course plenty more GWPF sea ice nonsense where that lot came from, but it’s already past my tea time (UTC) and so further debunking will have to wait a while. In the meantime here’s a wake up call for Professor J. Ray Bates:
[Edit – December 17th]
Moving further down section 2 Ray assures us that:
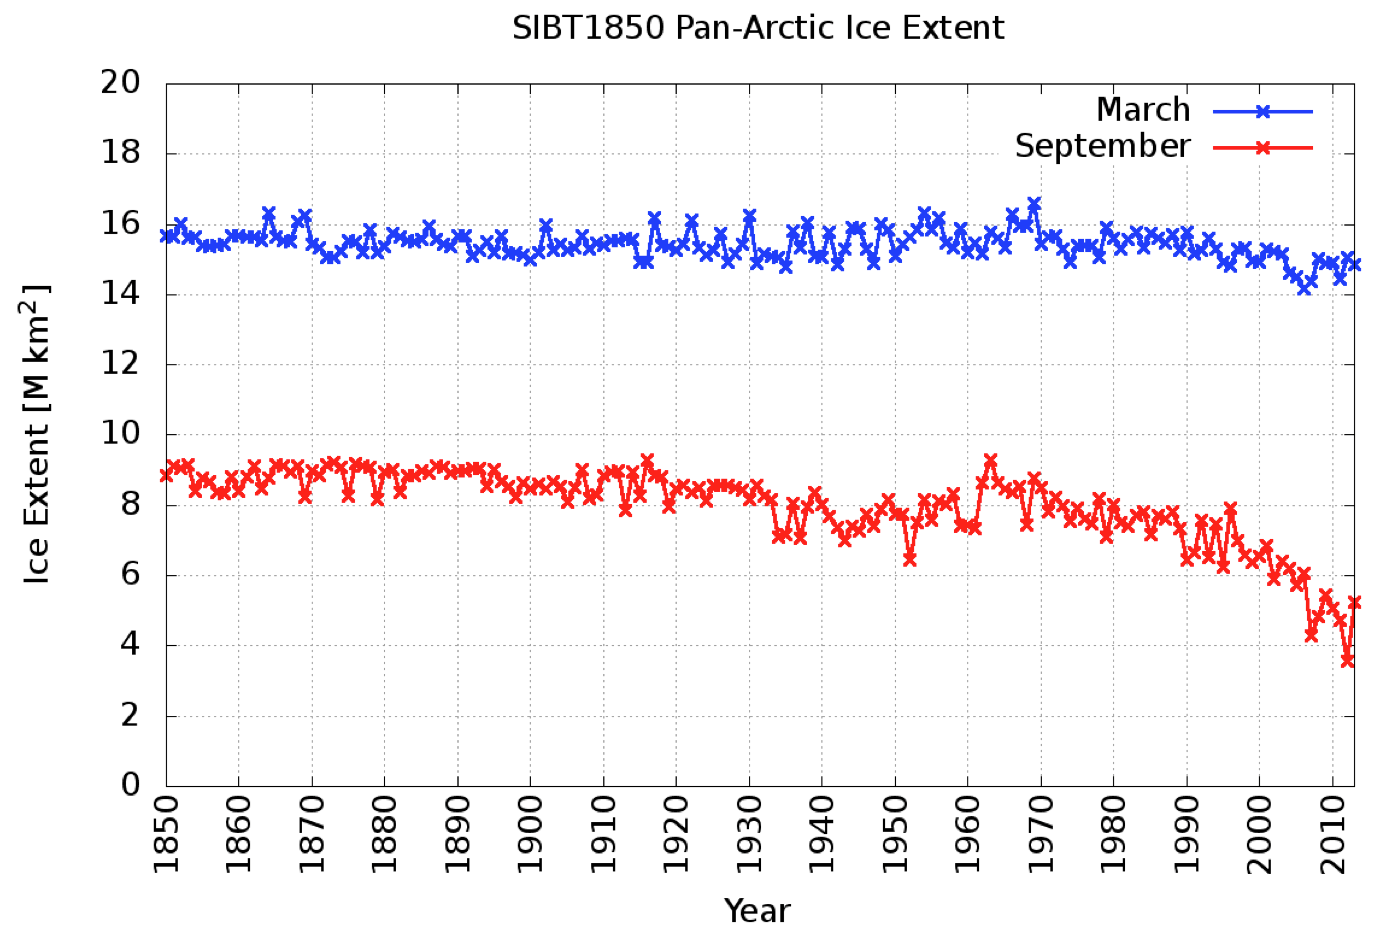
Any objective discussion of the recent Arctic sea-ice decline also requires that some consideration be given to the evidence regarding past natural variability on a multi-decadal timescale. In the pre-satellite era, reliable data on sea-ice coverage was sparse.
By combining the temperature and partial sea-ice records, statistical reconstructions of the total sea-ice extent going back to the early 1900s can be created. Some of these reconstructions indicate that between the 1900s and 1940s, Arctic sea-ice extent comparable to the present reduced levels may have occurred.
Ray doesn’t sound very certain, which is perhaps because the paper in question blithely states that:
Because Arctic sea ice trends are closely correlated to Arctic temperature trends, they are often discussed in the context of global temperature trends.
Maybe so, but to the best of my recollection Connolly et al. never attempt to “prove” the asserted correlation. Here’s an alternative assessment of “Arctic sea-ice extentbetween the 1900s and 1940s“:
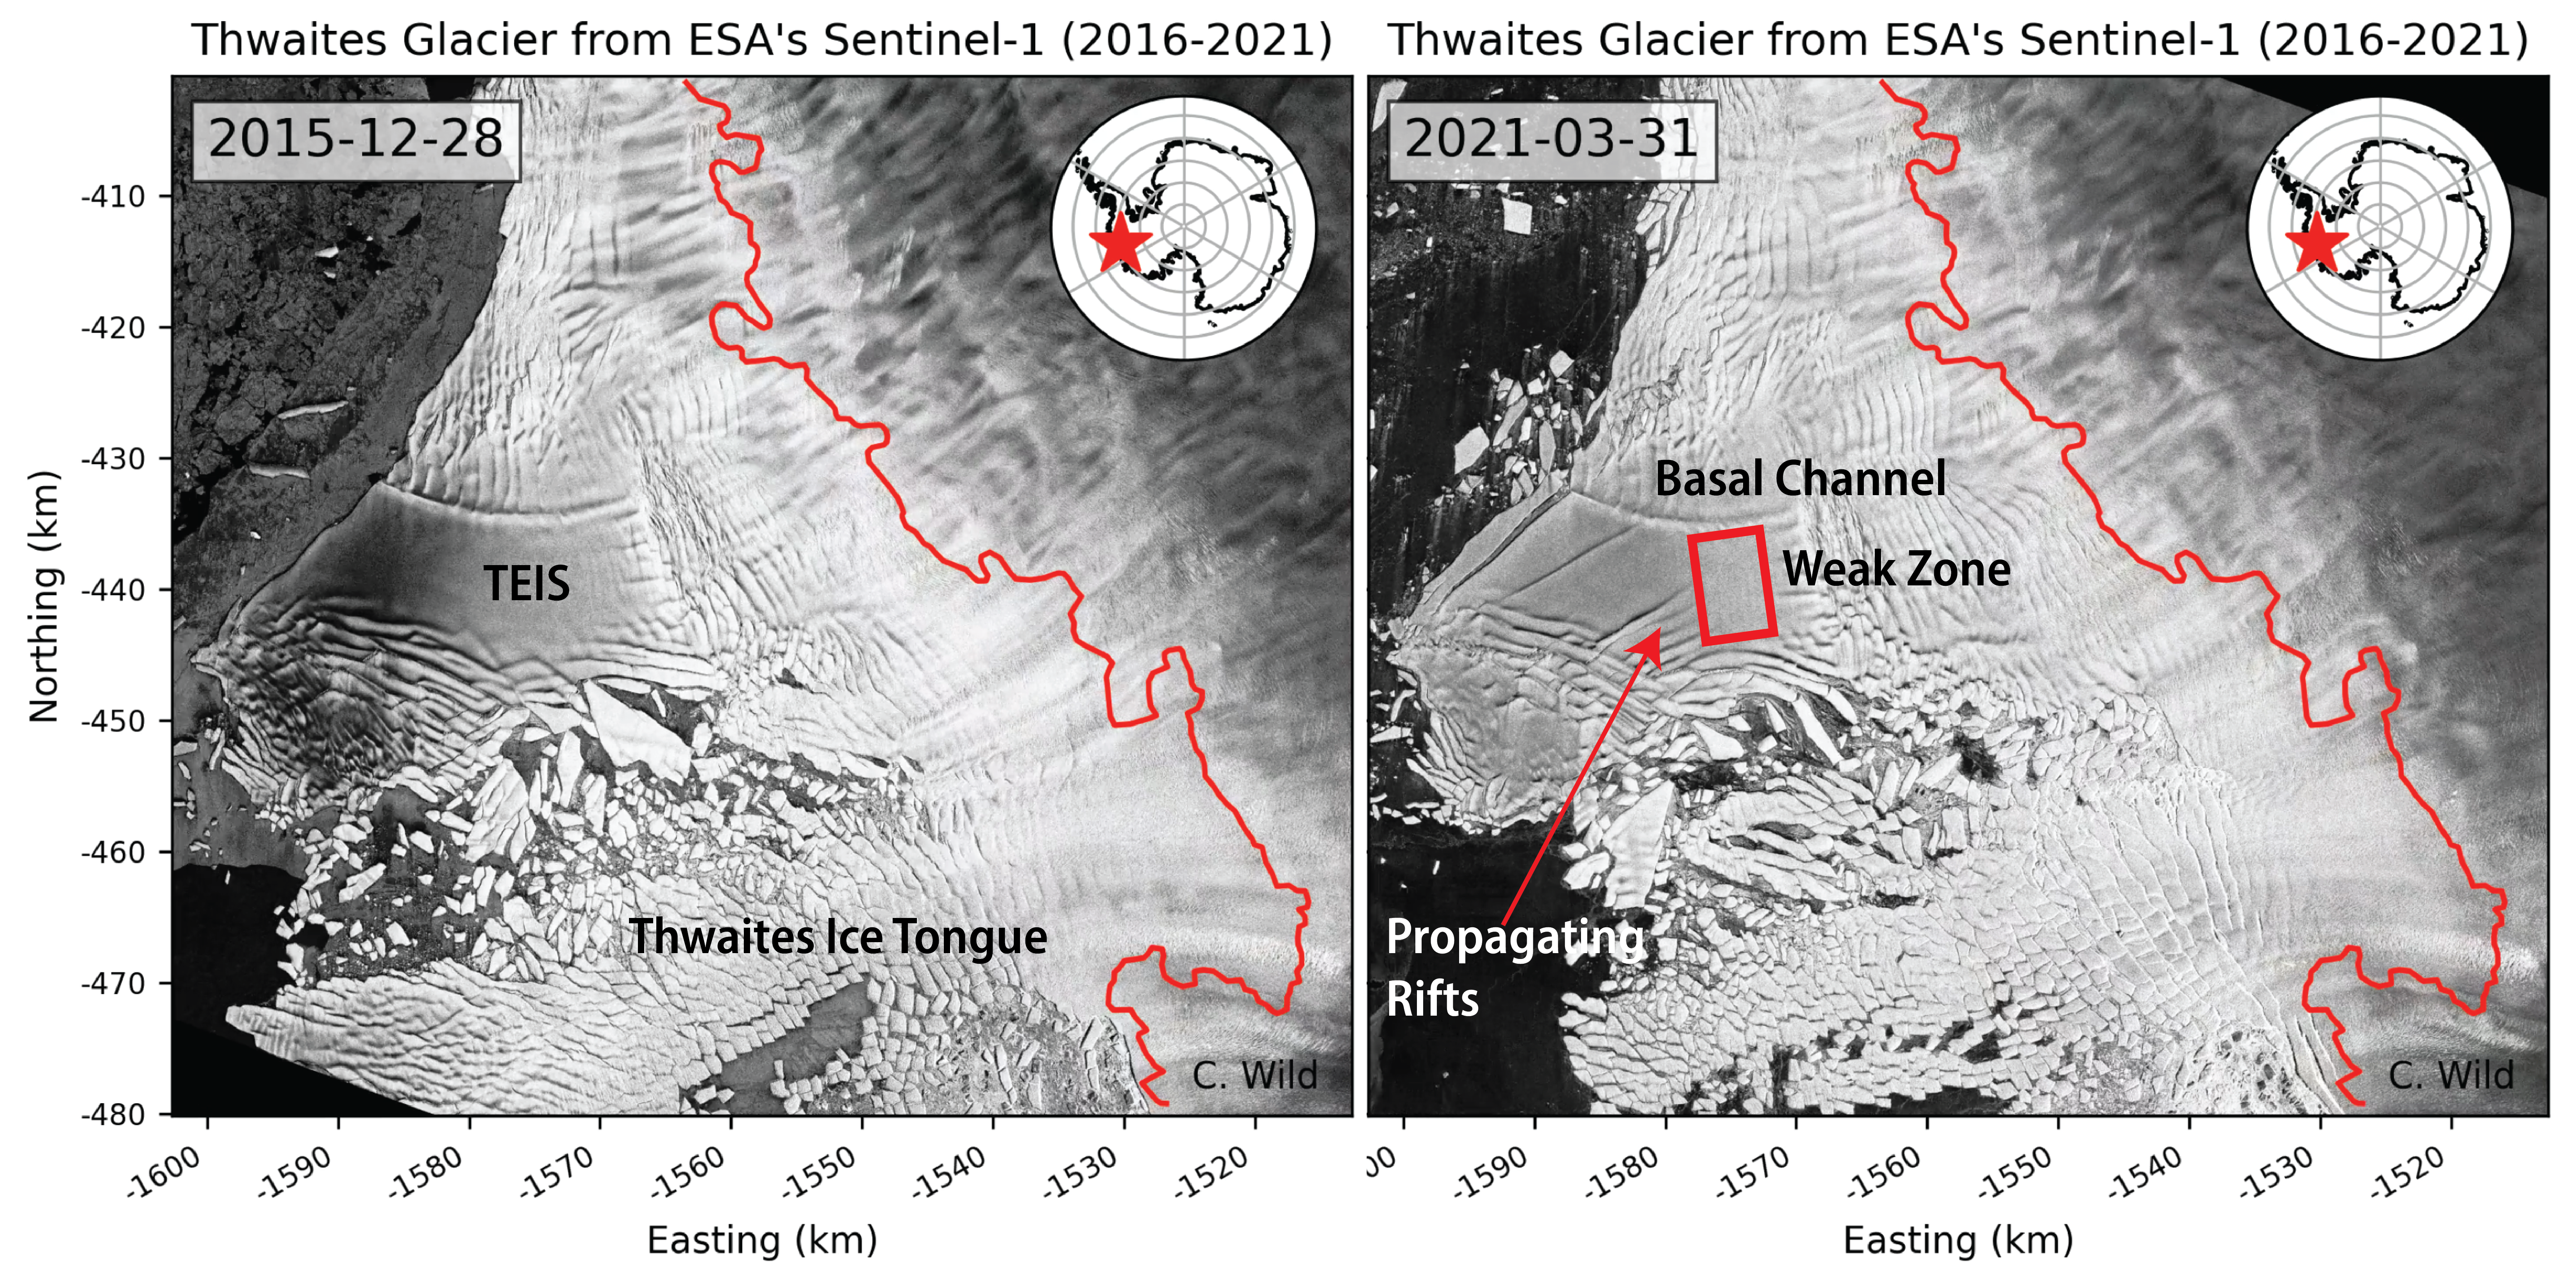
An alarming crackup has begun at the foot of Antarctica’s vulnerable Thwaites Glacier, whose meltwater is already responsible for about 4% of global sea level rise. An ice sheet the size of Florida, Thwaites ends its slide into the ocean as a floating ledge of ice 45 kilometers wide. But now, this ice shelf, riven by newly detected fissures on its surface and underside, is likely to break apart in the next 5 years or so, scientists reported today at a meeting of the American Geophysical Union.
The most dramatic sign of impending failure is a set of diagonal fractures that nearly span the entire shelf. Last month, satellites spotted accelerating movement of ice along the fractures, says Erin Pettit, a glaciologist at Oregon State University, Corvallis, who is part of a multiyear expedition studying the glacier. The shelf is a bit like a windshield with a series of slowly opening cracks, she says. “You’re like, I should get a new windshield. And one day, bang—there are a million other cracks there.”
Here’s an image from the AGU abstract to illustrate the “cracks” Erin referred to:
Image: Christian Wild, Oregon State University
Once the ice shelf shatters, large sections of the glacier now restrained by it are likely to speed up, says Ted Scambos, a glaciologist at the University of Colorado, Boulder, and a leader of the Thwaites expedition. In a worst case, this part of Thwaites could triple in speed, increasing the glacier’s contribution to global sea level in the short term to 5%, Pettit says.
Here is the AGU press conference that caused all the excitement:
It’s not very often that we discuss an article from Watts Up With That with even the vaguest hint of approval in the smoke filled editorial offices at the Great White Con, but here’s the exception that proves the rule! No doubt the fact that allegedly I inspired the article in question is also relevant? Here’s the start of a guest post at WUWT entitled “Polariced Mysteries“, written by our old friend Willis Eschenbach:
I got into a discussion about polar sea ice in the comments to my post Where Is The Climate Emergency?. In the process I noticed some mysteries.
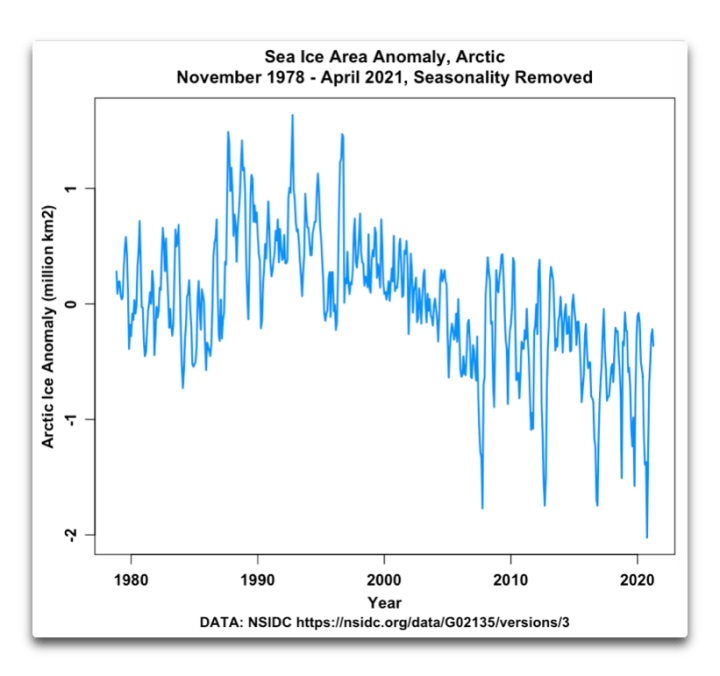
To start with, here’s the Arctic sea ice area record.
The mystery for me in this record is the decade from about 1998 to 2008. There’s very little month-to-month variation in the record over that period, and the ice area is dropping steadily … followed by ~ thirteen years of very large month-to-month variations with little overall change in ice area. Is this real? Is it an artifact? Unknown.
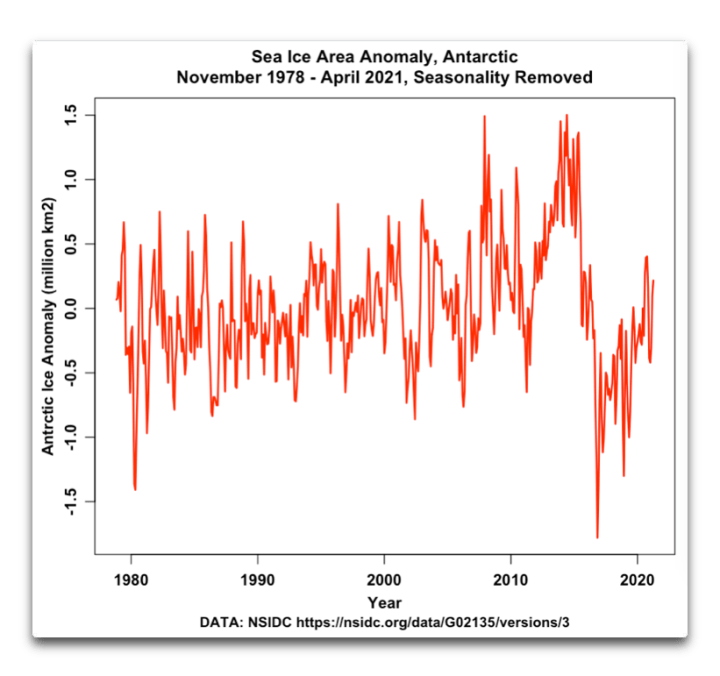
Then we have the Antarctic ice area record …
Here, the obvious mystery is, just what the heck happened around 2015-2017 to cause the Antarctic ice area to drop so precipitously?
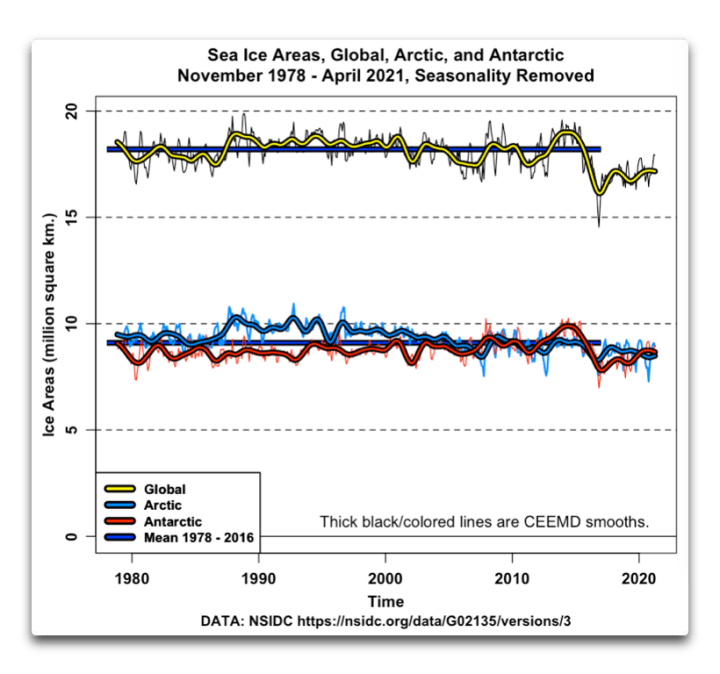
And finally, putting both poles together, we get the following:
etc. etc…
At the North Pole, there is an ocean covered with sea ice. At the South Pole, there’s a high rocky plateau covered with land ice and surrounded by sea ice. Yet despite these totally different situations, the area of sea ice is almost exactly the same at both poles … say what?
I will say that I am overjoyed that the world of climate contains far more mysteries than answers …
“When nothing is for sure, we remain alert, perennially on our toes. It is more exciting not to know which bush the rabbit is hiding behind than to behave as though we knew everything.” —Carlos Castaneda, in The Teachings of Don Juan
My best to all adventurers in this most marvelous universe,
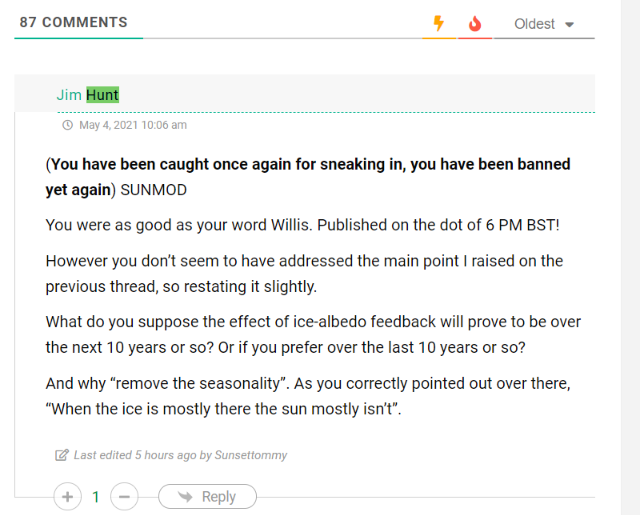
Thanks for your good wishes Willis, but there is a big black fly in the marvellous universal ointment. No sooner had a potentially enlightening discussion begun than darkness descended from on high:
At the risk of repeating myself:
What do you suppose the effect of ice-albedo feedback will prove to be over the next 10 years or so? Or if you prefer over the last 10 years or so?
And why “remove the seasonality”. As you correctly pointed out over there, “When the ice is mostly there the sun mostly isn’t”.
It is perhaps rather early to start speculating about if, and when, the Northwest Passage will become navigable for the host of small vessels eager to traverse it this summer.
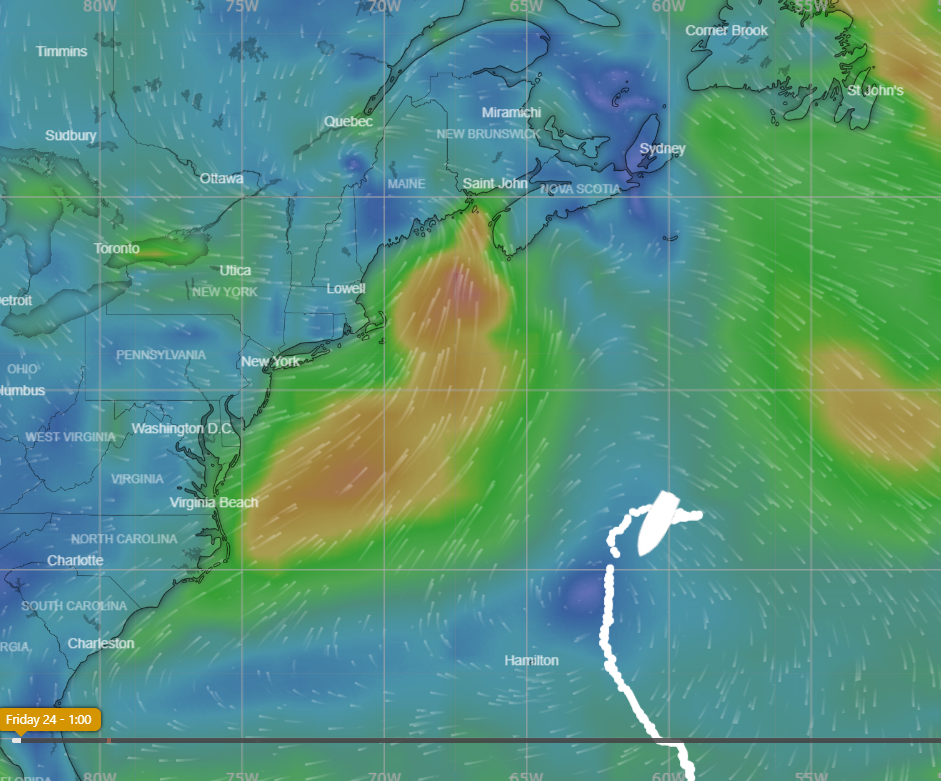
However one such vessel is already en route to the Arctic Circle, so why don’t we take a look at its live tracking map?
Moli (Mo for short) is being piloted singlehandedly by Randall Reeves, who has already circumnavigated Antarctica and is hell bent on circumnavigating America too!
According to Randall’s last but one update he’ll be stopping in St. Johns before heading for the Arctic Circle:
“Have you explained why your first stop is St John’s?” asked a friend recently, “Not New York, Boston, Camden, Lunenberg, Halifax, to name just, well, five?”
It is a good question, and the answer is simple: I never considered going anywhere else because a) St John’s is decidedly on the Figure 8 route and b) it has the required marine facilities and big grocery stores. And did I mention, it’s right on the route?
Actually, I did flirt briefly with the idea of Boston, thinking that goods there would be cheaper and marine facilities, more diverse. And though it does save some 500 miles of sailing on this inbound leg, Boston is so far west that it adds 1,000 miles to the leg up to the Arctic. So, I’ve decided to stick to the most logical stop.
St. John’s is less than a thousand miles north now. In any worthy wind, we’d be there before the end of the month. But when your average speed is 3.9 knots…you don’t do the when-do-we-make-port math.
Interestingly the background to Moli’s live tracking map is from Windy.com.
[Edit – June 10th]
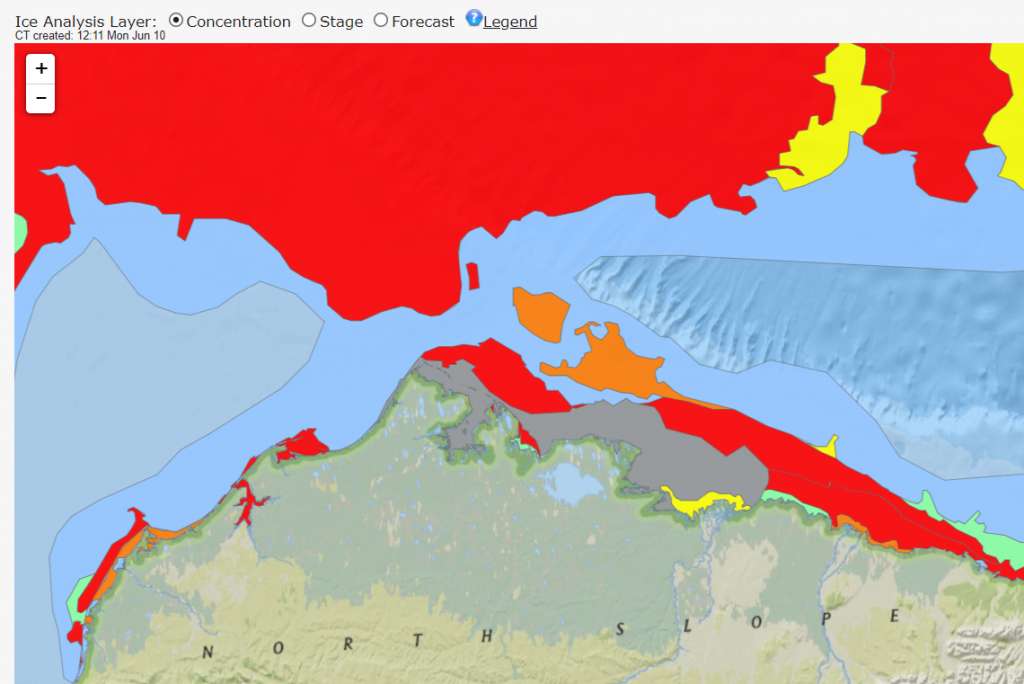
It’s very early in the melting season to be reporting on this event, but any early bird traversing the Northwest Passage from west to east could now sail through open water around Point Barrow, along the Alaskan and Canadian coast and into the Amundsen Gulf. Here’s the latest sea ice concentration chart for Alaskan waters from the US National Weather Service:
Whilst we’re here why don’t we take a look at how Randall is getting along in Moli. According to his latest blog post he is now in Halifax scraping barnacles off Moli’s bottom!
On Friday, June 8, day 245 of the Figure 8 Voyage, I hauled Mo here at the Royal Nova Scotia Yacht Squadron. My expectations were that the bum would be nearly spotless. Instead, we had a new crop of hitchhikers coming in at the base of those older barnacles that remained.
Lessons Learned: “There is no good bottom paint for aluminum boats,” says my friend, fellow cruiser, and aluminum boat builder, Gerd Marggraff. Prior to departure, I had applied three generous coats of a bottom paint known specifically to ward off hard growth, but barnacles are superior beings, able to penetrate even the best defenses.
An early jump. I might have had an easier time of it if I’d dived the hull before the first Cape Horn rounding, when the barnacles were young and few.
In hindsight, I think I could have dived the hull with some success, even when the barnacles had matured into a reef. I found here in the yard that the “hold fast” (the glue that holds the barnacle fast to the hull) was easier to remove with a sharpened spatula than I had thought. It would have been a big job, taking a full day or more–but not impossible.
[Edit – June 15th]
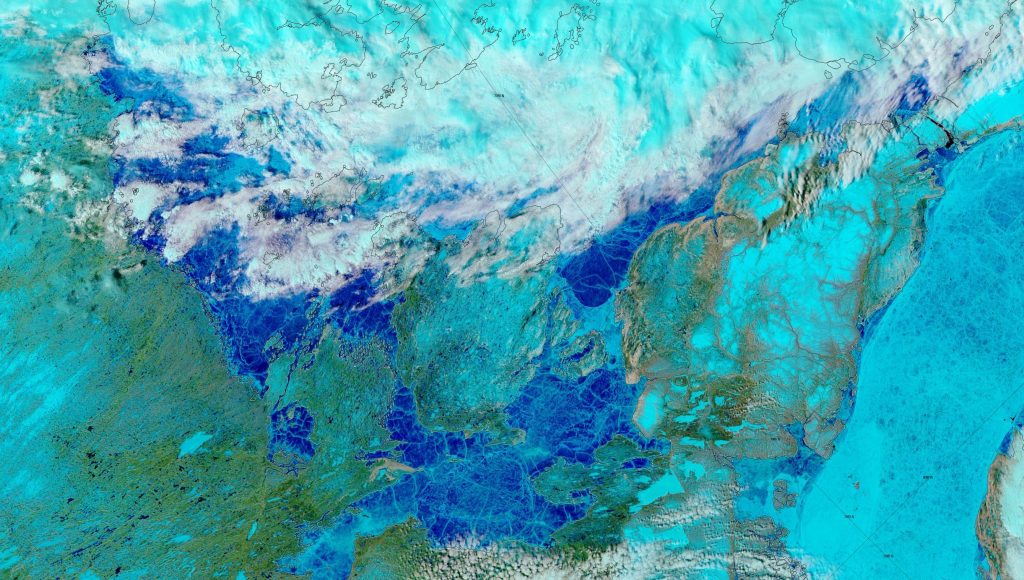
Delving deeper into the Canadian Arctic Archipelago, the clouds have cleared over “Amundsen’s Route” through the Northwest Passage to reveal extensive melt ponding:
NASA Worldview “false-color” image of the Northwest Passage on June 14th 2019, derived from the MODIS sensor on the Terra satellite
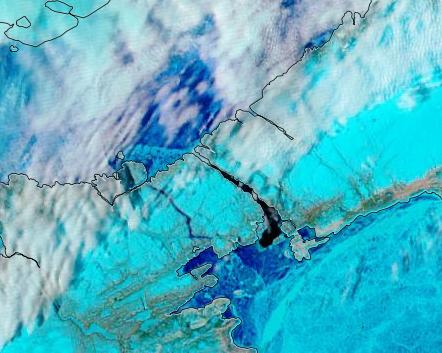
Bellot Strait appears to be largely free of sea ice already:
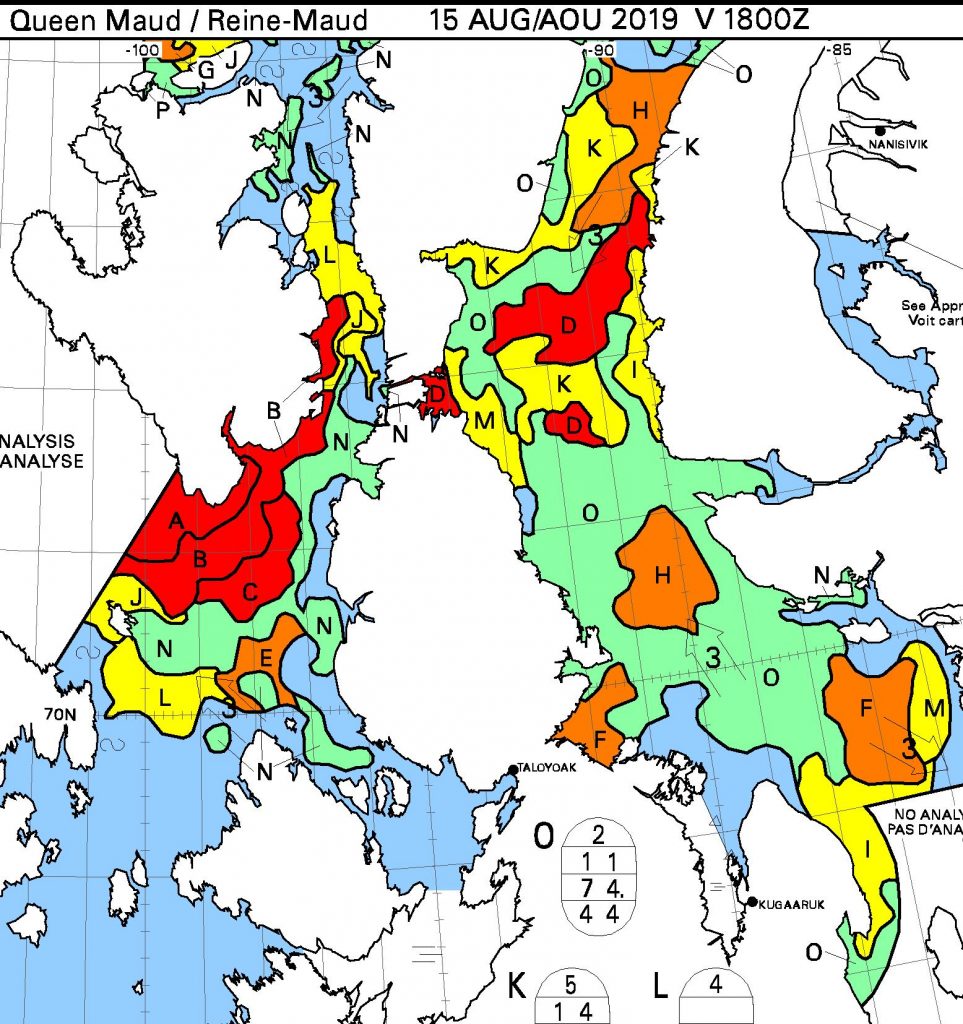
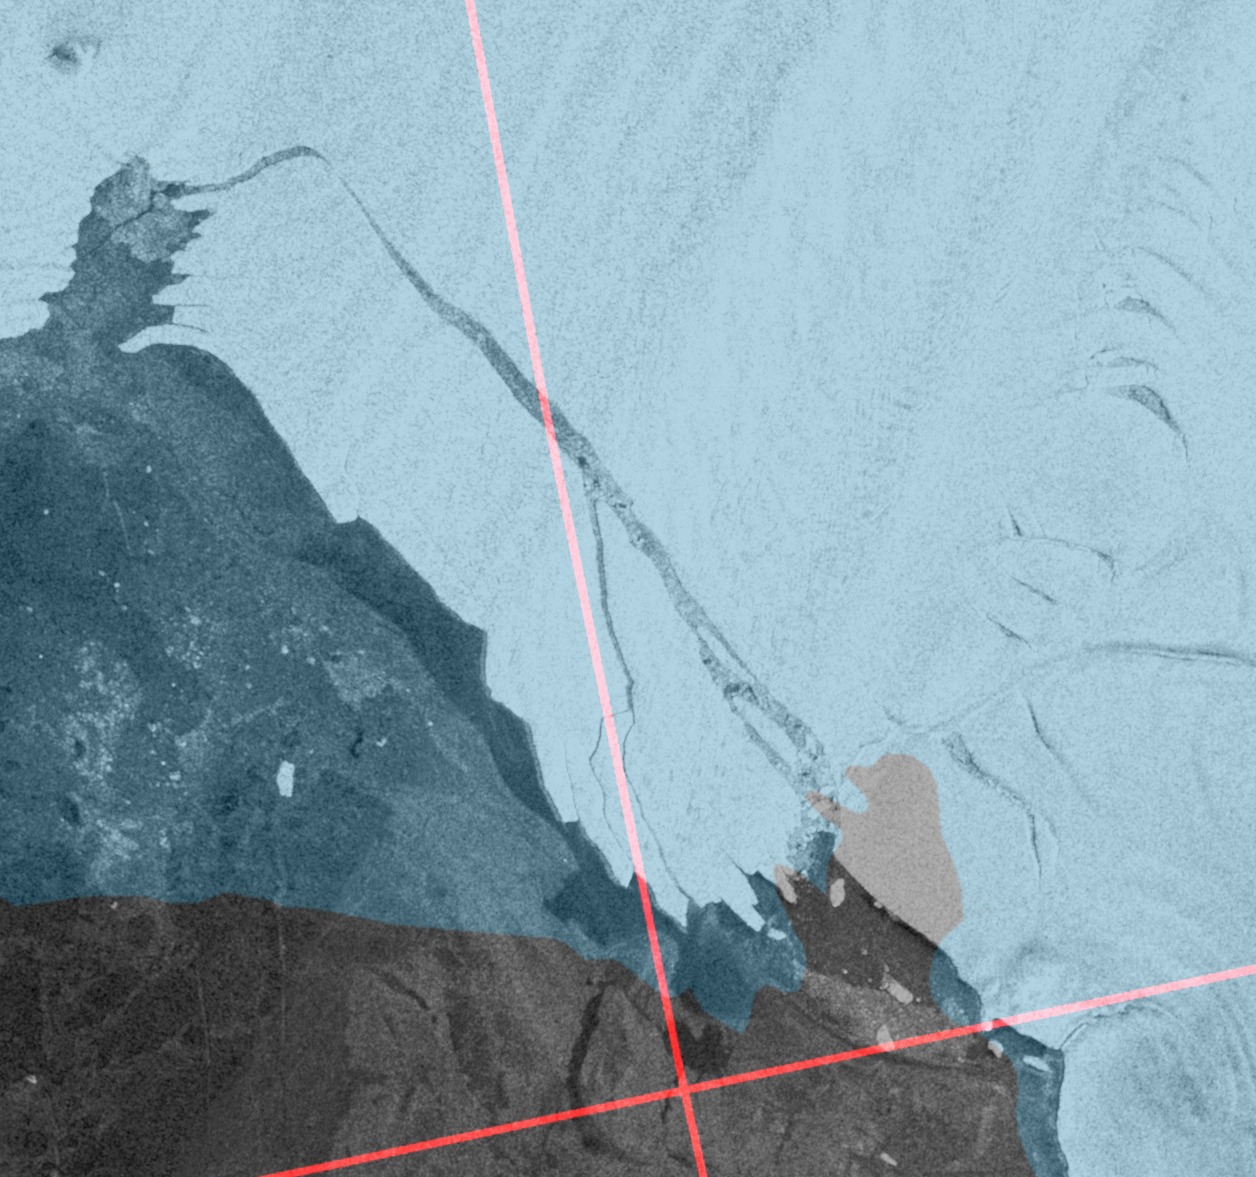
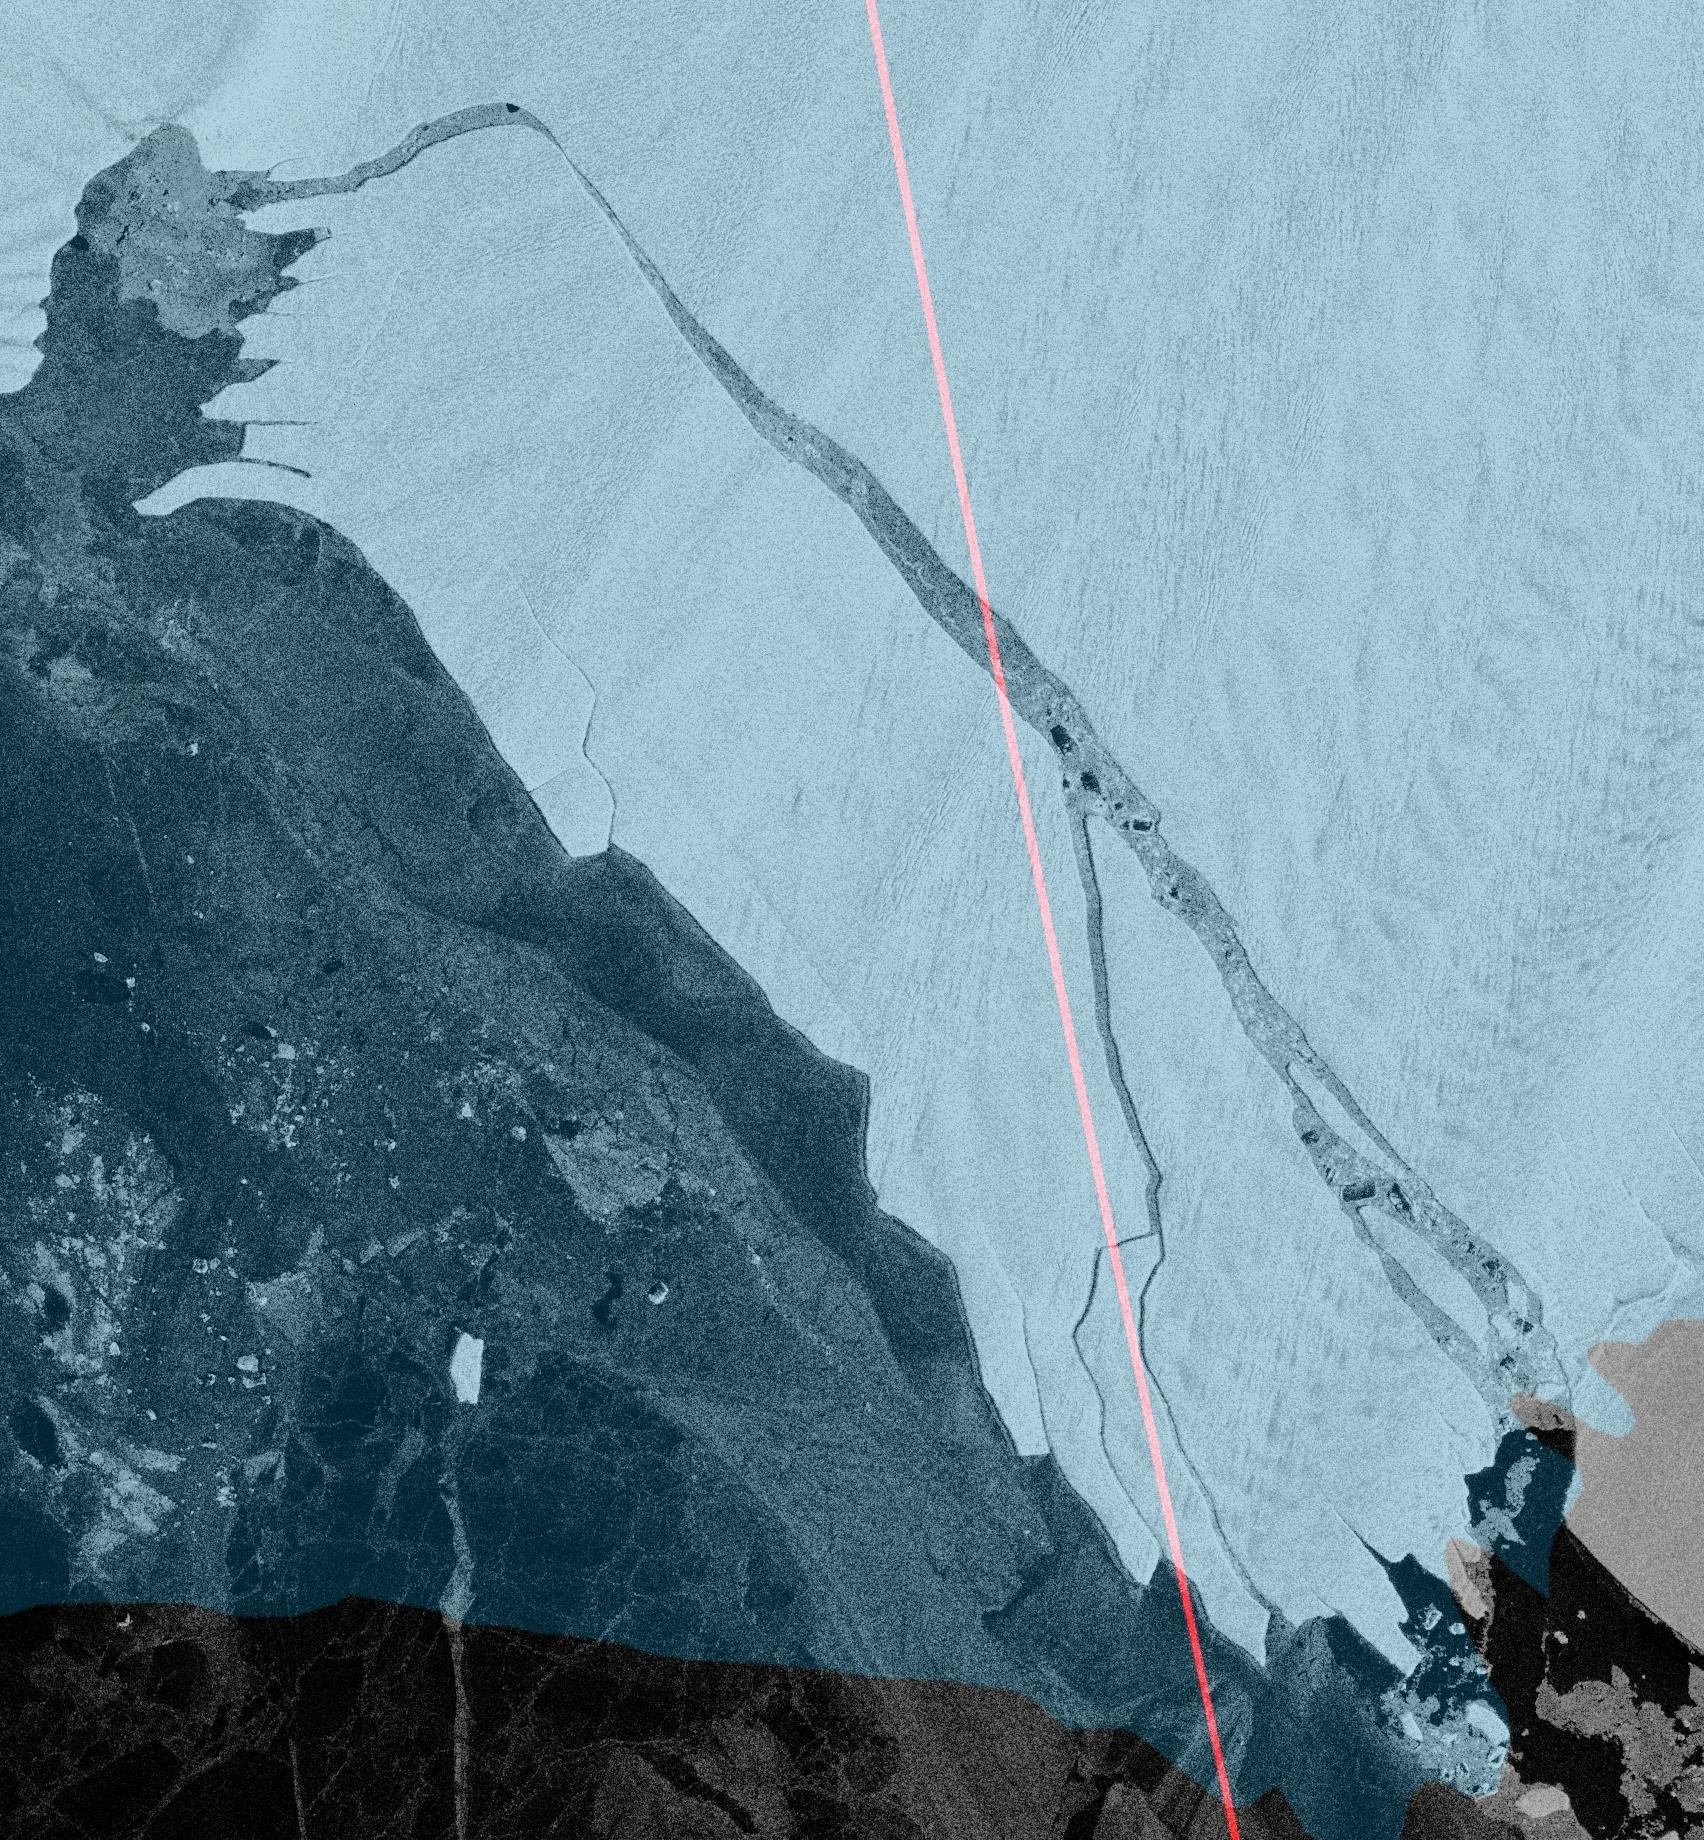
[Edit – August 16th]
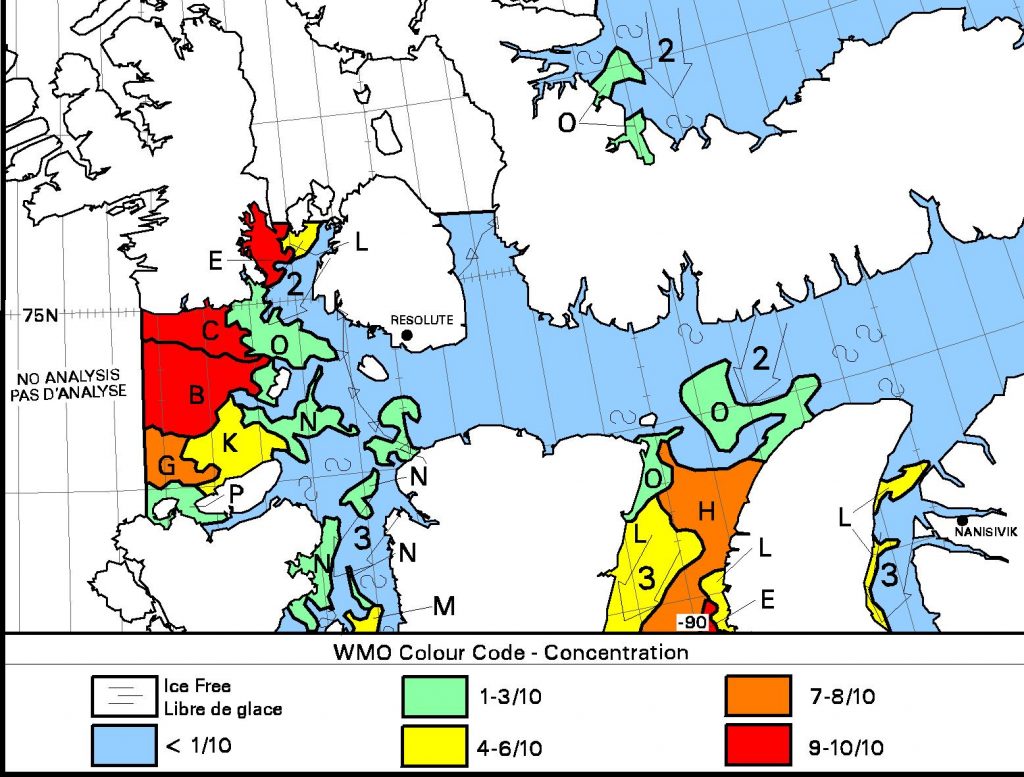
After a tense wait Bellot Strait has recently become blocked by 9/10 concentration sea ice but the southern route through the Northwest Passage via Peel Sound is now open to any vessel willing to cope with 6/10 concentration or less:
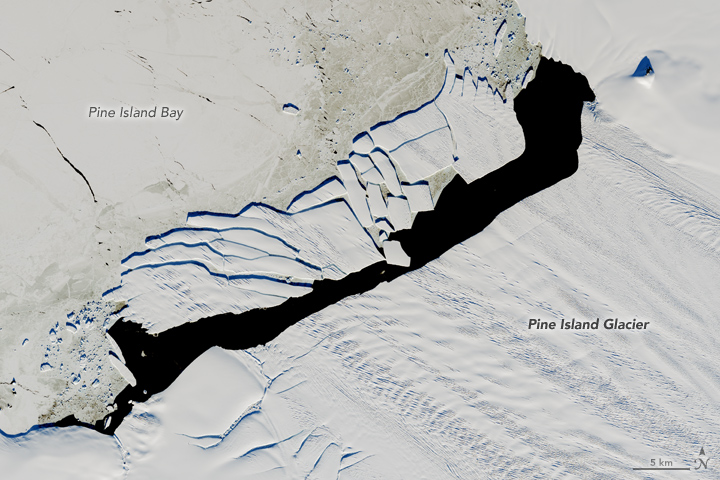
An image captured earlier this morning by the Sentinel 1A satellite’s synthetic aperture radar reveals that another huge chunk of the Pine Island Glacier in Antarctica has broken loose:
.@NASAEarth 's MODIS satellite gives an overview of #PIG's glacier front location since 2009 + corresponding 3 major calving locations 7/n pic.twitter.com/miP1RAUCBF
In September 2017, a new iceberg calved from Pine Island Glacier—one of the main outlets where the West Antarctic Ice Sheet flows into the ocean. Just weeks later, the berg named B-44 shattered into more than 20 fragments.
On December 15, 2017, the Operational Land Imager (OLI) on Landsat 8 acquired this natural-color image of the broken berg. An area of relatively warm water, known as a polyna, has kept the water ice free between the iceberg chunks and the glacier front. NASA glaciologist Chris Shuman thinks the polynya’s warm water could have caused the rapid breakup of B-44.
The image was acquired near midnight local time. Based on parameters including the azimuth of the Sun and its elevation above the horizon, as well as the length of the shadows, Shuman has estimated that the iceberg rises about 49 meters above the water line. That would put the total thickness of the berg—above and below the water surface—at about 315 meters.
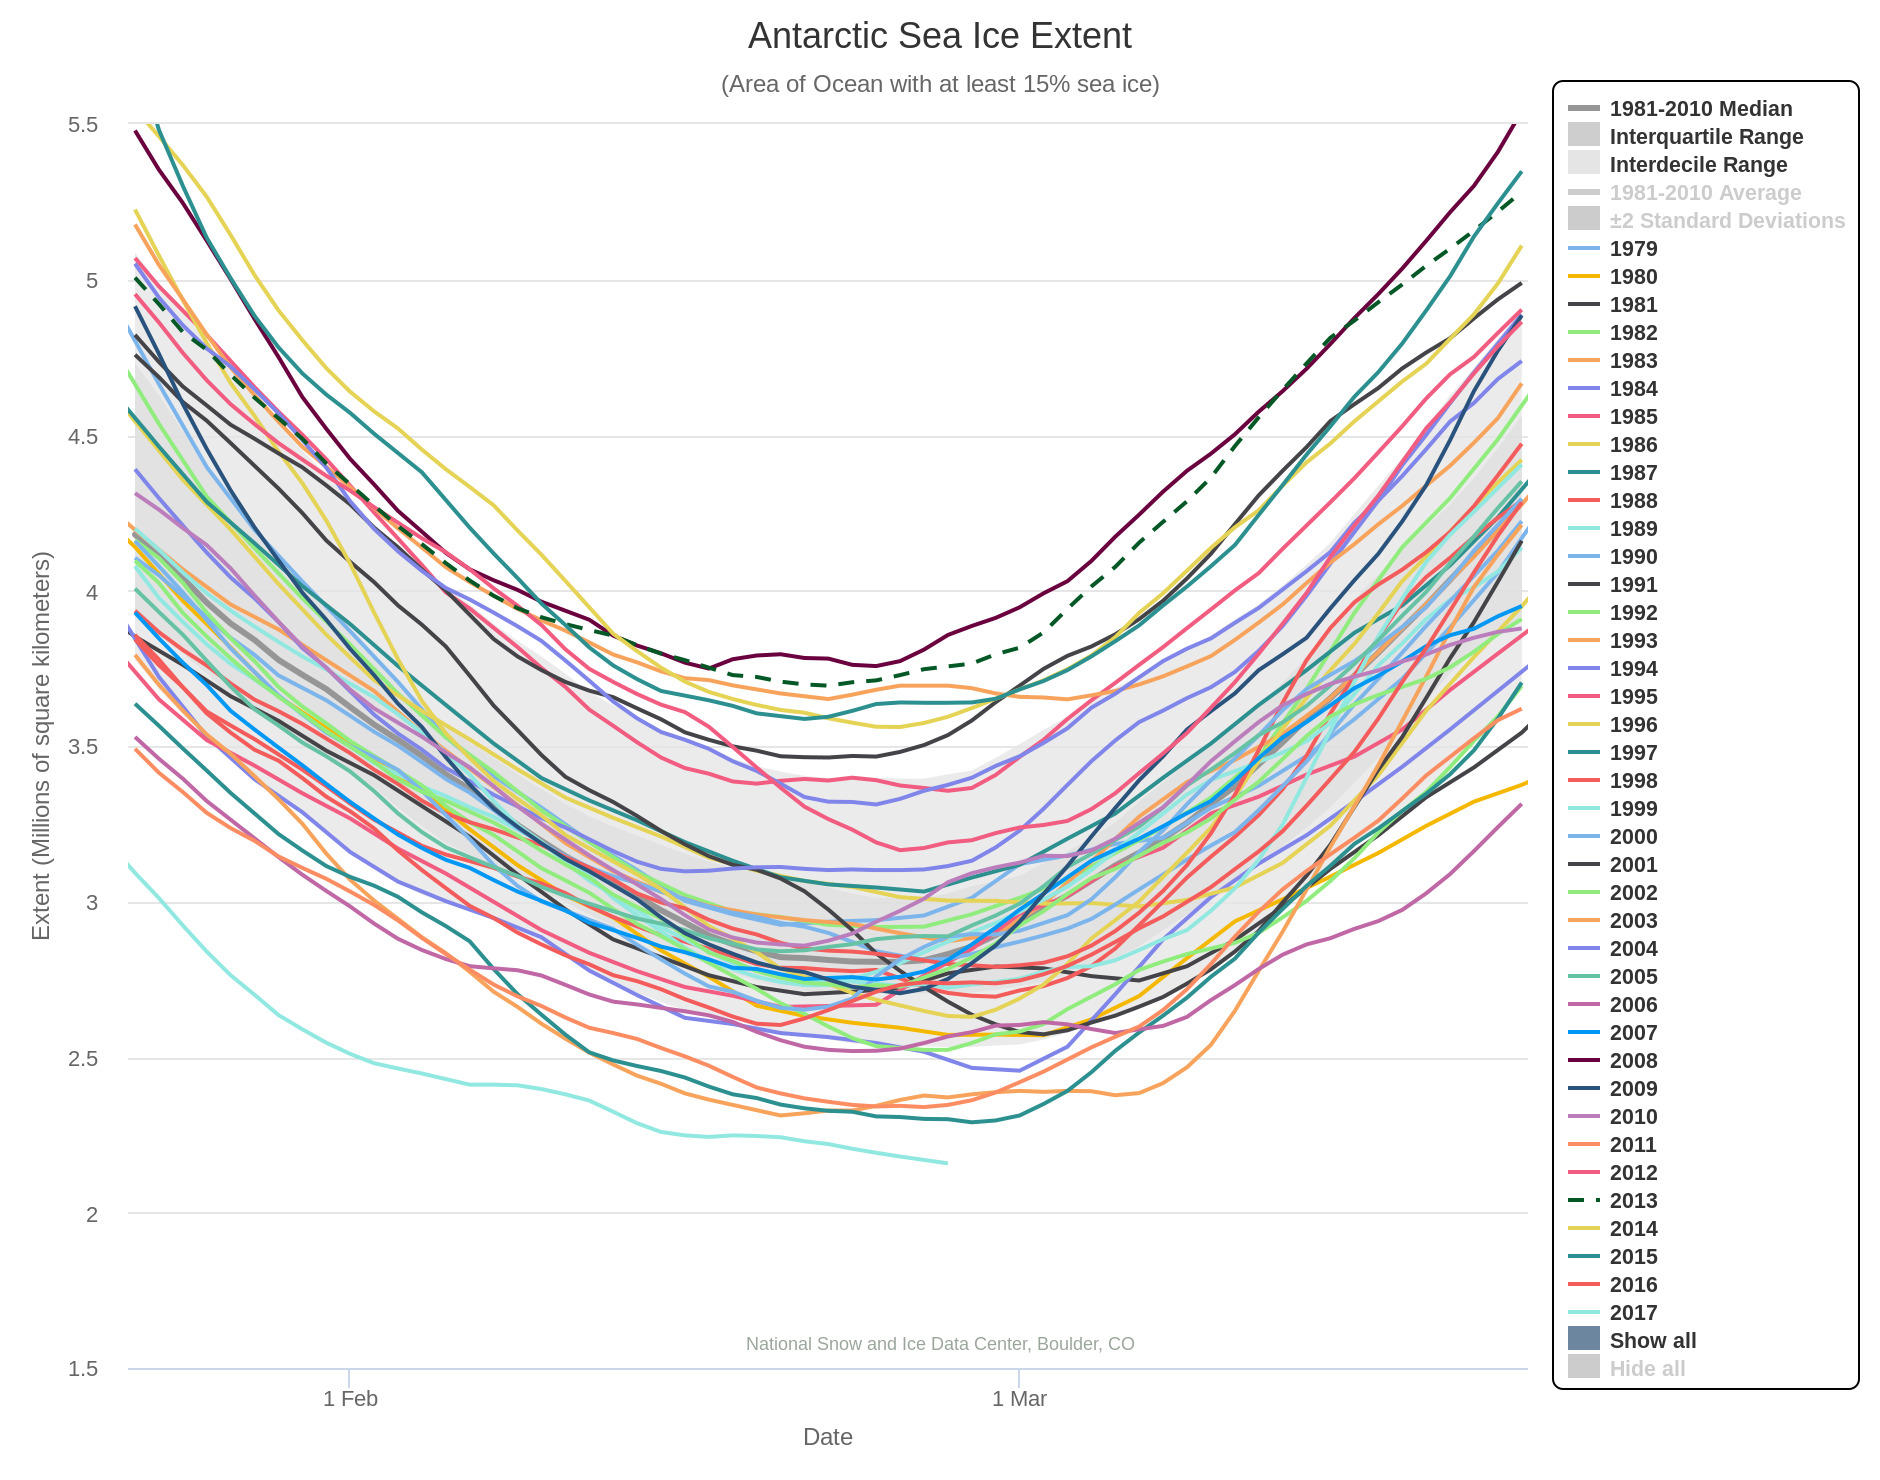
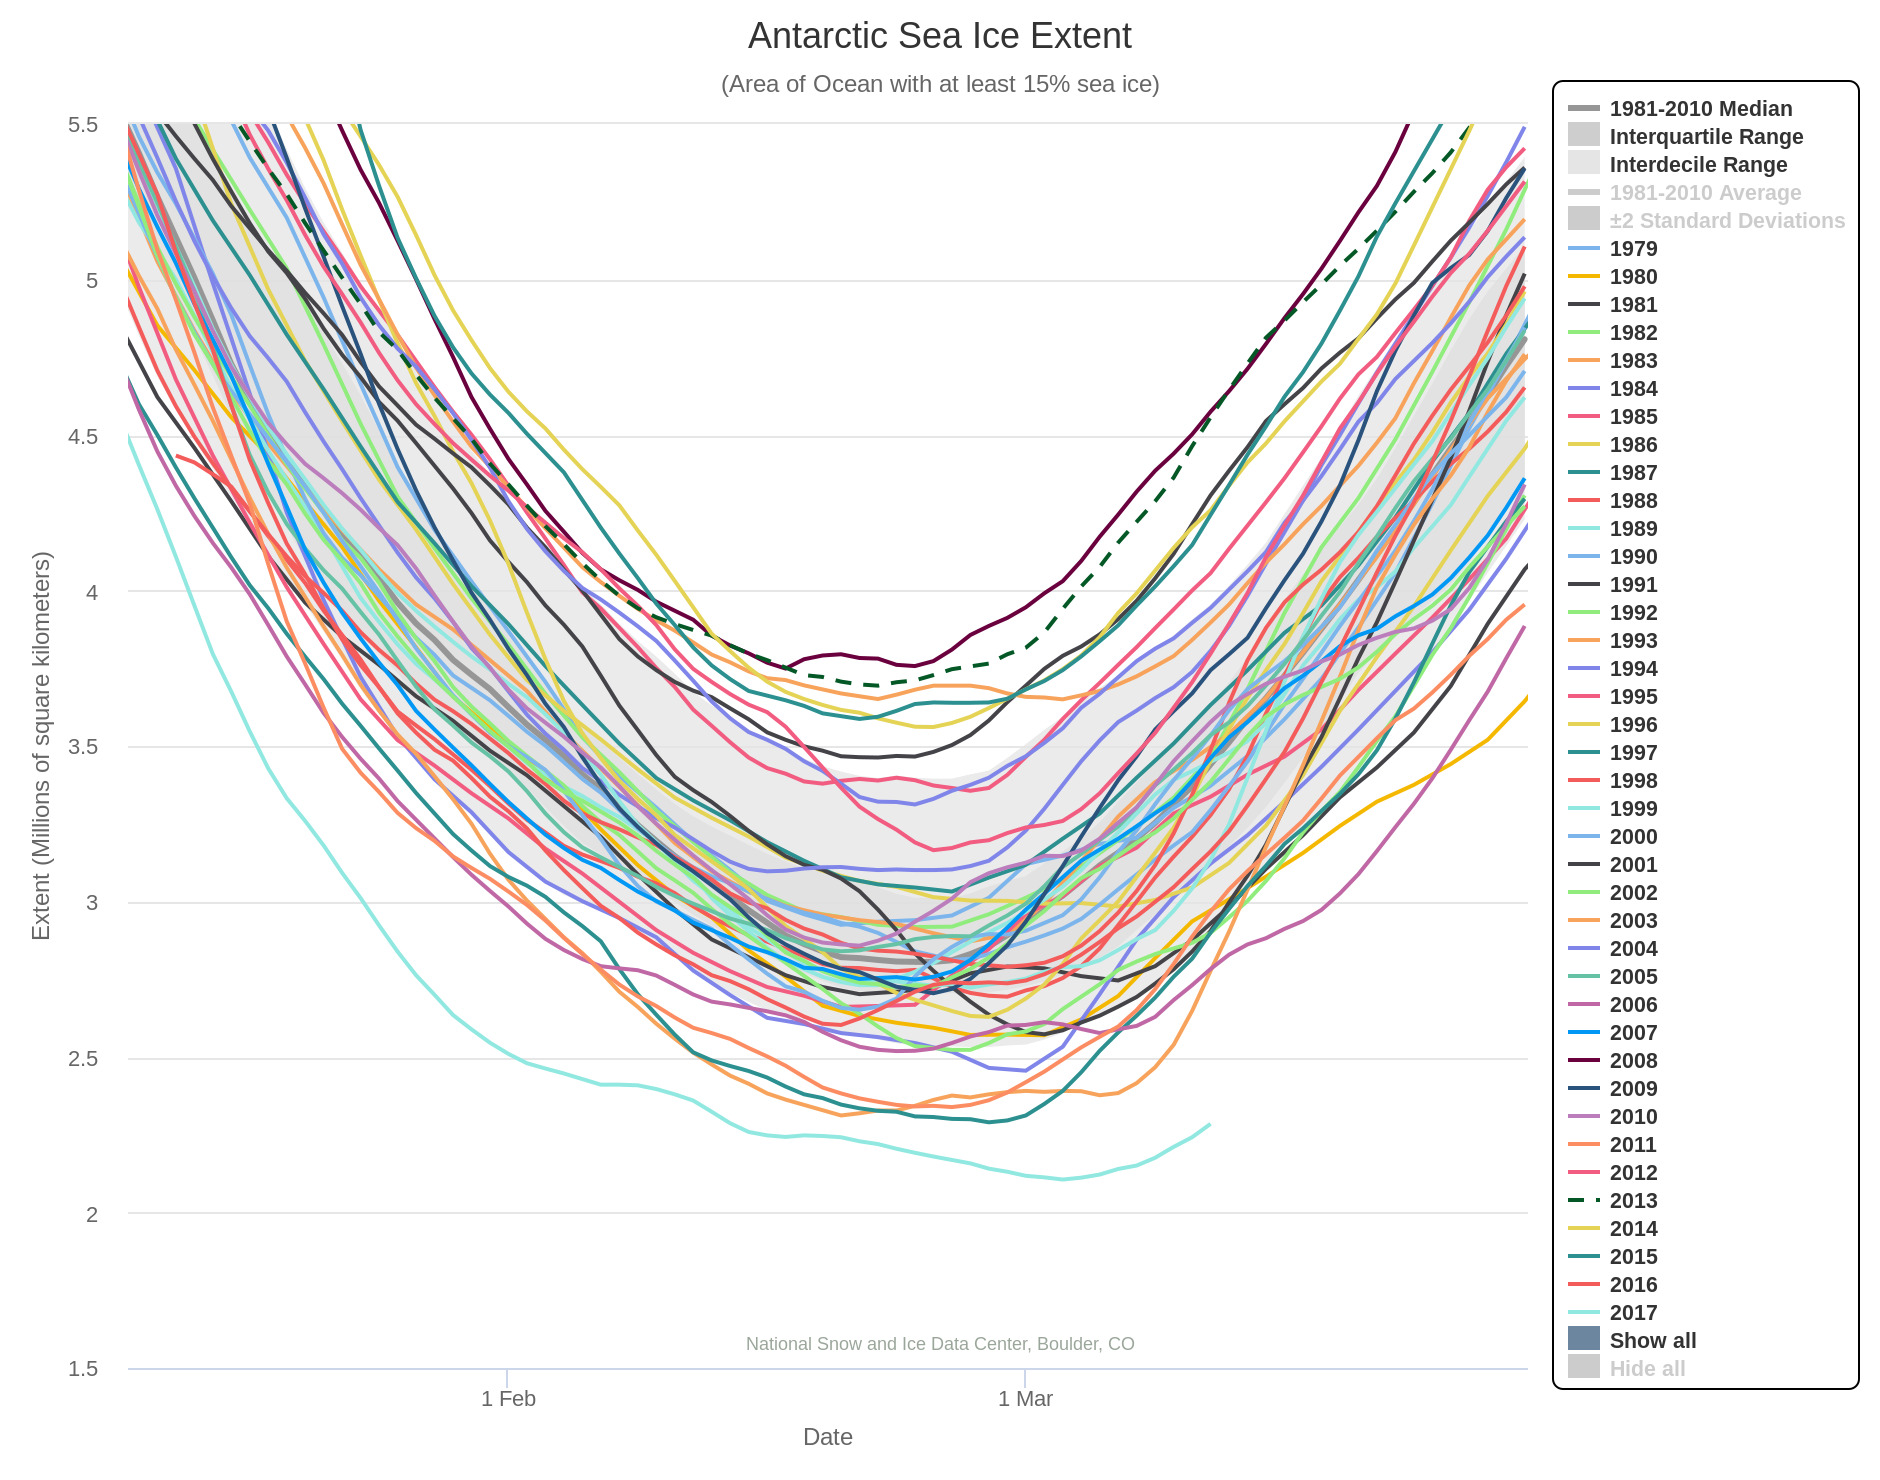
In 2017 Antarctic sea ice extent is beating all the records. All flavours of the metric are already below the minimum of all previous years in the satellite record, and it looks like there’s still some more melting left to go. Here’s the NSIDC’s 5 day averaged extent:
It seems highly likely that the 2017 Antarctic sea ice minimum extent has now been reached. Here’s the NSIDC 5 day averaged extent graph:
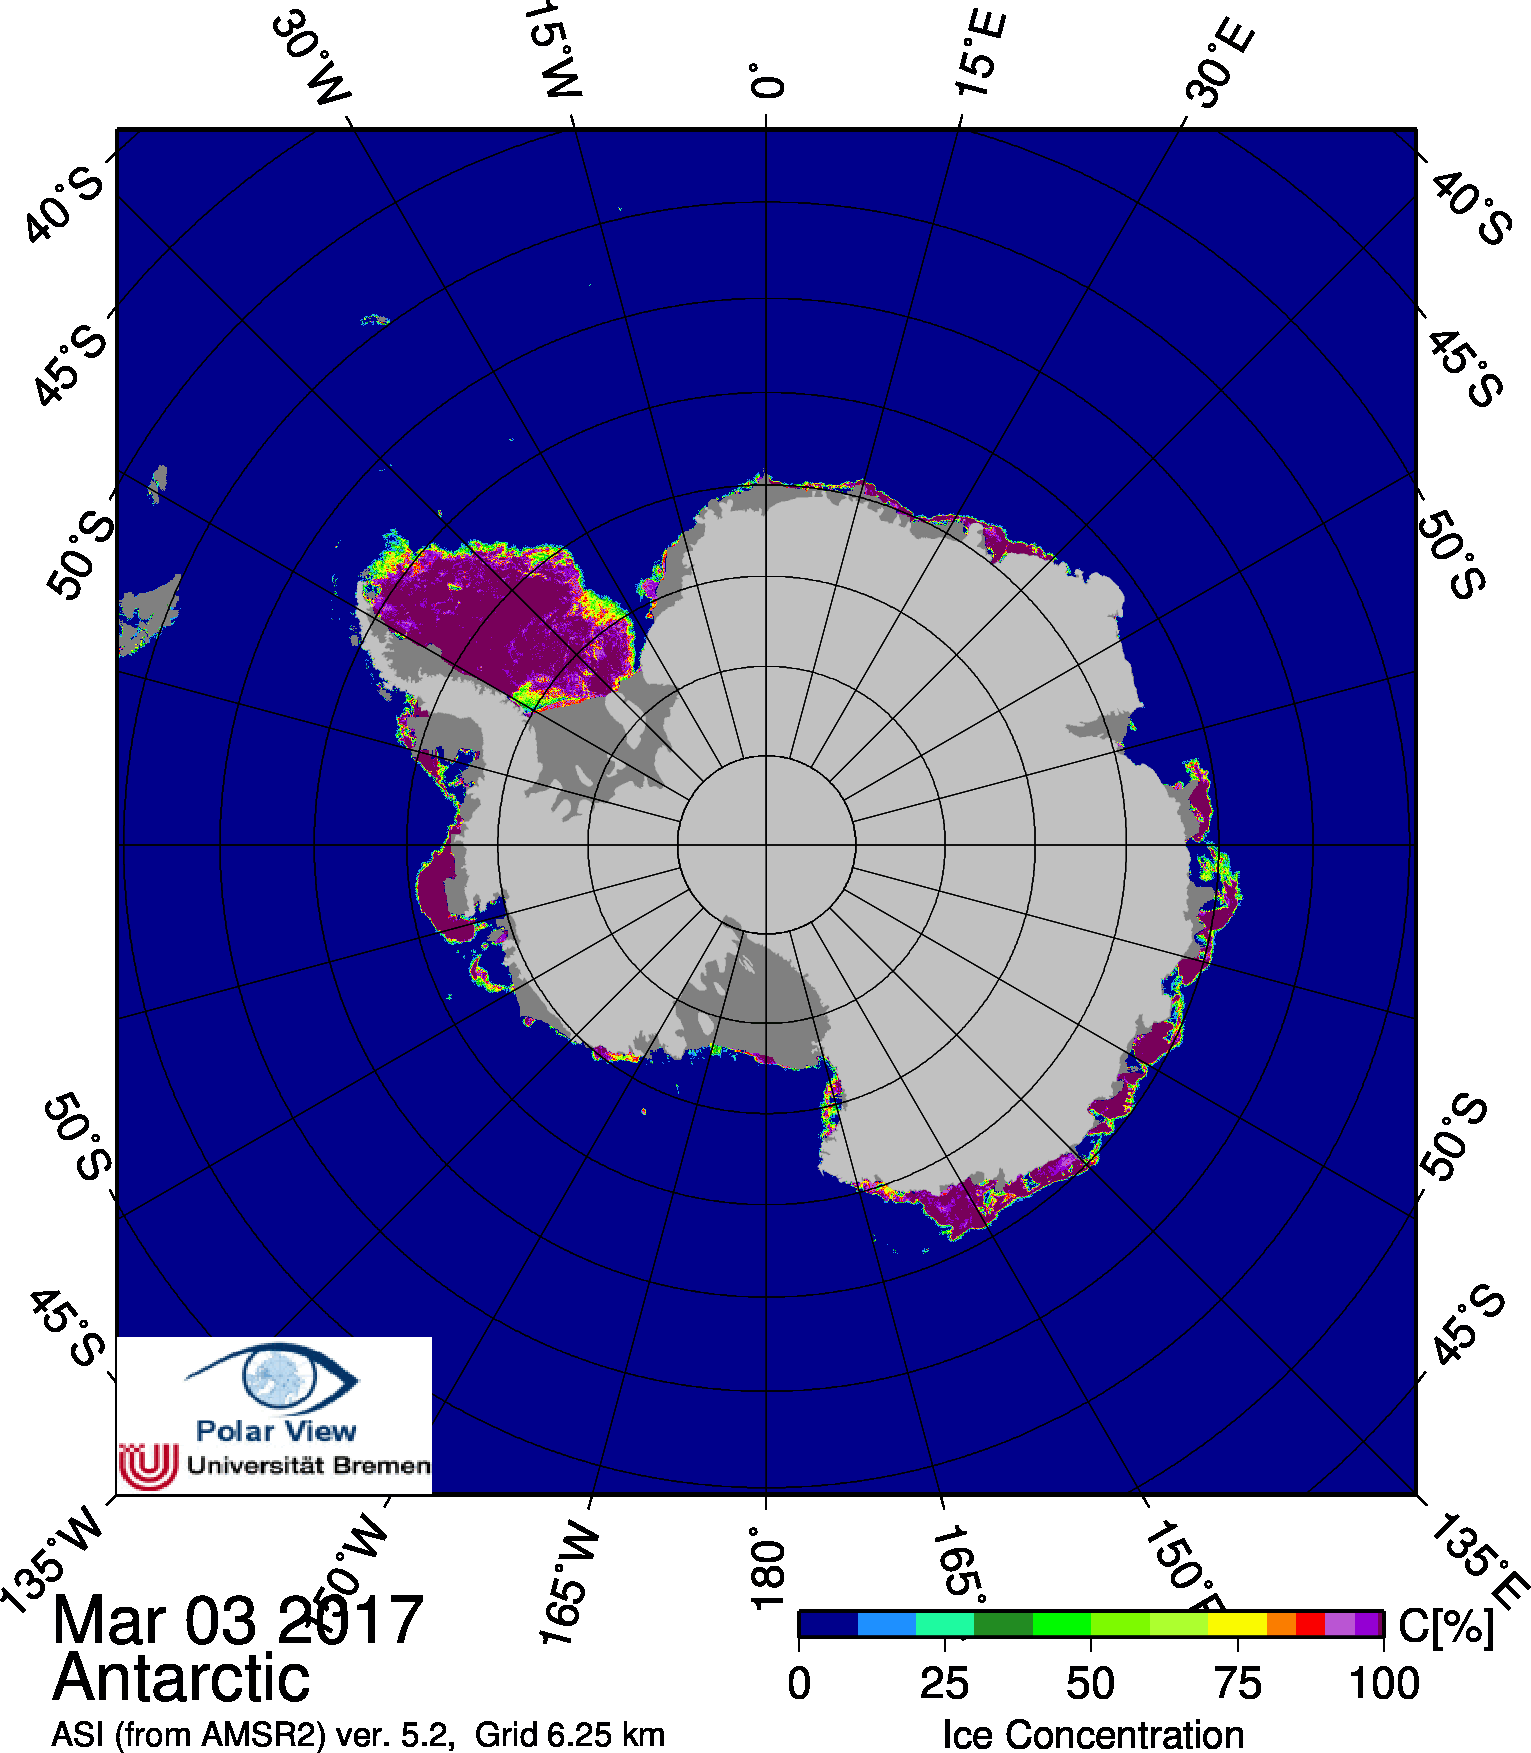
The minimum extent of 2.106 million square kilometers was reached on March 3rd. Here’s the University of Bremen’s Antarctic sea ice concentration map for March 3rd:
This website uses cookies to improve your experience. We'll assume you're ok with this, but you can opt-out if you wish. Cookie settingsACCEPT
Privacy & Cookies Policy
Privacy Overview
This website uses cookies to improve your experience while you navigate through the website. Out of these, the cookies that are categorized as necessary are stored on your browser as they are essential for the working of basic functionalities of the website. We also use third-party cookies that help us analyze and understand how you use this website. These cookies will be stored in your browser only with your consent. You also have the option to opt-out of these cookies. But opting out of some of these cookies may affect your browsing experience.
Necessary cookies are absolutely essential for the website to function properly. This category only includes cookies that ensures basic functionalities and security features of the website. These cookies do not store any personal information.
Any cookies that may not be particularly necessary for the website to function and is used specifically to collect user personal data via analytics, ads, other embedded contents are termed as non-necessary cookies. It is mandatory to procure user consent prior to running these cookies on your website.