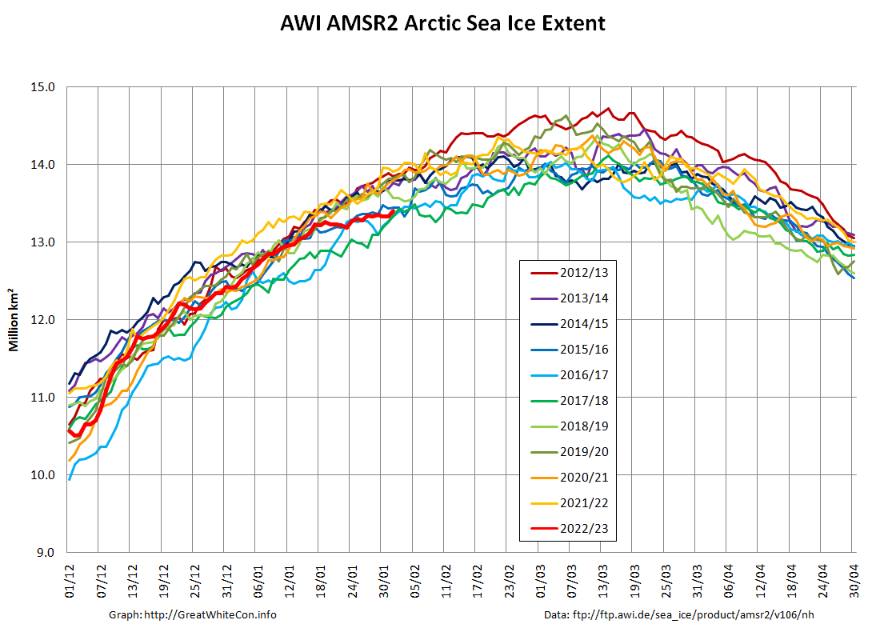
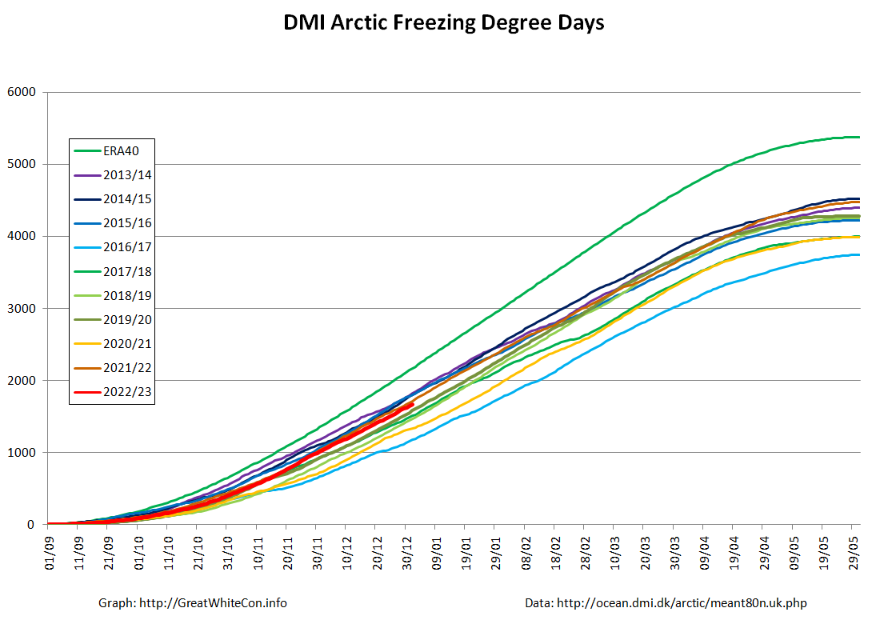
March has arrived, so it’s time to start taking a serious look at where and when the 2023 maximum Arctic sea ice extent will occur.
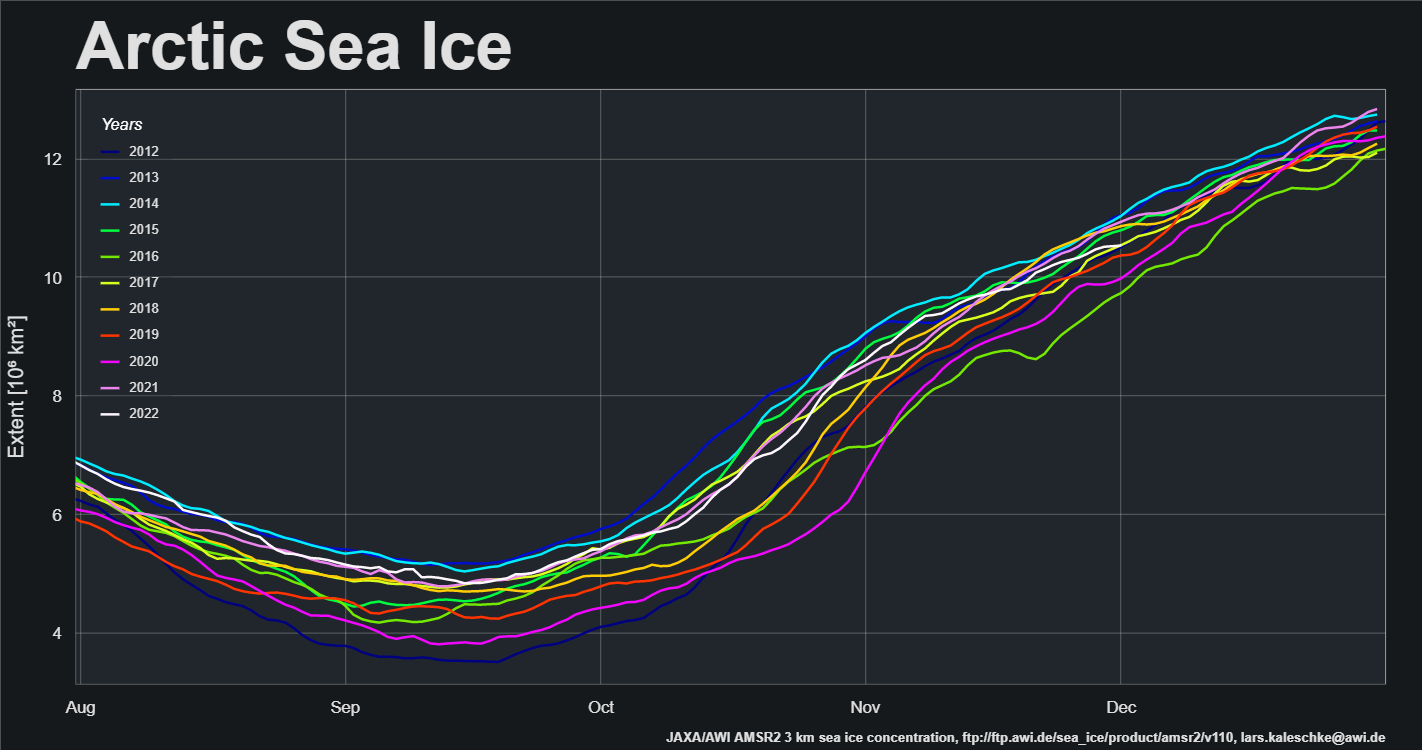
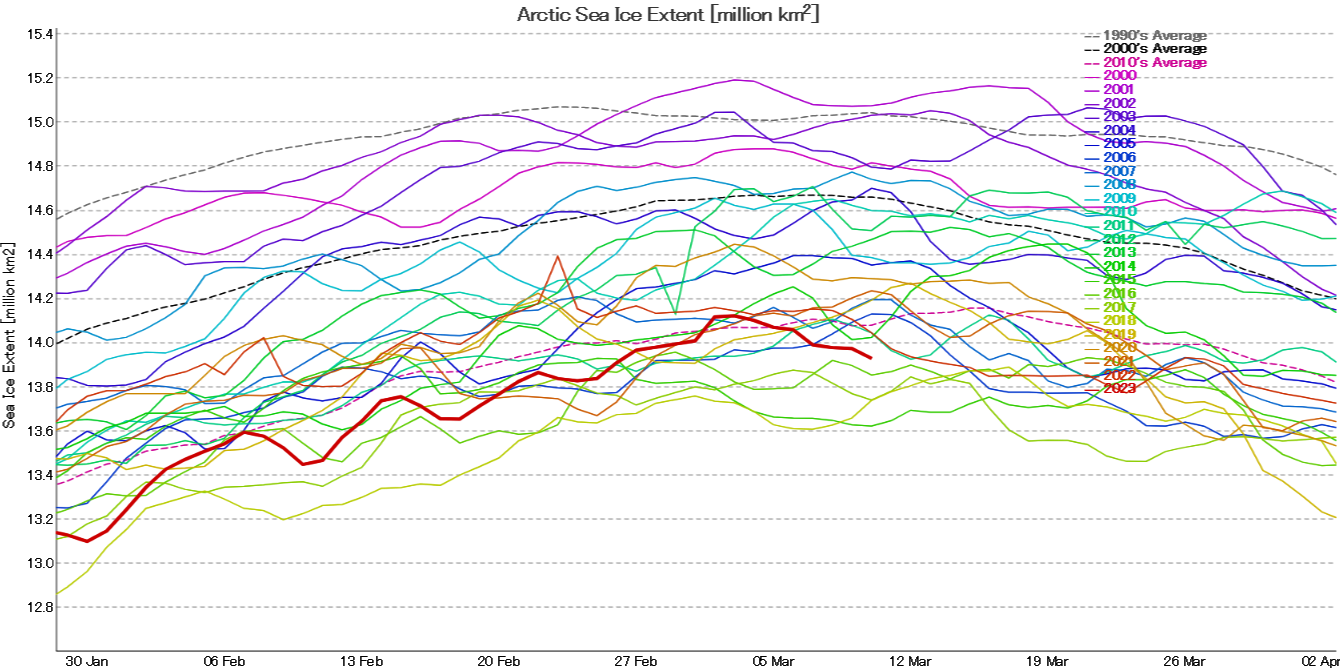
To start with here’s Zack Labe’s overview of previous years’ maxima:
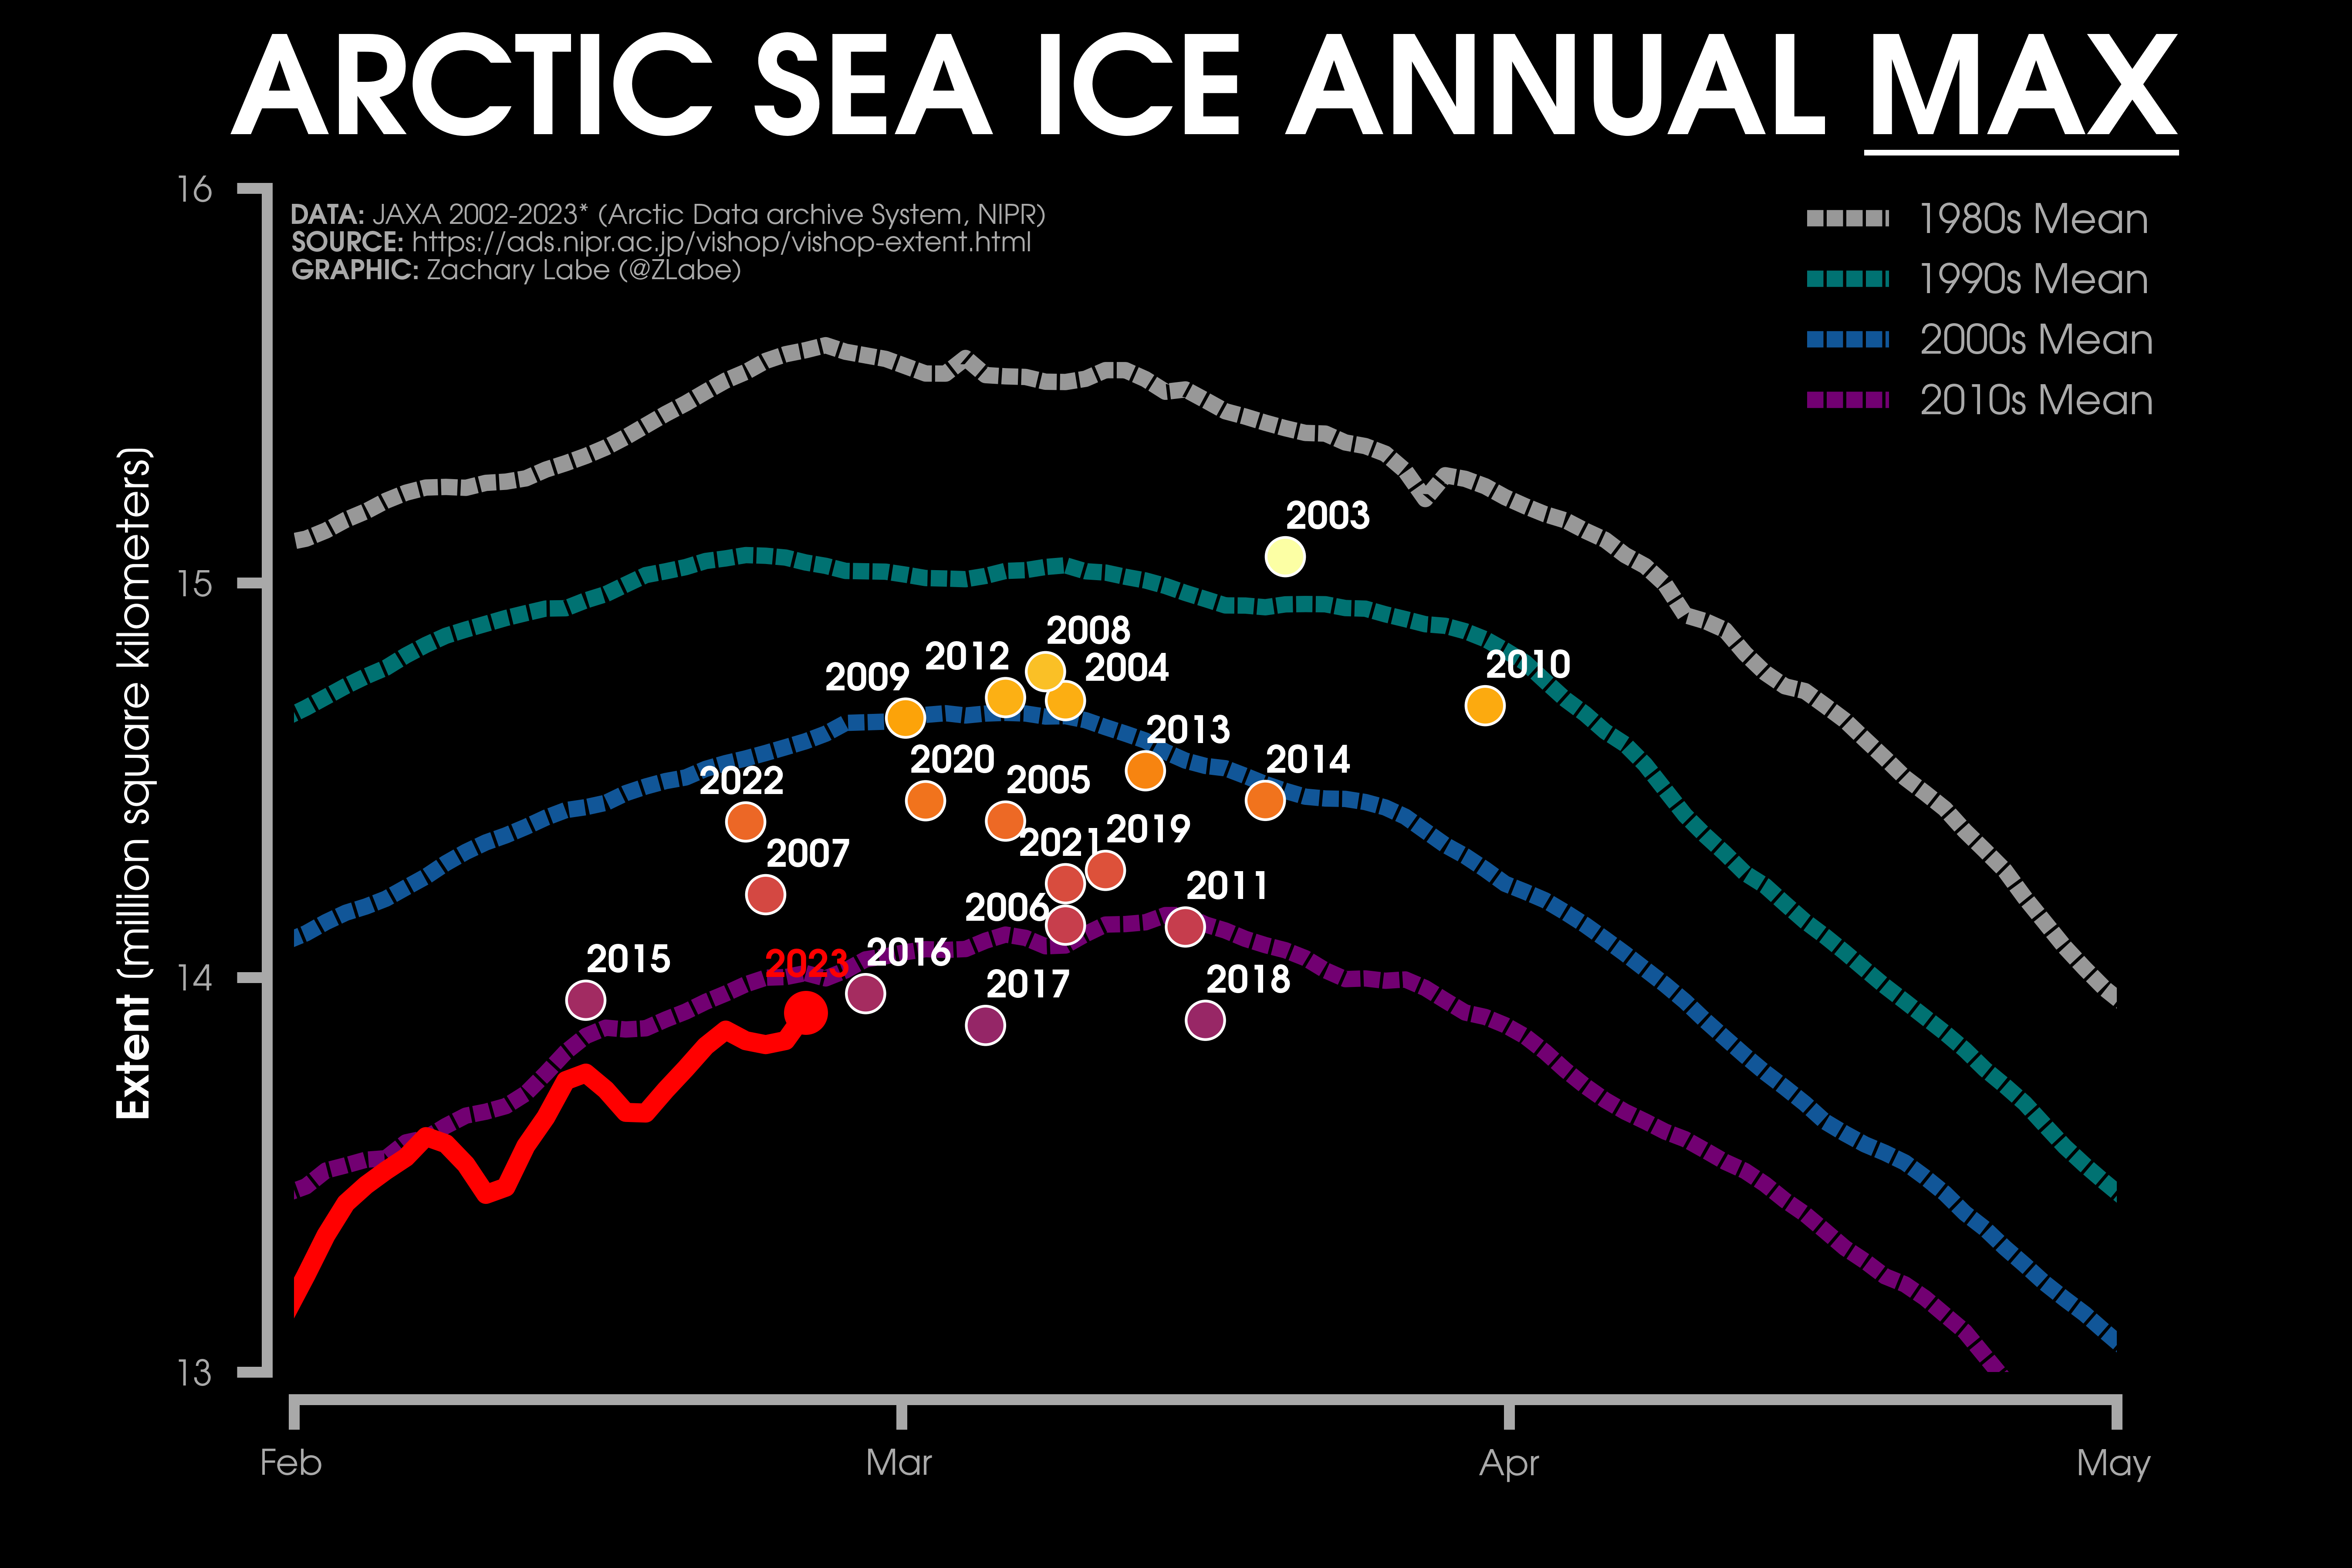
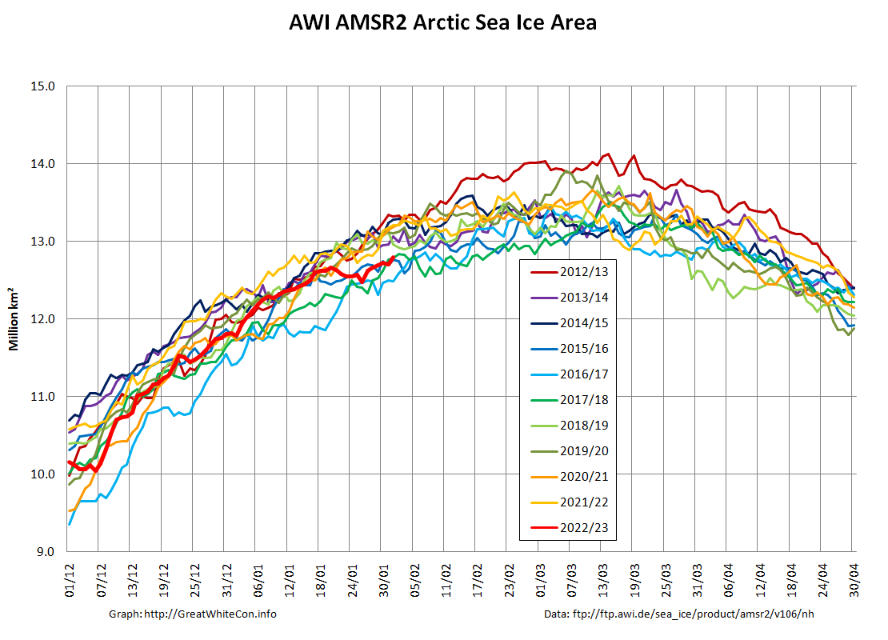
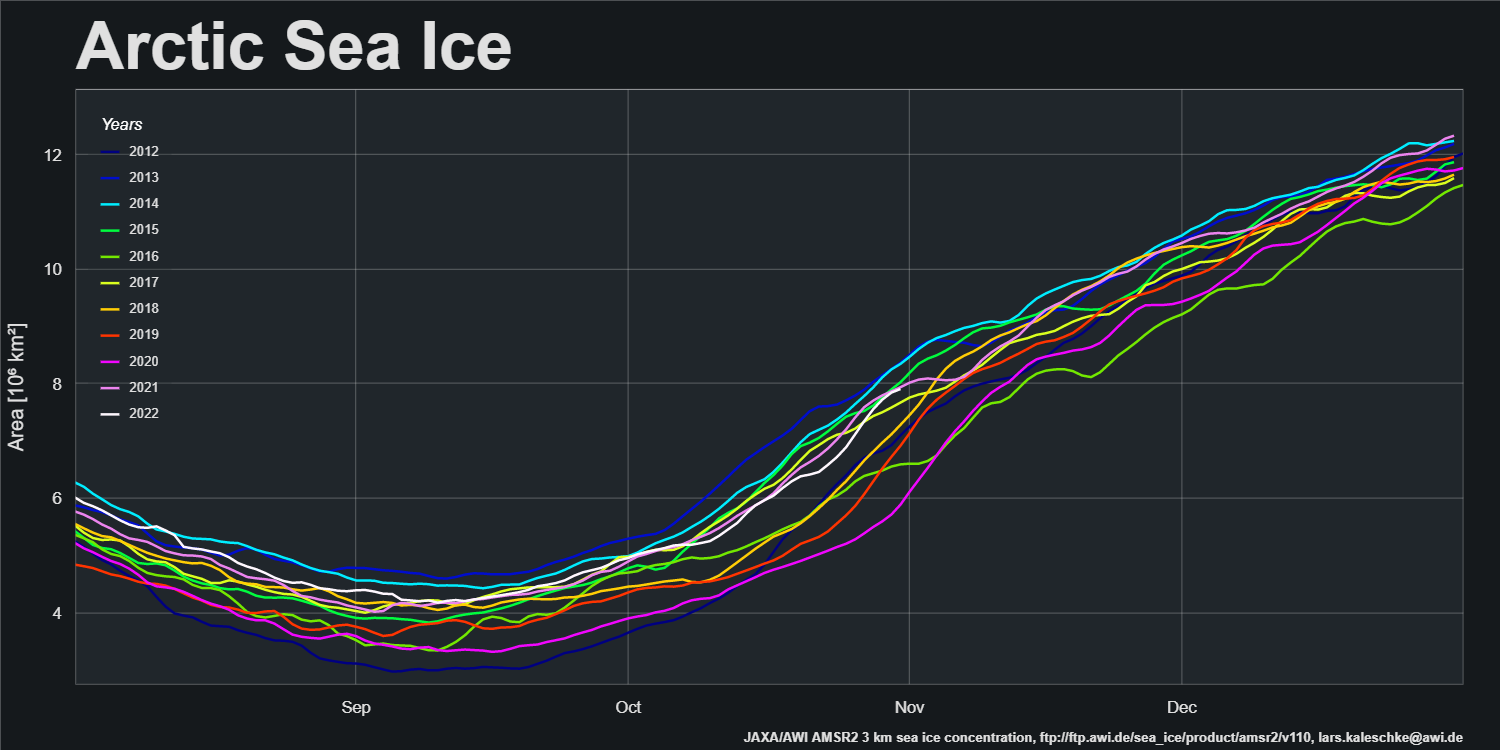
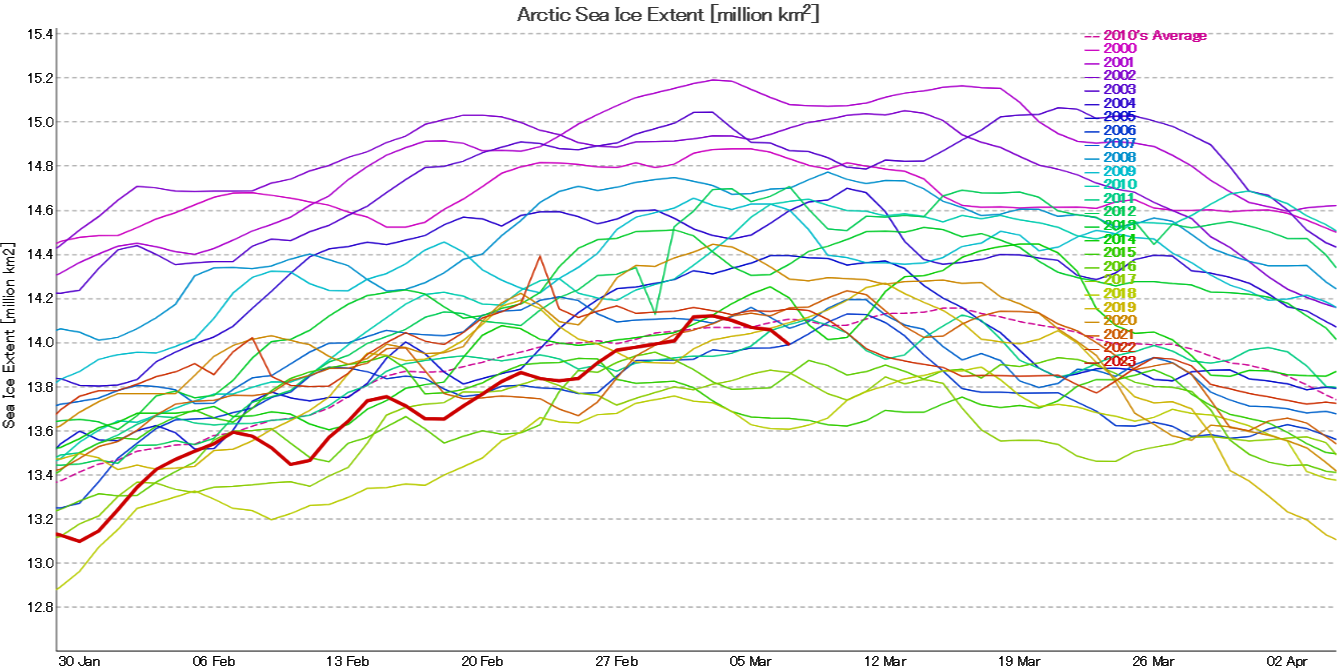
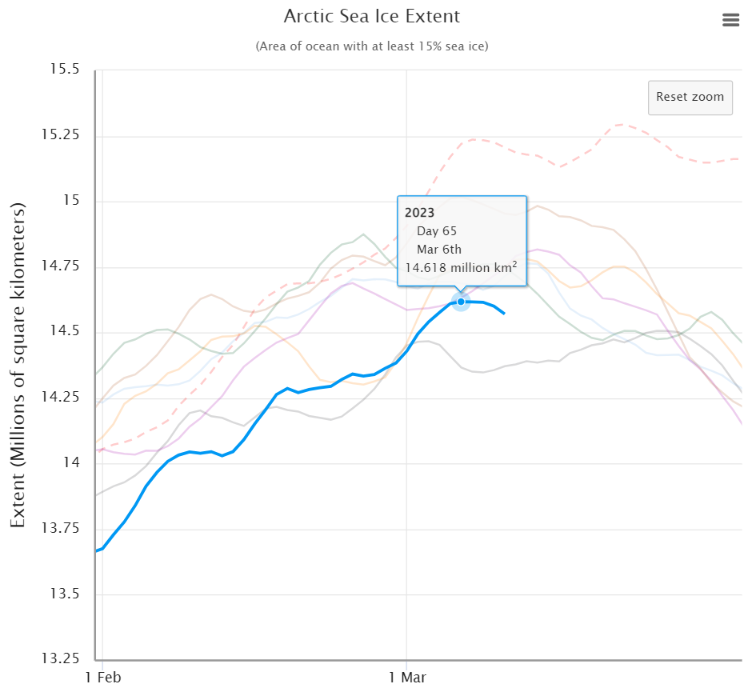
Zack’s graph displays the JAXA/ViSHOP version of Arctic extent, so here too is JAXA’s own graph of the current sea ice extent:

It doesn’t look as though the 2023 maximum has been achieved yet, but extent on March 1st was 14.01 million km². That is evidently not going to be the lowest in the satellite era!
[Edit – March 8th]As Tom has already mentioned below, JAXA extent has declined significantly since the (so far!) peak extent of 14.12 million km² on both the 2nd and 3rd of March:
It’s too soon to be certain of course, but we certainly now have a good candidate for the 2023 maximum JAXA extent.
NSIDC 5 day averaged extent is still increasing, but let’s see what this afternoon’s update (UTC) reveals…
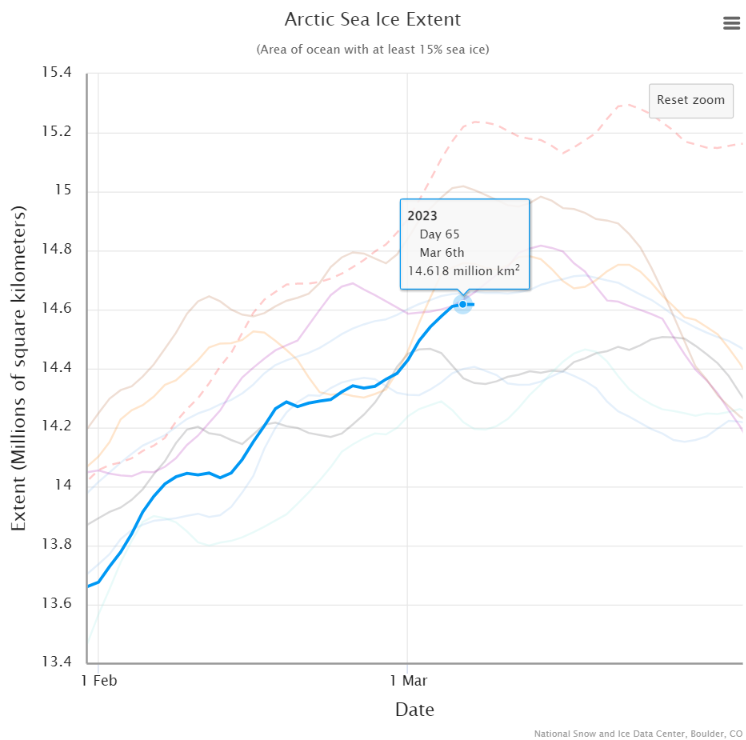
Which is a decrease of 0.001 million km² from March 6th, leaving a current NSIDC maximum extent of 14.62 million km²!
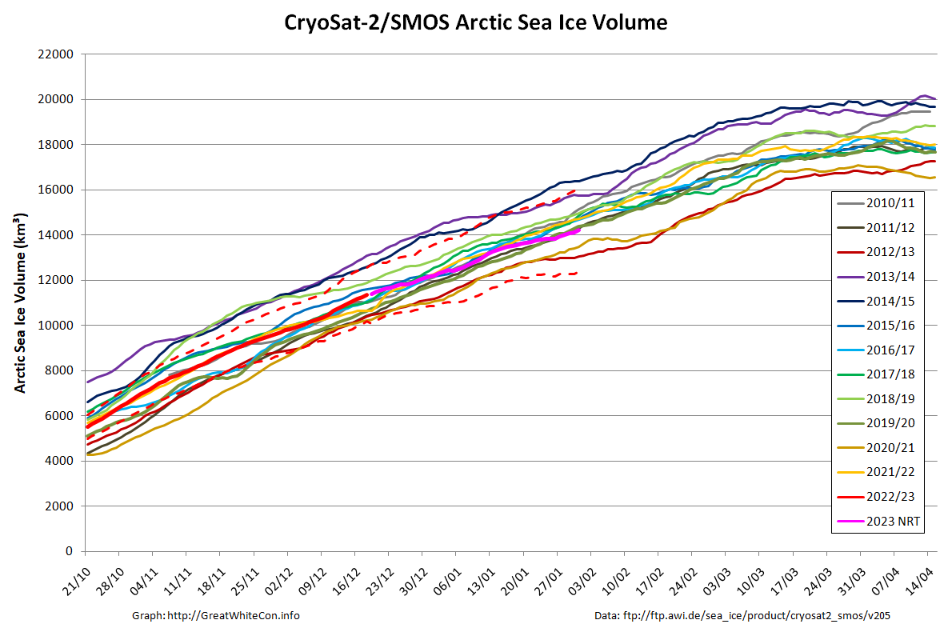
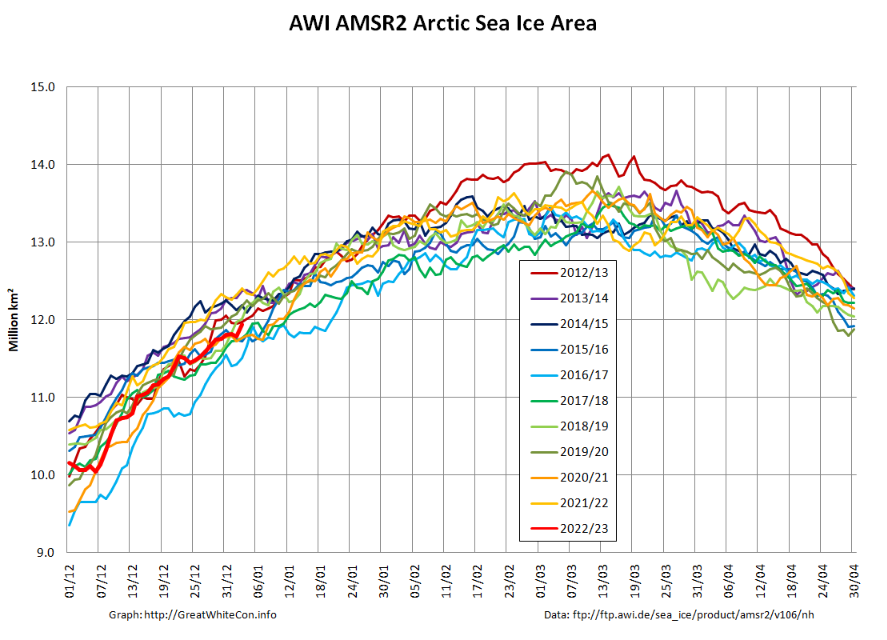
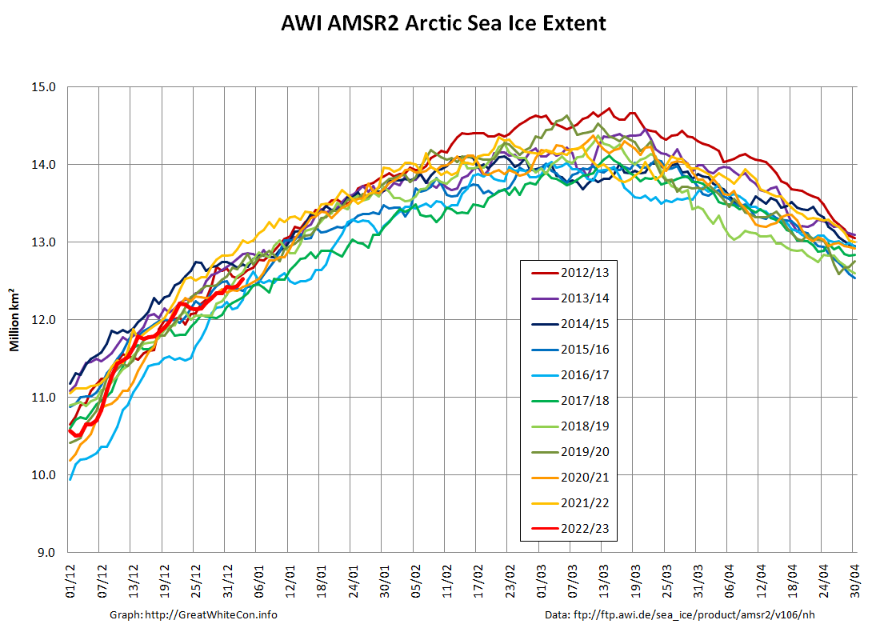
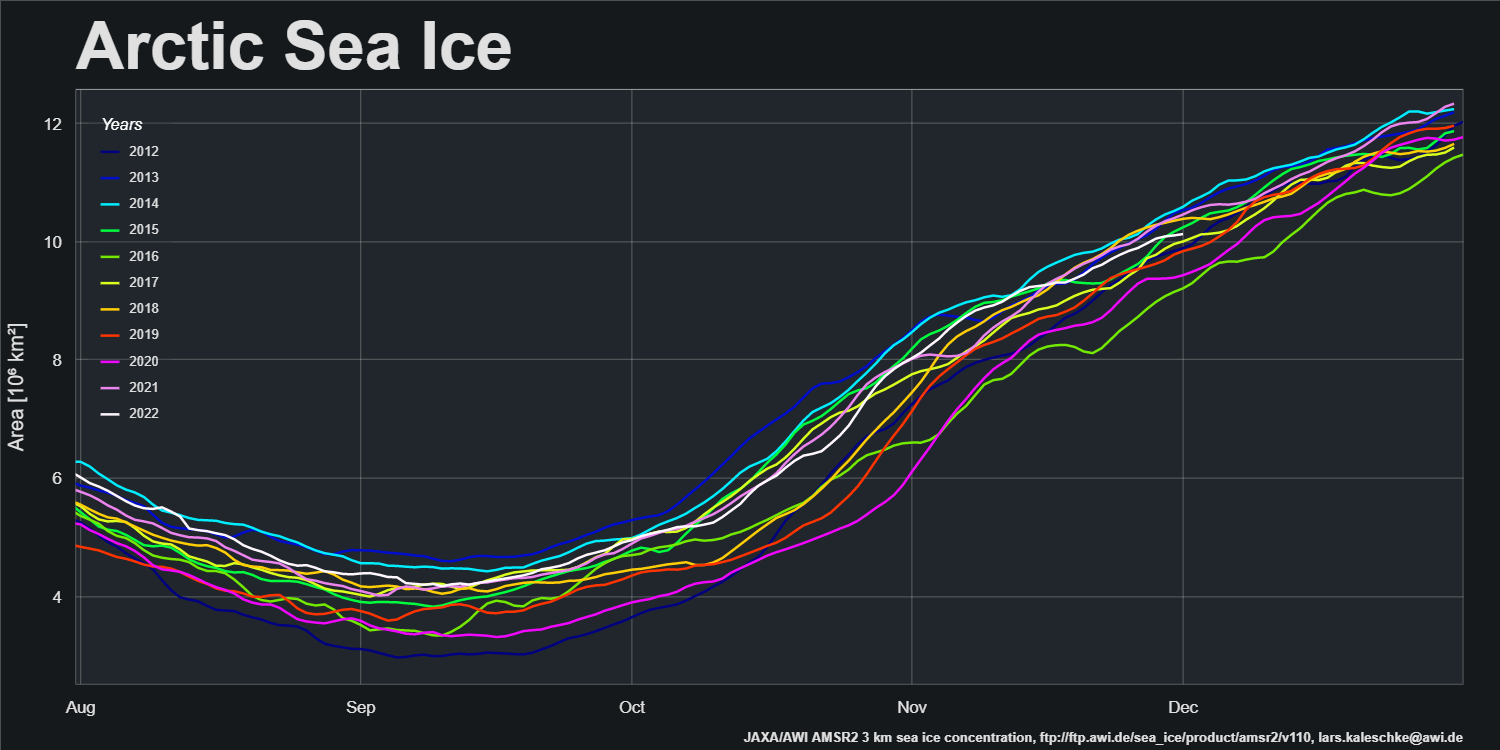
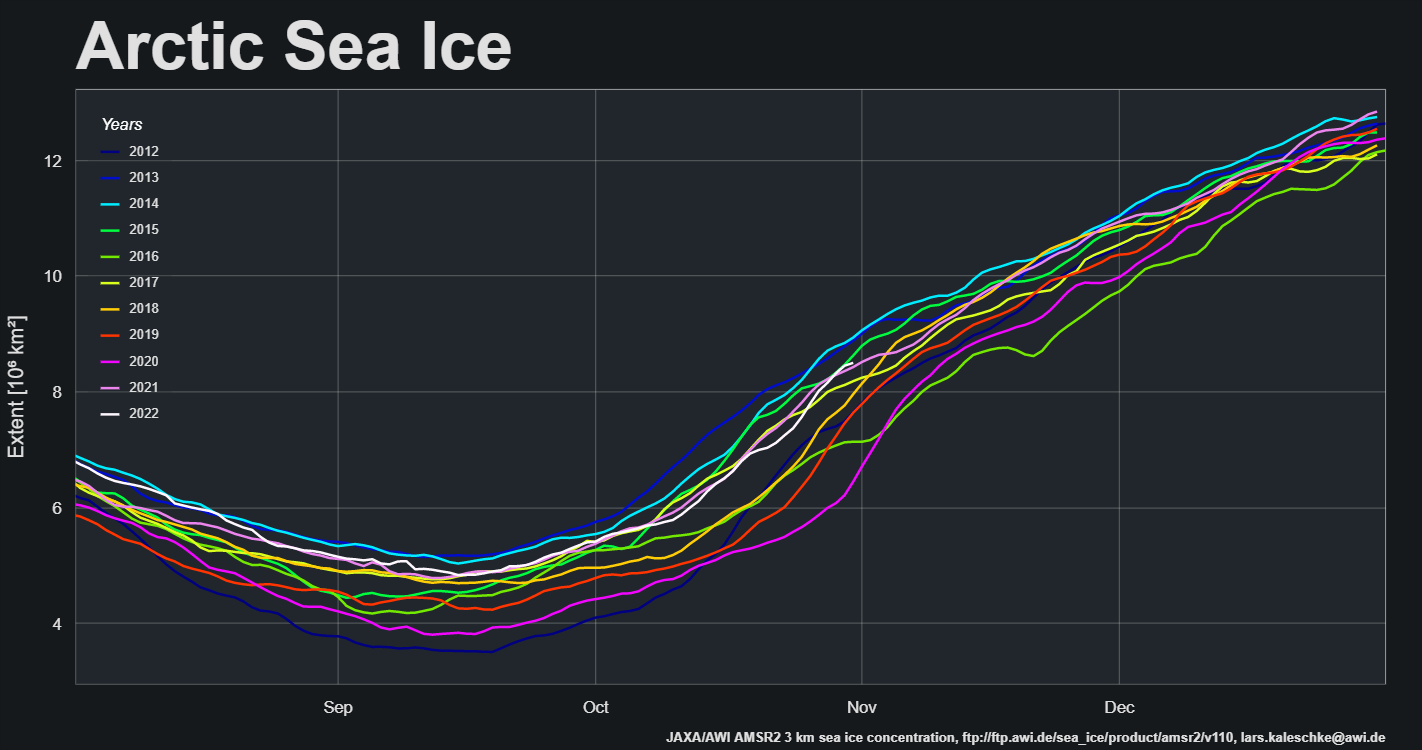
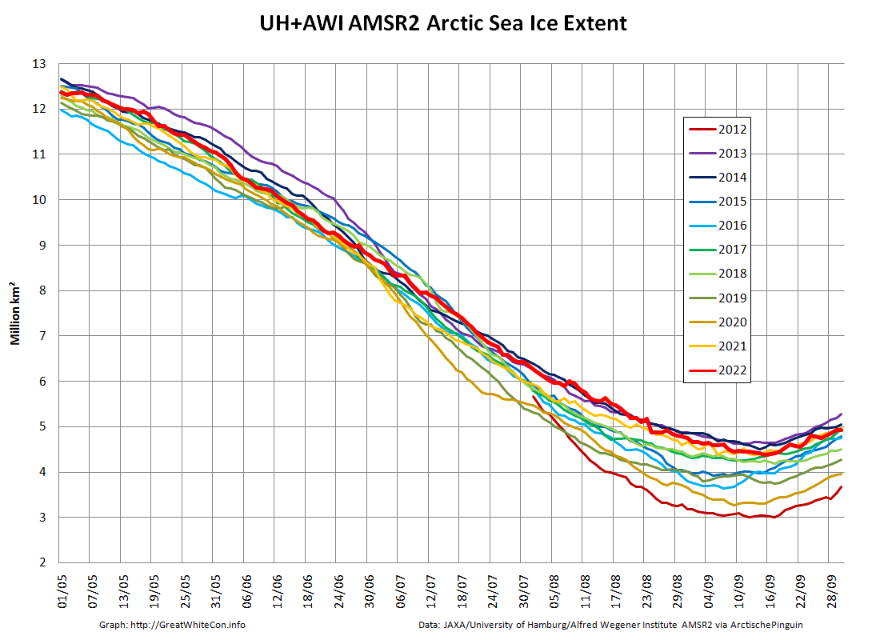
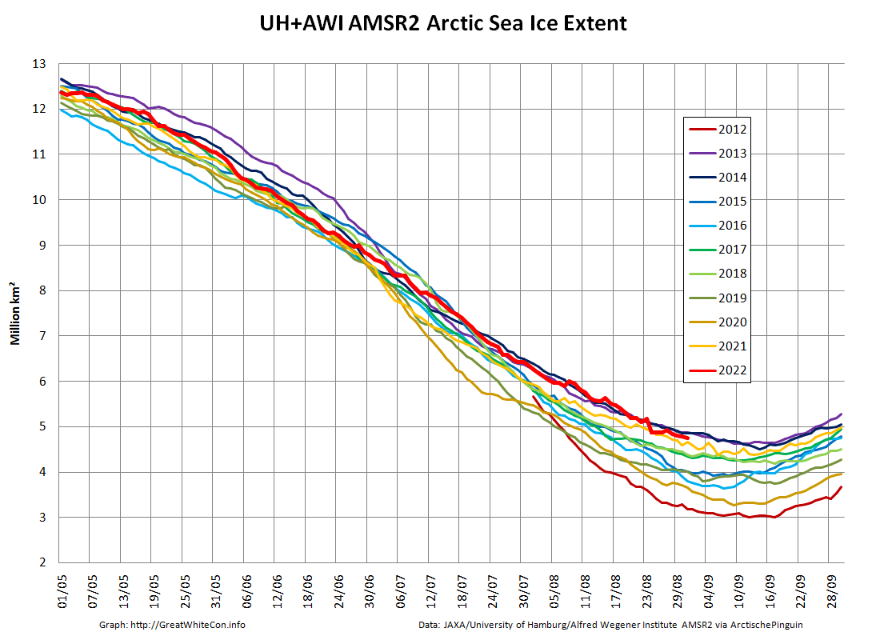
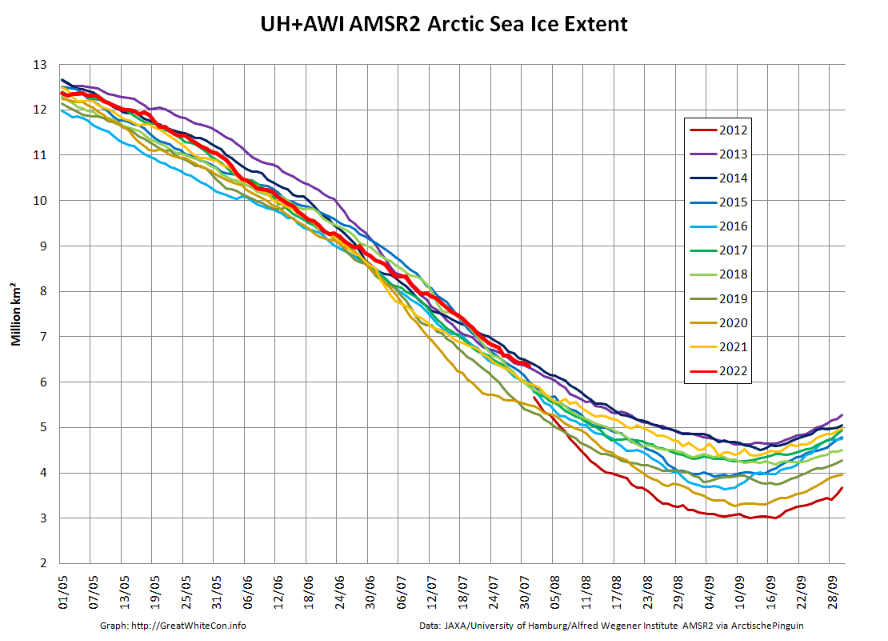
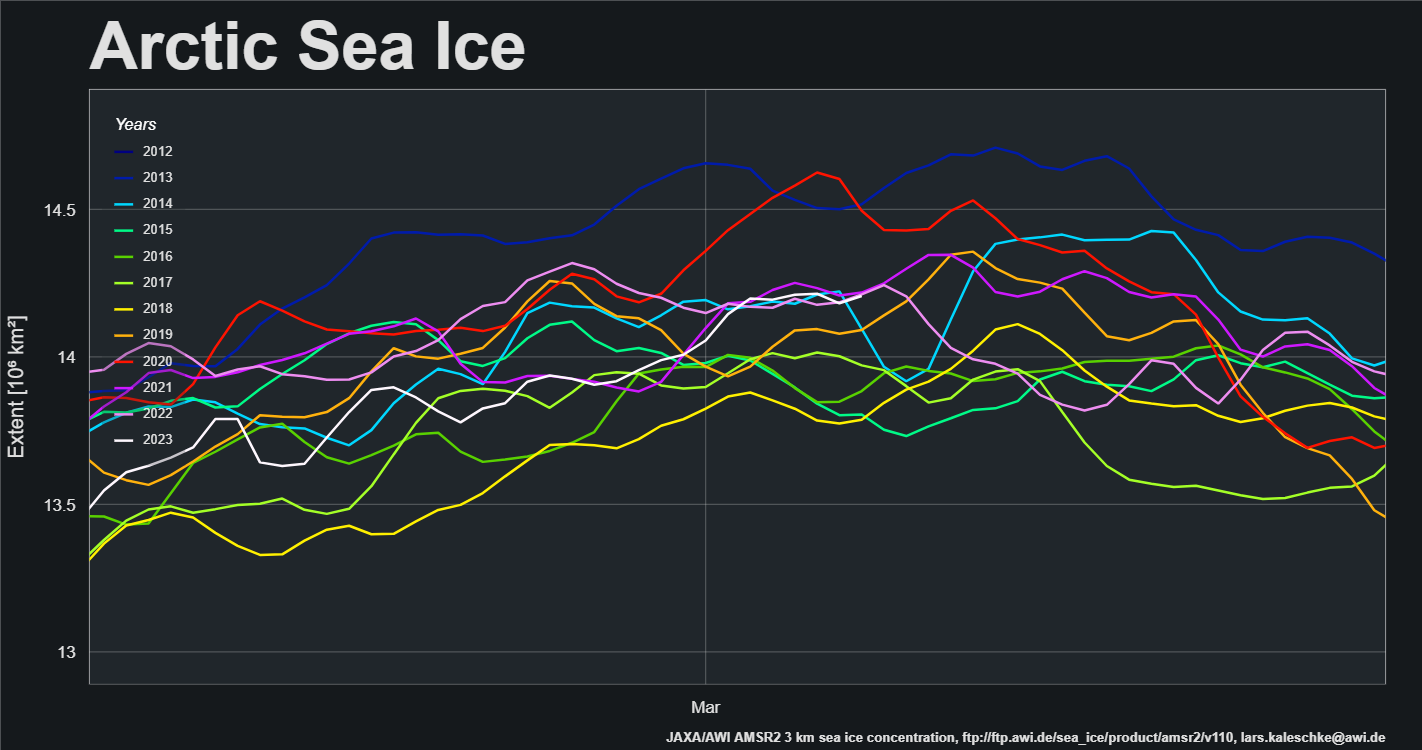
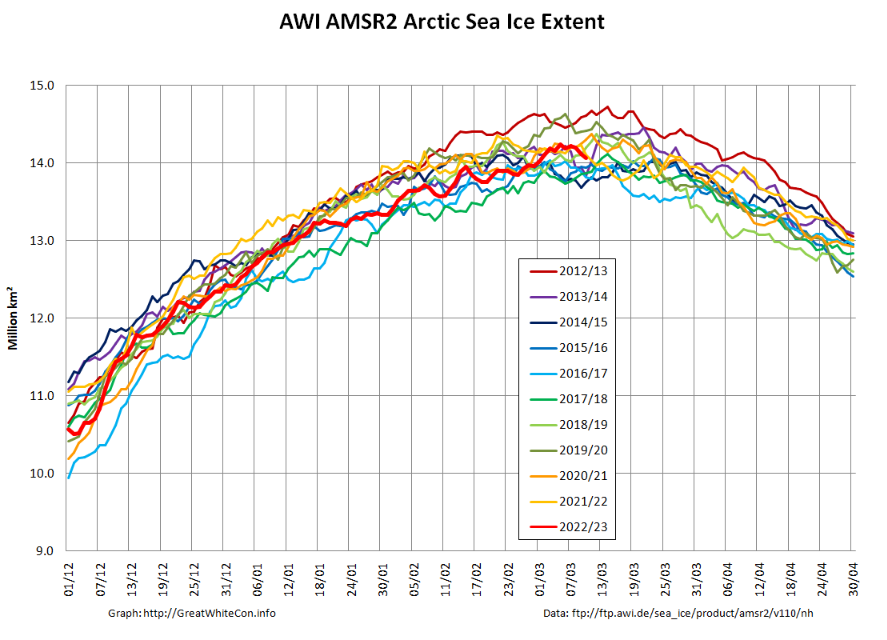
Finally, for the moment at least, AWI’s “high resolution” AMSR2 extent looks a lot less convincing than JAXA’s:
NSIDC Arctic sea ice extent took a tumble yesterday, so with only mild trepidation I’m calling the 2023 maximum extent. In the case of the NSIDC’s 5 day average metric that’s still a rounded up 14.62 million km² on March 6th:
The JAXA/ViSHOP maximum extent remains at 14.12 million km² on March 2nd:
The “high resolution” AMSR2 based metric from AWI peaked at 14.24 million km² on March 5th:
They are of course a bit late with the news, but the NSIDC have now called the 2023 maximum Arctic sea ice extent:
Arctic sea ice has likely reached its maximum extent for the year, at 14.62 million square kilometers (5.64 million square miles) on March 6. The 2023 maximum is the fifth lowest in the 45-year satellite record. NSIDC scientists will present a detailed analysis of the 2022 to 2023 winter sea ice conditions in the regular monthly post in early April:
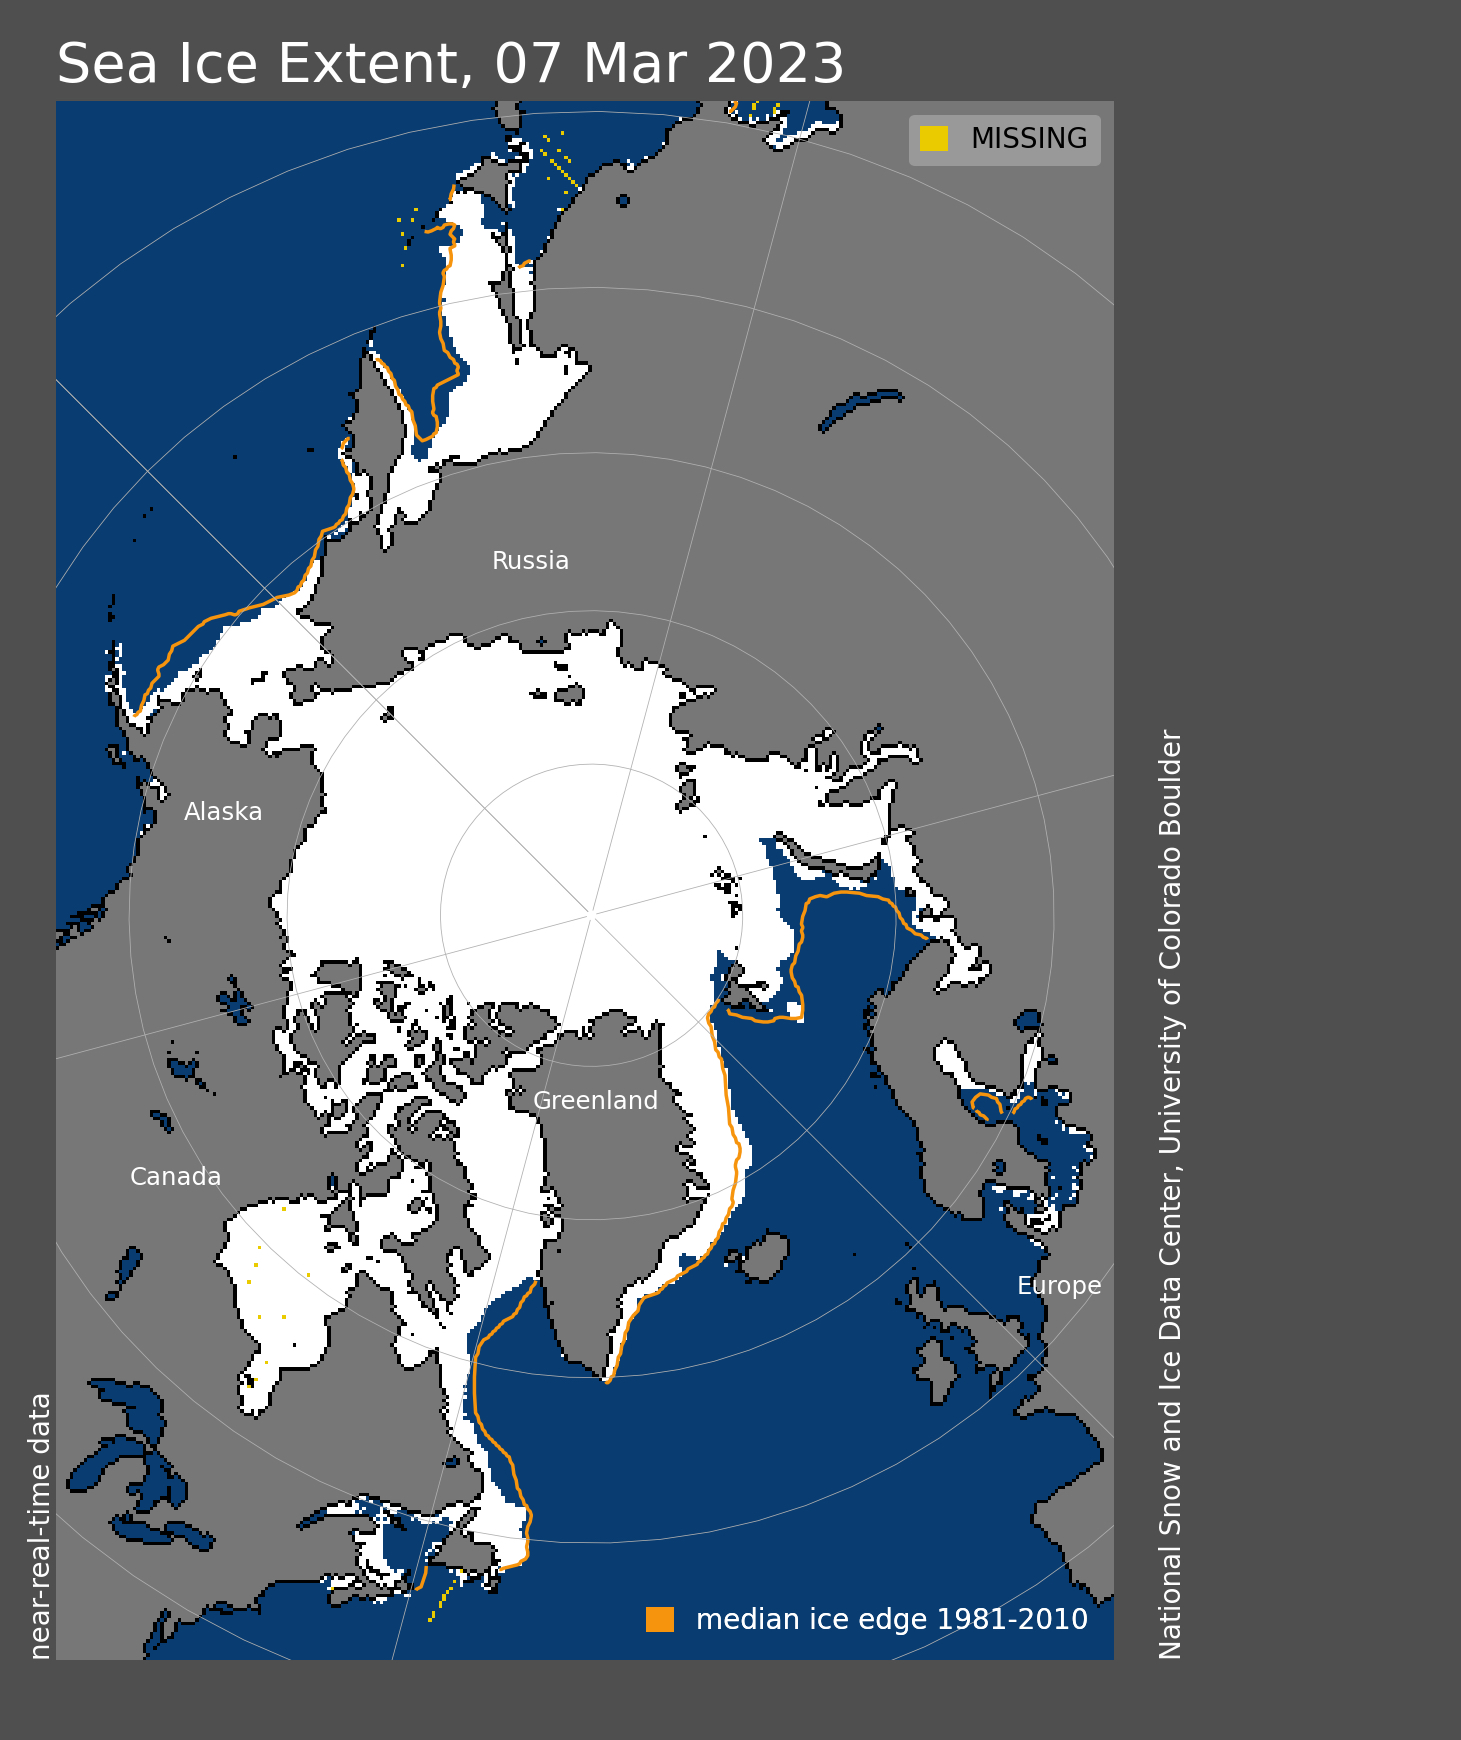
The date of the maximum this year, March 6, was six days earlier than the 1981 to 2010 average date of March 12…
The ice growth season ended with below average sea ice extent in the Bering Sea, Sea of Okhotsk, Barents Sea, and Labrador Sea. Above average extent was in the Greenland Sea. Extent was well below average in the Gulf of St. Lawrence for a second year in row.
Watch this space!