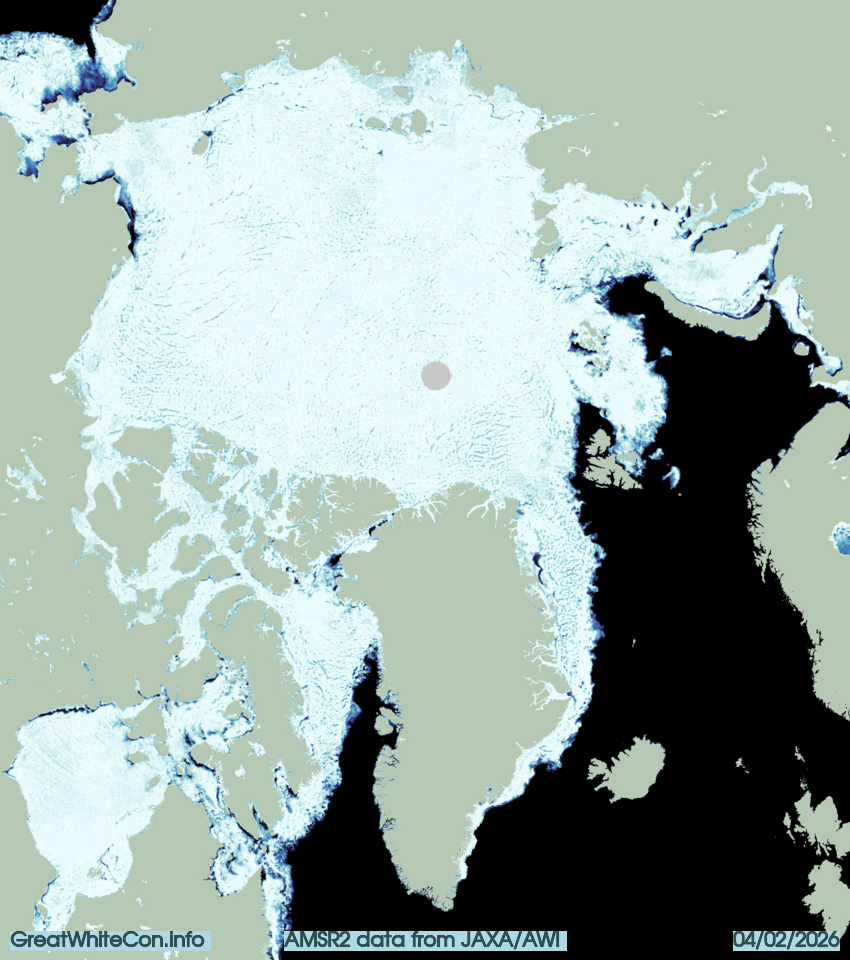
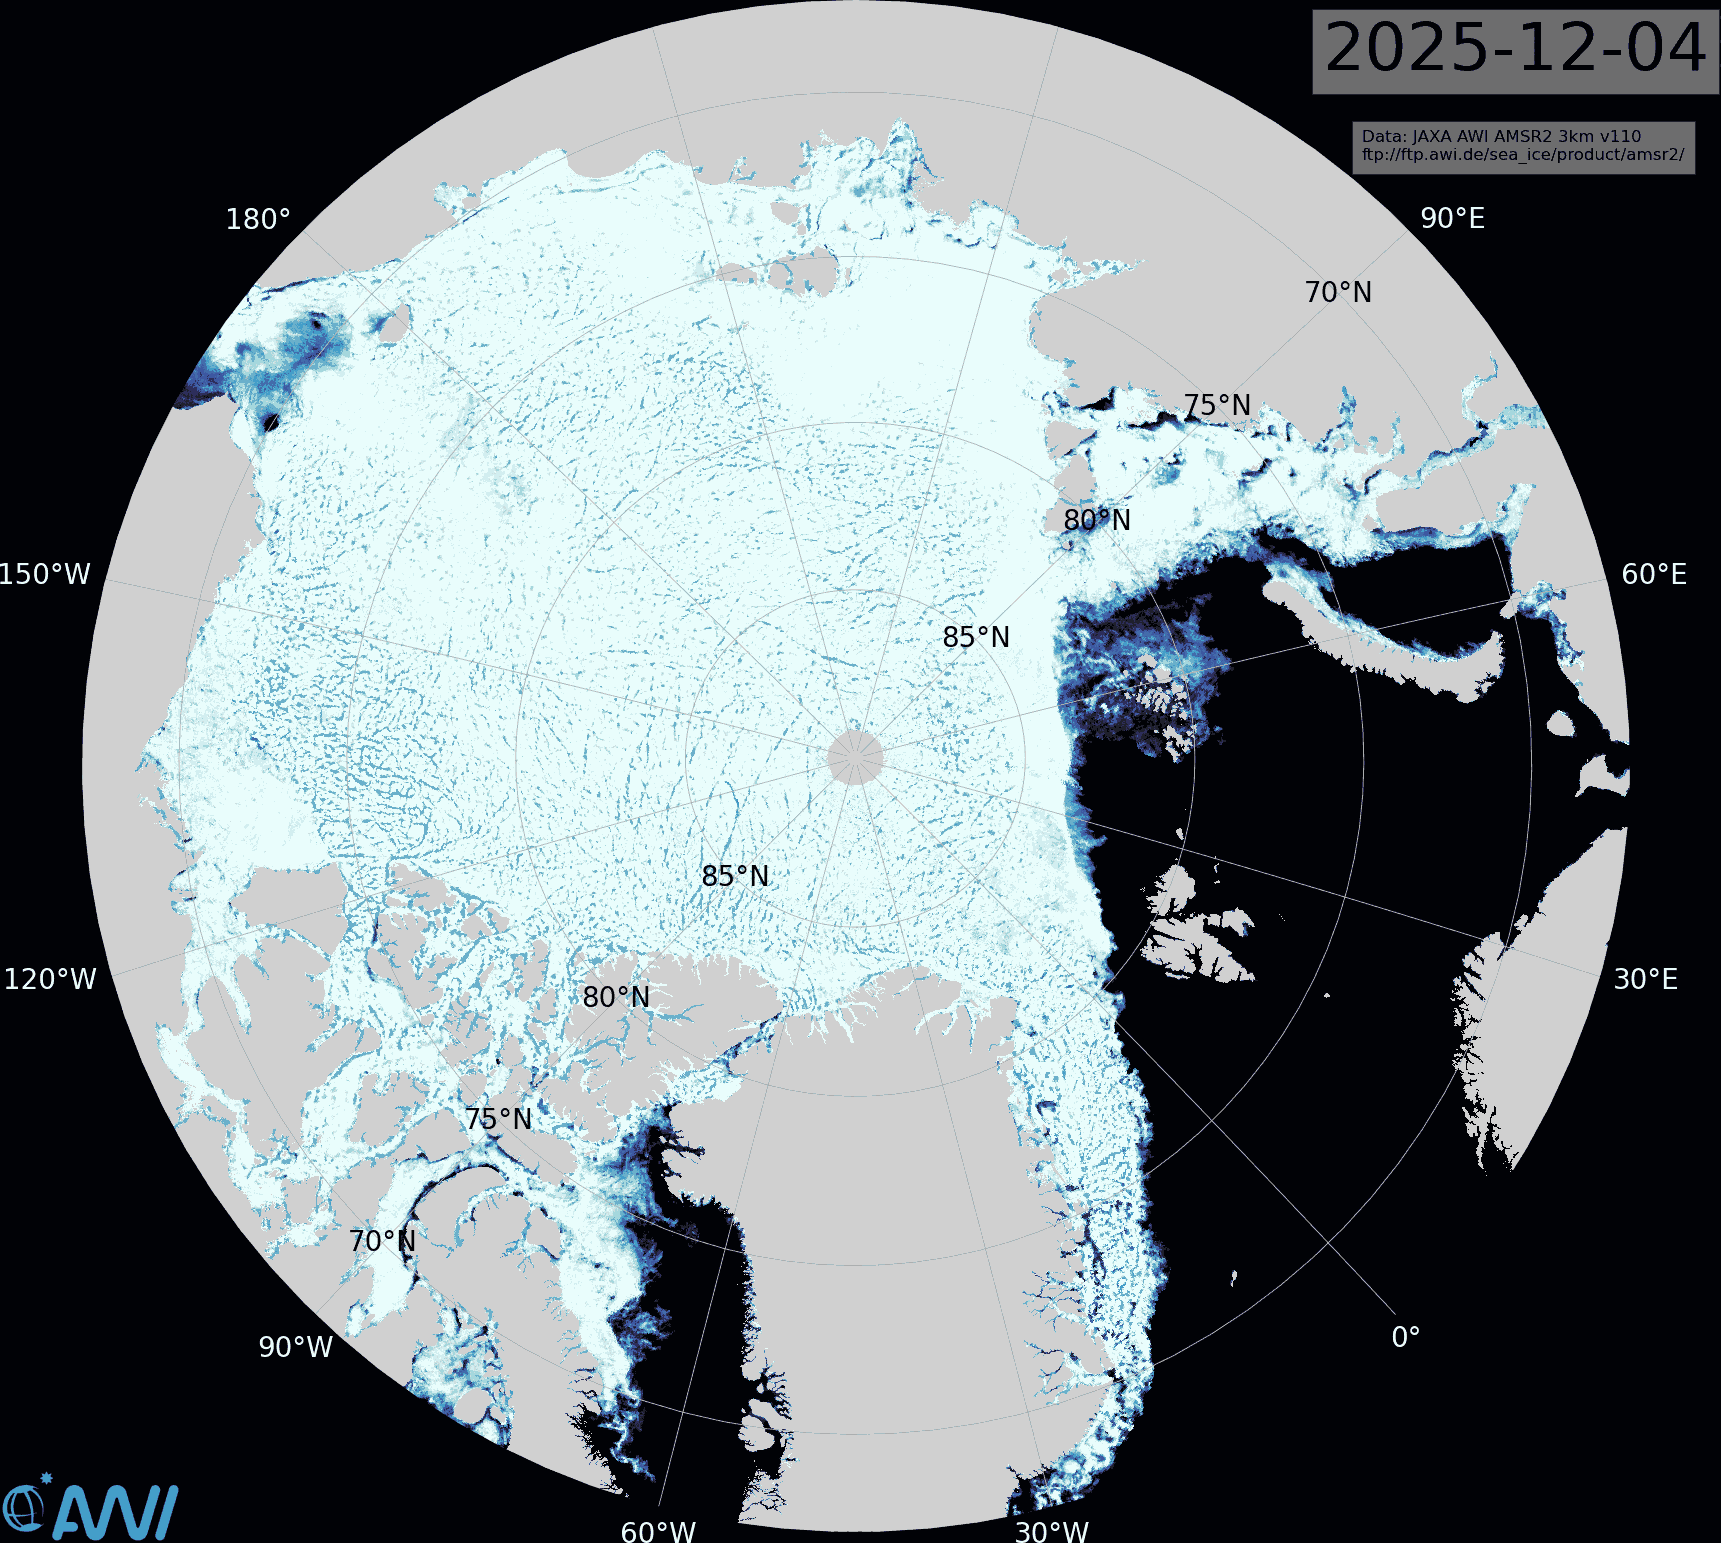
Hudson Bay has fully frozen over during January. However, there is still open water north of Svalbard and in the North Water Polynya. It’s even possible to go swimming in the Nares Strait according to the latest AMSR2 concentration map from the Alfred Wegener Institute:
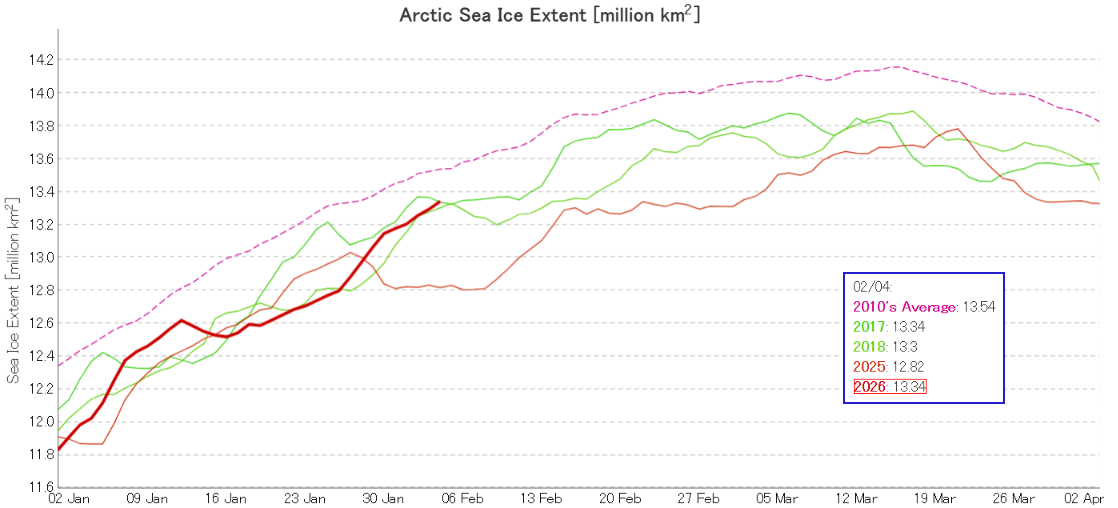
JAXA extent is currently 3rd lowest for the date, in a “statistical tie” with 2017:
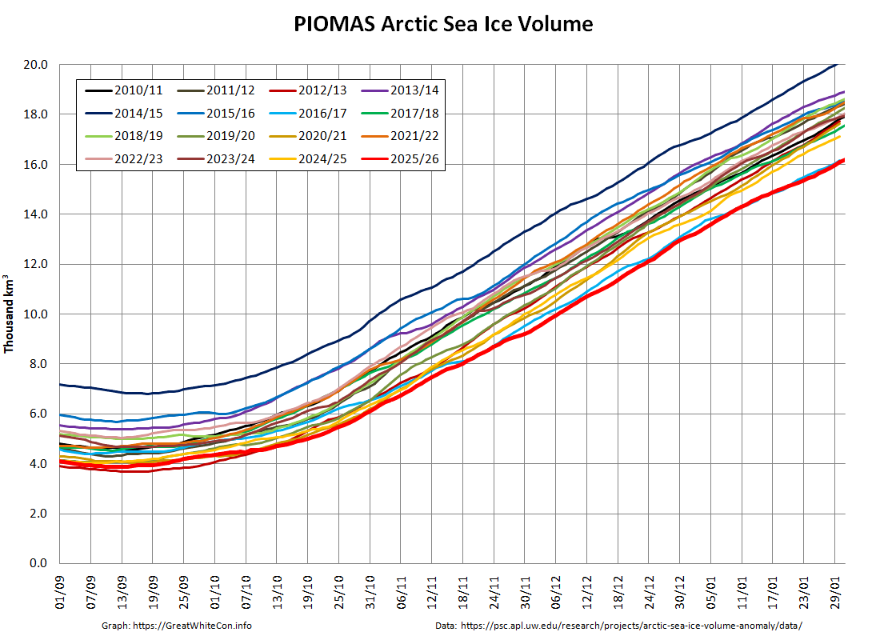
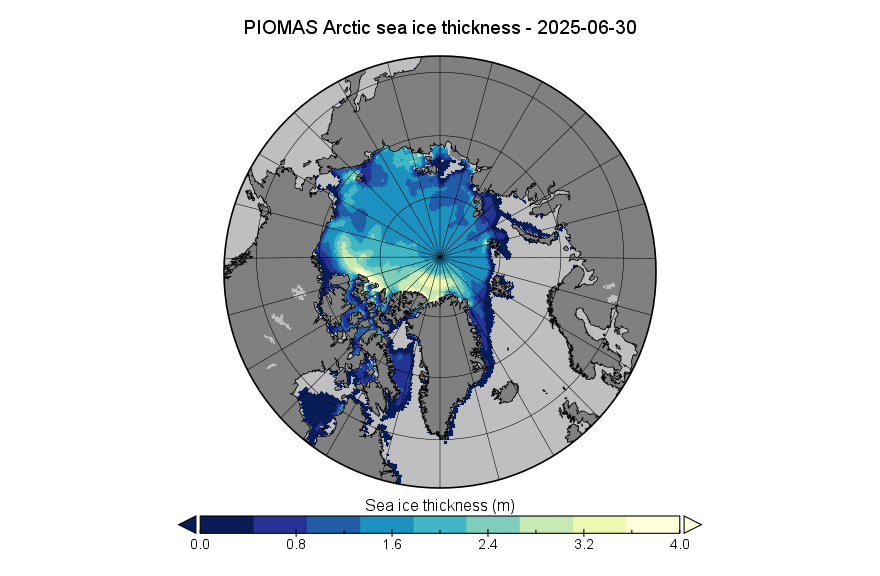
Looking at the third dimension next, PIOMAS volume was second lowest for the date by a whisker at the end of January:
The latest Alfred Wegener Institute sea ice concentration map shows that the Pacific side of the Central Arctic Basin is now almost completely refrozen:
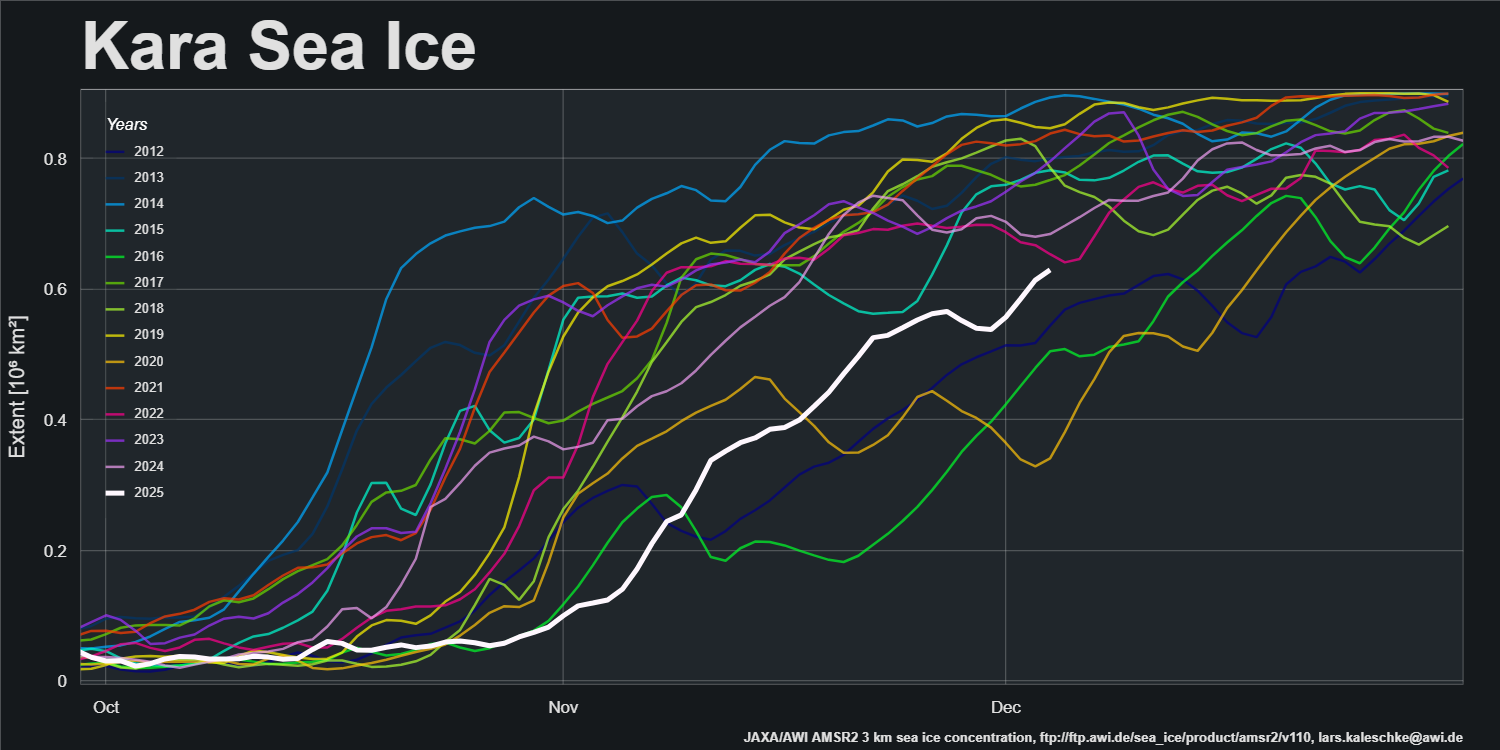
On the Atlantic side of the Arctic the Kara Sea is rapidly refreezing:
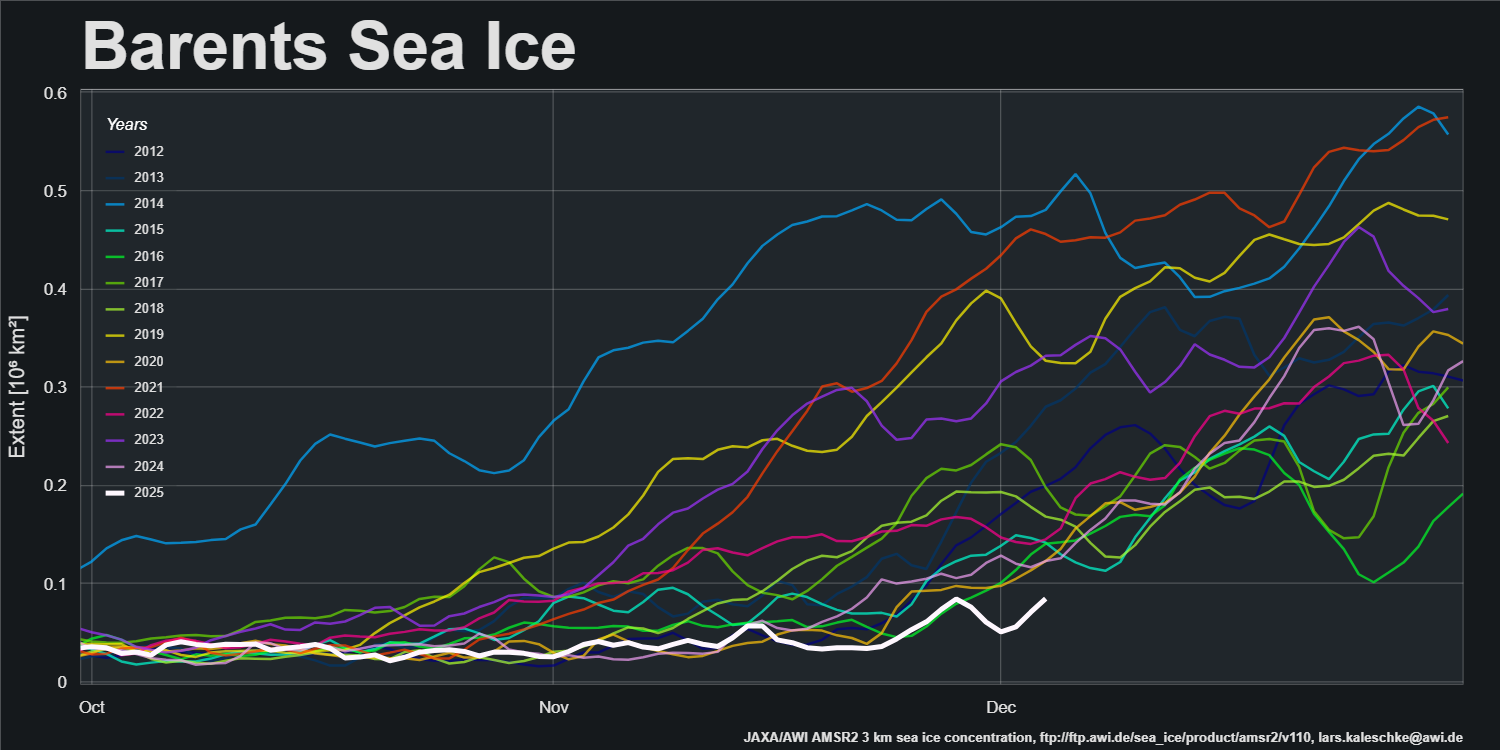
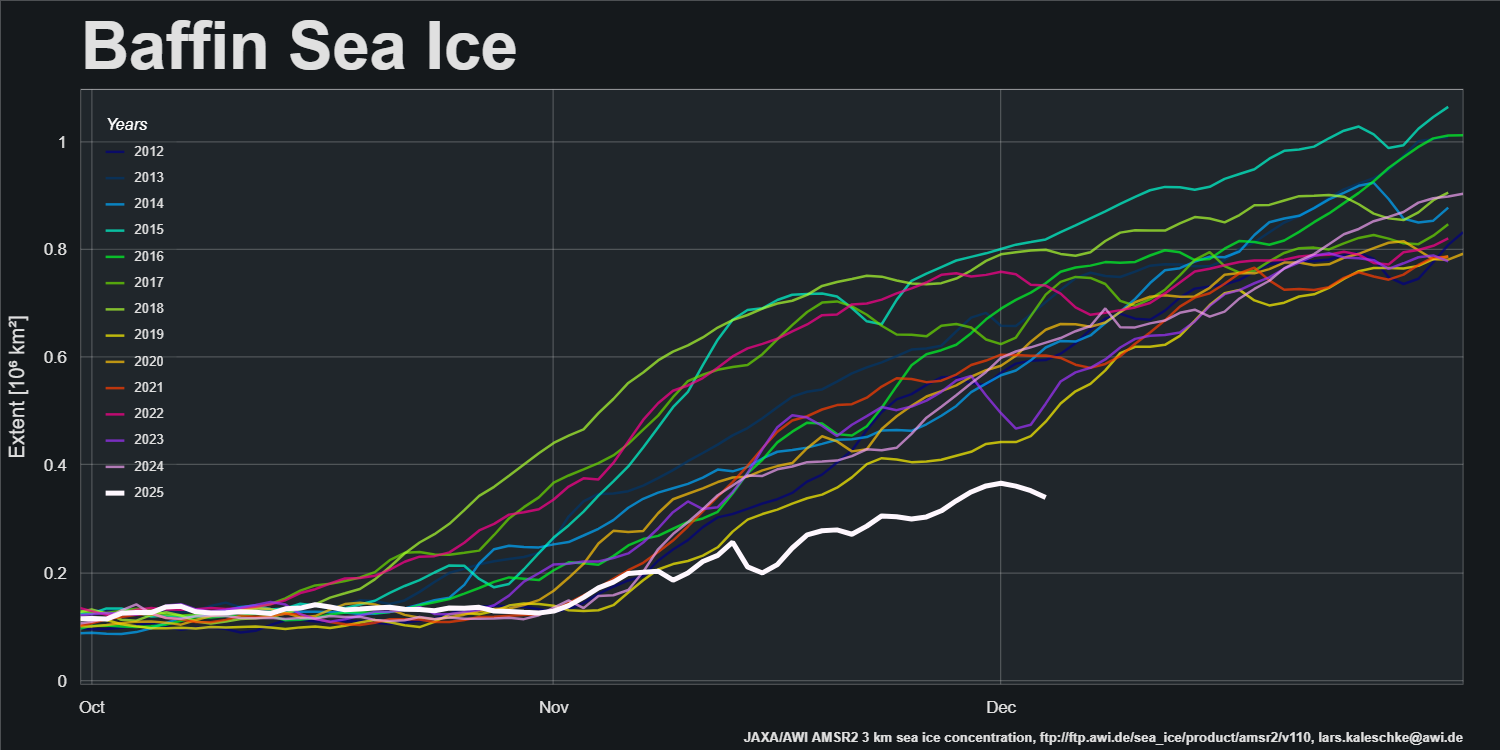
However, sea ice extent in the Barents Sea and Baffin Bay is currently lowest for the date in the AMSR2 record:
Pan Arctic JAXA/ViSHOP extent is currently lowest for the date in the satellite era:
Yes. NSIDC satellite data shows Arctic September sea ice extent declined from ~6.5 million km² in the early 2000s to ~4.2 million km² by 2024, while PIOMAS volume estimates fell from ~12,000 km³ to under 4,000 km³. Shellenberger's claim ignores these multi-decadal trends, though…
By way of additional background information, Wikipedia asserts that:
Grok is a generative artificial intelligence chatbot developed by xAI. It was launched in November 2023 by Elon Musk as an initiative based on the large language model (LLM) of the same name. Grok has apps for iOS and Android and is integrated with the social media platform X (formerly known as Twitter), Tesla vehicles, and Tesla’s Optimus robot. The chatbot is named after the verb grok, coined by American author Robert A. Heinlein in his 1961 science fiction novel Stranger in a Strange Land to describe a deeper than human form of understanding.
The bot has generated various controversial responses, including conspiracy theories, antisemitism, and praise of Adolf Hitler, as well as referring to Musk’s views when asked about controversial topics or difficult decisions. Updates since 2023 have shifted the bot politically rightward to provide conservative responses to user queries.
and that:
Michael D. Shellenberger is an American author and journalist. He is the first endowed professor at the University of Austin, serving as CBR Chair of Politics, Censorship, and Free Speech.
Shellenberger is a prominent heterodox thinker on topics including climate change and homelessness…
An archived photograph in the NHHC image collection: “USN 1040961 USS SKATE (SSN–578)” which shows the submarine moored to the ice pack. flickr.com
A blog article “USS Skate at the North Pole – Truth and Fantasy Fiction” that collects several of the historic photographs and discusses their context. greatwhitecon.info
I asked ChatGPT to check out the final link in more detail. I was informed:
What GreatWhiteCon does well:
It collects and reproduces the historic images and contemporary captions, and discusses how those images have been interpreted (or misinterpreted) over time. That makes it a handy one-stop place to see the pictures and some commentary.
What GreatWhiteCon is not:
It is a blog/analysis piece (2018) rather than an official or archival source. That means its interpretation is useful, but any factual claim that matters (dates, official captions, archival catalog numbers) is best checked against the primary records (Naval History & Heritage Command, National Archives, contemporary magazines, USNI Proceedings).
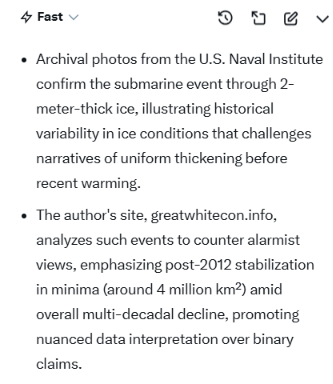
Grok has a rather different interpretation of what Great White Con does well. Allegedly “Snow White”:
Counters alarmist views… promoting nuanced data interpretation over binary claims.
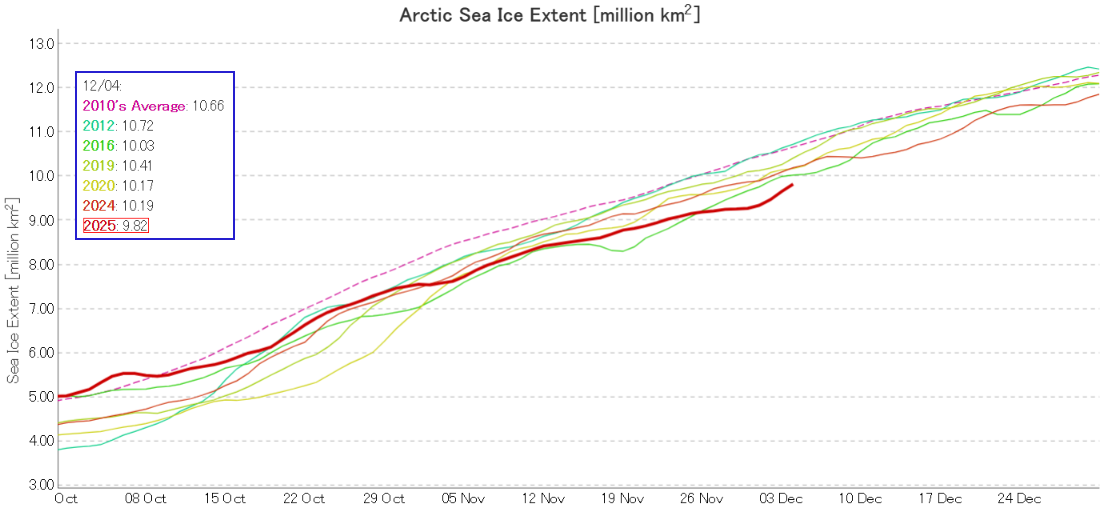
I was hoping that the September PIOMAS gridded thickness data would have been published by now, but no such luck. Reverting to JAXA/ViSHOP extent, after flatlining for most of September the refreeze has started in earnest over the last two weeks. Extent is currently 12th lowest in the satellite era:
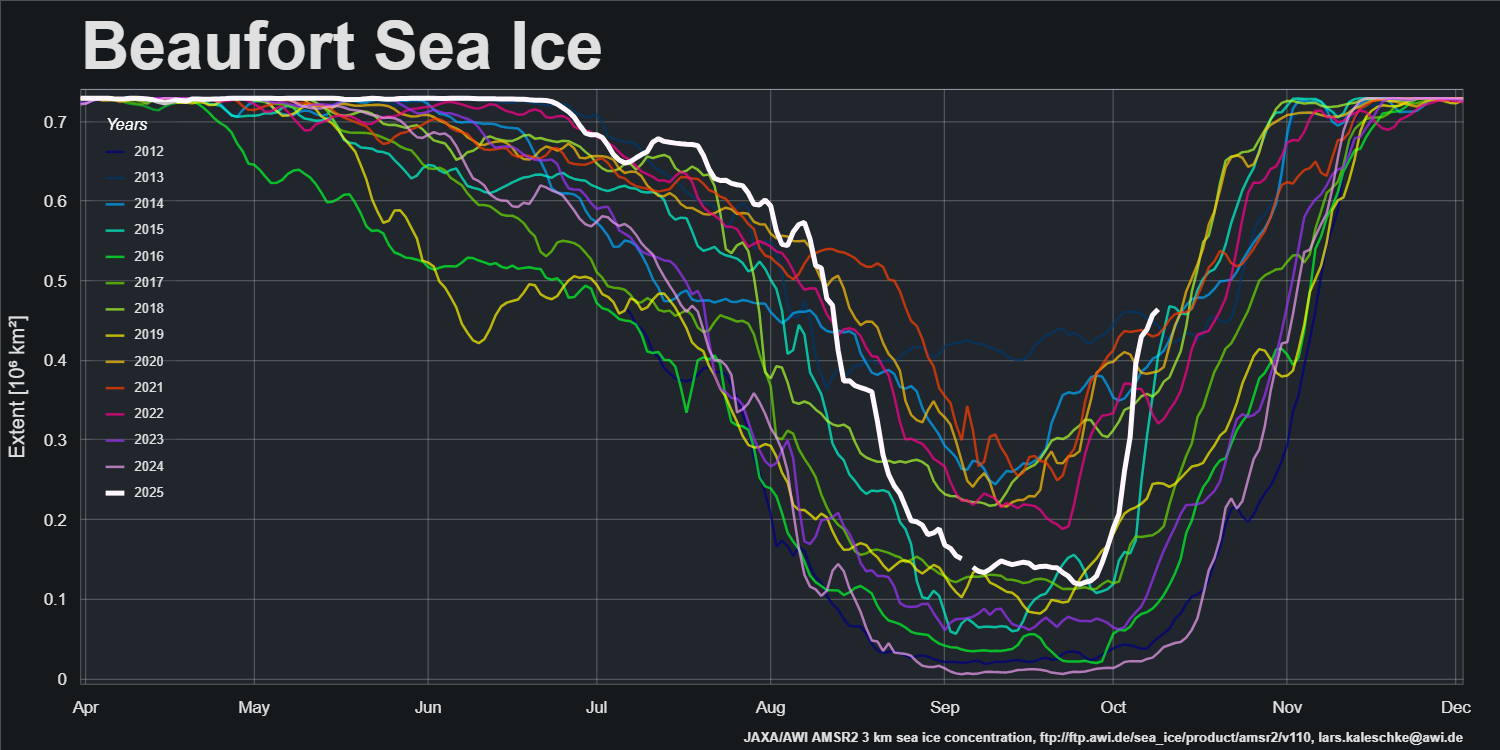
The latest sea ice concentration map from Lars Kaleschke of the Alfred Wegener Institute, based on AMSR2 data, reveals plenty of new ice in the Beaufort Sea, plus a bit more to the north of the Laptev Sea:
The latest sea ice “stage of development” charts from the Canadian Ice Service confirm that, and reveal more new ice that has yet to show up in the AMSR2 data:
[Update – October 11th]
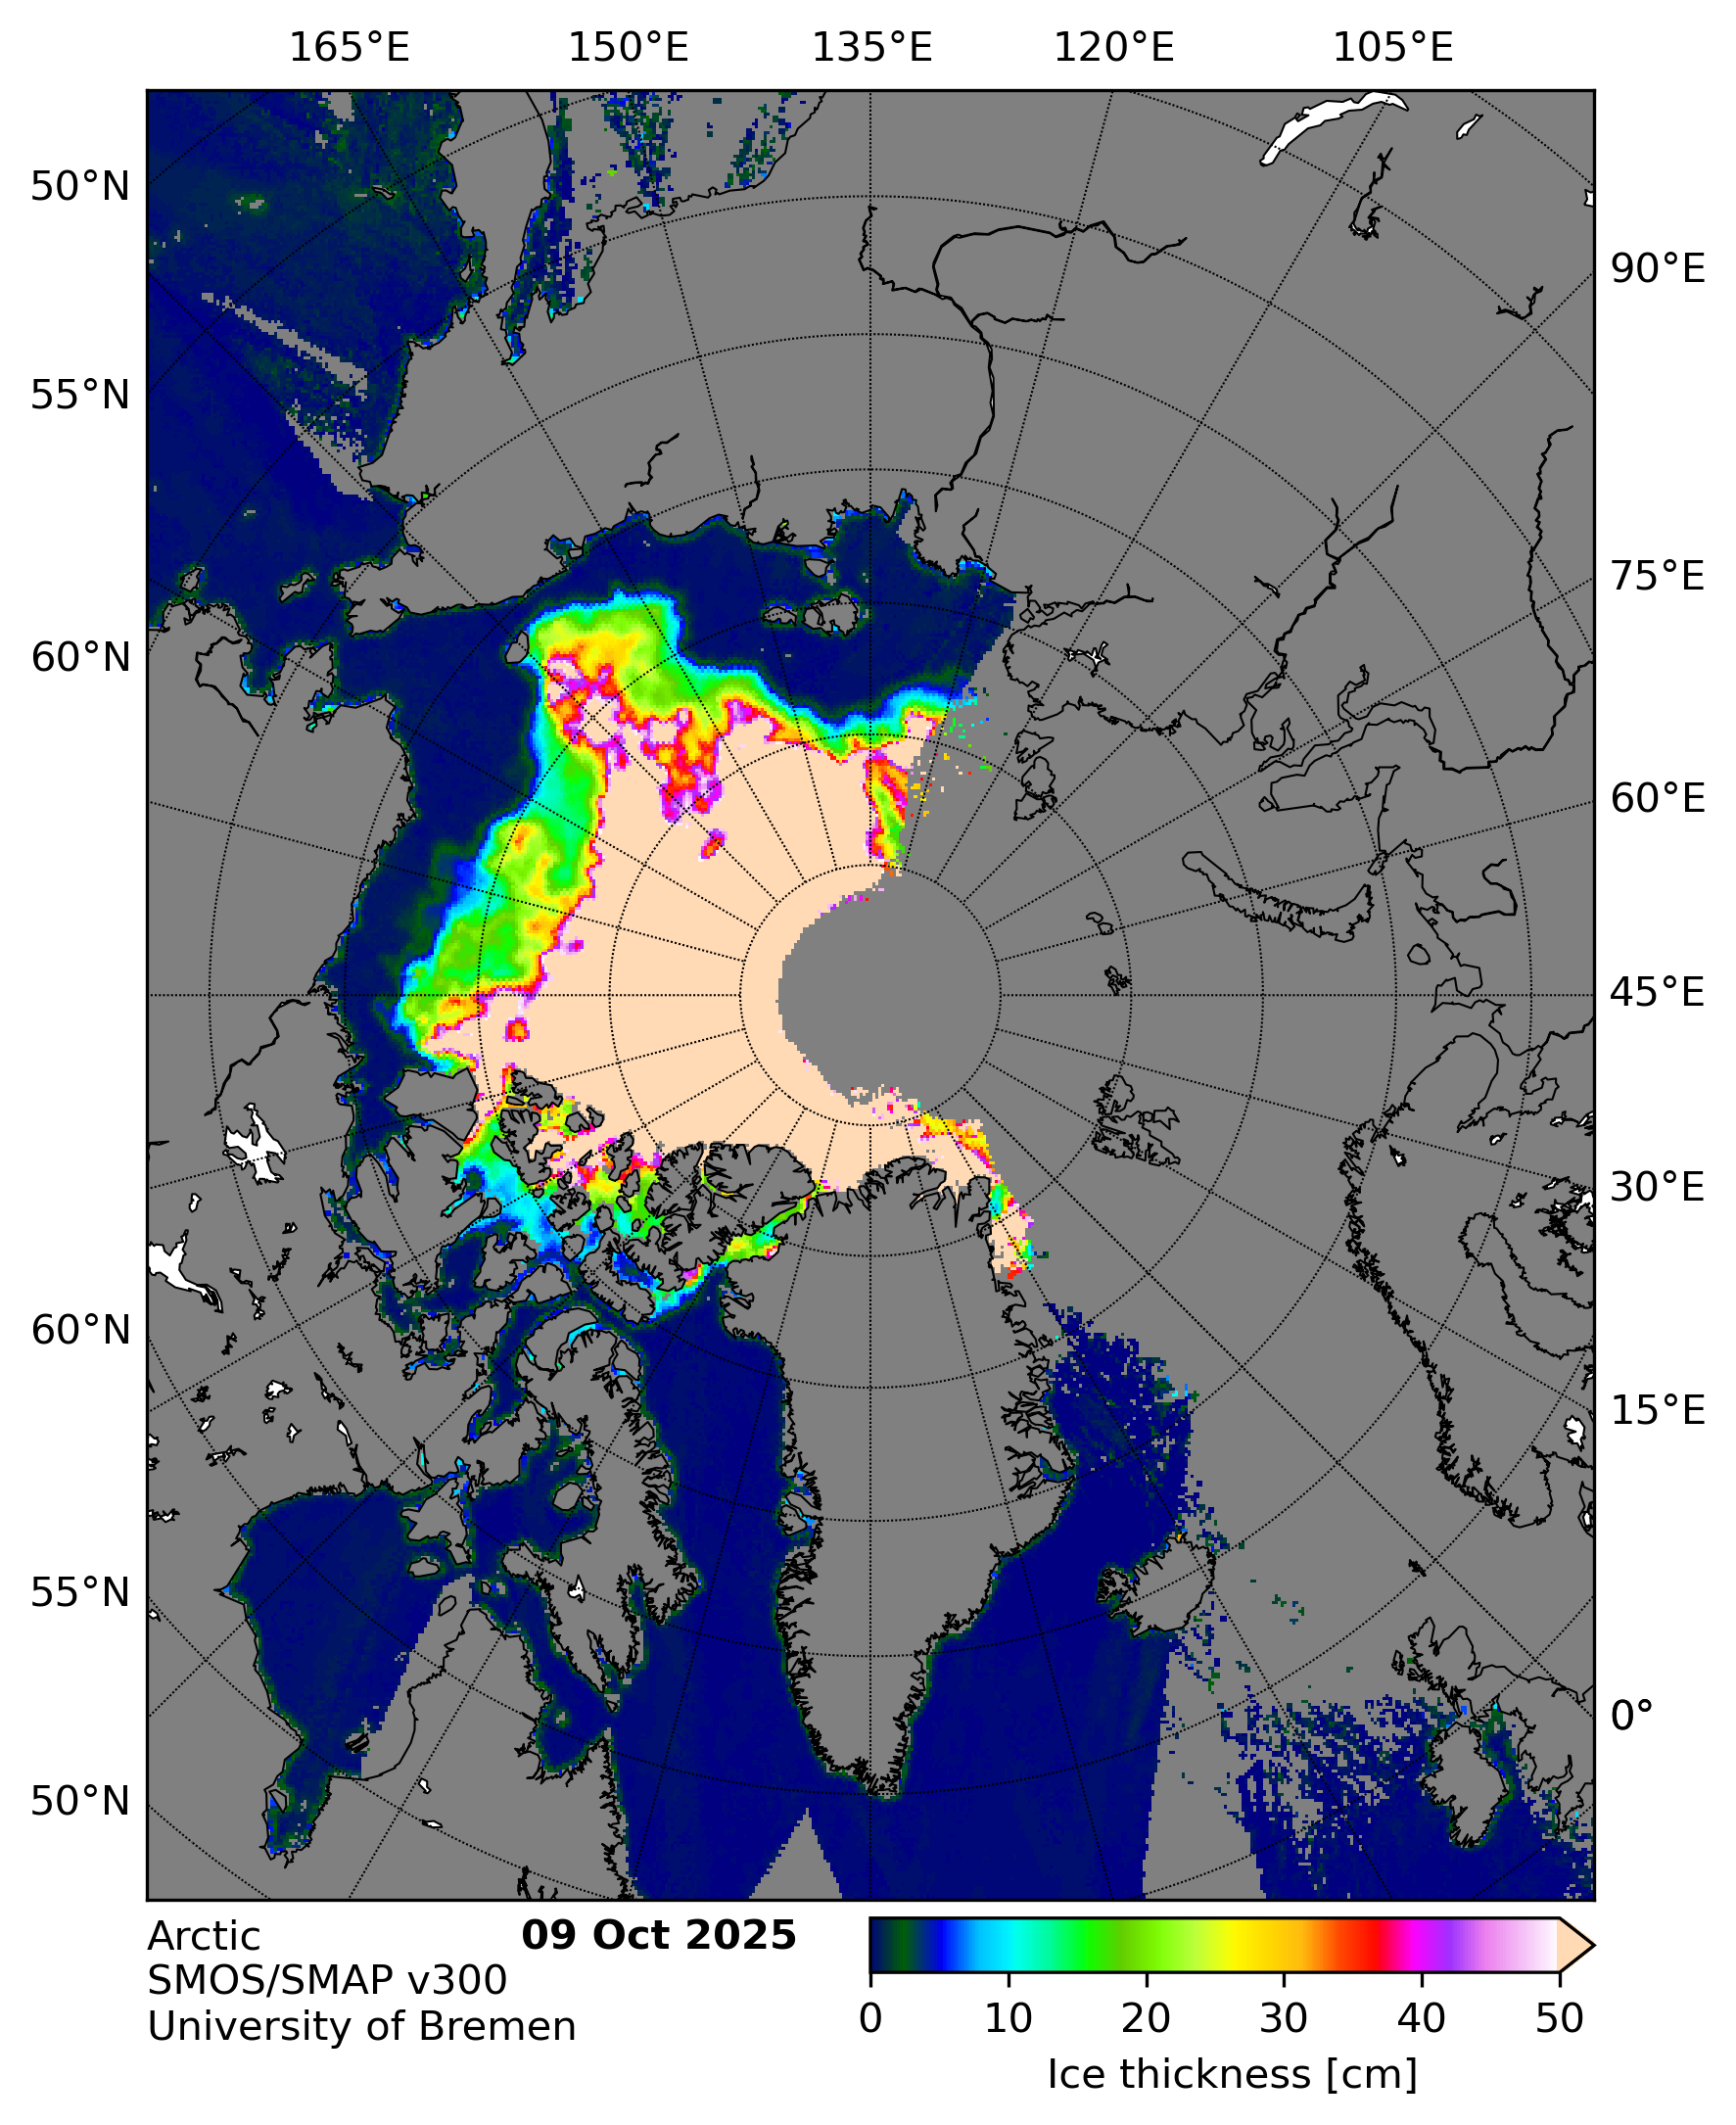
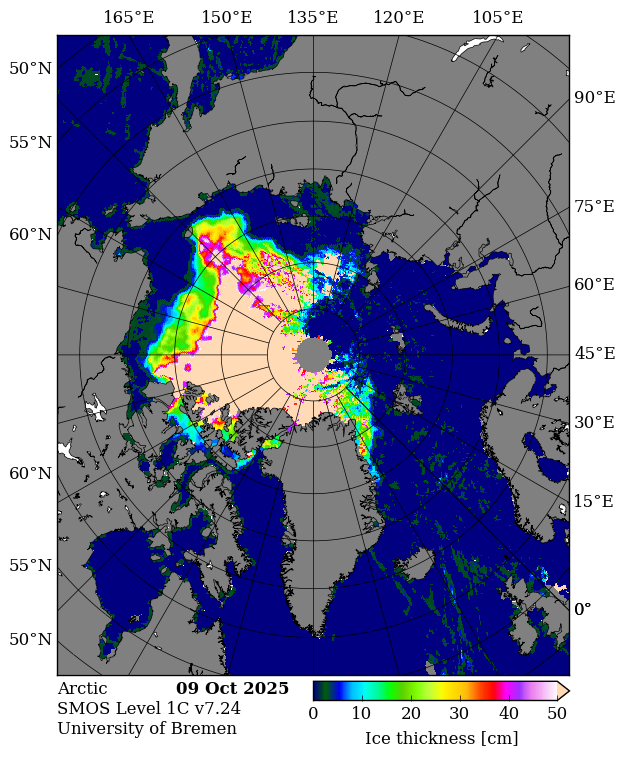
In the continuing absence of PIOMAS gridded thickness data (see below), here’s the latest SMOS/SMAP “thin ice thickness” map:
It appears to be badly affected by radio frequency interference on the Atlantic side of the Arctic. Here’s the raw SMOS map:
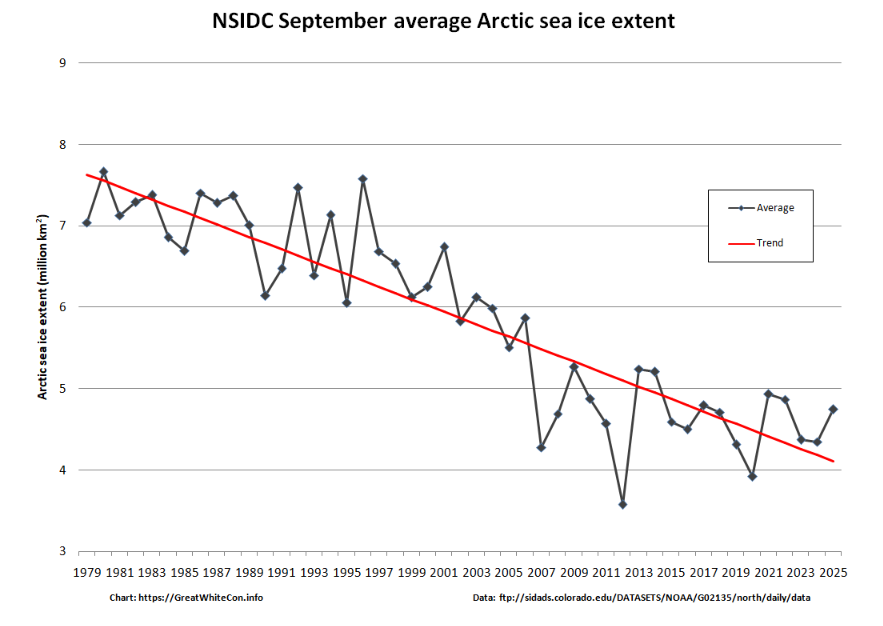
Further to a previous conversation on the subject, here’s the final NSIDC annual average extent graph for September:
As anticipated, 2025 annual average extent has proved to be the lowest in the satellite era.
[Update – October 16th]
I was hoping that the September edition of the NSIDC’s “Sea Ice Today” analysis would have been published by now, but no such luck. Here’s the latest data announcement from the NSIDC:
Effective October 15, 2025, due to non-renewed funding, NSIDC has suspended or reduced several Sea Ice Today tools and services.
Sea ice annual maximum and minimum announcements (typically occurring in March and September)
Previously-published Sea Ice Today analysis posts will remain online. The discontinued Sea Ice Today products will no longer update or be maintained, and will be removed in the next several weeks.
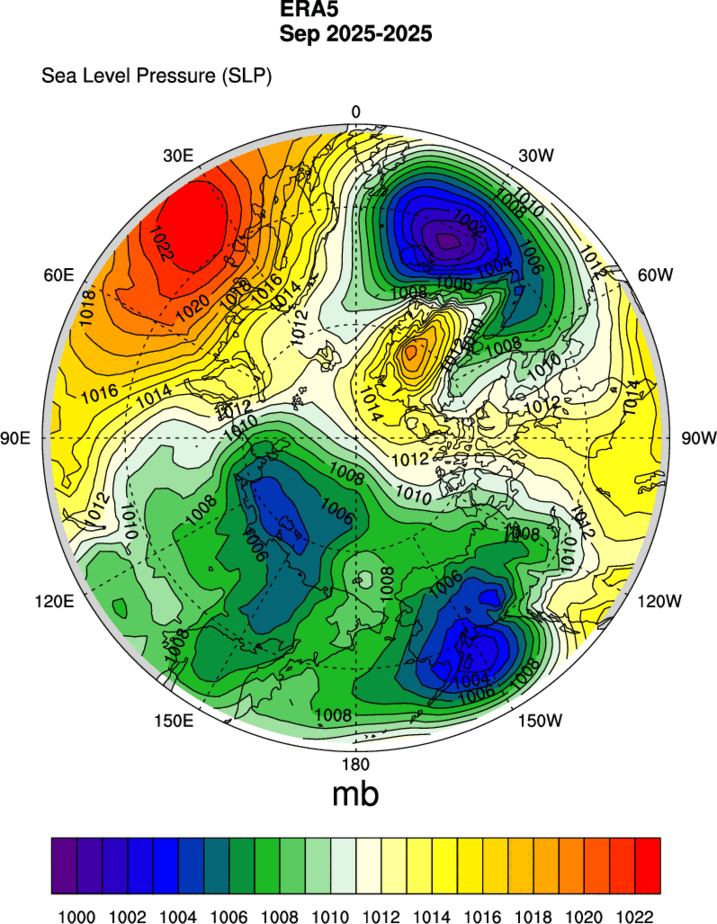
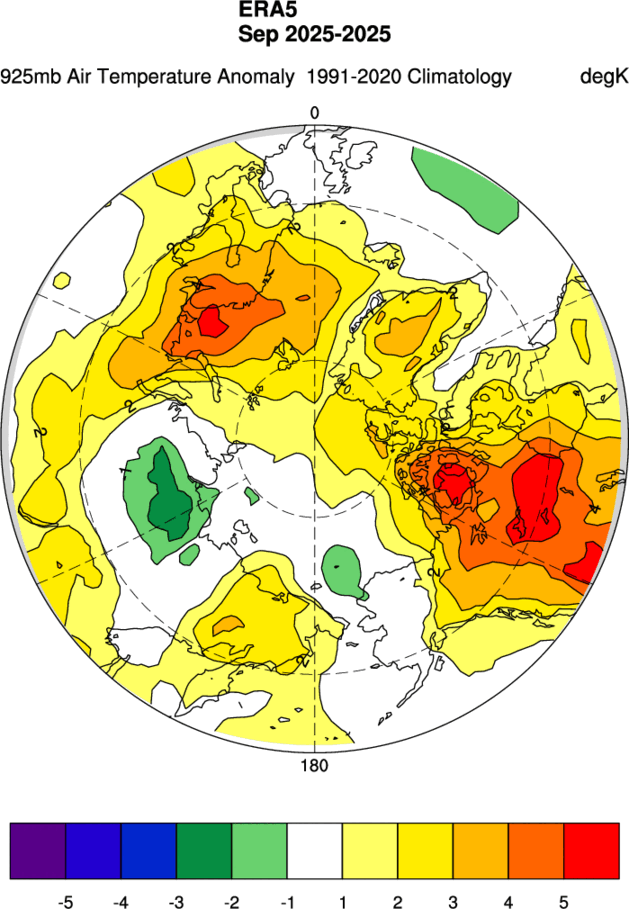
In Sea Ice Today’s absence, here’s the MSLP and 925 hPa temperature maps for September, usually contained in the monthly analysis articles:
Plus a hastily constructed graph of the monthly average extent for September:
The Arctic sea ice volume derived therefrom is 5.43 thousand km³. The data is accompanied by the following “Product Degradation Warning”:
SMOS input data continues to be affected by persistent and frequent radio-frequency interference (RFI) in the Barents, Kara, and Laptev Seas, resulting in missing thin ice thickness measurements. Consequently, sea ice thickness estimates for this region in the product will rely exclusively on radar altimeter data, which may lead to higher reported values than would have been obtained using SMOS.
[Update – October 27th]
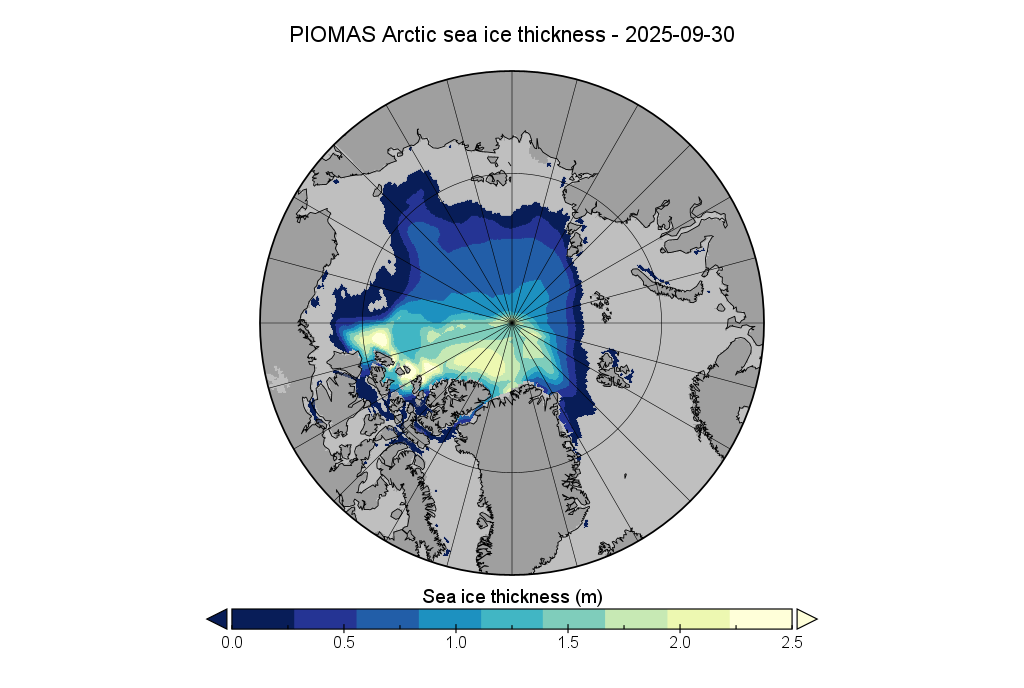
The PIOMAS gridded thickness data for September 2025 has been belatedly released:
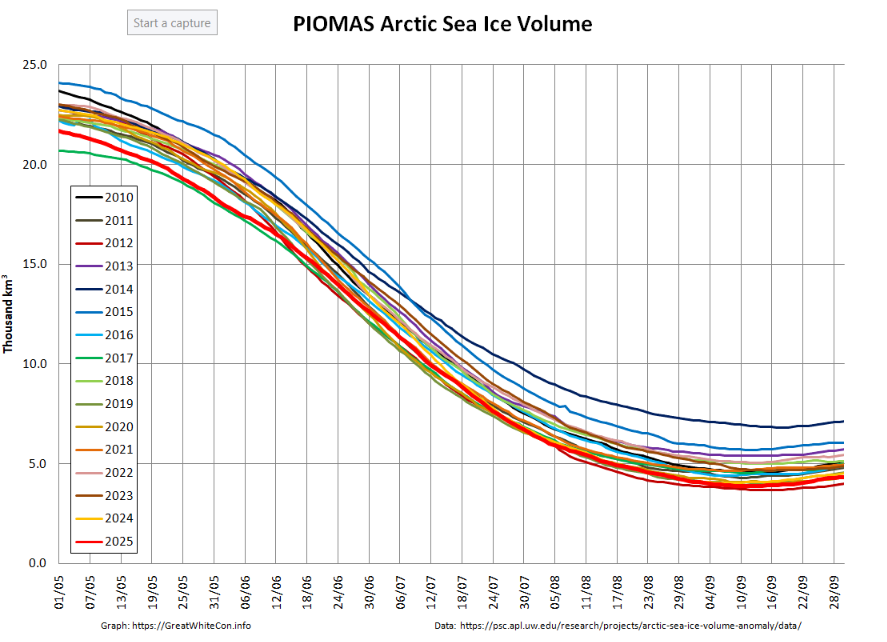
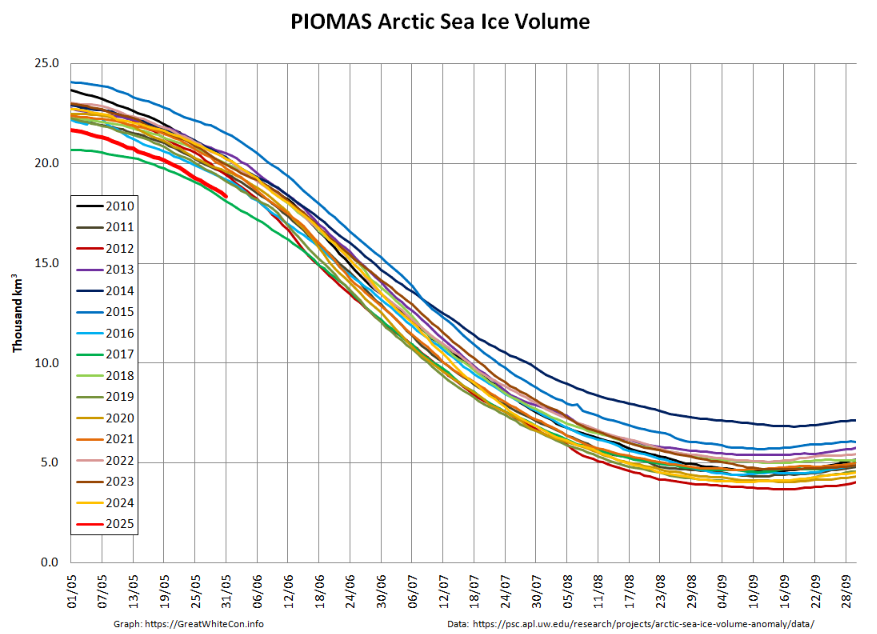
The associated volume graph reveals that the 2025 minimum modelled Arctic sea ice volume was 3.87 thousand km³ on September 12th, which is the 2nd lowest minimum in the PIOMAS record going back to 1979:
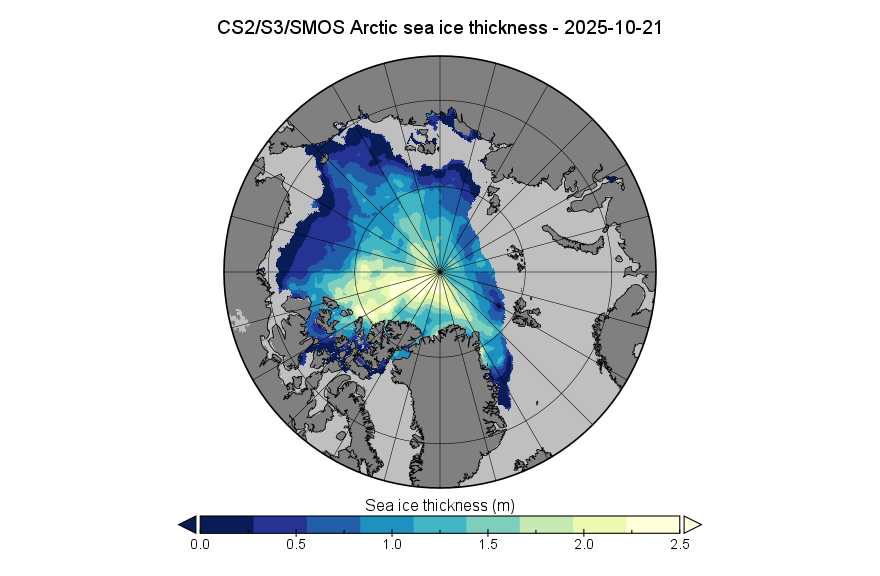
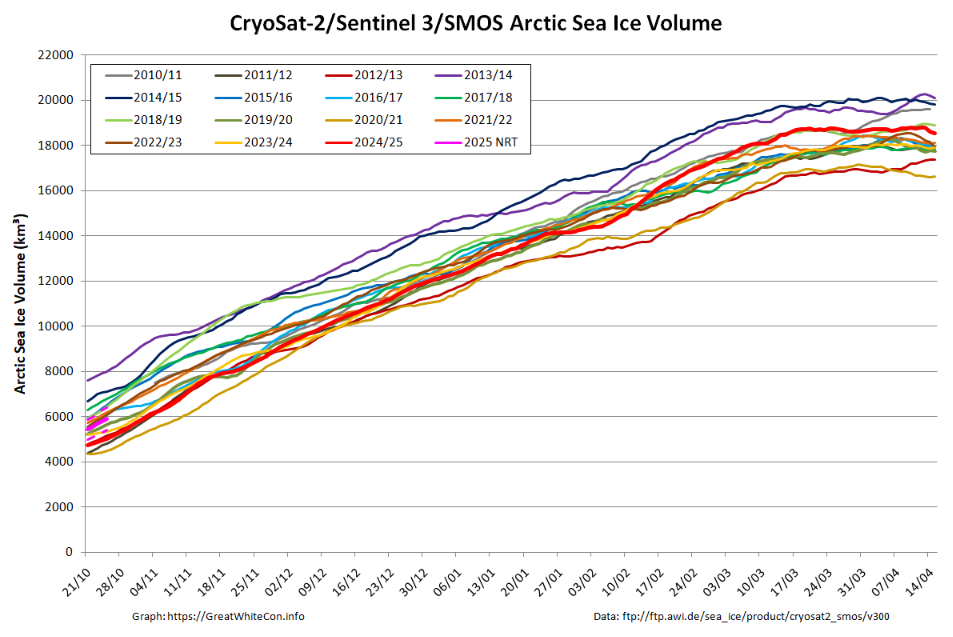
Whilst we’re on the topic of sea ice volume, here’s the latest “measured” volume graph:
Note the proviso about recent SMOS data above, and also that the version 3.00 data from AWI is currently only available beginning in Autumn 2023. Prior years shown on the graph above are based on version 2.06 data, which amongst other things does not incorporate Sentinel 3 data.
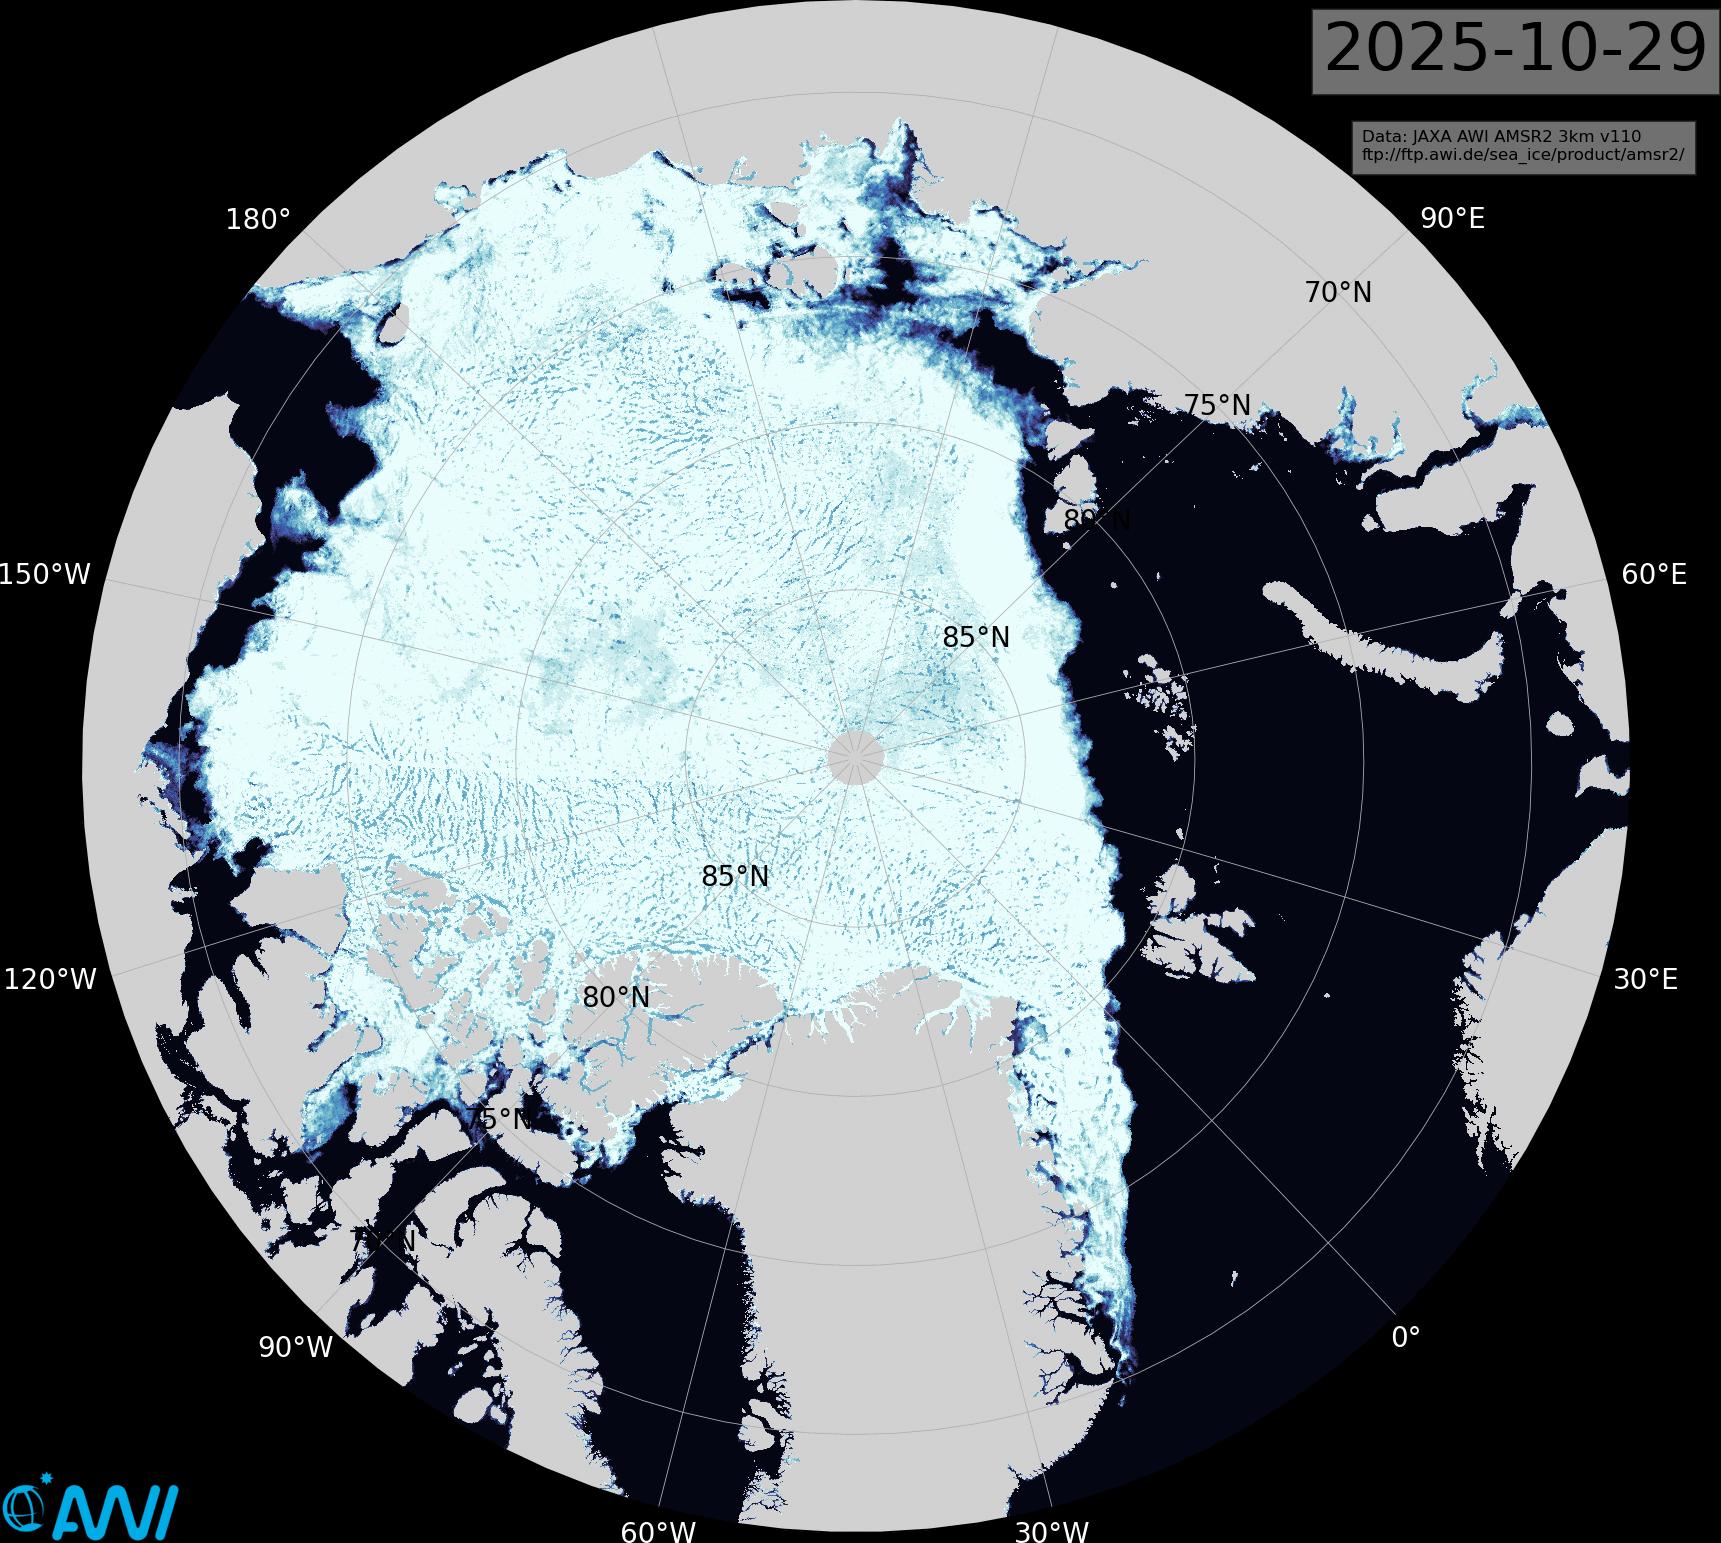
[Update – October 29th]
Much of the Siberian side of the Arctic Ocean has now refrozen:
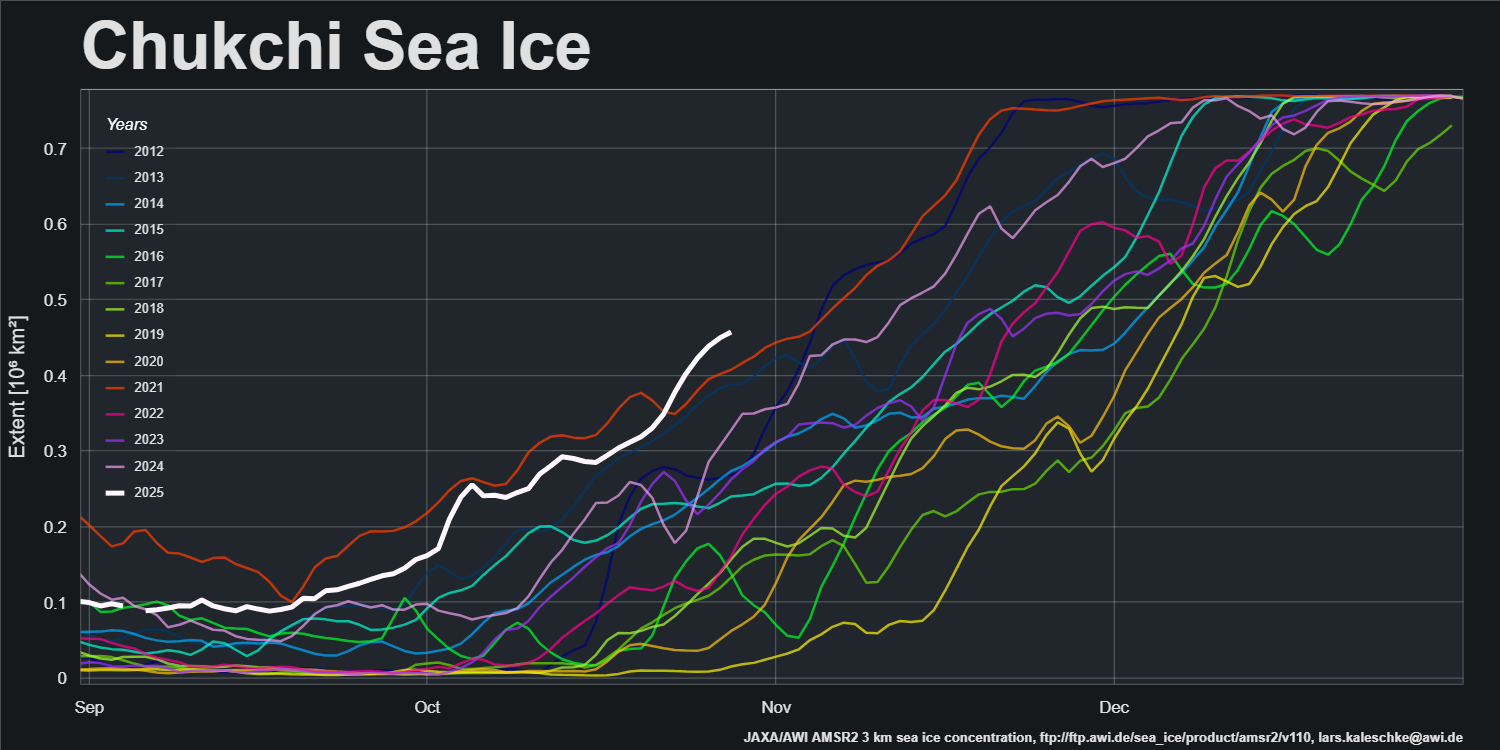
There is a significant difference between progress of the refreeze on the the Pacific and Atlantic sides of the Arctic. Extent in the Chukchi Sea is currently highest for the date in the AMSR2 record:
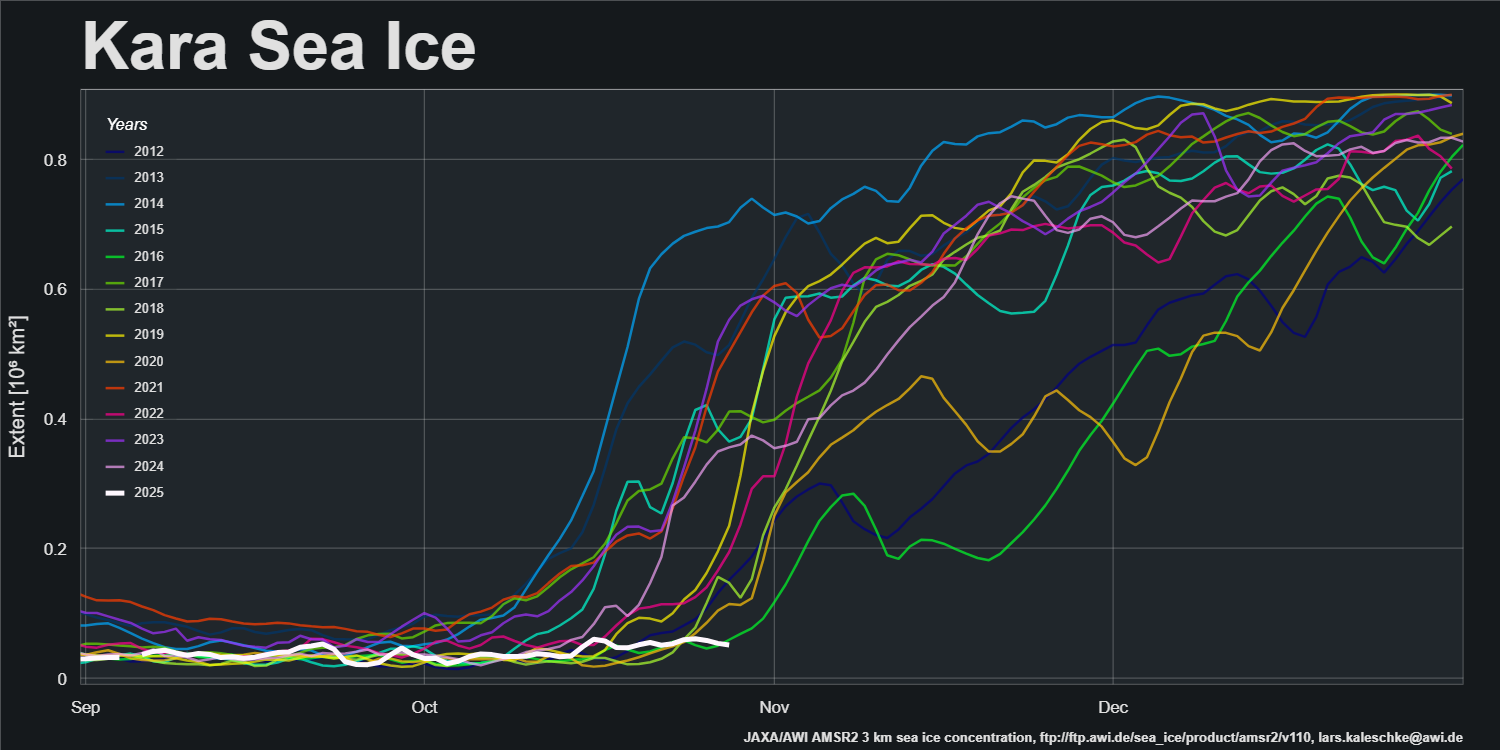
However, refreeze of the Kara Sea has yet to begin, and extent is currently lowest for the date in the AMSR2 record:
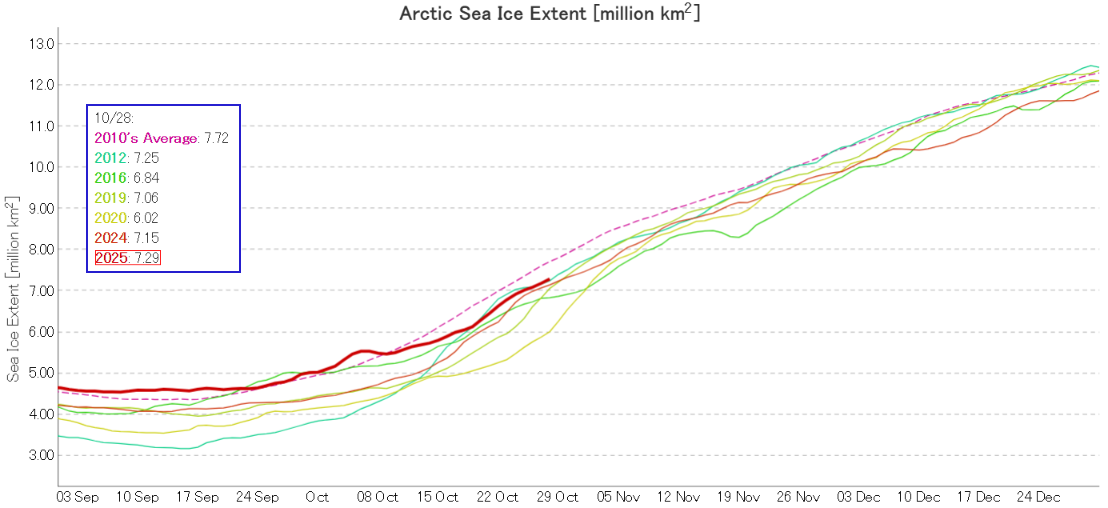
Pan Arctic JAXA/ViSHOP extent is now 6th lowest in the satellite era:
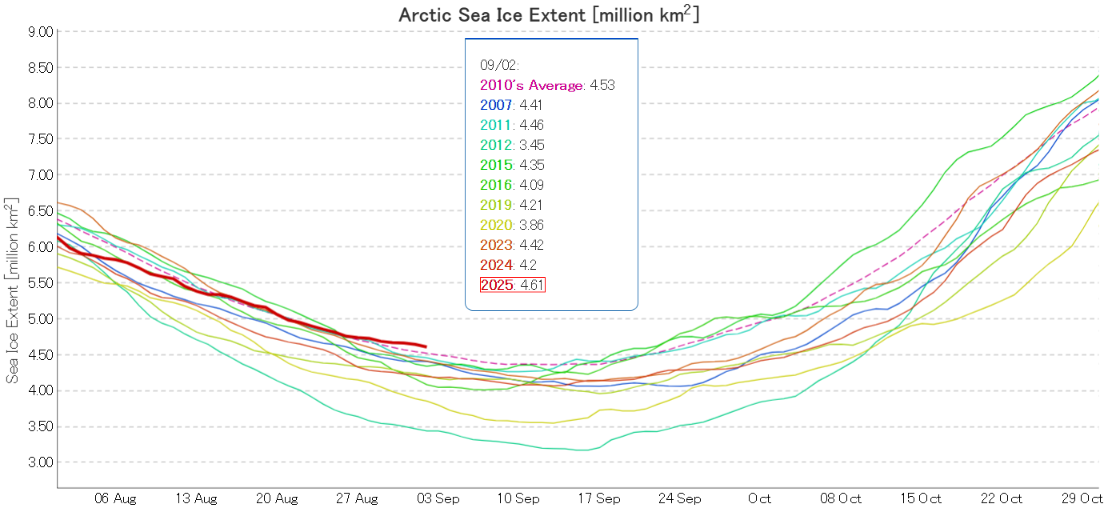
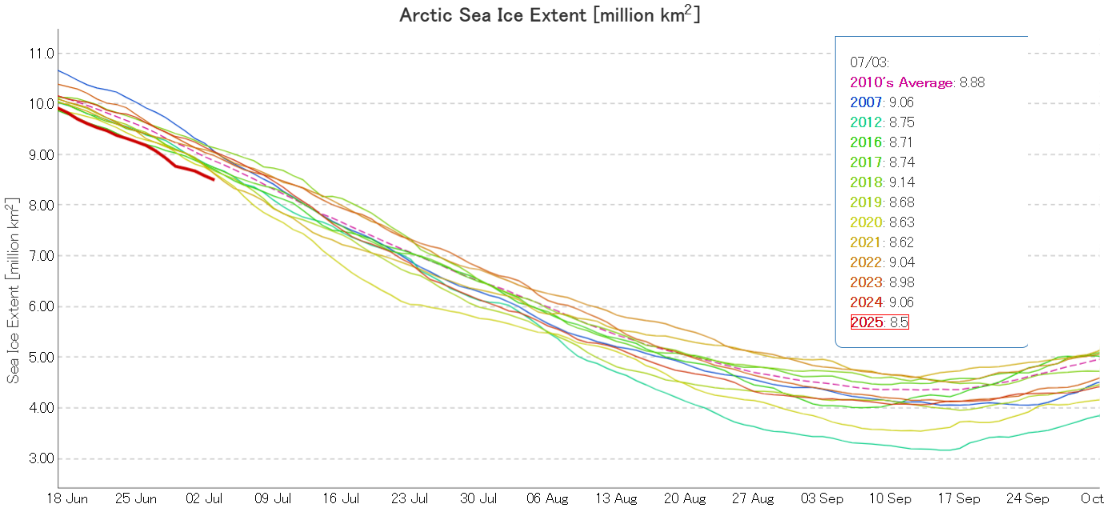
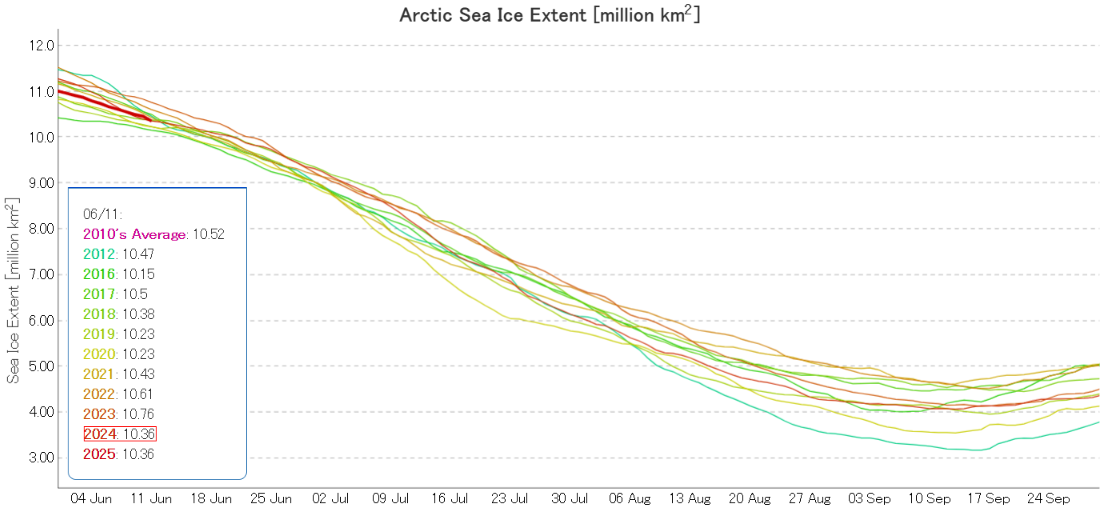
At the beginning of last month JAXA/ViSHOP extent was third lowest for the date in the satellite era. With the date of the 2025 minimum extent rapidly approaching that is no longer the case:
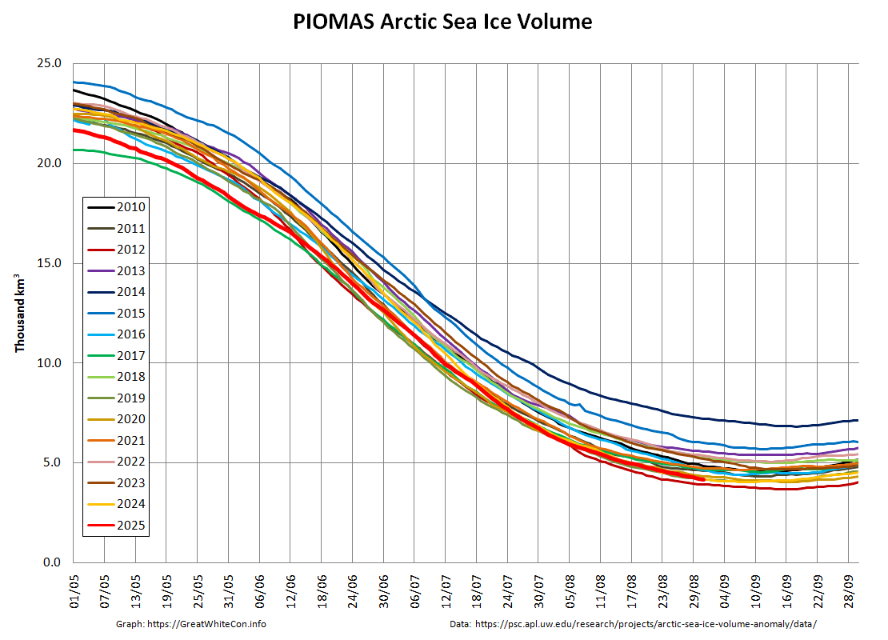
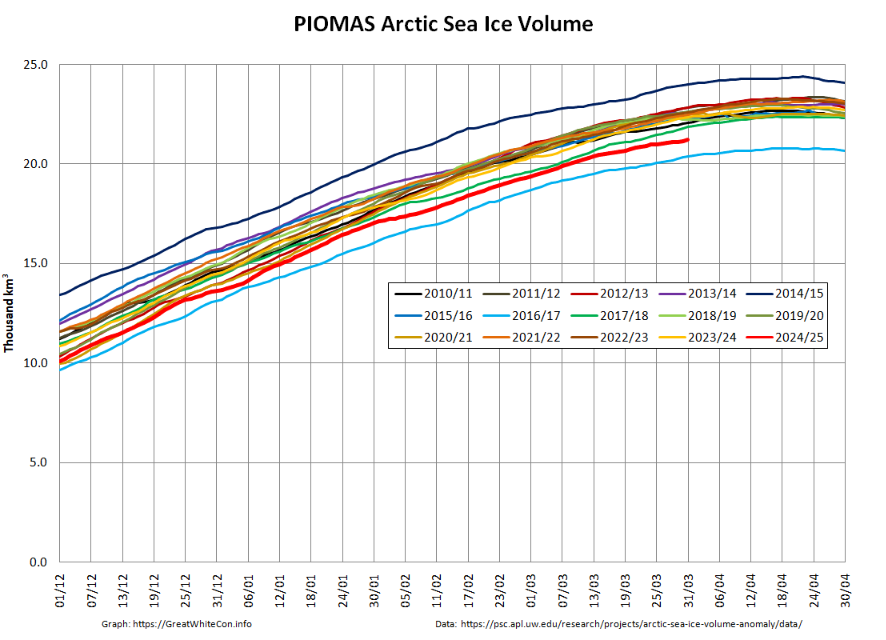
Whilst JAXA extent is now 10th lowest, PIOMAS volume remains second lowest for the date:
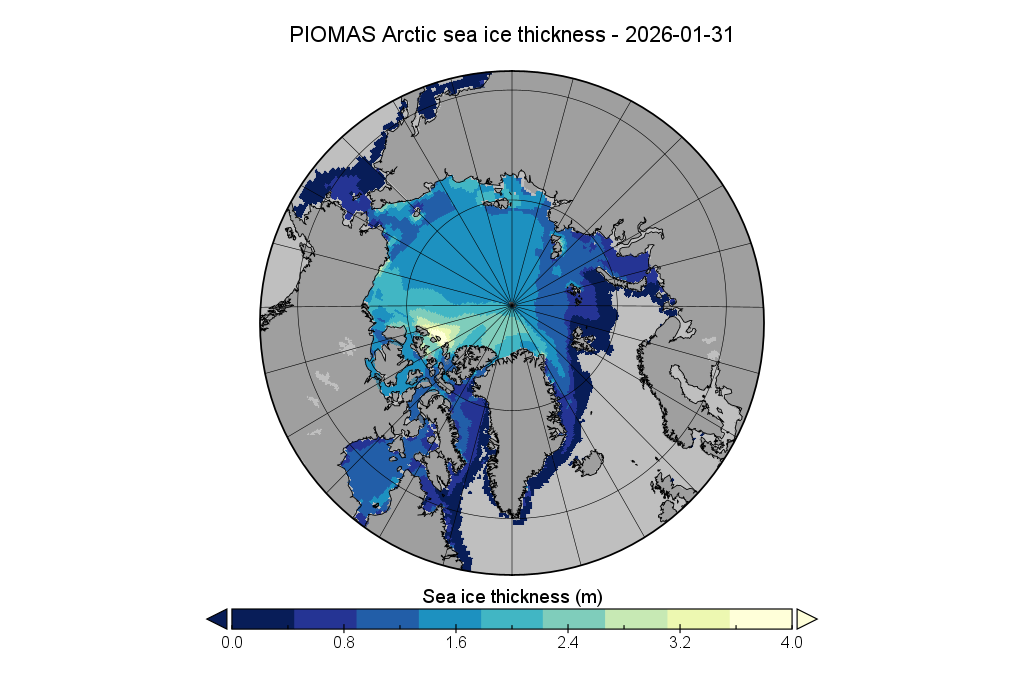
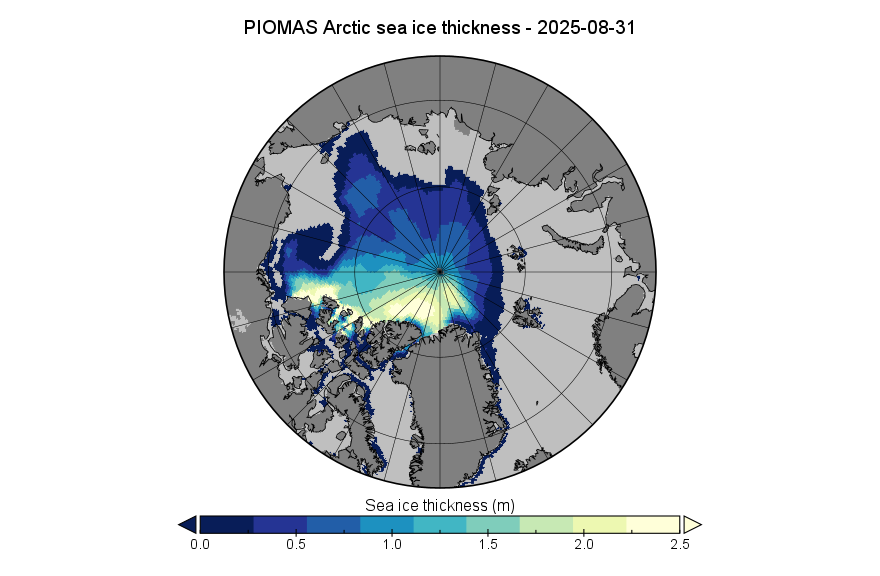
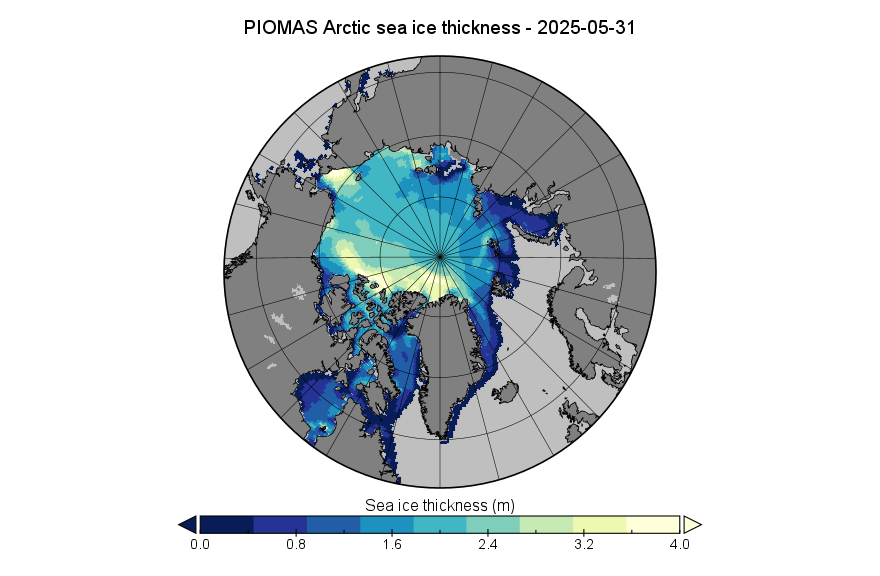
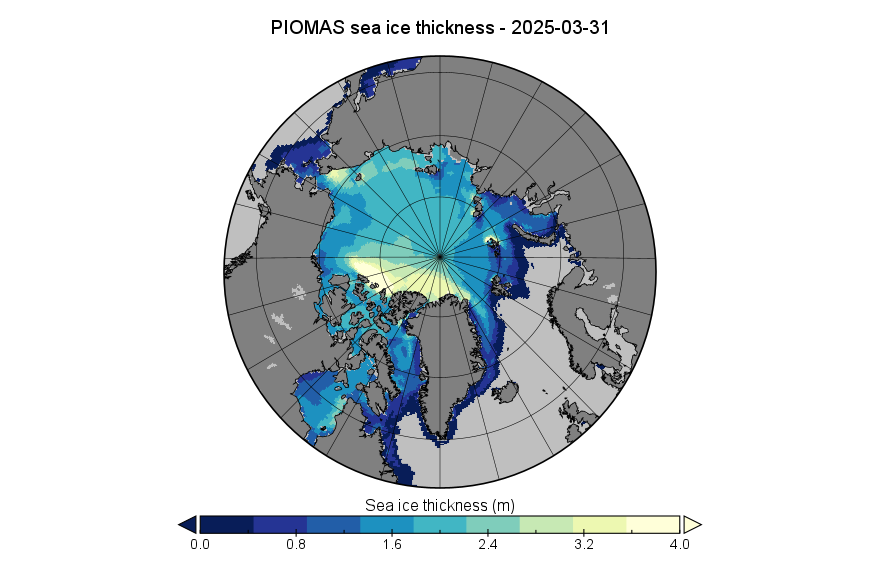
Here’s the associated thickness map. Note the change of scale from last month
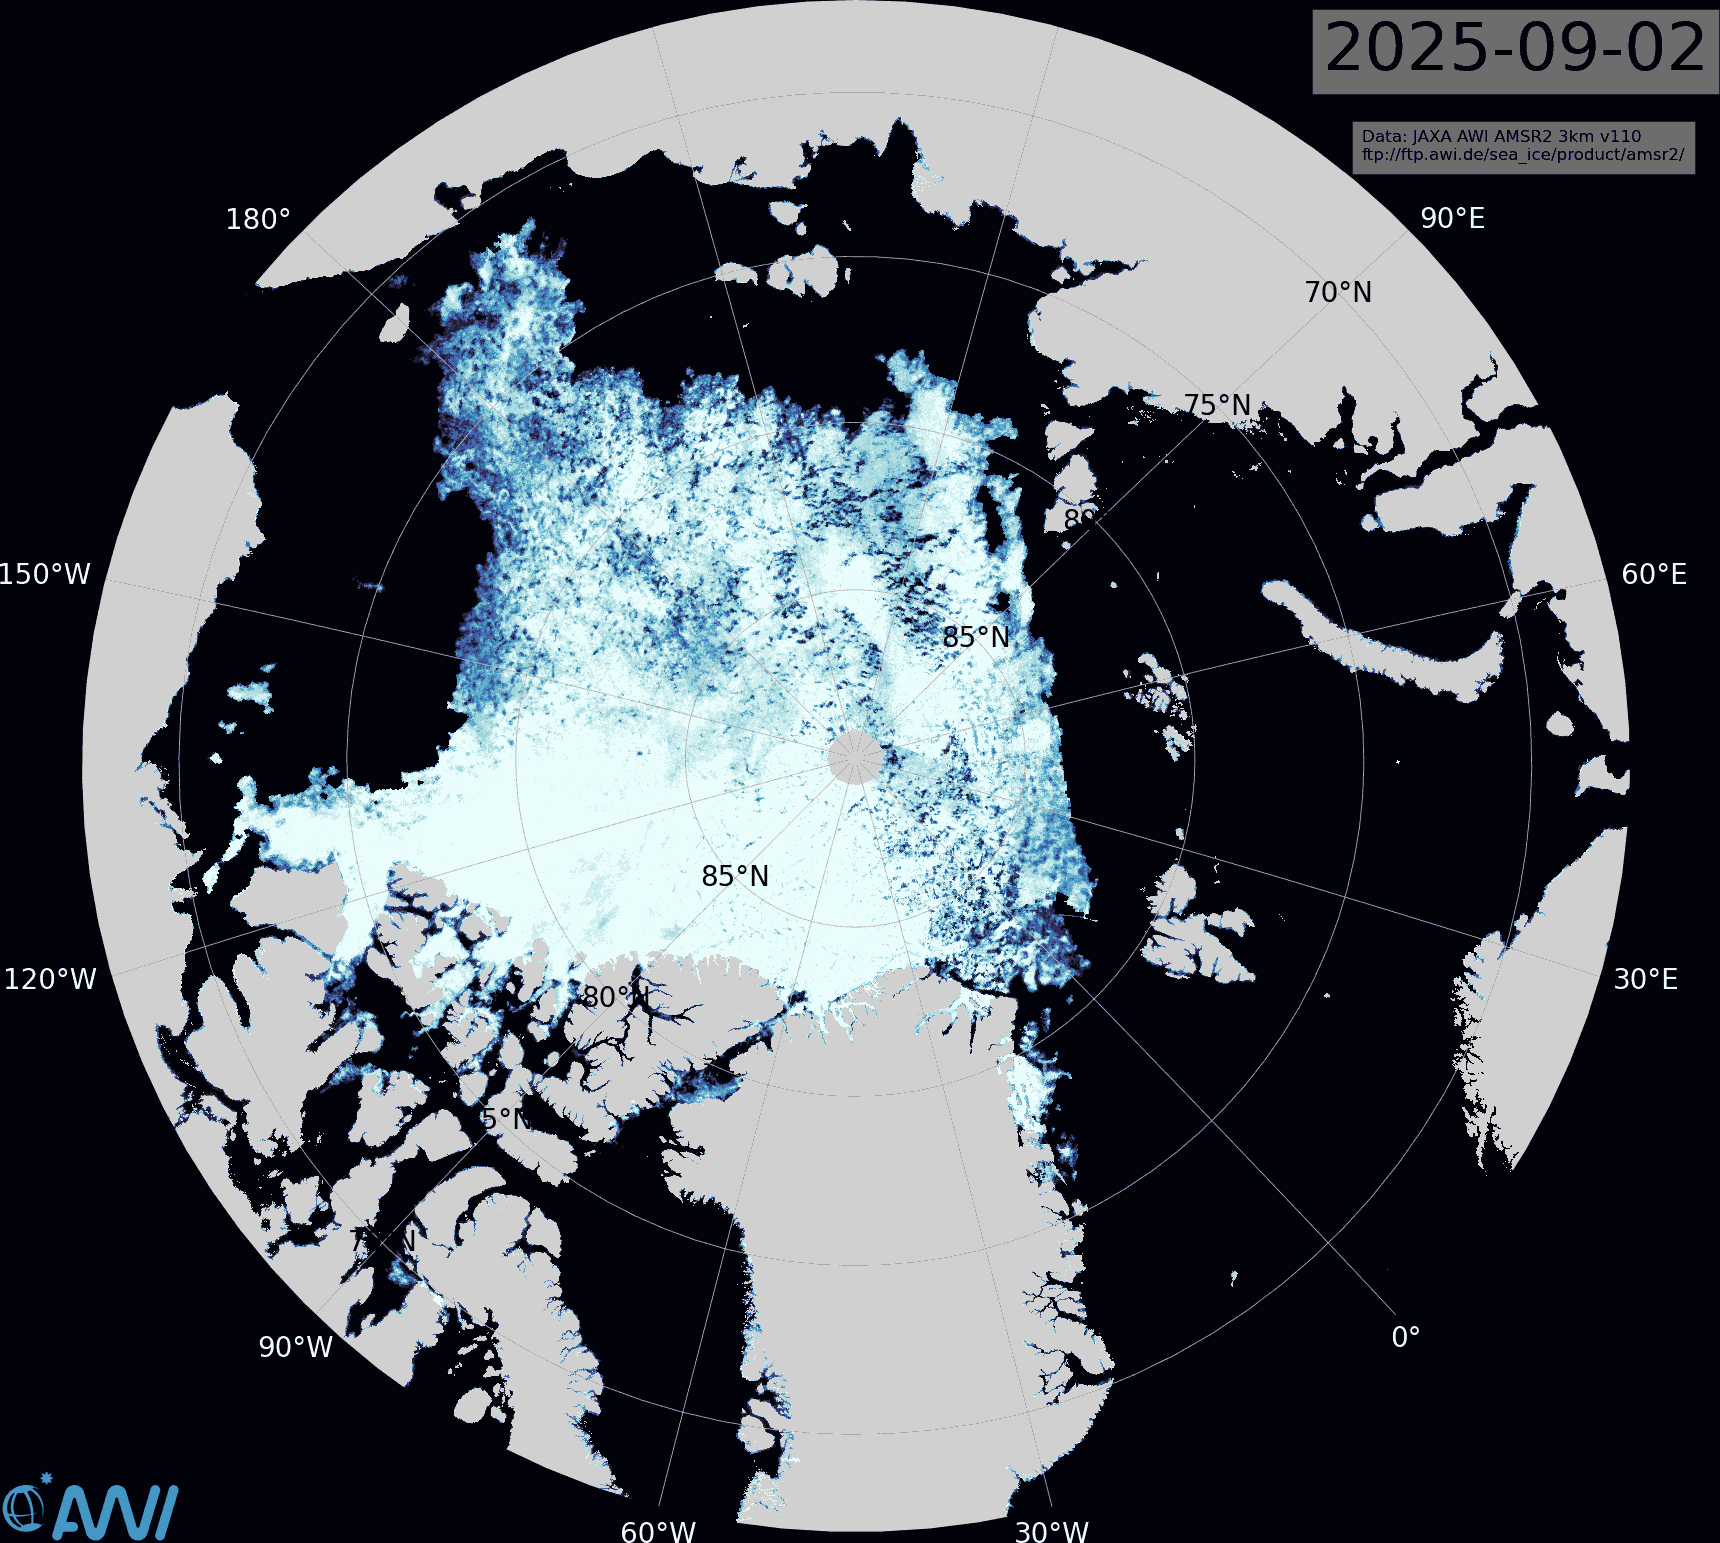
Compare and contrast that map with the AWI’s sea ice concentration map, particularly in the Beaufort Sea area:
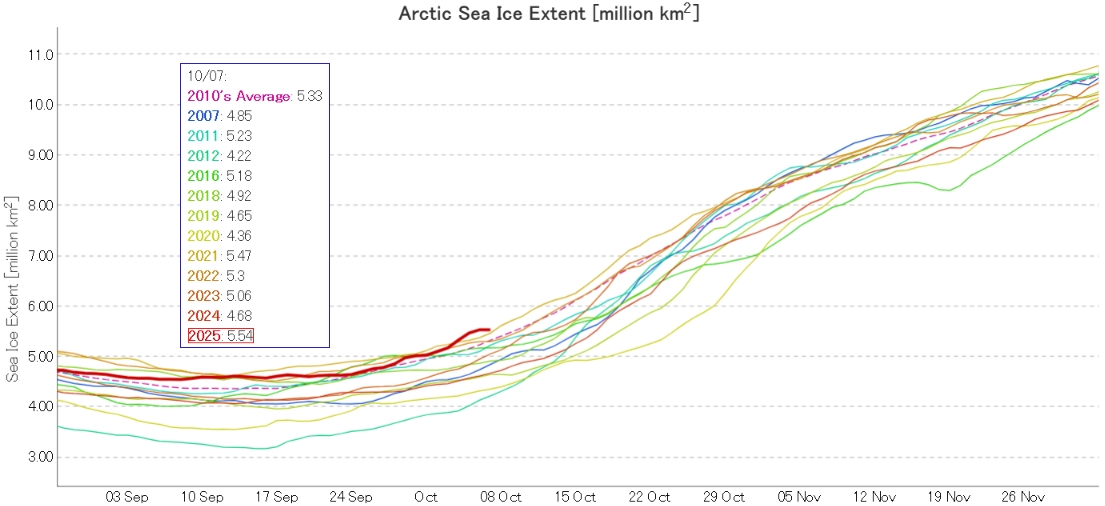
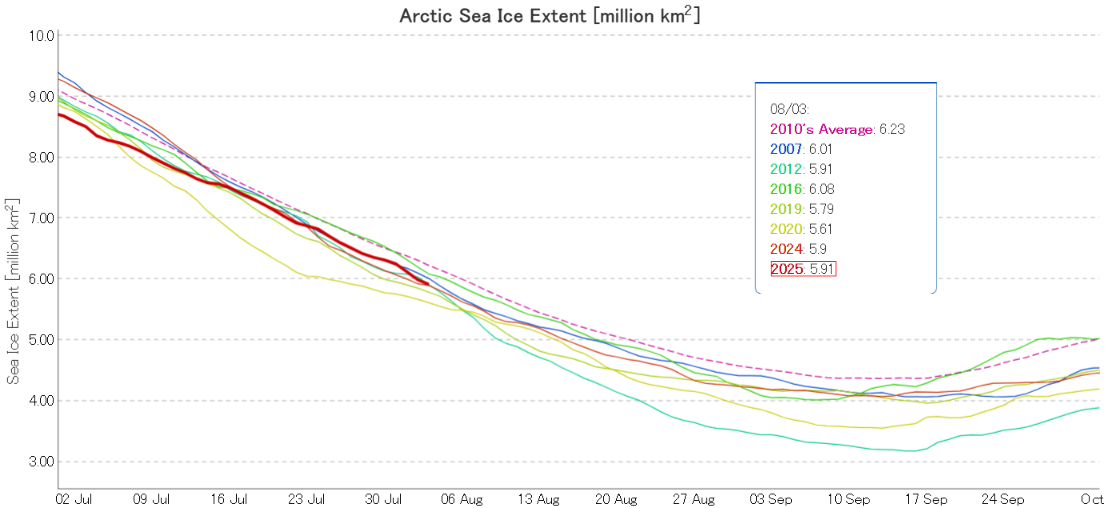
At the beginning of August JAXA/ViSHOP extent is in a “statistical tie” for 3rd lowest for the date in the satellite era:
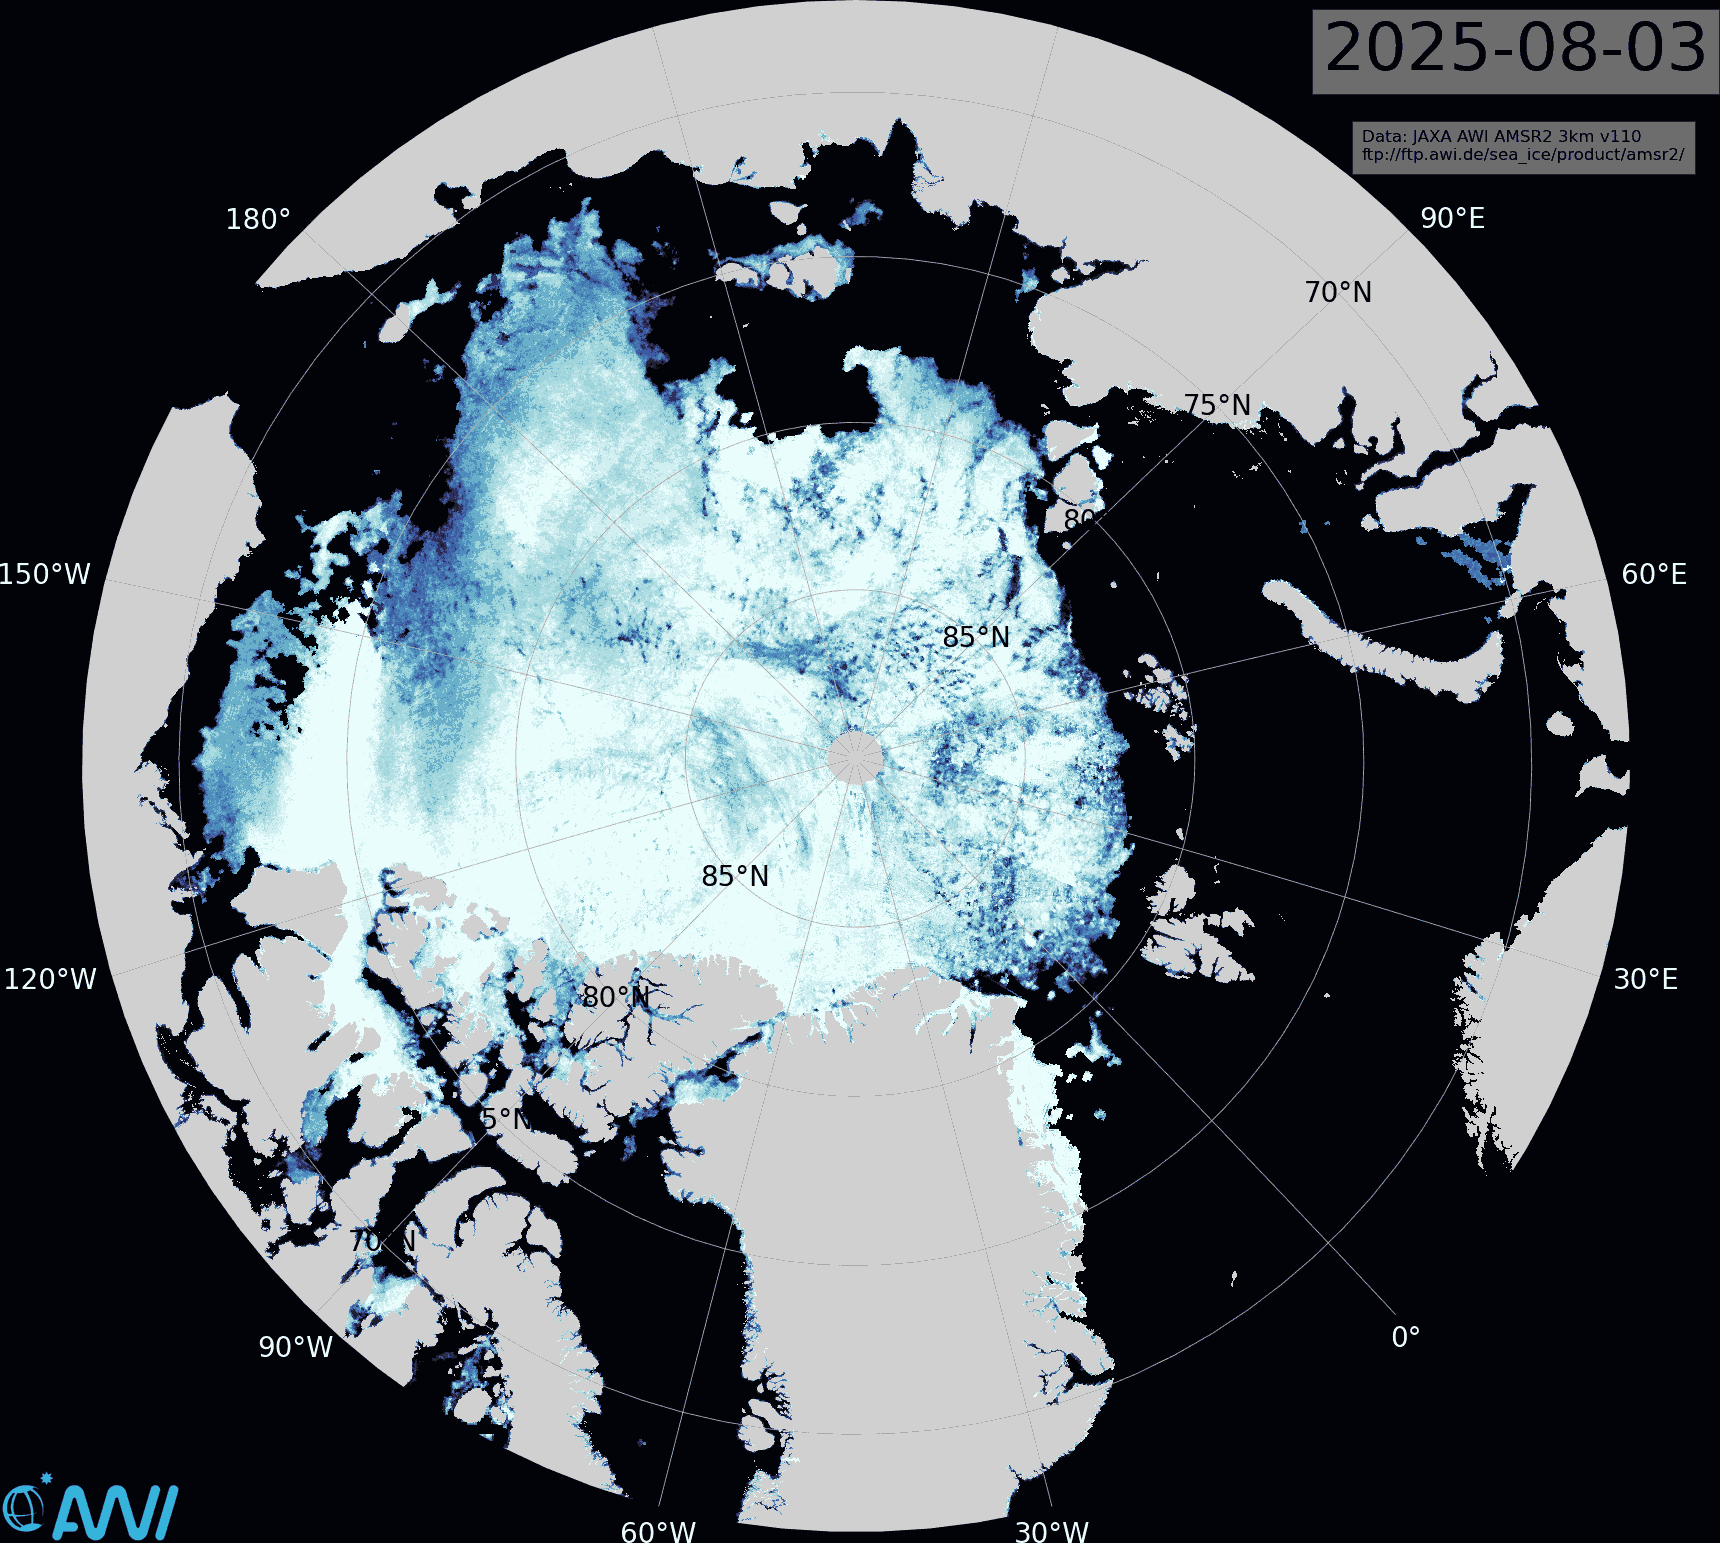
Extent has been declining rapidly for the past few days, and further losses look likely in the Beaufort Sea on either side of an arm of high concentration ice visible in the Alfred Wegener Institute’s map of sea ice concenration:
The ice on the Atlantic side of the Arctic is starting to look highly fragmented, all the way to the North Pole.
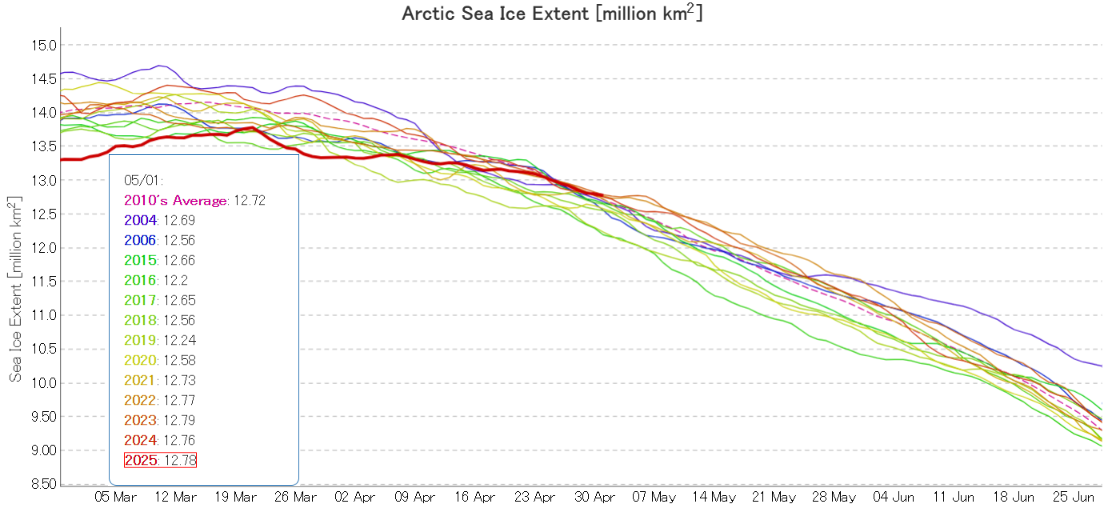
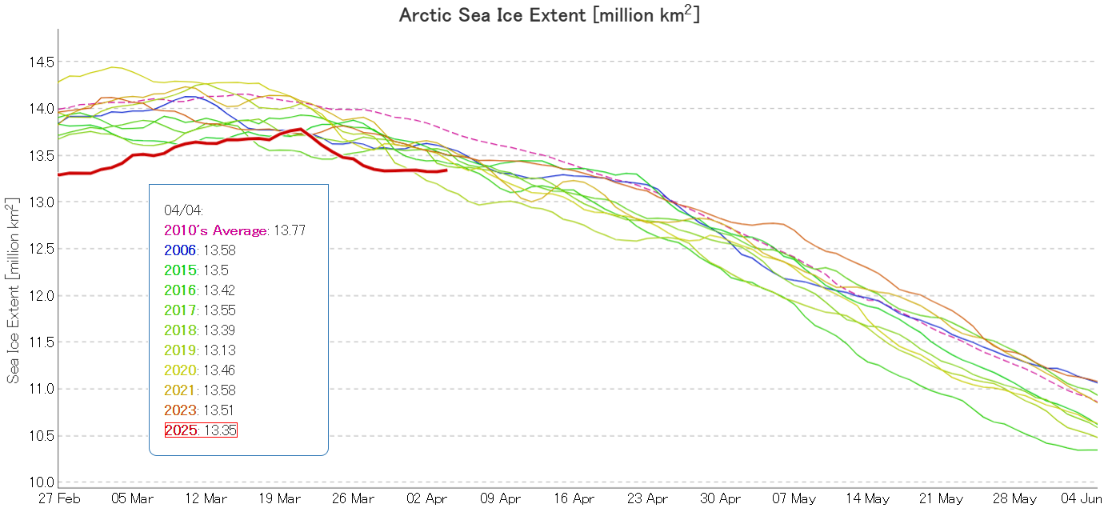
JAXA/ViSHOP extent is no longer “lowest for the date”! After “flatlining” for most of April the metric is now in the midst of a close knit group of the other years in the 2020s:
The high pressure area over the Central Arctic persisted through the second half of April, and so did the consequent drift of ice from the Pacific side of the Arctic to the Atlantic periphery:
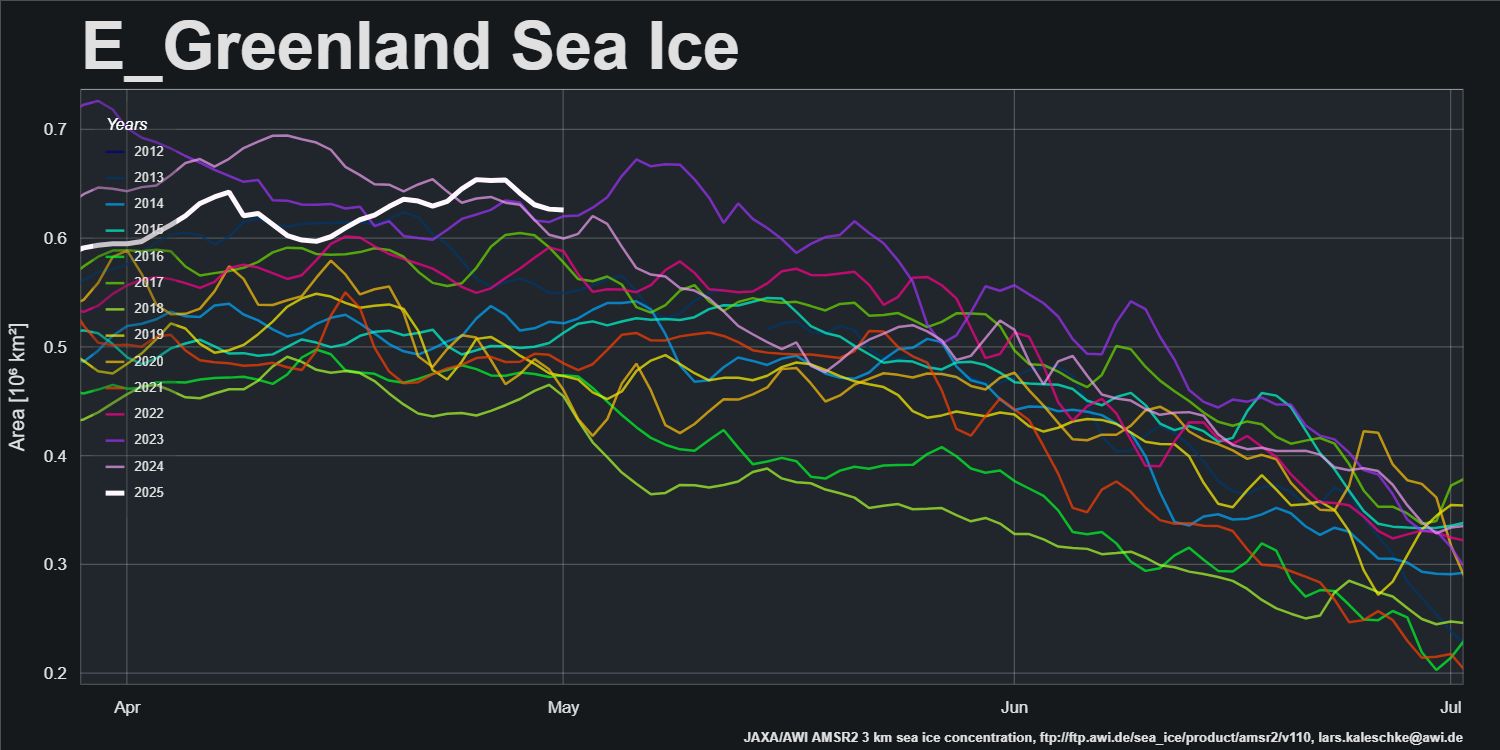
AWI’s sea ice area for the Greenland Sea is currently “highest for the date” in the AMSR2 record that started in July 2012:
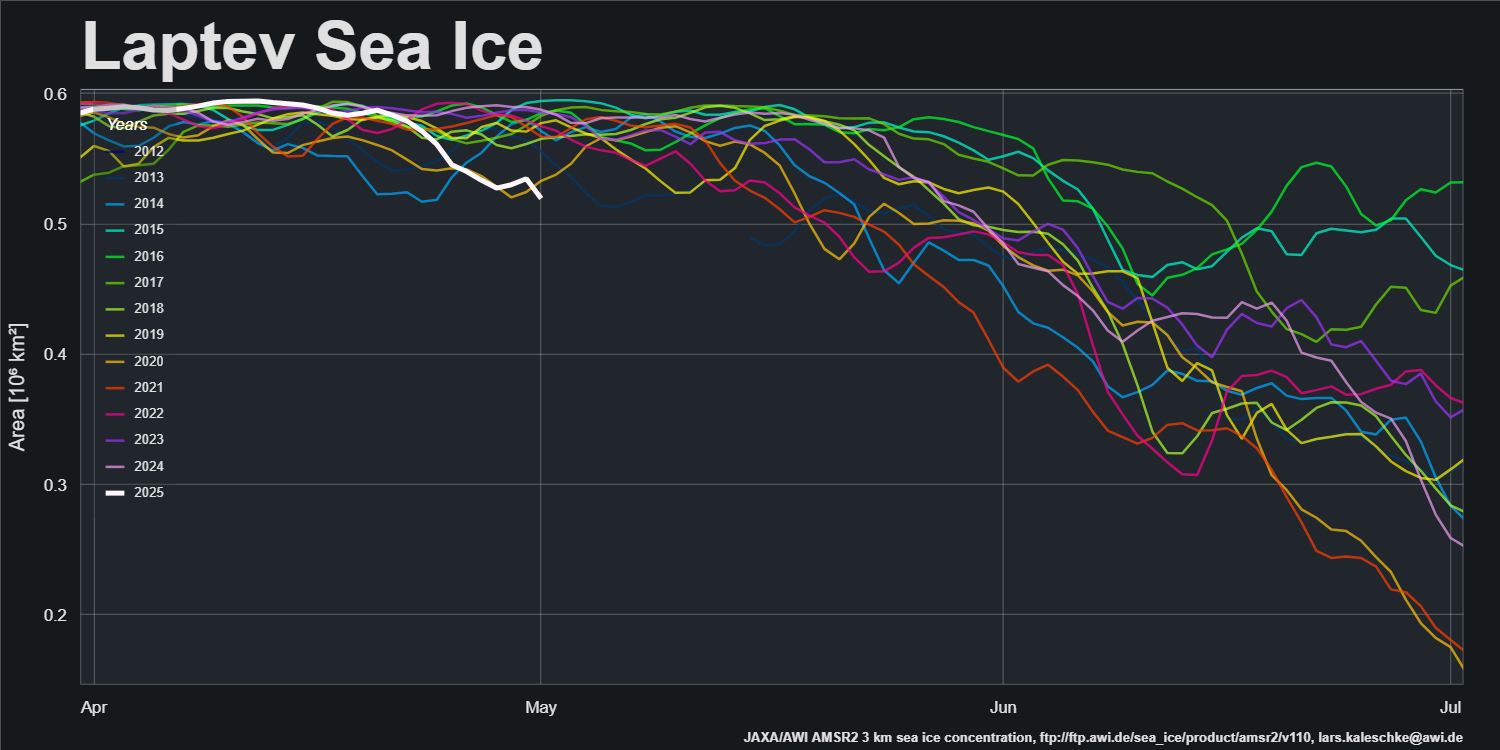
The offshore winds along the Laptev Sea coast have continued, and sea ice area is now “lowest for the date”:
The first signs of a break in the high pressure dominance are appearing. GFS currently forecasts that a low pressure area will enter the Central Arctic, bring above zero temperatures over the Kara Sea on Sunday:
This website uses cookies to improve your experience. We'll assume you're ok with this, but you can opt-out if you wish. Cookie settingsACCEPT
Privacy & Cookies Policy
Privacy Overview
This website uses cookies to improve your experience while you navigate through the website. Out of these, the cookies that are categorized as necessary are stored on your browser as they are essential for the working of basic functionalities of the website. We also use third-party cookies that help us analyze and understand how you use this website. These cookies will be stored in your browser only with your consent. You also have the option to opt-out of these cookies. But opting out of some of these cookies may affect your browsing experience.
Necessary cookies are absolutely essential for the website to function properly. This category only includes cookies that ensures basic functionalities and security features of the website. These cookies do not store any personal information.
Any cookies that may not be particularly necessary for the website to function and is used specifically to collect user personal data via analytics, ads, other embedded contents are termed as non-necessary cookies. It is mandatory to procure user consent prior to running these cookies on your website.