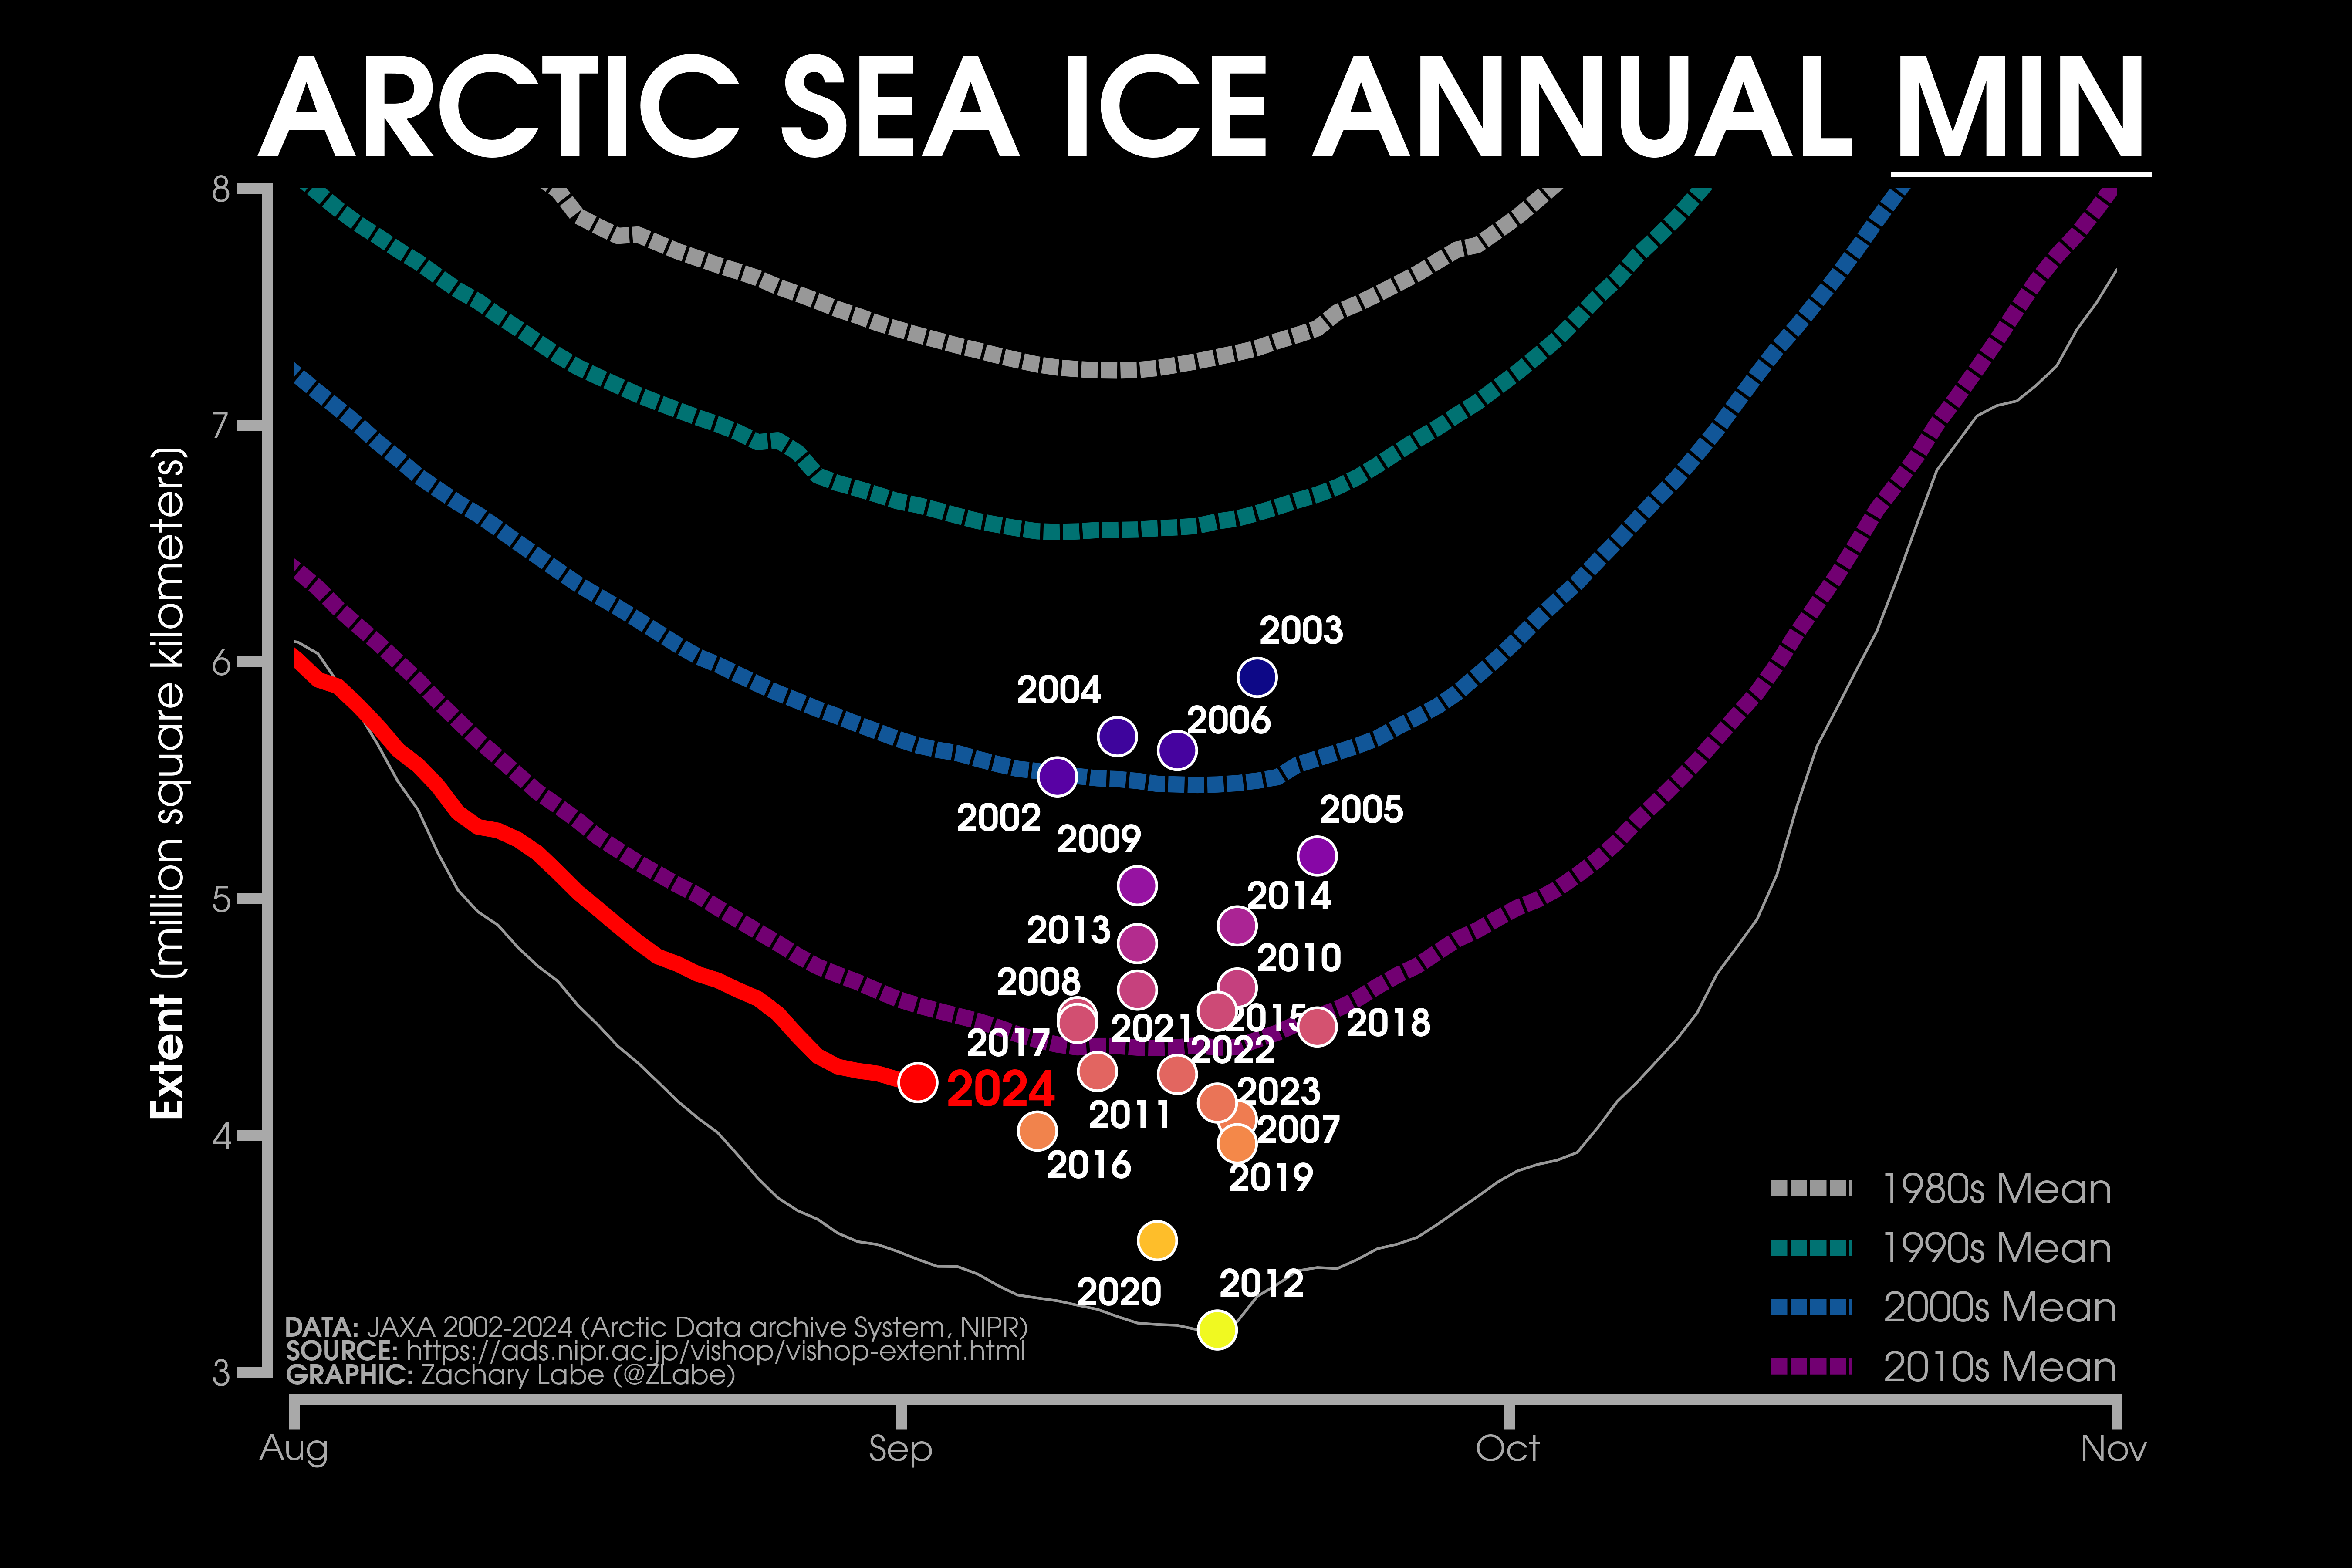
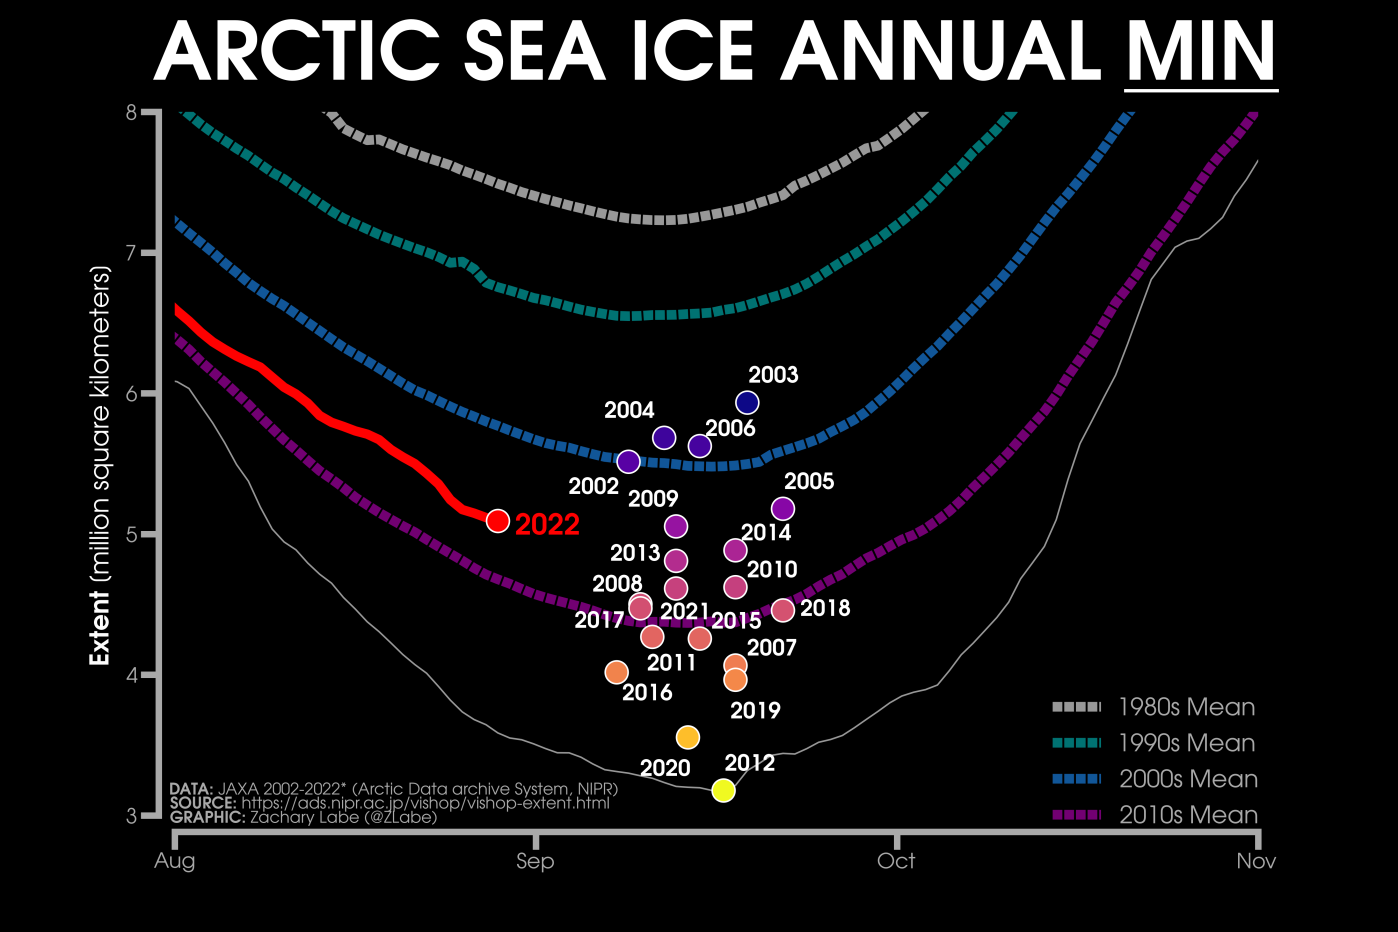
The 2024 Arctic sea ice minimum extent will almost certainly occur at some point over the next month. The exact date and level will vary from one extent metric to the next. Here’s a comparison of the current JAXA extent with previous minima, courtesy of Zack Labe:
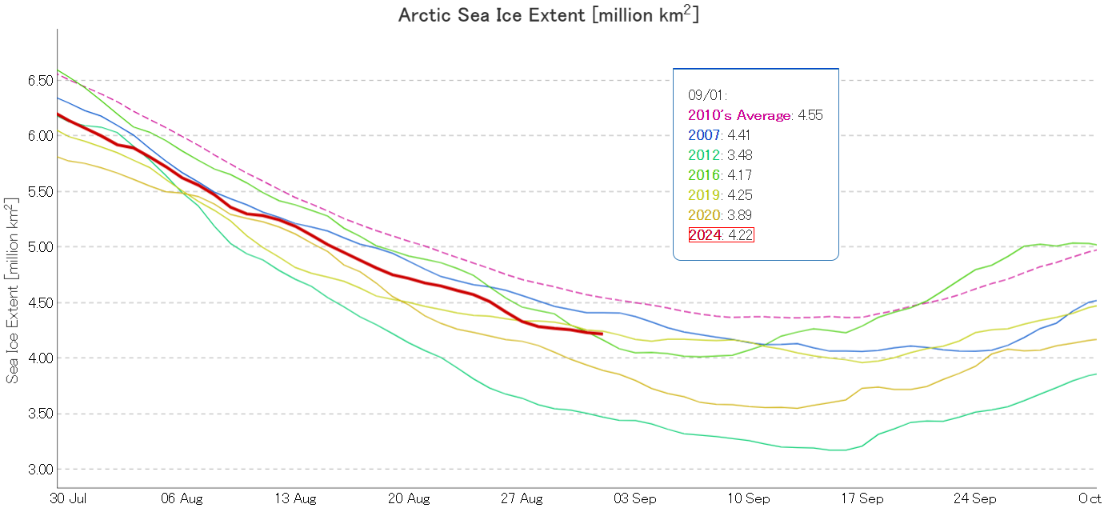
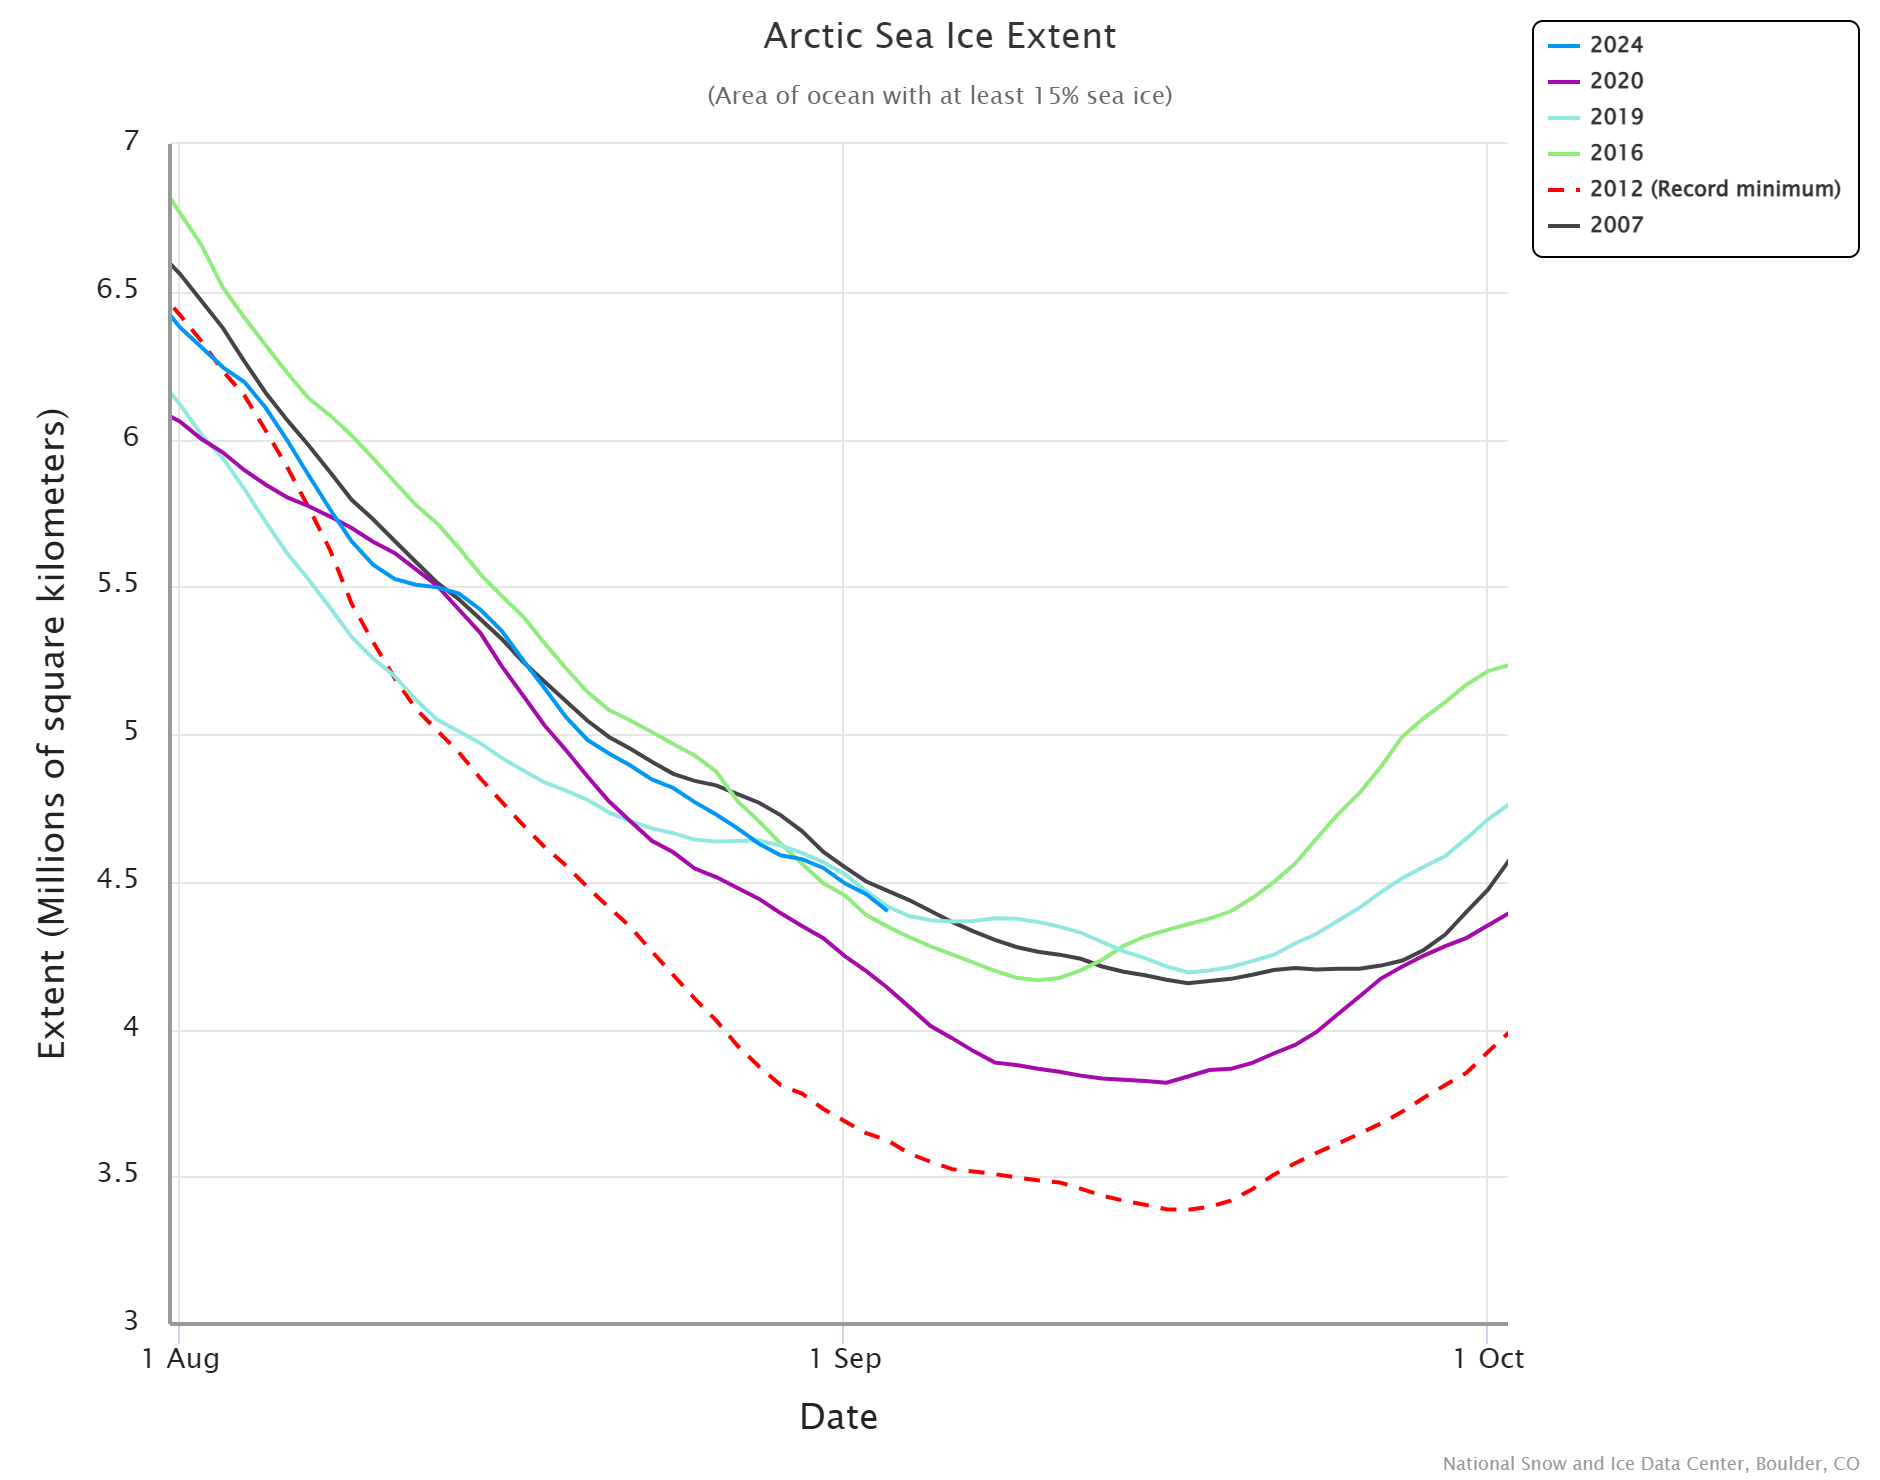
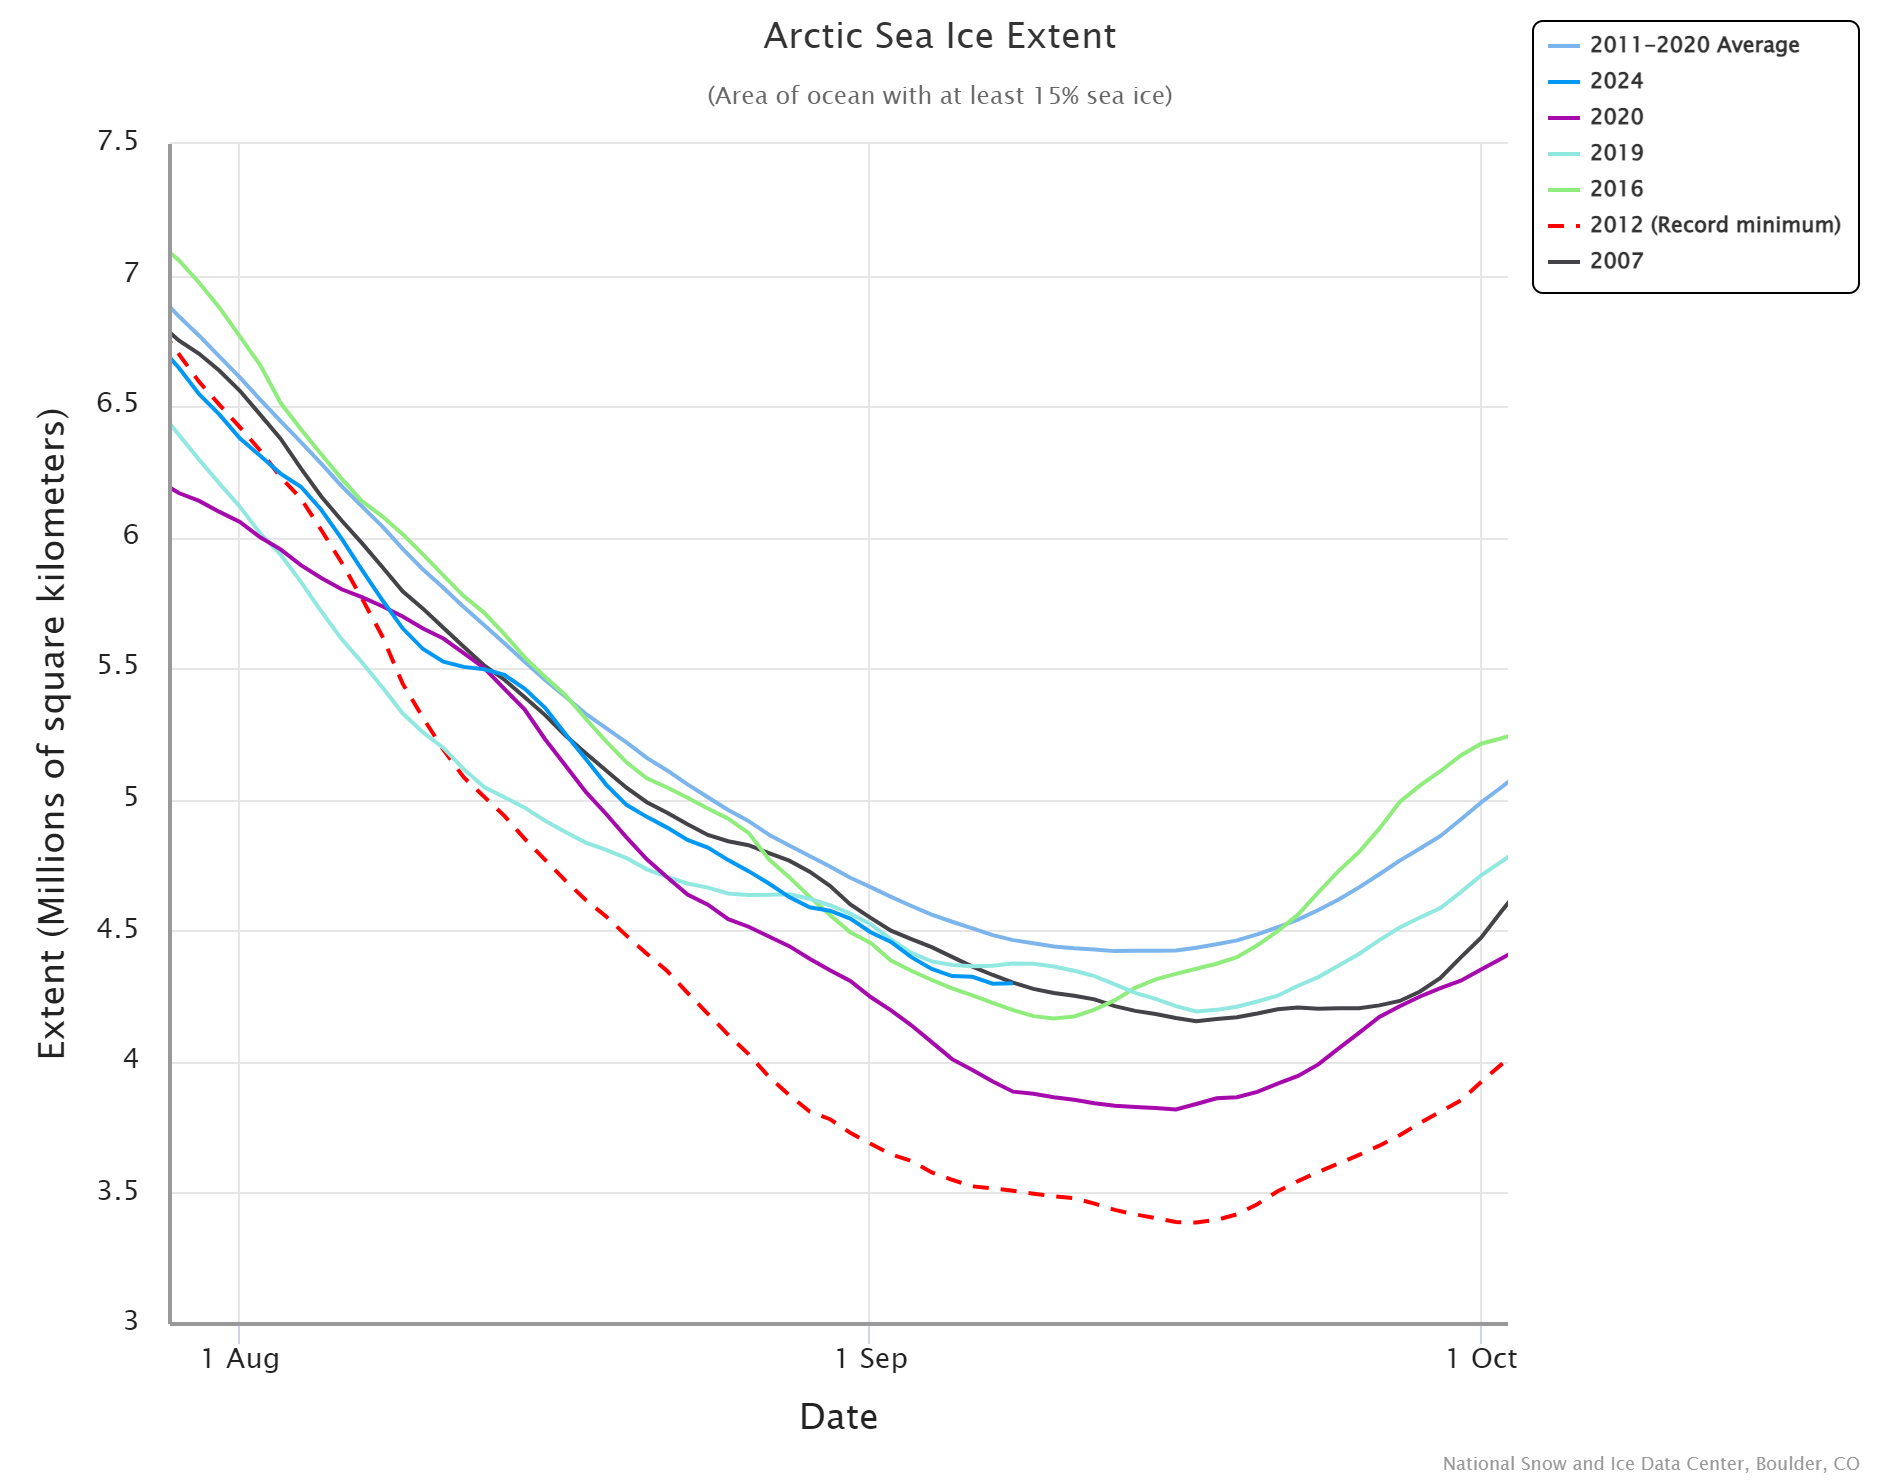
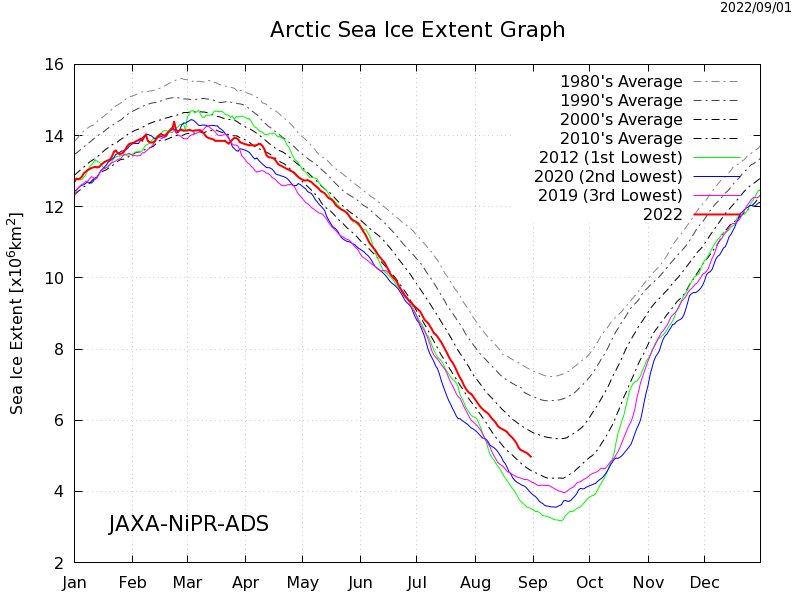
Here too is a more detailed look at 2024 extent compared with the 5 lowest annual minima in the JAXA record:
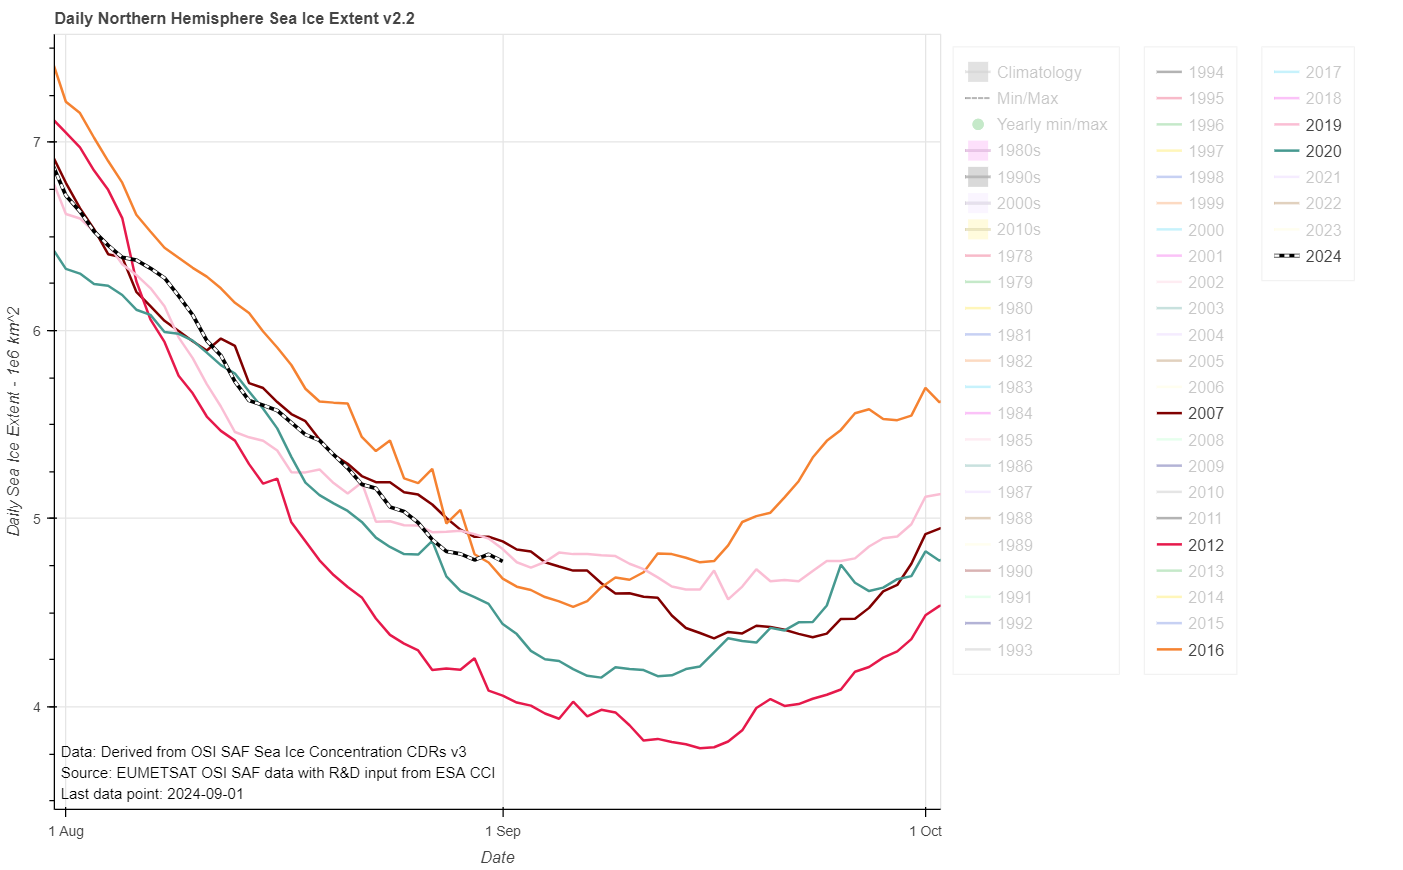
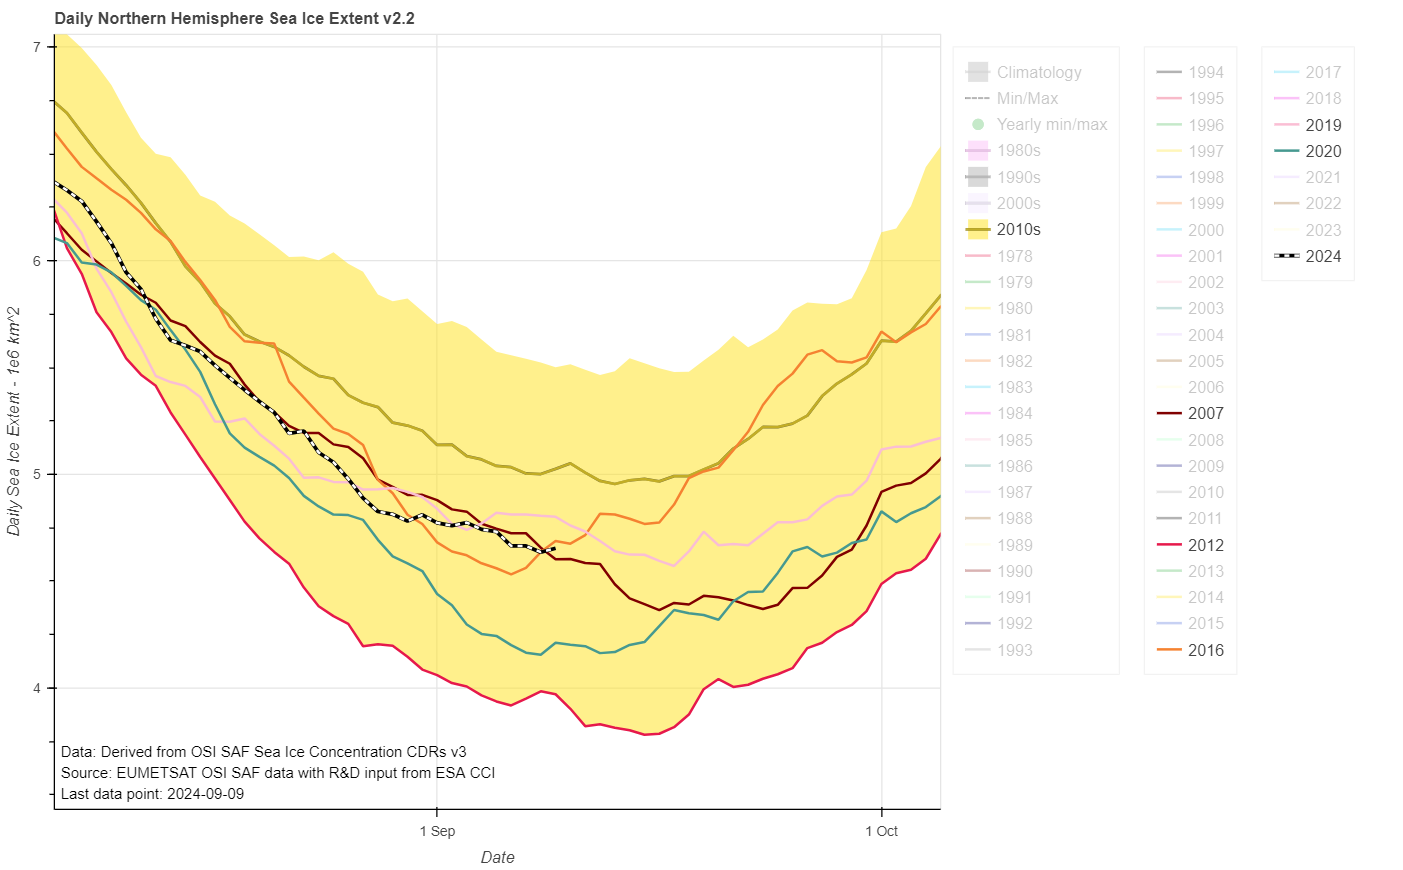
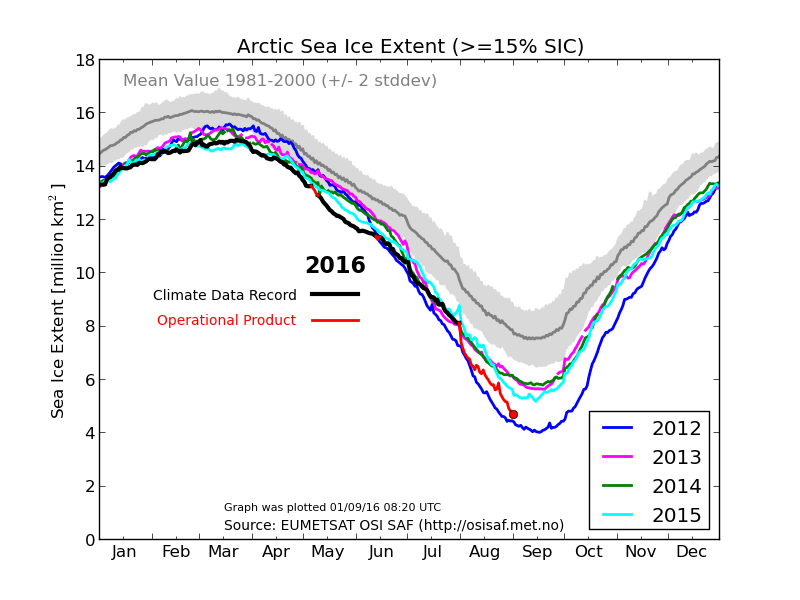
By way of comparison, here is the equivalent graph for the OSI SAF extent metric, which experienced an up tick yesterday but has now reached a new low for the year:
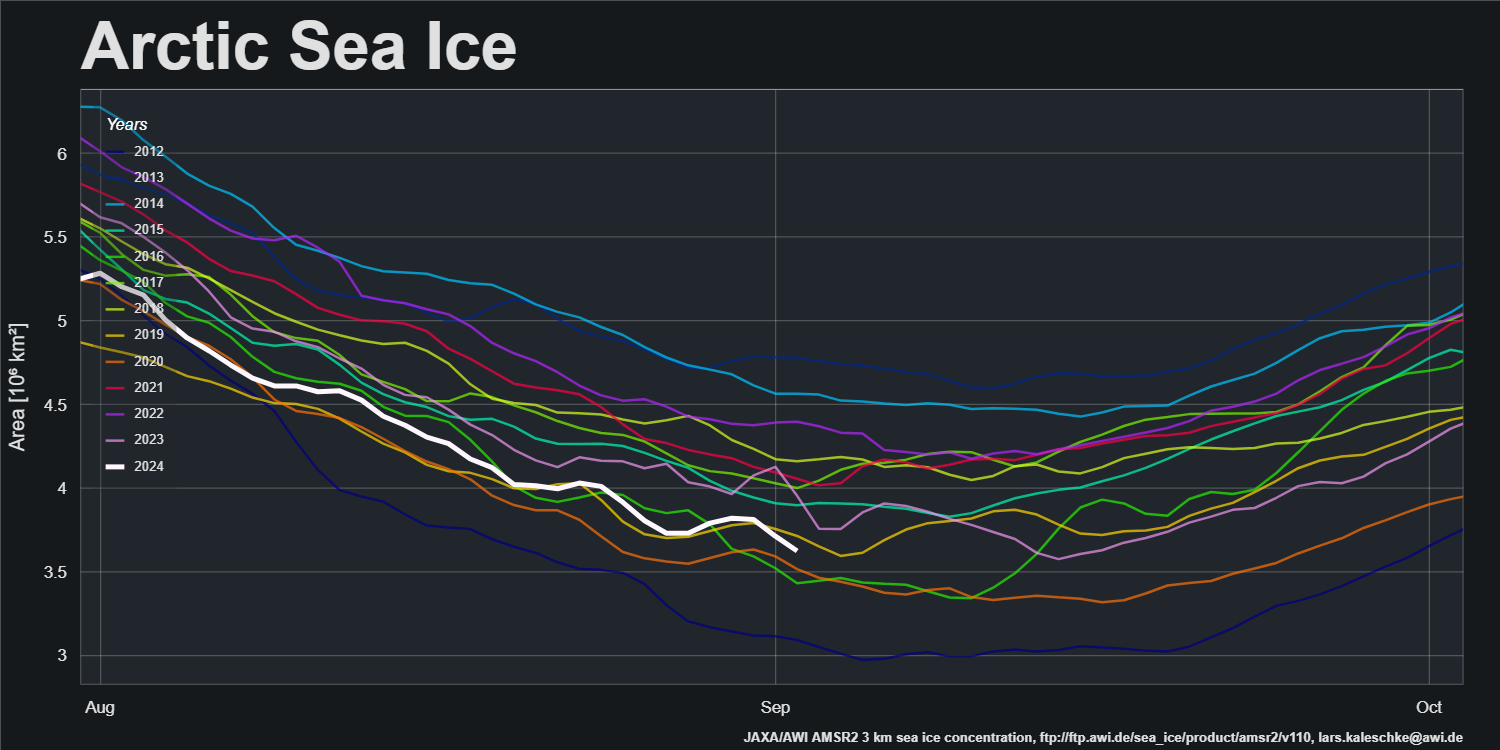
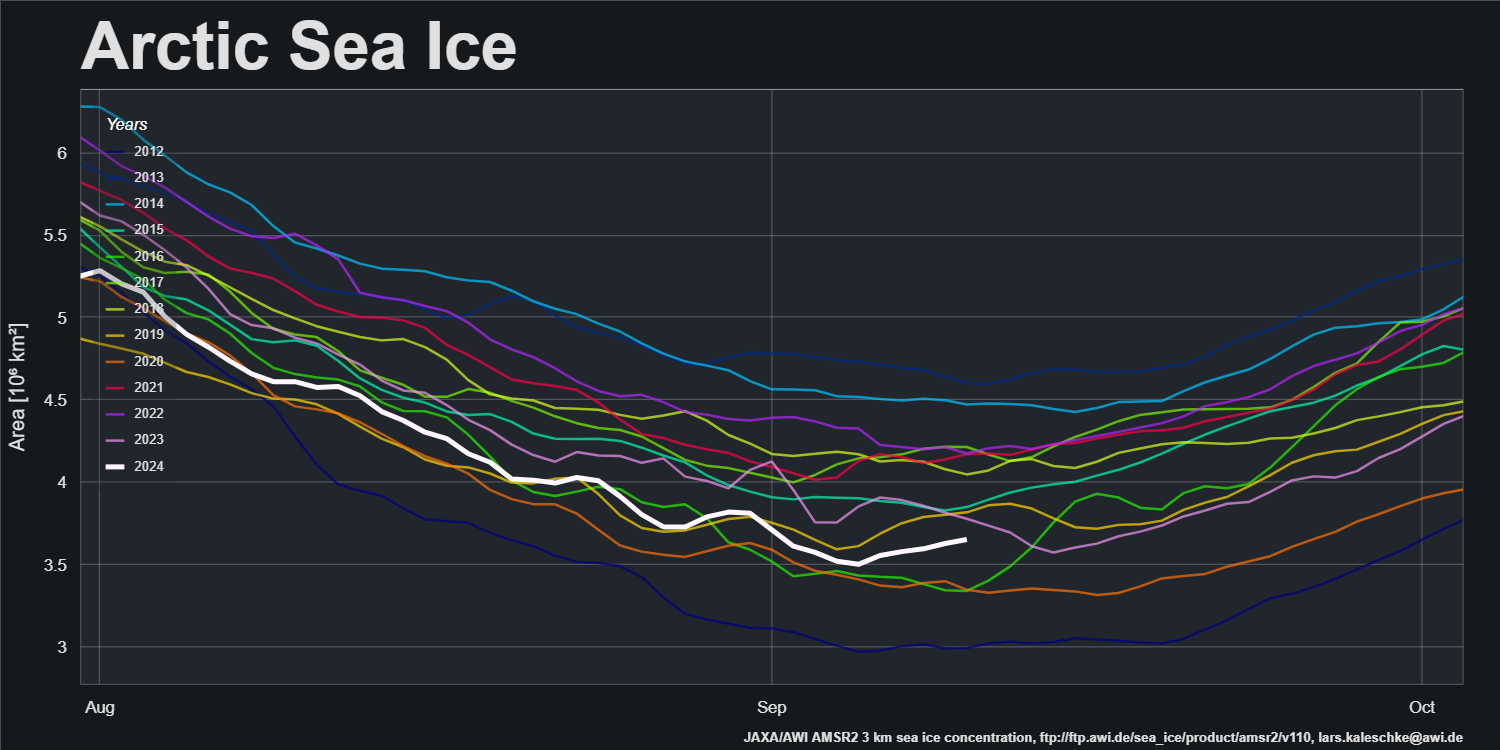
However AWI Arctic sea ice area is currently falling, which may well presage further significant falls in extent:
The NSIDC web site is currently “experiencing technical difficulties”, but hopefully we’ll be able to take a look at their extent graph in the very near future.
[Update – September 4th]
The NSIDC web site is back in action, and their 5 day averaged extent metric is currently still falling quickly:
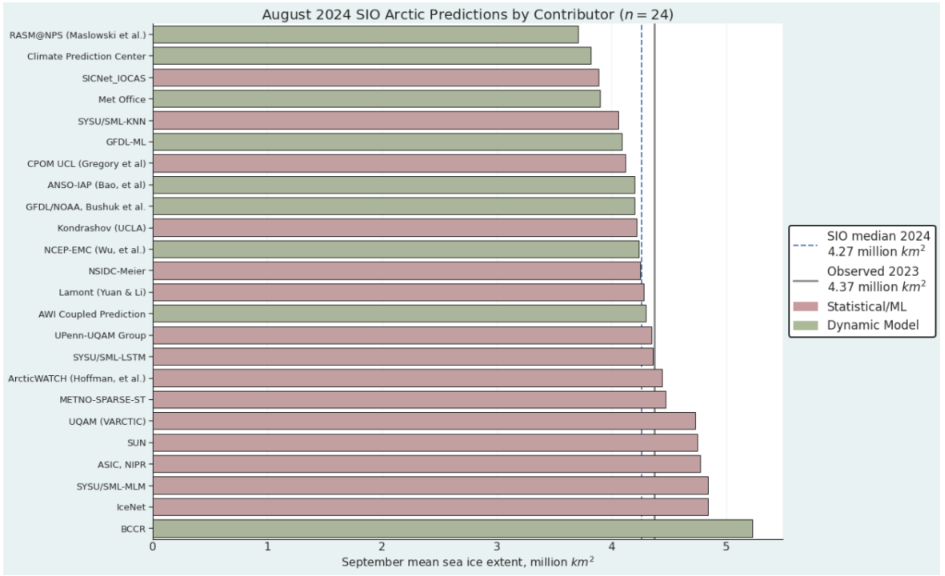
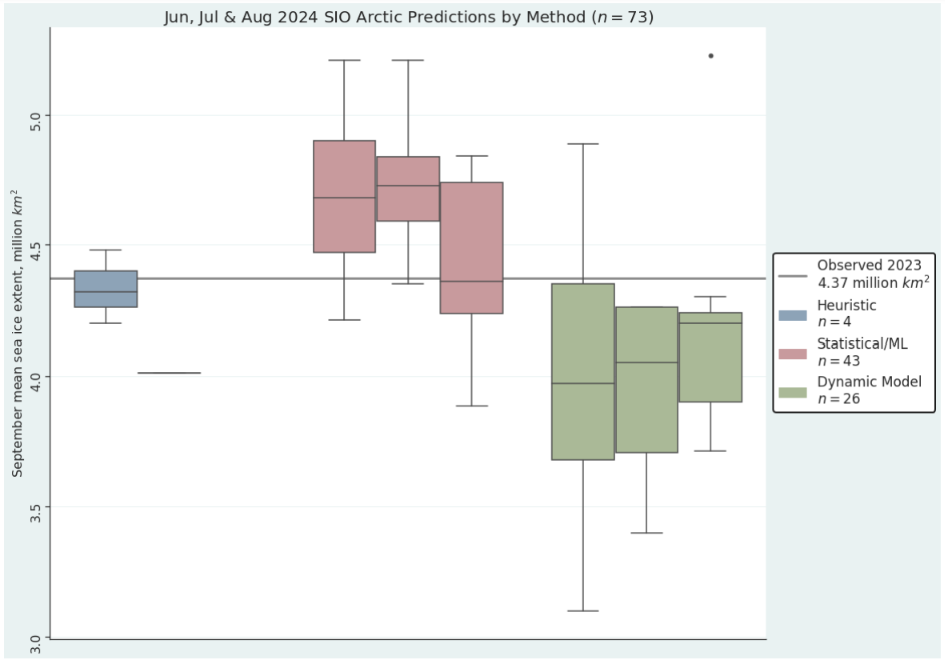
The ARCUS Sea Ice Prediction Network August report has been published. Note that the predicted numbers are for the September monthly average extent rather than the daily minimum:
For the August Outlook, we received 24 contributions of September pan-Arctic sea-ice extent forecasts…
The August 2024 median forecasted value for pan-Arctic September sea-ice extent is 4.27 million square kilometers with an interquartile range of 4.11 to 4.54 million square kilometers. This is about 200,000 square kilometers lower than the June median and about 250,000 square kilometers lower than the July median, which reflects the faster than average ice loss during July.
The lowest sea-ice extent forecast is 3.71 million square kilometers and the highest sea-ice extent forecast is 5.23 million square kilometers. These extremes are actually higher, particularly on the low end, than the estimates from July.
[Update – September 9th]
There’s been the tiniest of upticks in the NSIDC 5 day extent metric. 1 thousand km² to be precise. However, the others are still slowly declining:
[Update – September 10th]
NSIDC extent has posted a new low for the year, and JAXA extent is still declining. However there has been a slightly more substantial uptick in the OSI SAF metric:
The current minimum is 4.64 million km² on September 8th.
AWI sea ice area has posted a convincing looking minimum on September 4th, which suggests that the central refreeze is already well under way:
[Update – September 17th]
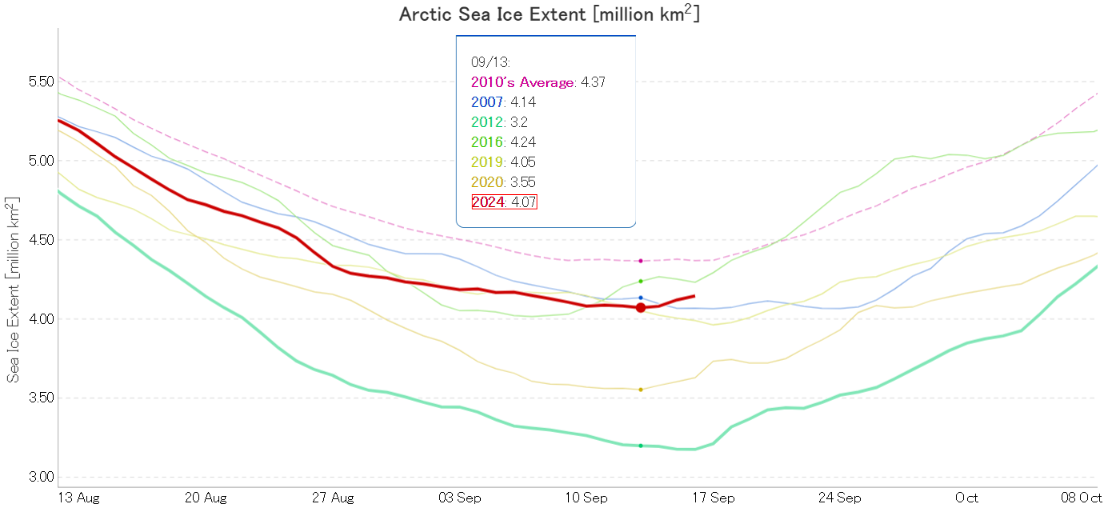
JAXA/ViSHOP/ADS extent has risen significantly over the last two days:
It now looks highly likely that the 2024 minimum will prove to be 4.07 million km² on September 13th. That is 4th lowest for the date, but equal 5th lowest minimum in the JAXA record.
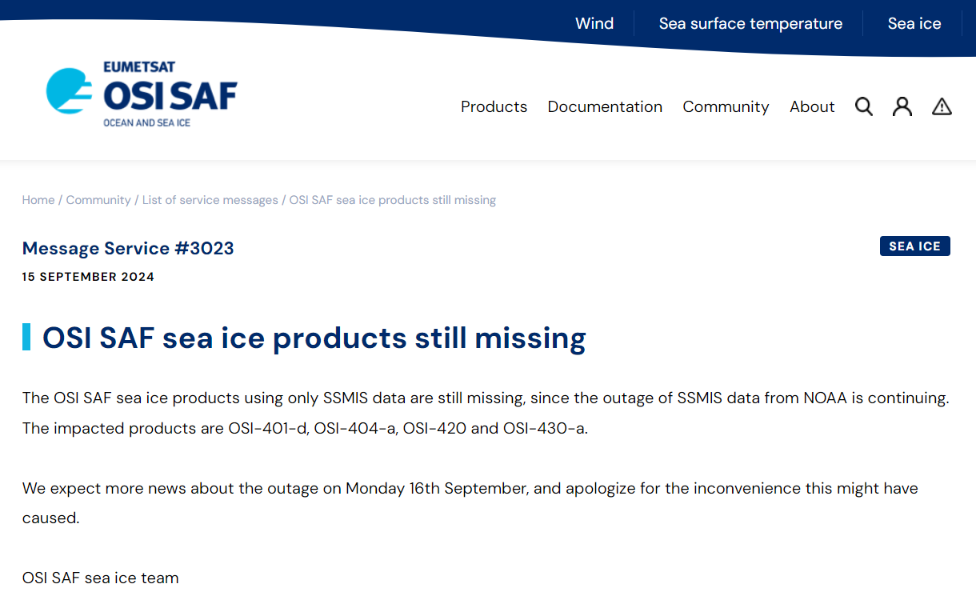
A closer look at some of the other extent metrics will have to wait until this problem is solved:
Not good timing for a data outage!
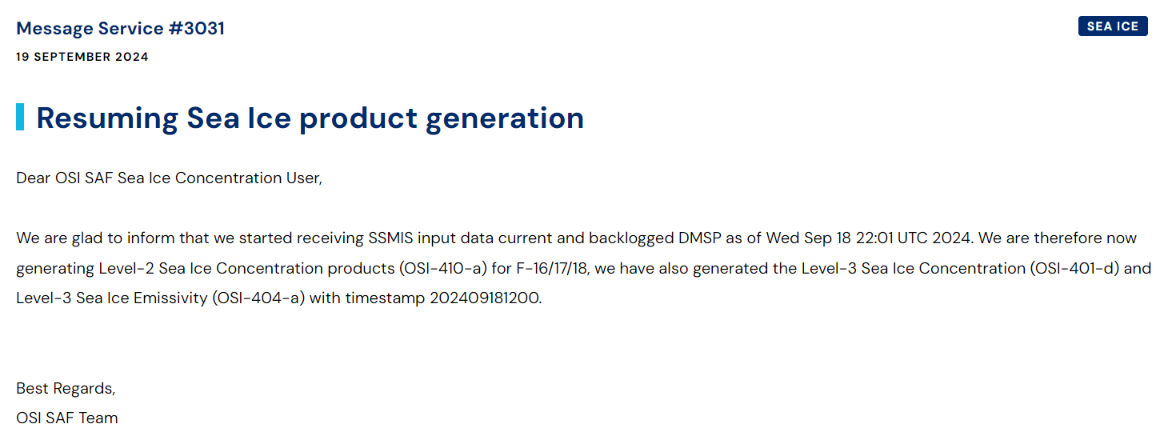
[Update – September 22nd]
SSMIS data has been flowing again for a couple of days:
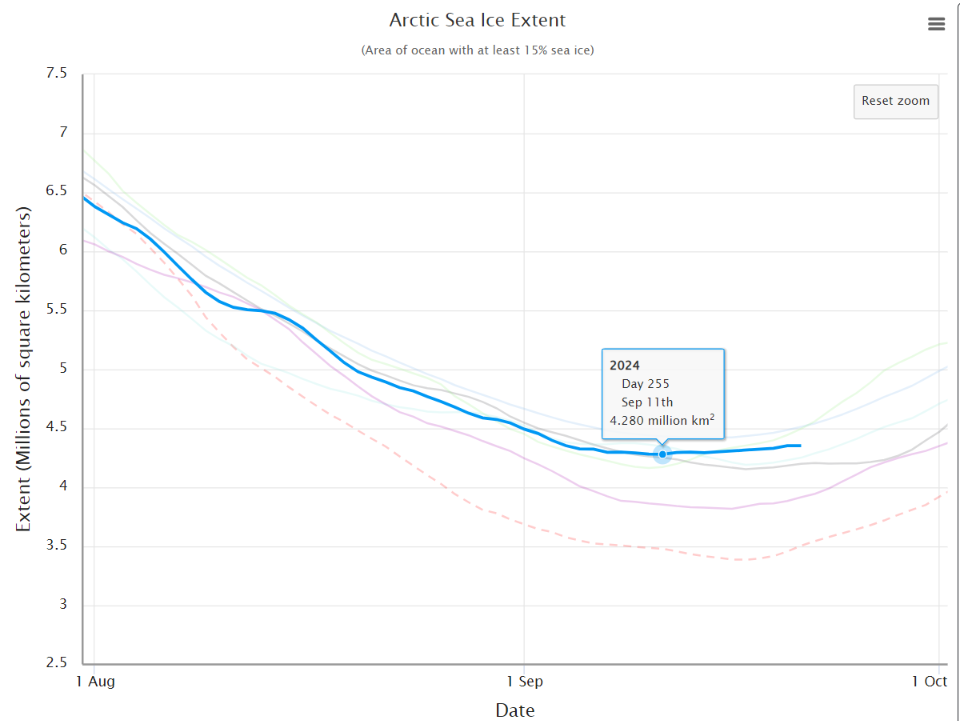
This graph may be subject to revision if and when the missing data is recovered, but currently it looks as though the 2024 minimum of the NSIDC 5 day averaged extent metric is 4.28 million km² on September 11th.
[Update – September 24th]
The National Snow and Ice Data Center formally announced today that:
On September 11, Arctic sea ice likely reached its annual minimum extent of 4.28 million square kilometers. The 2024 minimum is the seventh lowest in the nearly 46-year satellite record. The last 18 years, from 2007 to 2024, are the lowest 18 sea ice extents in the satellite record…
Note that this is a preliminary announcement. Changing winds or late-season melt could still reduce the Arctic ice extent, as happened in 2005 and 2010. NSIDC scientists will release a full analysis of the Arctic melt season, and discuss the Antarctic winter sea ice growth, in early October.
The NSIDC also addressed the recent missing SSMIS data issue mentioned above as follows:
Note that a gap exists in the input source data between September 12 and September 18. This gap somewhat lowers our confidence in the minimum extent estimate. However, it appears that September 11 is the mostly likely date of the minimum based on data trends in daily extent values leading up to the 5-day average on September 11 and the extent values after data restarted on September 18. If extent did drop further between September 11 and September 18, it would have been marginal. If the input source data becomes available to fill that gap, our team will update the minimum estimate if necessary.
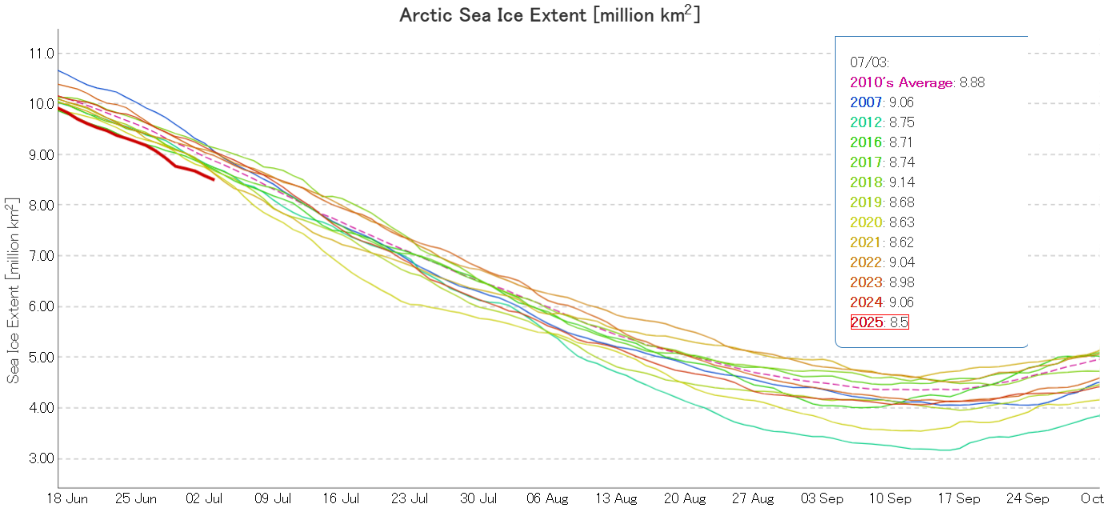
September has arrived and it’s time to start speculating about when and at what level this summer’s minimum Arctic sea ice extent will occur. Here’s a helpful summary of previous years’ JAXA AMSR2/AMSR-E extent minima courtesy of Zack Labe:
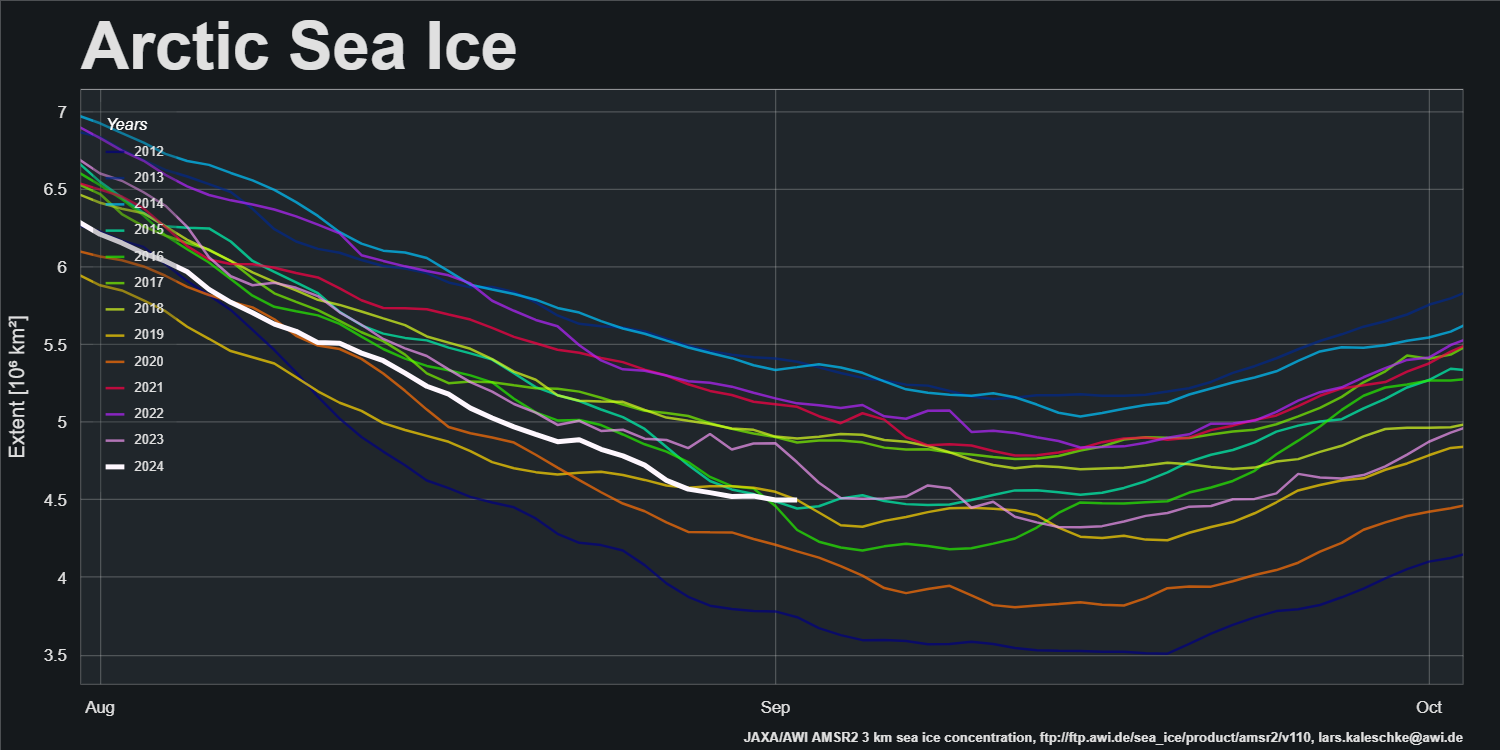
Here too is JAXA’s current graph of extent, including a selection of previous years:
JAXA extent on August 31st was 4.96 million km2, marginally below last year’s value of 4.99 million km2 on the same date.
A recent paper by Kent Moore et al. has caused something of a stir in the mainstream media recently, as well as in cryospheric circles and amongst the cryodenialista:
The area to the north of Ellesmere Island and Greenland contains the Arctic’s thickest ice and it is predicted to be the last to lose its perennial ice, thus providing an important refuge for ice-dependent species. There is however evidence that this Last Ice Area is, like the entire Arctic, undergoing rapid changes that may reduce its suitability as a refuge. During May 2020, a polynya developed to the north of Ellesmere Island in a region where there are no reports of a previous development. We use a variety of remotely sensed data as well as an atmospheric reanalysis to document the evolution and the dynamics responsible for the polynya. In particular, we argue that anomalously strong divergent winds associated with an intense and long-lived Arctic anti-cyclone contributed to the development of the polynya as well as similar previously unreported events in May 1988 and 2004.
Curiously the paper neglects to mention a polynya in the same region that we reported on, albeit in passing, in August 2018. Here’s an updated video of that event, with the addition at the start of a yellow arrow to highlight the part of the Arctic’s “Last Ice Area” investigated by Moore et al. and a pale blue arrow to highlight Kap Morris Jesup, the most northerly point in Greenland:
Next here’s another animation, covering the time period discussed in the paper and continuing throughout the summer of 2020:
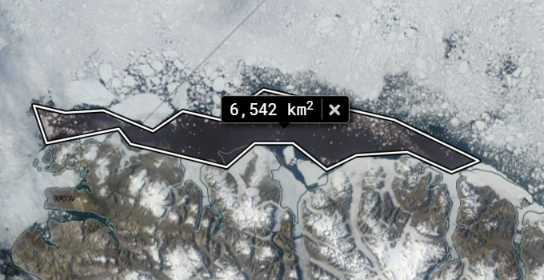
Comparing the two animations it is obvious that the August 2018 polynya is much larger than the one in May 2020, confirmed by a quick area computation using NASA WorldView:
The introduction to the paper states that:
Flaw leads, elongated regions of open water that develop along the interface between land fast and pack ice (Barber & Massom, 2007) are common in the region. Indeed Peary’s 1909 sledding expedition to the North Pole was delayed as a result of a large flaw lead that developed north of Ellesmere Island (Peary, 1910). However, the development of a polynya in this region has not been reported previously.
To my eye the image above reveals something far too wide to be described as a “flaw lead”, but let’s delve deeper into the paper:
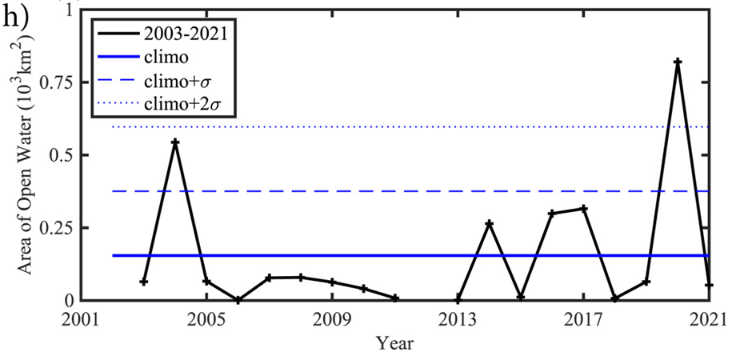
A perspective on the unique nature of the May 2020 event is provided by the monthly mean area of open water in the area of interest during May for the entire period of the ASI data set, 2003–2021 (Figure 2h). Typically the area of open water during May in the region is less than 160 km2. May 2020 is the only year in which the area of open water exceeds 2 standard deviations above the mean.
Perhaps the polynya in question is indeed “unique in the month of May”, in which case it would no doubt have been helpful if the abstract and/or the introduction to the paper had mentioned this subtlety. Then the plethora of erroneous statements in the media like the one recently referenced by Mark Lynas on Twitter might have been avoided?
The polynya is the first one that has been identified in this part of the Last Ice Area, according to a new study detailing the findings in the AGU journal Geophysical Research Letters.
Since Mark, amongst others, seem to be suffering from the misapprehension that “The Arctic’s ‘Last Ice Area’ is cracking, just in time for COP26” here is what’s been happening in the “Last Ice Area” this year, in the run up to next month’s conference in Glasgow:
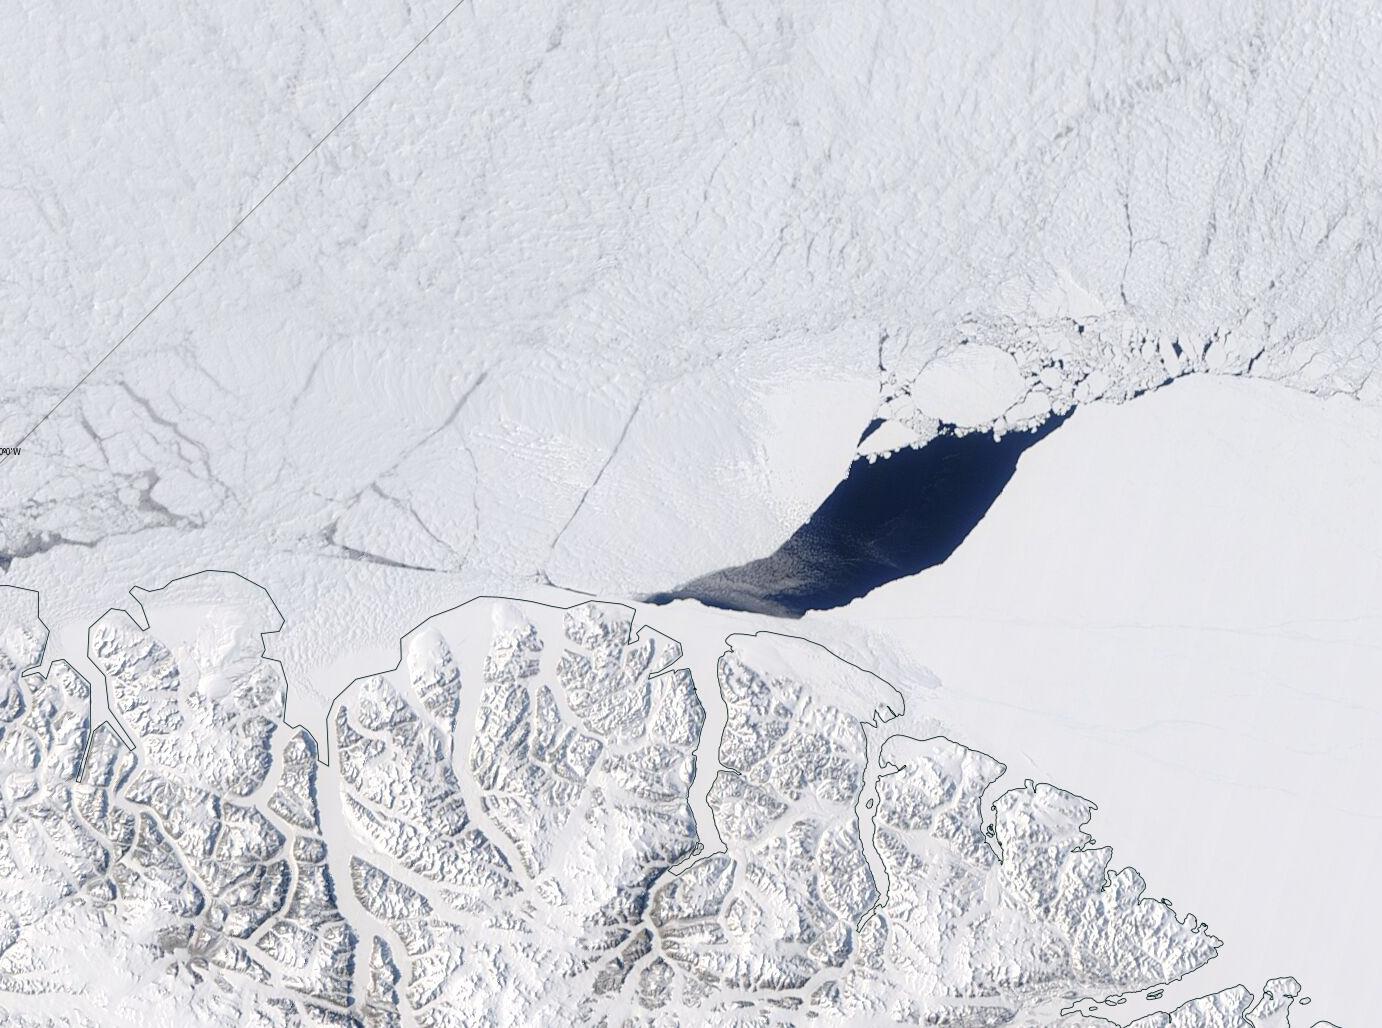
Finally, for the moment at least, are MODIS images of the May 20th 2020 polynya:
and the one on May 12th 2004:
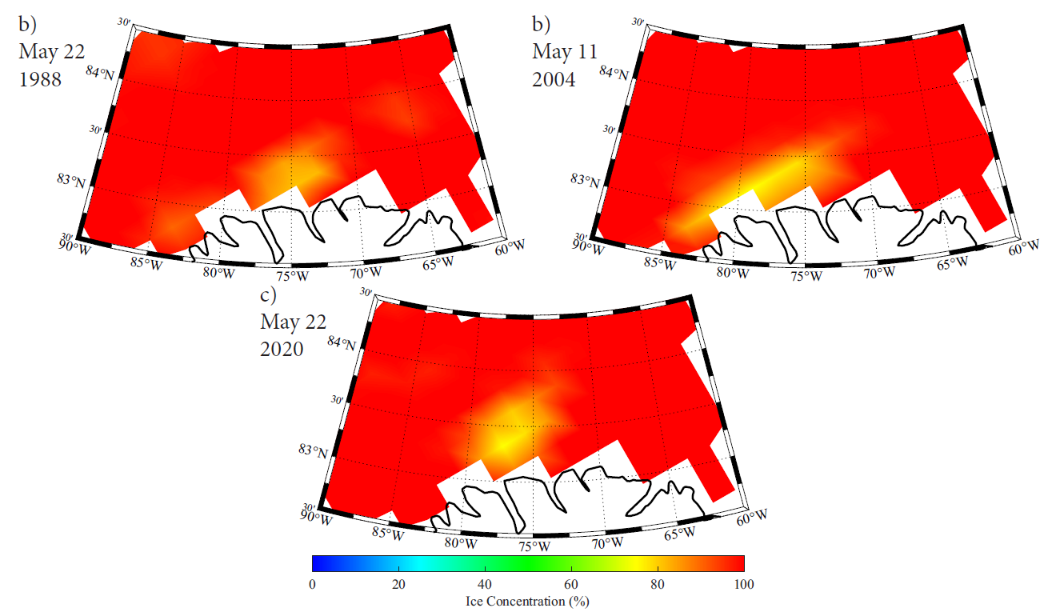
Neither Aqua or Terra had been launched in 1988 of course, and Landsat 5 didn’t cover the north of Ellesmere Island. This is the SSM/I & SSMIS visualisation of all three May polynyas from the supplement to Moore’s paper:
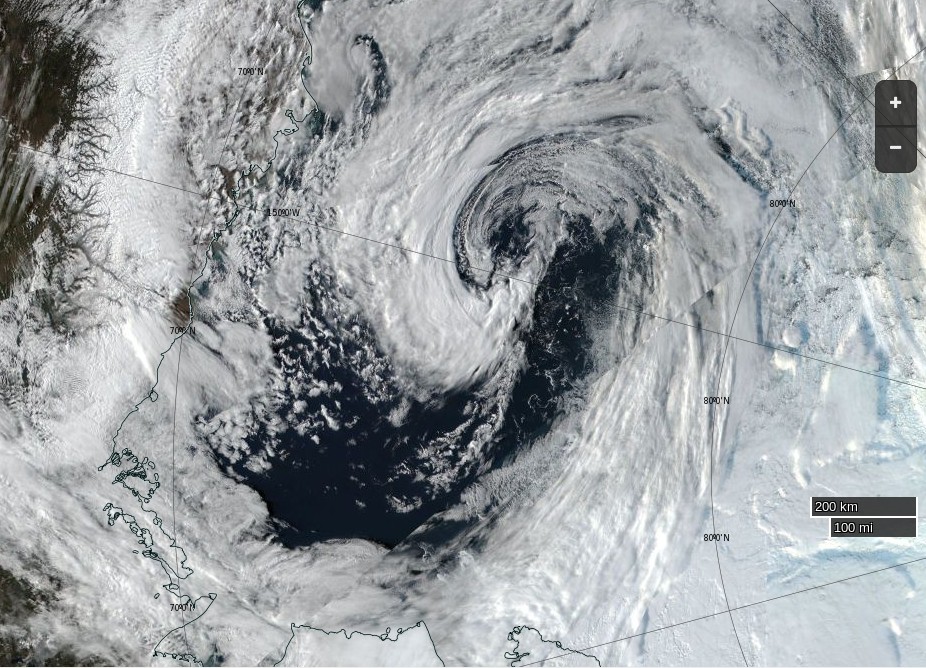
September 2016 is here at last! I posed this question at the start of the recent “Great Arctic Cyclone“:
I wonder what the minimum for 2016 will be, and on what date?
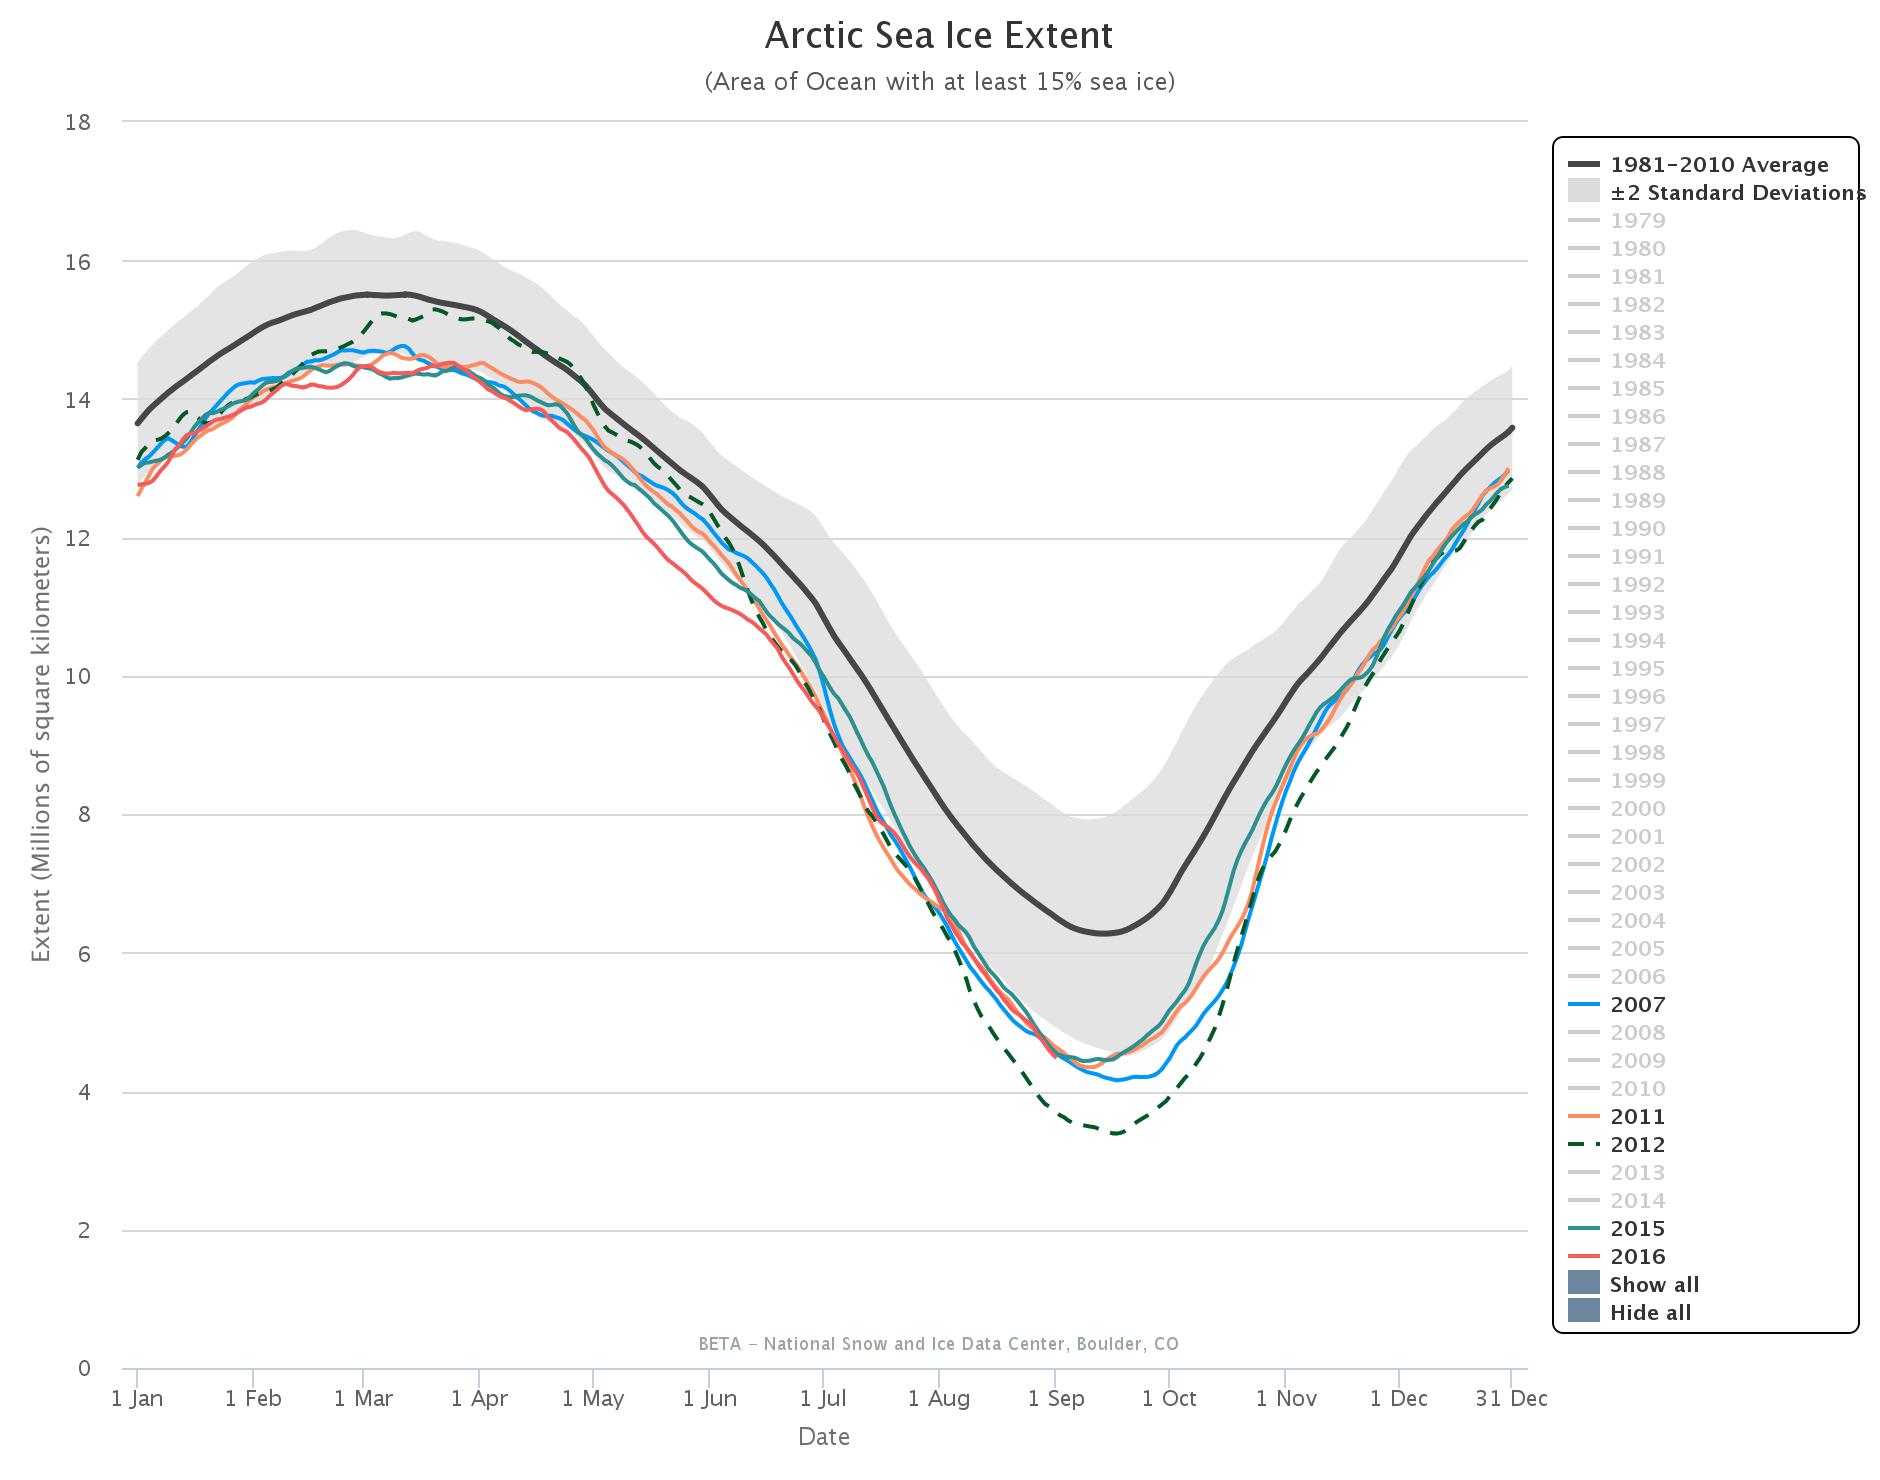
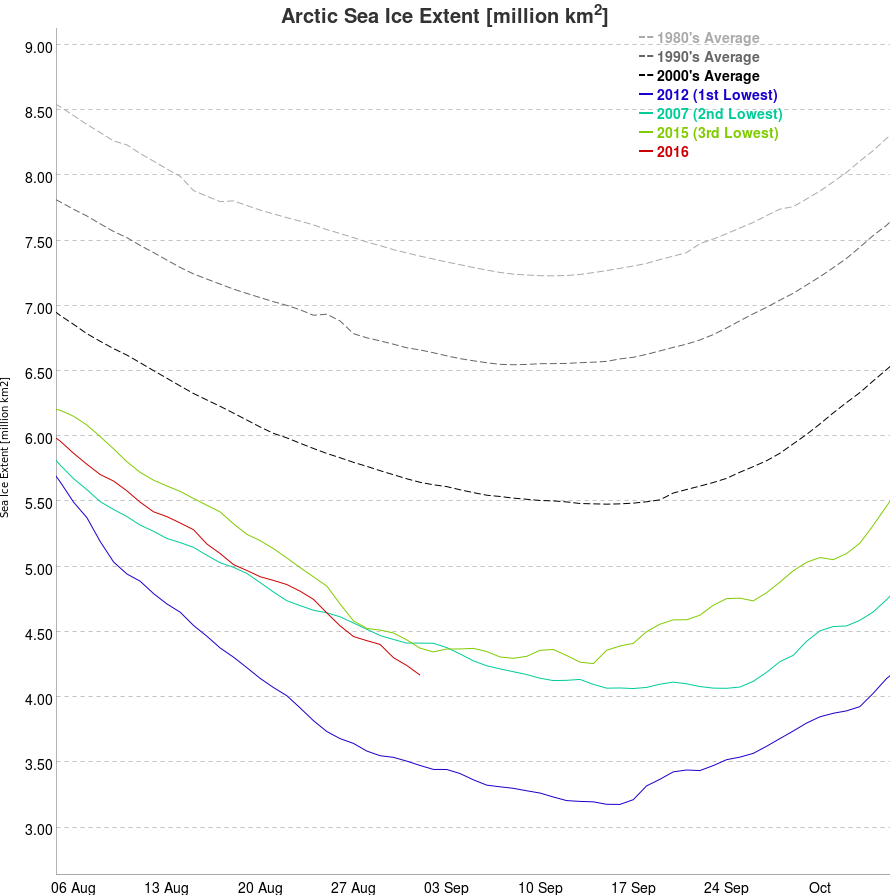
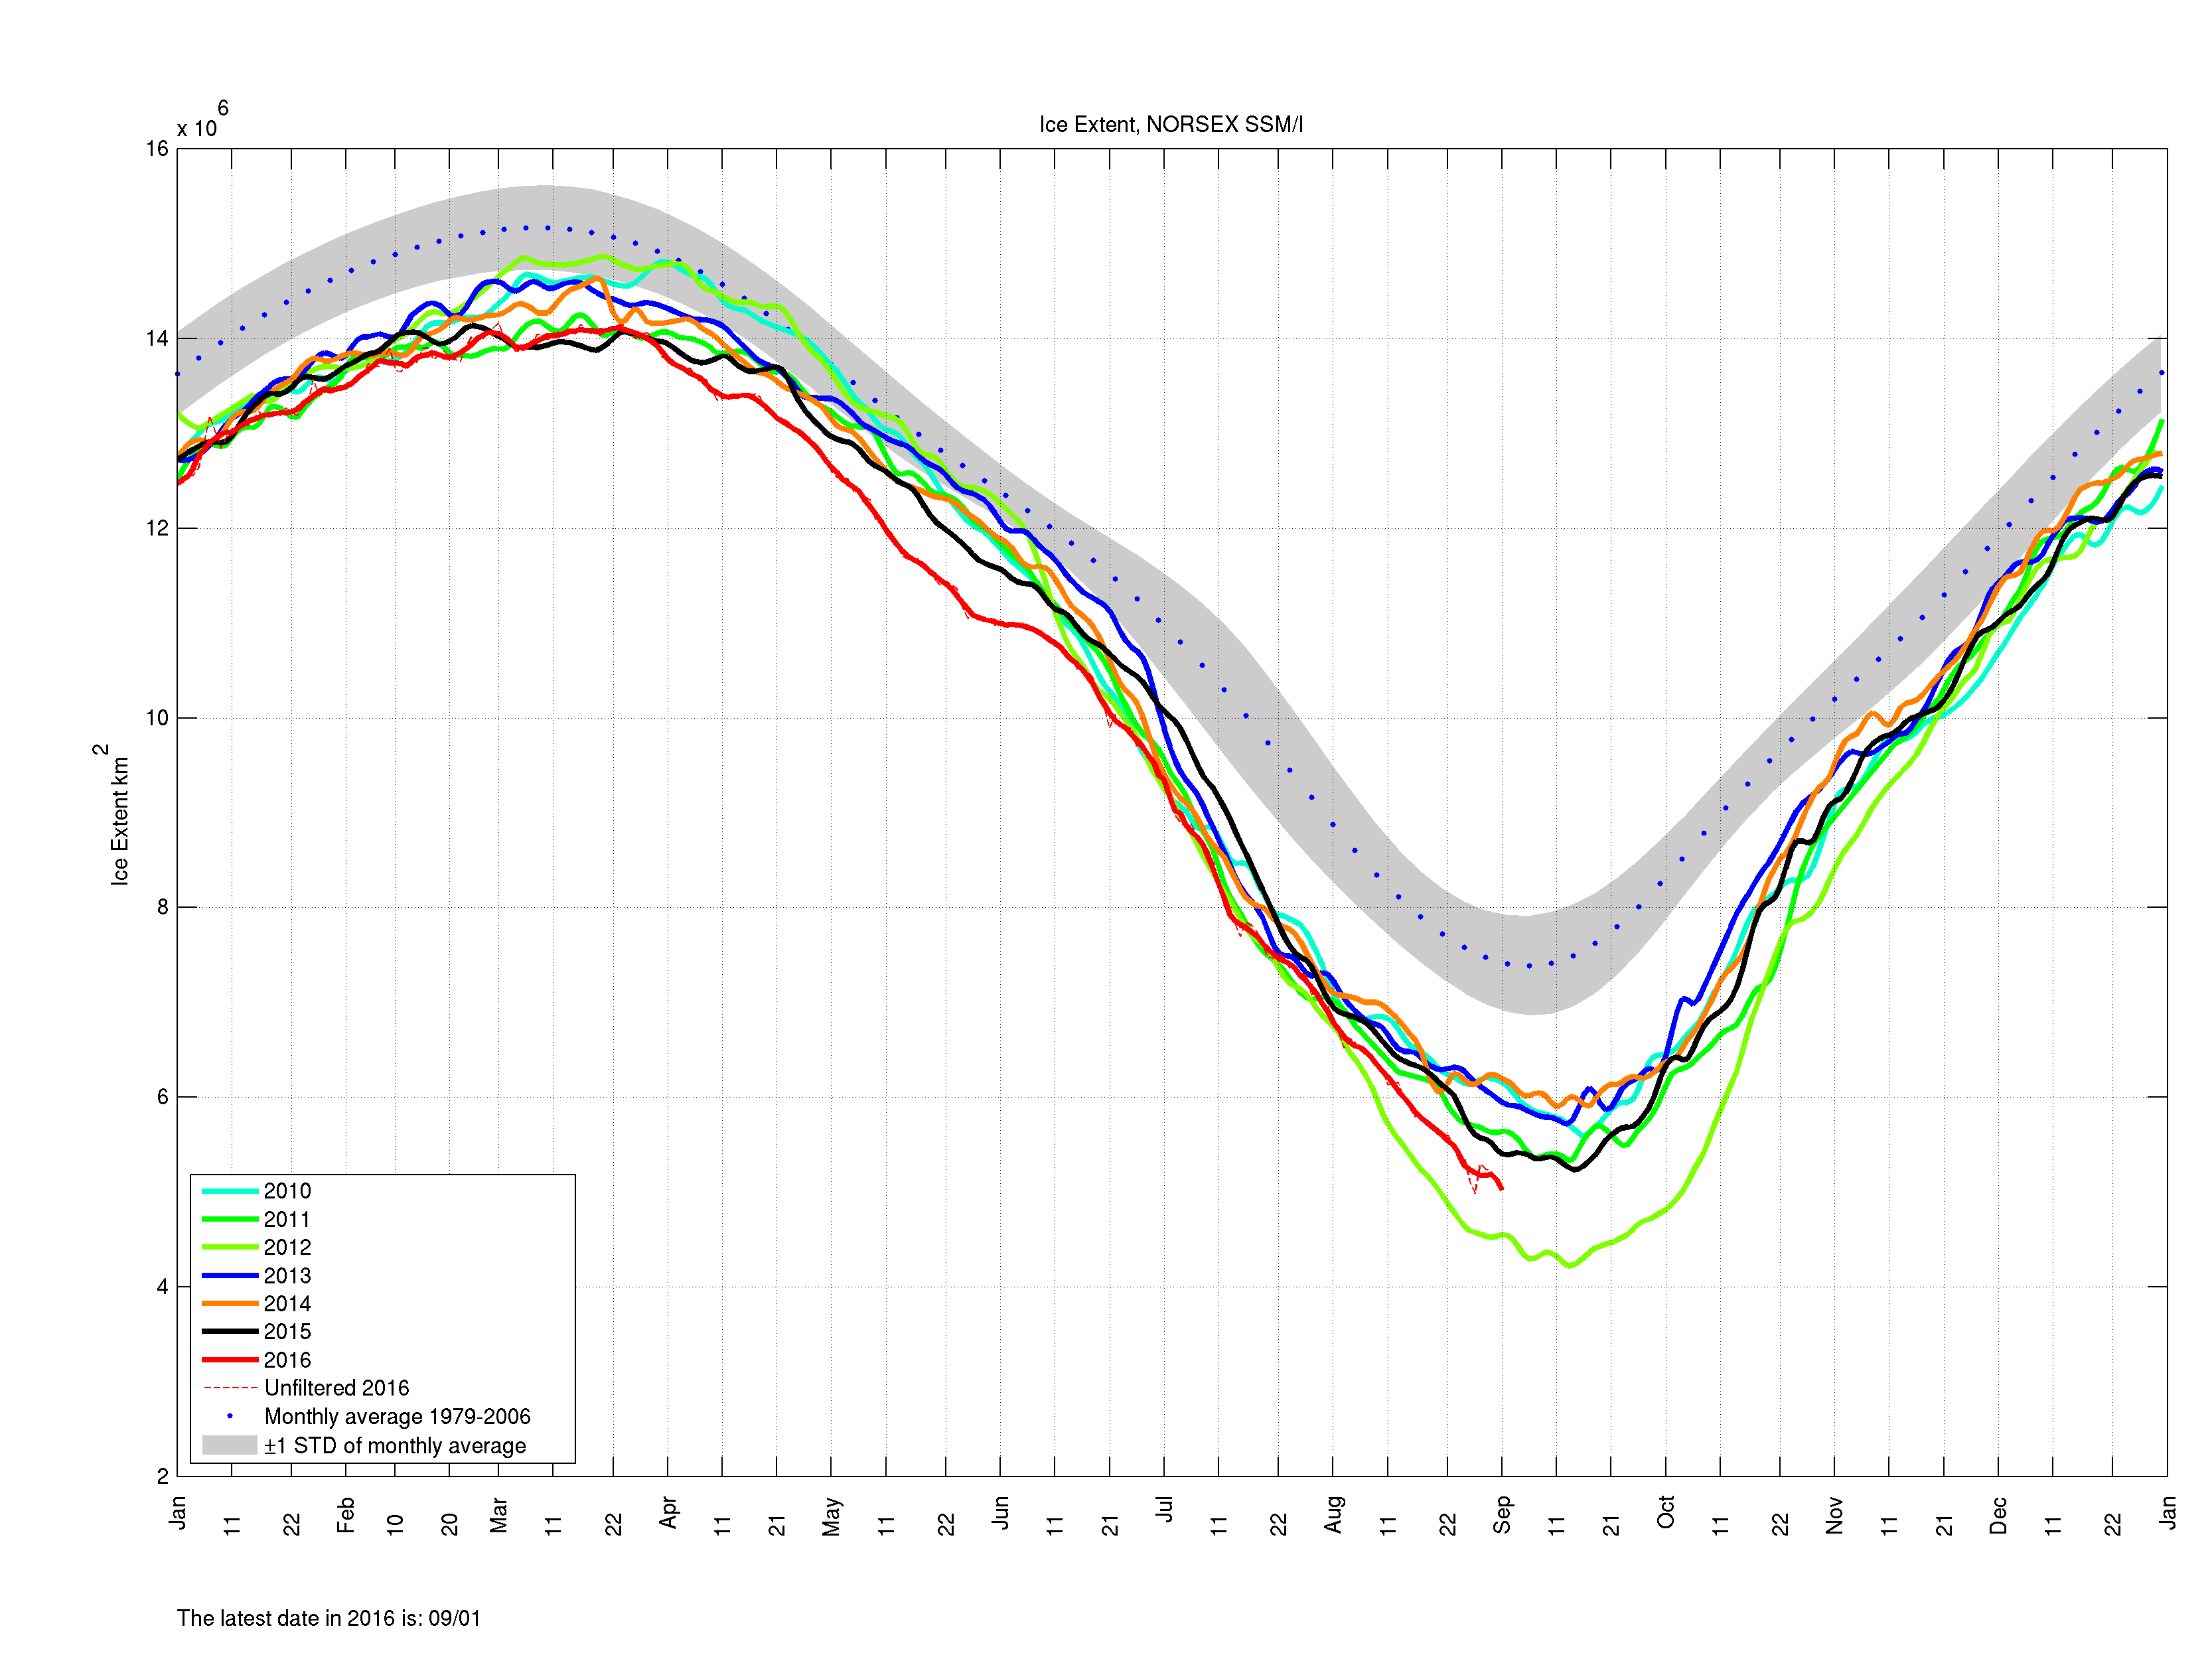
I’m still wondering, and the answer does of course depend on which Arctic sea ice metric you happen to be looking at. Here’s a few examples to be going on with. Firstly there’s Tony Heller’s extent metric du jour, from the University of Bremen:
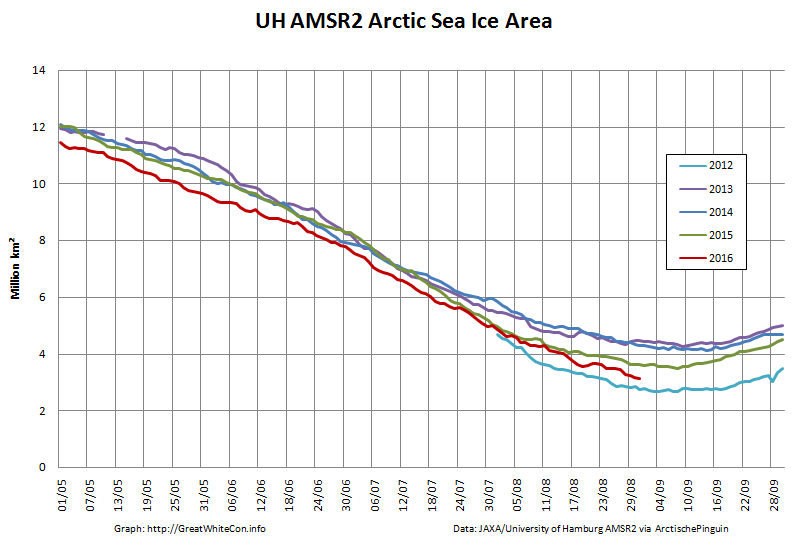
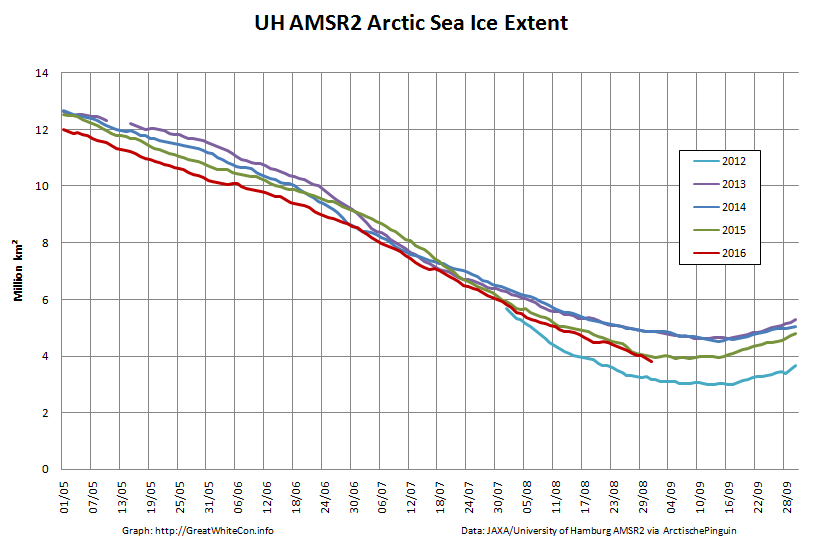
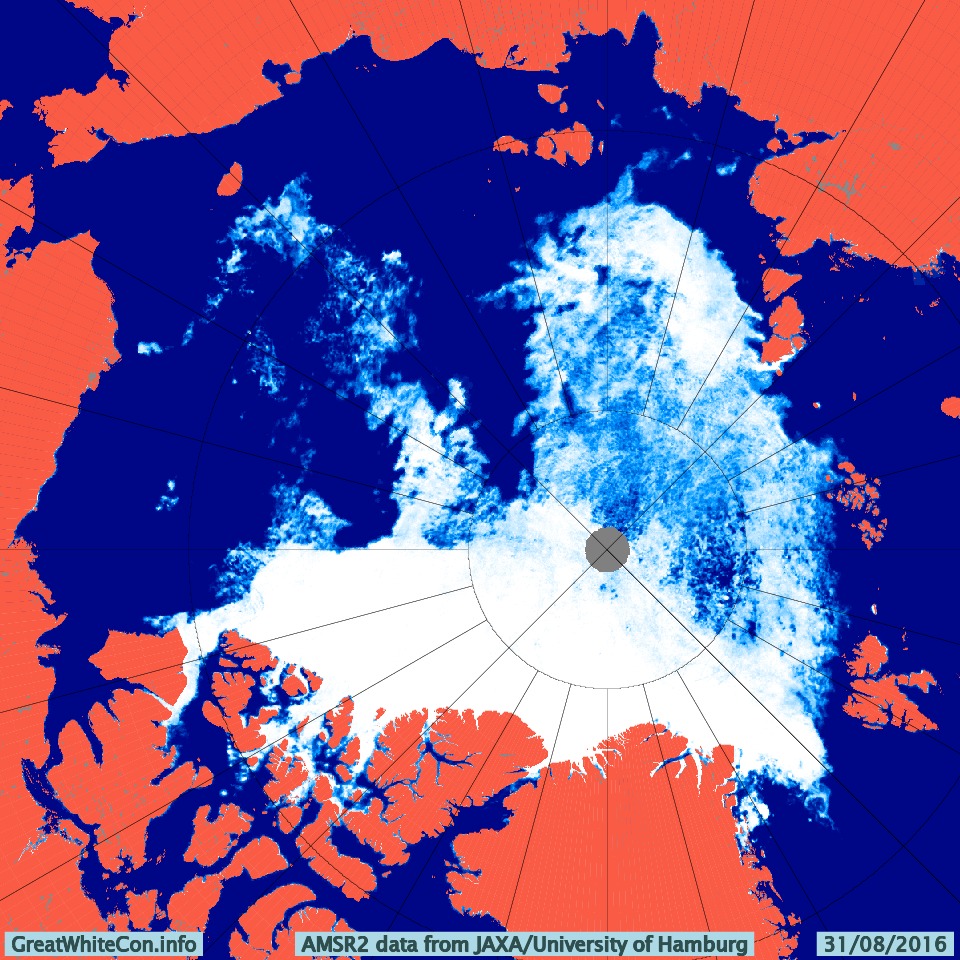
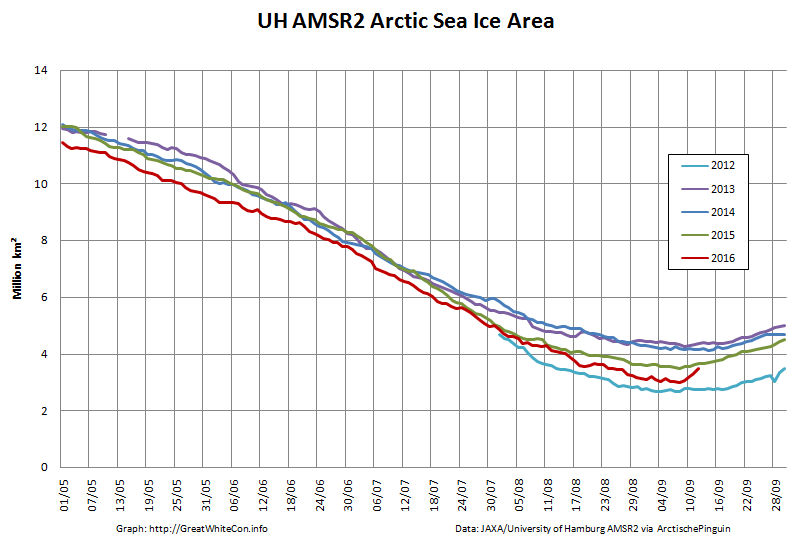
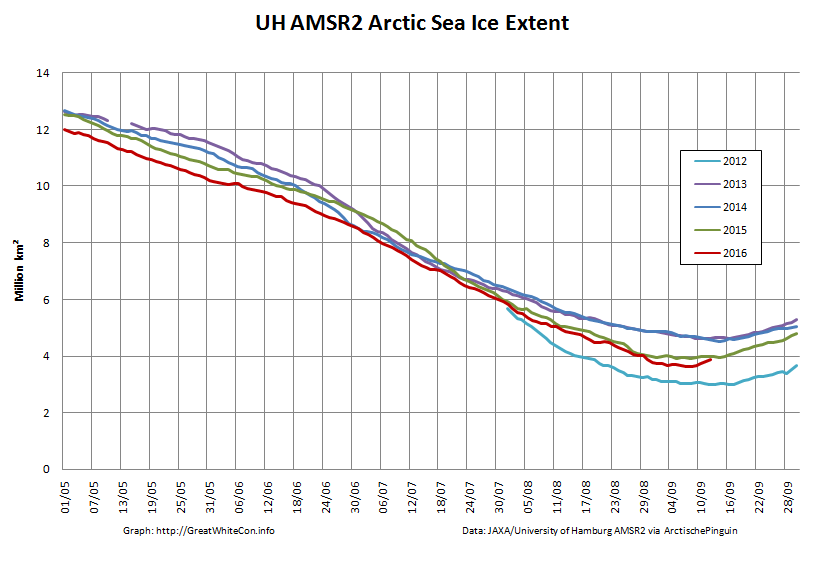
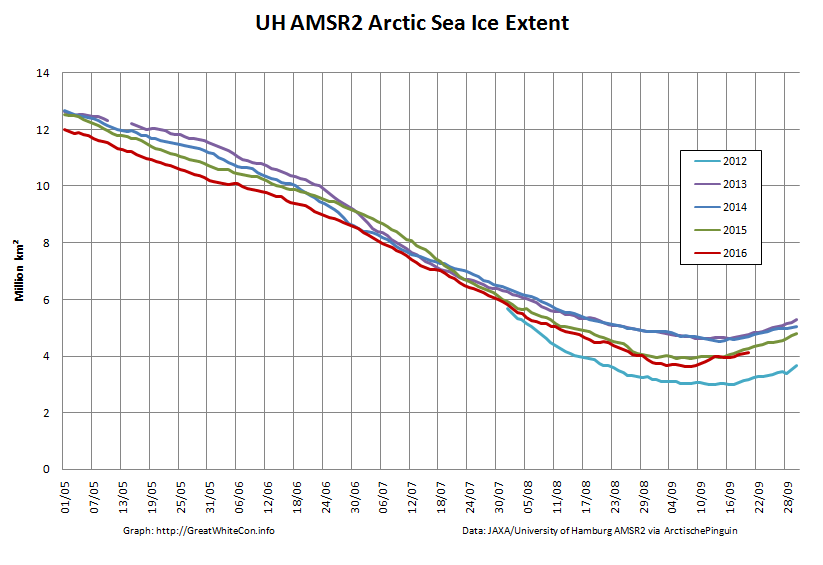
Finally here are “Snow White’s” favourite high resolution AMSR2 metrics derived by “Wipneus” from University of Hamburg AMSR2 concentration data:
Are there any other suggestions for numbers to keep a close eye on over the next few weeks?
[Edit – September 3rd]
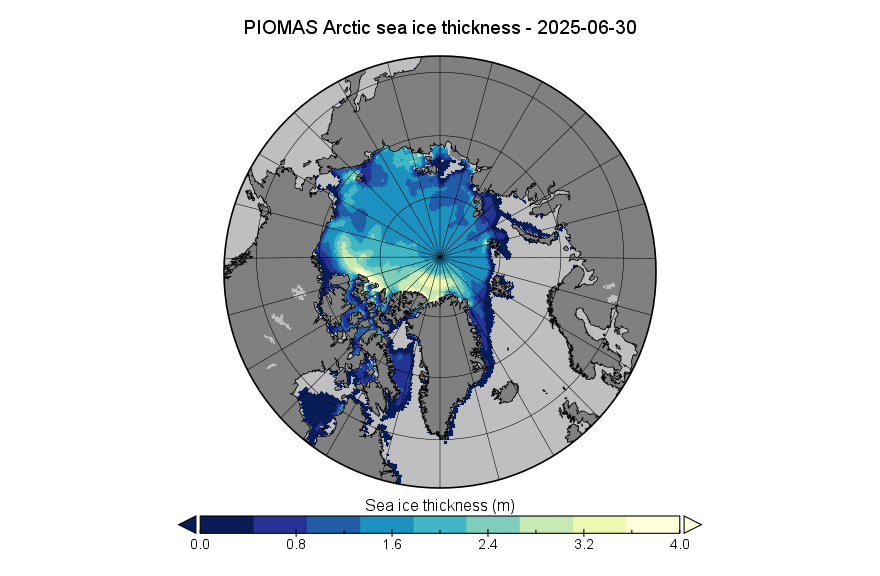
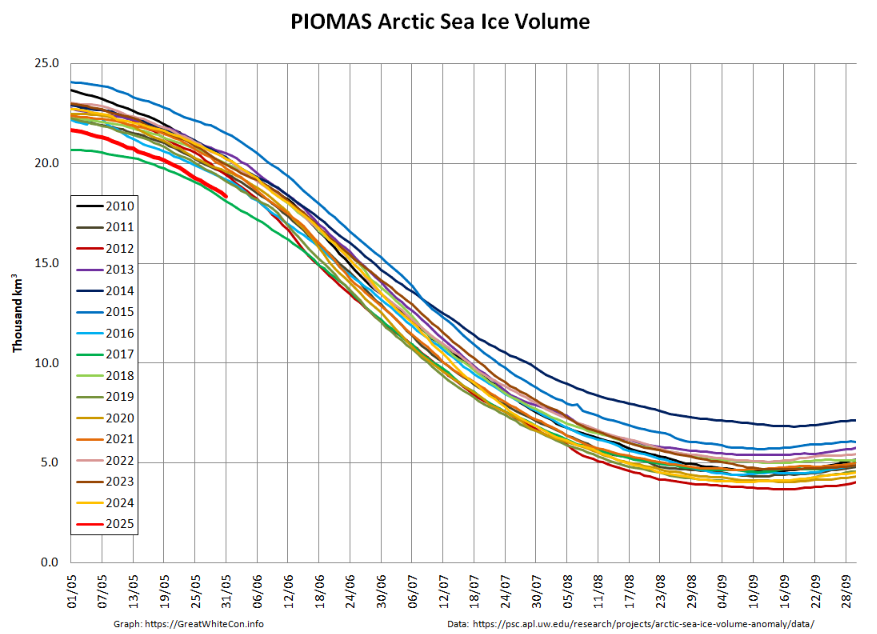
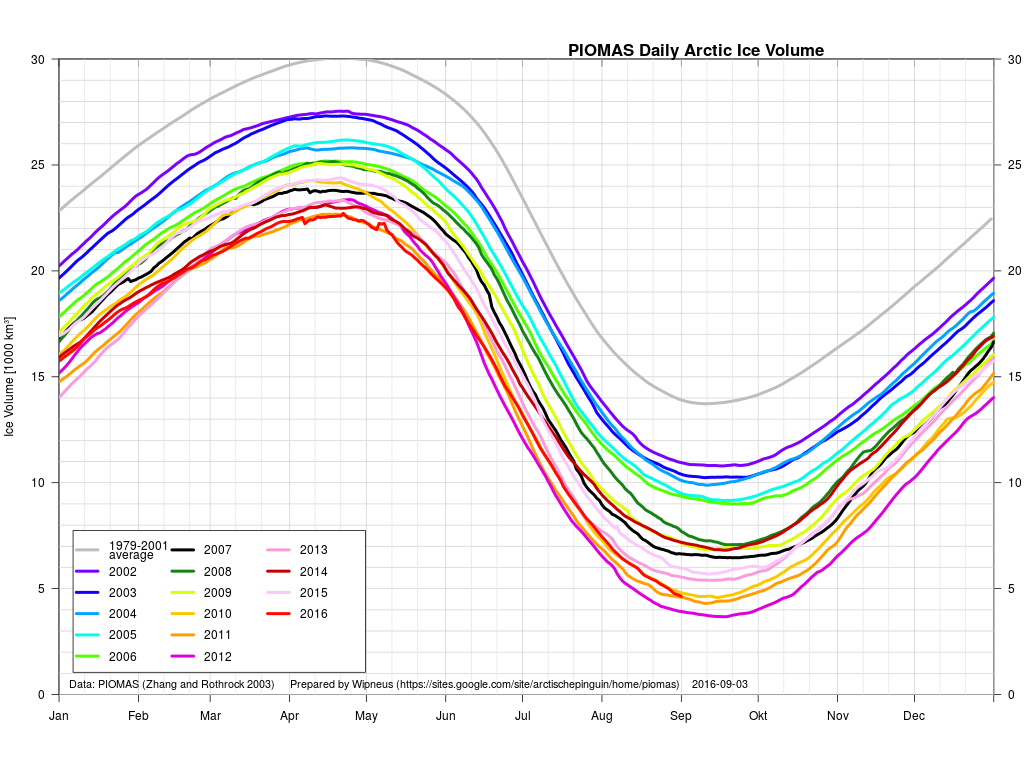
Arctic sea ice volume, as modelled by PIOMAS, has been updated to August 2016:
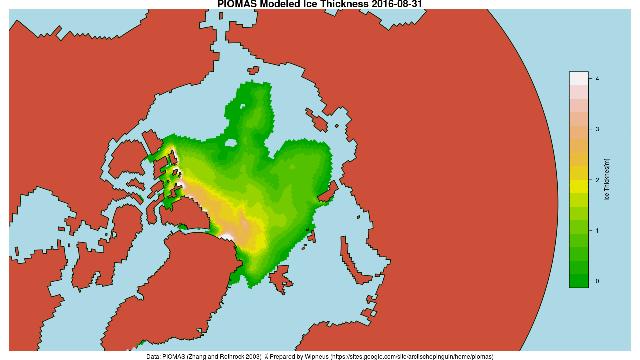
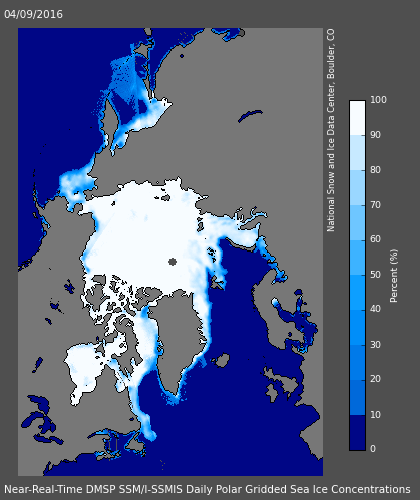
It’s currently 3rd lowest for the month, just a whisker behind 2011. Here’s the PIOMAS gridded data for August 31st 2016:
and for comparison purposes here’s the high res AMSR2 concentration map for the same date:
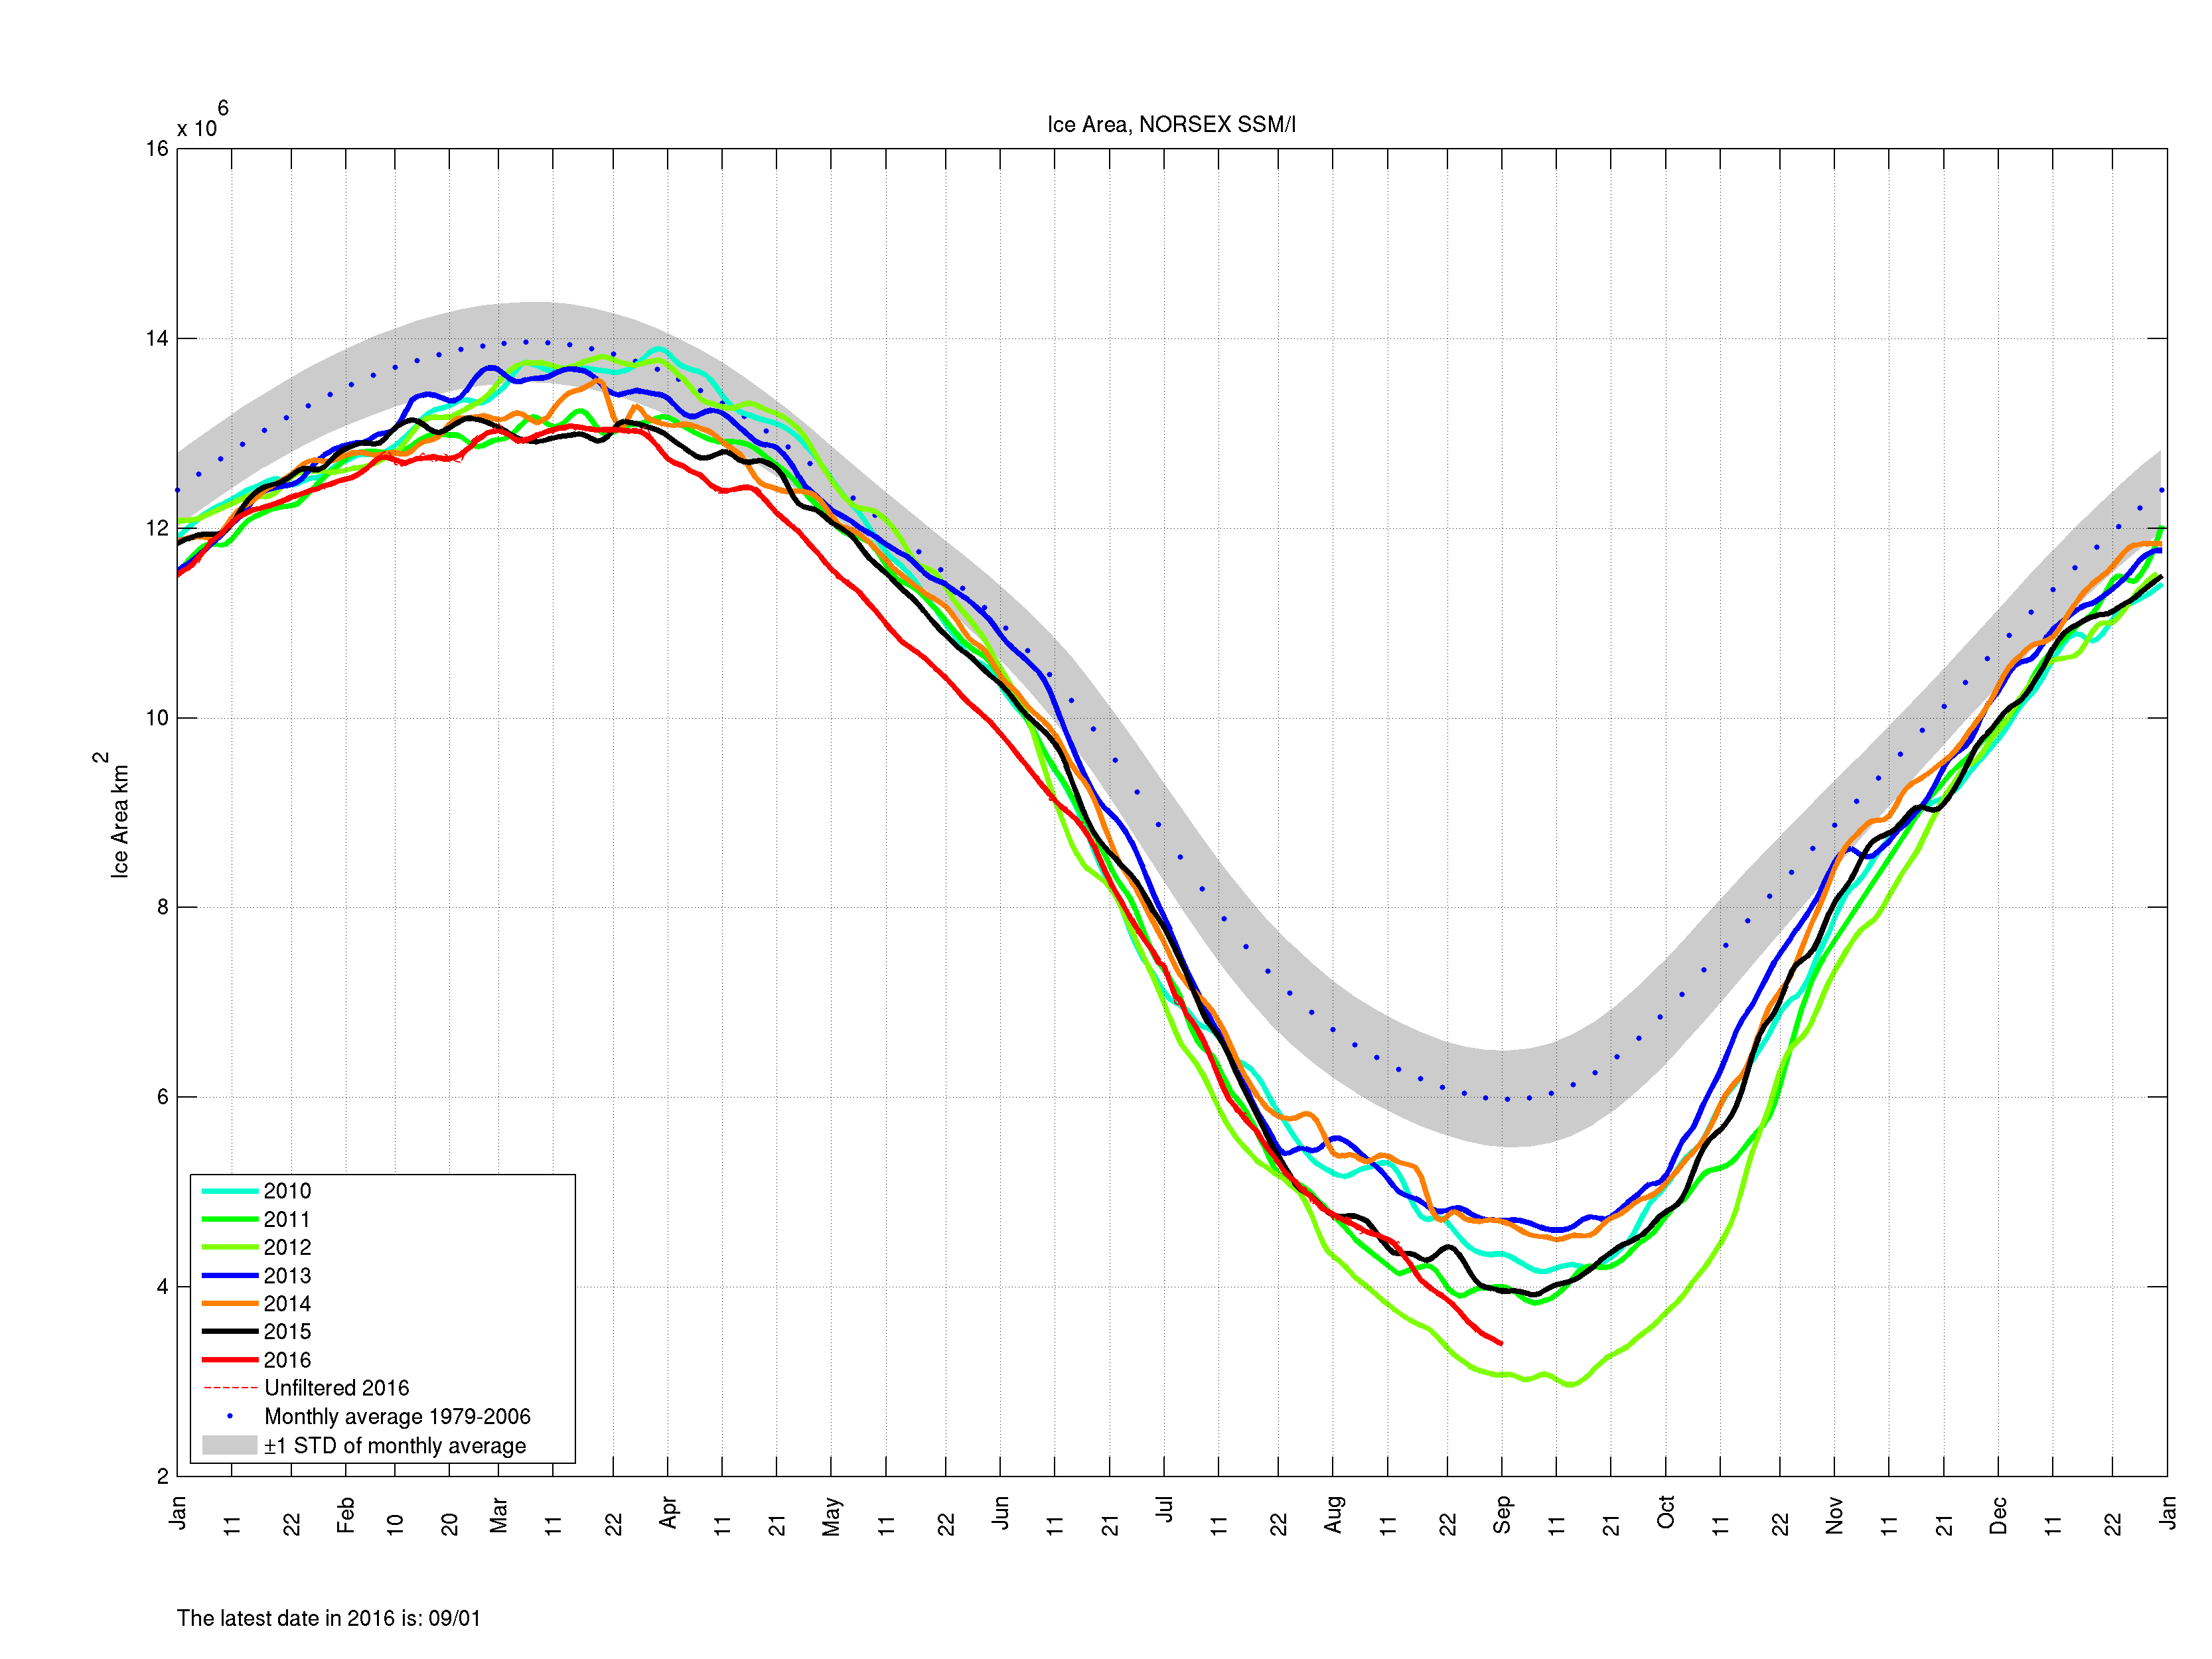
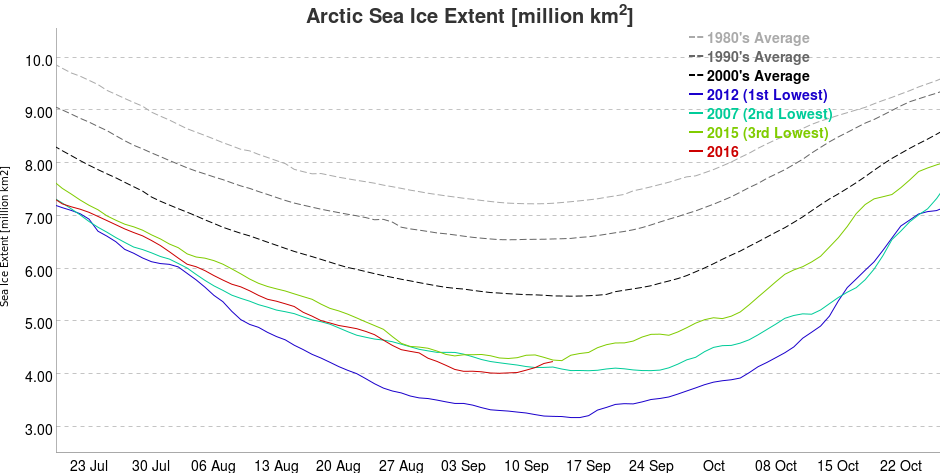
As suggested by Bill, here too are the Arctic Regional Ocean Observing System numbers. Much like the high res AMSR2 data they allow comparison between area and extent from the same sensor/algo combination, in this case SSMIS/NORSEX on a 25 km grid:
Both sources agree that currently the remaining ice is less compact in 2016 than it was in 2012.
[Edit – September 4th]
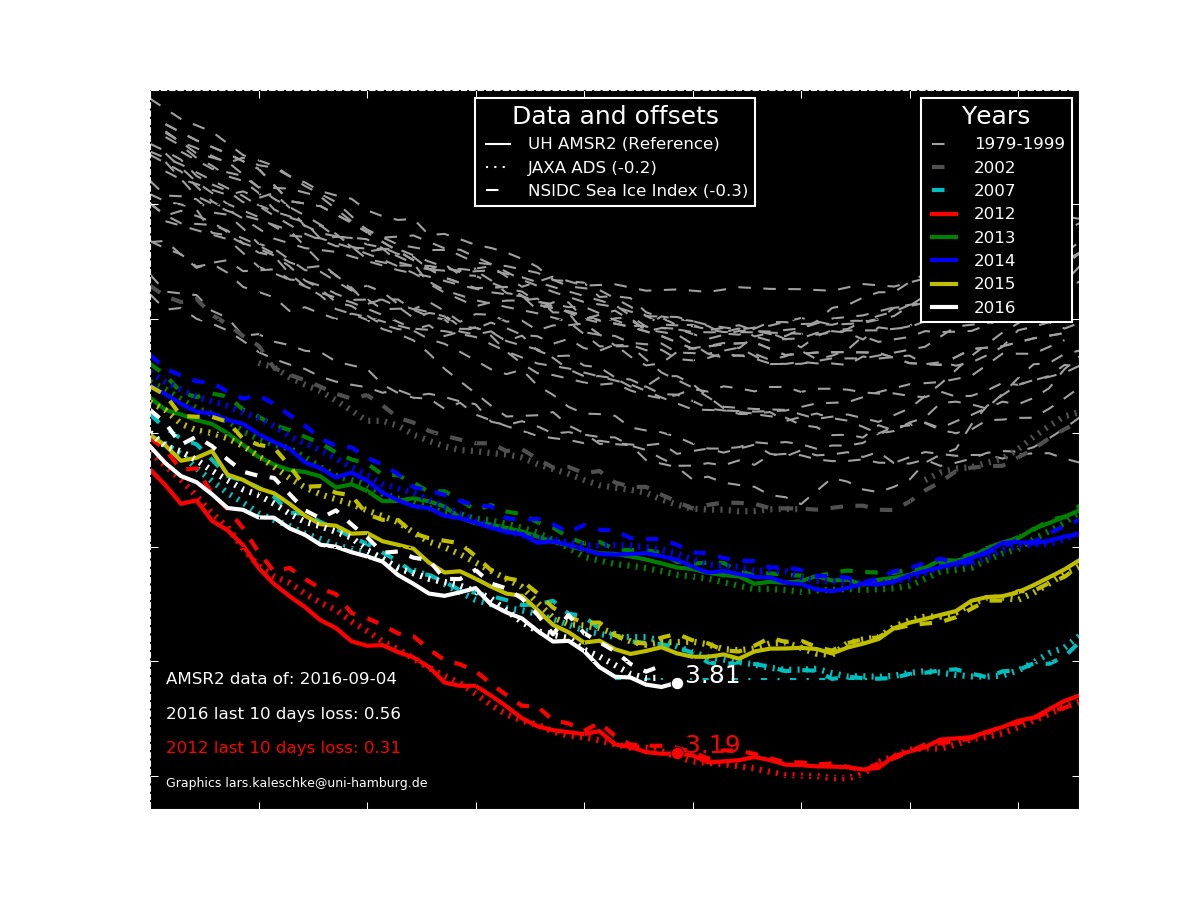
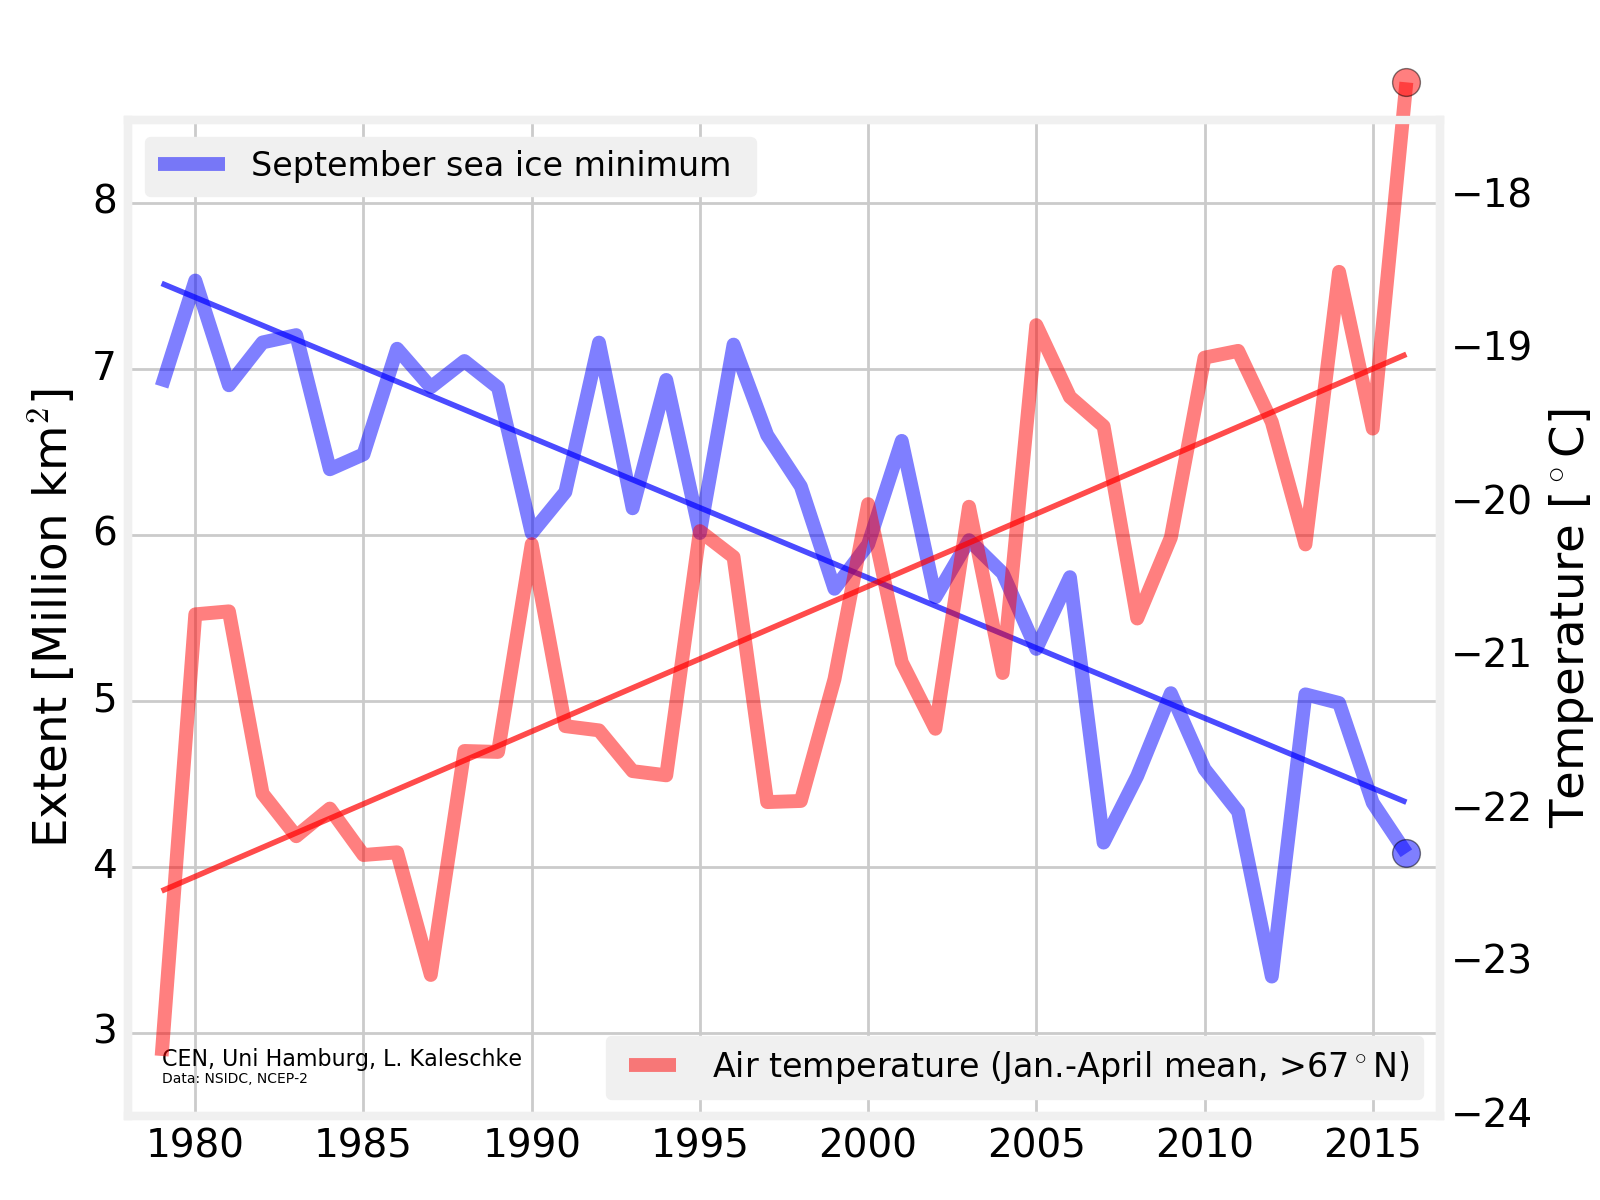
An interesting inter-metric comparison from Lars Kaleschke of the University of Hamburg:
Here’s another twist on the University of Hamburg’s AMSR2 extent, courtesy of Lars Kaleschke:
[Edit – September 11th]
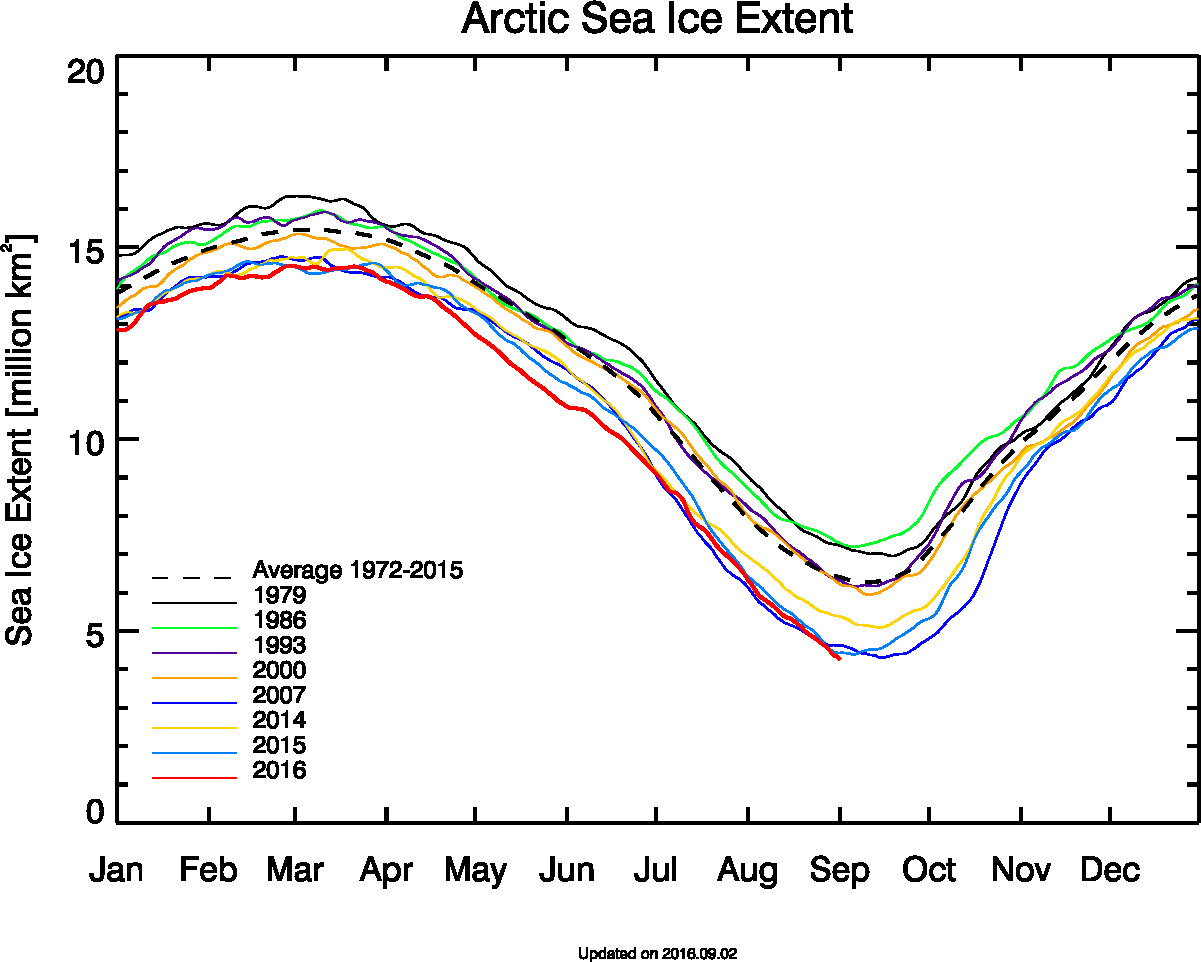
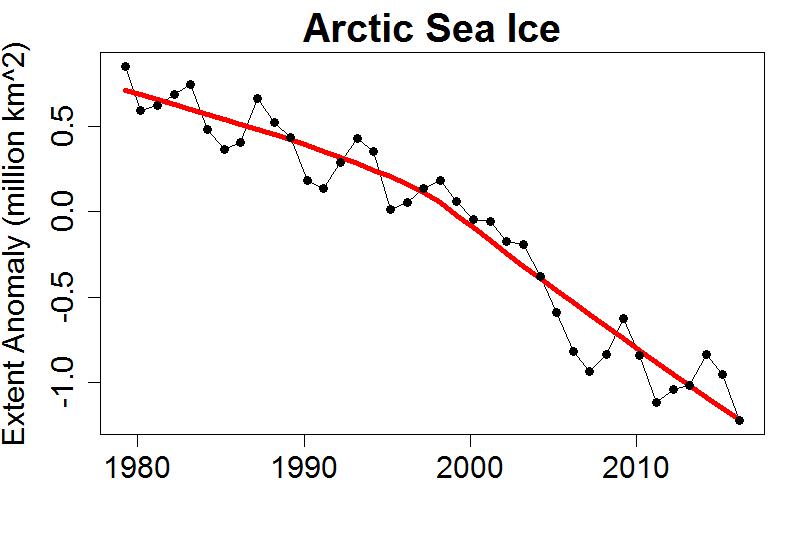
Several of the metrics displayed above have increased over the last day or two. The 2016 minimum may be upon us, but another few days will have to go by before that’s finally confirmed. Whilst we wait here’s another metric to consider, as described on “Tamino’s” Open Mind blog:
A plot of annual average extent also clearly shows the decline, and includes data from throughout the year rather than just the annual minimum. The figure for 2016 is the lowest on record, but the year isn’t done yet. If instead of averaging January-through-December we do September-through-August (to make the final year complete), we find that the most recent year is still the lowest on record:
Any way you look at it, Arctic sea ice is in decline. If you look at the entire year rather than just the annual minimum, the record year is this one.
[Edit – September 14th]
The refreeze has certainly started now. A quick look through the metrics. First of all the Hamburg University high resolution AMSR2 matched set:
Area just squeezed under 3 million km². Next up is JAXA extent:
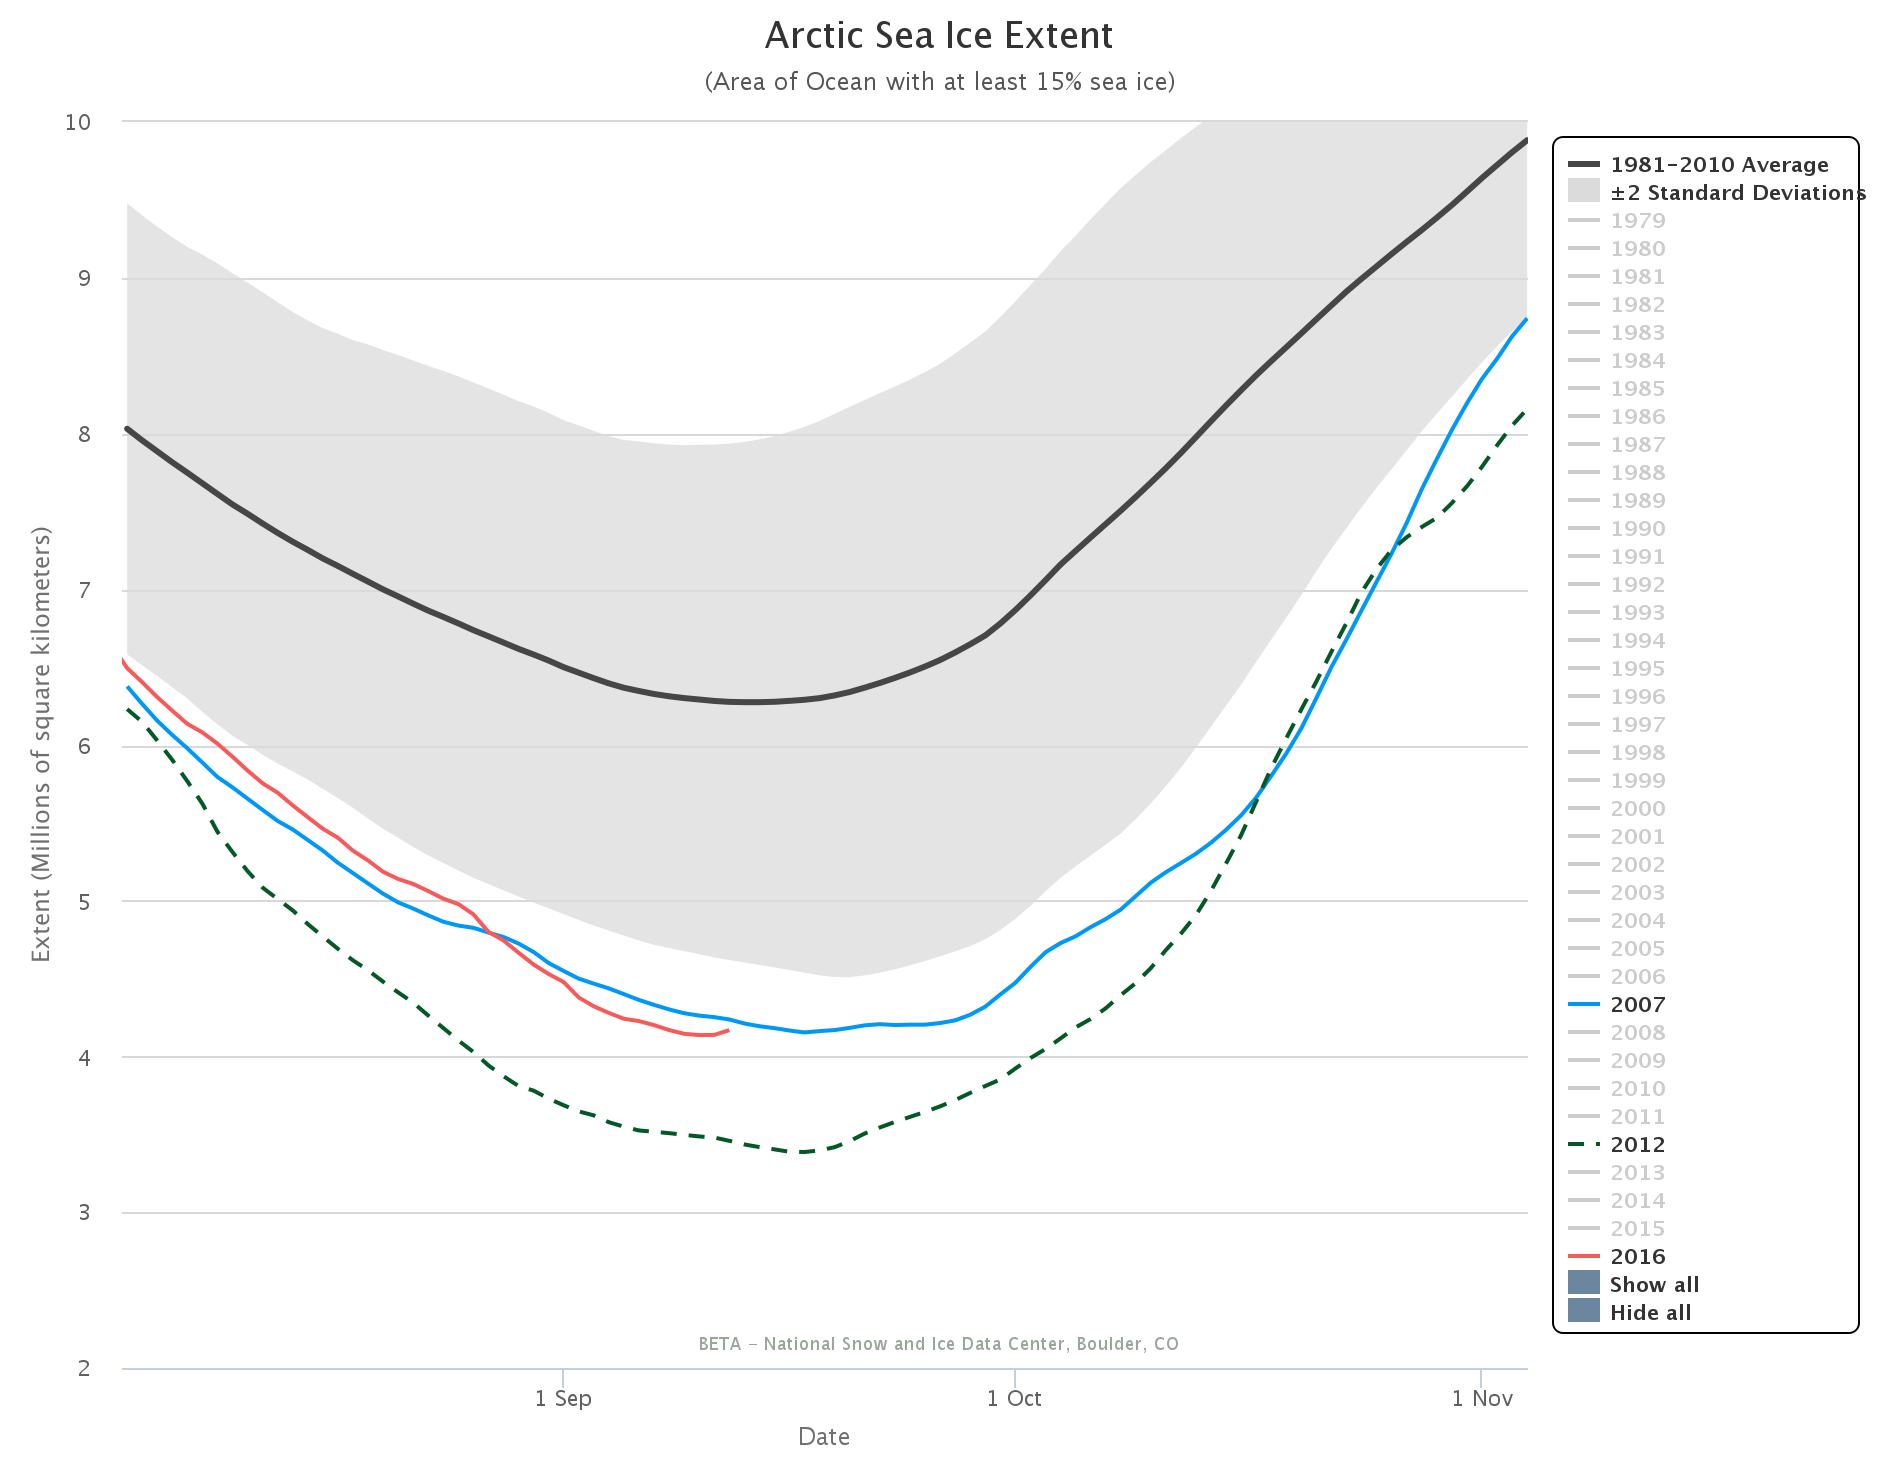
which just failed to fall below 4 million km². Last but not least, just for the moment, is the NSIDC 5 day trailing averaged extent:
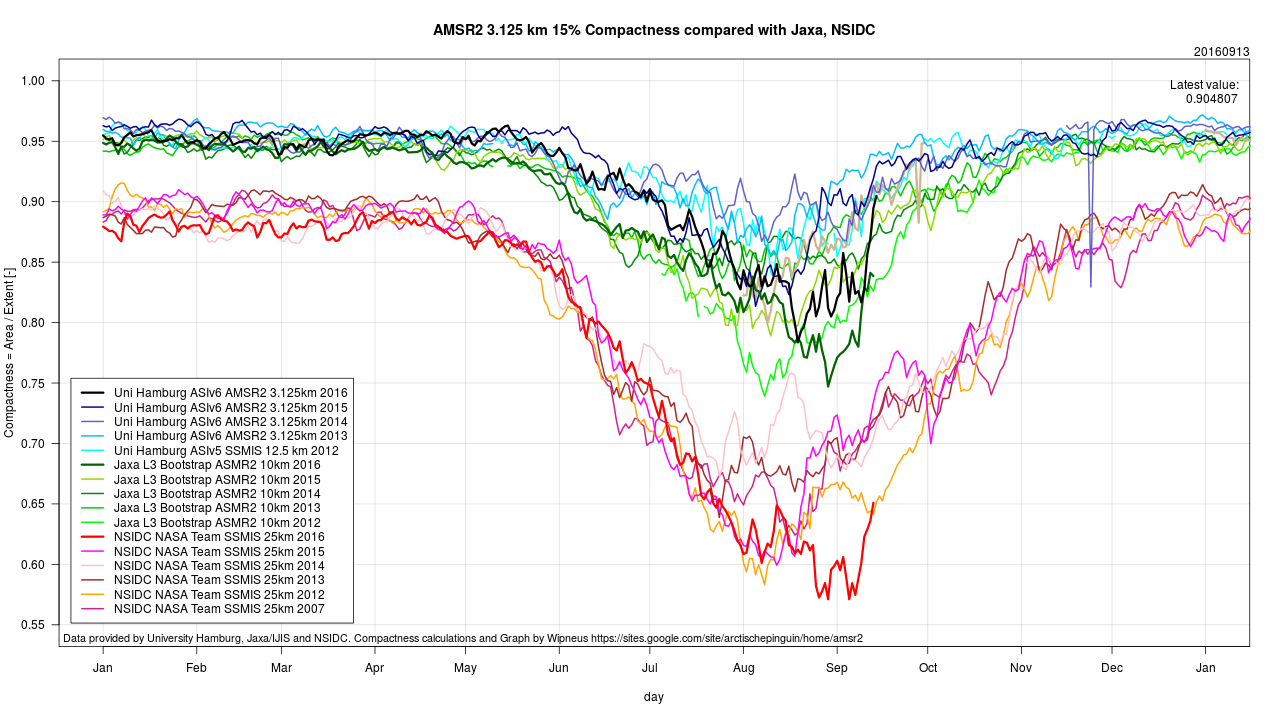
The most striking this year is the unusually large gap between area and extent for this time of year, illustrated by this “compactness” graph from Arctische Pinguin:
Note too the striking difference between different sensor/algo combinations for this metric!
[Edit – September 15th]
With the minimum now beyond doubt, here’s a new graphic from Lars Kaleschke of the University of Hamburg:
Need I say more?
[Edit – September 20th]
The September cyclone has now done its worst:
NASA Worldview “true-color” image of the Beaufort Sea on September 18th 2016, derived from the VIIRS sensor on the Suomi satellite
Leaving the area and extent metrics with an intriguing “double dip”:
2016 Minimum Milestones
September 3rd – JAXA extent dropped to 2nd place below the 2007 minimum at 4.05 million km²
September 7th – JAXA extent minimum of 4.02 million km²
September 8th – NSIDC single day extent dropped to 2nd place below the 2007 minimum at 4.083 million km². This proved to the minimum value for the year as a whole.
September 9th – NSIDC 5 day trailing averaged extent dropped to 2nd place below the 2007 minimum at 4.146 million km²
September 10th – NSIDC 5 day trailing averaged extent minimum of 4.137 million km²
Skeptical sorts across the cryoblogosphere are in meltdown mode at the moment. They seem to be unaware that satellites don’t last forever in the harsh environment of space, and the individual scientific instruments carried by a satellite don’t either. Some failures are more spectacular than others however. By way of illustration here’s one recent report from Space.com:
The February [2015] explosion of an American military satellite may cause some problems for orbiting spacecraft after all, a new study reports.
The U.S. Air Force’s 20-year-old Defense Meteorological Satellite Program Flight 13 (DMSP-F13) craft blew apart on Feb. 3 after experiencing a power-system faillure. Analyses by the European Space Agency and other organizations found that the cloud of space junk generated by the explosion shouldn’t pose much of a threat to their missions, but the new research suggests that not all spacecraft are in the clear.
Another DMSP satellite started pushing up the metaphorical daisies earlier this year. Last month Space Flight Now reported that:
The U.S. Air Force has been unable to send commands to the service’s newest weather satellite for nearly a month, and engineers are trying to determine if the spacecraft can be salvaged, officials said last week.
The polar-orbiting Defense Meteorological Satellite Program Flight 19, or DMSP F19, spacecraft stopped responding to orders from the ground Feb. 11, the Air Force said in a March 3 press release.
“At this time, it is not known what caused the anomaly or if the satellite will be recovered, and the anomaly is under investigation,” the Air Force said. “There are no other known issues with the satellite.”
Designed for a five-year service life, DMSP F19 launched April 3, 2014, from California atop a United Launch Alliance Atlas 5 rocket. It is the newest in the Air Force’s series of DMSP weather observatories designed to help forecasters predict storms, clouds, fog and dust storms that could inhibit global military operations.
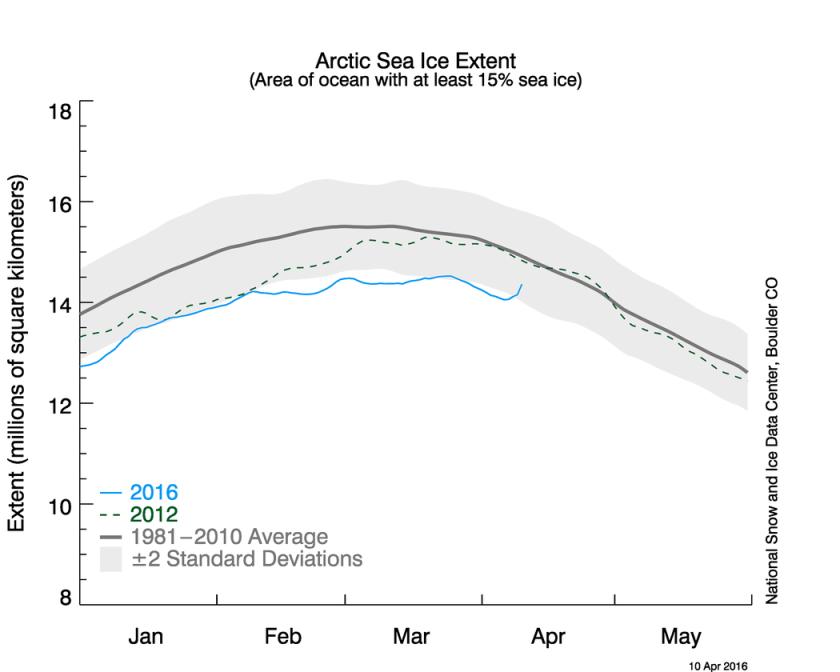
The data provided by the Special Sensor Microwave Imager/Sounder (SSMIS) instrument carried aboard several of the DMSP series of satellites is used by the National Snow and Ice Data Center to calculate their Sea Ice Index metric of Arctic sea ice extent. However suddenly Boulder has a problem. As we reported earlier this week the SSMIS sensor carried by DMSP F17 appears to be malfunctioning. This can be seen in this visualisation of the data from the European Ocean and Sea Ice Satellite Application Facility(OSI-SAF):
Look closely at the top centre of the image to see a large patch of spurious “sea ice”. Here’s the resulting SII extent graph from the NSIDC:
Anthony Watts reported this news in typically fanciful fashion:
There is this small notice on the NSIDC page:
“The daily sea ice extent images are currently displaying erroneous data. NSIDC is investigating.”
It looks to be a problem with the DMSP F17 satellite.
Makes you wonder how long this has been going on and if the anomalously low readings we’ve seen for awhile are due to a slow sensor degradation.
Time will tell.
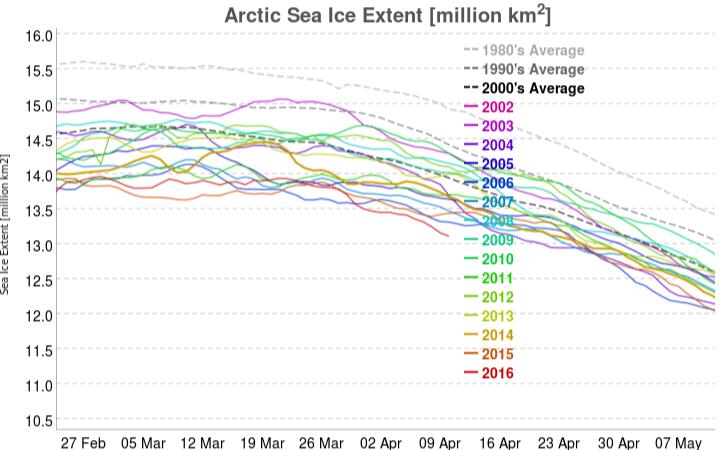
For a more realistic interpretation of the facts we suggest that instead of reading the propaganda perpetrated at WUWT you instead examine this graph derived using data from the AMSR2 sensor on board the Japanese SHIZUKU satellite:
Mr. Watts evidently takes a very US centric view of these matters, since he neglected to report this timely news bulletin from the OSI-SAF:
Due to the previously reported problems with one of the channels on SSMIS onboard DMSP F17, OSI SAF is now working on replacing DMSP F17 with DMSP F18 in our sea ice products.
Currently, the switch to F18 has been implemented for the ice concentration product (OSI-401). The product dated 20160410 has been reprocessed and is available on our FTP server, ftp://osisaf.met.no/prod/ice/conc/ and ftp://osisaf.met.no/archive/ice/conc/2016/04
The ice edge and type products (OSI-402 and OSI-403) will be updated to use F18 tomorrow, 2016-04-12.
It seems Willis Eschenbach, the current Watts Up With That resident sea ice expert, is already beavering away endeavouring to prove Anthony’s case for him:
We have no way to know if this has been a gradual decrease followed by a failure, so yes, it’s certainly possible that the previous data is bad. Doesn’t mean it is, but we’d be fools not to check.
We suggested a simple check:
Why not compare the NSIDC’s SSMIS data from F-17 with JAXA’s AMSR2 data from Shizuku? Wouldn’t that do the trick?
Willis replied:
I meant that just from the bad reading alone, we don’t know if the previous data is bad. Yes, we can check it in the way you suggest and other ways … which is why I said we’d be fools not to check.
We think that if he does his due diligence he will find that he is in actual fact engaged on a fool’s errand, but time will indeed tell. Let’s wait and see what Willis n Willard can come up with, shall we? Meanwhile we also cannot help but wonder what the dynamic duo might make of our own due diligence replicating the results of another collaboration of theirs:
This website uses cookies to improve your experience. We'll assume you're ok with this, but you can opt-out if you wish. Cookie settingsACCEPT
Privacy & Cookies Policy
Privacy Overview
This website uses cookies to improve your experience while you navigate through the website. Out of these, the cookies that are categorized as necessary are stored on your browser as they are essential for the working of basic functionalities of the website. We also use third-party cookies that help us analyze and understand how you use this website. These cookies will be stored in your browser only with your consent. You also have the option to opt-out of these cookies. But opting out of some of these cookies may affect your browsing experience.
Necessary cookies are absolutely essential for the website to function properly. This category only includes cookies that ensures basic functionalities and security features of the website. These cookies do not store any personal information.
Any cookies that may not be particularly necessary for the website to function and is used specifically to collect user personal data via analytics, ads, other embedded contents are termed as non-necessary cookies. It is mandatory to procure user consent prior to running these cookies on your website.