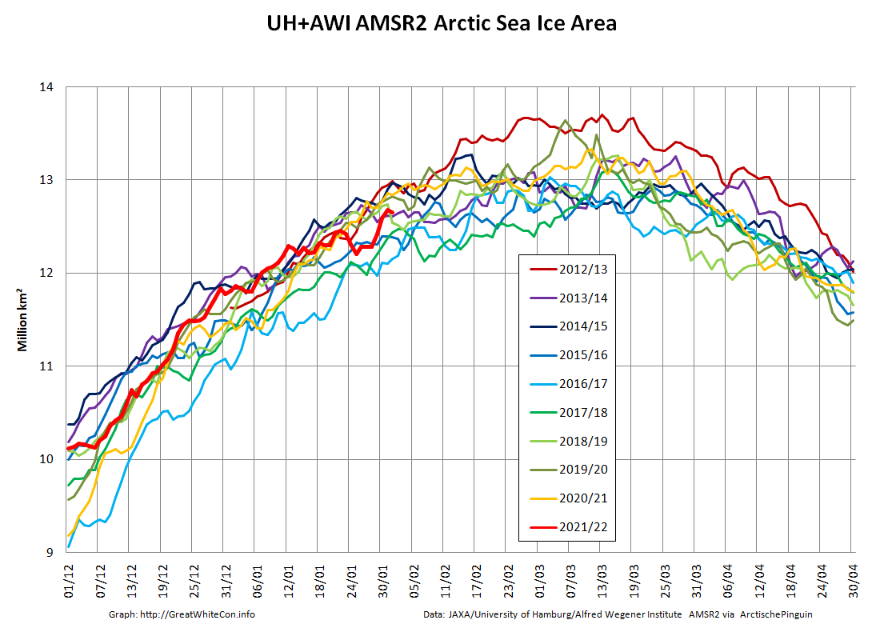
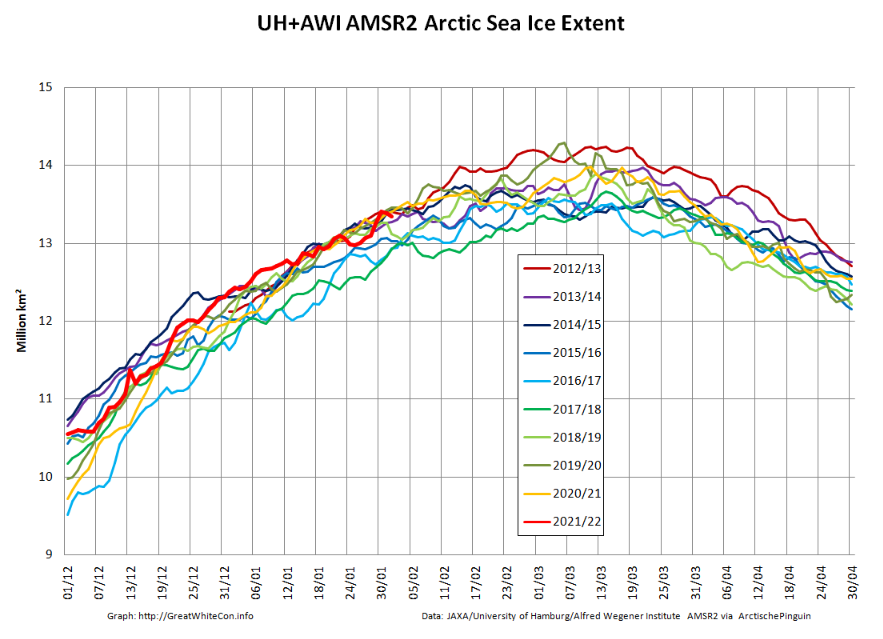
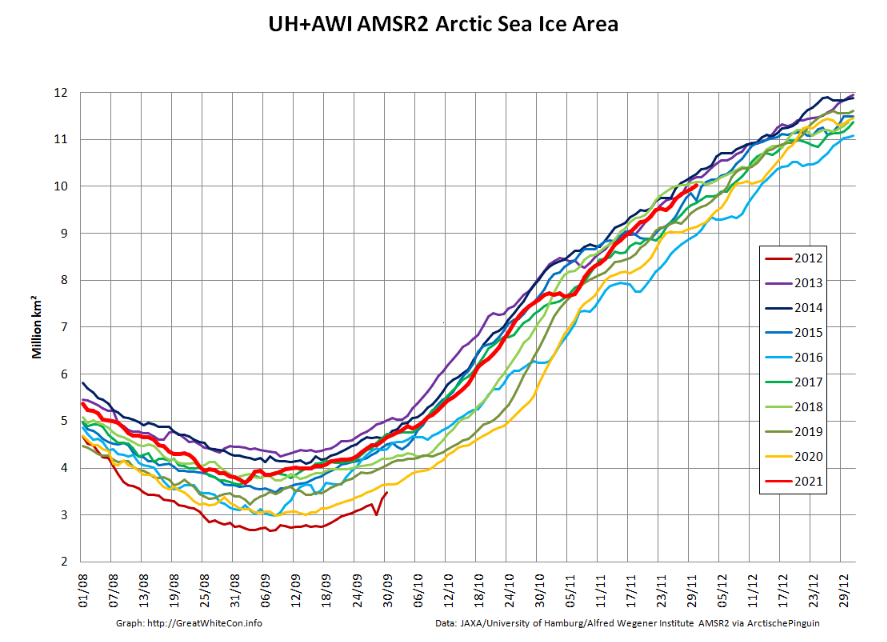
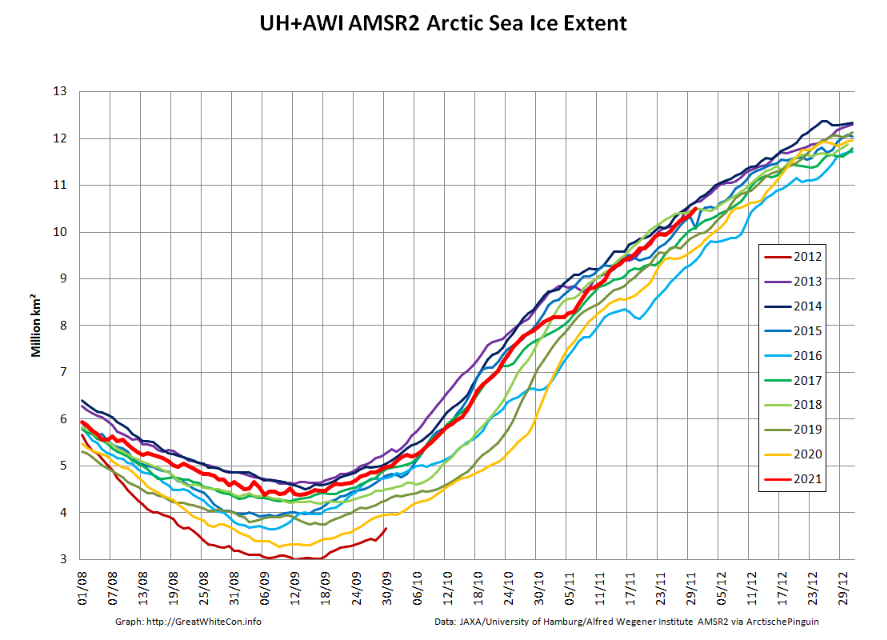
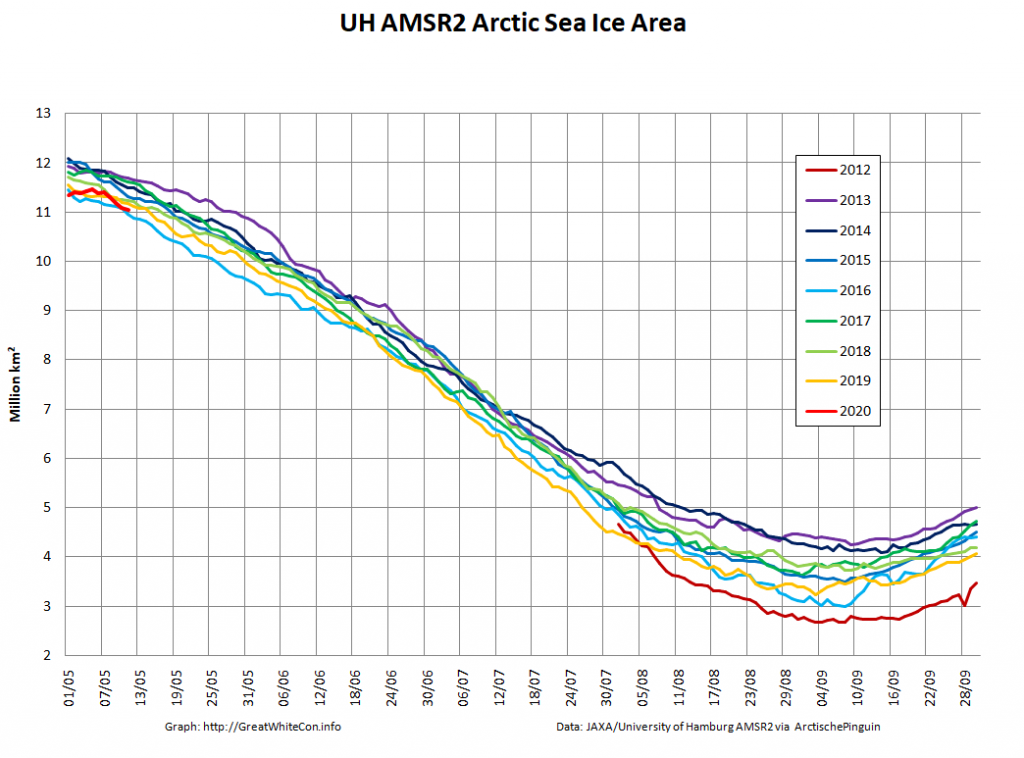
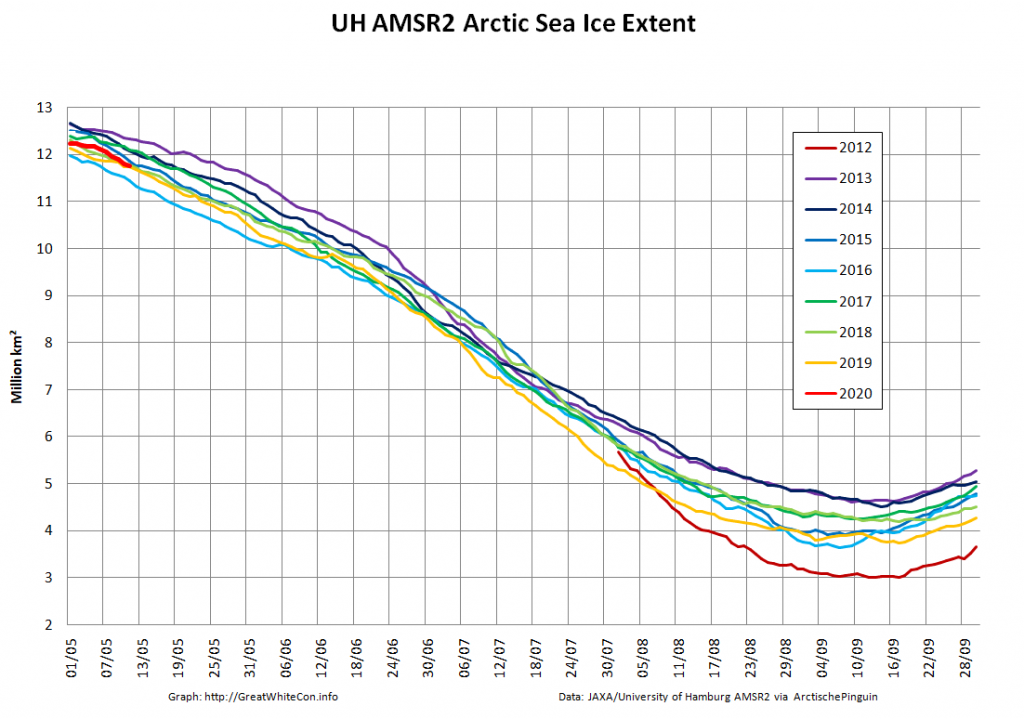
Following the “Great Arctic Winter Cyclone” towards the end of January, here are the latest high resolution AMSR2 area and extent graphs:
The sudden reduction in sea ice area due to the cyclone is very apparent, as is the subsequent refreeze of the affected area. Here’s an animation of AMSR2 concentration revealing more detail:
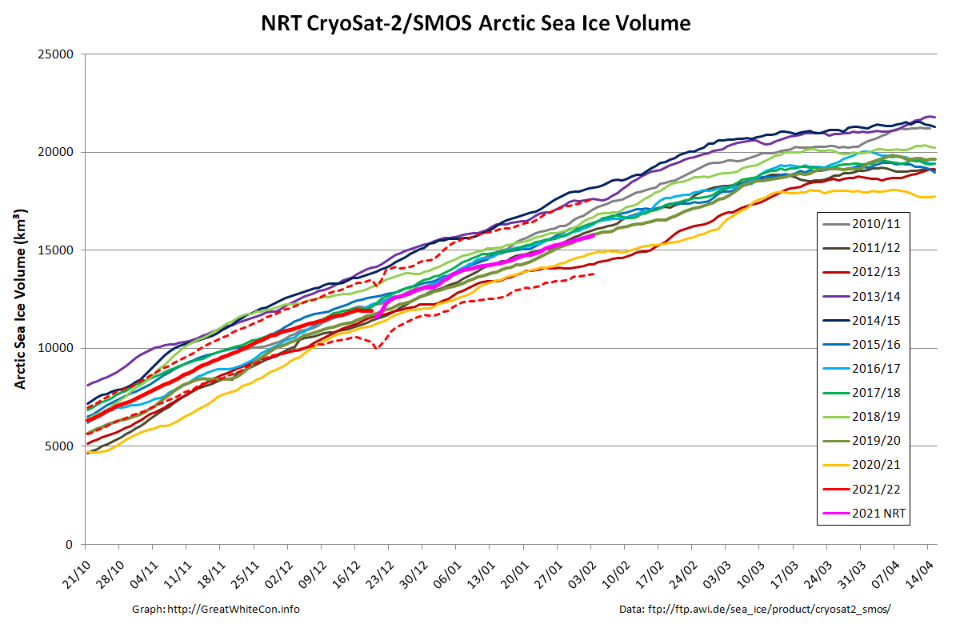
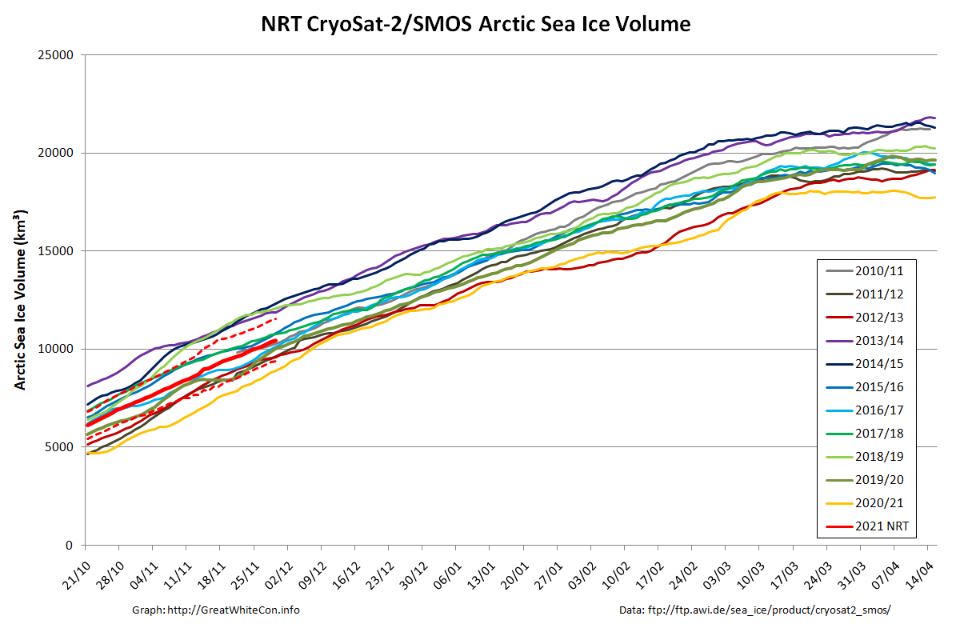
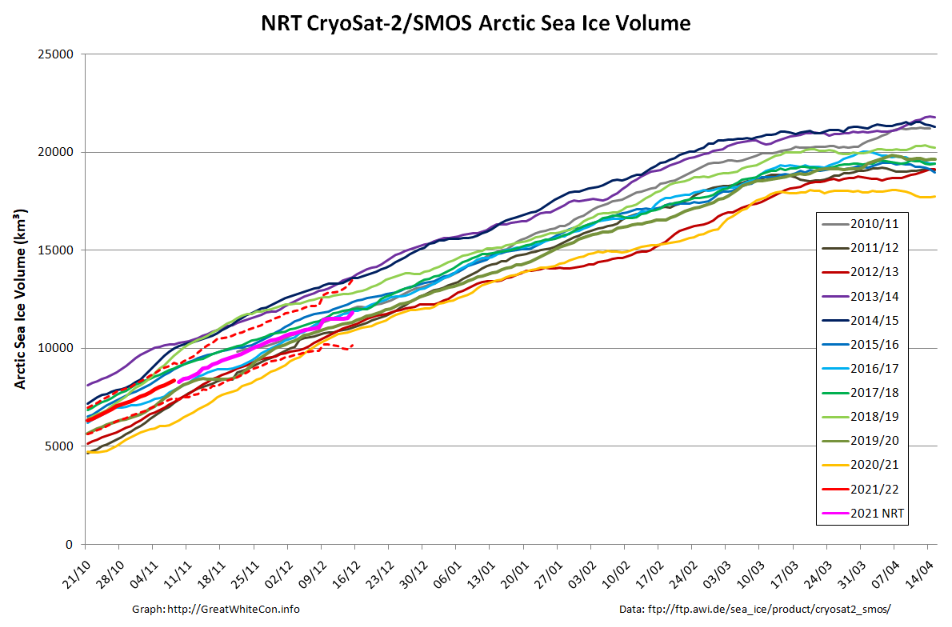
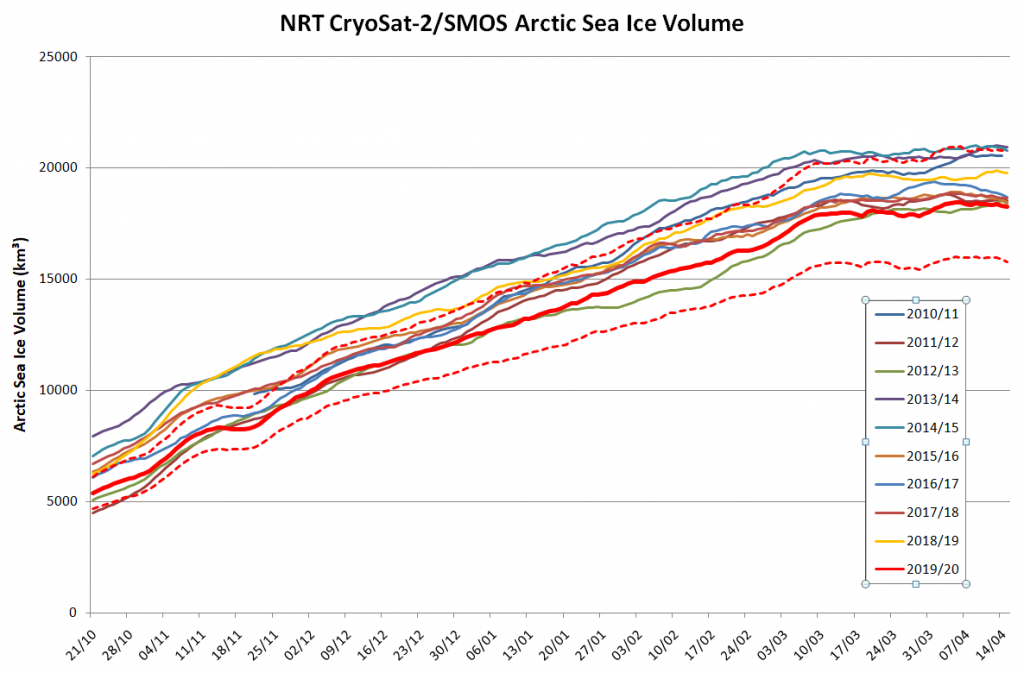
Here too is the latest AWI CryoSat-2/SMOS Arctic sea ice volume graph:
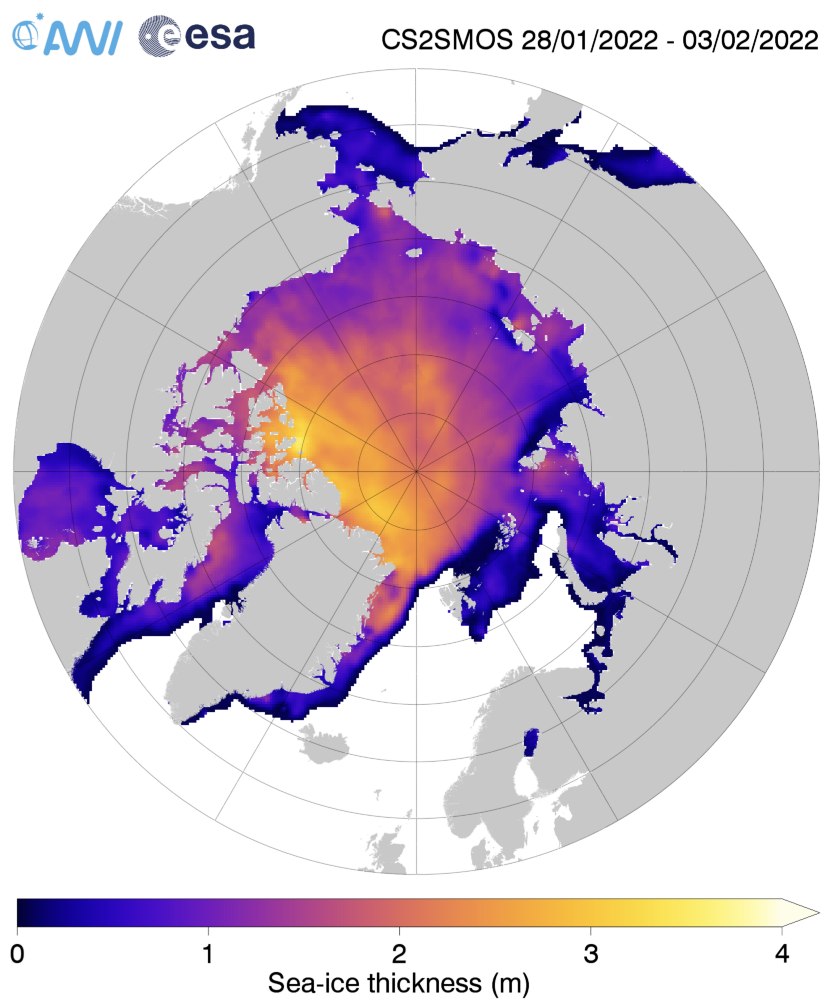
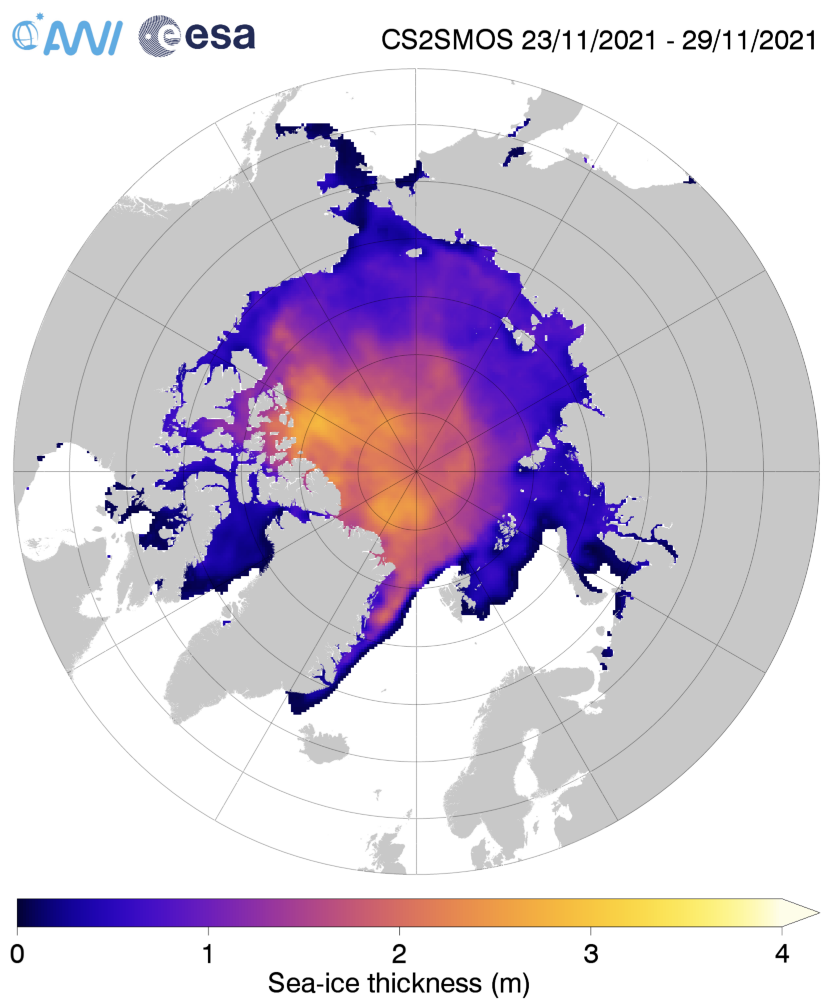
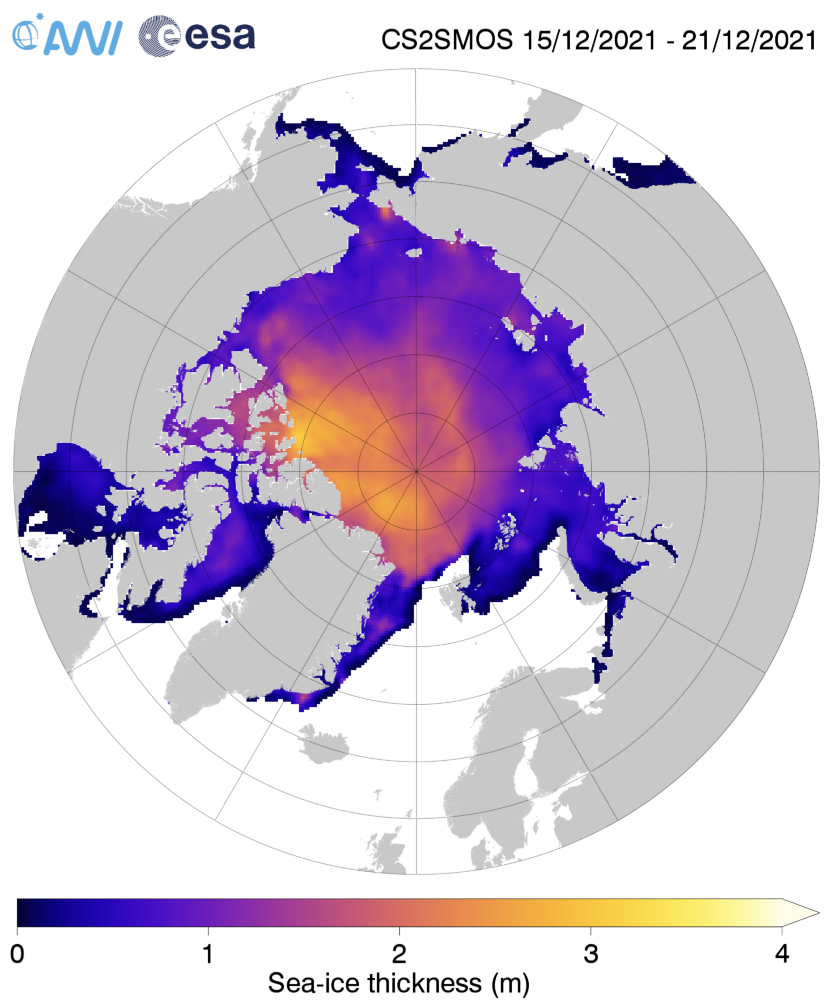
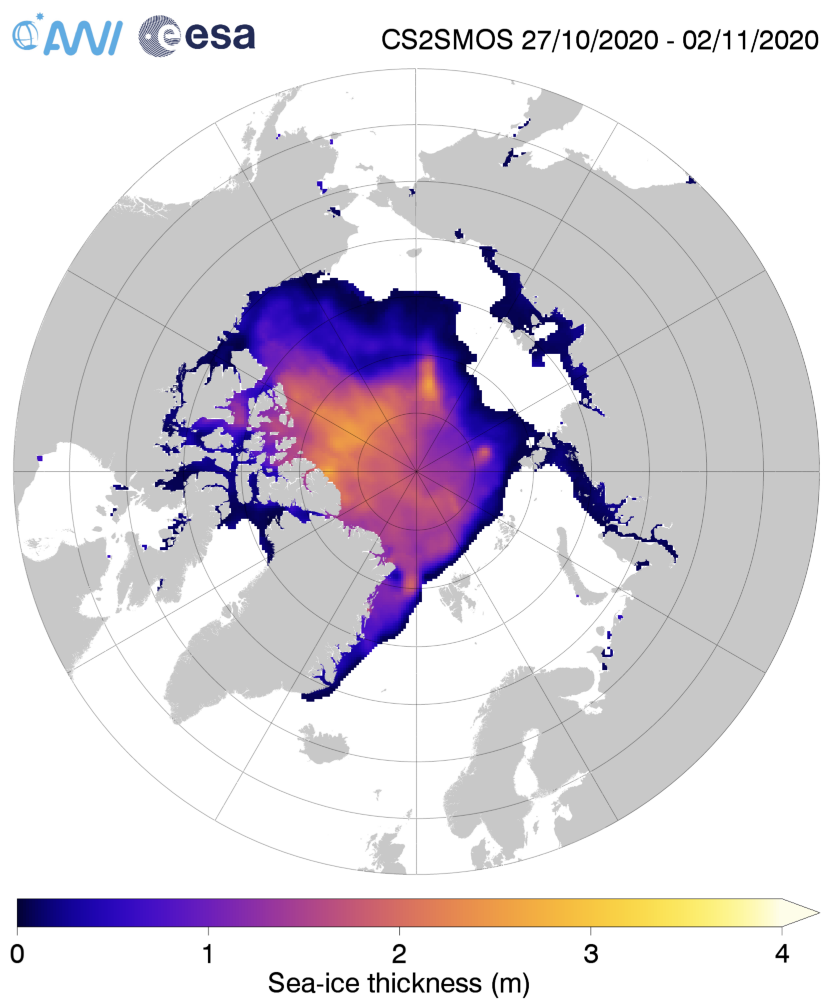
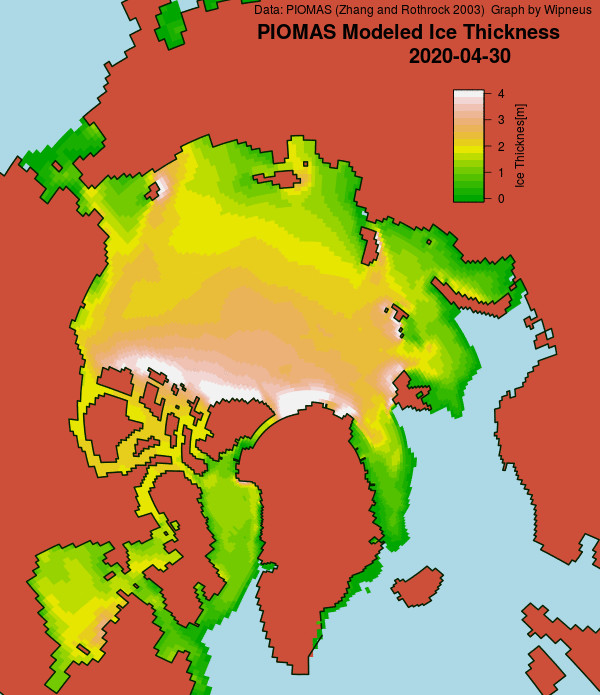
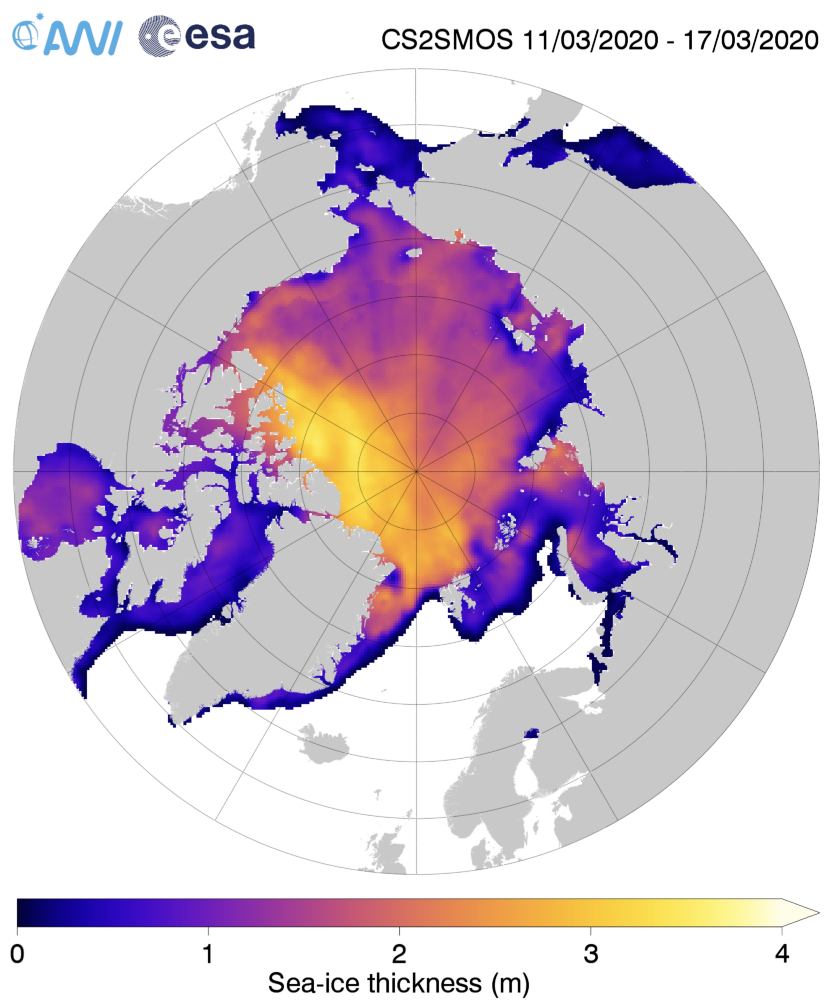
It doesn’t reveal a similar “blip” towards the end of January, suggesting that reduction in area was due to compaction rather than melt. The current AWI thickness map shows the freshly formed ice north east of Svalbard is still very thin:
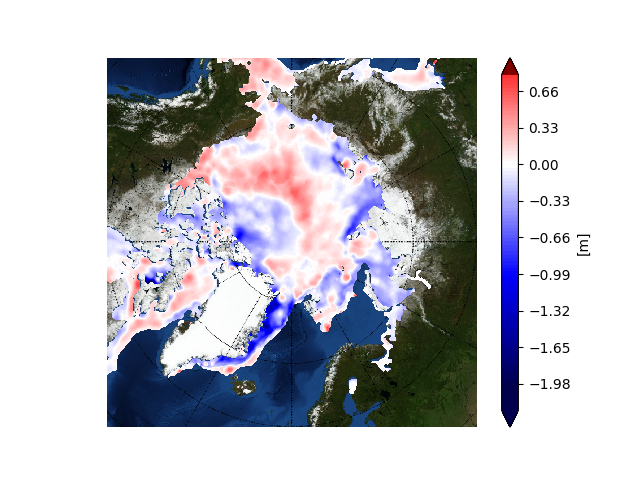
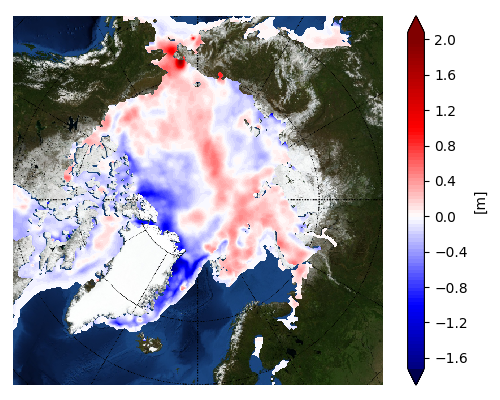
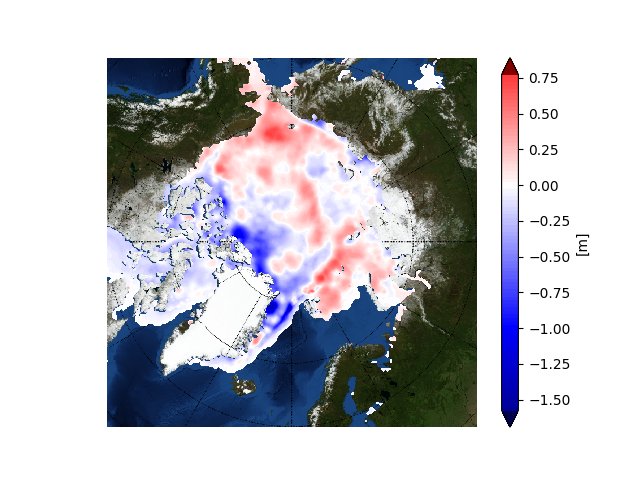
The latest thickness anomaly map from the Finnish Meteorological Institute shows that the ice which was exported from the Central Arctic via the Fram Strait is nevertheless still anomalously thin, although there is now an area of thicker ice north of Greenland:
2021 has been and gone, so first of all may I wish all our readers a very Happy New Year.
Sadly it’s not been a happy start to 2022 for the inhabitants of Boulder, Colorado, home of the National Snow and Ice Data Center. According to the Denver Post:
The Marshall fire destroyed an estimated 991 homes in Boulder County, damaged 127 more and may have killed three people, Sheriff Joe Pelle said Saturday afternoon.
Pelle added that the cause of the fire — the most damaging in Colorado history — remains under investigation, and confirmed that sheriff’s officials have served a search warrant on at least one property based on a tip.
Currently, two people are missing in Superior and another is missing in the Marshall area, Pelle said. All three are feared dead as each of their homes was lost to the fire, the sheriff said…
So far, officials say Thursday’s wildfire — exacerbated by 100-mph winds — burned more than 6,000 acres across Boulder County.
The fire destroyed 553 homes in Louisville, damaging 45, Pelle said Saturday. It also destroyed 332 homes in Superior, damaging 60 in that town, and destroyed 106 homes in unincorporated Boulder County, damaging 22…
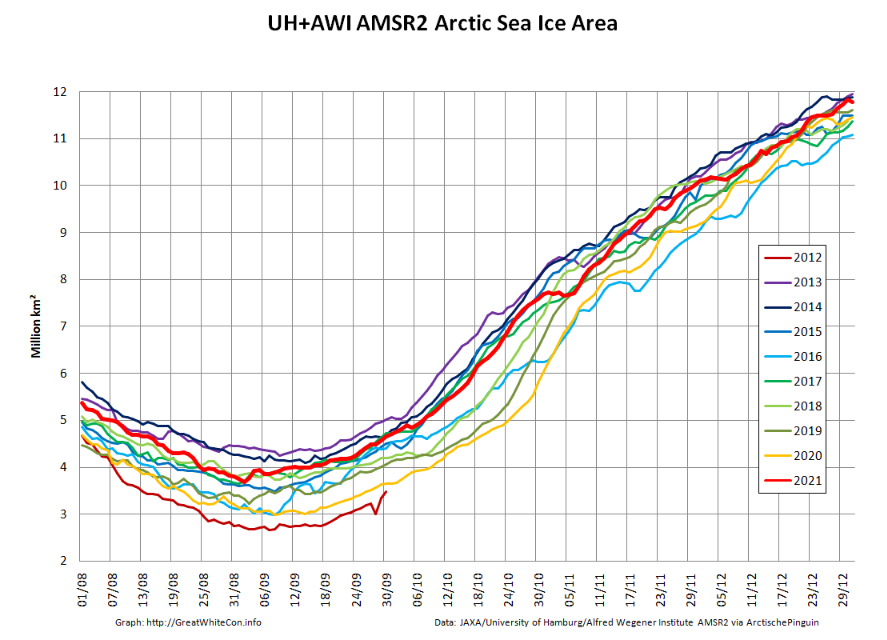
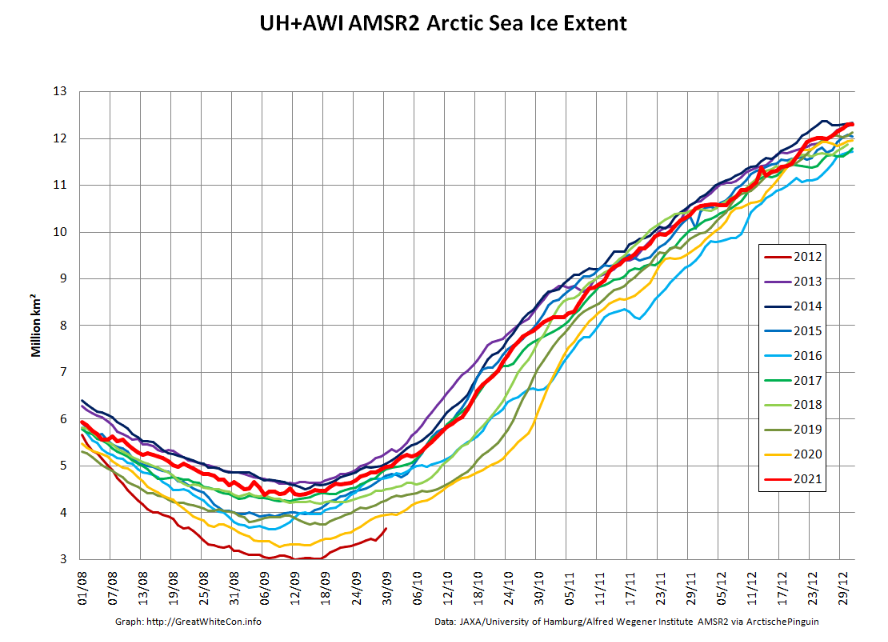
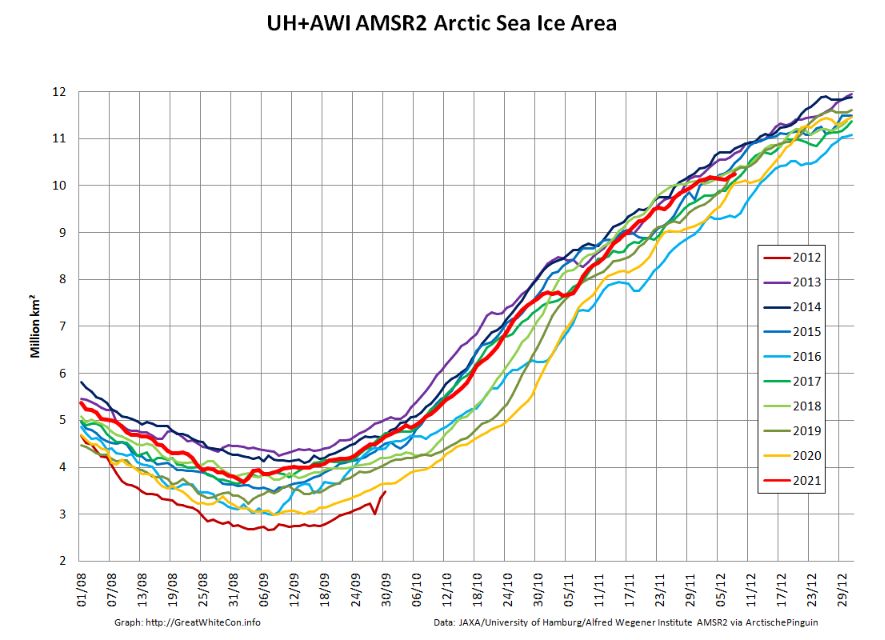
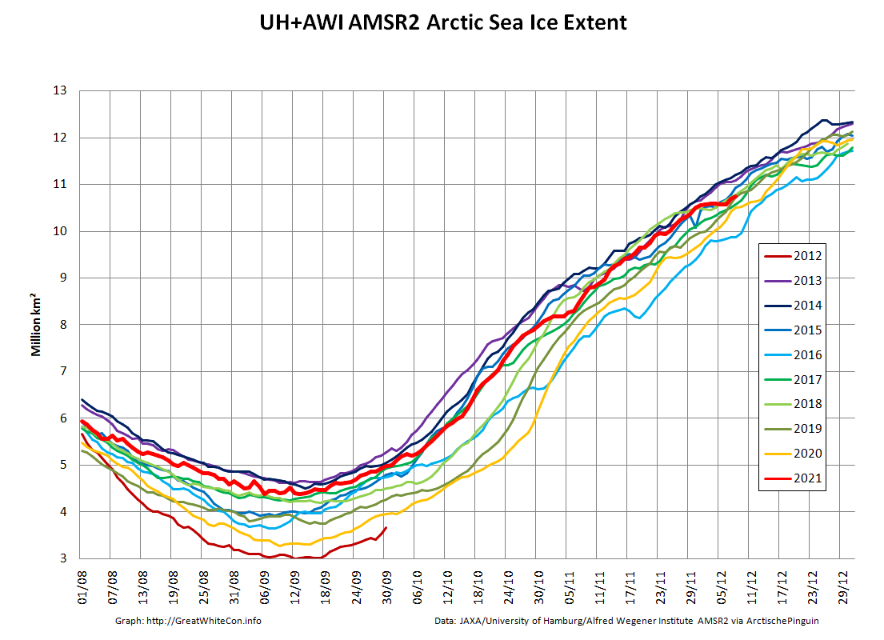
Moving north to examine snow and ice data from the Arctic, let’s start 2022 in traditional fashion with a look at high resolution AMSR2 area and extent:
Both metrics are now near the upper boundary of the last 10 years’ range. The AMSR2 instrument wasn’t launched into orbit until summer 2012, but according to both JAXA and NSIDC data extent on January 1st 2022 is almost identical to the same date in 2012. Regular readers will recall that year went on to produce the lowest annual minimum extent in the satellite era despite recording the highest annual maximum in the decade of the 2010s:
Note that sea ice volume tells a rather different story. Here’s the latest AWI CryoSat-2/SMOS volume graph:
The current near real time data is likely to be revised upwards slightly when the final reanalysis is complete, but even so volume seems likely to remain in the lower half of the recent range at the end of 2021.
Once again the ice in the so called “last ice area” north of Greenland and Ellesmere Island is thinner than usual, as is the ice in the Fram Strait and East Greenland Sea.
[Edit – January 11th]
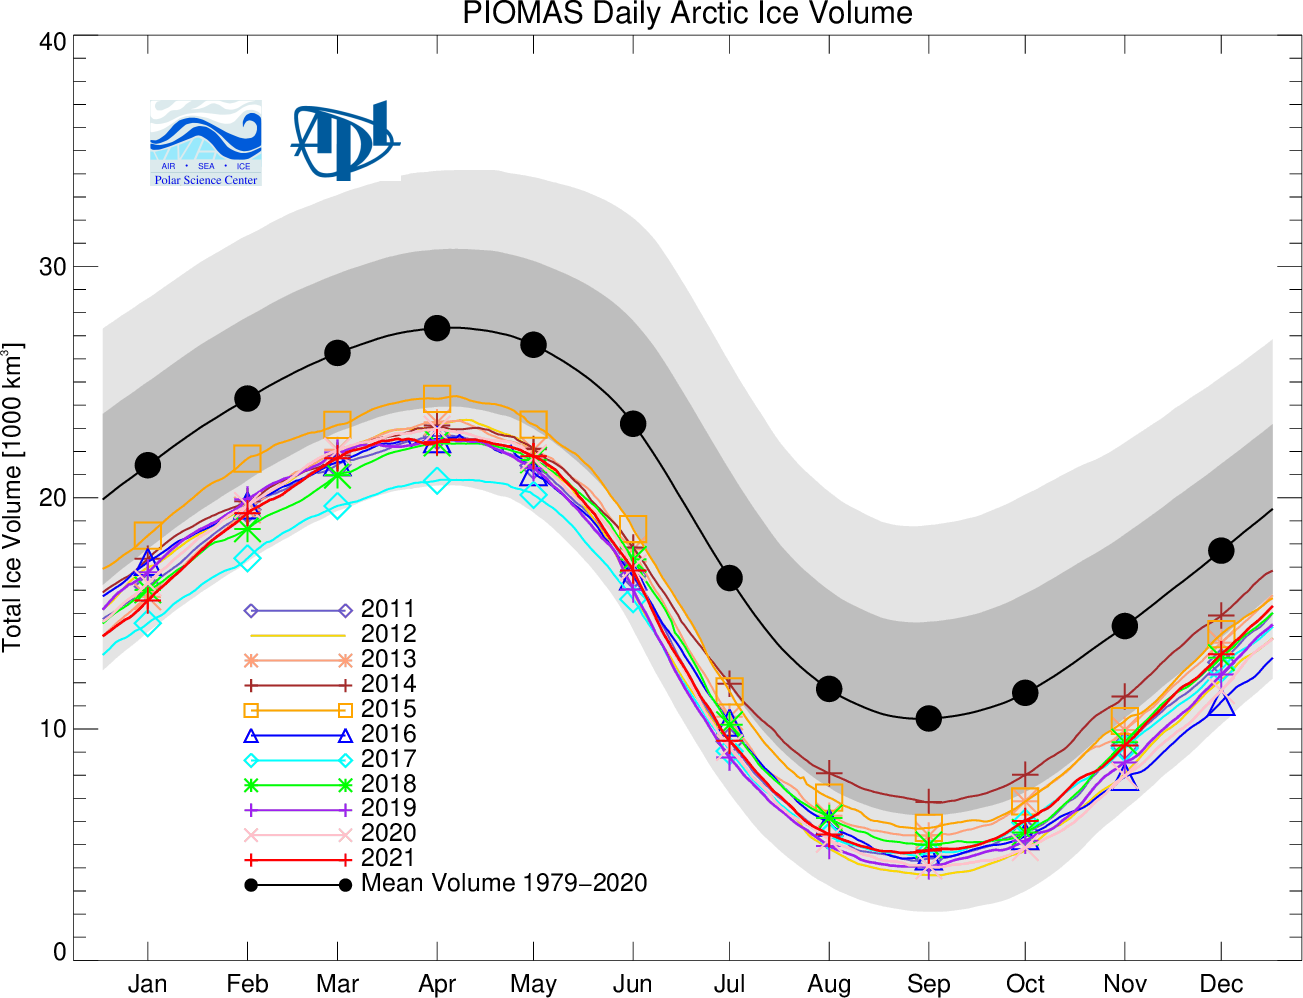
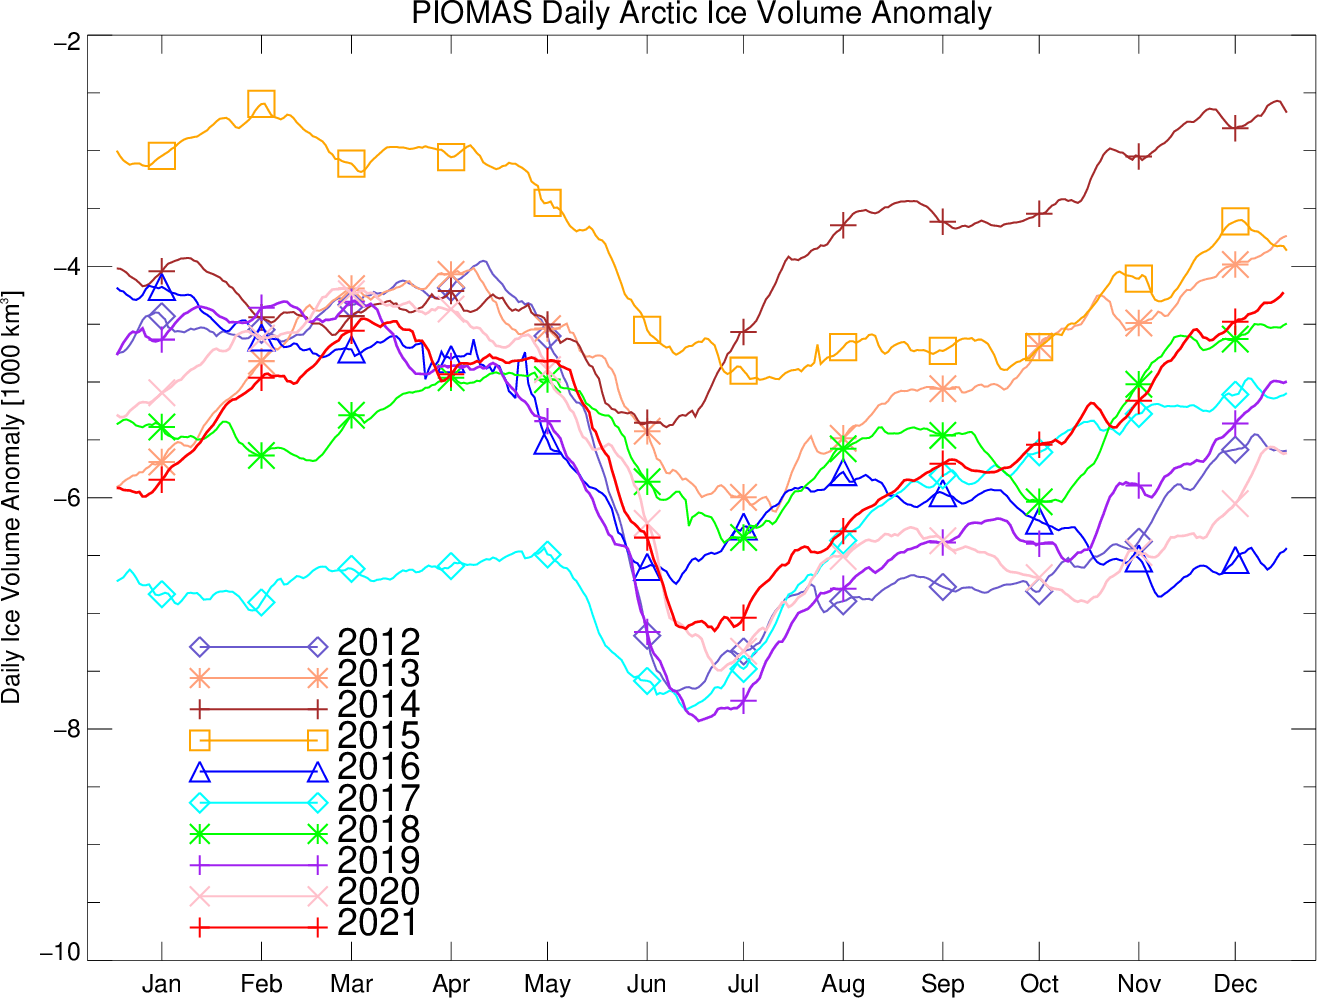
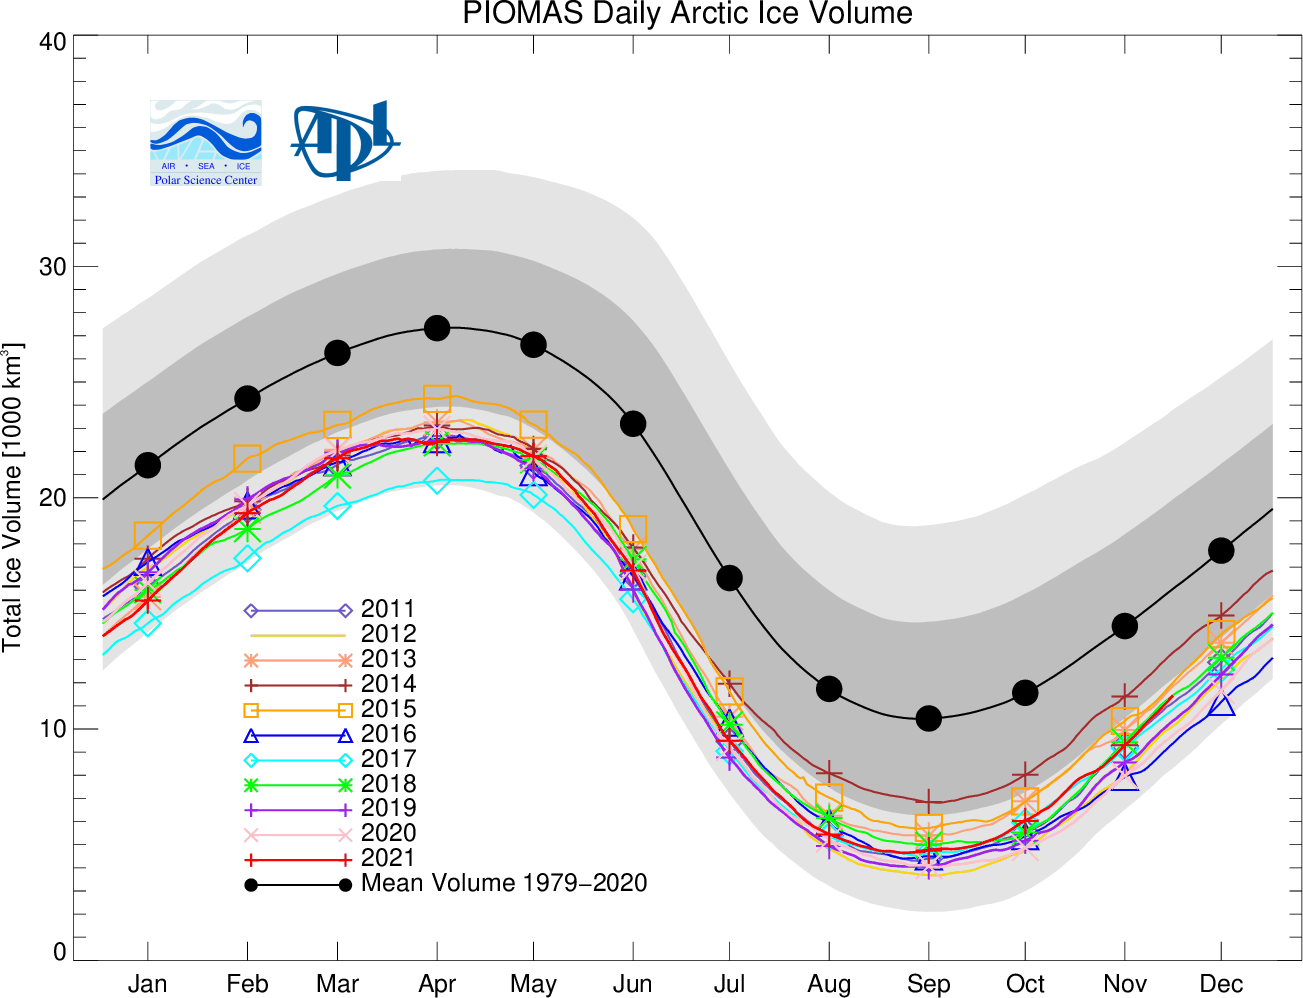
As has been pointed out below, the Polar Science Center has now released the PIOMAS volume data for December 2021:
Average Arctic sea ice volume in December 2021 was 13,300 km3. This value is the 9th lowest on record for December, about 2100 km3 above the record set in 2016. Monthly ice volume was 51% below the maximum in 1979 and 37% below the mean value for 1979-2020. Average December 2021 ice volume was 1.2 standard deviations above the 1979-2020 trend line.
November and December of 2021 saw relative rapid ice growth for recent years, bringing the mean ice thickness (above 15 cm thickness) towards the thicker end of the recent values.
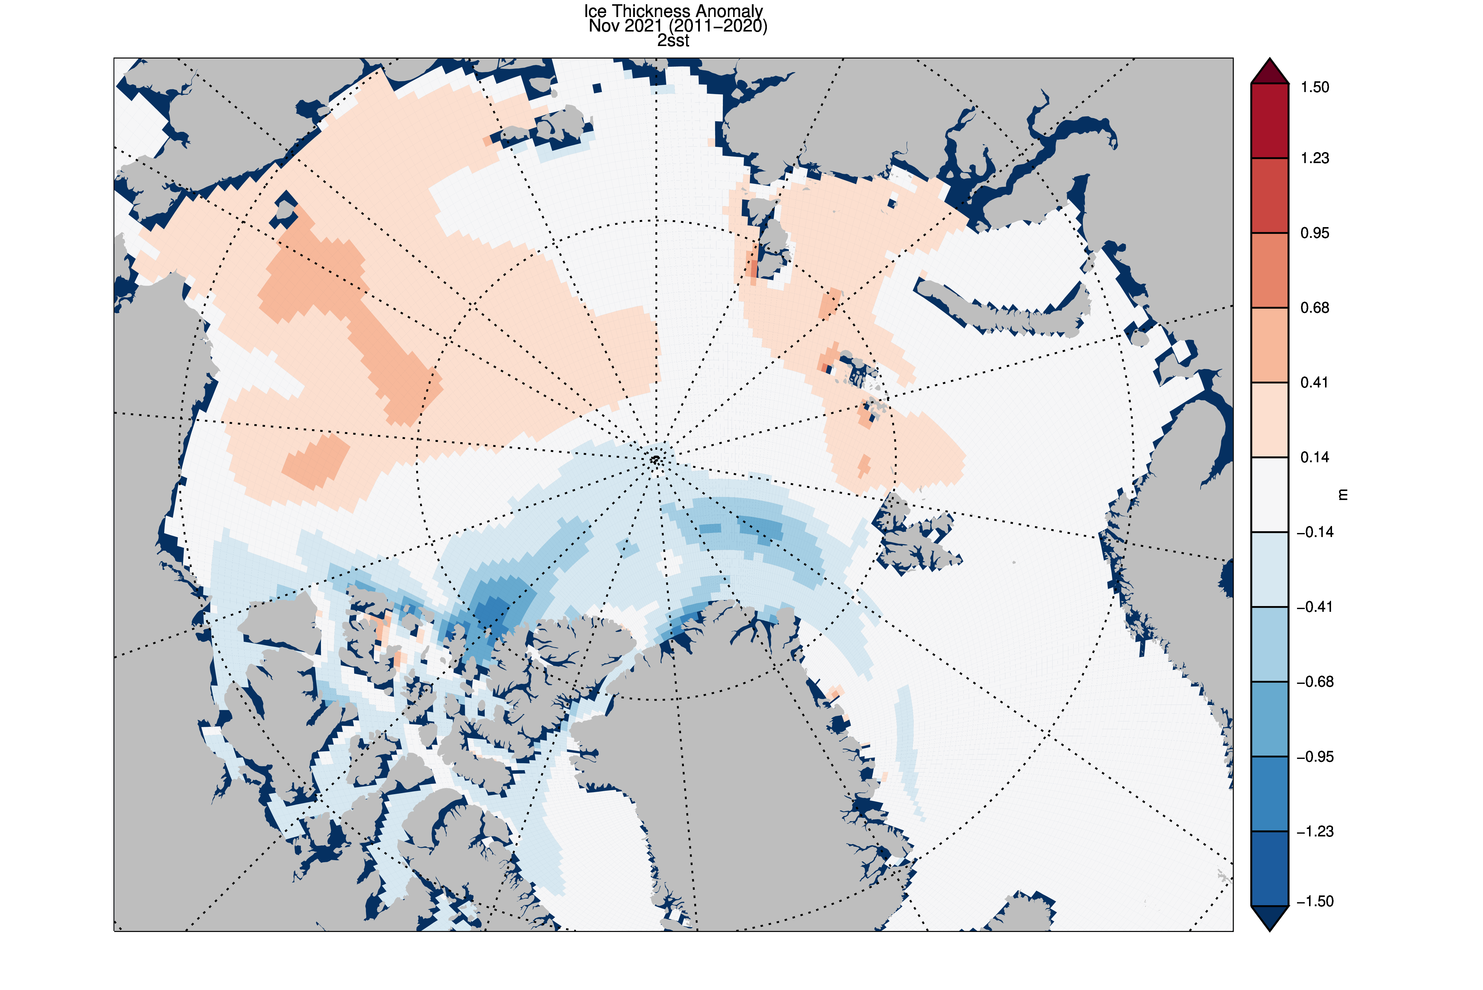
The ice thickness anomaly map for December 2021 relative to 2011-2020 continues to show anomalies divided into positive and a negative halves with areas of positive anomalies increasing since the two prior months and stretching from the Beaufort, over the pole and into the Barents. Negative anomalies stretching from Fram Strait, North of Greenland and along the Canadian Archipelago. Areas North of Greenland again feature low ice thickness as in prior years.
Note that as revealed by this animation from NASA Worldview the sea ice in the Lincoln Sea is currently still breaking up and being exported from the Central Arctic via the Nares Strait:
[Edit – January 25th]
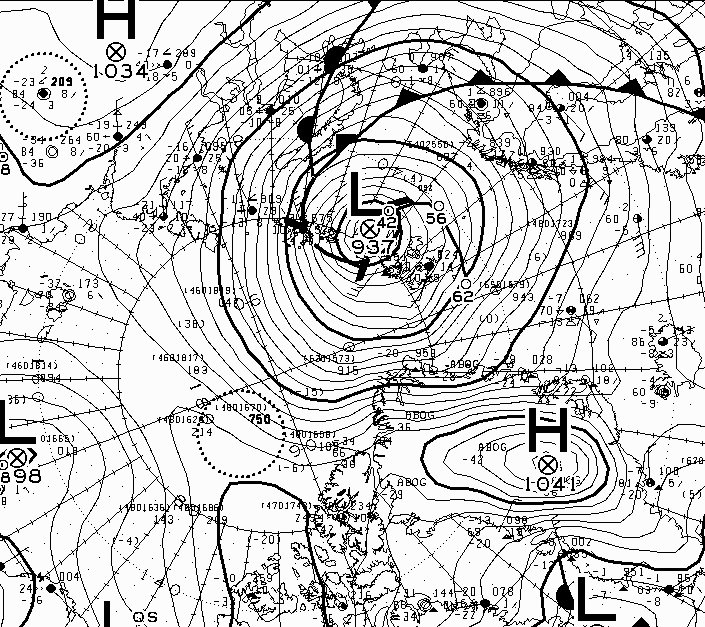
The Atlantic side of the Arctic Ocean has been taking a bit of a battering from what I shall henceforth refer to as the Great Arctic Winter Cyclone of 2022, or GAWC 2022 for short. Unless there’s an even deeper one later in the year of course!
According to the Canadian Meteorological Centre the storm achieved a minimum Mean Sea Level Pressure of 937 hPa at 12 noon UTC yesterday:
Here are the visible effects of the storm on the sea ice in the area so far, now updated to January 25th:
Christmas is coming. Santa’s secret summer swimming pool has frozen over. The time has come for a new monthly Arctic update.
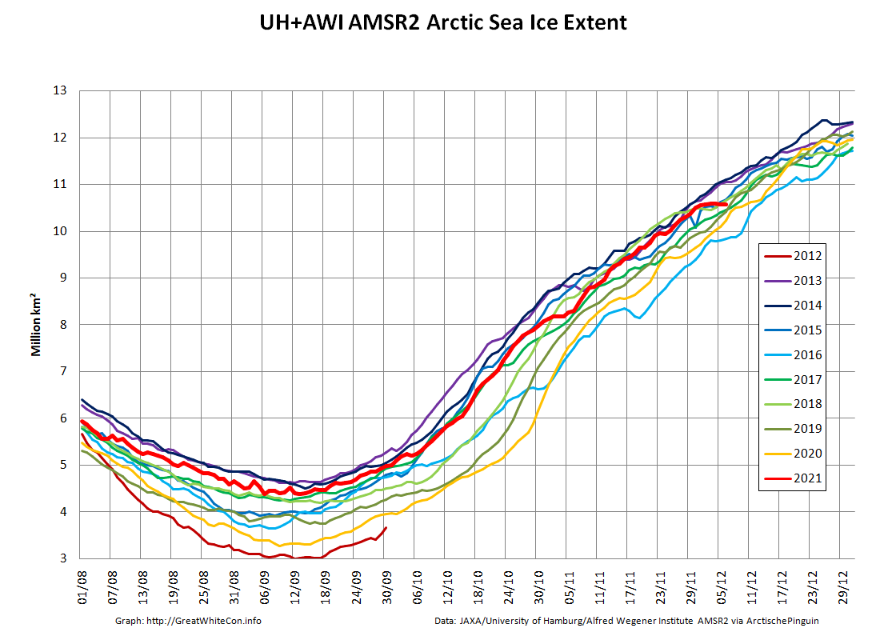
The JAXA/ADS/ViSHOP web site is undergoing maintenance for a week, so let’s start the festive season with a look at high resolution AMSR2 area and extent:
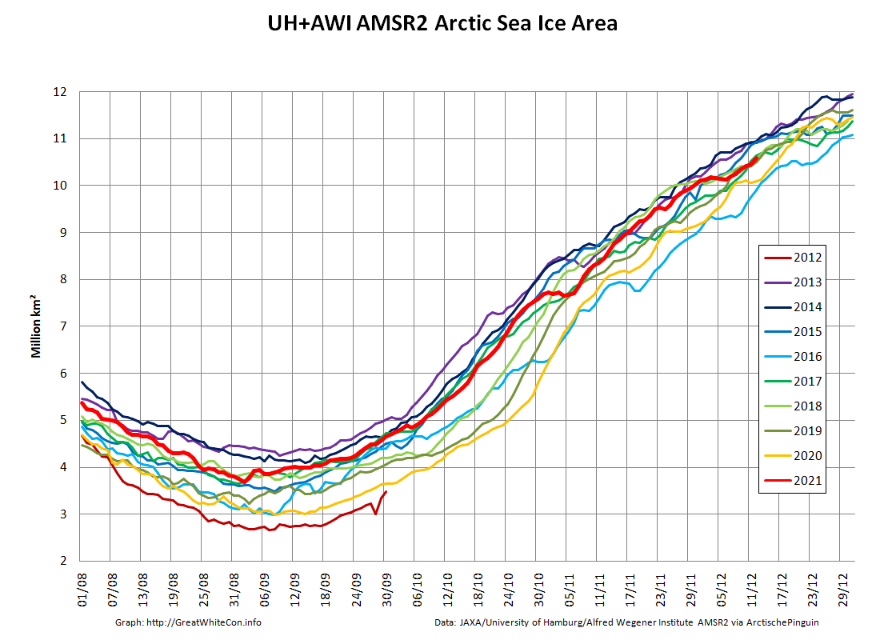
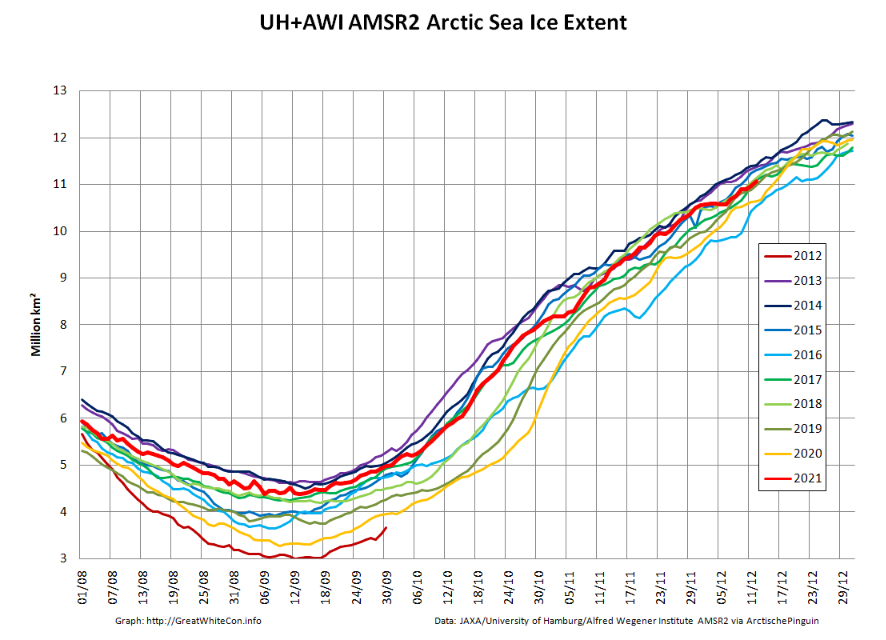
After a brief hiatus in early November both metrics are once again tracking within, but near the upper bound of the last 10 years.
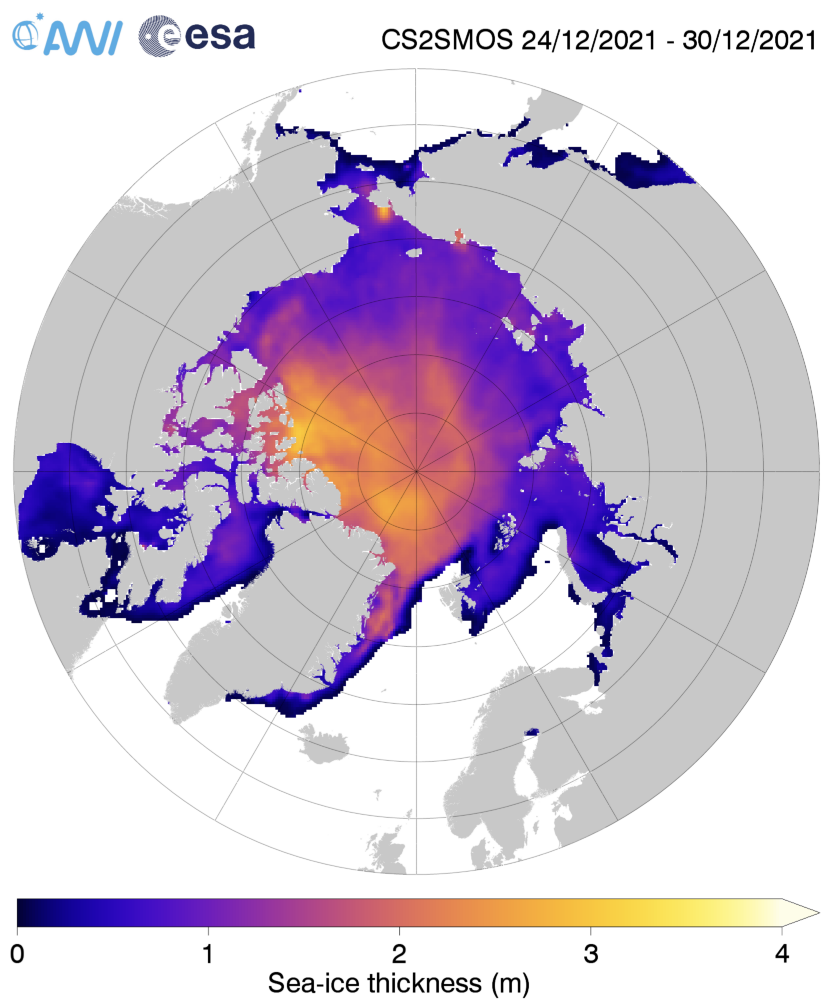
Next let’s take a look at the latest AWI CryoSat-2/SMOS thickness map:
together with the anomaly map from the Finnish Meteorological Institute:
Still thinner than usual in the so called “last ice area” north of Greenland and Ellesmere Island, and thicker than usual on the Siberian side of the Arctic, particularly in the Chukchi Sea.
Finally, for the moment at least, here’s the latest CryoSat-2/SMOS volume graph:
Unlike the previous metrics, this particular one is close to the middle of the pack.
Sea ice extent increased at a faster than average pace through November and by the end of the month, extent was just within the interdecile range. Extent was above average in the Bering Sea, but Hudson Bay remained unusually ice free through the month.
The November 2021 monthly average extent was 9.77 million square kilometers (3.77 million square miles), which ranked tenth lowest in the satellite record. The 2021 extent was 930,000 million square kilometers (359,000 million square miles) below the 1981 to 2010 long-term average. Extent was higher than average in the Bering Sea, but is extremely low in Hudson Bay.
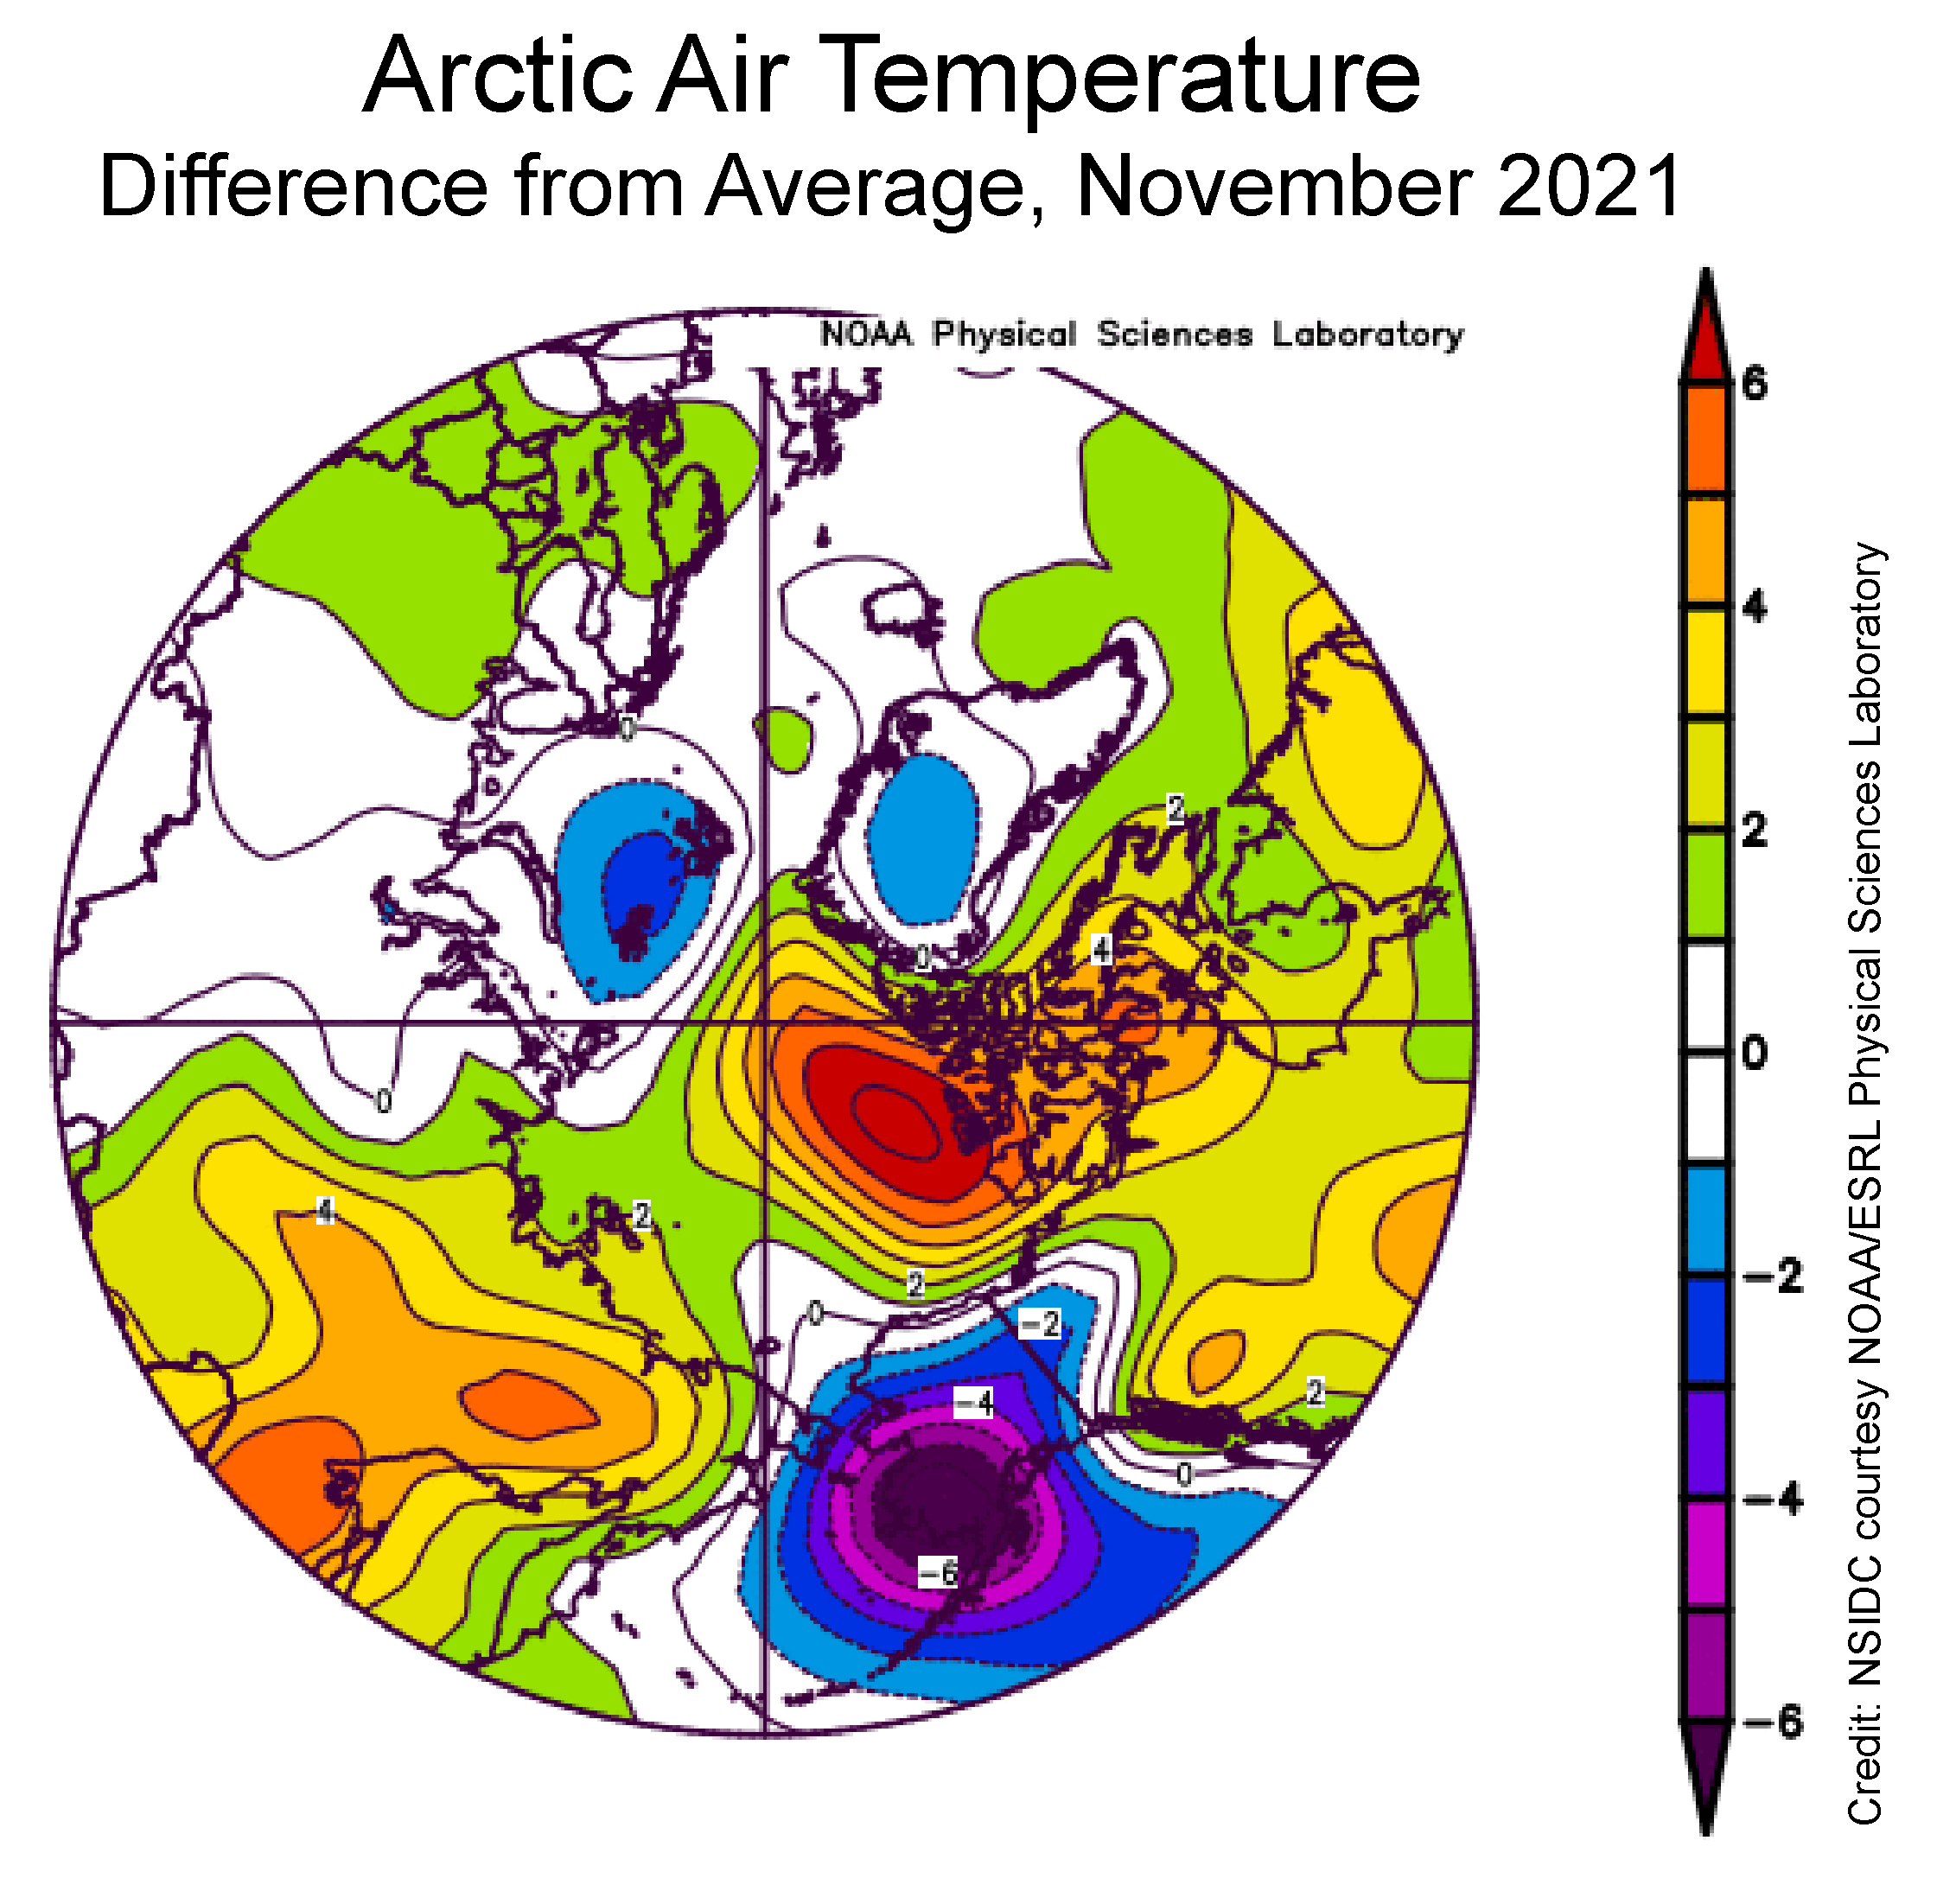
Air temperatures at the 925 millibar level (about 2,500 feet above the surface) were well above average north of the Canadian Archipelago, by as much as 6 degrees Celsius. Conversely, temperatures over southwest Alaska and the eastern sector of the Bering Sea were as much as 6 degrees Celsius below average:
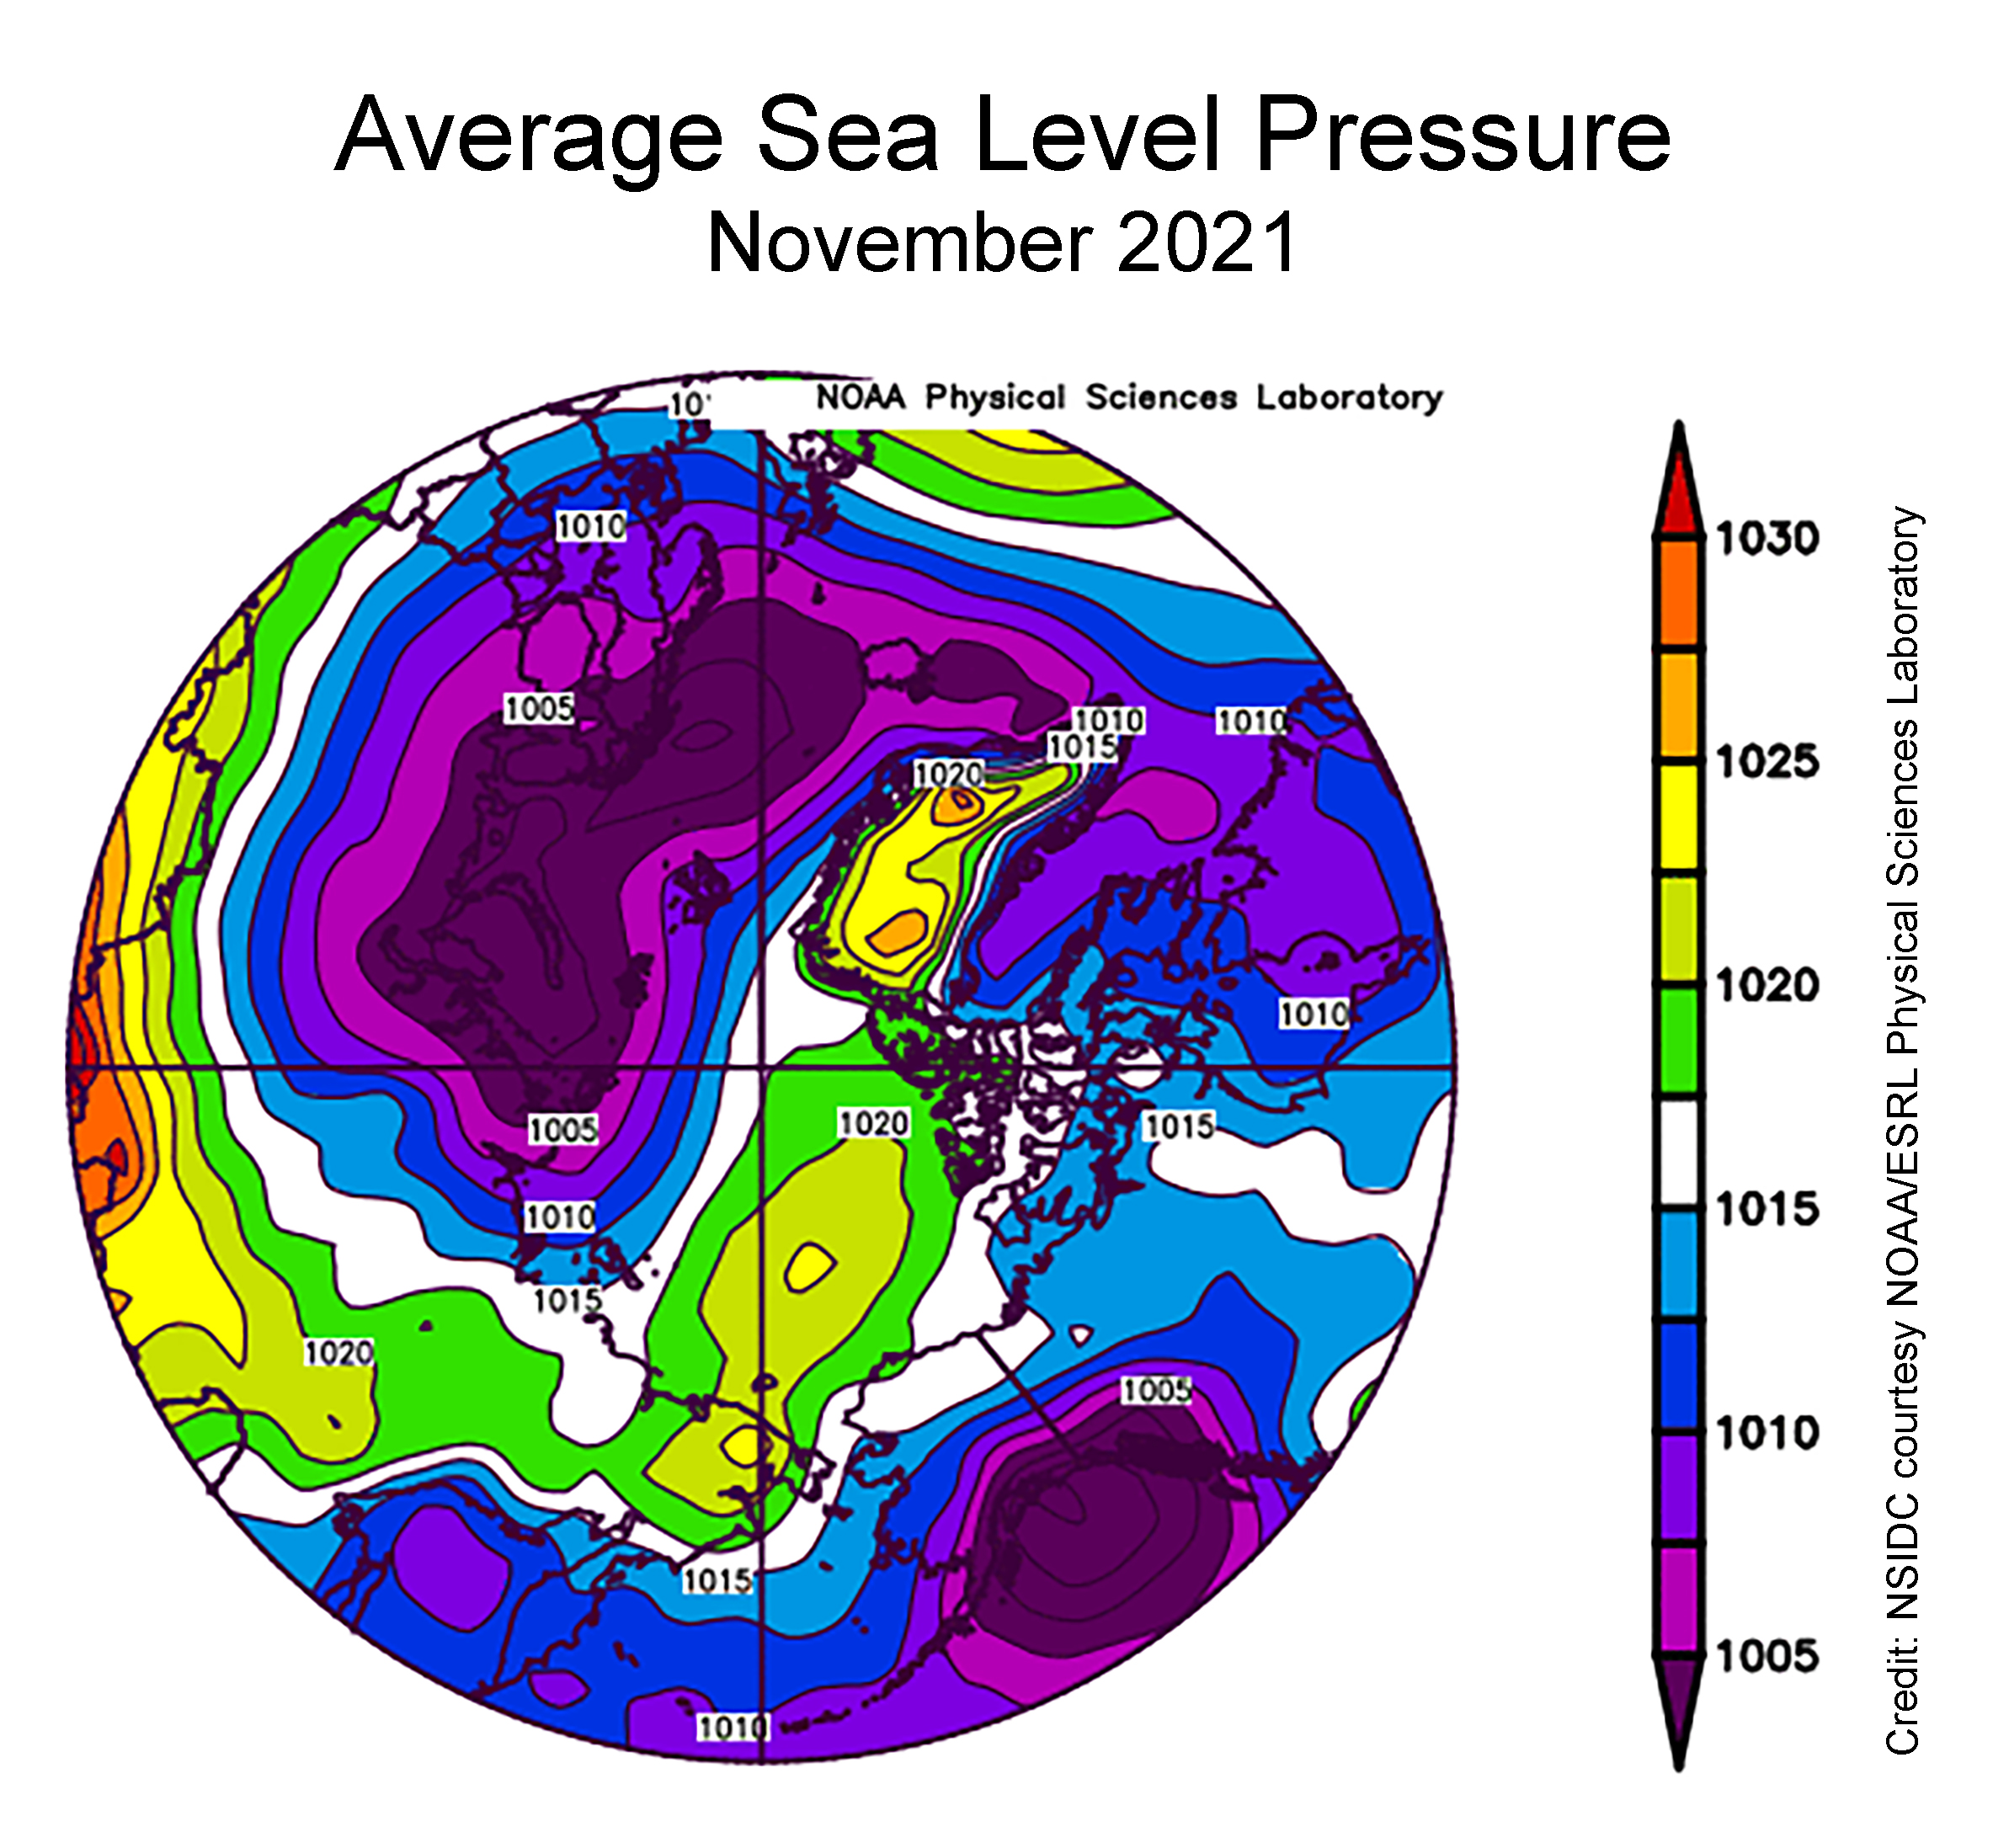
The sea level pressure pattern for November featured widespread low pressure over the Atlantic side of the Arctic and extending into the Barents and Kara Seas, paired with a moderately strong Beaufort Sea High. Strong low pressure over the Gulf of Alaska resulted in a circulation pattern in the eastern Bering Sea that brought cold air from the north. This pattern was favorable for sea ice growth, and can explain the above average ice extent in the region:
[Edit – December 7th]
Since the start of December high resolution AMSR2 extent has been flatlining:
Sea ice area has even declined slightly over the past few days:
Here too is an animation created by Uniquorn on the Arctic Sea Ice Forum using AWI ASMR2 data to reveal ice movement through the Nares Strait during December:
[Edit – December 9th]
The JAXA/ADS/ViSHOP web site is down again, so let’s take another look at high resolution AMSR2 area and extent:
It seems that the “brief hiatus” is over, and extent is now in a “statistical tie” with 2018/19 at 4th lowest for the date amongst recent year.
[Edit – December 13th]
The PIOMAS Arctic sea ice volume data for November 2021 has been released:
Average Arctic sea ice volume in November 2021 was 7,830 km3. This value is the 7th lowest on record for November, about 1600 km3 above the record set in 2016. Monthly ice volume was 61% below the maximum in 1979 and 45% below the mean value for 1979-2020. Average November 2021 ice volume was about one sigma above the 1979-2020 trend line. October saw relative rapid ice growth for recent years bringing the mean ice thickness (above 15 cm thickness) above the recent low values:
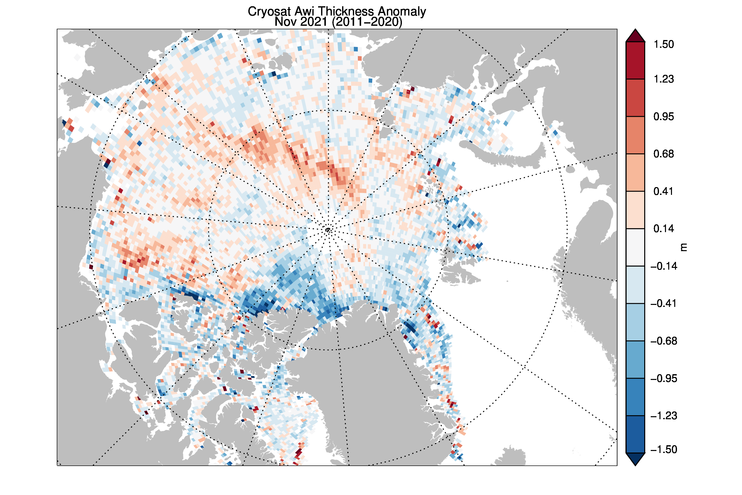
The ice thickness anomaly map for November 2021 relative to 2011-2020 continues to show anomalies divided into positive and a negative halves with areas of positive anomalies increasing since the two prior months. Negative anomalies stretching from North of Greenland and along the Canadian Archipelago across the Eastern Arctic into the Barents Sea. Areas North of Greenland again feature very low ice thickness as in prior years (see our recent paper). Positive anomalies are notable in the Beaufort and Chukchi seas due to advection of thicker older ice into the areas during the previous winter (See recent paper on this). The Alaskan summer has also been relatively cold contributing to unusually thick ice in this area:
CryoSat-2 ice thickness shows a similar picture sea ice thickness anomalies but with the maxima slightly displaced which maybe due to temporal sampling of the composite:
The JAXA web site is still down, so here’s another set of high resolution AMSR2 graphs:
[Edit – December 14th]
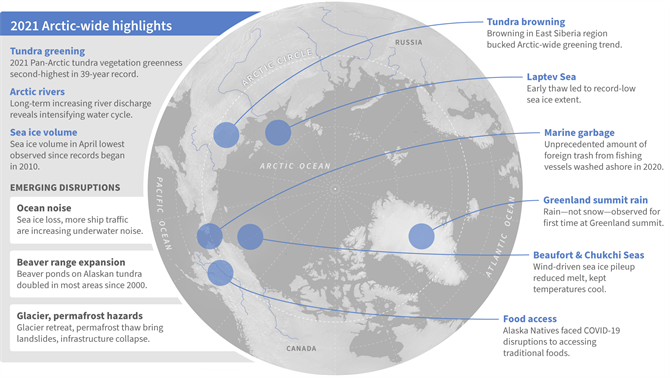
NOAA have just released their 2021 Arctic Report Card. Here’s the introductory video:
“Everybody knows [the Arctic] is a canary when it comes to climate change,” says Peter Jacobs, a climate scientist at NASA’s Goddard Space Flight Center, who presented the work on 13 December at a meeting of the American Geophysical Union. “Yet we’re misreporting it by a factor of two. Which is just bananas.”
Jacob’s co-authors include researchers who oversee several influential global temperature records, and they noted the faster Arctic warming as they prepared to release the global temperature average for 2020. NASA’s internal peer reviewer challenged the higher figure, suggesting the scientific literature didn’t support it. But the researchers have found the four times ratio holds in record sets from both NASA (3.9) and the United Kingdom’s Met Office (4.1), and they hope to soon include the Berkeley Earth record. (Their work also has company: In July, a team at the Finnish Meteorological Institute posted a preprint also arguing for the four times figure.)
The researchers found Arctic warming has been underestimated for a couple of reasons. One is climate scientists’ tendency to chop each hemisphere into thirds and label the area above 60°N as the “Arctic”—an area that would include, for example, most of Scandinavia. But the true definition of the Arctic is defined by Earth’s tilt. And, as has been known for centuries, the Arctic Circle is a line starting at 66.6°N. When researchers lump in the lower latitudes, “you’re diluting the amount of Arctic warming you’re getting,” Jacobs says. “That is not a trivial thing.”
The other difference is the choice of time periods over which the warming rate is calculated. Jacobs and his colleagues focused on the past 30 years, when a linear warming trend emerged for the Arctic. Analyses that look at longer term trends see less divergence between the Arctic and the world.
[Edit – December 23rd]
Here is the latest CryoSat-2/SMOS volume graph, now including some reanalysed data which seems to have come in slightly higher than the earlier “near real time” numbers:
Plus the AWI thickness map:
Further discussion of the divergence between volume and extent continues in the new New Year 2022 thread:
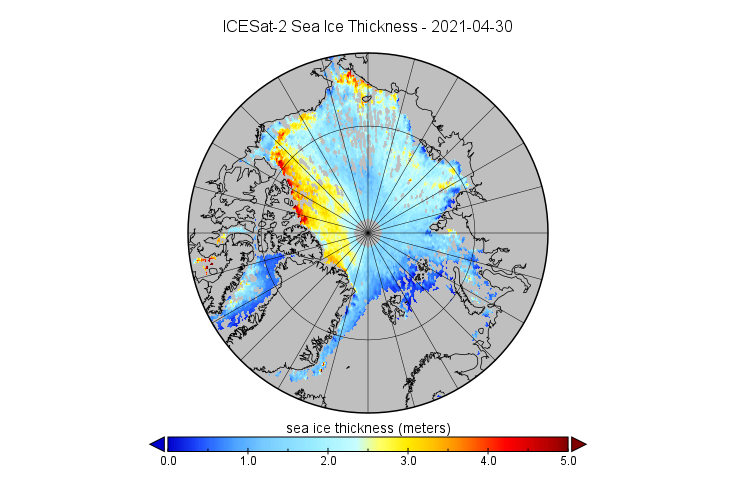
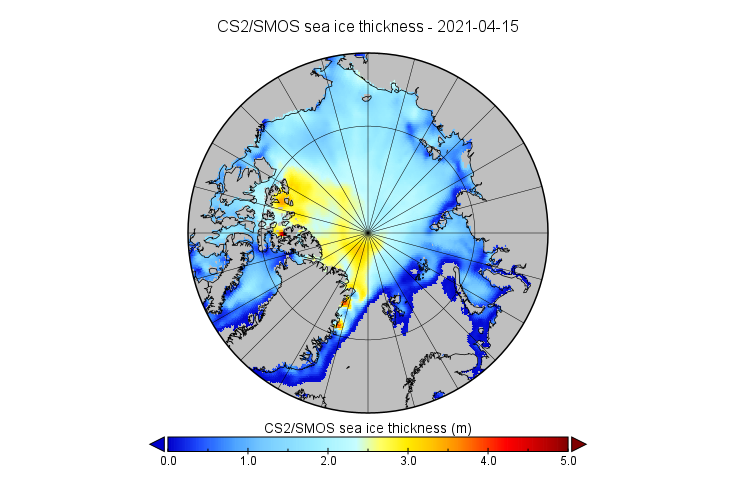
We reported on the first ICESat-2 sea ice thickness data to be released back in May. We are now very pleased to be able to reveal that the data up to April 2021 is now available for download from the NSIDC web site. Here’s a visualisation of April’s data:
For comparison purposes here’s the CryoSat-2/SMOS equivalent:
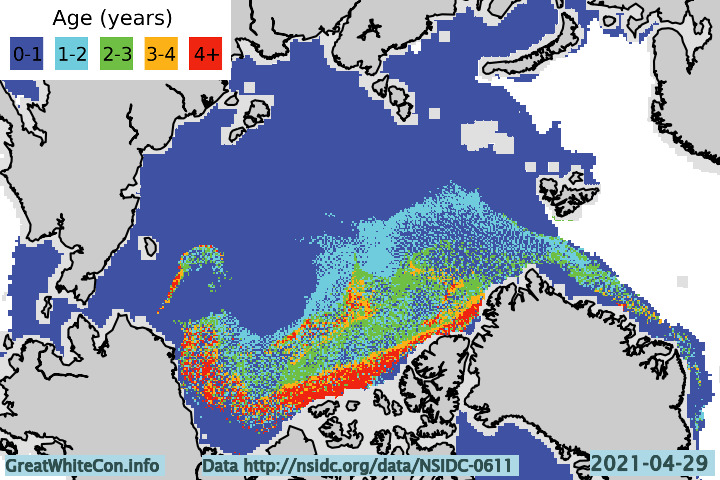
ICESat-2 looks to have captured the arm of thicker ice extending across the Beaufort Sea suggested by sea ice age data better than CryoSat-2:
However thickness data is totally absent where leads are absent, in land-fast ice for example. It seems that near real time ICESat-2 processing isn’t available as yet, but we await the release of the data for October with barely bated breath!
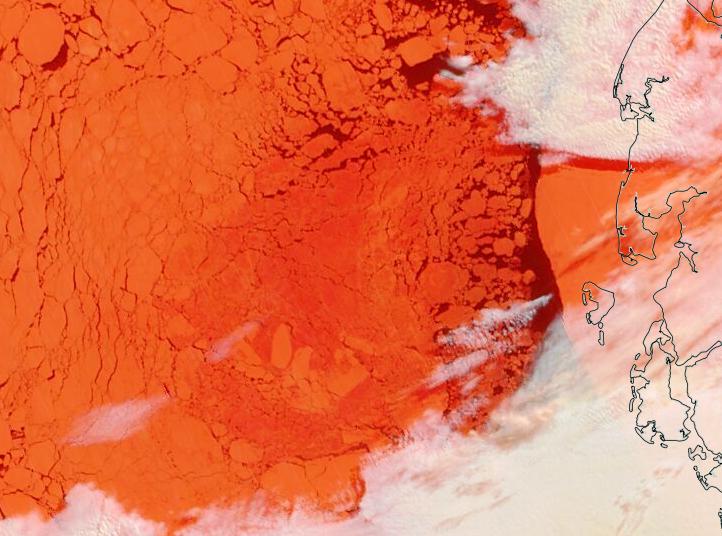
It’s May Day 2021, and just for a change we’re going to start the month off with a pretty picture!
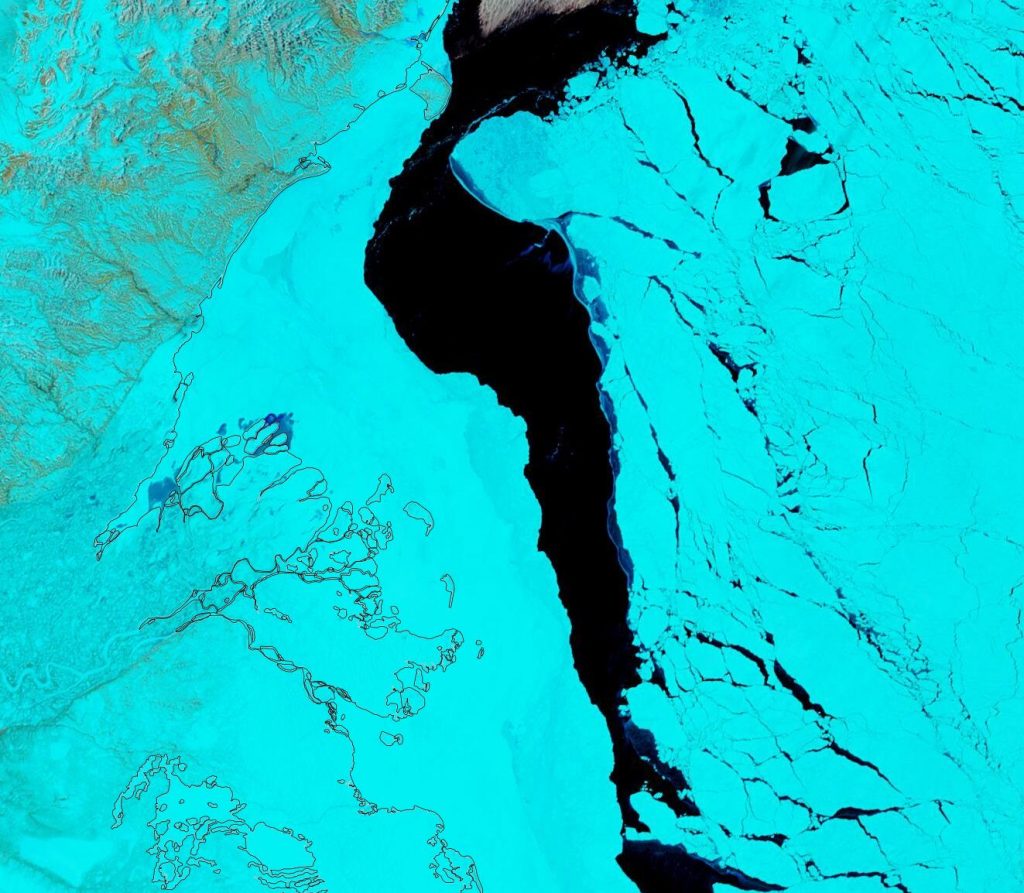
Parts of the Laptev Sea are starting to look distinctly “warm” in the infra-red. Here’s a “false colour” image taken by the Terra satellite during a gap in the clouds:
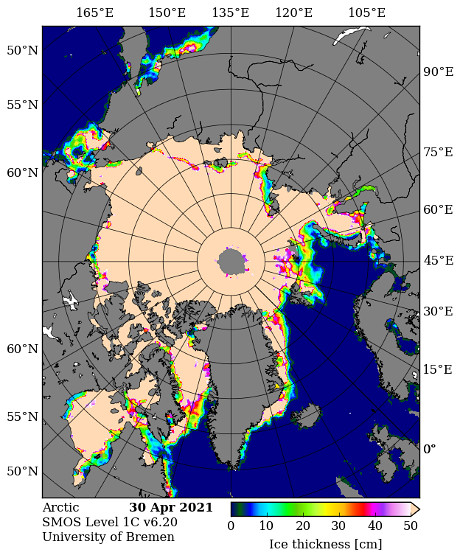
We have reached the time of year when the SMOS “thin ice thickness” readings start being affected by surface melt, but let’s take a look anyway:
That area of the Laptev certainly appears to be either thin or melting.
Meanwhile on the Canadian side of the Arctic the fast ice off the Mackenzie Delta is starting to get damp, even though the river itself still looks to be fairly well frozen:
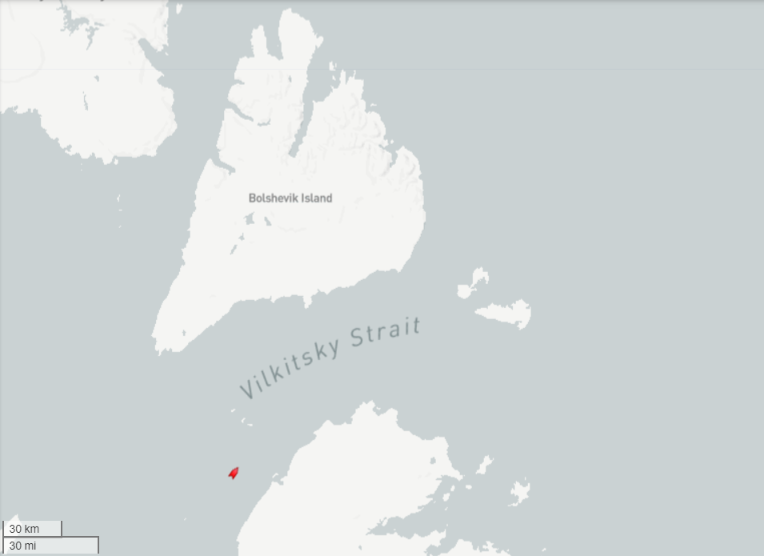
It will also be interesting to follow the progress of this large floe as it heads towards oblivion through the Fram Strait:
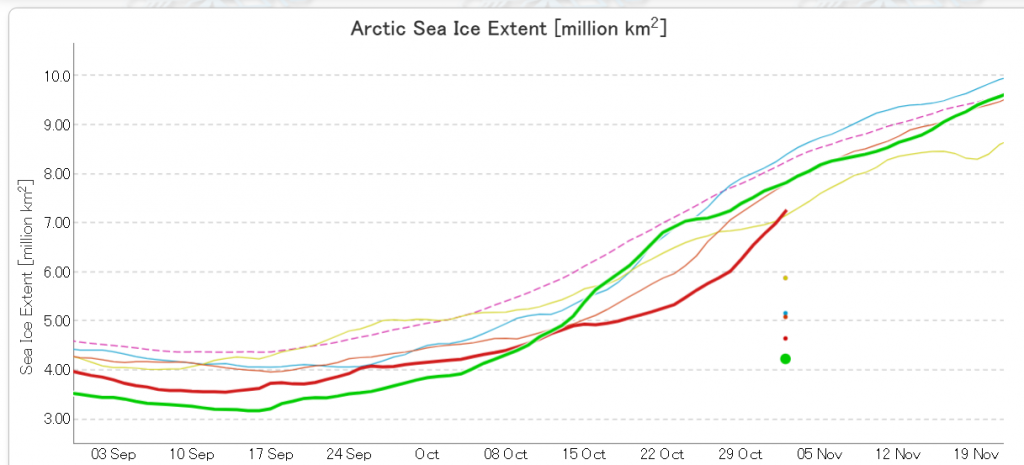
Arctic sea ice volume is of course far more important in the grand scheme of things. However sea extent is easier to measure, and the JAXA AMSR2 flavour thereof has now nudged into second place for the date above 2016:
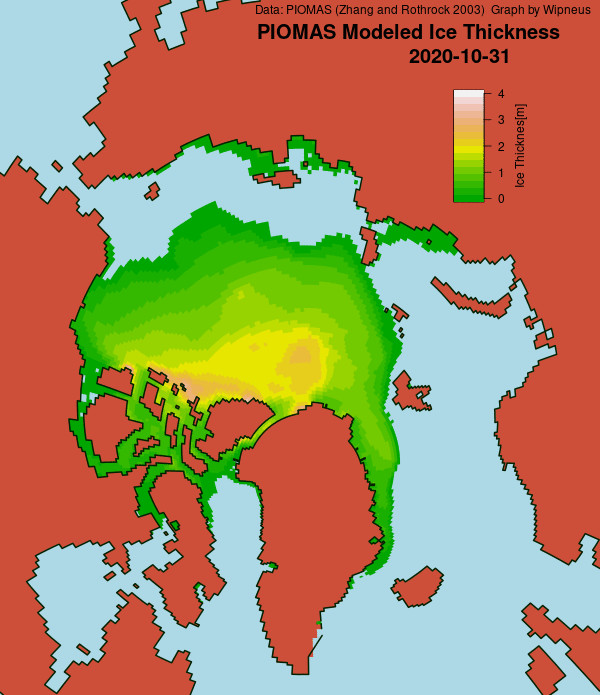
[Edit – November 4th]
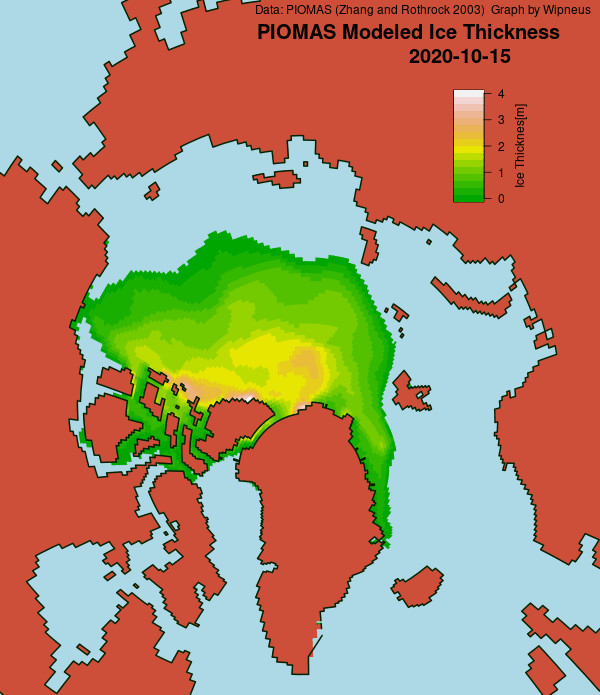
The PIOMAS gridded thickness numbers have been released, to reveal this end of October thickness map:
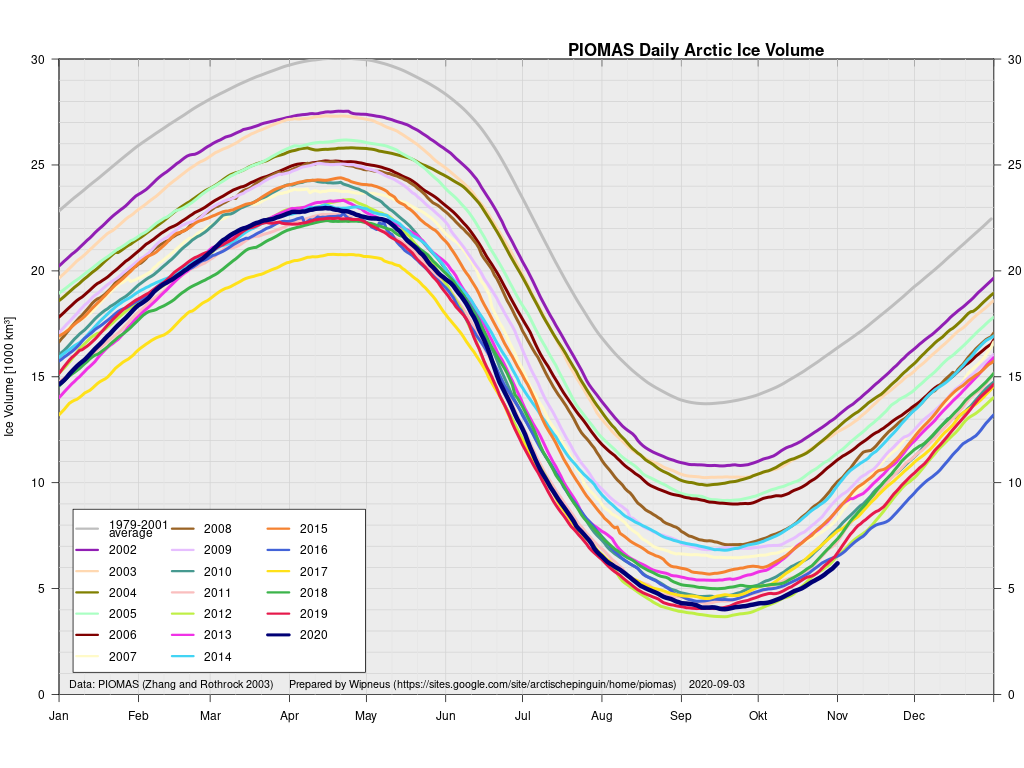
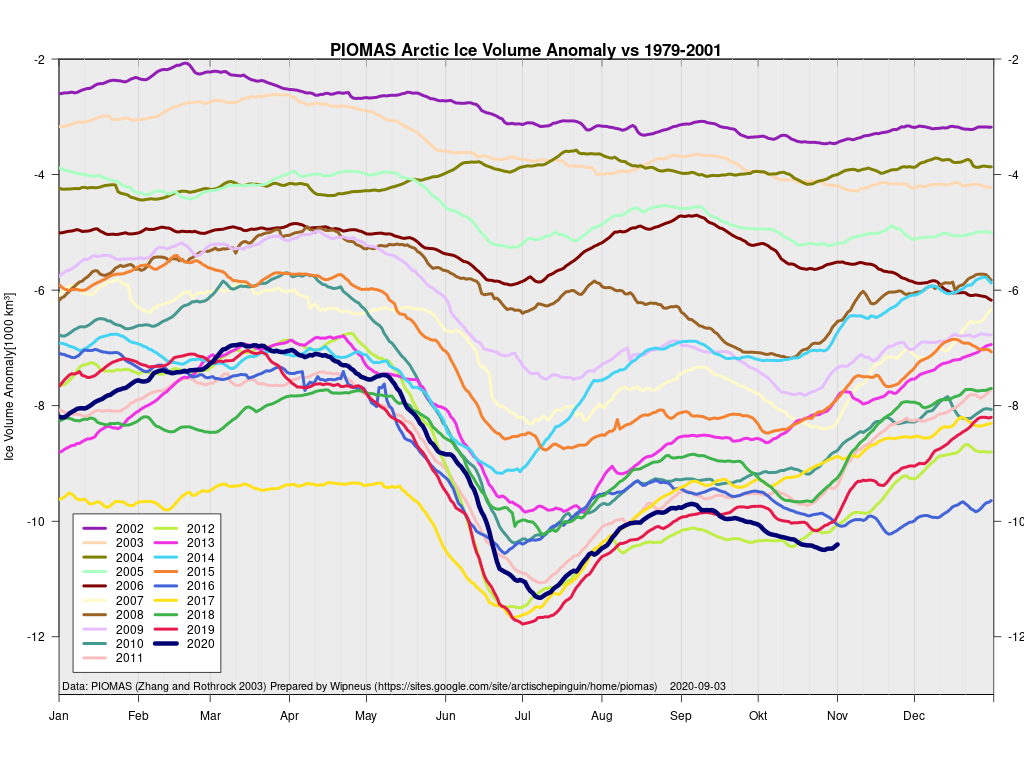
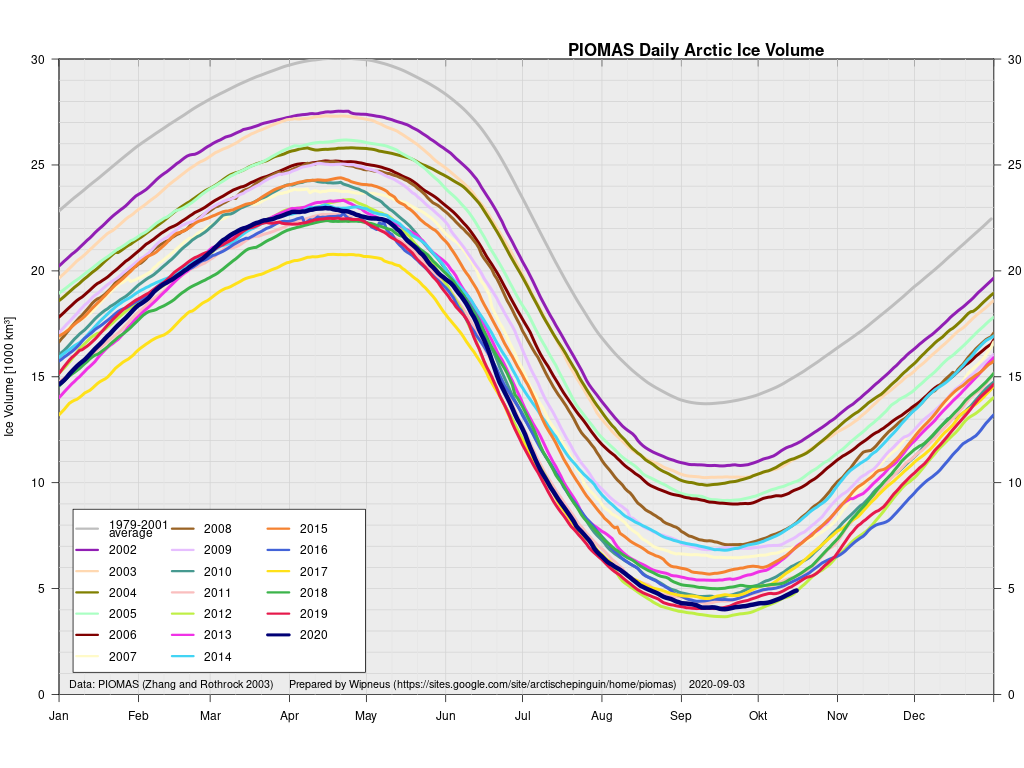
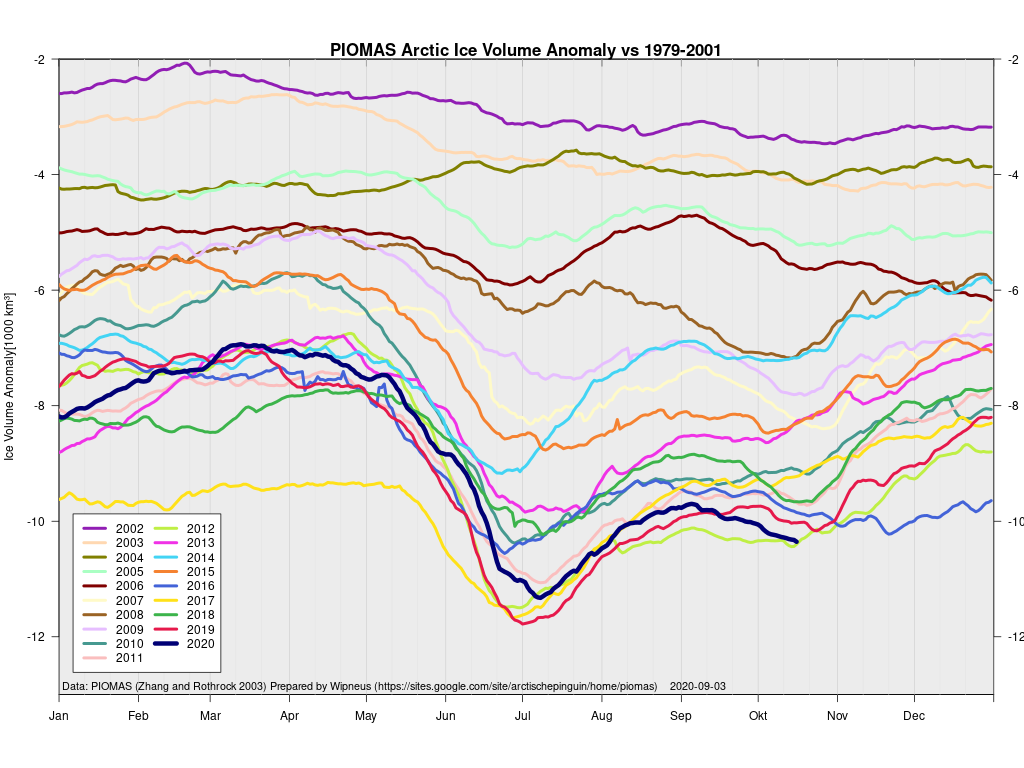
and these calculated volume graphs:
These show Arctic sea ice volume to be lowest for the date, even if extent has slipped into 2nd place.
For comparison purposes here too is the latest AWI CryoSat-2/SMOS merged thickness map:
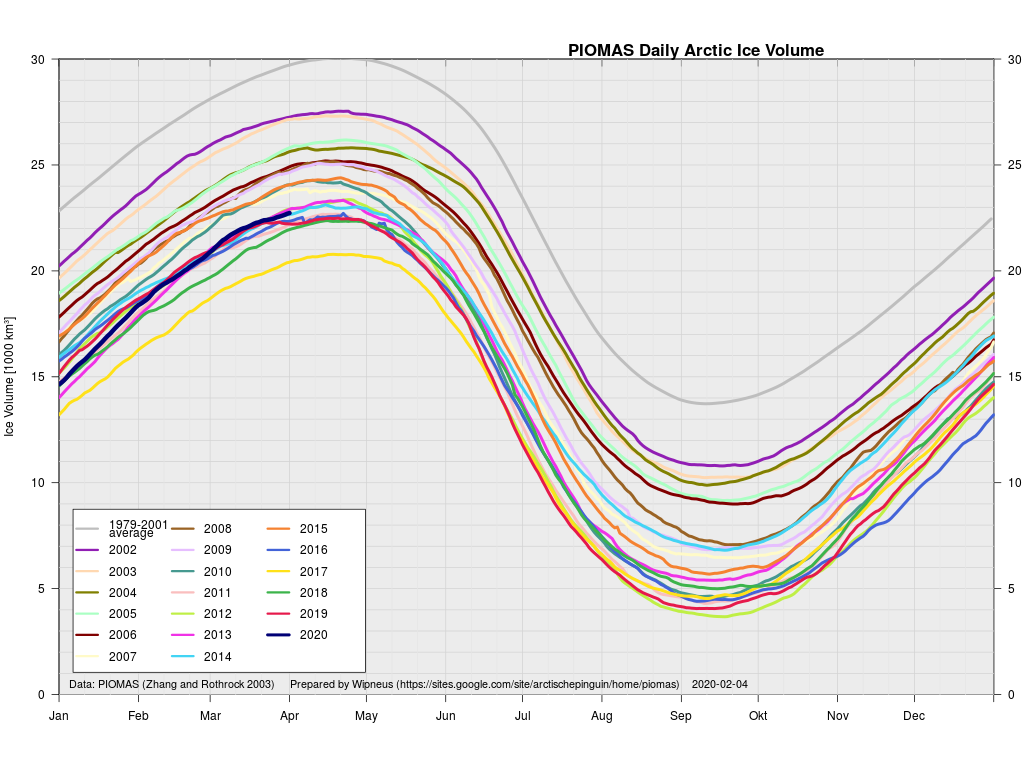
Let’s start this somewhat belated article by looking at Arctic sea ice volume. The mid month PIOMAS gridded thickness numbers have been released to reveal these volume graphs:
Minimum volume for 2021 was 4.03 thousand km3 on September 17th, 2nd lowest in the PSC record.
Modelled volume is now in a “statistical tie” with 2012 for lowest on record for mid October. Here too is the PIOMAS thickness map:
Meanwhile for comparison purposes here is the first merged Cryosat-2/SMOS thickness map of the 2020/21 freezing season, hot off the presses at the Alfred Wegener Institute:
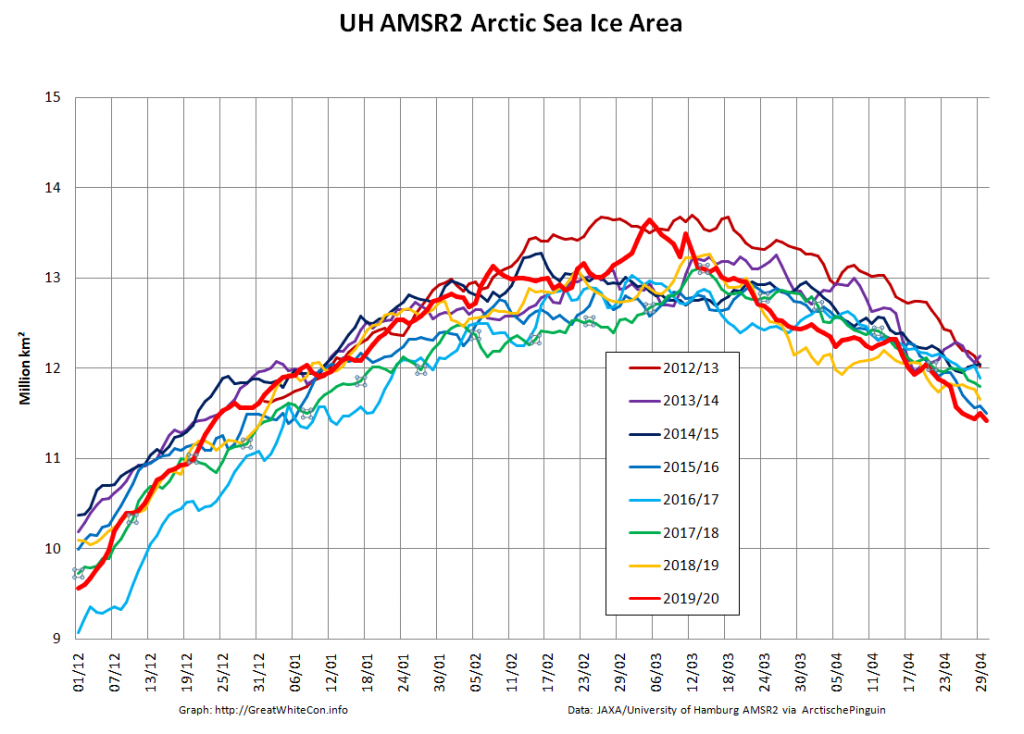
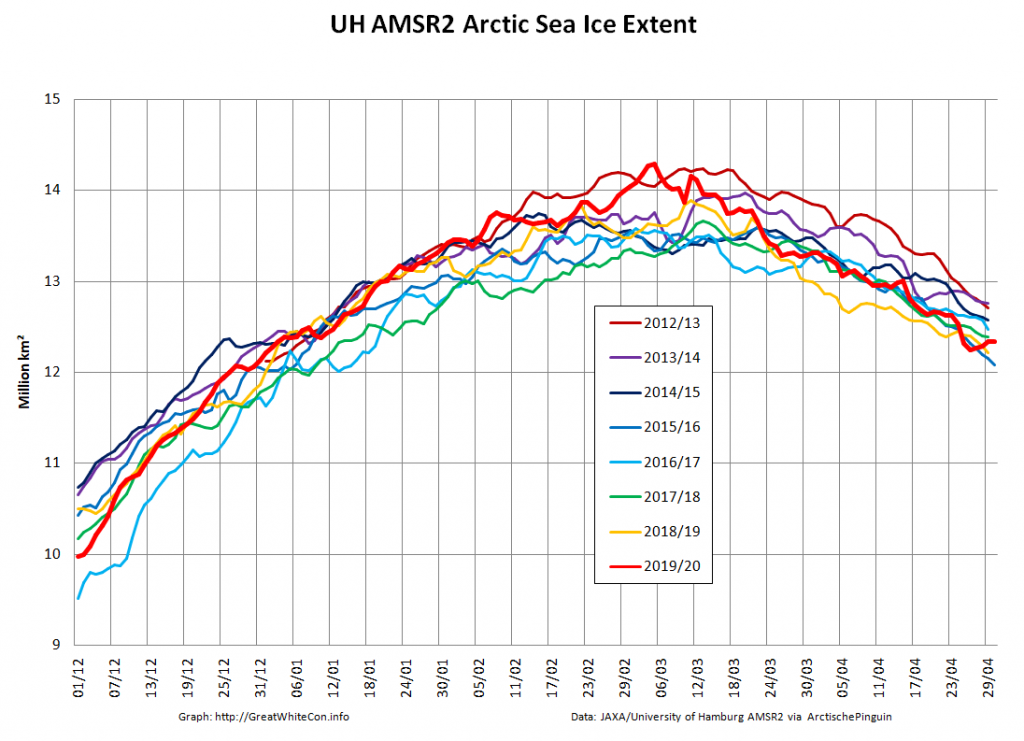
Let us begin this month’s report from the far north with the high resolution Arctic sea ice area and extent graphs based on the University of Hamburg’s AMSR2 concentration maps:
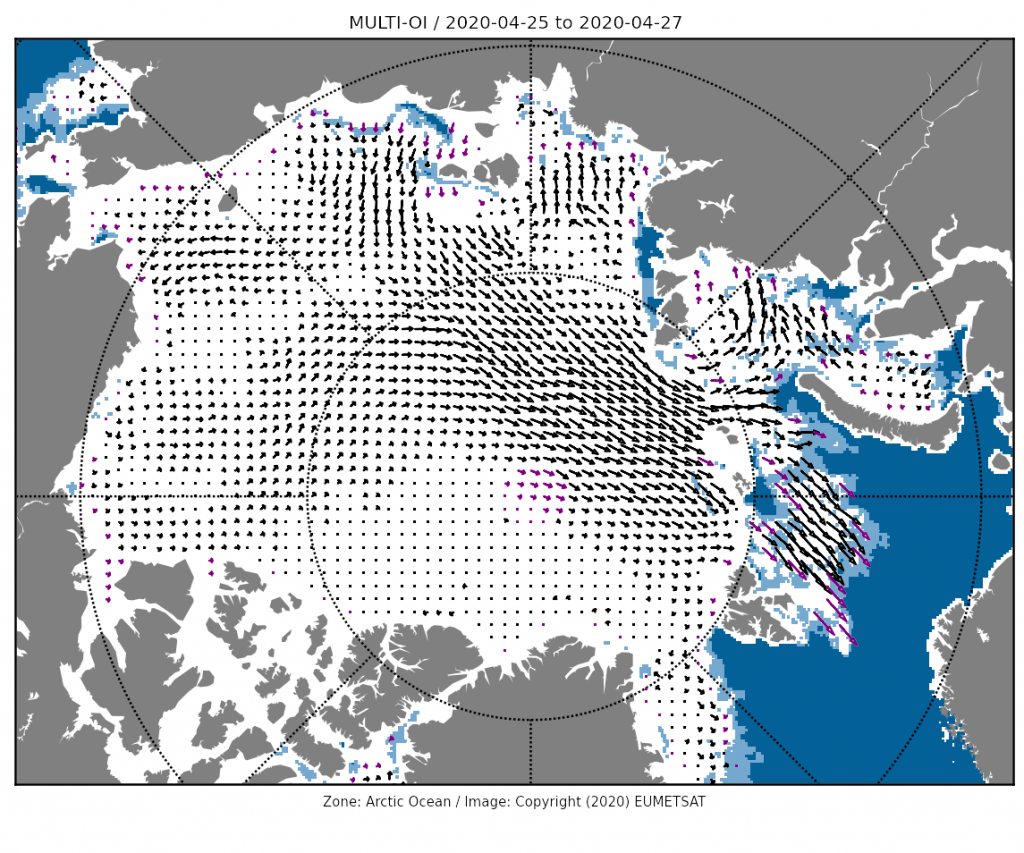
Area is currently lowest for the date in the AMSR2 record. After briefly occupying that position extent has increased over the last few days of April due to winds causing sea ice to move in the direction of the far North Atlantic:
The Alfred Wegener Institute has now finished reanalysing their CryoSat-2/SMOS thickness data, and the resulting volume graph looks like this:
“Measured” Arctic sea ice volume is the lowest in the CryoSat-2 era as we head towards the main 2020 melting season, which in my calendar at least begins on June 1st. The PIOMAS modelled volume numbers should be released shortly.
[Edit – May 5th]
The April 30th PIOMAS gridded thickness numbers have been released, and Wipneus has worked his usual magic. By way of comparison with the AWI metric:
Obviously differing from CryoSat-2/SMOS, PIOMAS has 2020 volume a long way above 2017, in amongst a gaggle of other years.
[Edit – May 13th]
The middle of May is rapidly approaching, so let’s start to set the scene for the forthcoming melting season. First off here are the hi res AMSR2 area and extent graphs:
Extent is currently significantly above 2016 due to the recent “dispersion” mentioned above, but area is very close to an all time low for the date.
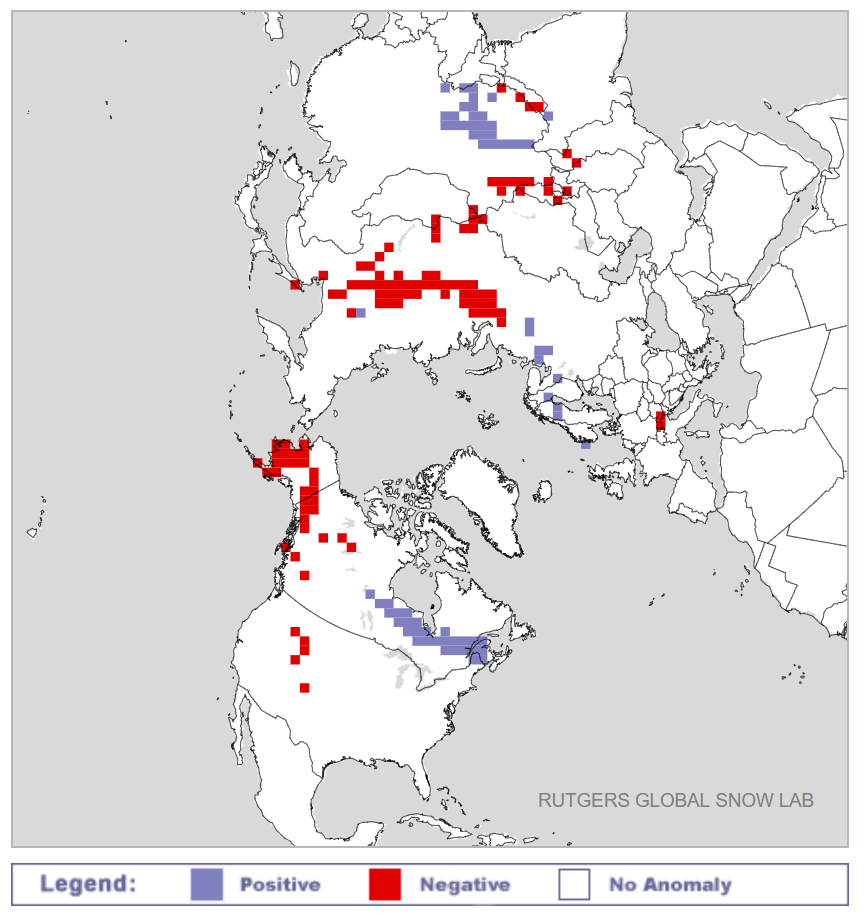
Next take a look at the current northern hemisphere snow cover anomalies from the Rutgers University Snow Lab:
Whilst there is a positive anomaly near Hudson Bay, there are significant negative anomalies across Siberia and Alaska. This does not augur well for sea ice retention along both the Northern Sea Route and Northwest Passage by September 2020.
This comes to you a couple of days early, but the clocks have just changed to British Summer Time in the once United Kingdom and there is news to impart.
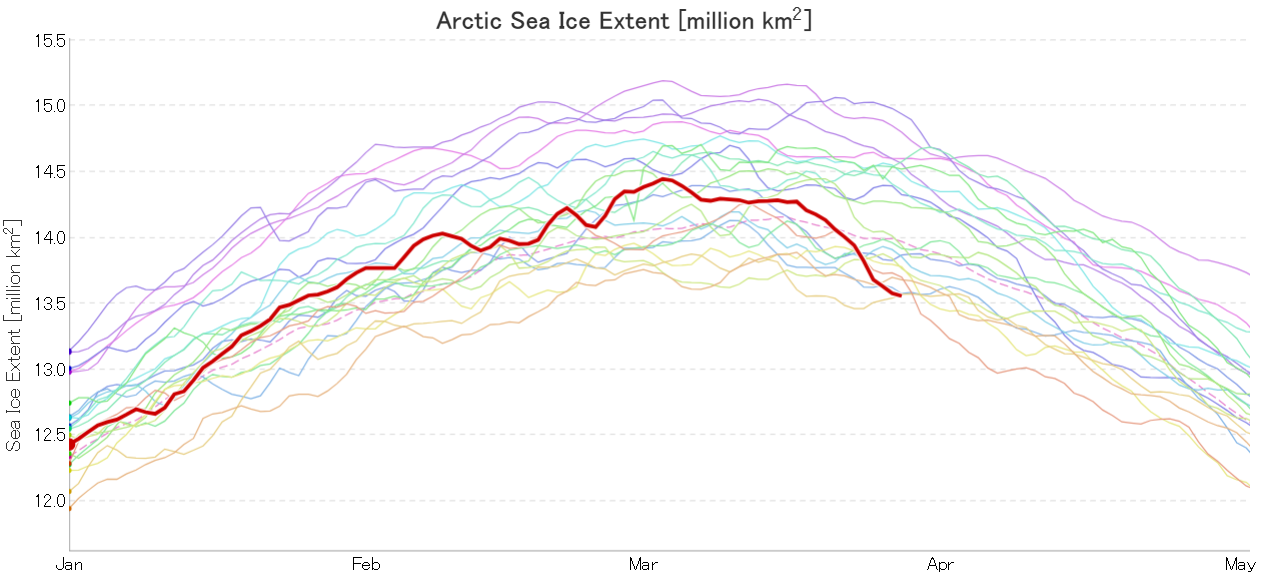
JAXA Arctic sea ice extent has fallen to the lowest level for the date in their satellite era records going back to 1979. This graph shows every year since 2000:
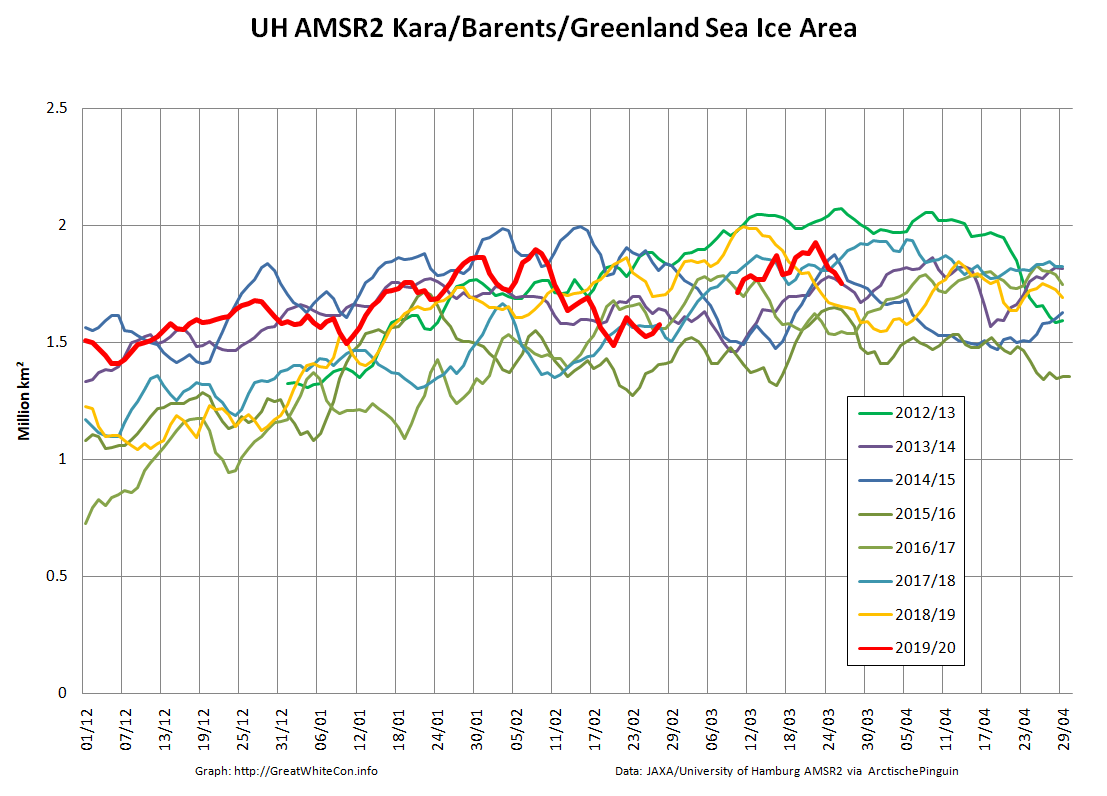
The high resolution AMSR2 regional graphs make clear that the precipitous drop on the Pacific periphery has continued:
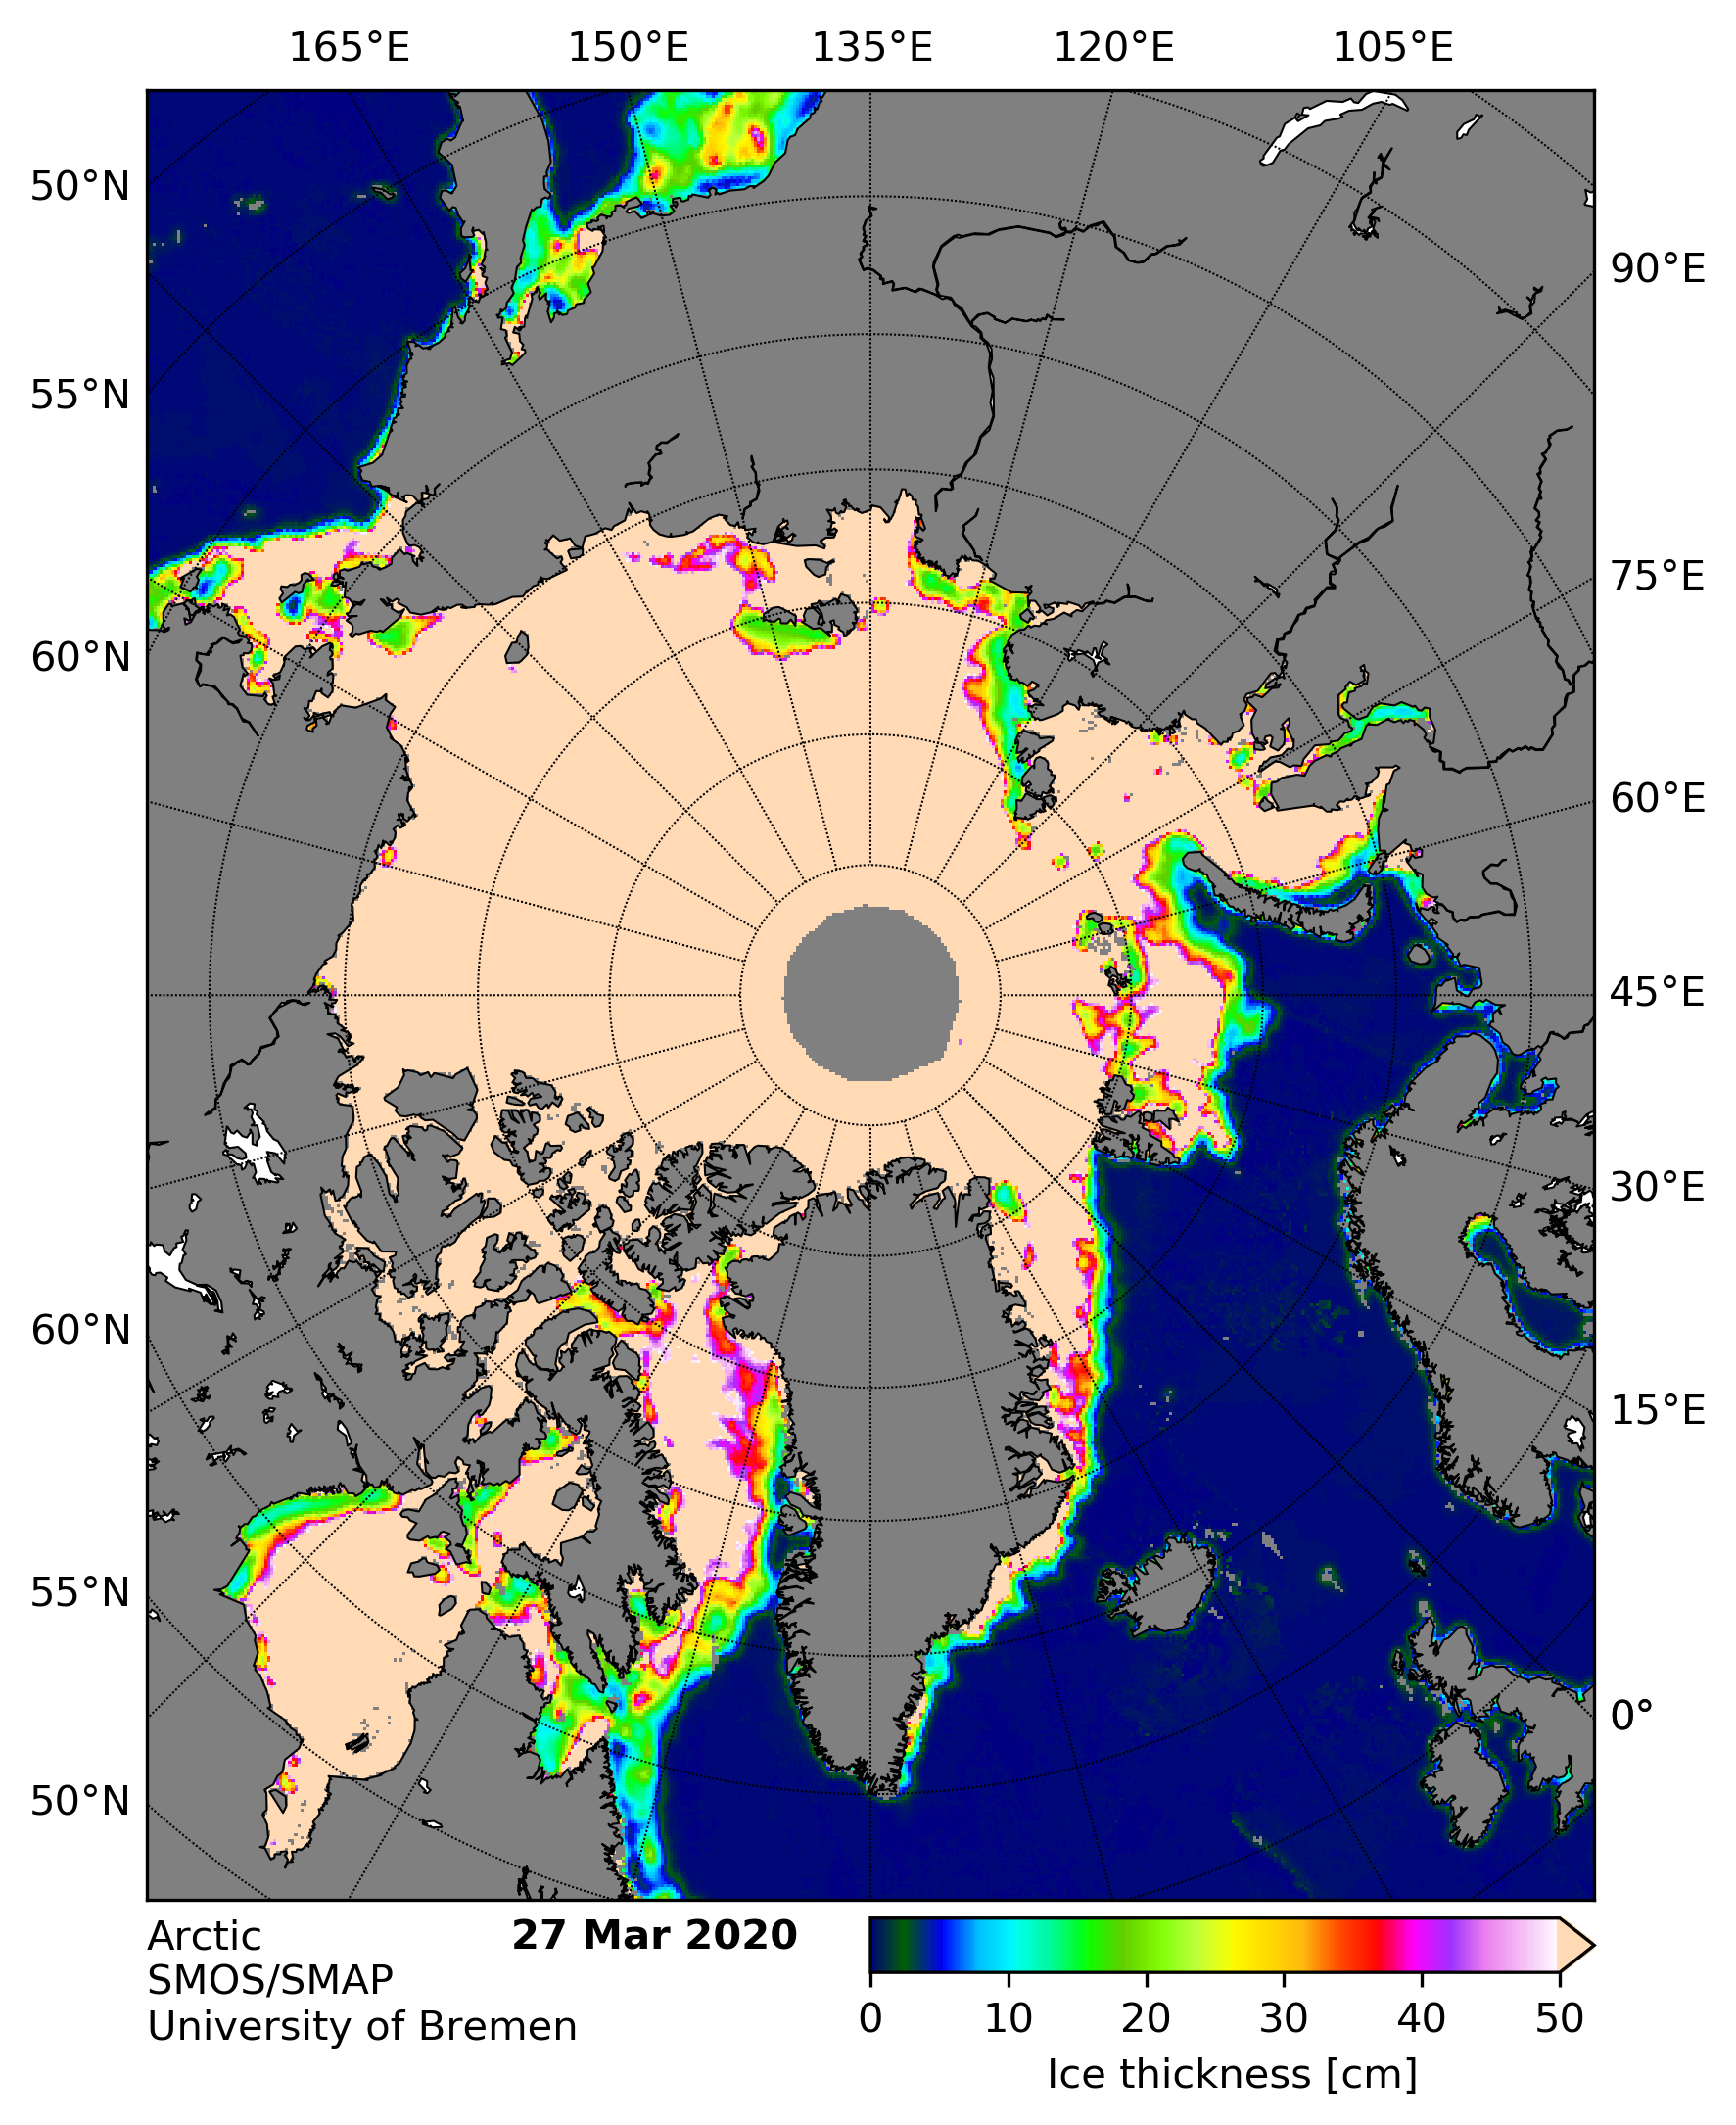
The current combined SMOS/SMAP Arctic sea ice “thinness” map makes clear that there is plenty more thin ice ready for melting in the Sea of Okhotsk and Baffin Bay:
There is also a large area of thin ice in the Laptev Sea, which will be interesting to watch once the 2020 melting season gets underway in earnest.
[Edit – April 1st]
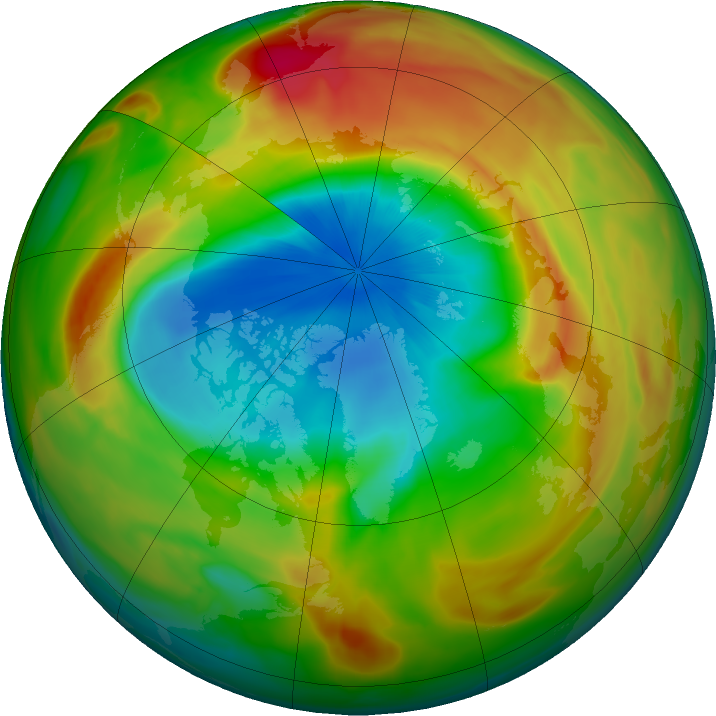
Today is All Fools’ Day, but this is no joke. Thanks to the consistent polar vortex over the Northern Hemisphere winter there is currently an anomalous “ozone hole” over the North Pole. As recently described in Nature:
A vast ozone hole — probably the biggest on record in the north — has opened in the skies above the Arctic. It rivals the better-known Antarctic ozone hole that forms in the southern hemisphere each year.
Record-low ozone levels currently stretch across much of the central Arctic, covering an area about three times the size of Greenland. The hole doesn’t threaten people’s health, and will probably break apart in the coming weeks. But it is an extraordinary atmospheric phenomenon that will go down in the record books.
“From my point of view, this is the first time you can speak about a real ozone hole in the Arctic,” says Martin Dameris, an atmospheric scientist at the German Aerospace Center in Oberpfaffenhofen.
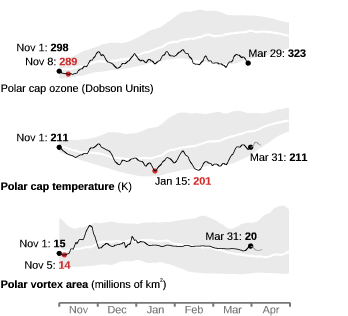
Here are the latest graphics from the “Arctic Ozone Watch” section of the NASA web site:
Observations made during the still ongoing MOSAiC expedition, have confirmed the satellite derived measurements:
This year, powerful westerly winds flowed around the North Pole and trapped cold air within a ‘polar vortex’. There was more cold air above the Arctic than in any winter recorded since 1979, says Markus Rex, an atmospheric scientist at the Alfred Wegener Institute in Potsdam, Germany. In the chilly temperatures, the high-altitude clouds formed, and the ozone-destroying reactions began.
Researchers measure ozone levels by releasing weather balloons from observing stations around the Arctic (including the Polarstern icebreaker, which is frozen in sea ice for a year-long expedition). By late March, these balloons measured a 90% drop in ozone at an altitude of 18 kilometres, which is right in the heart of the ozone layer. Where the balloons would normally measure around 3.5 parts per million of ozone, they recorded only around 0.3 parts per million, says Rex. “That beats any ozone loss we have seen in the past,” he notes.
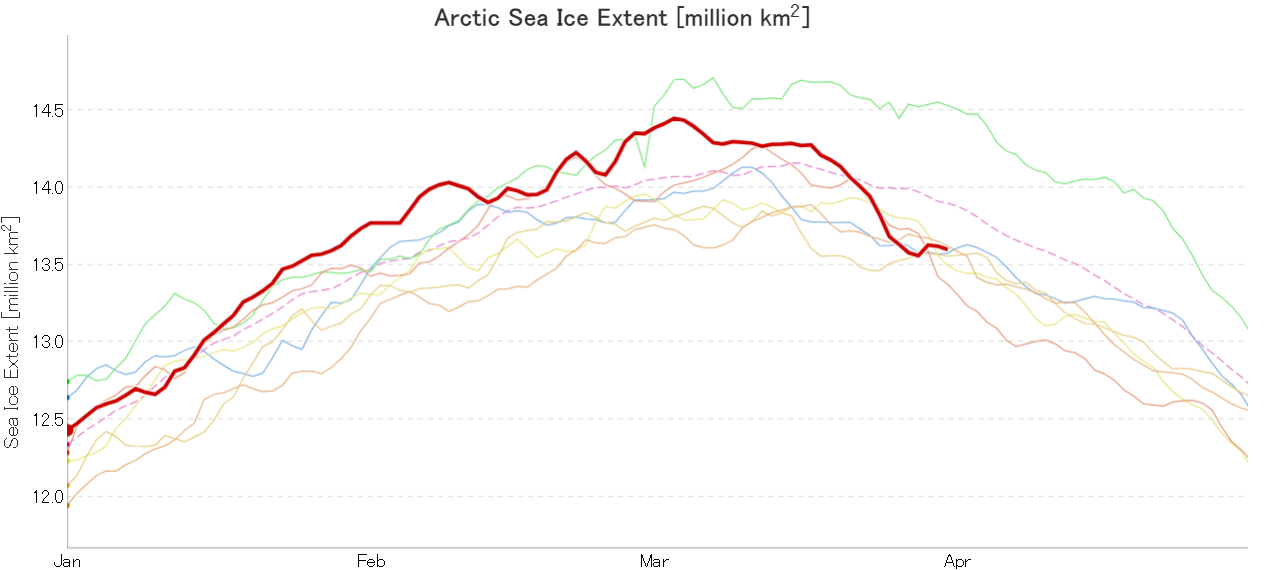
I’ve previously conjectured about the potential effect of the strong polar vortex on Northern Hemisphere snow cover this Spring, and here’s NOAA’s current snow extent graph:
JAXA extent’s precipitous recent decline has abated, and it’s now 5th lowest for the date in the satellite era:
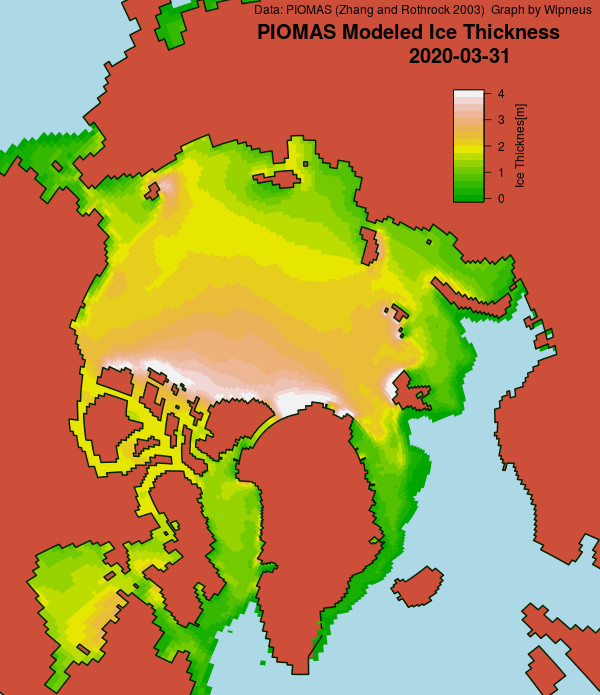
[Edit – April 4th]
Here’s the March 31st PIOMAS Arctic sea ice gridded thickness map:
Ice is thickening impressively against the Canadian Archipelago and North Greenland.
That is indeed the case with the PIOMAS “modelled” numbers, but is much less obvious in the latest CryoSat-2/SMOS “measured” thickness map where ice over 4 metres thick is still conspicuous by its absence North of Greenland:
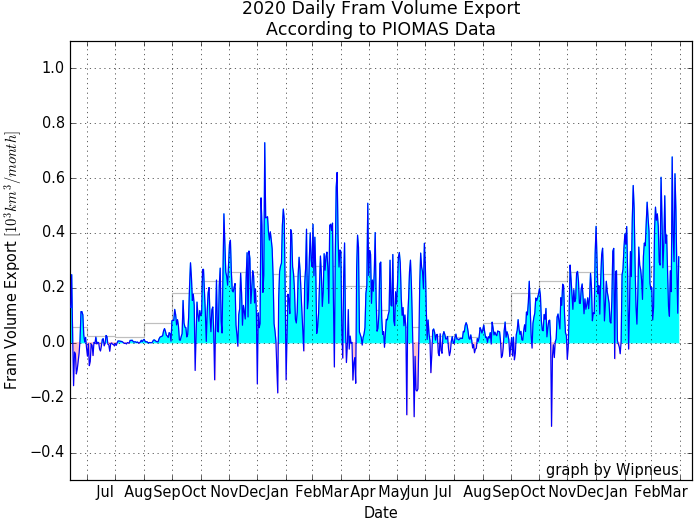
[There’s] not much thick ice on the East Coast of Greenland, indicating the increase was from reduced loss through the Fram Strait?
together with the latest AARI ice age map:
[Edit – April 6th]
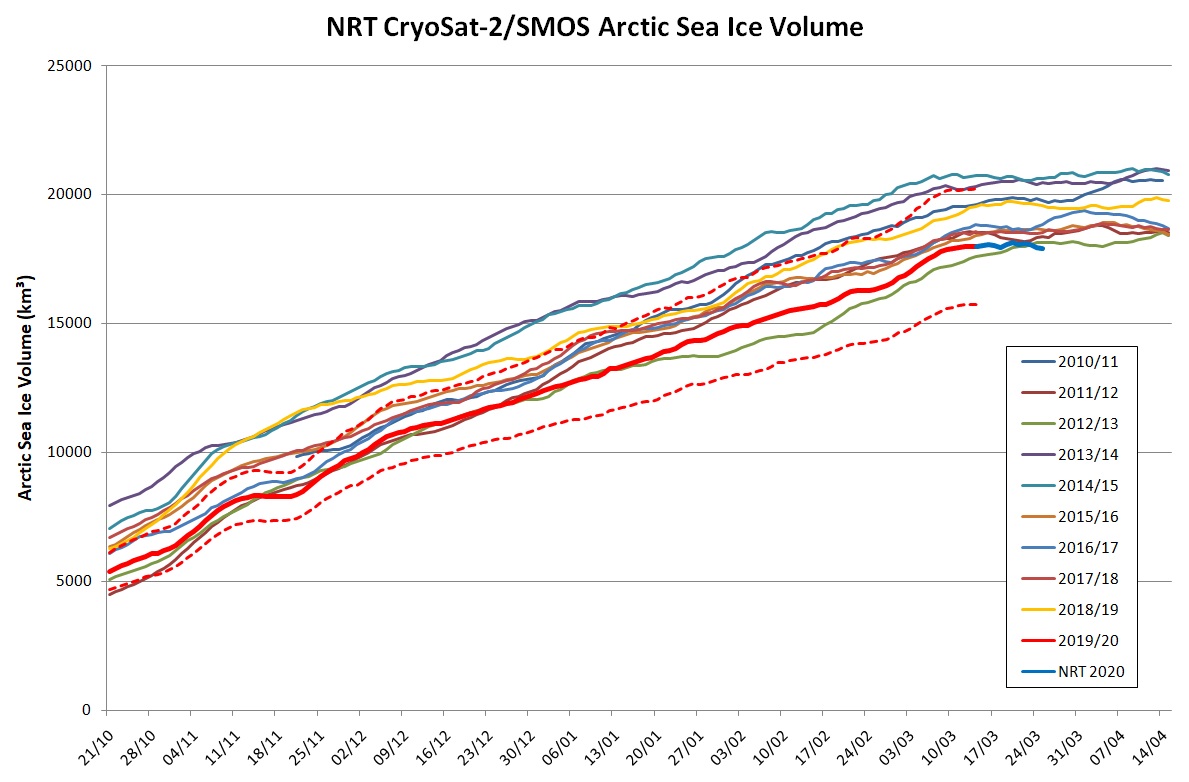
Here’s the latest update of our novel NRT volume metric:
I’ve applied a crude correction to the still problematic NRT data so that it at least coincides with the reanalysed data on March 14th. Whilst we await the reanalysed numbers for the rest of March and early April it looks as though Arctic sea ice volume reached at least a temporary peak on March 20th 2020.
[Edit – April 19th]
Here’s another update of our novel NRT volume metric, still incorporating my “fudge factor”:
Note also this handy hint from Stefan Hendricks on Twitter:
The reprocessed #Cryosat2 data is fine though and for the recent winter there is a corrected CS2SMOS version: ftp://ftp.awi.de/sea_ice/product/cryosat2_smos/v202_2/
Wipneus has crunched the mid month PIOMAS gridded thickness numbers. Here’s the result:
The discrepancy between the PIOMAS model and the CryoSat-2 “reality” is still very evident.
[Edit – April 25th]
With another week’s worth of reanalysed data now processed, it now seems certain that the CS2/SMOS Arctic sea ice volume maximum was 18469 km³ on April 6th:
[Edit – April 28th]
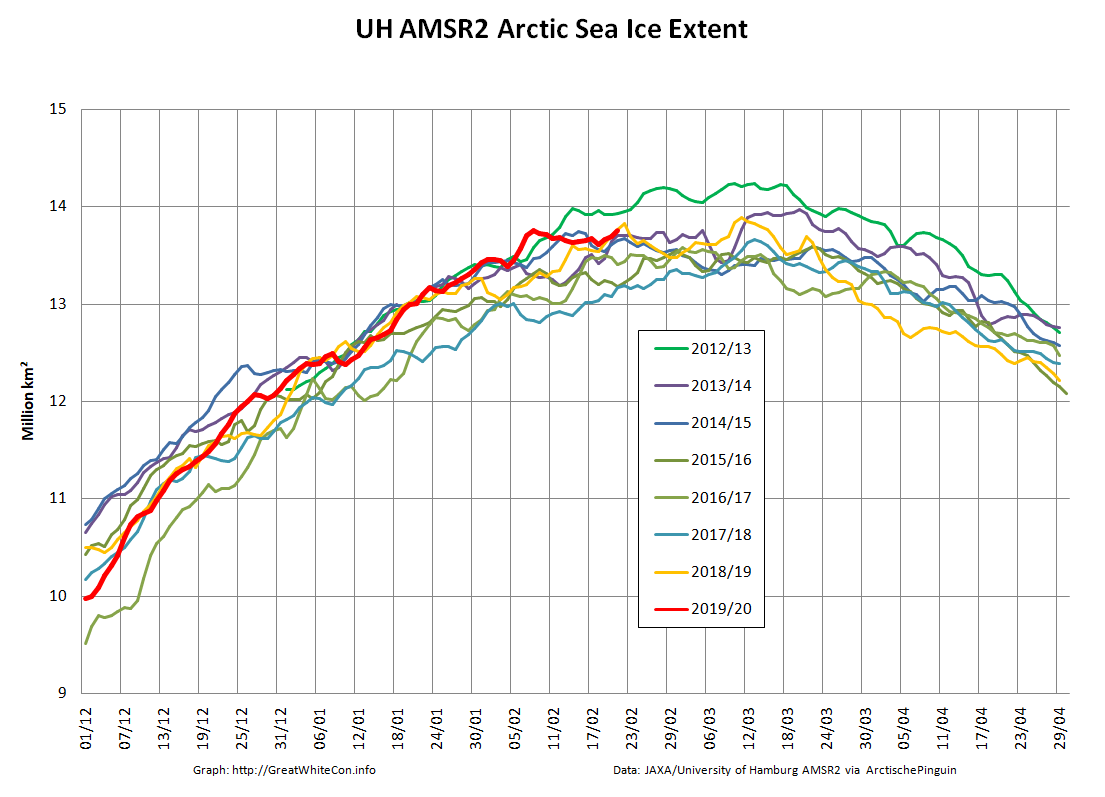
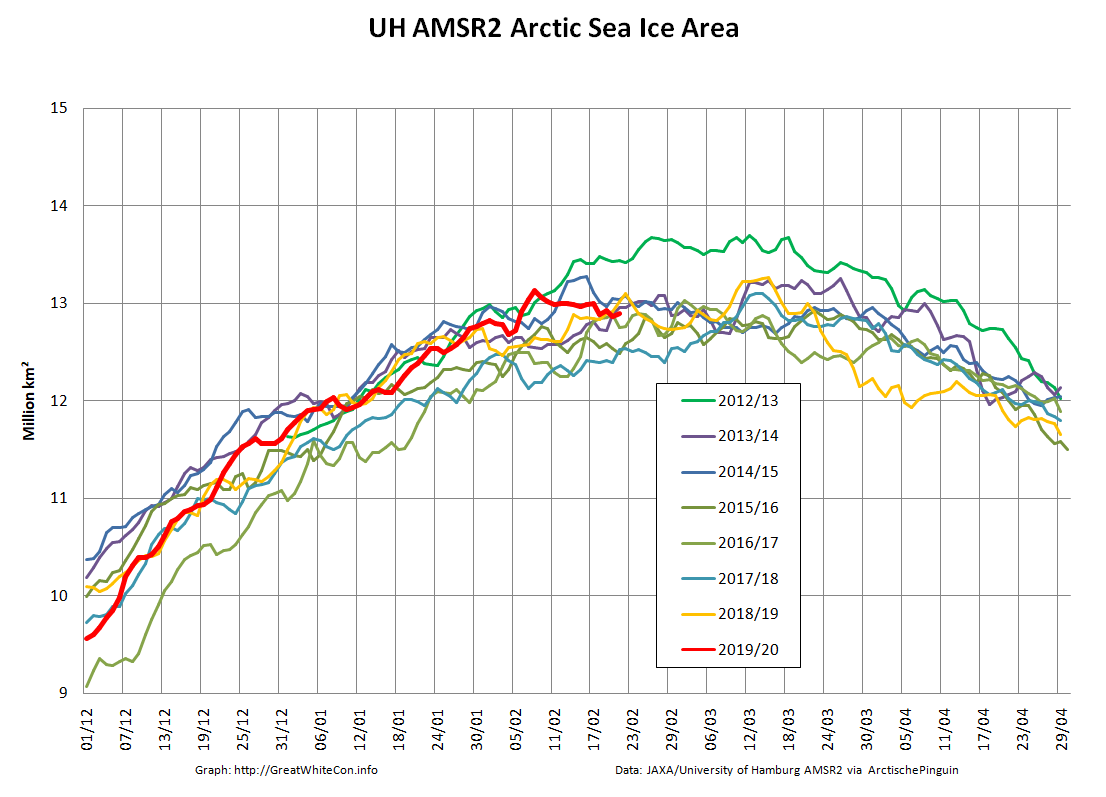
The high resolution AMSR2 area and extent metrics are now both “lowest for the date” in the AMSR2 record:
As Zack Labe has recently pointed out, in 2015 the Arctic sea ice maximum extent based on the JAXA numbers had already occurred on February 15th:
Perhaps it’s time we started paying attention this year! However the National Snow and Ice Data Center reported a significantly later date in 2015:
On February 25, 2015, Arctic sea ice extent appeared to have reached its annual maximum extent, marking the beginning of the sea ice melt season. This year’s maximum extent not only occurred early; it is also the lowest in the satellite record. However, a late season surge in ice growth is still possible.
Each year we keep track of the assorted Arctic sea ice metrics over the next month or so, and they rarely agree on the date of maximum extent, and never agree on the sea ice extent on that date! The reason for that is explained in a 2017 paper entitled “Variability and trends in the Arctic Sea ice cover: Results from different techniques“:
Reports on the sea ice cover have been provided by different institutions using basically the same set of satellite data but different techniques for estimating key parameters such as ice concentration, ice extent, and ice area. In this study, a comparison of results from four different techniques that are frequently used shows significant disagreements in the characterization of the distribution of the sea ice cover primarily in areas that have a large fraction of new ice cover or significant amount of surface melt.
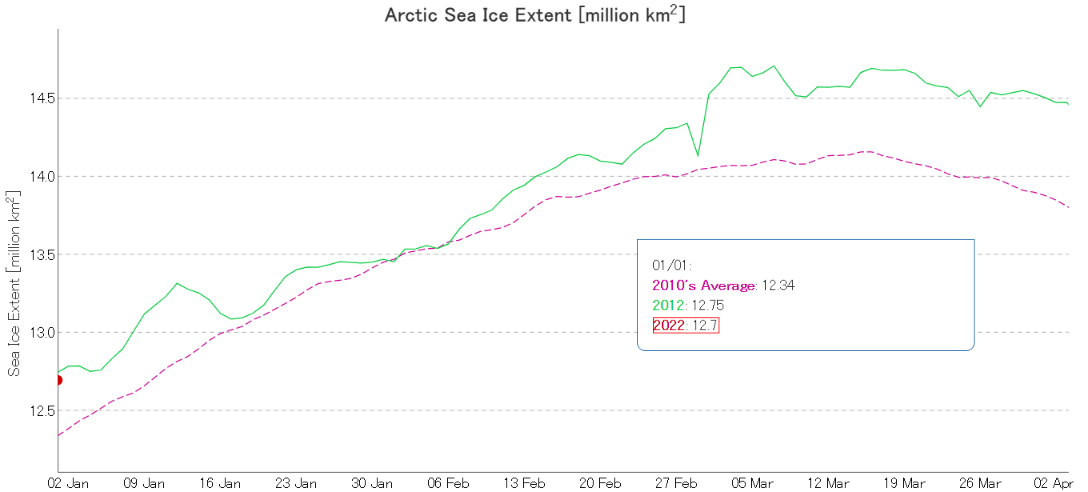
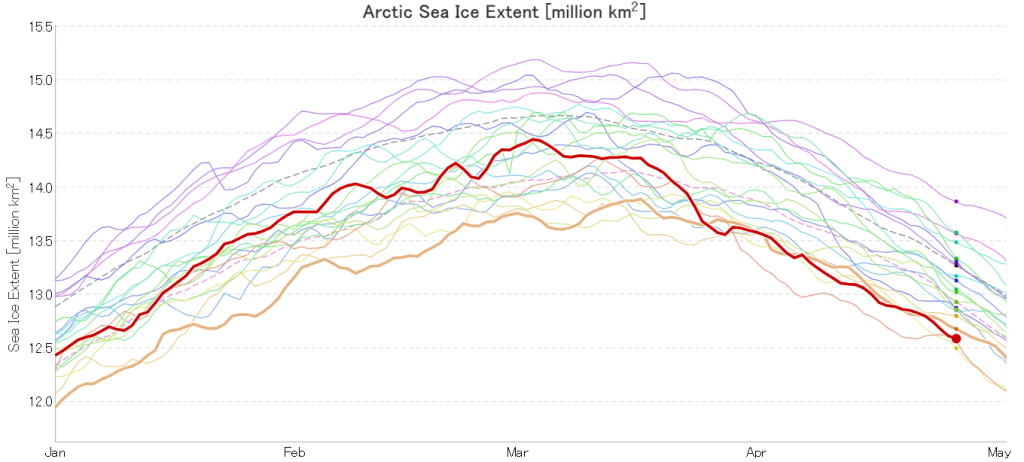
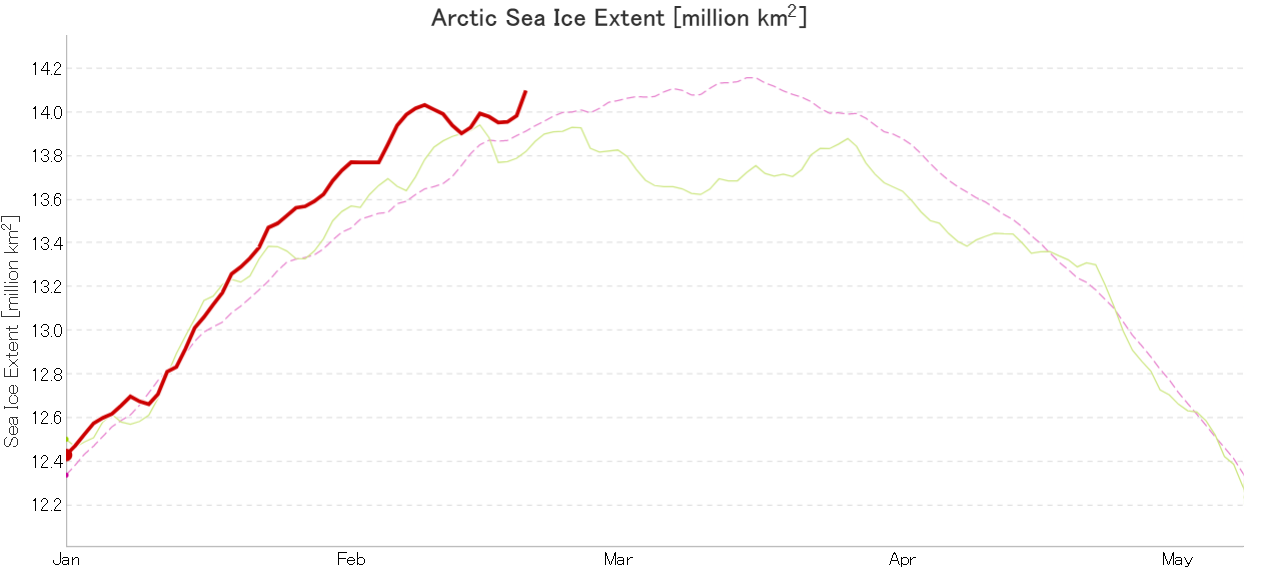
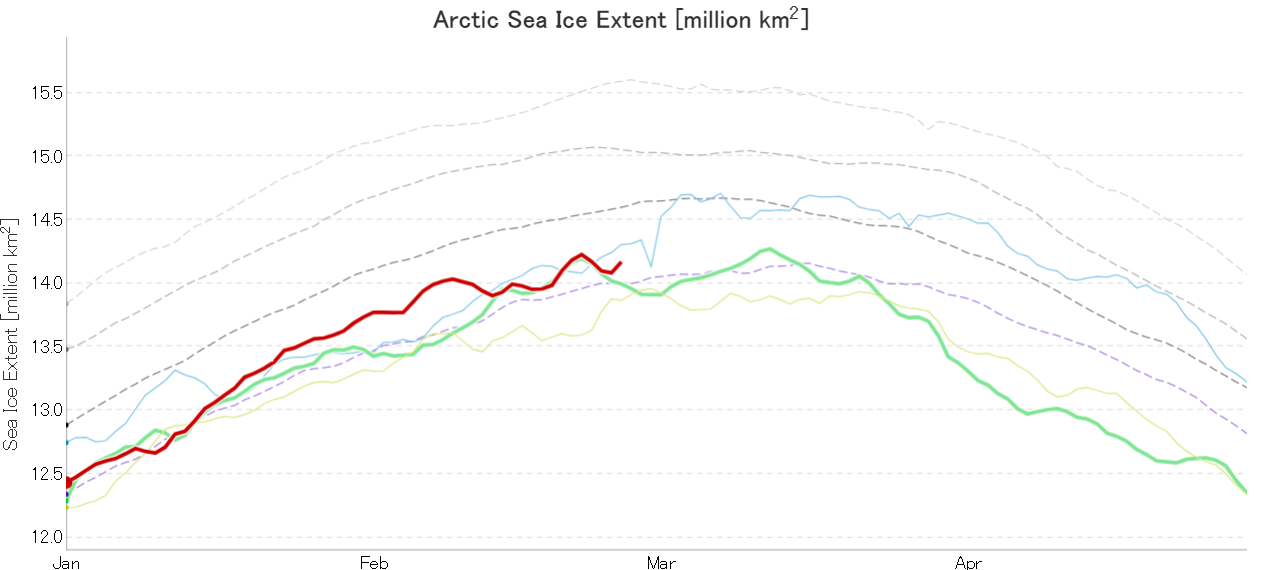
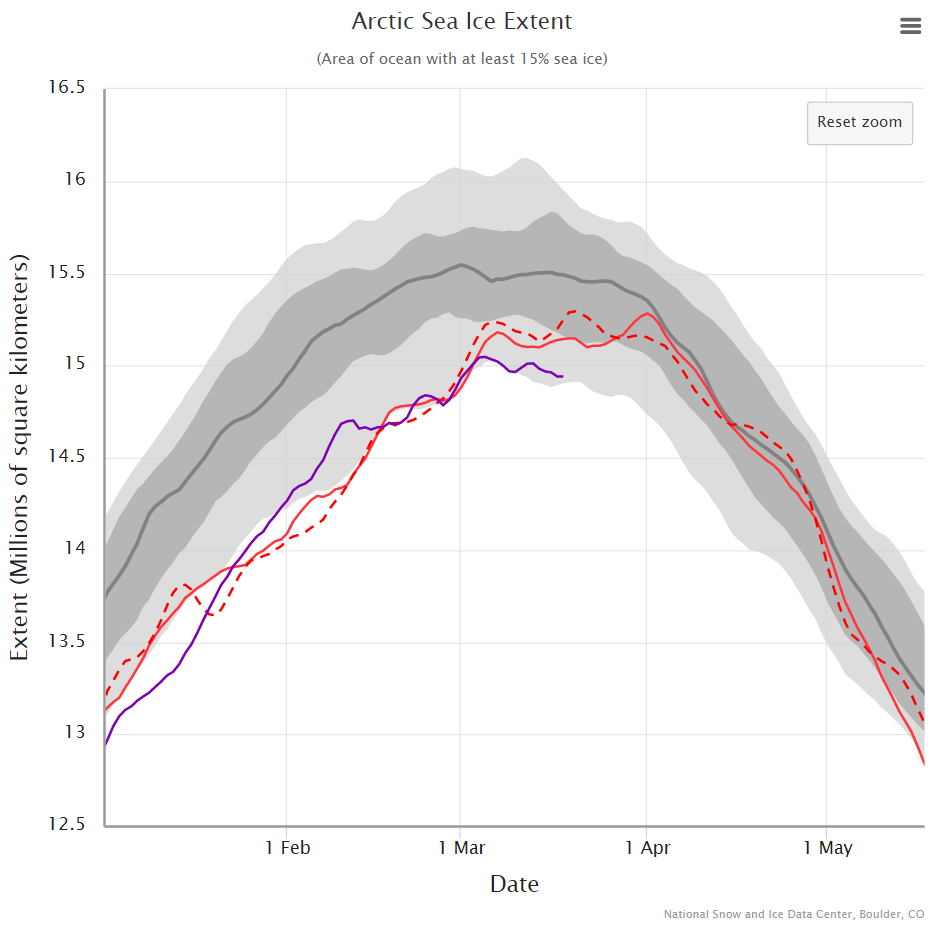
In due course we’ll look at the metrics from a variety of different institutions, but let’s start with JAXA, comparing 2020 with 2015 and the 2010s average:
Extent is clearly increasing just at the moment! Will the next peak prove to be the maximum for the year or will we have to wait another month or more to find out that value, as suggested by the average?
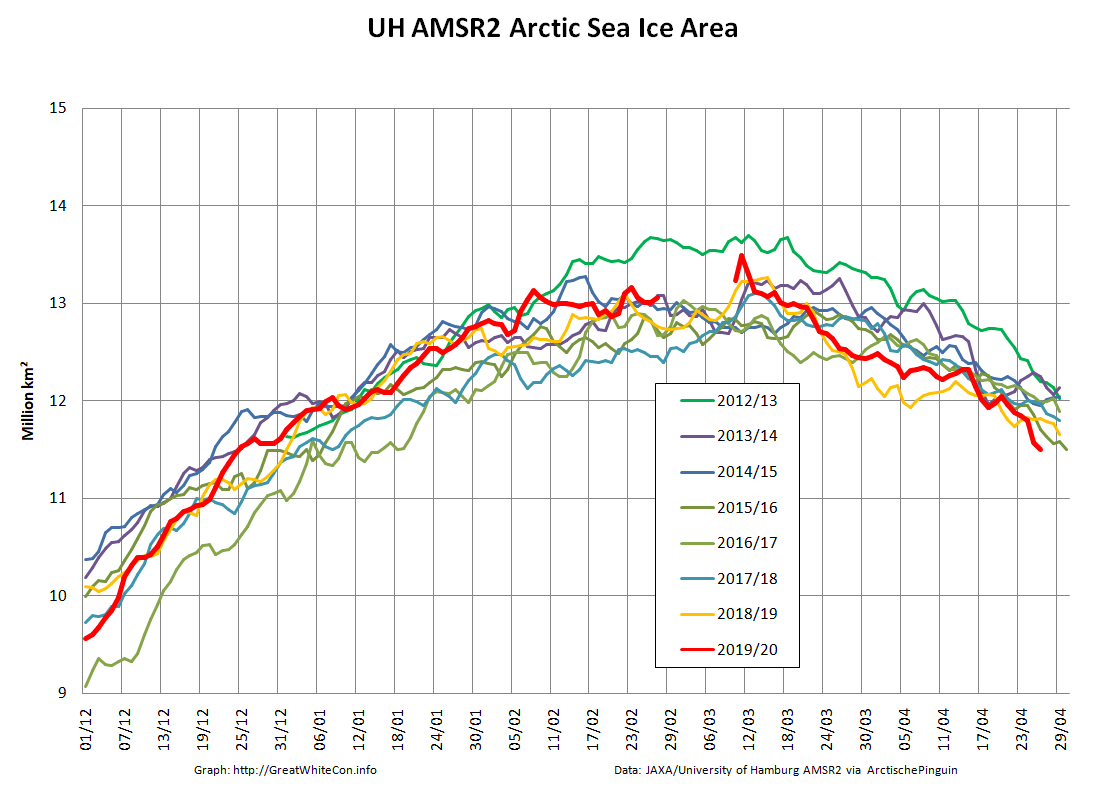
Compare and contrast JAXA extent with Wipneus’ high resolution AMSR2 extent and area:
Perhaps the 2020 maximum area has already been reached?
[Edit – February 25th]
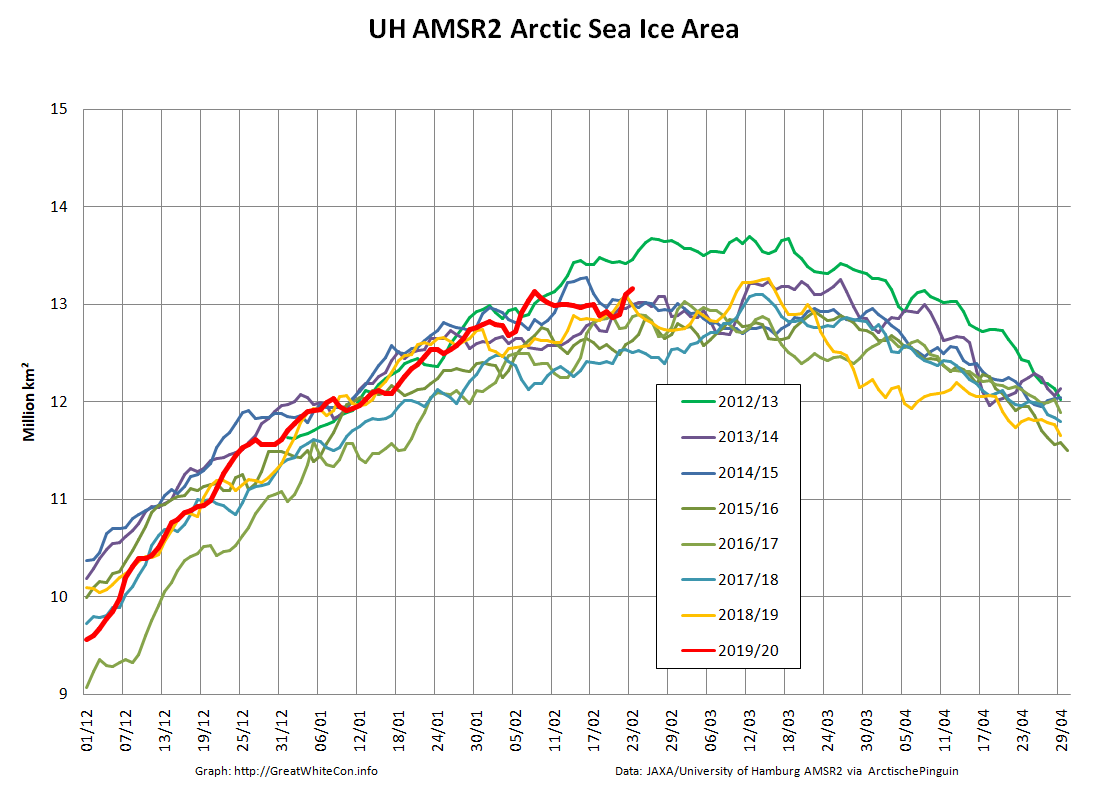
Or perhaps not! We’re playing mix and match this morning, since Wipneus’s new numbers haven’t been released yet. Here UH AMSR2 high resolution Arctic sea ice area from February 23rd:
Plus JAXA extent for the 24th:
[Edit – February 27th]
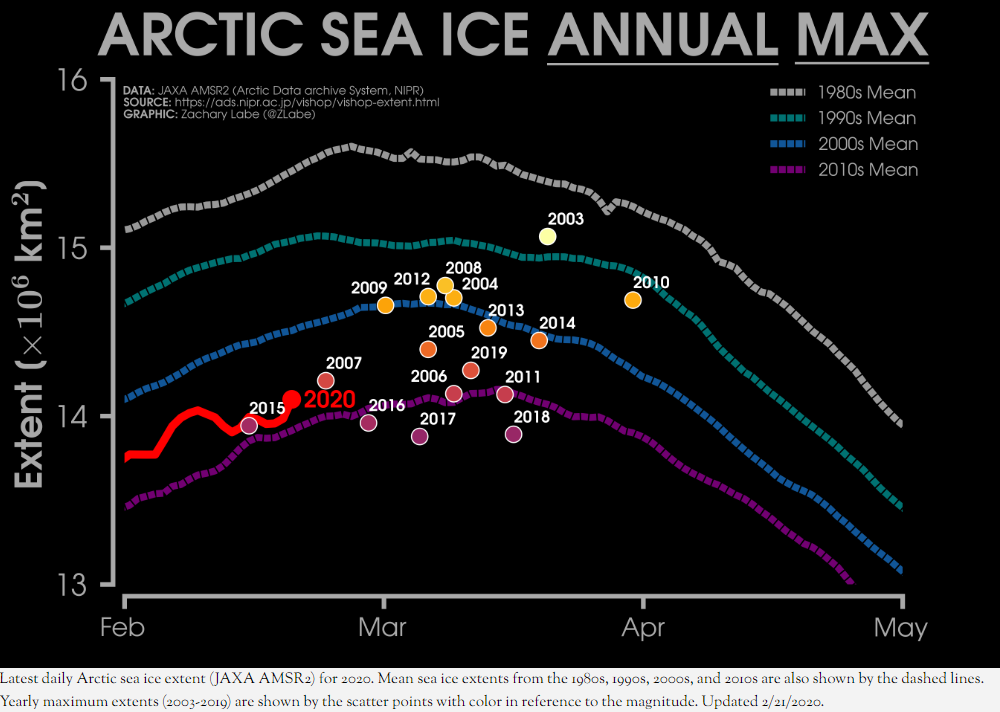
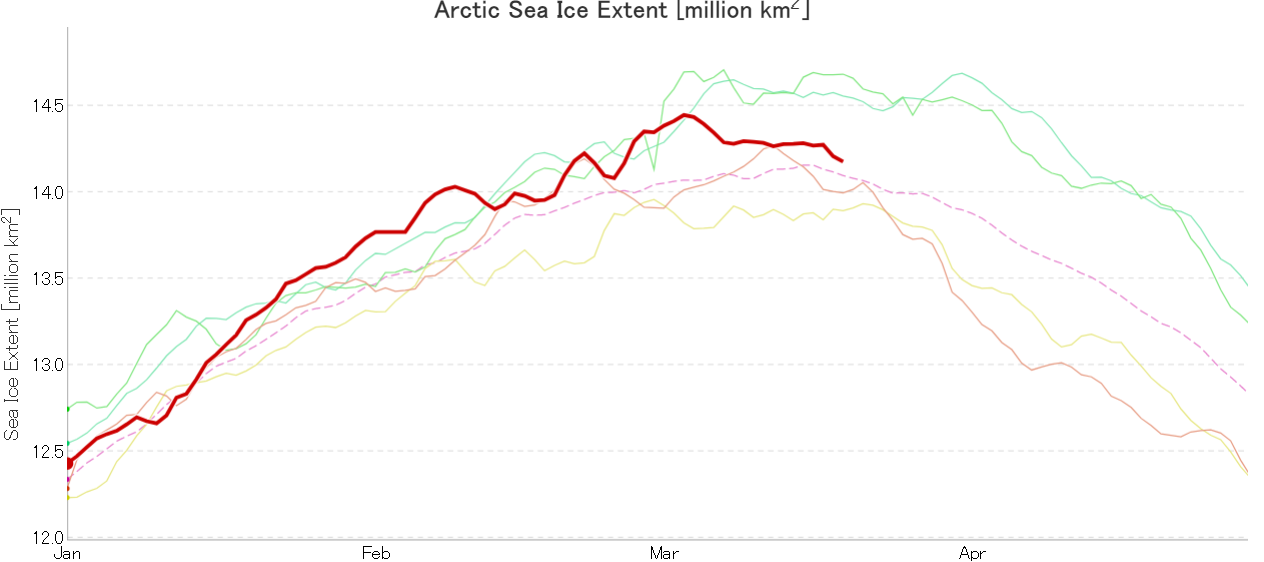
Tony Heller’s latest sea ice themed article claims “Normal Sea Ice Extent At Both Poles”. Hence today’s JAXA extent graph includes the averages for previous decades:
Extent is evidently increasing once again, and is even more evidently well below what passed for “normal” in the twentieth century!
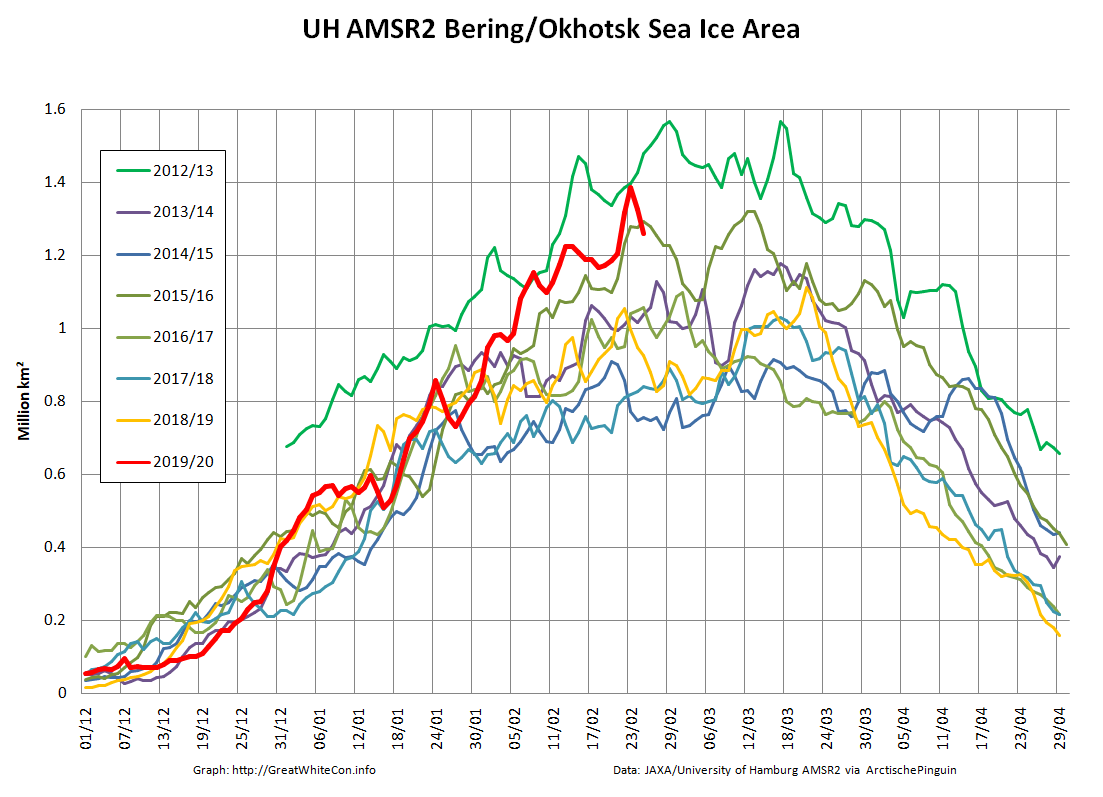
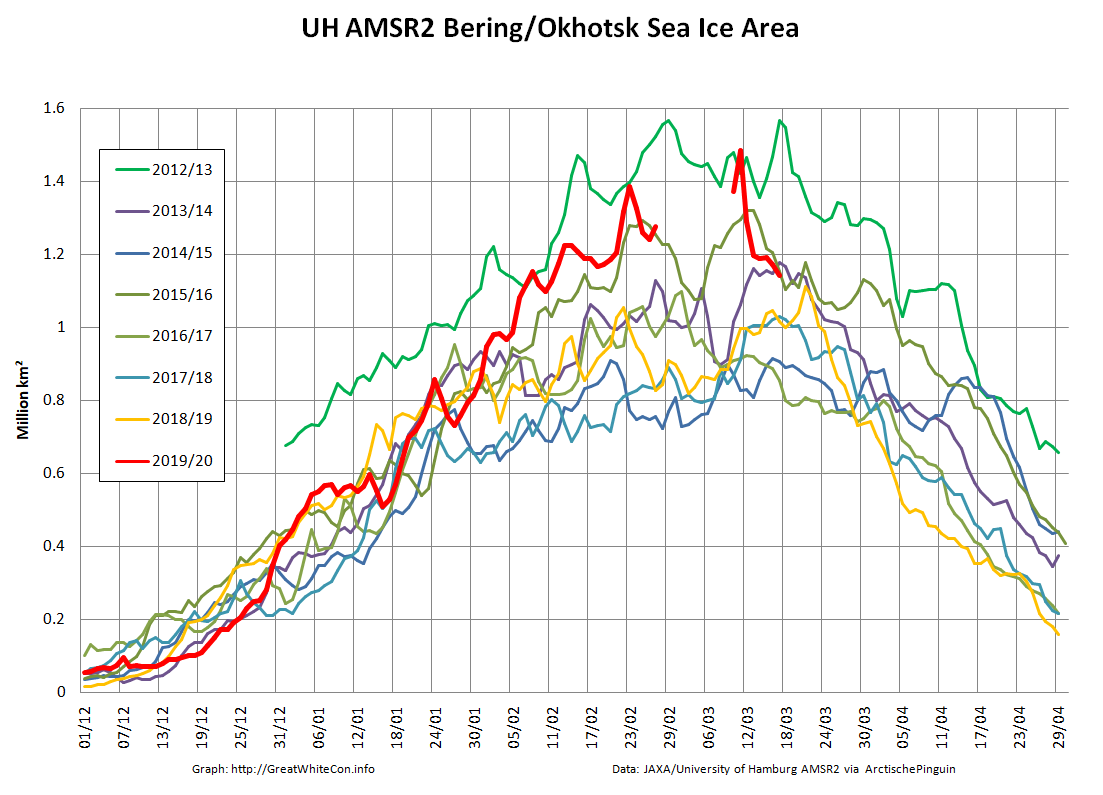
Let’s also compare the Pacific periphery:
with the Atlantic side of the Arctic Ocean:
The Bering and Okhotsk Seas will be sea ice free by the time September 2020 arrives. How about the Kara, Barents and particularly Greenland Seas though?
[Edit – February 29th]
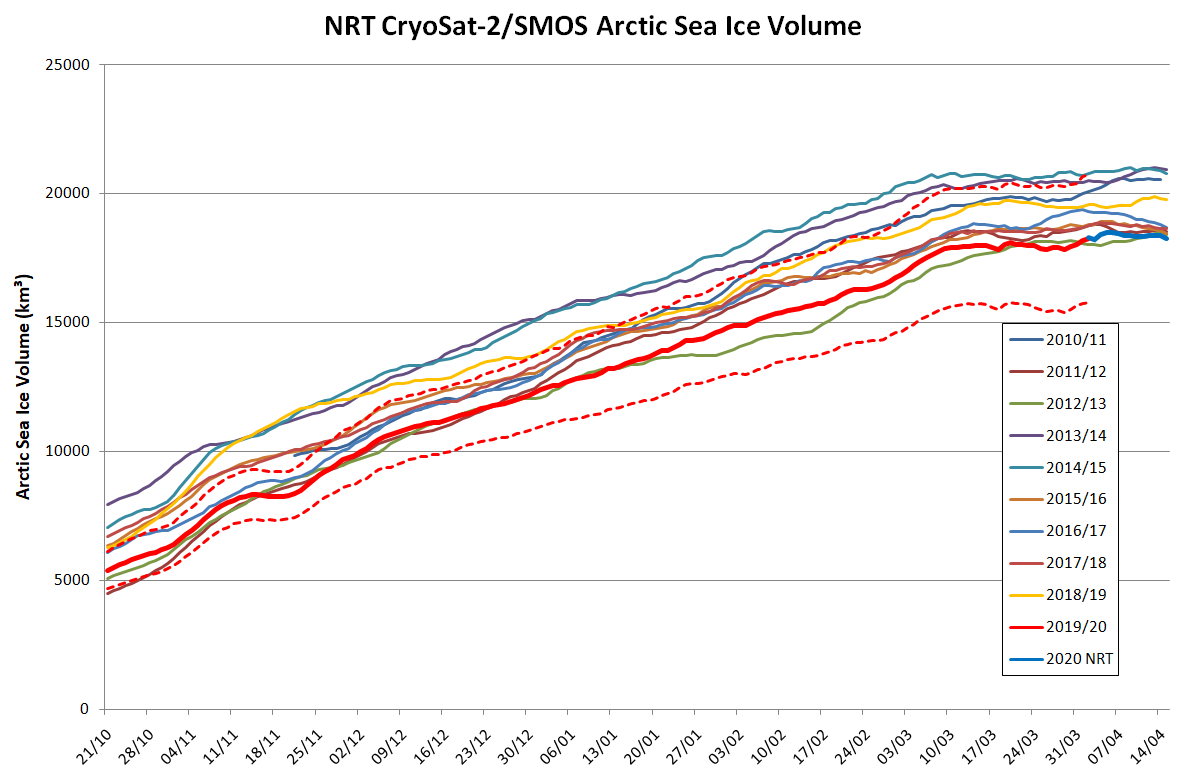
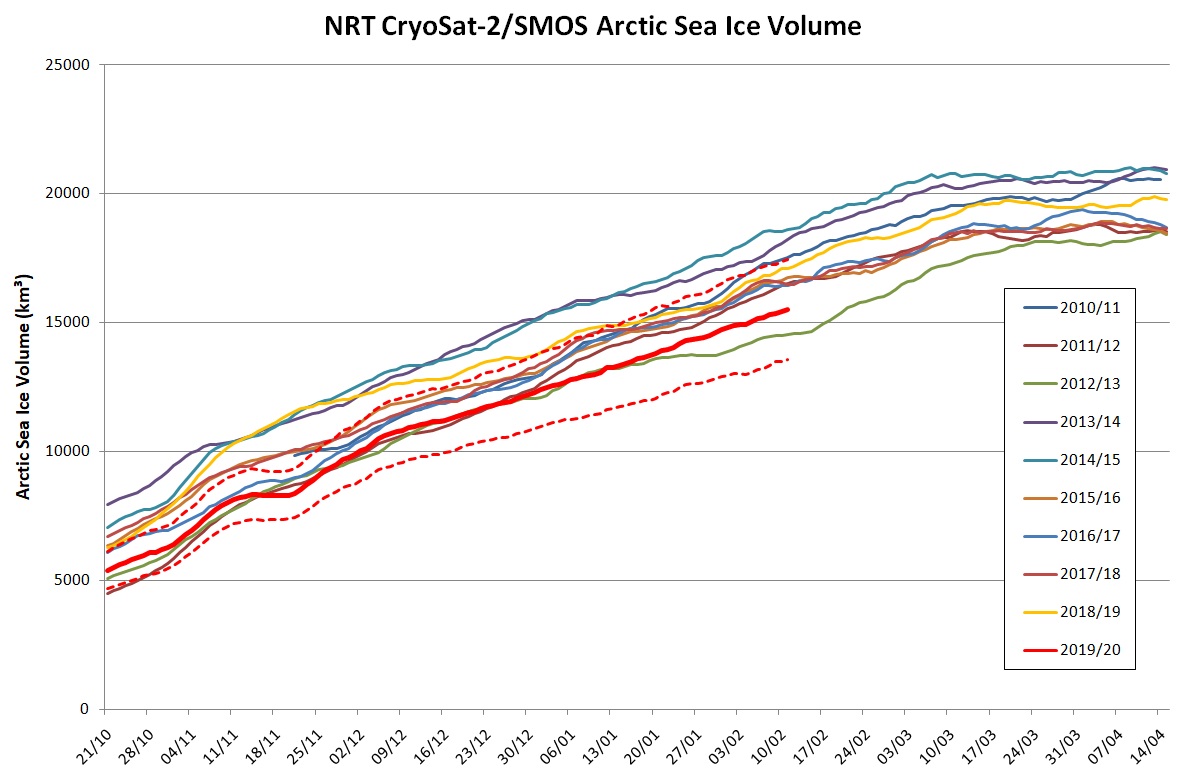
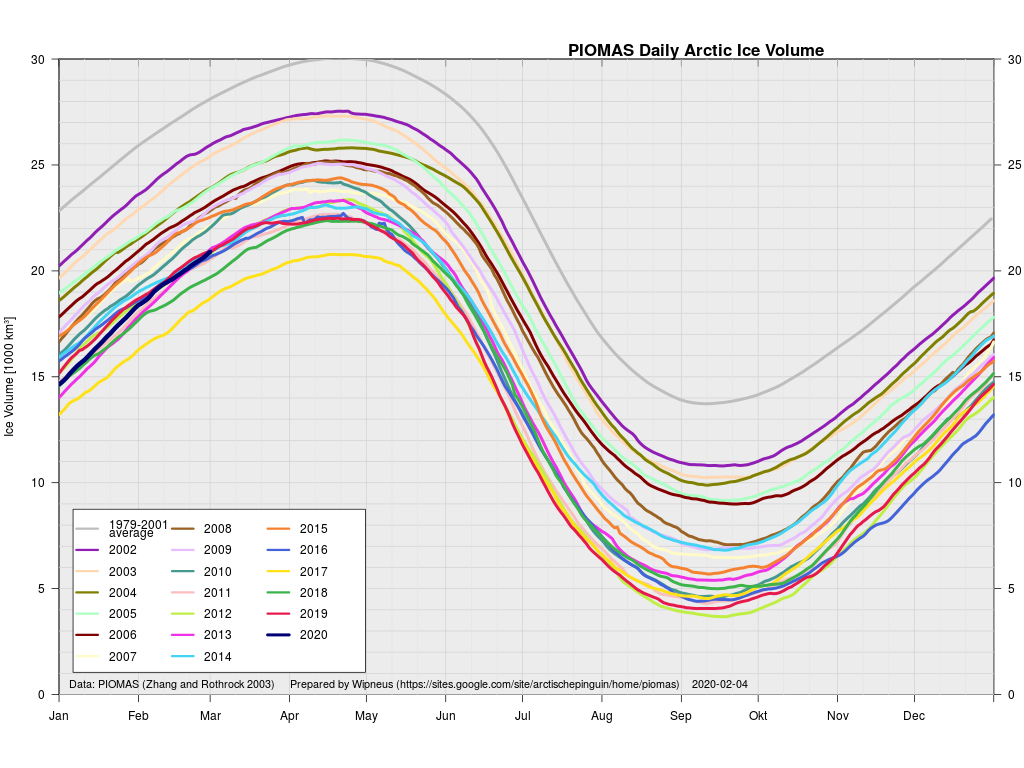
Arctic sea ice maximum volume usually occurs in April, but nonetheless let’s keep an eye on the metric that most nearly measure the “amount” of sea ice left in the Arctic in 2020. Here’s our “measured” CryoSat-2/SMOS volume metric, using reanalysed data up to February 12th:
PIOMAS “modelled” volume for February should be released soon, but getting back to extent the JAXA flavour has been setting new highs over recent days:
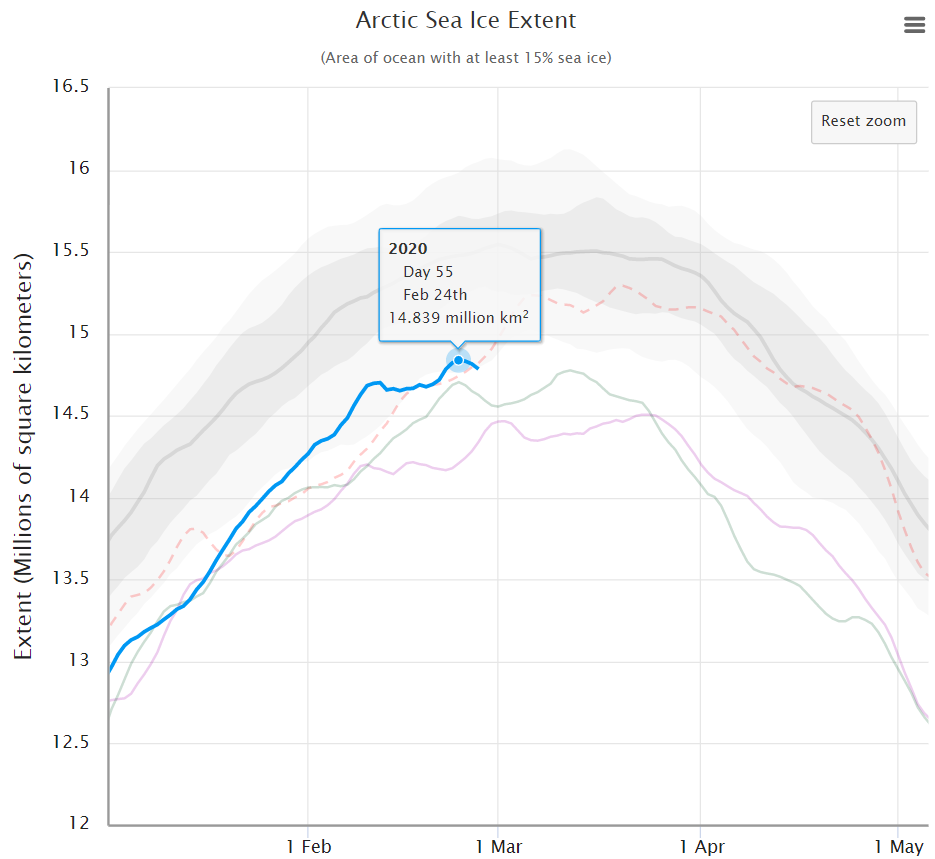
whereas the NSIDC’s Charctic 5 day averaged extent has not!
[Edit – March 6th]
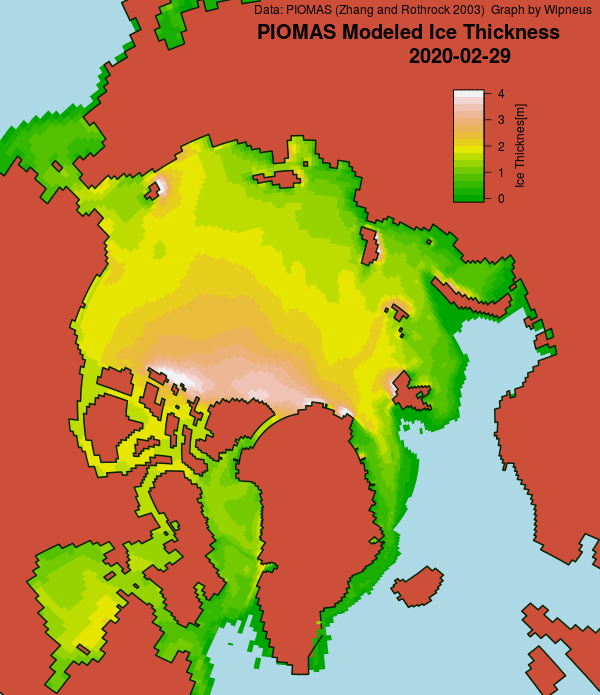
Here’s the February PIOMAS gridded Arctic sea ice thickness map, courtesy of Wipneus on the Arctic Sea Ice Forum:
plus the traditional modelled volume graph:
As angech has pointed out elsewhere, according to the PIOMAS team:
CryoSat-2 data show total volume for February 2020 substantially lower than PIOMAS with 2020 Febuary near record low levels over the 2011-2020 period
[Edit – March 19th]
The March mid month PIOMAS numbers have been crunched by Wipneus. Here’s how things look at the moment:
For comparison purposes here’s the current CryoSat-2/SMOS Arctic sea ice thickness map:
[Edit – March 20th]
After flatlining for a long time JAXA extent has posted significant declines for two days running. There’s been no official announcement from the NSIDC as yet, but it now seems safe to conclude that there won’t be a late surge in extent similar to 2010. Here’s the current JAXA graph:
plus NSIDC’s 5 day averaged extent:
Hence the (still provisional!) maximum numbers for 2020 are:
JAXA/VISHOP AMSR2 – 14.45 million square kilometres on March 3rd
NSIDC 5 day SSMIS – 15.05 million square kilometres on March 5th
The University of Hamburg’s JAXA AMSR2 concentration data seems to have suffered an outage over the crucial period. Hopefully the gaps will be filled in due course. However more recent regional graphs reveal the following:
The recent declines in overall extent are evidently driven by declines on the Pacific periphery.
This website uses cookies to improve your experience. We'll assume you're ok with this, but you can opt-out if you wish. Cookie settingsACCEPT
Privacy & Cookies Policy
Privacy Overview
This website uses cookies to improve your experience while you navigate through the website. Out of these, the cookies that are categorized as necessary are stored on your browser as they are essential for the working of basic functionalities of the website. We also use third-party cookies that help us analyze and understand how you use this website. These cookies will be stored in your browser only with your consent. You also have the option to opt-out of these cookies. But opting out of some of these cookies may affect your browsing experience.
Necessary cookies are absolutely essential for the website to function properly. This category only includes cookies that ensures basic functionalities and security features of the website. These cookies do not store any personal information.
Any cookies that may not be particularly necessary for the website to function and is used specifically to collect user personal data via analytics, ads, other embedded contents are termed as non-necessary cookies. It is mandatory to procure user consent prior to running these cookies on your website.