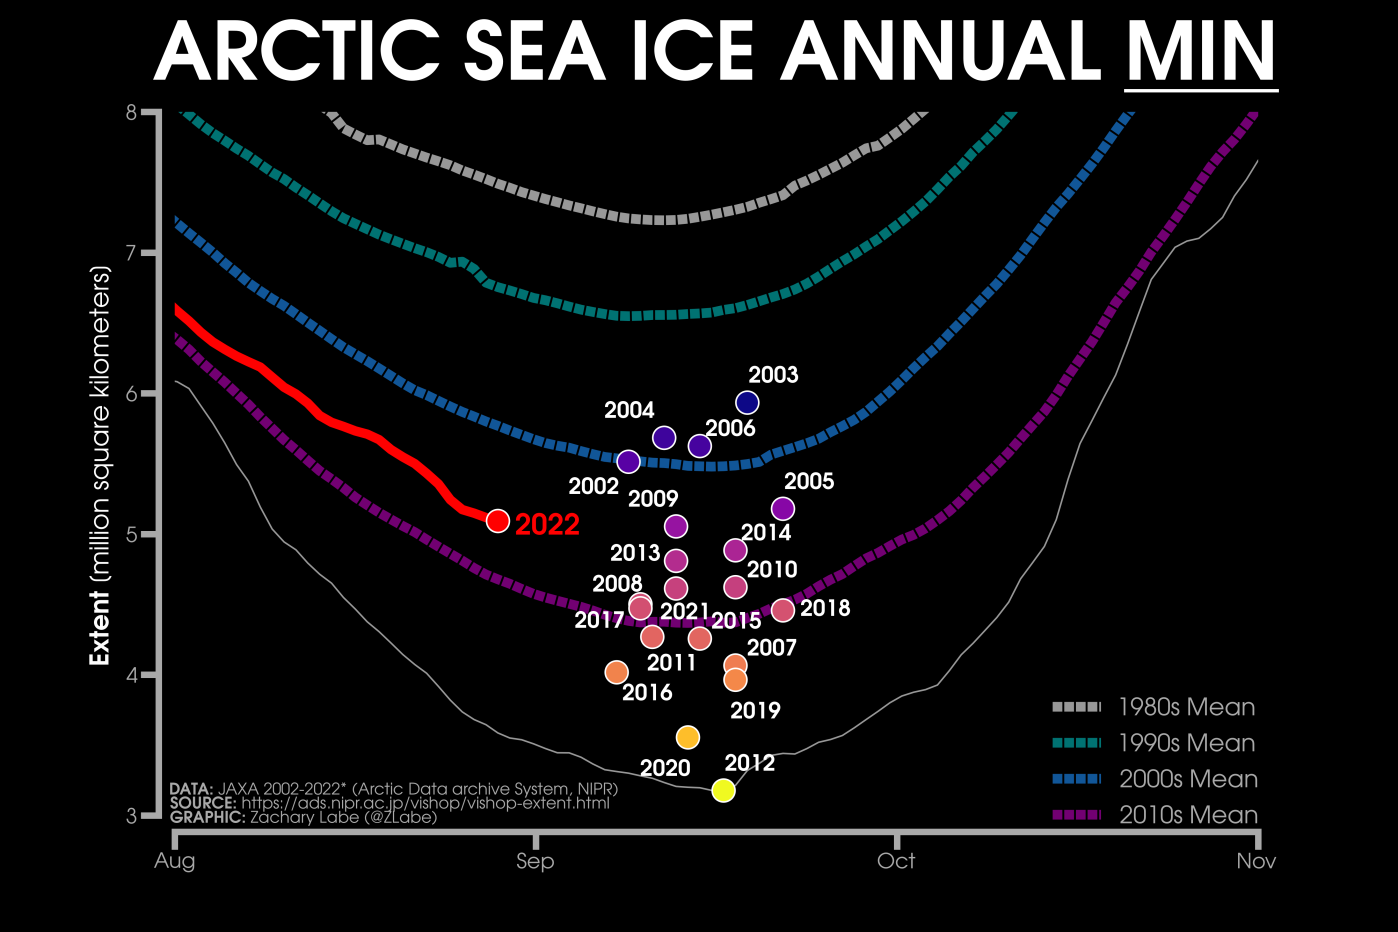
September has arrived and it’s time to start speculating about when and at what level this summer’s minimum Arctic sea ice extent will occur. Here’s a helpful summary of previous years’ JAXA AMSR2/AMSR-E extent minima courtesy of Zack Labe:
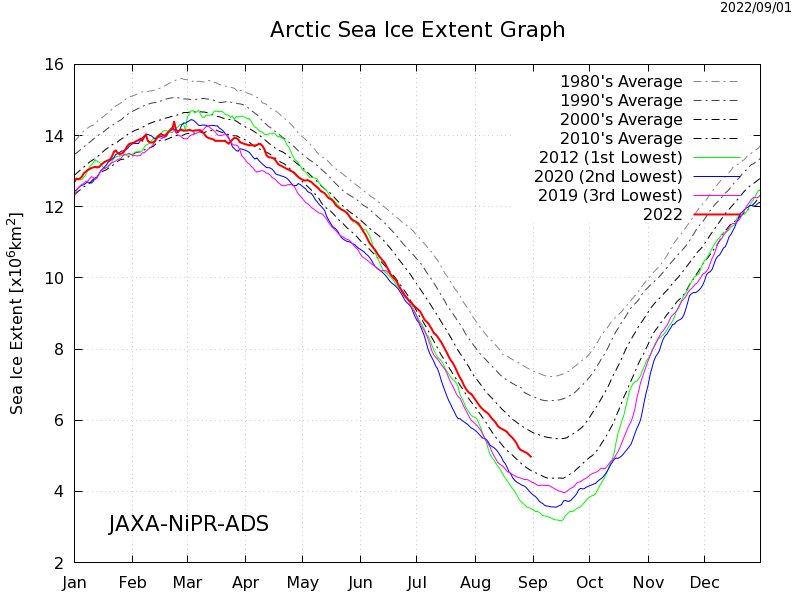
Here too is JAXA’s current graph of extent, including a selection of previous years:
JAXA extent on August 31st was 4.96 million km2, marginally below last year’s value of 4.99 million km2 on the same date.
The results of the ARCUS Sea Ice Prediction Network August call have been released, and here is the outlook for the 2021 minimum September mean Arctic sea ice extent:
The median prediction for the mean sea ice extent during the month of September 2021 is 4.39 million km2. According to ARCUS:
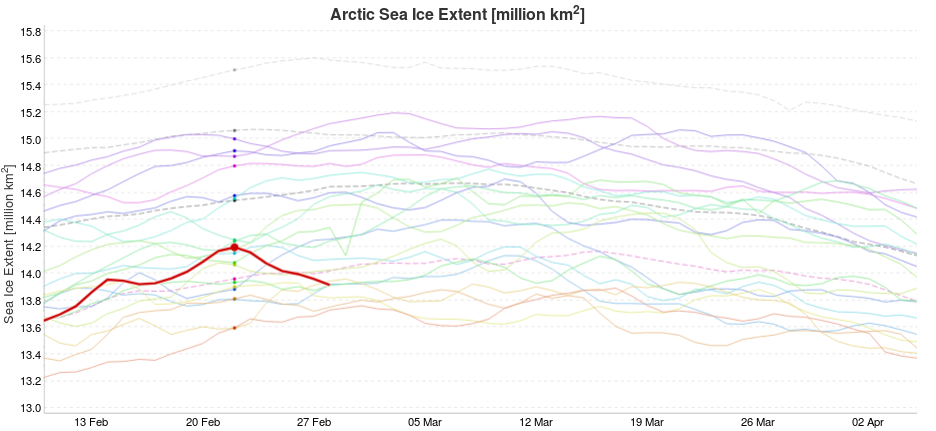
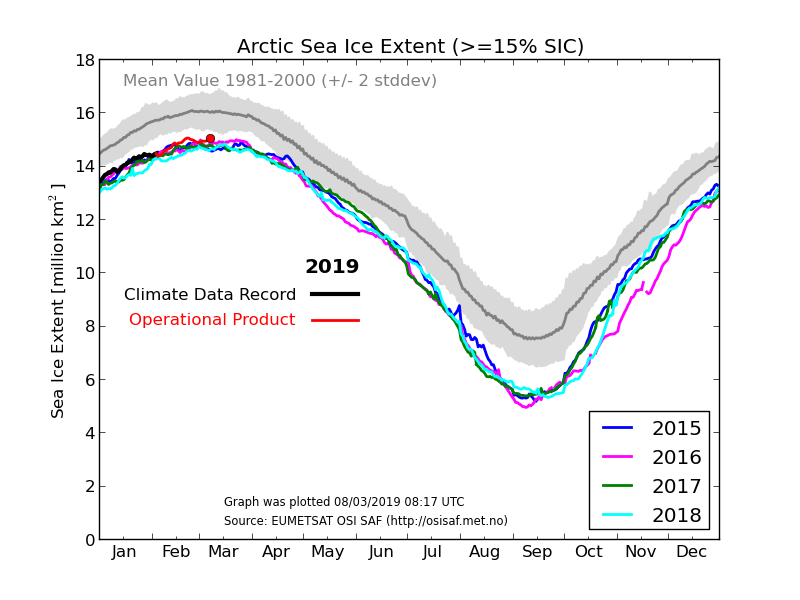
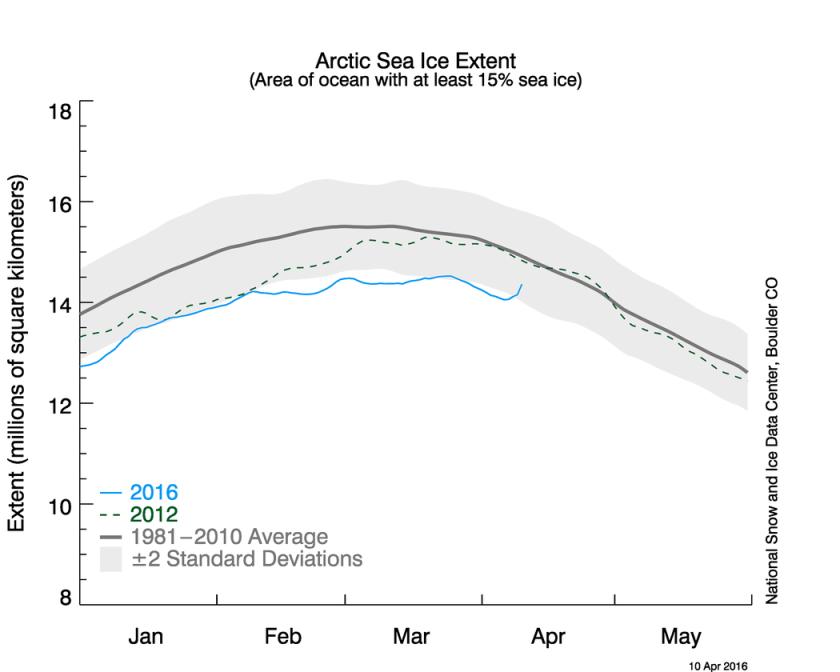
As of 22 August 2021, the Arctic sea-ice extent was 5.58 (compared with 25 August 2020 value of 4.43) million square kilometers. Arctic sea-ice extent in 2021 remains well below the climatological median and has closely followed the 2012 values for much of the summer but has diverged to higher sea-ice extent starting in early August. The forecasts continue to support September 2021 mean sea-ice extent being well above the September 2020 value. July sea-ice retreat has been greatest in the Eurasian seas, particularly in the East Siberian Sea, making the 2021 ice edge well north of the long-term median edge in Eurasia. Sea ice retreated since the end of July along the northern coast of Alaska, although the ice edge is near its climatological position, which makes the Beaufort and Chukchi sea ice extent the largest at this time of year since 2006. A tongue of sea ice that has been present all summer continues to extend close to land in the Kara Sea, making the northeast passage likely to remain blocked for the first time in several years. Half the models which provide spatial data to the SIO predict that the tongue is likely to survive.
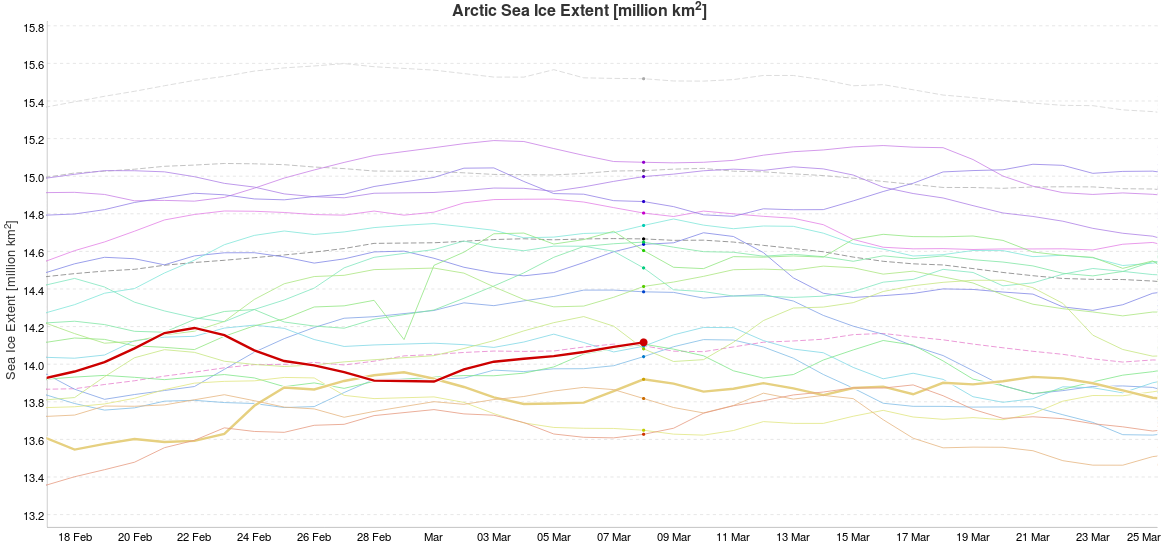
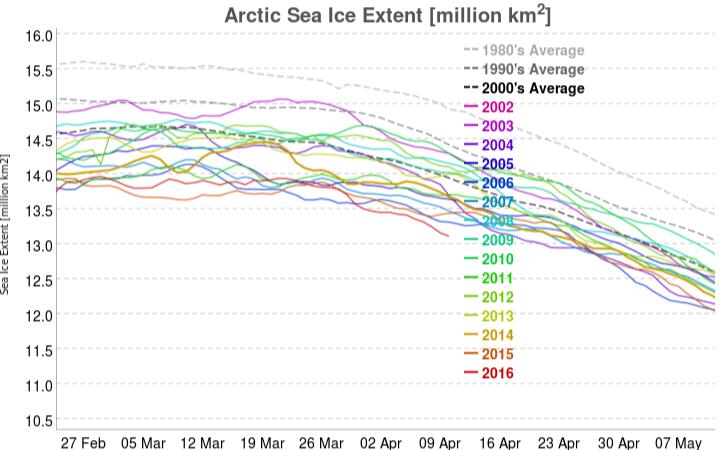
Now let’s take a look at a range of assorted extent measurements. Here’s the NSIDC’s 5 day average extent:
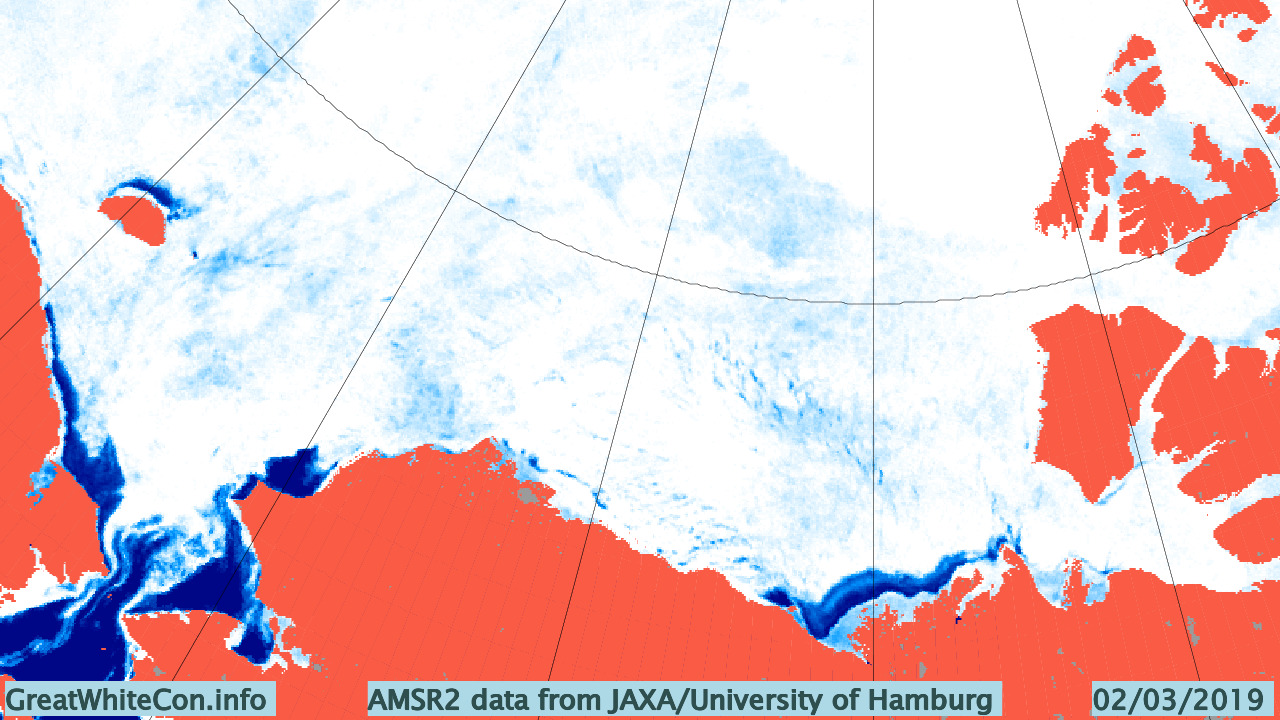
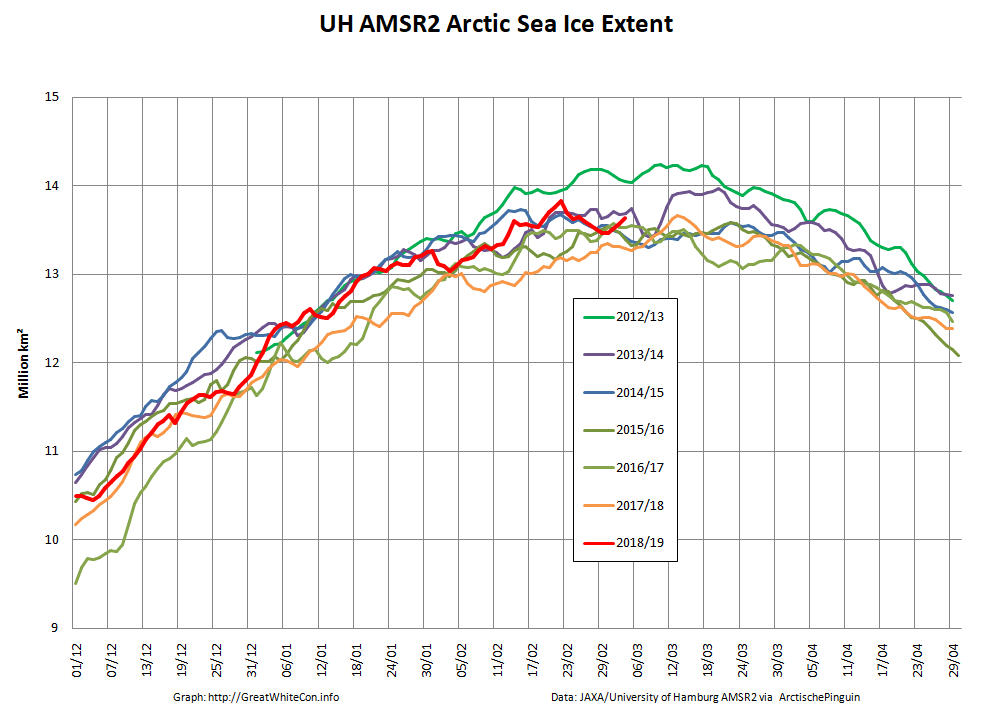
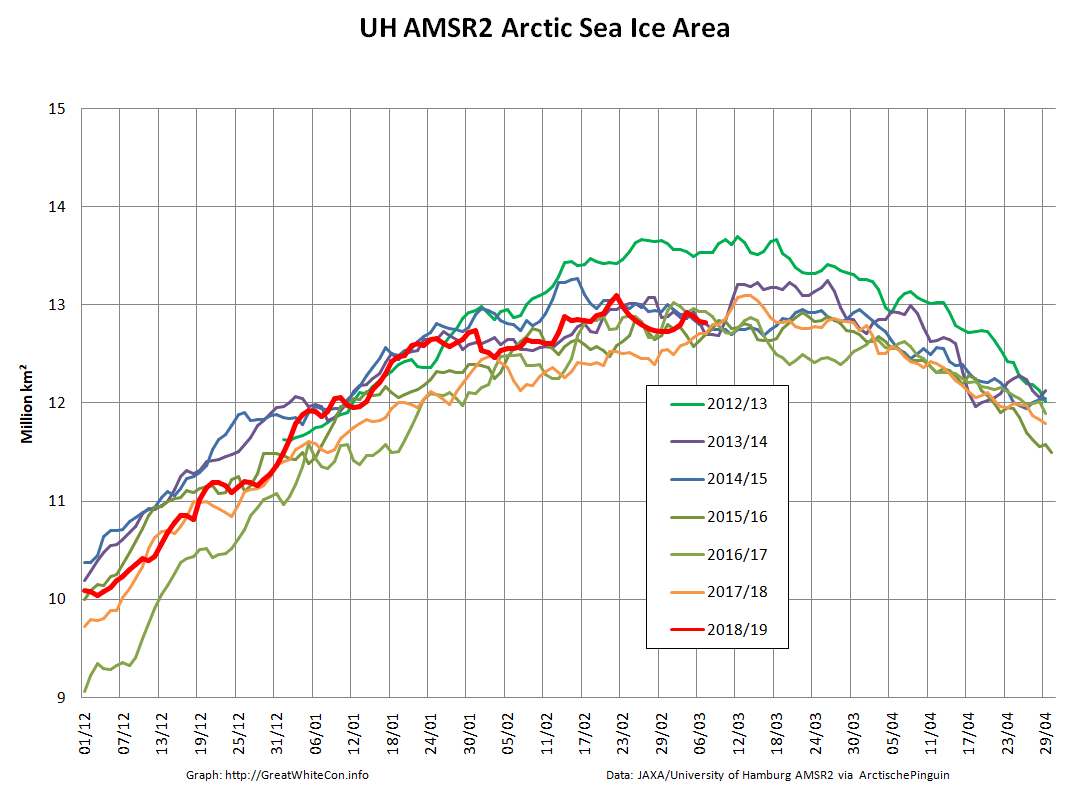
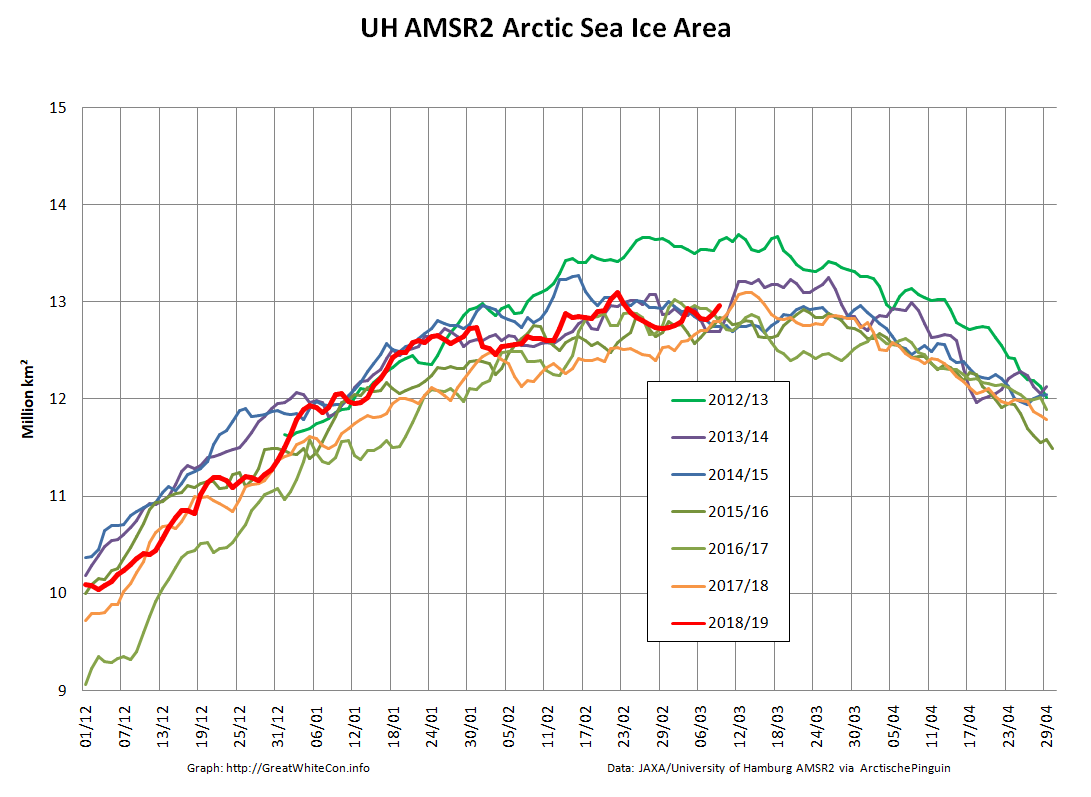
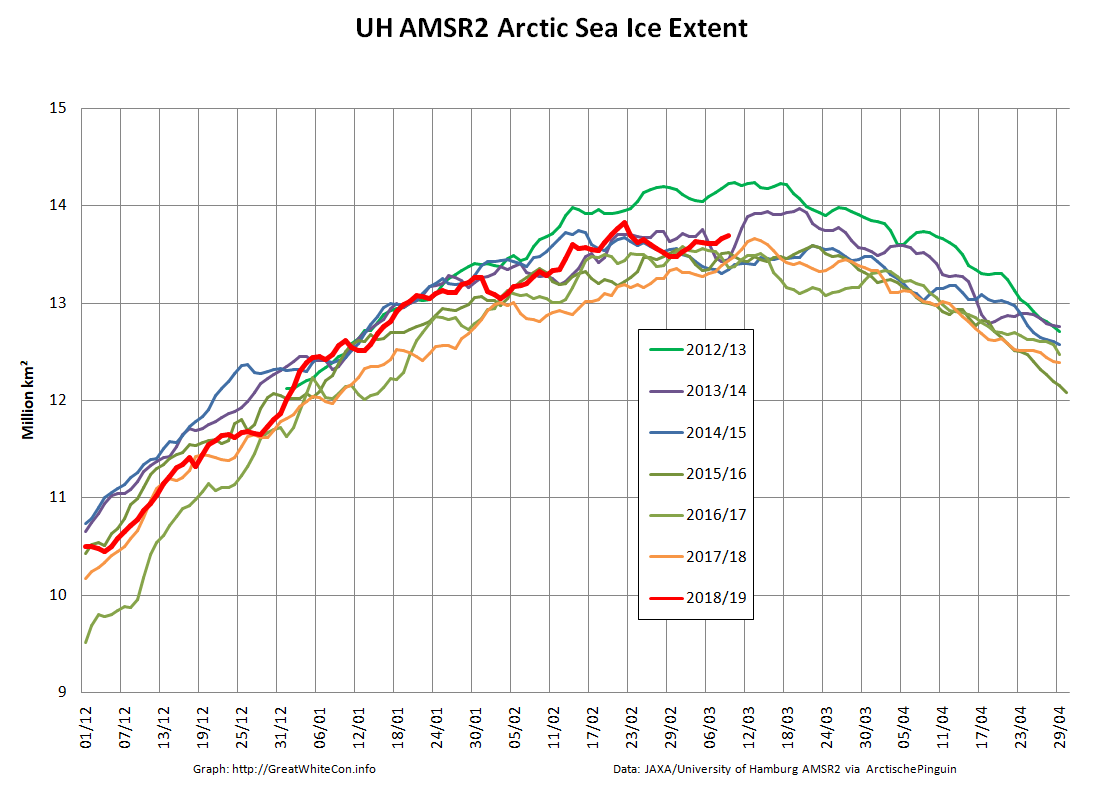
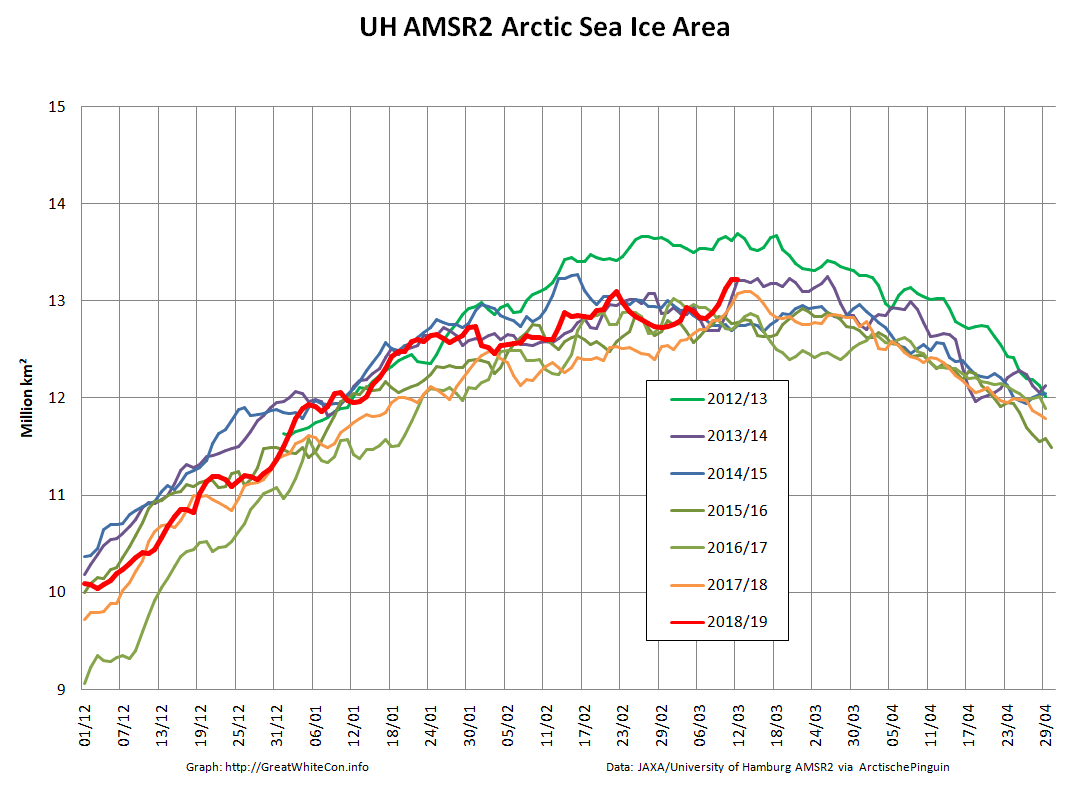
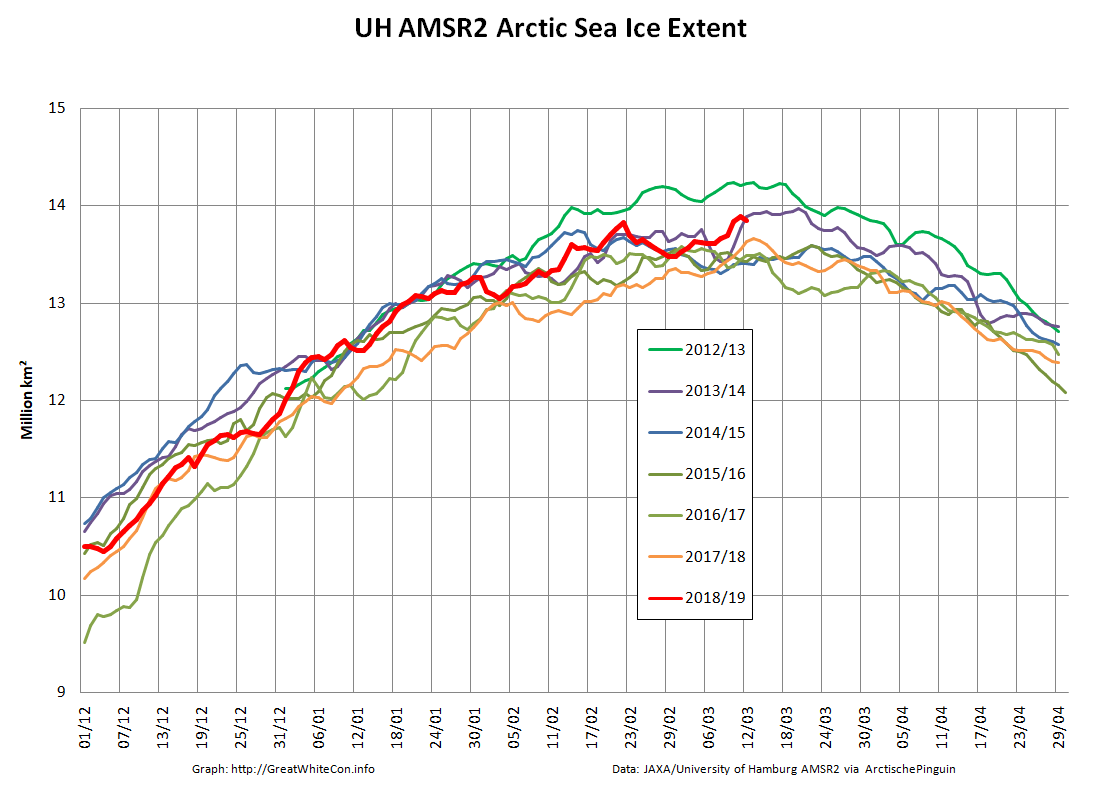
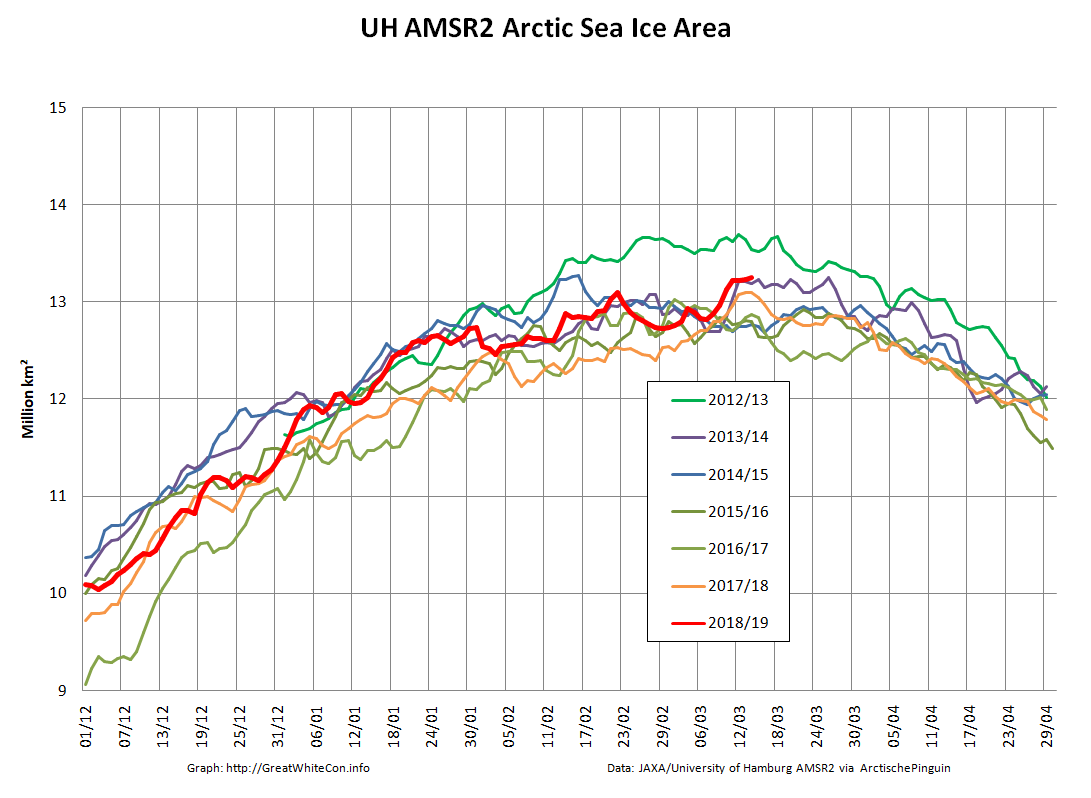
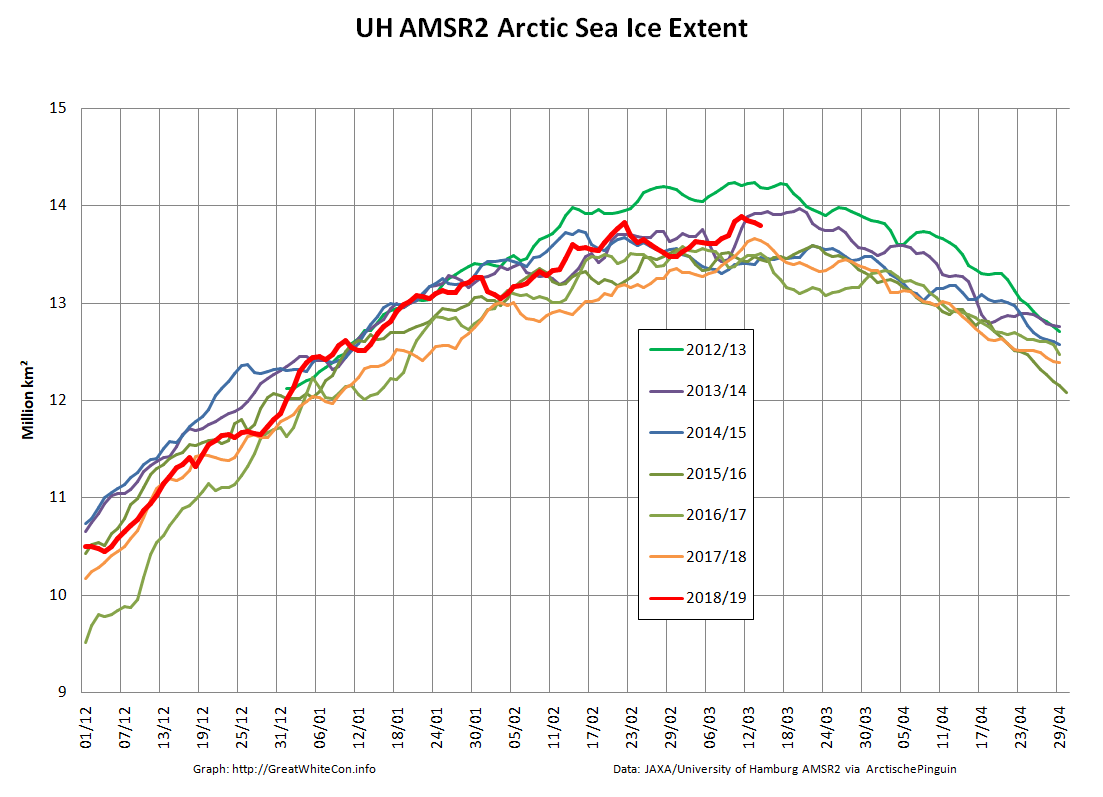
March 2019 has arrived, which in recent years has proved to be by far the likeliest month to contain the maximum extent of Arctic sea ice for the year. To begin with, here’s our favourite high resolution extent graph calculated by “Wipneus” from University of Hamburg/JAXA AMSR2 data:
Hopefully you can plainly see the pronounced sharp peak towards the end of February 2019? The current maximum Arctic sea ice extent for 2019 is 13.83 million square kilometers on February 22nd. Here’s Arctic sea ice area for good measure:
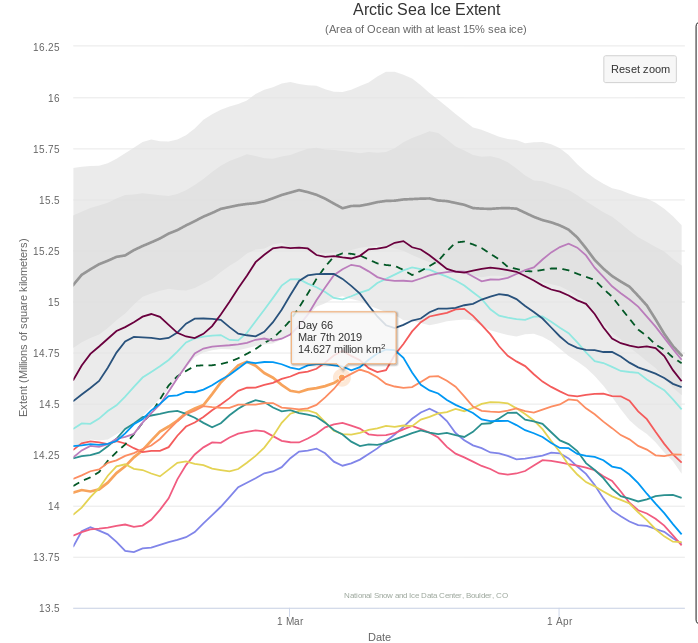
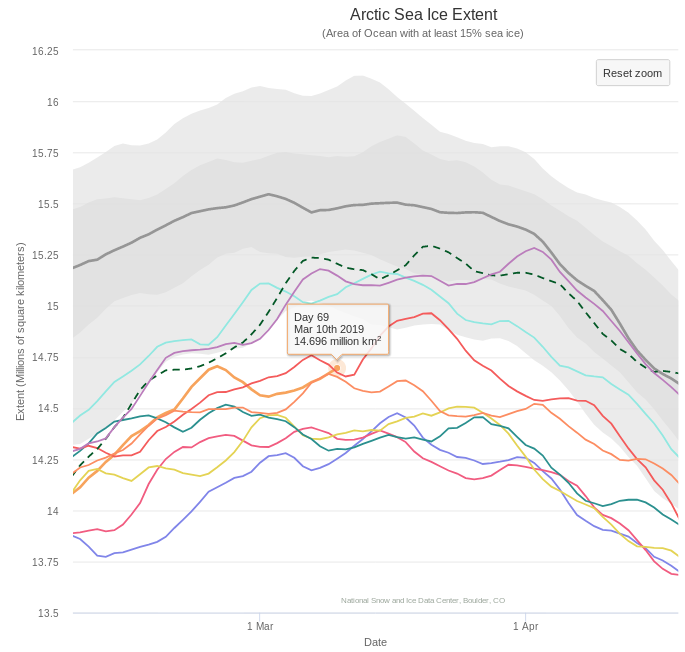
The current maximum area for 2019 is 13.10 million square kilometers, also on February 22nd. Here too is the NSIDC’s 5 day averaged extent:
This reveals a current maximum extent for 2019 of 14.705 million square kilometers on February 24th.
At this juncture you may well be wondering what the cause of that sudden sharp peak might be? Here’s your starter for ten:
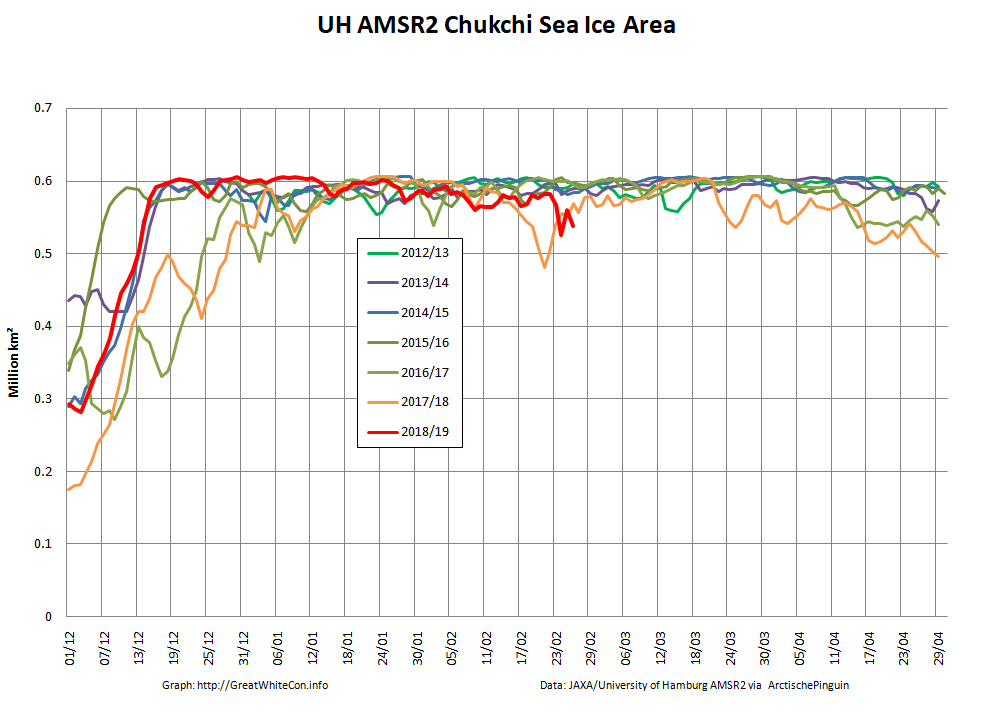
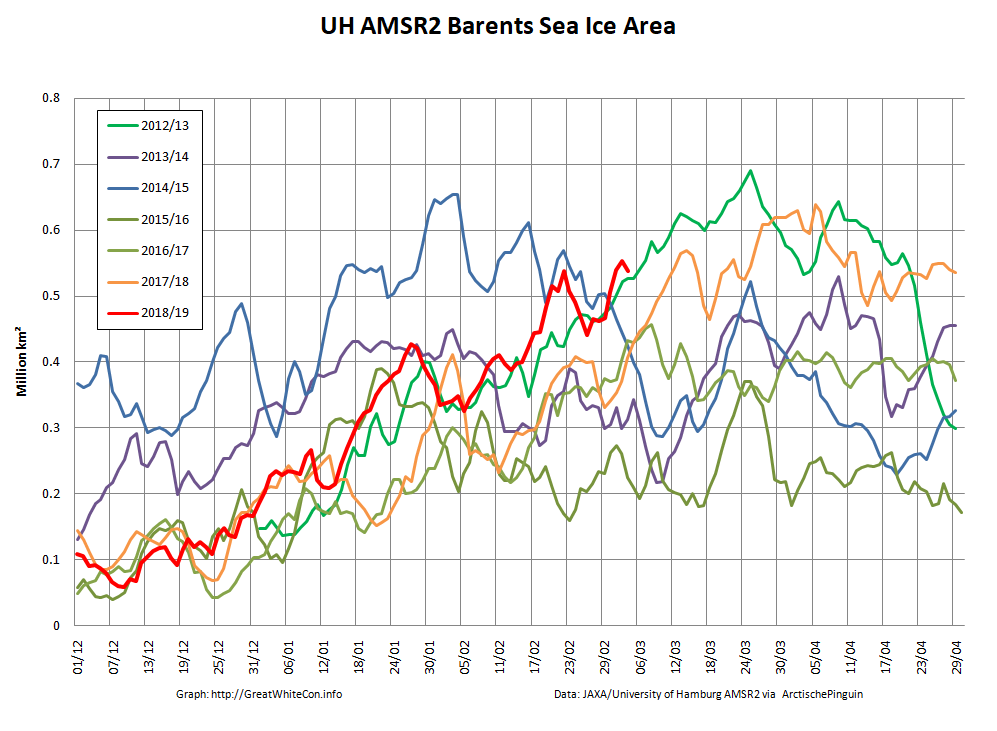
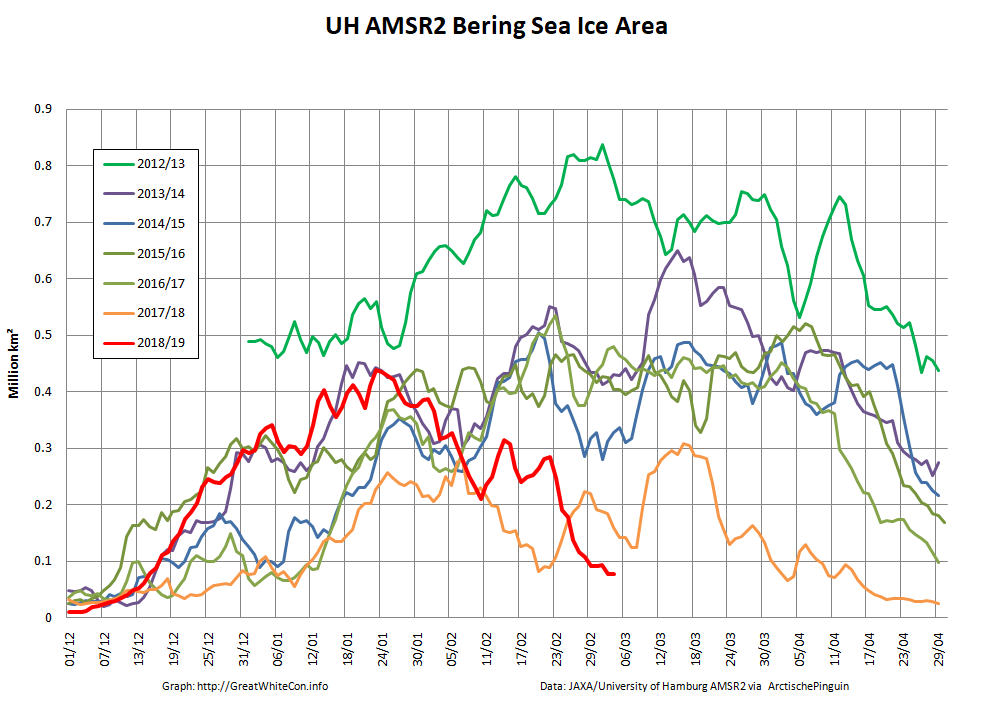
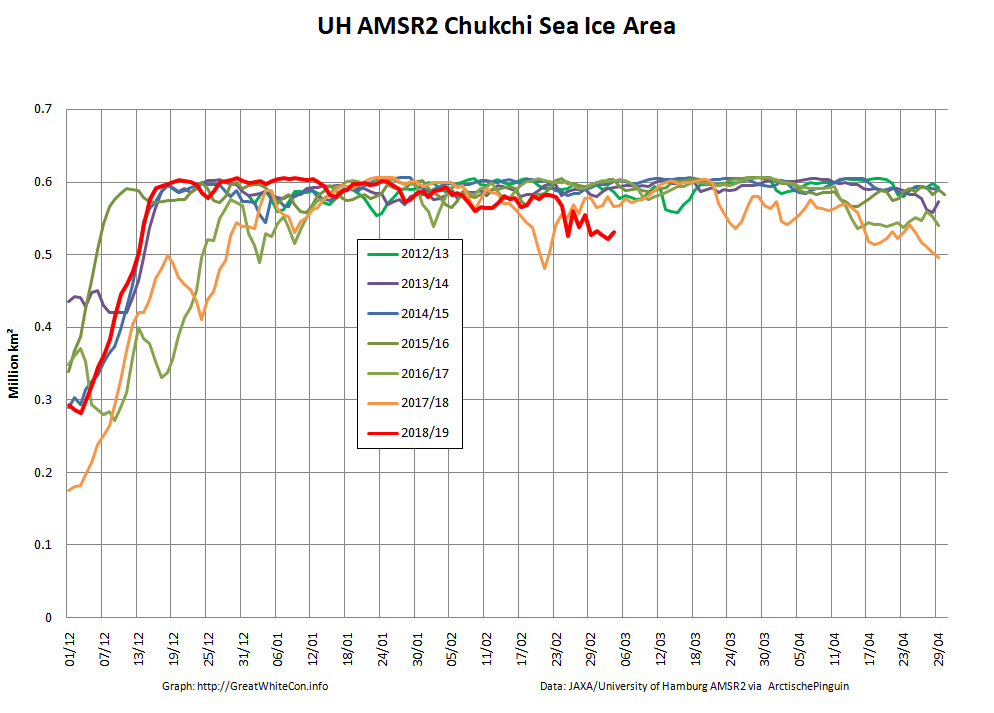
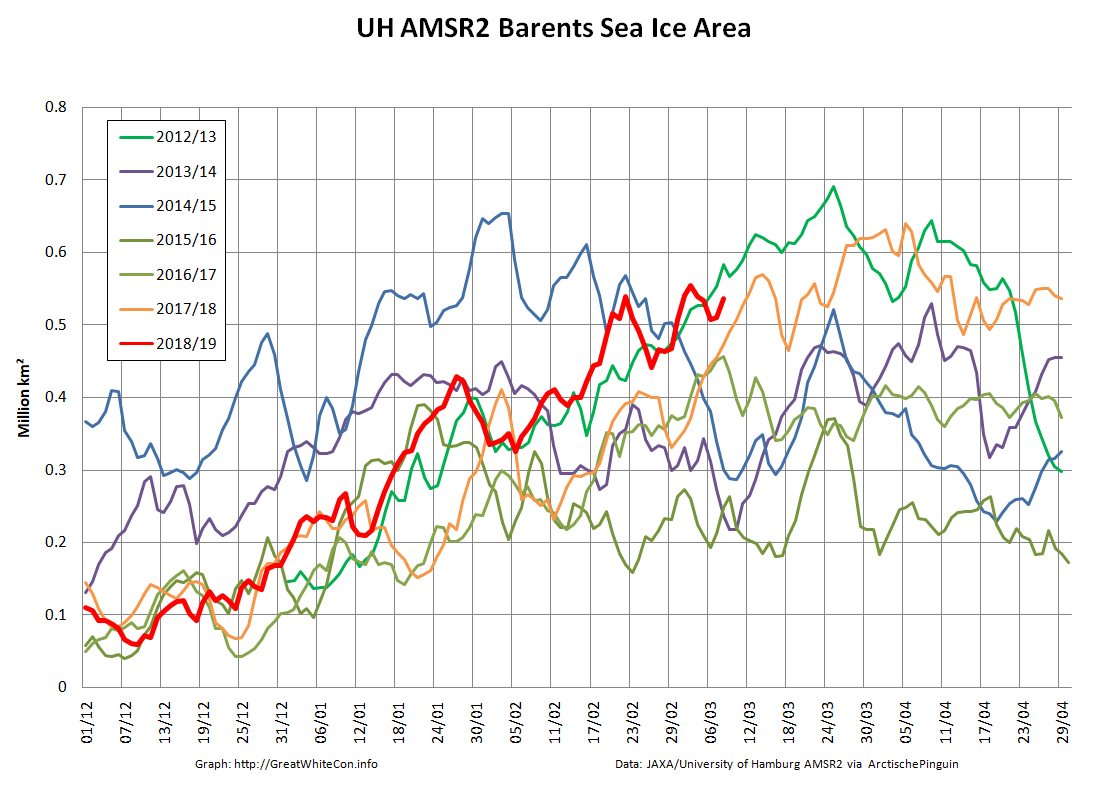
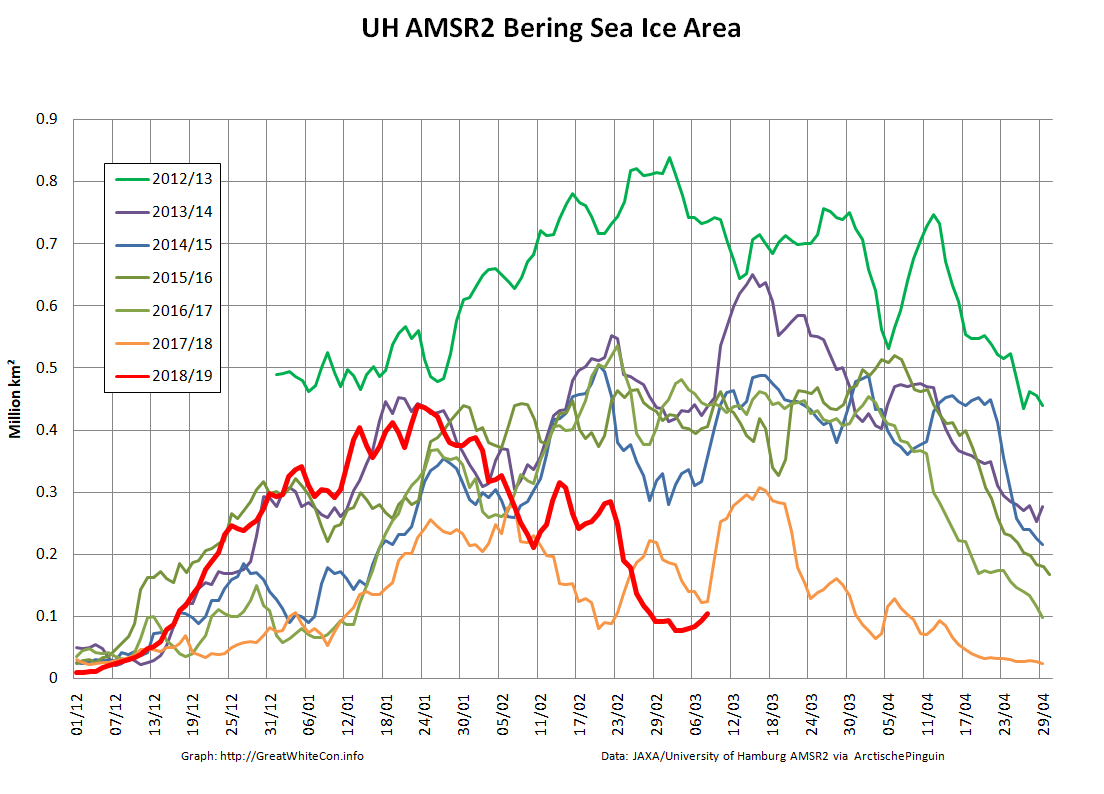
Whilst overall Arctic sea ice area is unremarkable for the current decade, sea ice area in the Bering Sea is remarkable low for the time of year! What’s more much like last year the Chukchi Sea is not currently full to overflowing with sea ice, and is also lowest for the date in the AMSR2 satellite records:
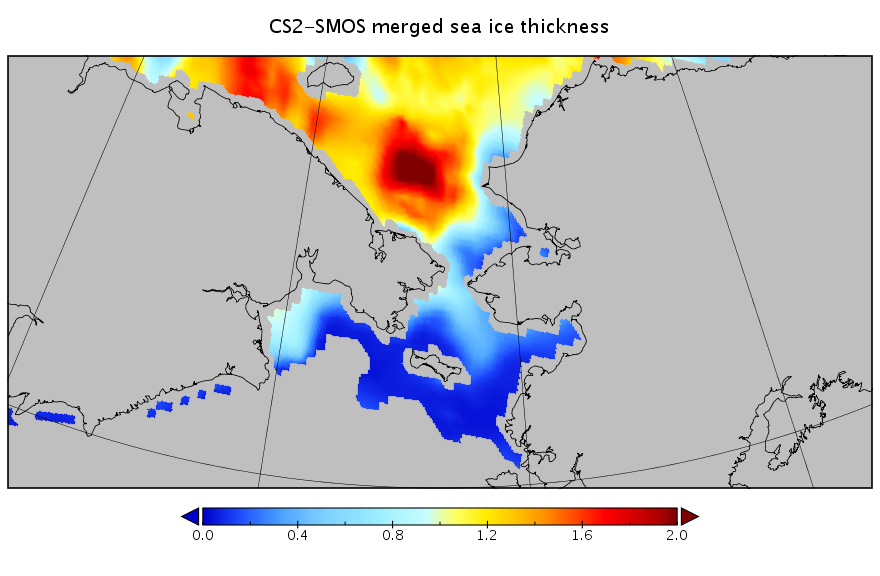
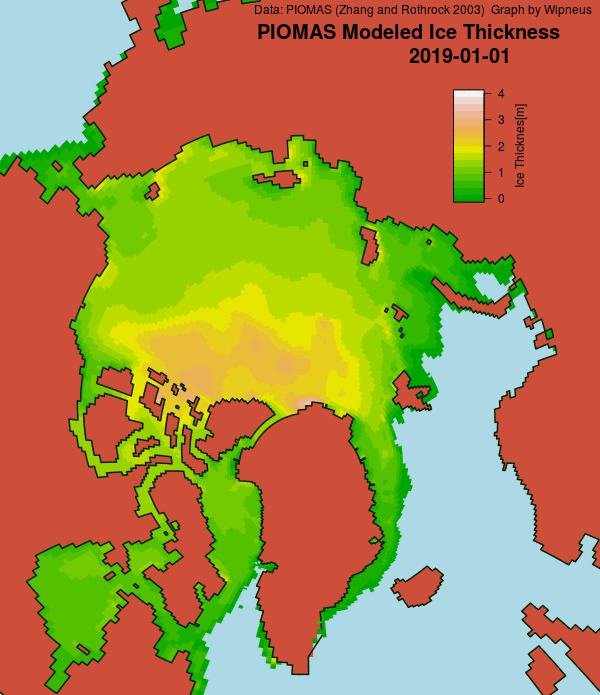
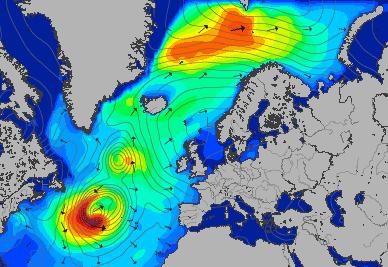
I’ve also been experimenting with the new gridded CryoSat-2/SMOS thickness data from the Finnish Meteorological Institute, which reveals this:
That’s a weekly overview dated February 24th, but it does perhaps explain how such a large area of sea ice could melt so swiftly?
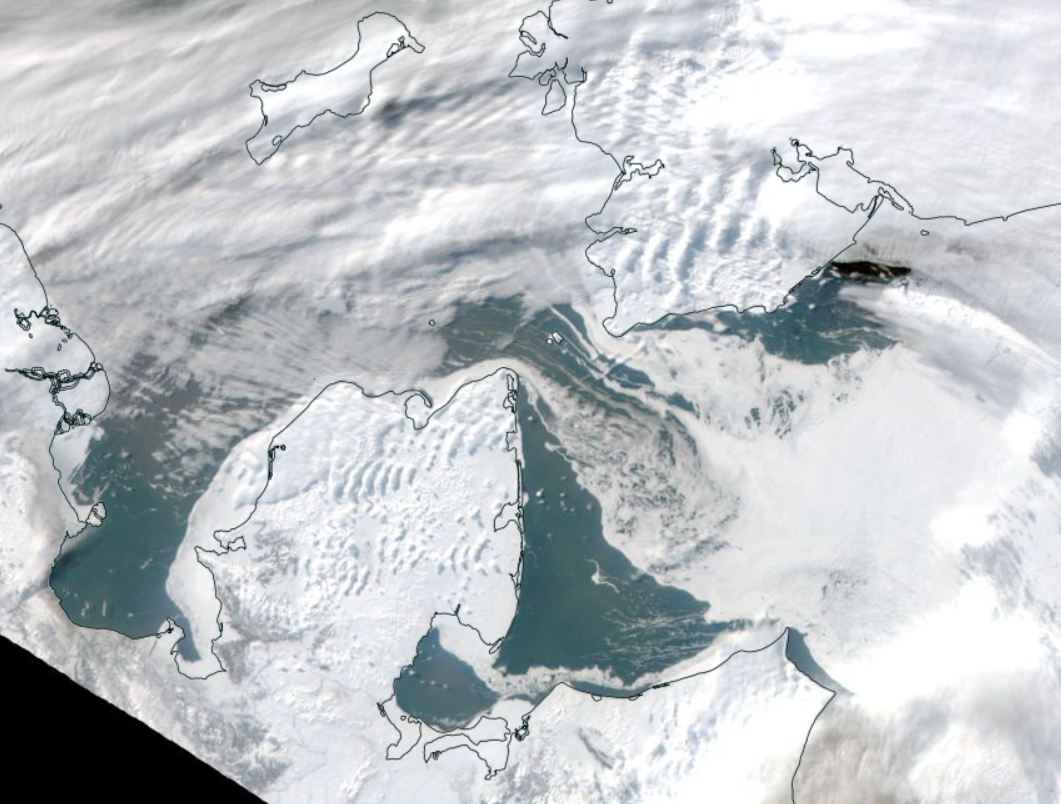
As luck would have it the skies are reasonably clear over the Bering Strait this morning (UTC). Here’s Terra’s view from on high of the current situation:
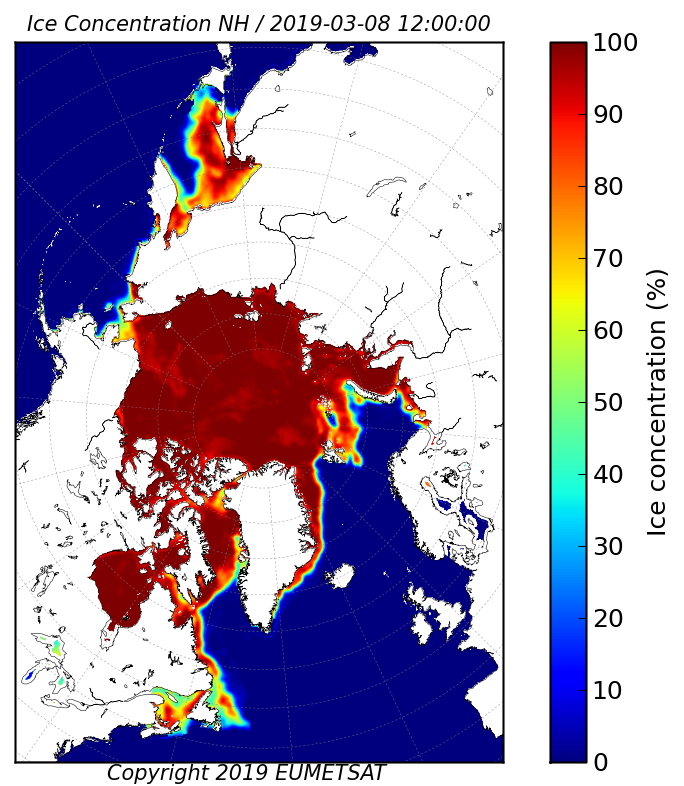
In addition, here is the underlying sea ice concentration data from the OSI-SAF:
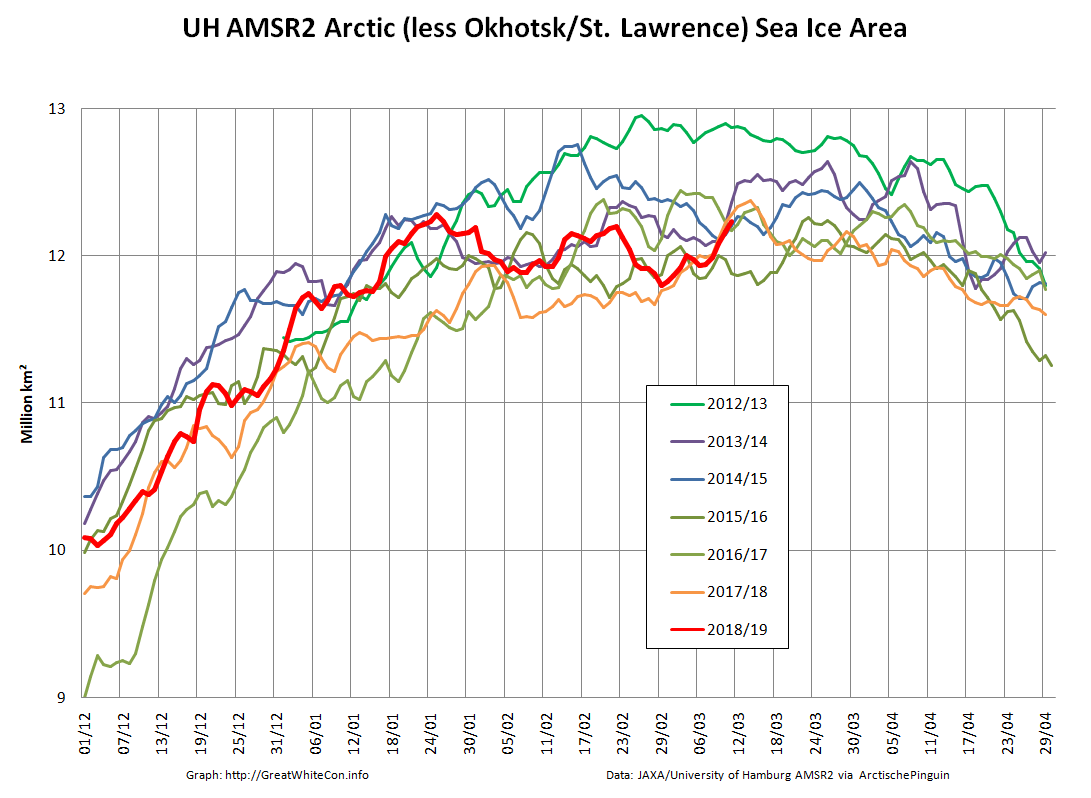
Since Michael is also asserting that there currently exists “the greatest February Arctic sea ice extent (according to DMI) in your blog’s history”, here’s Arctic sea ice area excluding the extremely peripheral Okhotsk and St. Lawrence regions:
P.S. Wipneus’ Pi has processed the AMSR2 data now, and area shows another, more modest, decline today:
Both area and extent are still moving inexorably upwards:
The late February maximum still holds, on the high resolution numbers at least. The JAXA/VISHOP web site is down at the moment, so we’ll have to wait for an update to that particular metric, as well as a post weekend update to the NSIDC’s Charctic chart.
P.S. Jaxa is still down this afternoon, but here’s the latest from the NSIDC:
[Edit – March 13th]
Arctic wide area and extent have blasted past their respective late February maxima:
However Arctic sea ice area excluding the Okhotsk and St. Lawrence peripheral regions has still not exceeded the maximum formed on January 25th:
[Edit – March 14th]
This morning’s data reveal the first decline in extent for several days:
The (extremely!) tentative new maximum Arctic sea ice extent for 2019 is 13.89 million square kilometers on March 12th.
[Edit – March 15th]
JAXA is back!
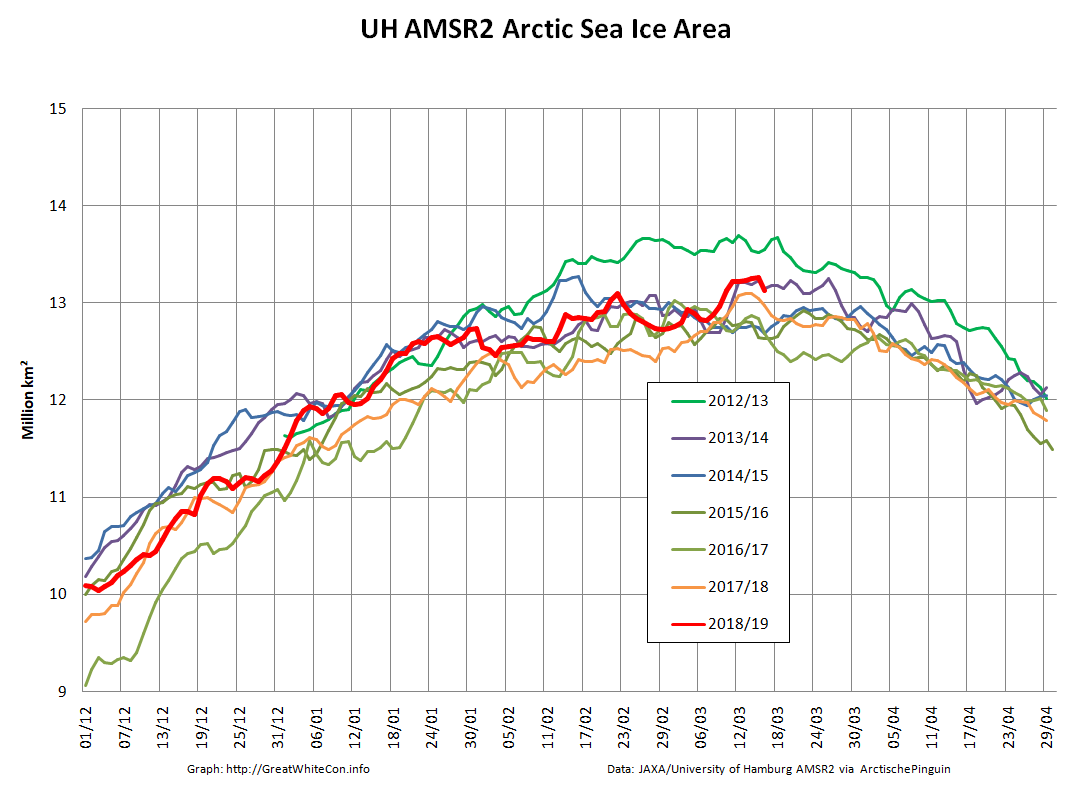
UH AMSR2 confirms that extent is still declining:
[Edit – March 16th]
Arctic sea ice extent continues to decline, whilst area is still flatlining:
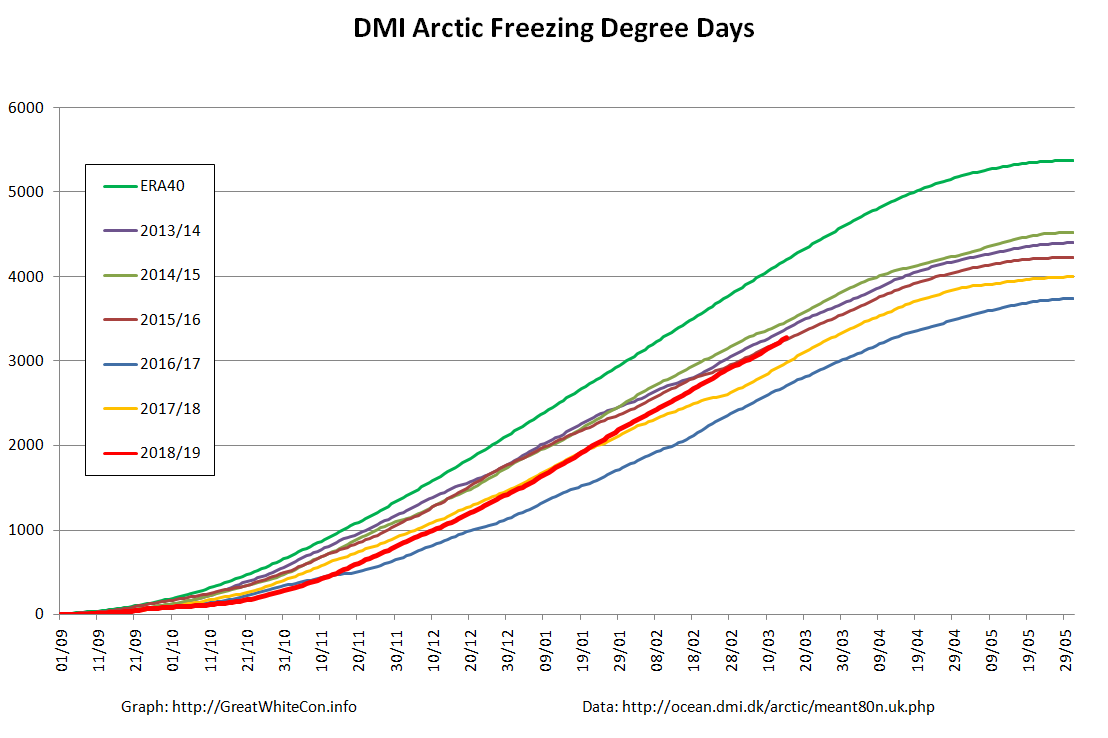
Meanwhile a look at freezing degree days based on the DMI’s dubiously weighted data for north of 80 degrees reveals the story of the freezing season. A historically warm start, but now back in amongst the pack of the 2010s:
[Edit – March 17th]
It looks as though there’ll be no going back from this. Arctic sea ice area is finally following extent’s decline in no uncertain terms:
Barring exceedingly unforeseen circumstances after this year’s “double top” that leaves the 2019 Arctic sea ice maximum extent numbers as follows:
UH/Wipneus AMSR2 – 13.89 million square kilometers on March 12th
JAXA/VISHOP AMSR2 – 14.27 million square kilometers on March 12th
NSIDC 5 day SSMIS – 14.78 million square kilometers on March 13th
[Edit – March 19th]
Arctic sea ice area has fallen off the proverbial cliff over the last few days. There can now be no doubt that the 2019 maximum extent has been reached:
That being the case, all other Arctic sea ice discussion for the month of March can now take place over at:
On March 13, 2019, Arctic sea ice likely reached its maximum extent for the year, at 14.78 million square kilometers (5.71 million square miles), the seventh lowest in the 40-year satellite record, tying with 2007. This year’s maximum extent is 860,000 square kilometers (332,000 square miles) below the 1981 to 2010 average maximum of 15.64 million square kilometers (6.04 million square miles) and 370,000 square kilometers (143,000 square miles) above the lowest maximum of 14.41 million square kilometers (5.56 million square miles) set on March 7, 2017. Prior to 2019, the four lowest maximum extents occurred from 2015 to 2018.
The date of the maximum this year, March 13, was very close to the 1981 to 2010 median date of March 12.
Please note this is a preliminary announcement of the sea ice maximum. At the beginning of April, NSIDC scientists will release a full analysis of winter conditions in the Arctic, along with monthly data for March.
Our old friend Tony Heller has been publishing a glorious Gish gallop of articles showing OSI-SAF Arctic sea ice type maps and claiming amongst other things:
A decade after declaring the end of Arctic multi-year sea ice, it has increased 116% and now covers nearly half of the Arctic.
That is of course not true. In actual fact it’s an “alternative fact” par excellence!
I have been endeavouring to point out to Tony the error of his ways for weeks now, but my words have wisdom have fallen on deaf ears. My graphic graphics have been viewed only by “snow blind” eyes. My incontrovertible arguments have been misapprehended by purpose built dumb and dumberer wetware illogic. By way of example, here’s a refreshingly ad hom free riposte from a typical commenter:
Jimmy Boy actually thinks his honesty and integrity are equally to that of Anthony Watts???
No doubt we’ll get around to discussing Anthony Watts “honesty and integrity” again soon, but for now let’s see if we can finally set this particular badly warped record straight shall we?
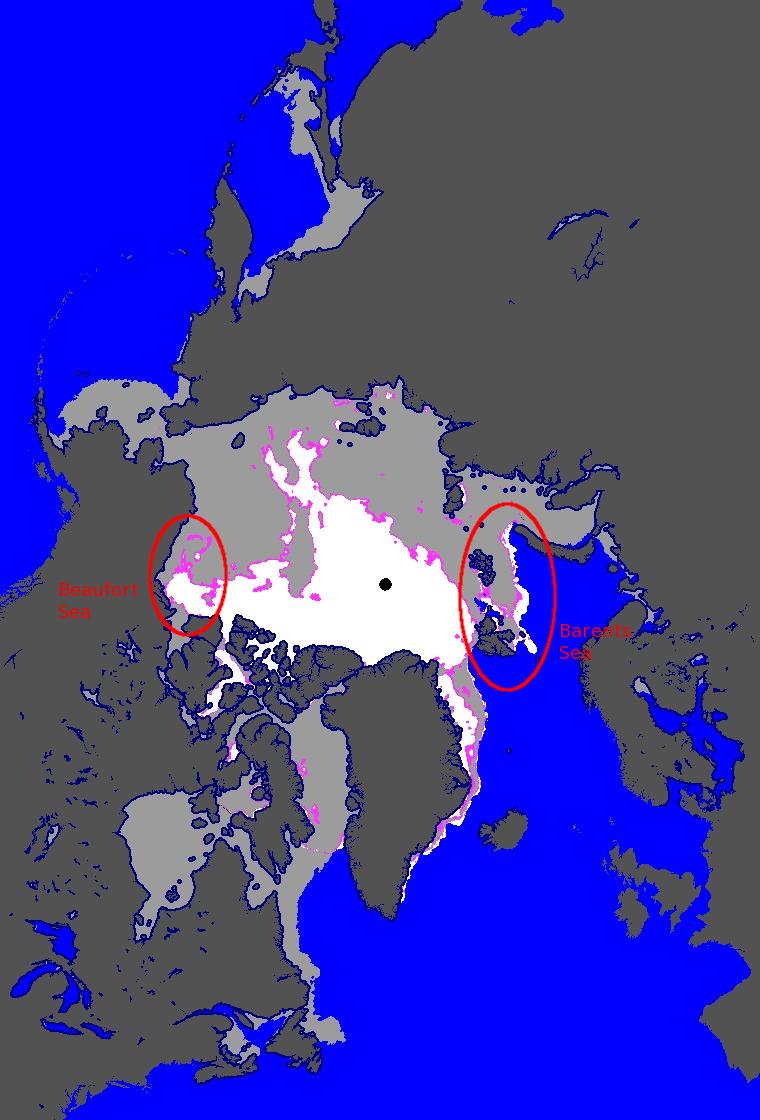
Here is the latest OSI-SAF ice type map, for March 16th 2017:
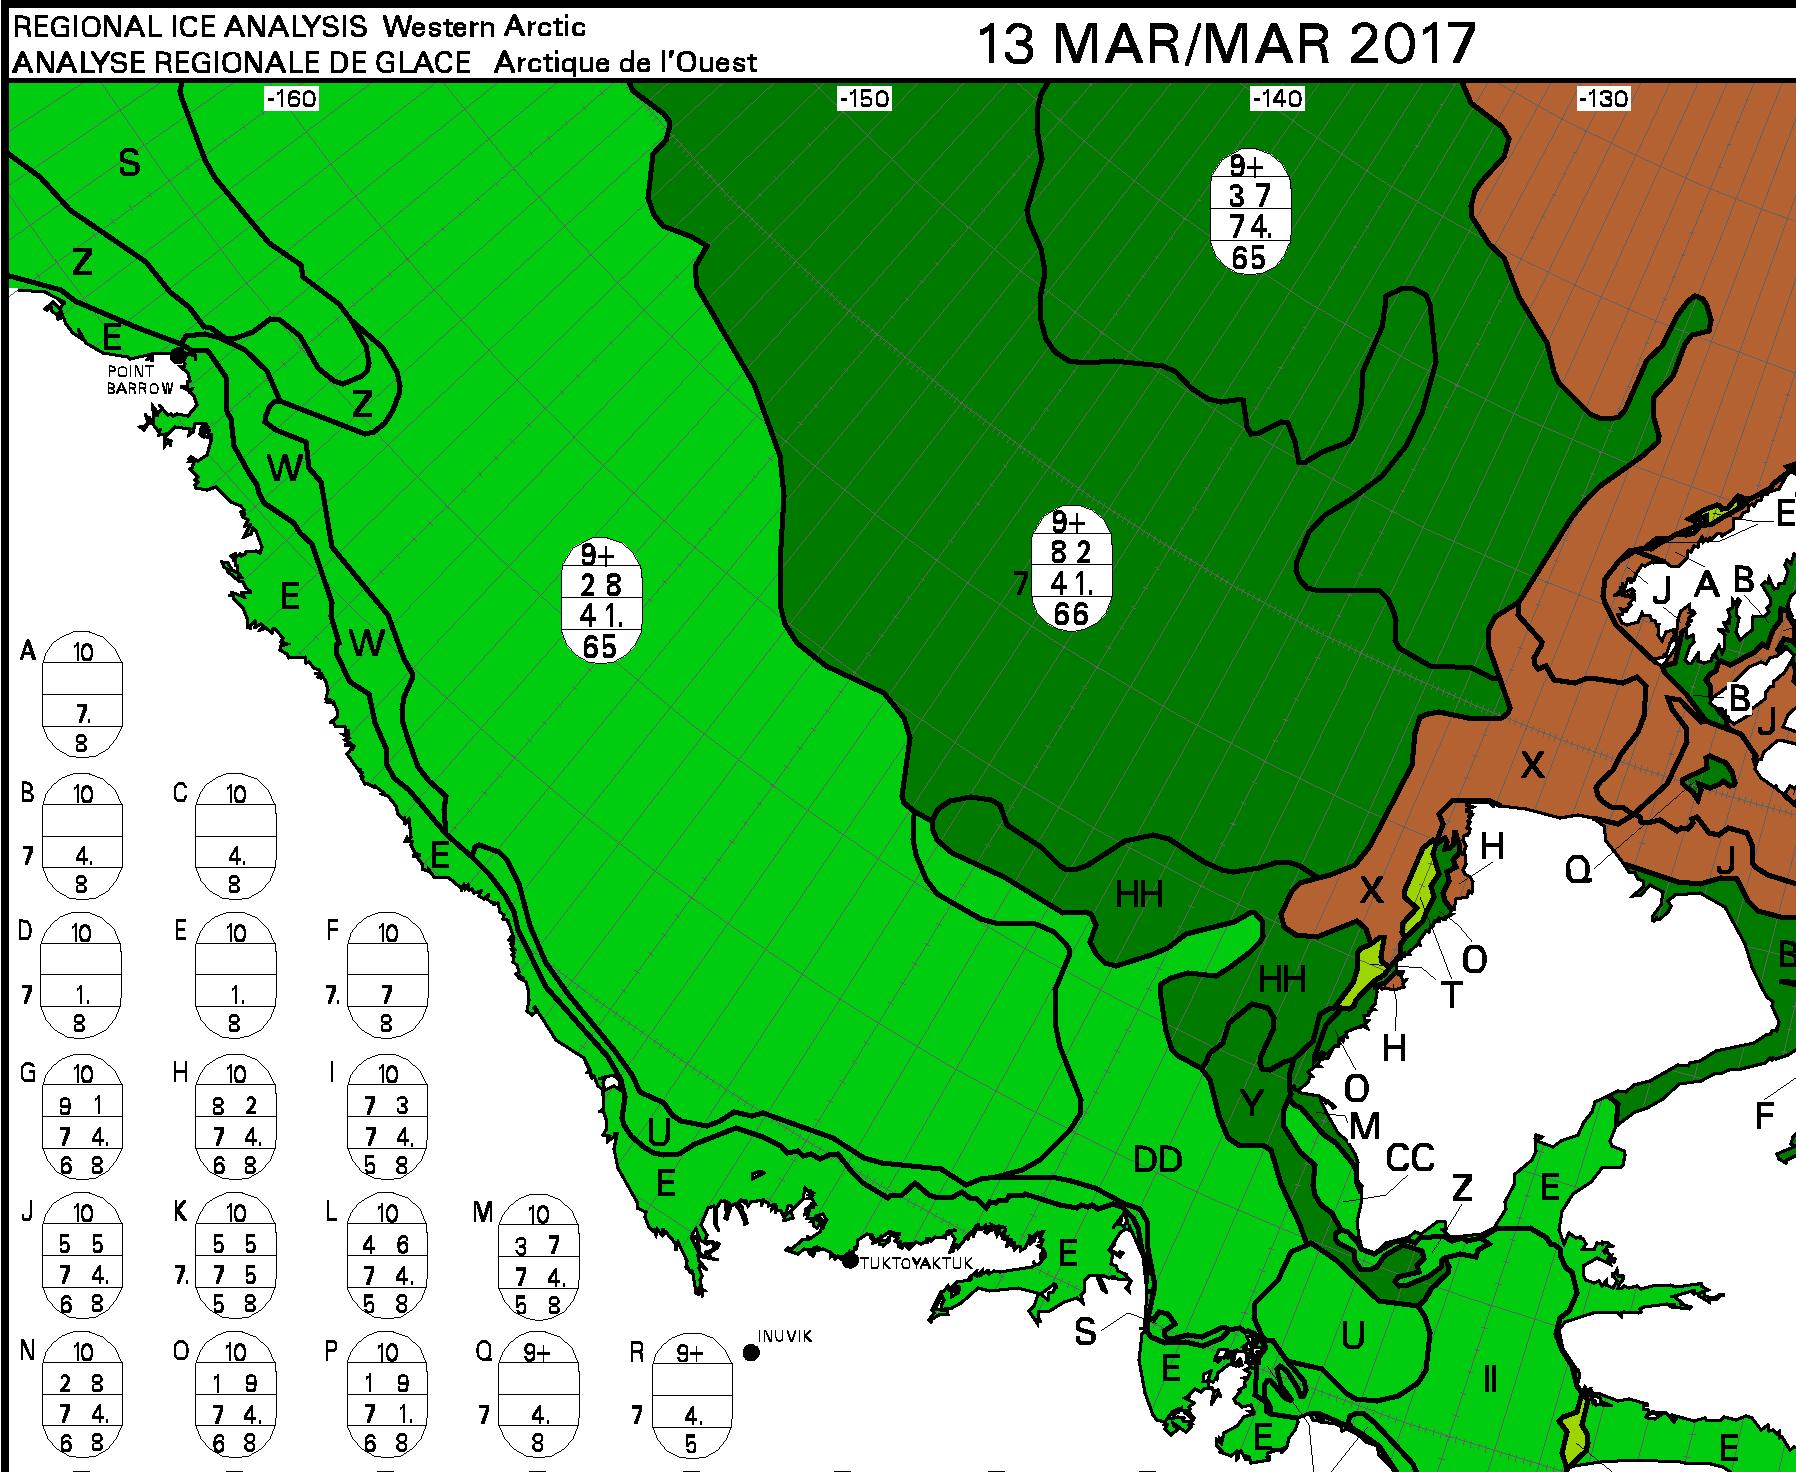
The highlighted area on the left is the Beaufort Sea to the north of Canada. If you’re not “snow blind” you can no doubt readily perceive a large area of allegedly “multi-year sea ice” coloured white. Let’s now take a look at the most recent Canadian Ice Service map of the same area, for March 13th 2017:
Canadian Ice Service sea ice stage of development on March 13th 2017
Can you see a large area of brown “old ice” covering most of the surface of the Beaufort Sea?
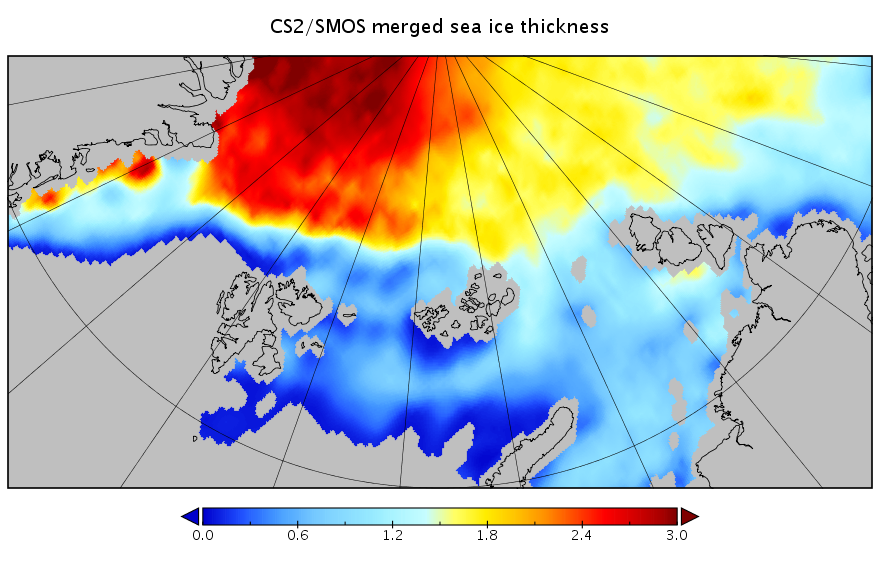
Now let’s take a look on the other side of the Arctic at the area north of the Barents Sea. Can you see a large area of allegedly “multi-year sea ice” coloured white inside the red ellipse on the OSI-SAF map? Next let’s take a look at the most recent University of Bremen SMOS map of the Arctic, for March 15th 2017:
On this map the brightly coloured areas show sea ice that’s less than 50 cm thick. Even when two people explain this point slowly to them the “deplorable denizens” at Mr. Heller’s blog do not manage to get the message! So now let’s look at a closeup comparison between the OSI-SAF ice type map and the University of Bremen SMOS sea ice thickness map:
As I popped the question to the deplorable denizens over on Tony Heller’s Deplorable Climate Science blog:
For anybody else here who isn’t deaf, dumb and blind, please note all the young, thin sea ice around Svalbard identified by SMOS that OSI-SAF currently classifies as “multi-year” ice.
At the risk of (repeating myself)^n, n → ∞:
Why do Tony, Tommy and Andy persist with this nonsense?
Skeptical sorts across the cryoblogosphere are in meltdown mode at the moment. They seem to be unaware that satellites don’t last forever in the harsh environment of space, and the individual scientific instruments carried by a satellite don’t either. Some failures are more spectacular than others however. By way of illustration here’s one recent report from Space.com:
The February [2015] explosion of an American military satellite may cause some problems for orbiting spacecraft after all, a new study reports.
The U.S. Air Force’s 20-year-old Defense Meteorological Satellite Program Flight 13 (DMSP-F13) craft blew apart on Feb. 3 after experiencing a power-system faillure. Analyses by the European Space Agency and other organizations found that the cloud of space junk generated by the explosion shouldn’t pose much of a threat to their missions, but the new research suggests that not all spacecraft are in the clear.
Another DMSP satellite started pushing up the metaphorical daisies earlier this year. Last month Space Flight Now reported that:
The U.S. Air Force has been unable to send commands to the service’s newest weather satellite for nearly a month, and engineers are trying to determine if the spacecraft can be salvaged, officials said last week.
The polar-orbiting Defense Meteorological Satellite Program Flight 19, or DMSP F19, spacecraft stopped responding to orders from the ground Feb. 11, the Air Force said in a March 3 press release.
“At this time, it is not known what caused the anomaly or if the satellite will be recovered, and the anomaly is under investigation,” the Air Force said. “There are no other known issues with the satellite.”
Designed for a five-year service life, DMSP F19 launched April 3, 2014, from California atop a United Launch Alliance Atlas 5 rocket. It is the newest in the Air Force’s series of DMSP weather observatories designed to help forecasters predict storms, clouds, fog and dust storms that could inhibit global military operations.
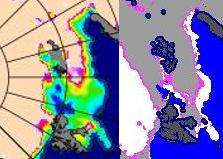
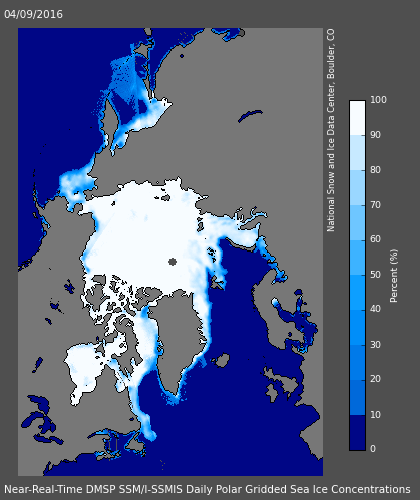
The data provided by the Special Sensor Microwave Imager/Sounder (SSMIS) instrument carried aboard several of the DMSP series of satellites is used by the National Snow and Ice Data Center to calculate their Sea Ice Index metric of Arctic sea ice extent. However suddenly Boulder has a problem. As we reported earlier this week the SSMIS sensor carried by DMSP F17 appears to be malfunctioning. This can be seen in this visualisation of the data from the European Ocean and Sea Ice Satellite Application Facility(OSI-SAF):
Look closely at the top centre of the image to see a large patch of spurious “sea ice”. Here’s the resulting SII extent graph from the NSIDC:
Anthony Watts reported this news in typically fanciful fashion:
There is this small notice on the NSIDC page:
“The daily sea ice extent images are currently displaying erroneous data. NSIDC is investigating.”
It looks to be a problem with the DMSP F17 satellite.
Makes you wonder how long this has been going on and if the anomalously low readings we’ve seen for awhile are due to a slow sensor degradation.
Time will tell.
For a more realistic interpretation of the facts we suggest that instead of reading the propaganda perpetrated at WUWT you instead examine this graph derived using data from the AMSR2 sensor on board the Japanese SHIZUKU satellite:
Mr. Watts evidently takes a very US centric view of these matters, since he neglected to report this timely news bulletin from the OSI-SAF:
Due to the previously reported problems with one of the channels on SSMIS onboard DMSP F17, OSI SAF is now working on replacing DMSP F17 with DMSP F18 in our sea ice products.
Currently, the switch to F18 has been implemented for the ice concentration product (OSI-401). The product dated 20160410 has been reprocessed and is available on our FTP server, ftp://osisaf.met.no/prod/ice/conc/ and ftp://osisaf.met.no/archive/ice/conc/2016/04
The ice edge and type products (OSI-402 and OSI-403) will be updated to use F18 tomorrow, 2016-04-12.
It seems Willis Eschenbach, the current Watts Up With That resident sea ice expert, is already beavering away endeavouring to prove Anthony’s case for him:
We have no way to know if this has been a gradual decrease followed by a failure, so yes, it’s certainly possible that the previous data is bad. Doesn’t mean it is, but we’d be fools not to check.
We suggested a simple check:
Why not compare the NSIDC’s SSMIS data from F-17 with JAXA’s AMSR2 data from Shizuku? Wouldn’t that do the trick?
Willis replied:
I meant that just from the bad reading alone, we don’t know if the previous data is bad. Yes, we can check it in the way you suggest and other ways … which is why I said we’d be fools not to check.
We think that if he does his due diligence he will find that he is in actual fact engaged on a fool’s errand, but time will indeed tell. Let’s wait and see what Willis n Willard can come up with, shall we? Meanwhile we also cannot help but wonder what the dynamic duo might make of our own due diligence replicating the results of another collaboration of theirs:
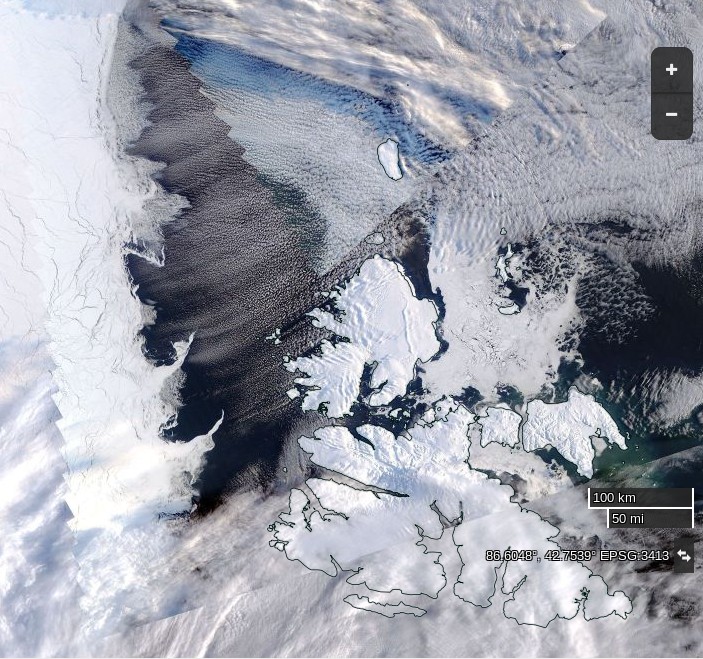
At the turn of the year we speculated about the potential effect of high temperatures and the swells caused by strong winds on sea ice in the Fram Strait and Barents and Greenland Seas. With the vernal equinox rapidly approaching let’s take stock of the state of Svalbard sea ice. Here’s one the first “visual” satellite images of the area in 2016 recorded yesterday by the Aqua satellite:
NASA Worldview “true-color” image of the Central Arctic north of Svalbard on March 14th 2016, derived from the MODIS sensor on the Aqua satellite
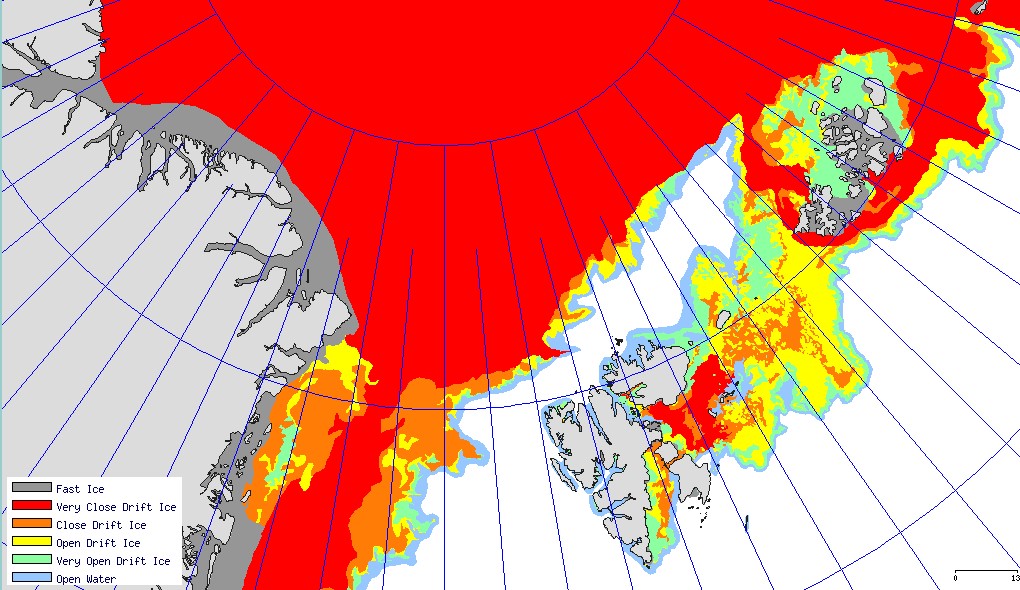
and here is the equivalent sea ice map from the Norwegian Meteorological Institute:
Both sources reveal an unseasonable lack of solid sea ice around Svalbard. In fact an intrepid Northwest Passage navigator who didn’t mind the dark might well currently be able to circumnavigate Svalbard!
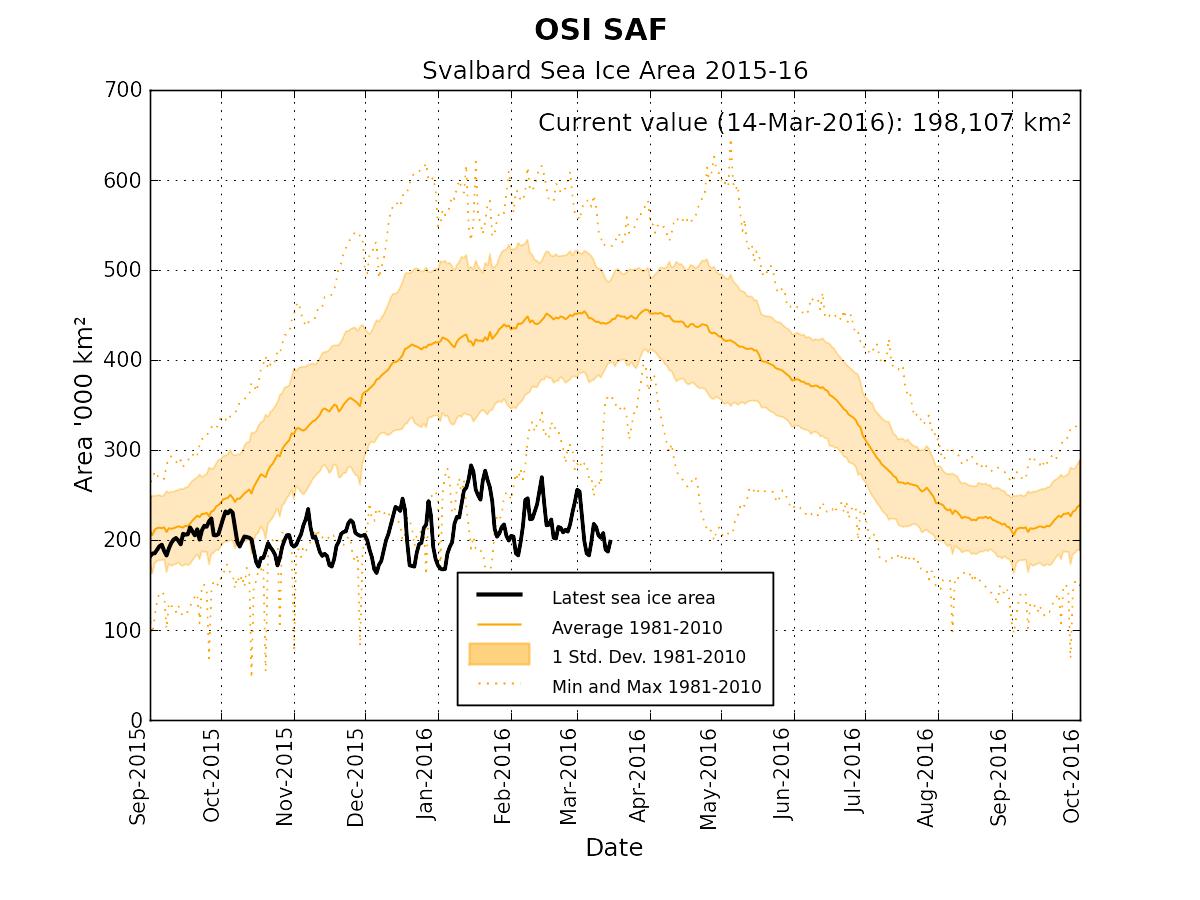
The Norwegian Meteorological Institute also produce a time series of sea ice area in the Svalbard region based on data from OSI-SAF. It currently looks like this:
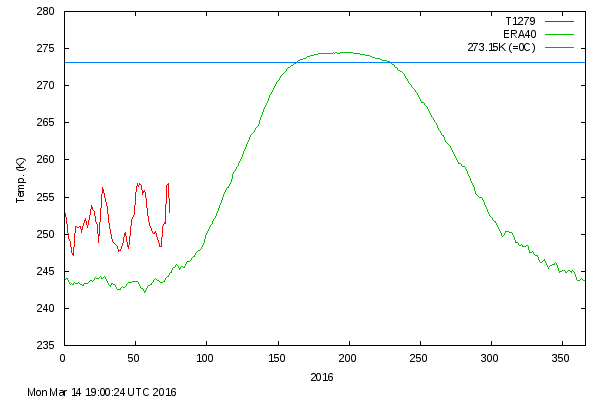
As sunlight returns to the Central Arctic north of 80 degrees there is an anomalously large area of open water ready to soak up the rays. Here is what the Danish Meteorological Institute timeseries of Central Arctic temperatures looks like at the moment:
and here is the current Svalbard surf forecast from Magic Seaweed:
Whilst we speculate on what all this might mean for the Atlantic side of the Arctic over the coming melting season, here’s our new Svalbard Sea Ice page which contains a variety of graphs and maps to help us keep track of events on that part of our planet.
This website uses cookies to improve your experience. We'll assume you're ok with this, but you can opt-out if you wish. Cookie settingsACCEPT
Privacy & Cookies Policy
Privacy Overview
This website uses cookies to improve your experience while you navigate through the website. Out of these, the cookies that are categorized as necessary are stored on your browser as they are essential for the working of basic functionalities of the website. We also use third-party cookies that help us analyze and understand how you use this website. These cookies will be stored in your browser only with your consent. You also have the option to opt-out of these cookies. But opting out of some of these cookies may affect your browsing experience.
Necessary cookies are absolutely essential for the website to function properly. This category only includes cookies that ensures basic functionalities and security features of the website. These cookies do not store any personal information.
Any cookies that may not be particularly necessary for the website to function and is used specifically to collect user personal data via analytics, ads, other embedded contents are termed as non-necessary cookies. It is mandatory to procure user consent prior to running these cookies on your website.