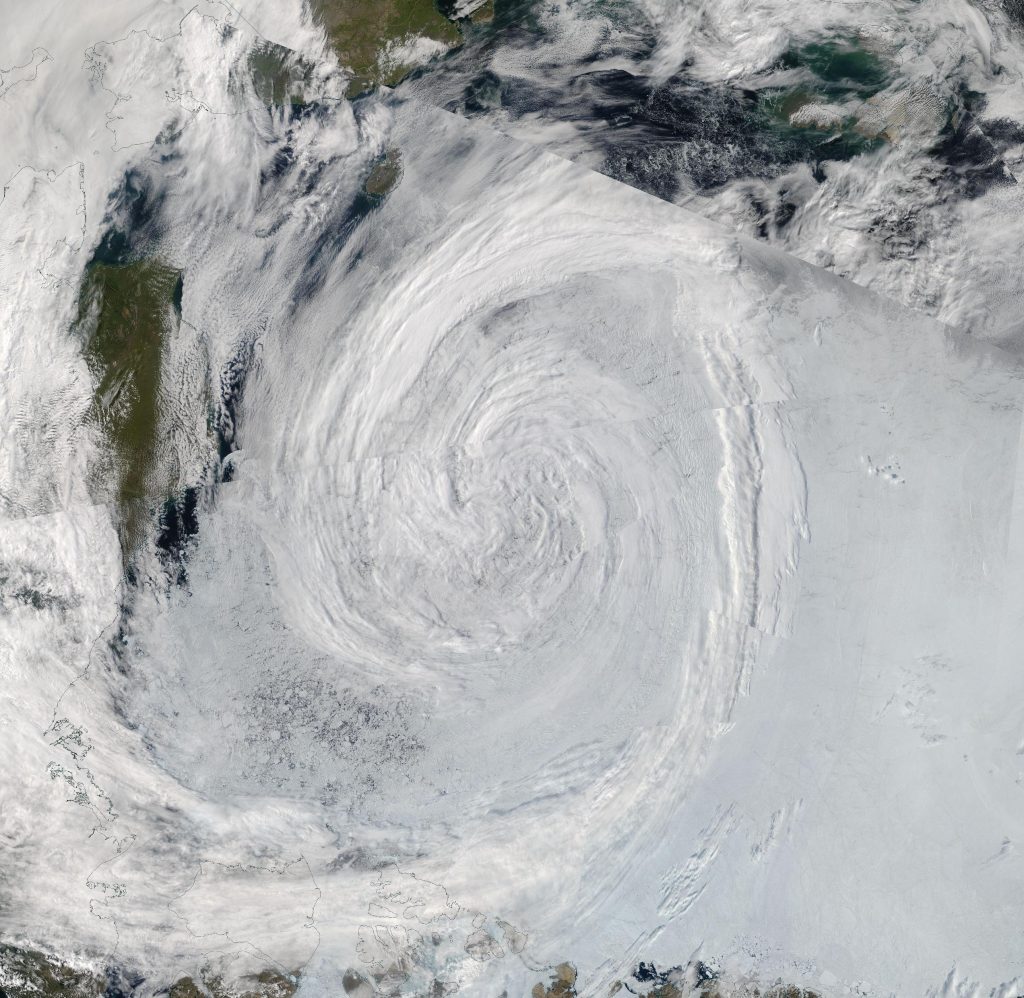
2021 has been and gone, so first of all may I wish all our readers a very Happy New Year.
Sadly it’s not been a happy start to 2022 for the inhabitants of Boulder, Colorado, home of the National Snow and Ice Data Center. According to the Denver Post:
The Marshall fire destroyed an estimated 991 homes in Boulder County, damaged 127 more and may have killed three people, Sheriff Joe Pelle said Saturday afternoon.
Pelle added that the cause of the fire — the most damaging in Colorado history — remains under investigation, and confirmed that sheriff’s officials have served a search warrant on at least one property based on a tip.
Currently, two people are missing in Superior and another is missing in the Marshall area, Pelle said. All three are feared dead as each of their homes was lost to the fire, the sheriff said…
So far, officials say Thursday’s wildfire — exacerbated by 100-mph winds — burned more than 6,000 acres across Boulder County.
The fire destroyed 553 homes in Louisville, damaging 45, Pelle said Saturday. It also destroyed 332 homes in Superior, damaging 60 in that town, and destroyed 106 homes in unincorporated Boulder County, damaging 22…
Officials first thought downed power lines sparked the fire, but have been unable to confirm its origin. The abnormally dry conditions led to what is now the most destructive wildfire in Colorado history.
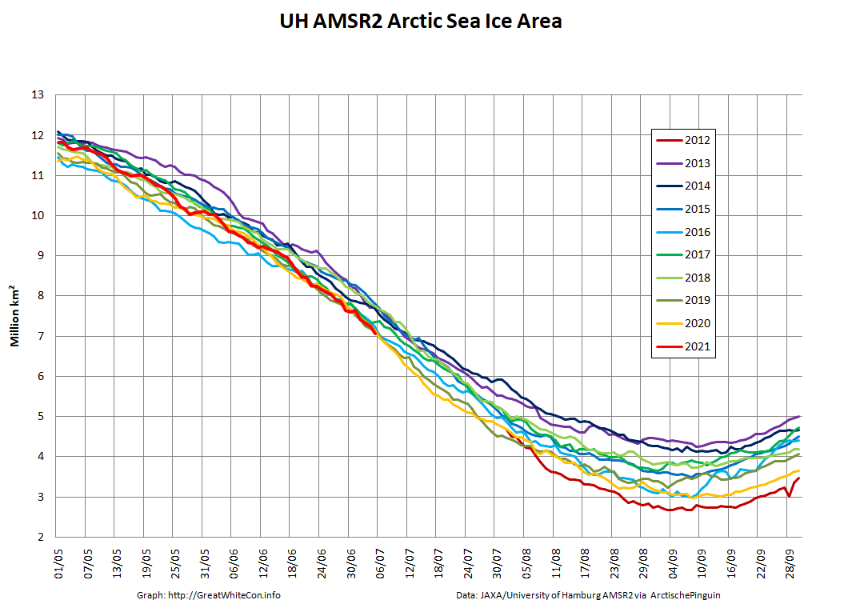
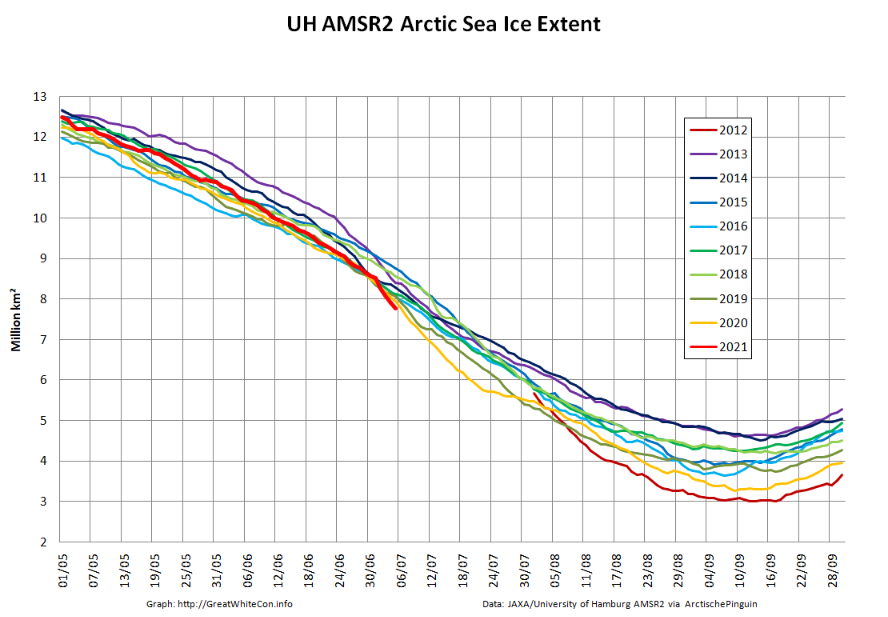
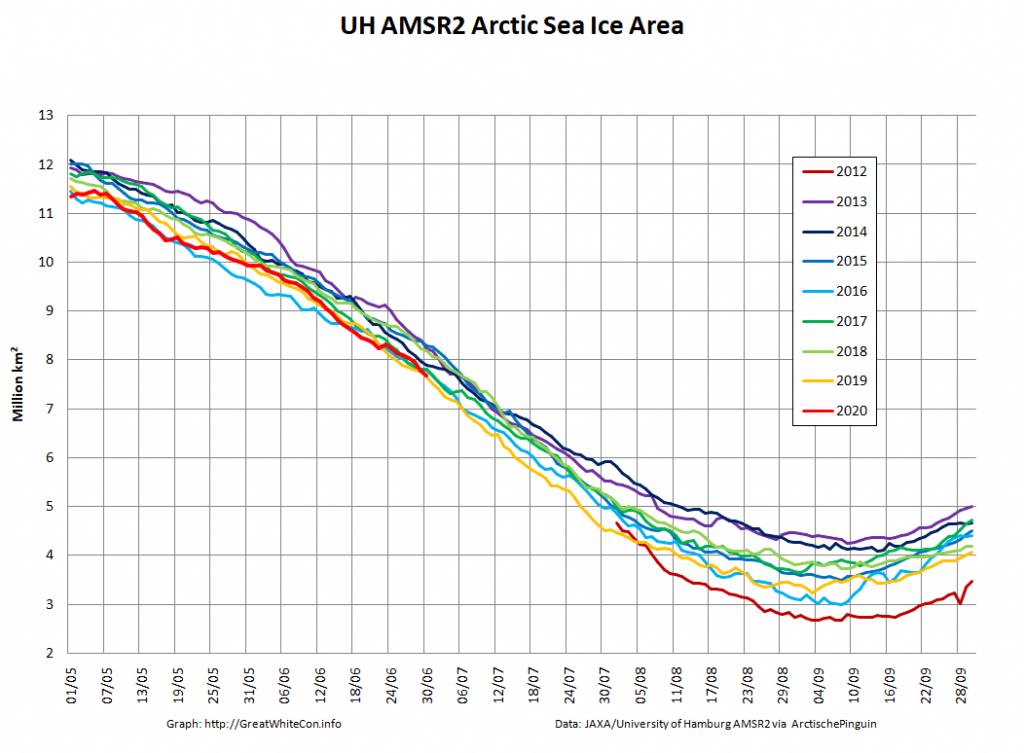
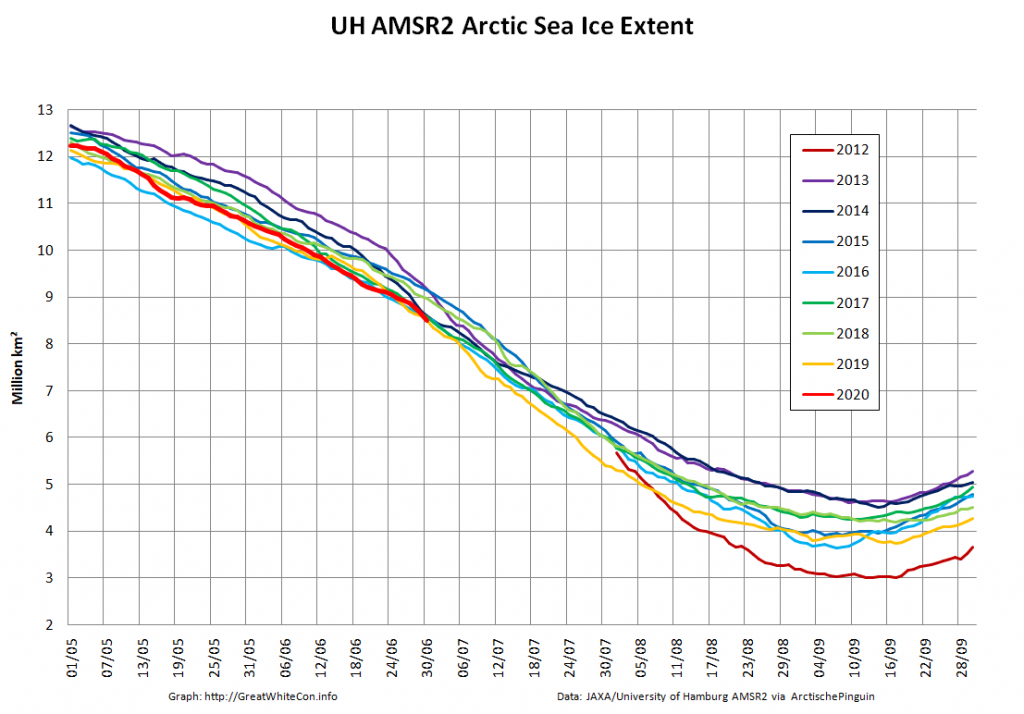
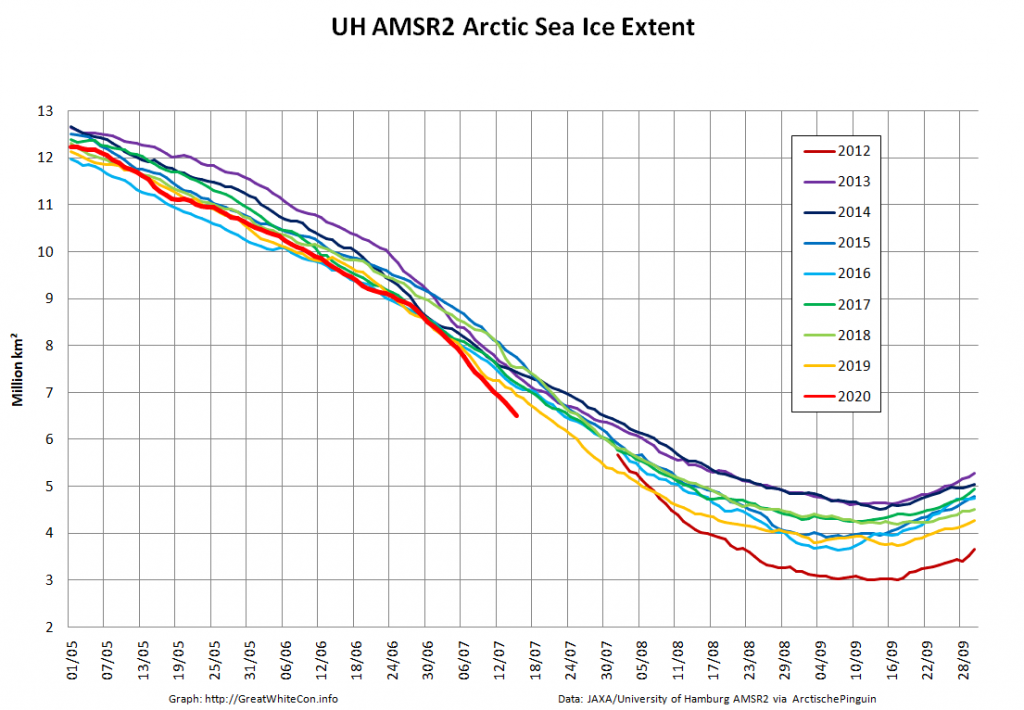
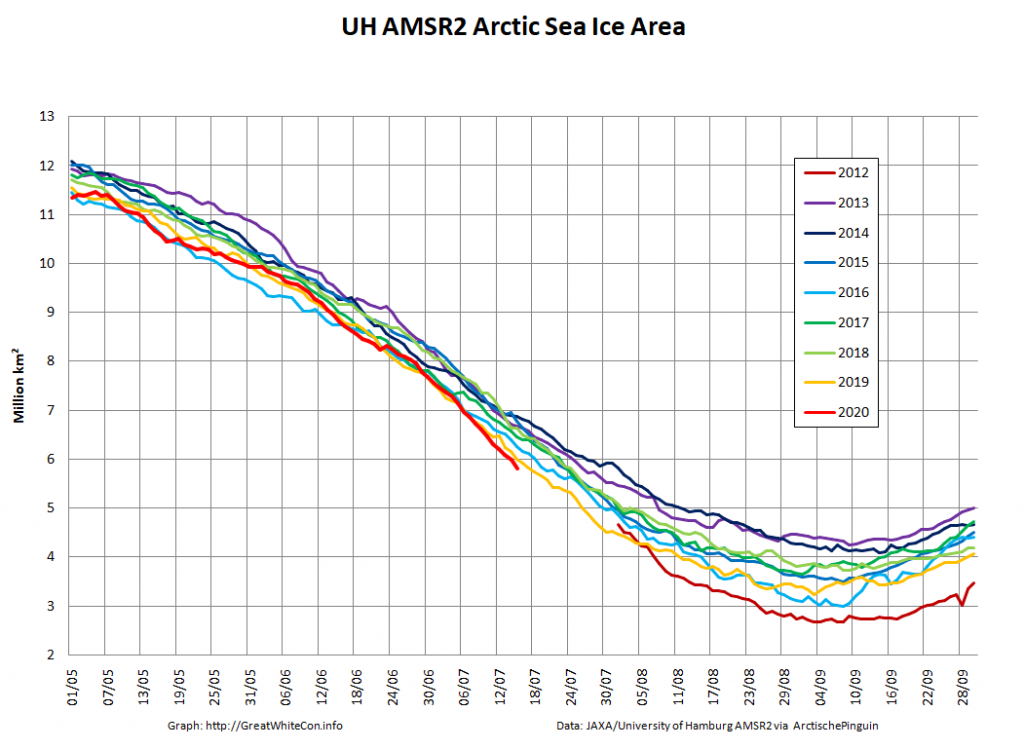
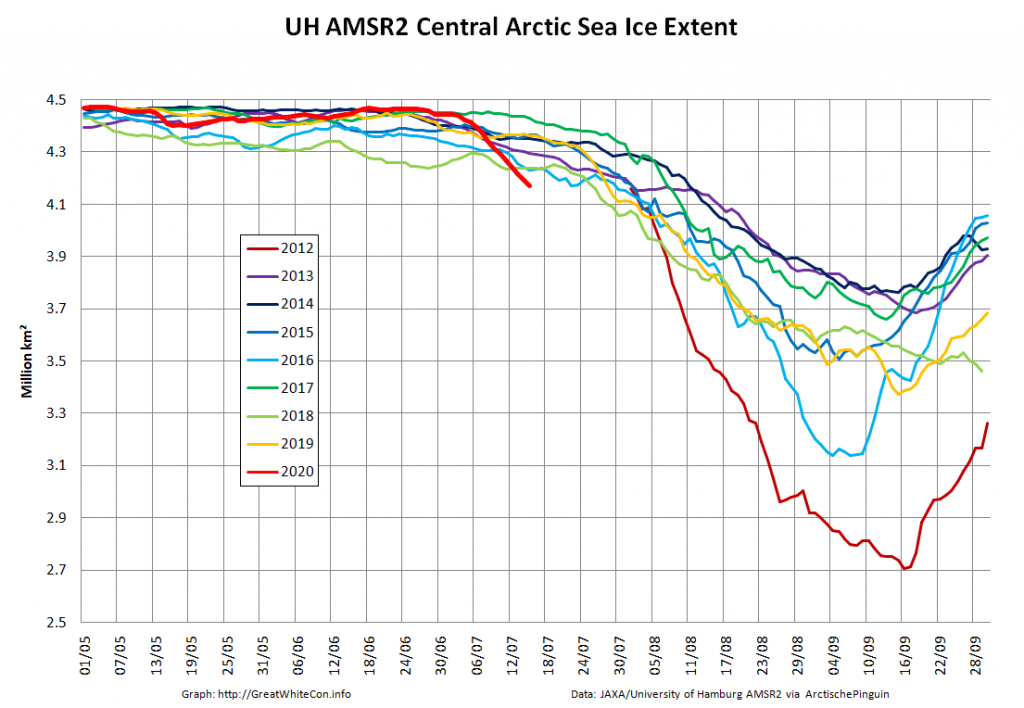
Moving north to examine snow and ice data from the Arctic, let’s start 2022 in traditional fashion with a look at high resolution AMSR2 area and extent:
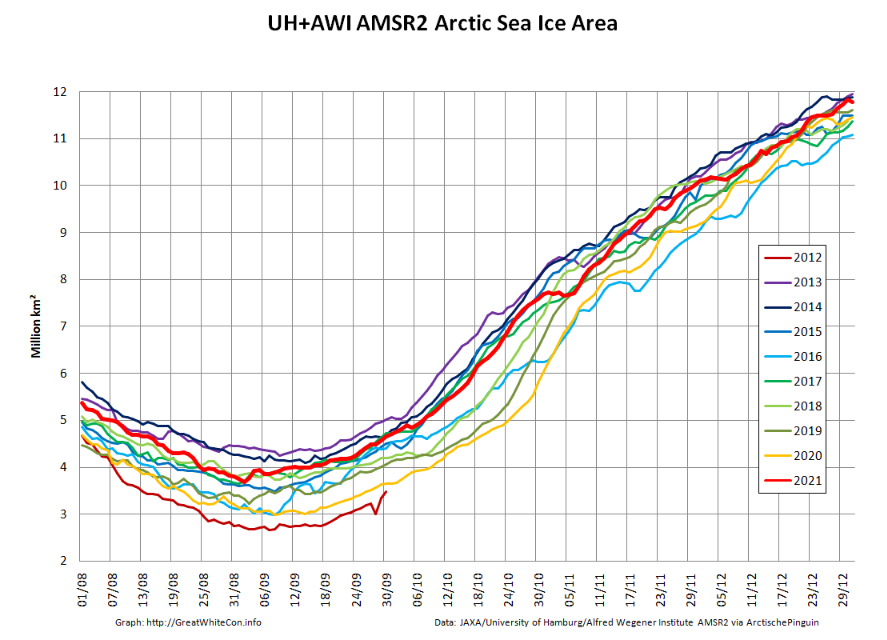
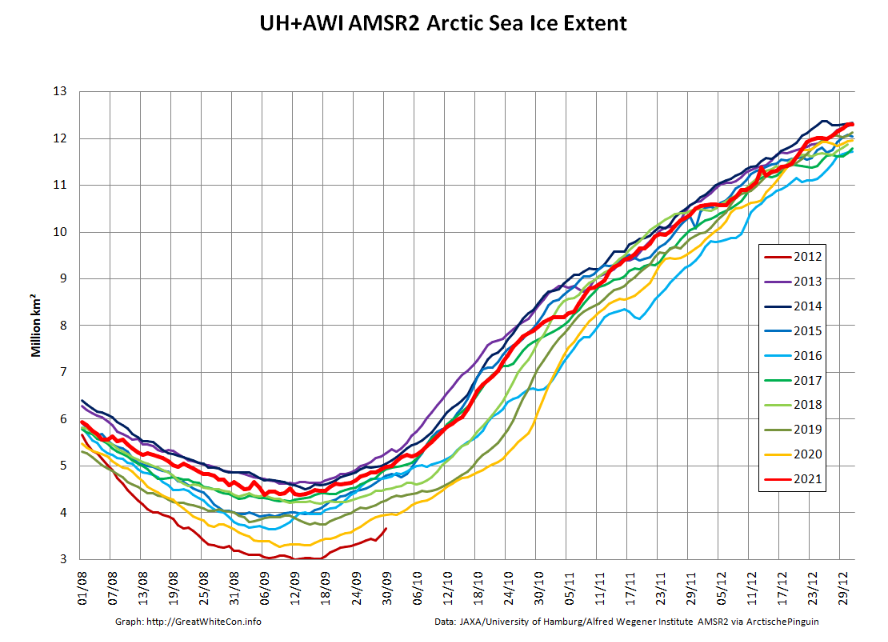
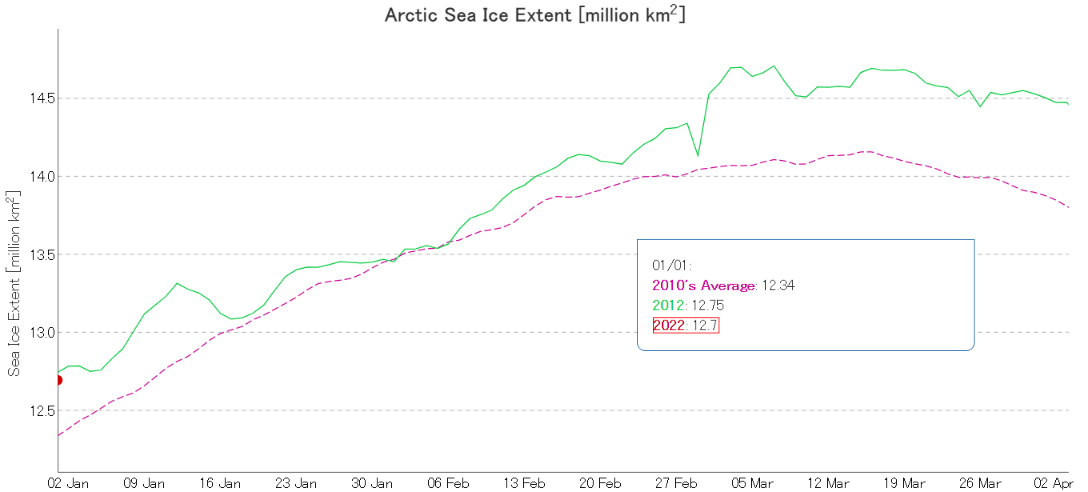
Both metrics are now near the upper boundary of the last 10 years’ range. The AMSR2 instrument wasn’t launched into orbit until summer 2012, but according to both JAXA and NSIDC data extent on January 1st 2022 is almost identical to the same date in 2012. Regular readers will recall that year went on to produce the lowest annual minimum extent in the satellite era despite recording the highest annual maximum in the decade of the 2010s:
Note that sea ice volume tells a rather different story. Here’s the latest AWI CryoSat-2/SMOS volume graph:

The current near real time data is likely to be revised upwards slightly when the final reanalysis is complete, but even so volume seems likely to remain in the lower half of the recent range at the end of 2021.
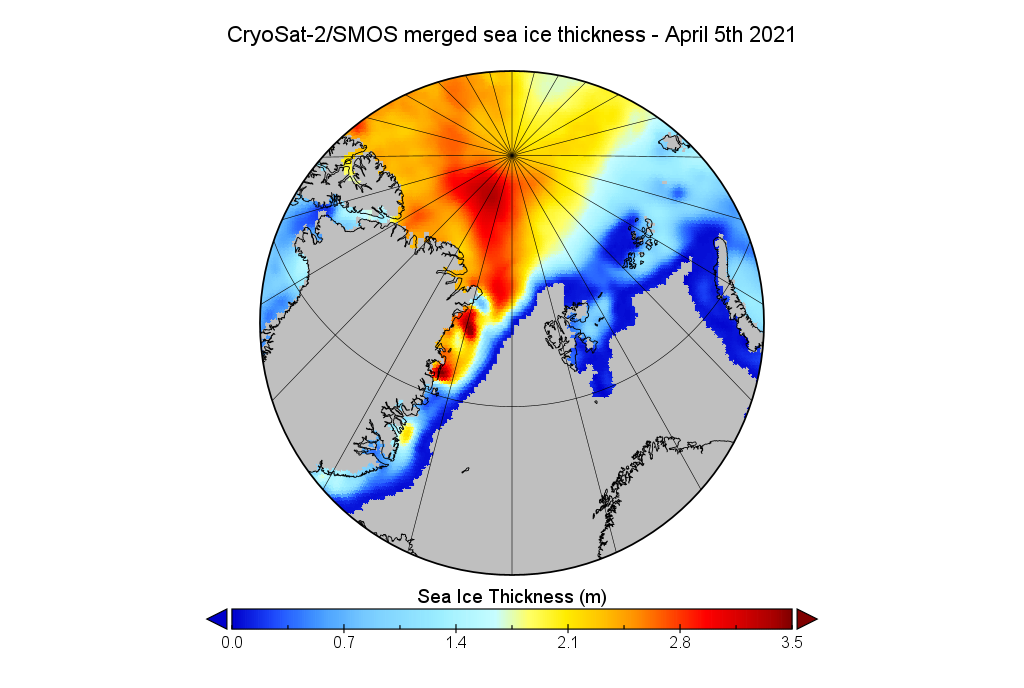
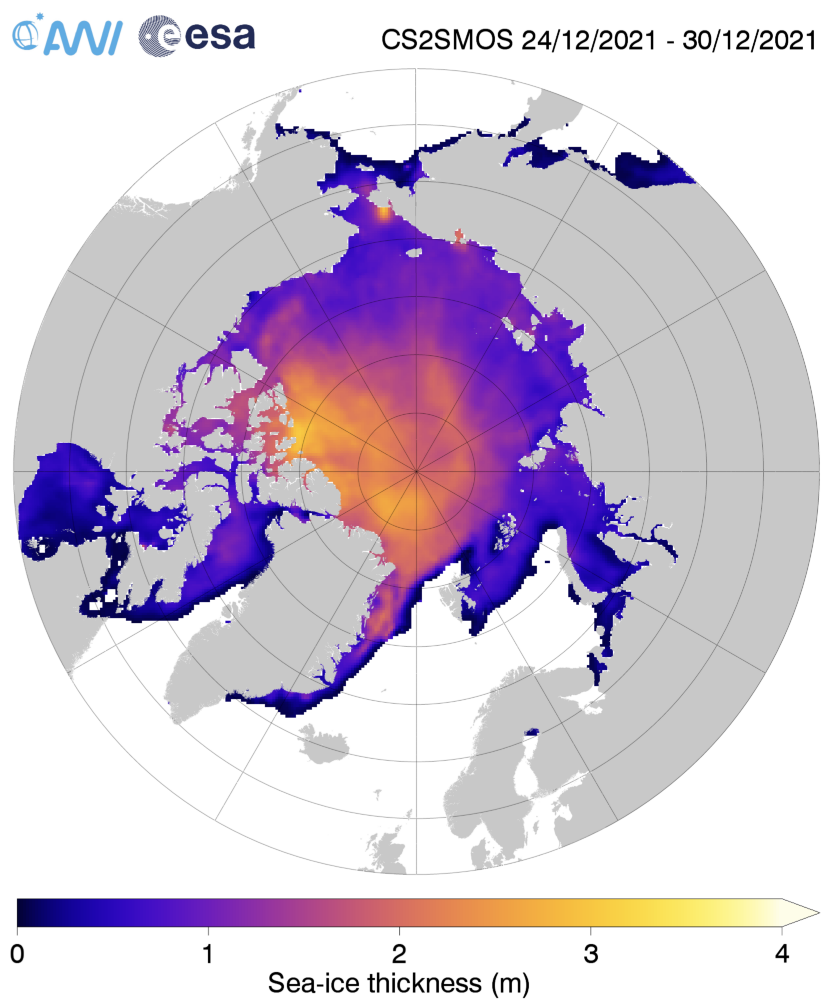
Here too is the AWI Arctic sea ice thickness map:
together with the thickness anomaly map from the Finnish Meteorological Institute:
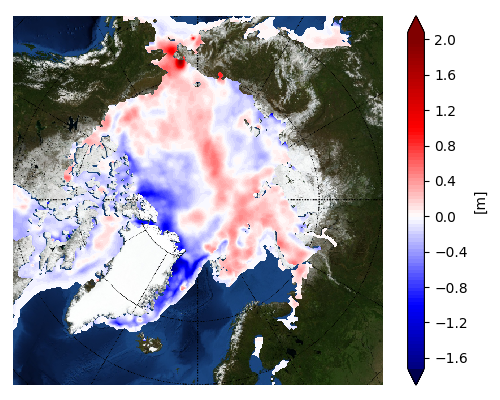
Once again the ice in the so called “last ice area” north of Greenland and Ellesmere Island is thinner than usual, as is the ice in the Fram Strait and East Greenland Sea.
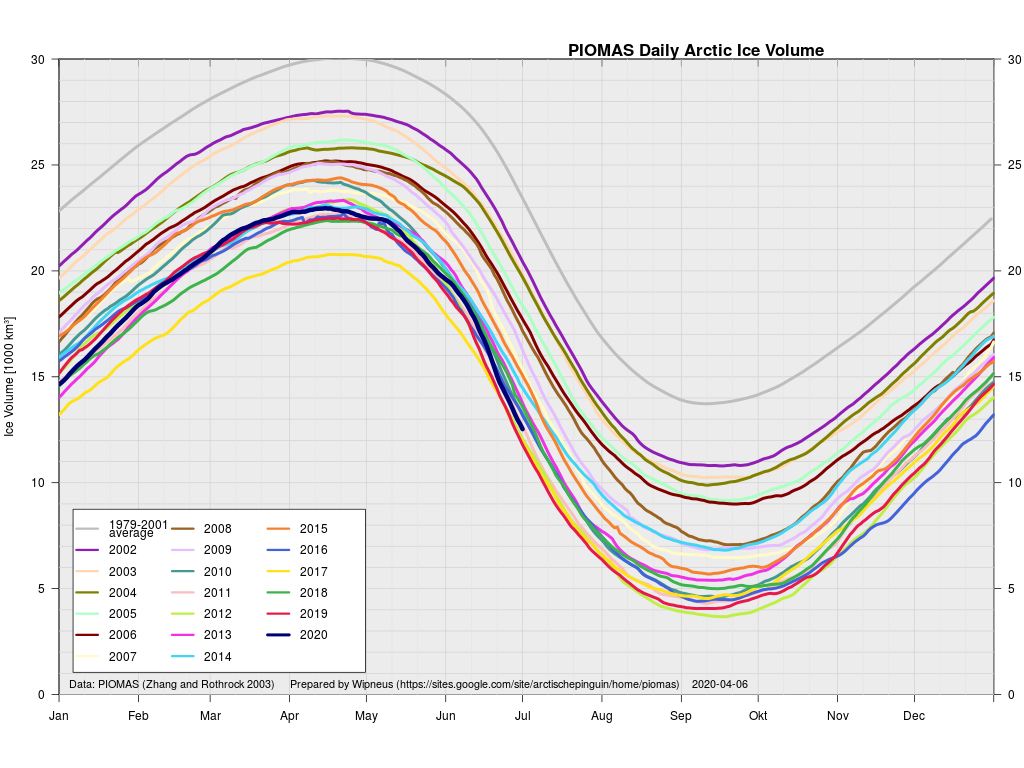
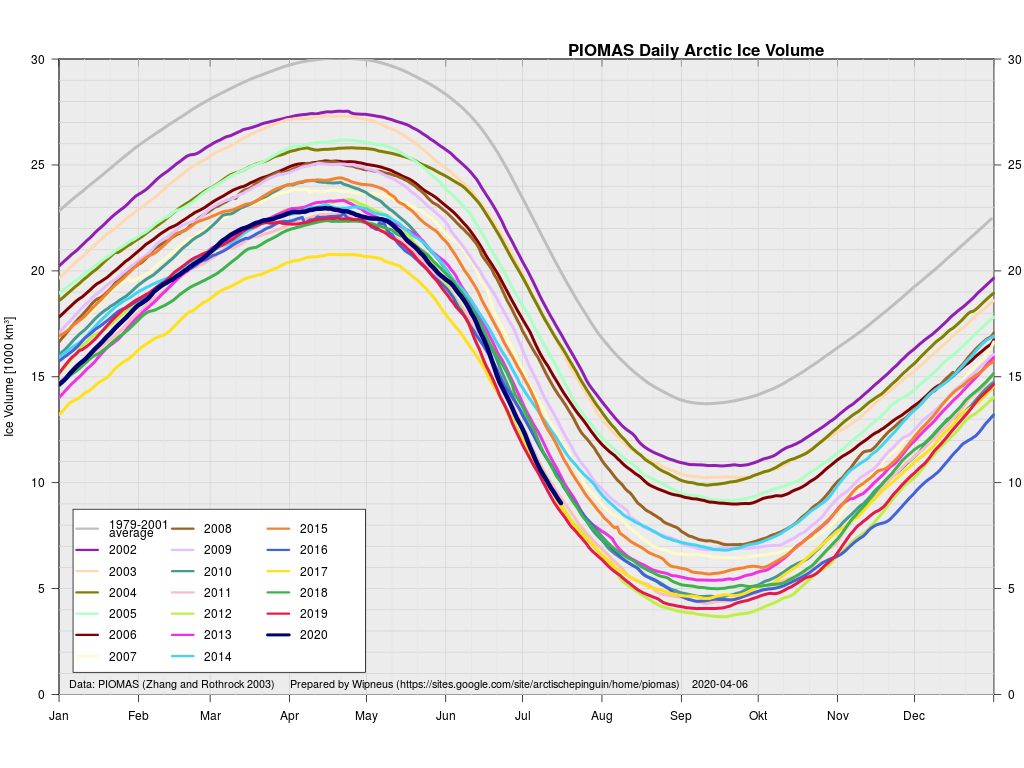
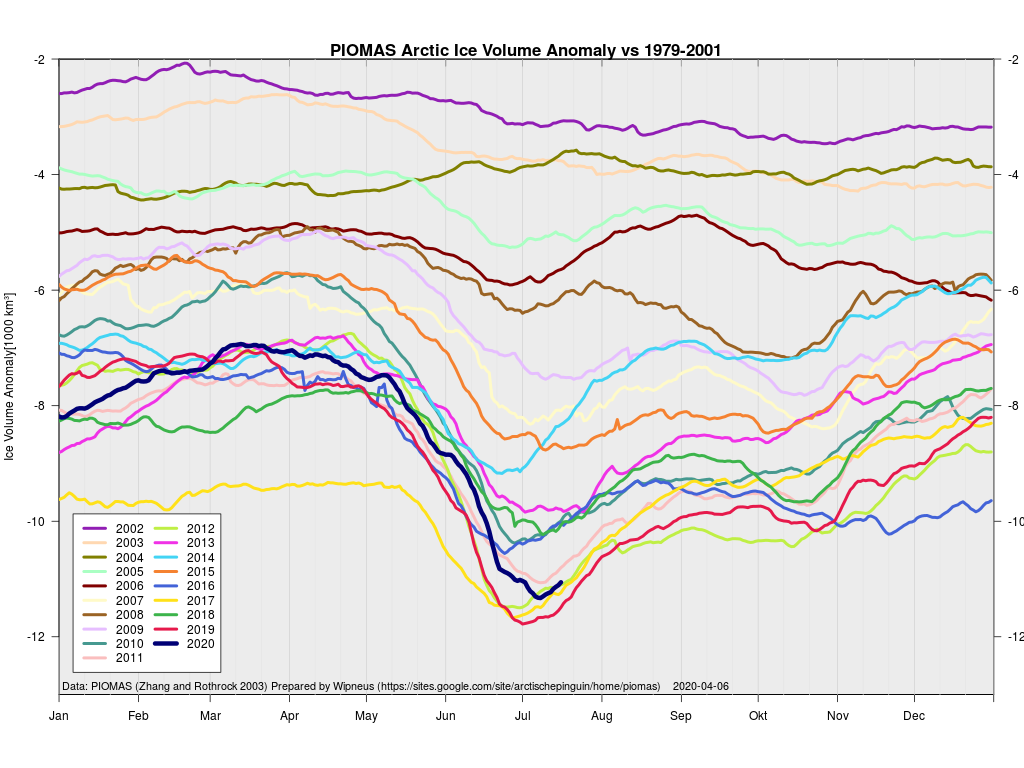
[Edit – January 11th]As has been pointed out below, the Polar Science Center has now released the PIOMAS volume data for December 2021:
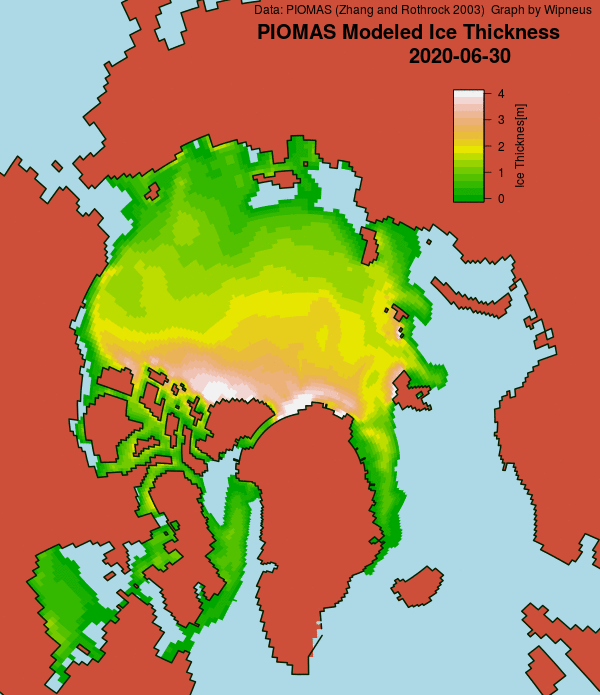
Average Arctic sea ice volume in December 2021 was 13,300 km3. This value is the 9th lowest on record for December, about 2100 km3 above the record set in 2016. Monthly ice volume was 51% below the maximum in 1979 and 37% below the mean value for 1979-2020. Average December 2021 ice volume was 1.2 standard deviations above the 1979-2020 trend line.
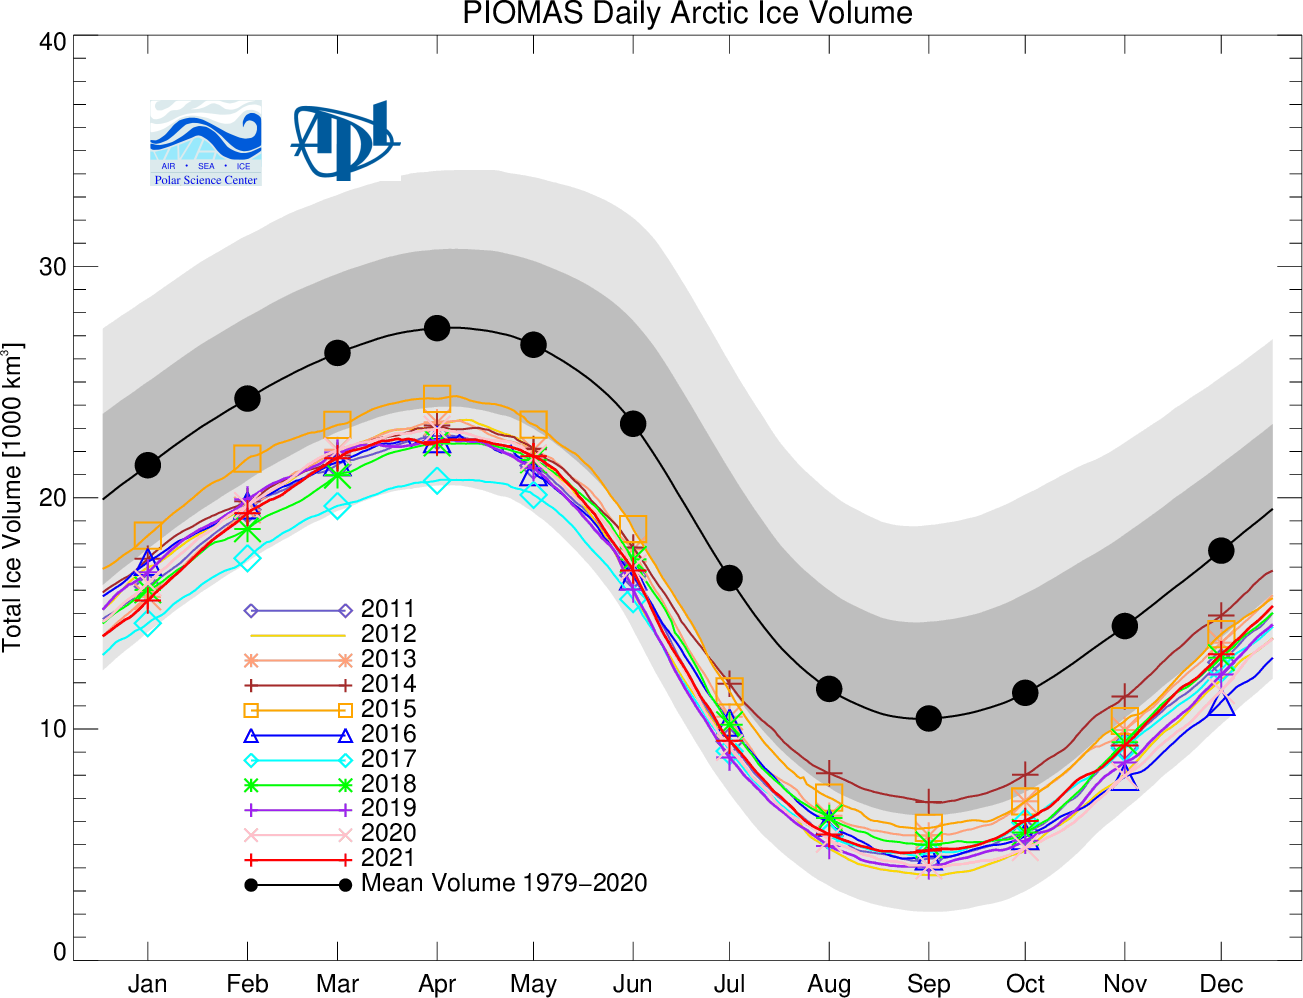
November and December of 2021 saw relative rapid ice growth for recent years, bringing the mean ice thickness (above 15 cm thickness) towards the thicker end of the recent values.
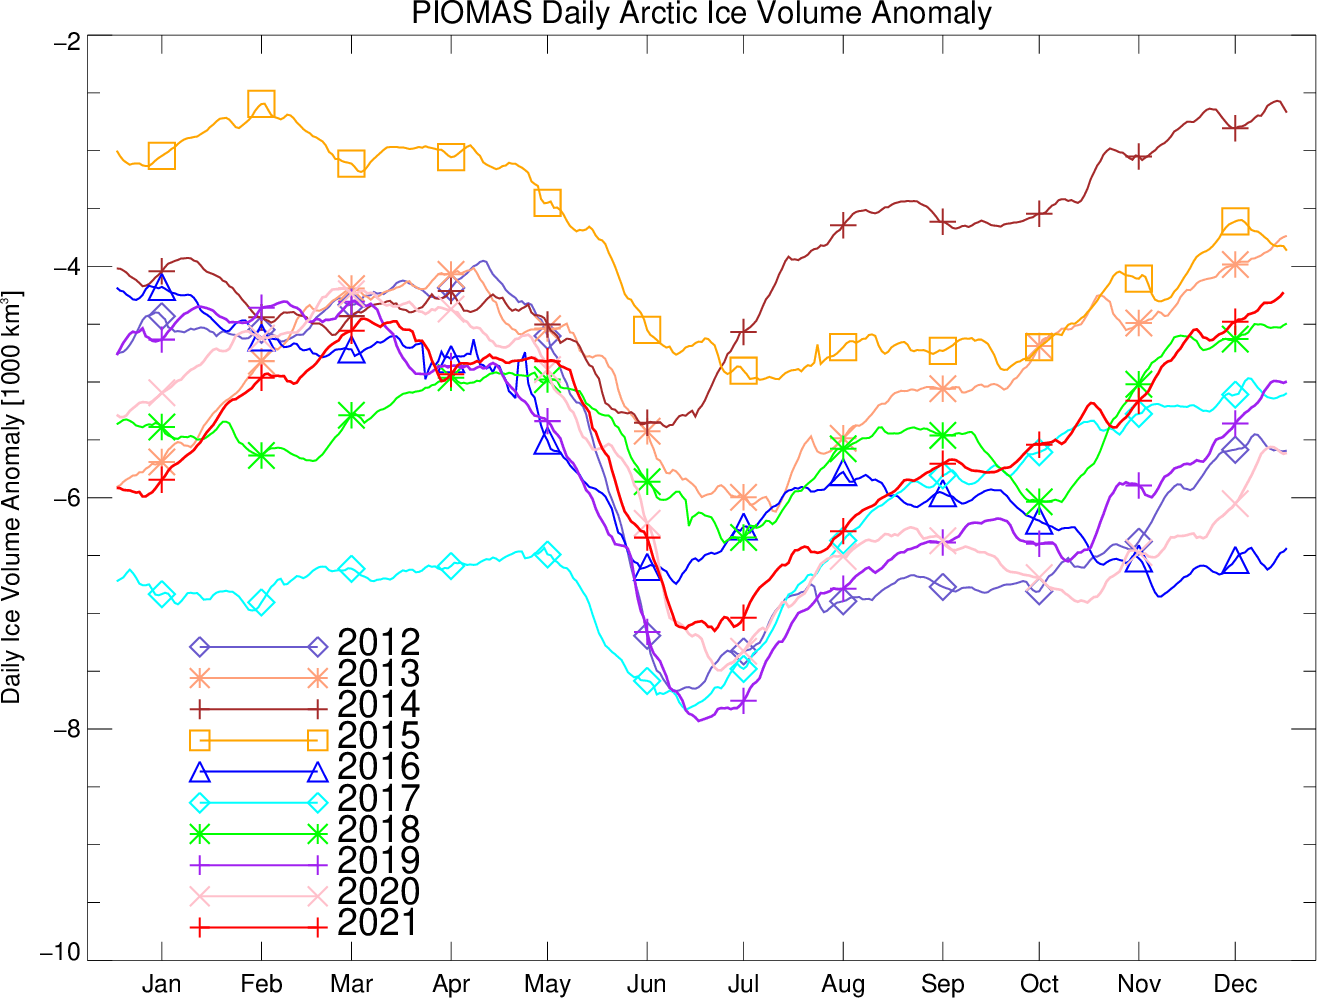
The ice thickness anomaly map for December 2021 relative to 2011-2020 continues to show anomalies divided into positive and a negative halves with areas of positive anomalies increasing since the two prior months and stretching from the Beaufort, over the pole and into the Barents. Negative anomalies stretching from Fram Strait, North of Greenland and along the Canadian Archipelago. Areas North of Greenland again feature low ice thickness as in prior years.

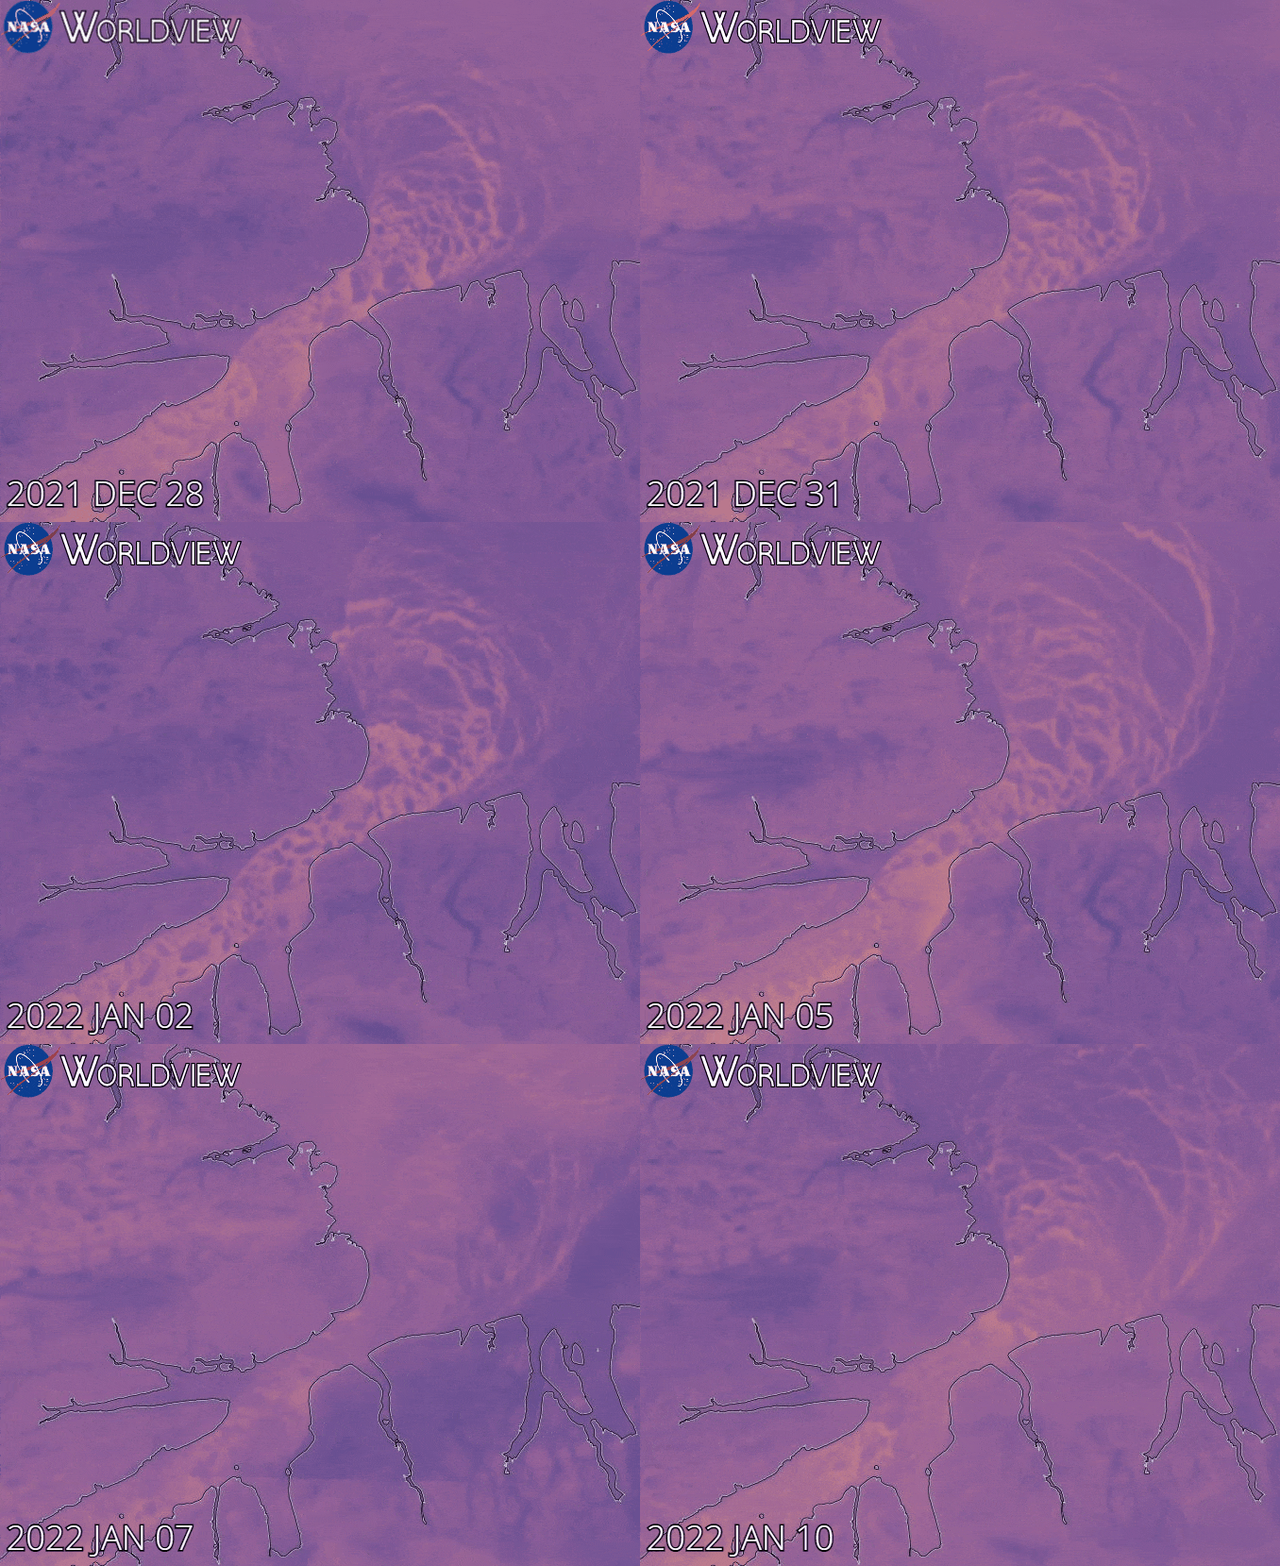
Note that as revealed by this animation from NASA Worldview the sea ice in the Lincoln Sea is currently still breaking up and being exported from the Central Arctic via the Nares Strait:
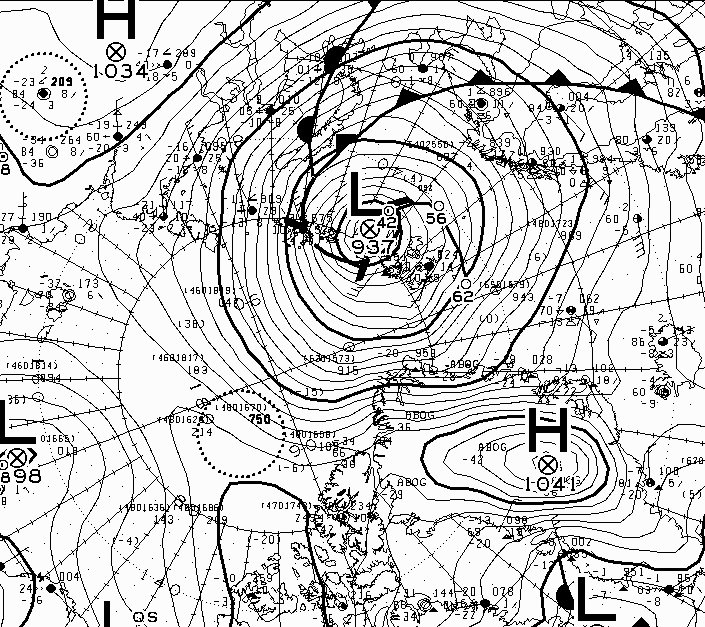
The Atlantic side of the Arctic Ocean has been taking a bit of a battering from what I shall henceforth refer to as the Great Arctic Winter Cyclone of 2022, or GAWC 2022 for short. Unless there’s an even deeper one later in the year of course!
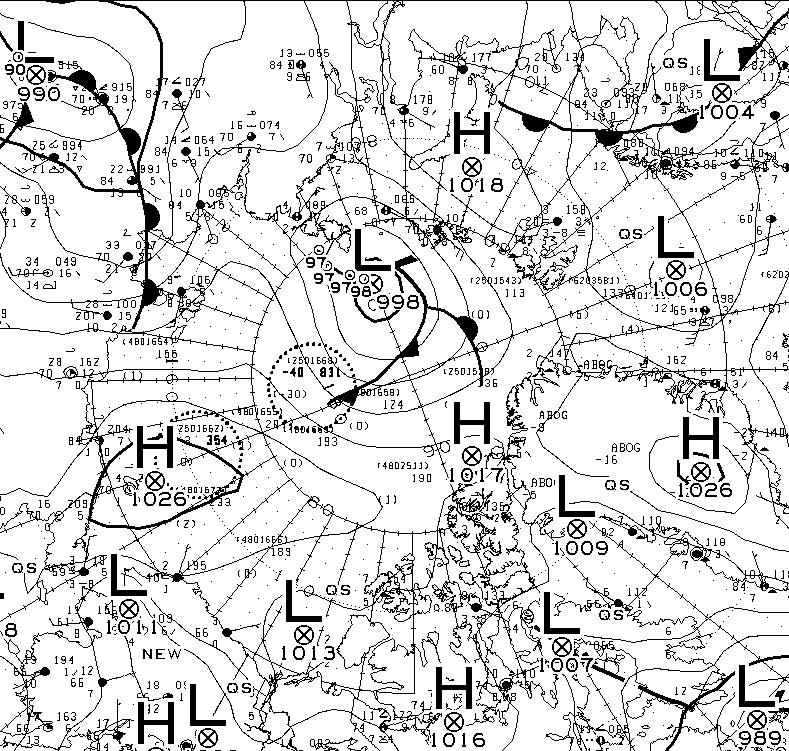
According to the Canadian Meteorological Centre the storm achieved a minimum Mean Sea Level Pressure of 937 hPa at 12 noon UTC yesterday:
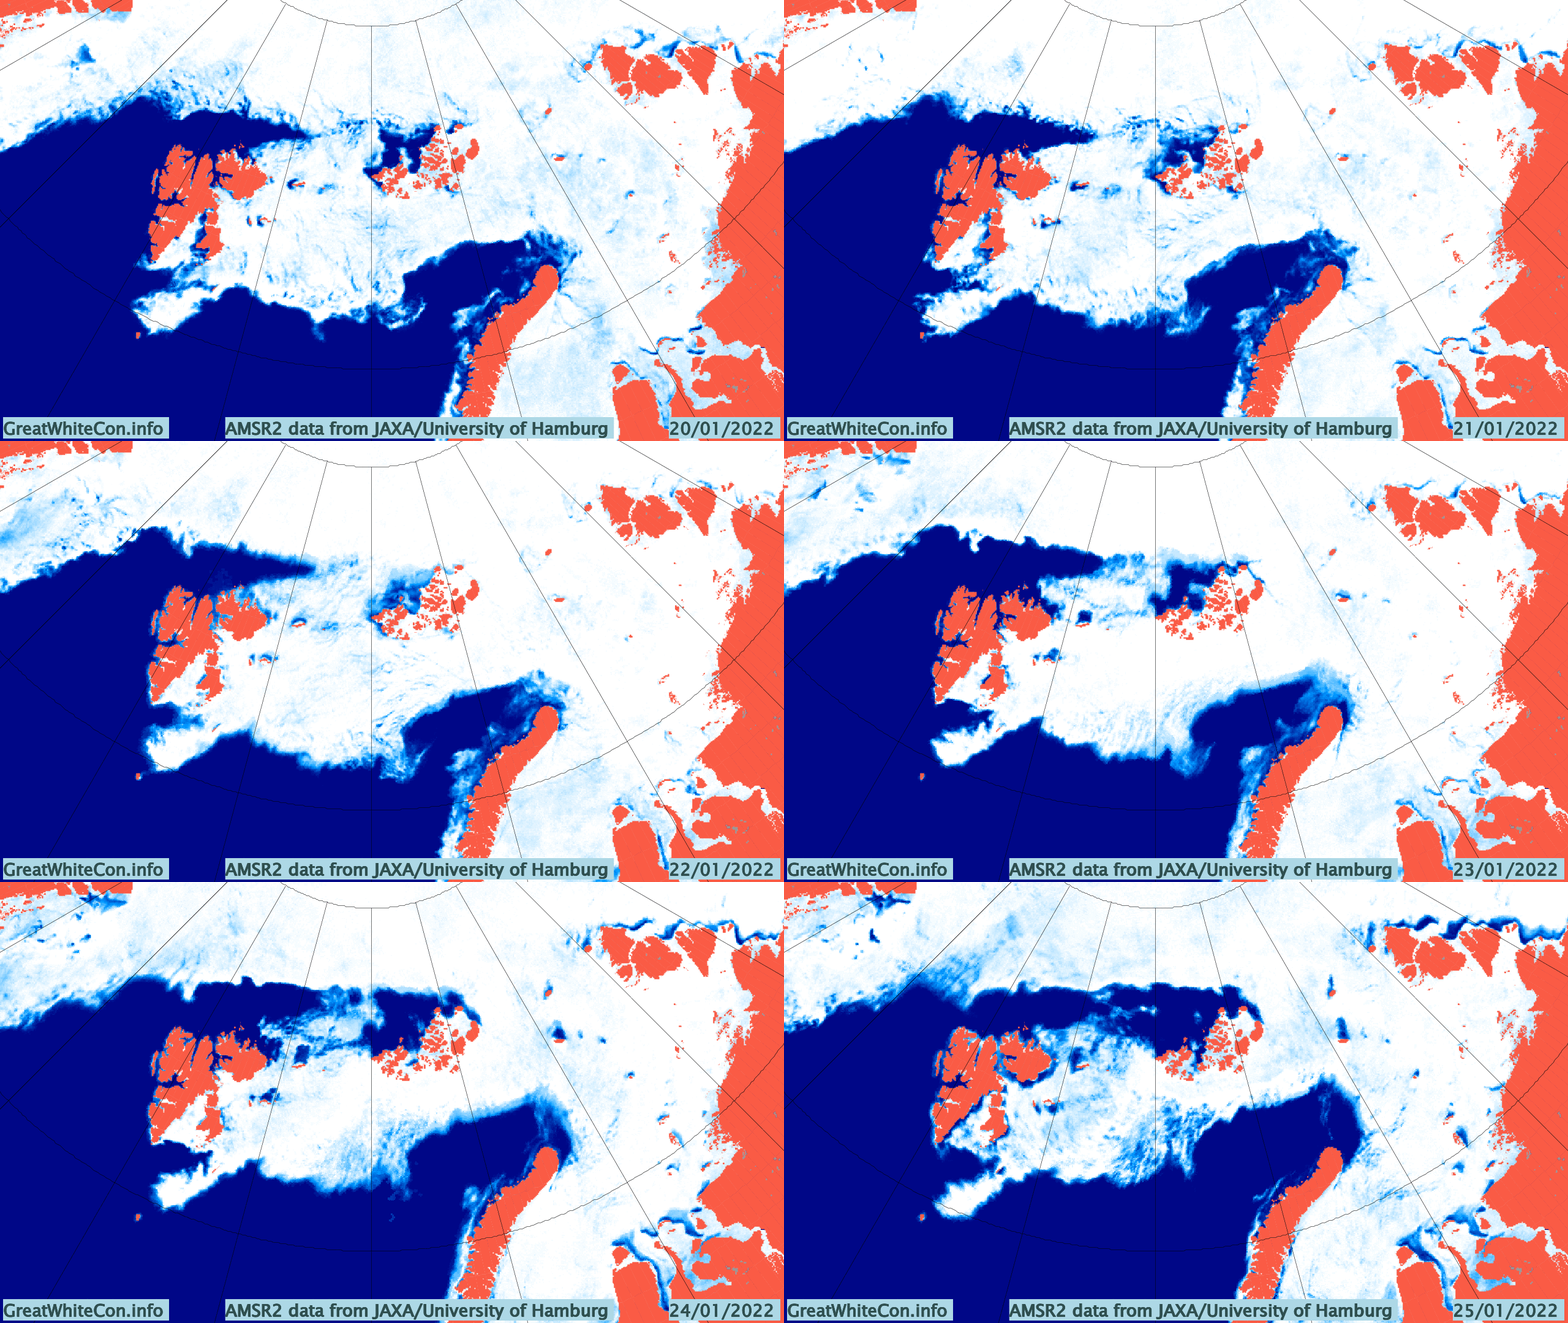
Here are the visible effects of the storm on the sea ice in the area so far, now updated to January 25th:
Watch this space!