Tag Archives: Beaufort Sea

Summer 2016 Surface Melt Takes Off

June has arrived, and according to the Great White Con Arctic sea ice calendar that means the summer surface melting season has started. Once July arrives bottom melt should have started in earnest too, but for now let’s stick to the surface. Here’s the Climate Reanalyzer map of Arctic surface air temperatures at 06:00 UTC this morning:

CCI-T2-2016-06-04-0600

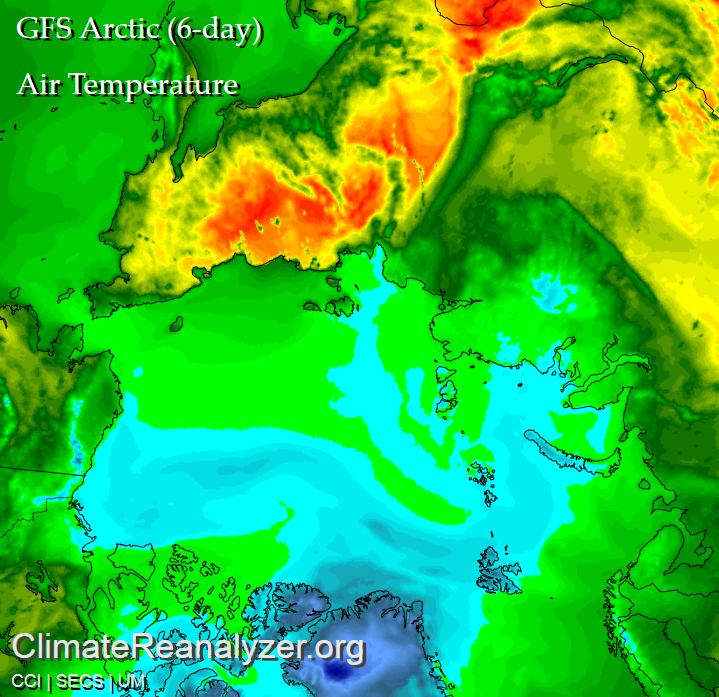
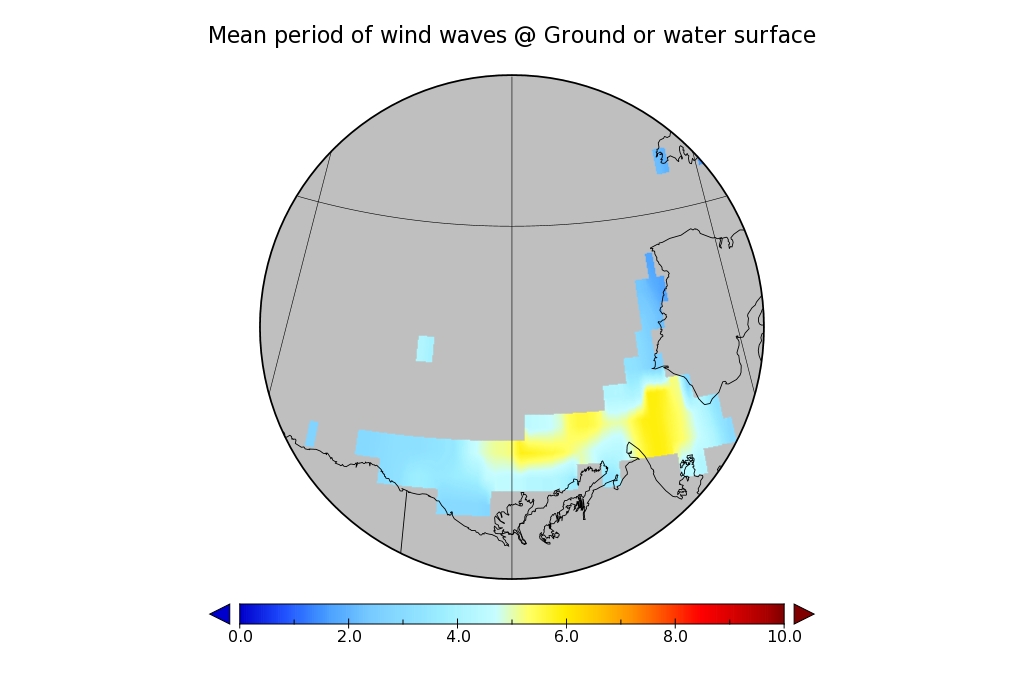
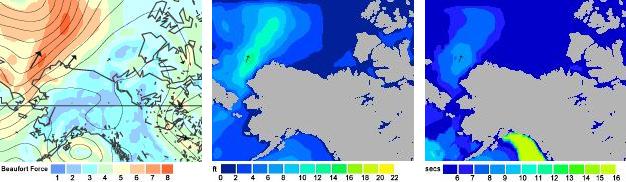
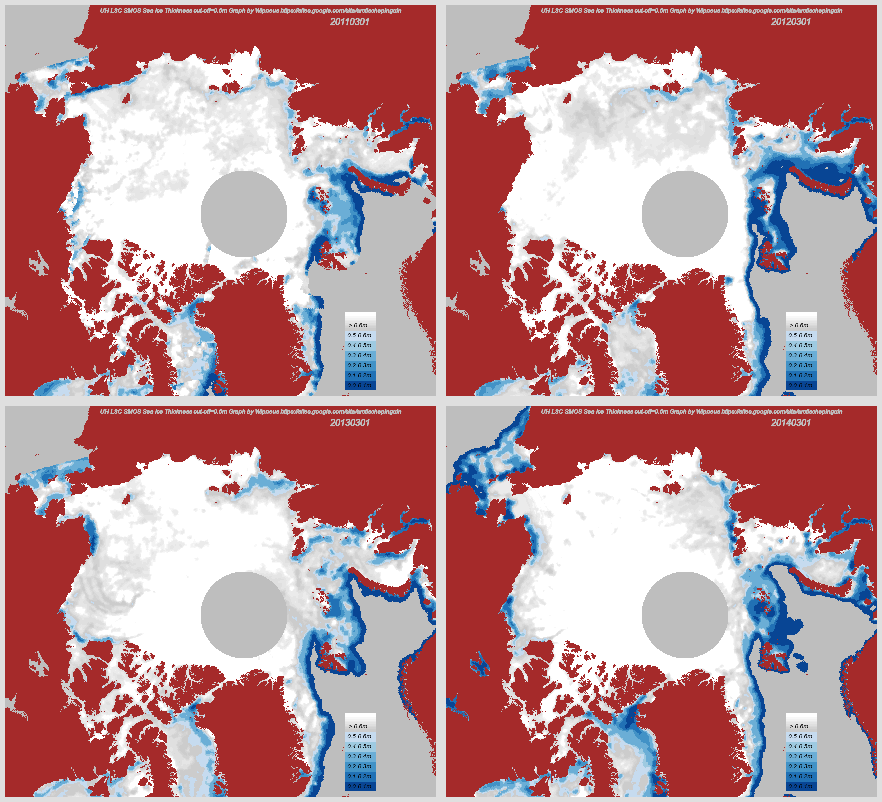
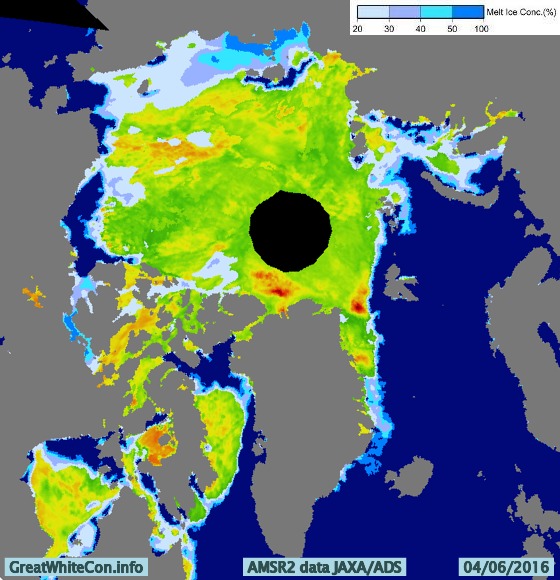
Green areas are above 0 degrees Celsius, and bear in mind that the melting point of sea ice is at around -1.8 degrees Celsius. The red areas near the East Siberian Sea coast are 25-30 degrees Celsius. Given those sort of temperatures you might well think that some snow and/or ice in that area would be melting, and you would be correct! Here is the Japan Aerospace Exploration Agency’s current map of Arctic surface melting:

AM2SI20160603A_SIT_NP

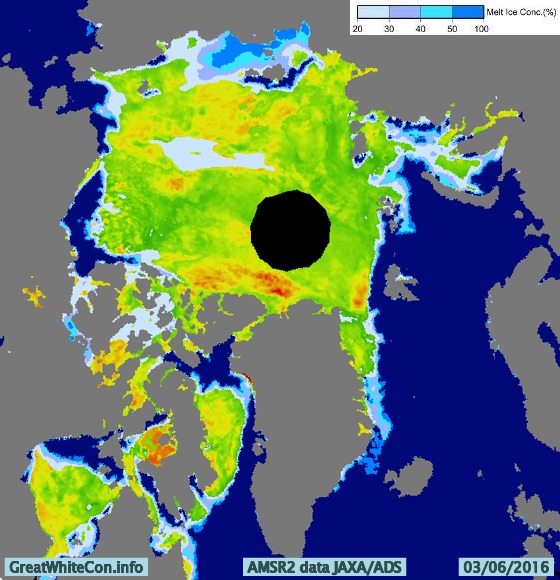
The assorted shades of blue/grey show the areas where surface melting is already underway. Whilst this melting is taking place you may possibly read in some quarters of the cryodenialosphere that “There is almost no melting going on in the Arctic“. The authors of such nonsense evidently don’t know their proverbial Arctic arse from their elbow.

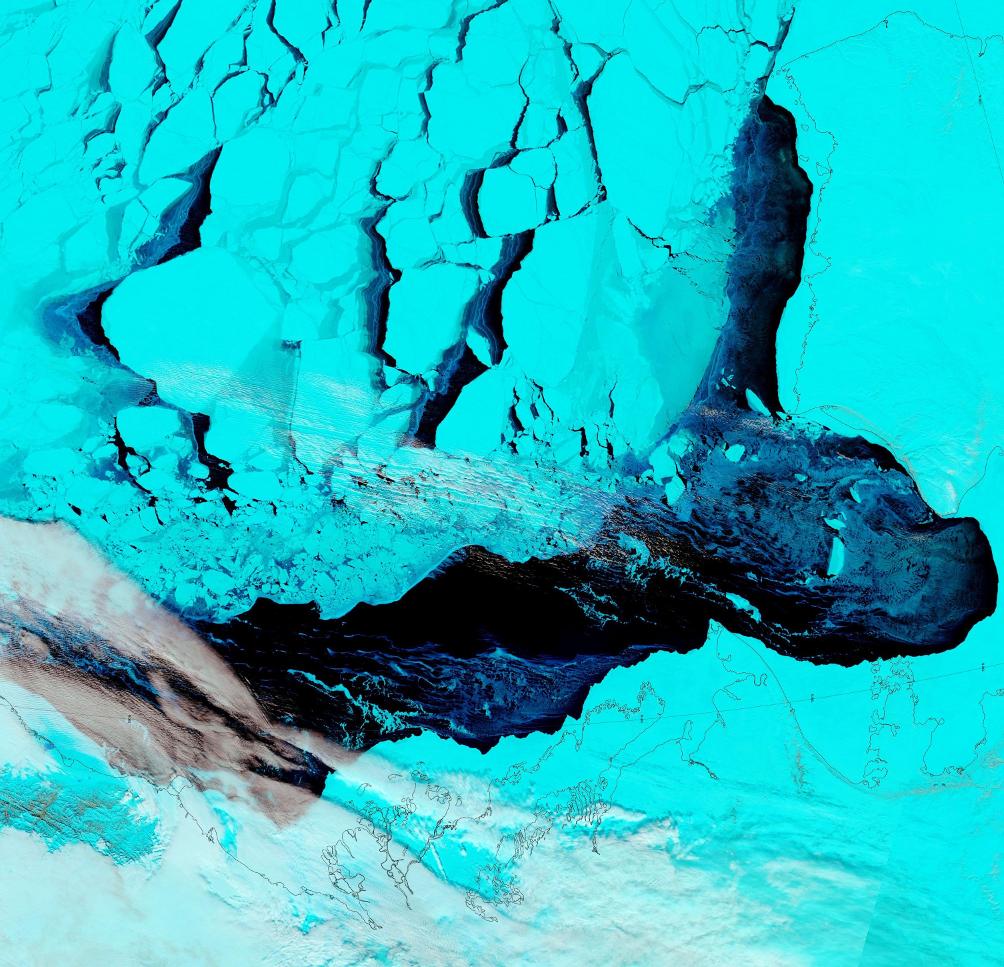
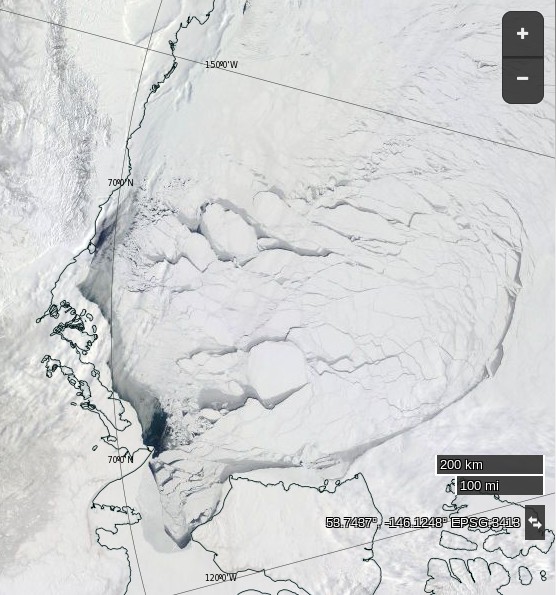
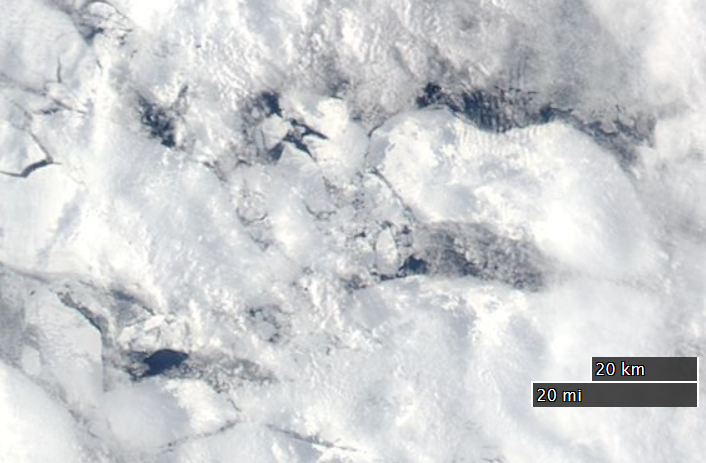
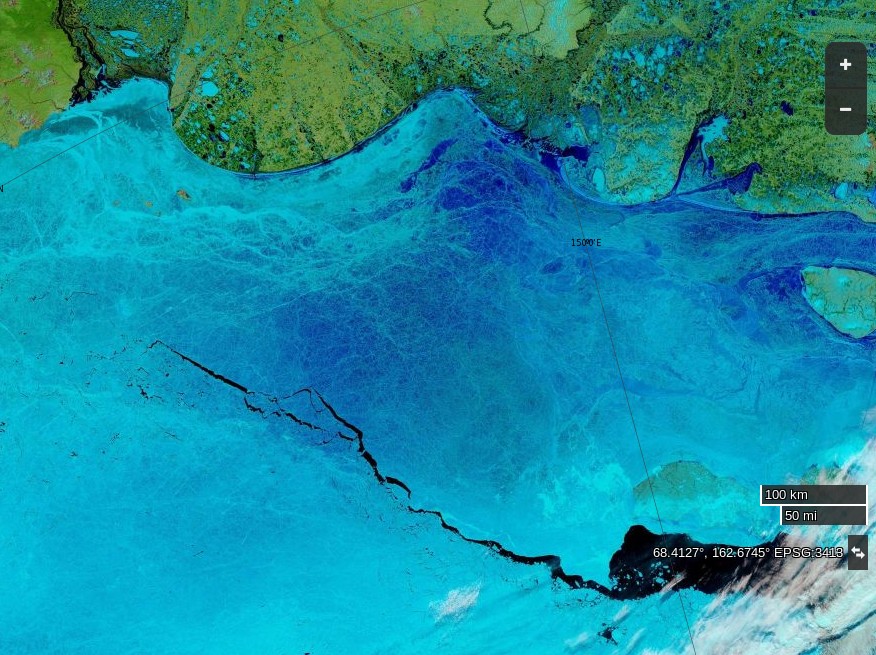
Here’s how today’s surface melting in the East Siberian Sea looks from space:

NASA Worldview “false-color” image of the East Siberian Sea on June 4th 2016, derived from the MODIS sensor on the Terra satellite

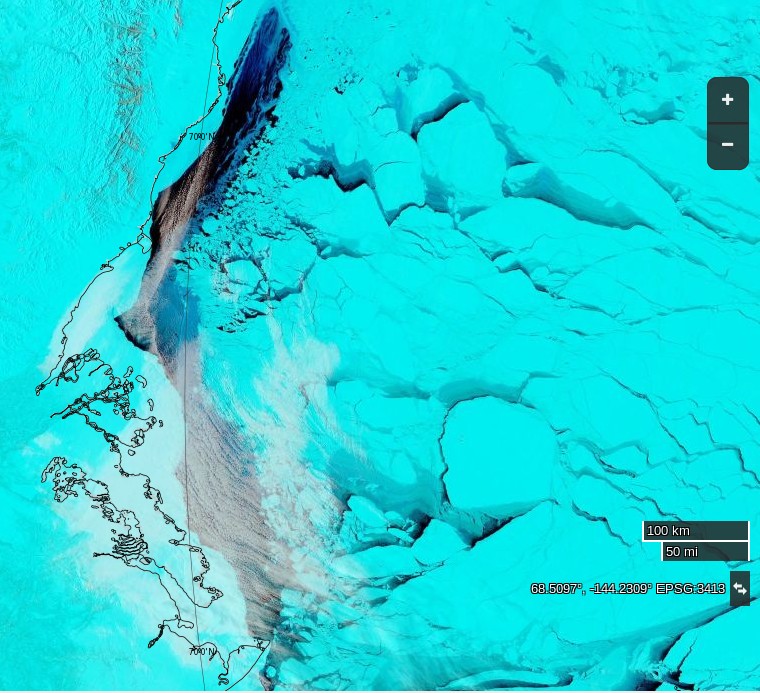
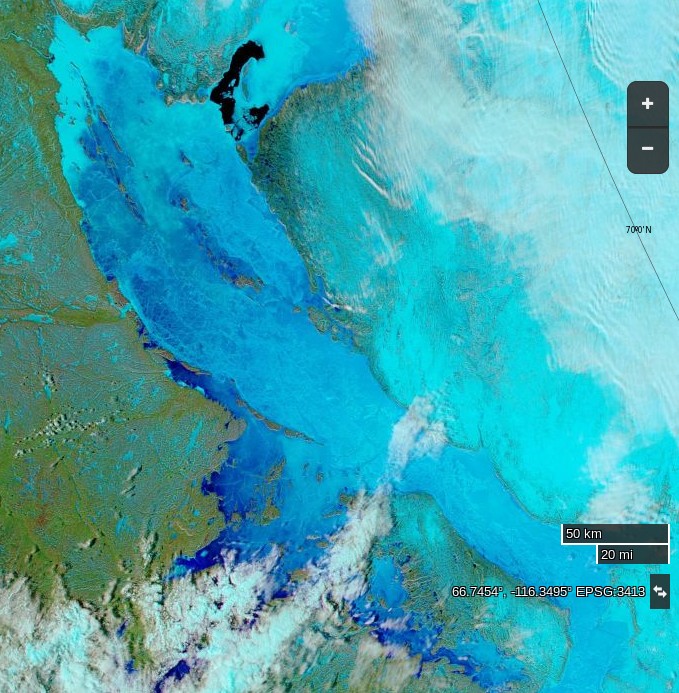
Meanwhile over on the other side of the Arctic, here’s yesterday’s surface melting on “Amundsen’s Route” through the Northwest Passage:

NASA Worldview “false-color” image of the Northwest Passage on June 3rd 2016, derived from the MODIS sensor on the Aqua satellite

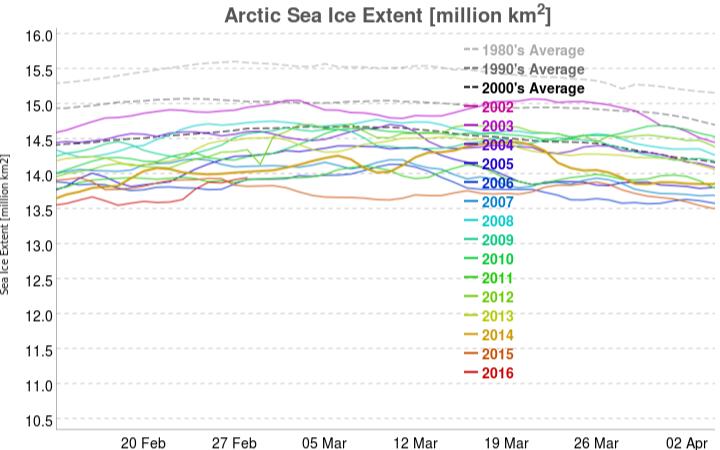
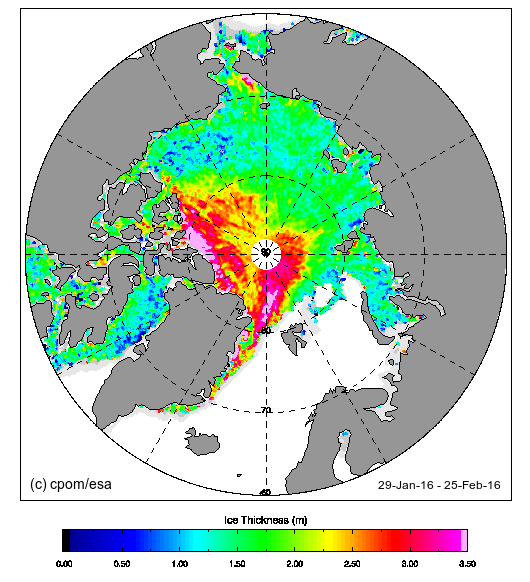
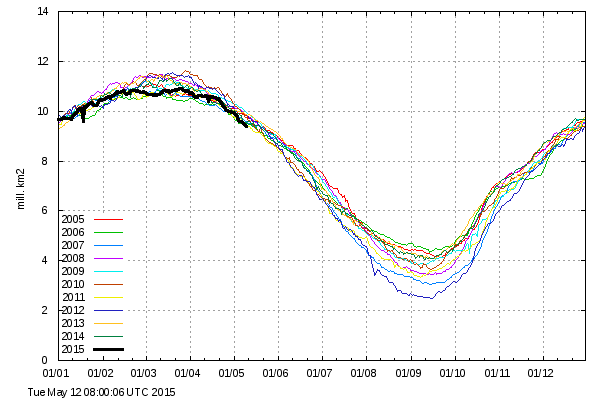
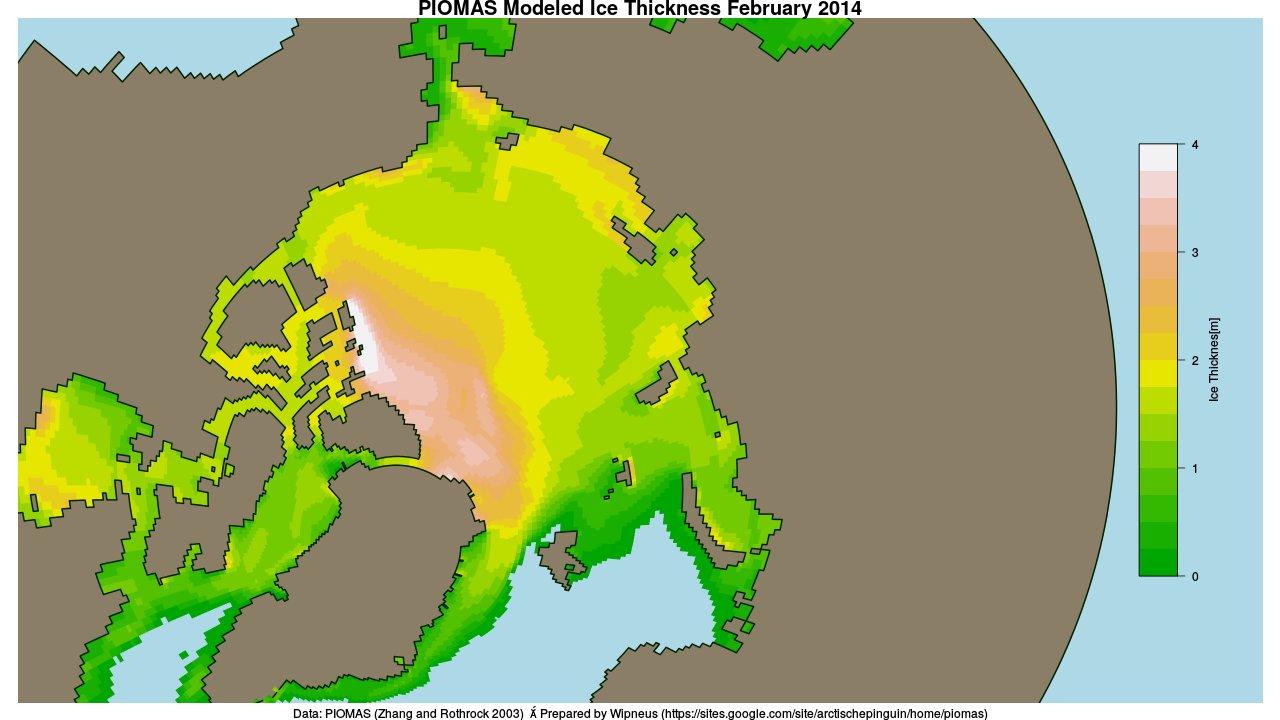
By way of further illustration of the fact that Arctic sea ice is and has been melting, here is a graph of the current area of sea ice in the all important central area of the Arctic Basin, courtesy of “Wipneus” at Arctische Pinguin:

basin-area-20160603

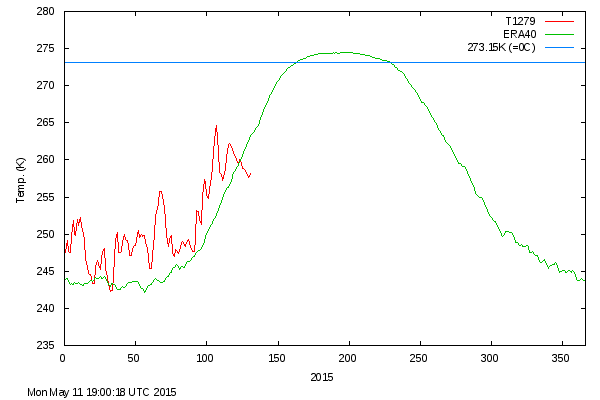
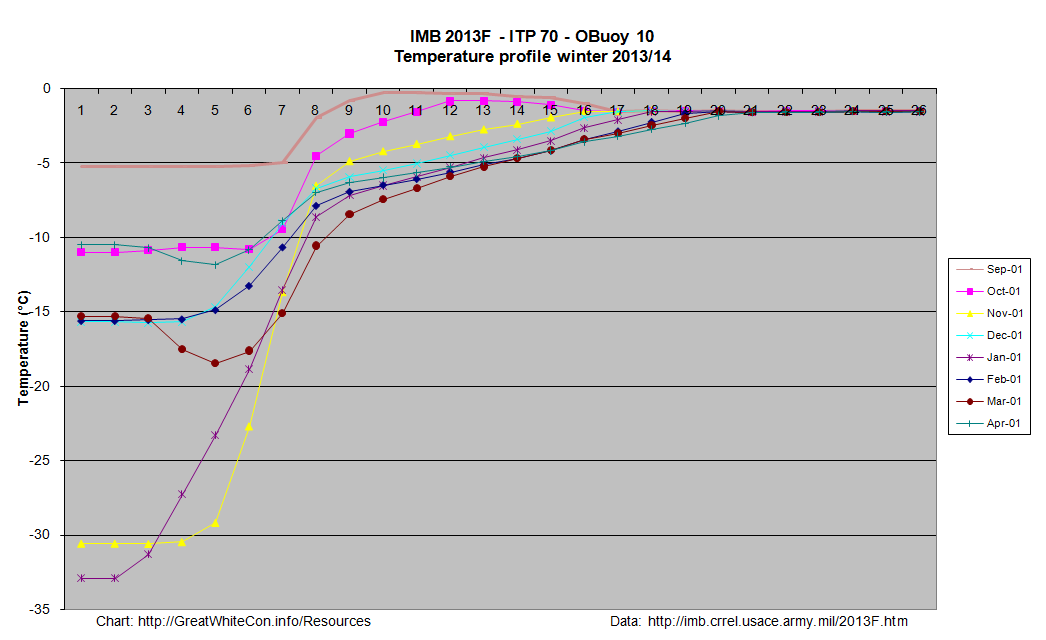
The areas included are the Central Arctic Basin, plus the Beaufort, Chukchi, East Siberian and Laptev Seas. The above zero temperatures are forecast to spread across the Central Arctic Basin early next week, whereupon it will be very interesting to discover what happens to the snow around the single ice mass balance buoy currently transmitting near real time data. Here is the current temperature profile for the sea ice underneath IMB buoy 2015F:

2016-06-02_2015F

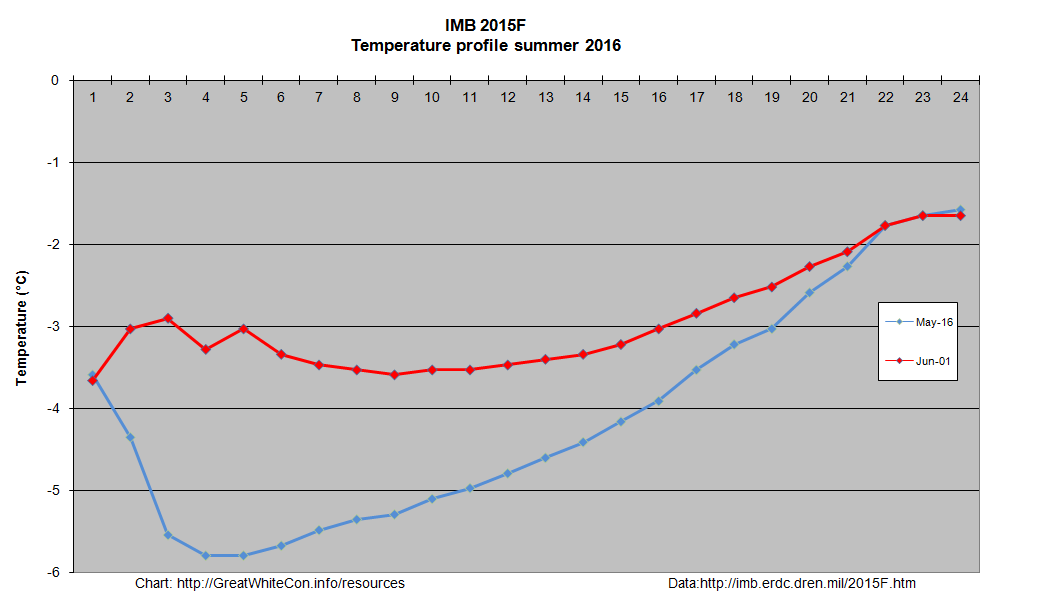
The current conditions there are summarised this morning as:

Pos: 82.00 N, 147.45 W
Air Temp: -3.74 C
Air Pres: 1007.42 mb
Snow depth: 21 cm
Ice thickness: 202 cm

Normally by now there would also be a number of webcams beaming back pictures from across the sea ice in the Arctic Basin. However according to NOAA:

Due to funding constraints, it was not possible to deploy new Web Cams in Spring 2016, but deployments in Spring 2017 are planned.

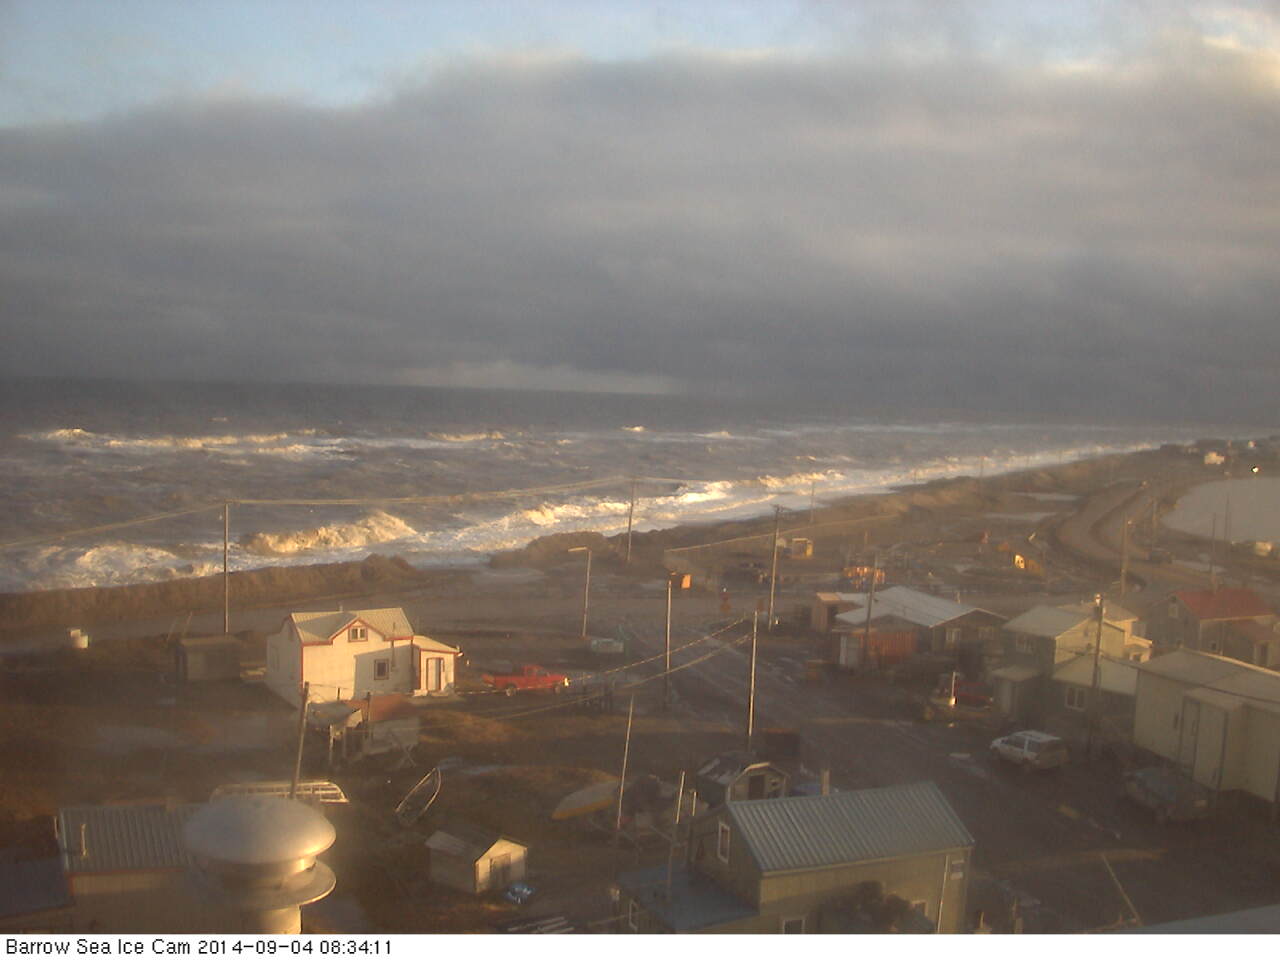
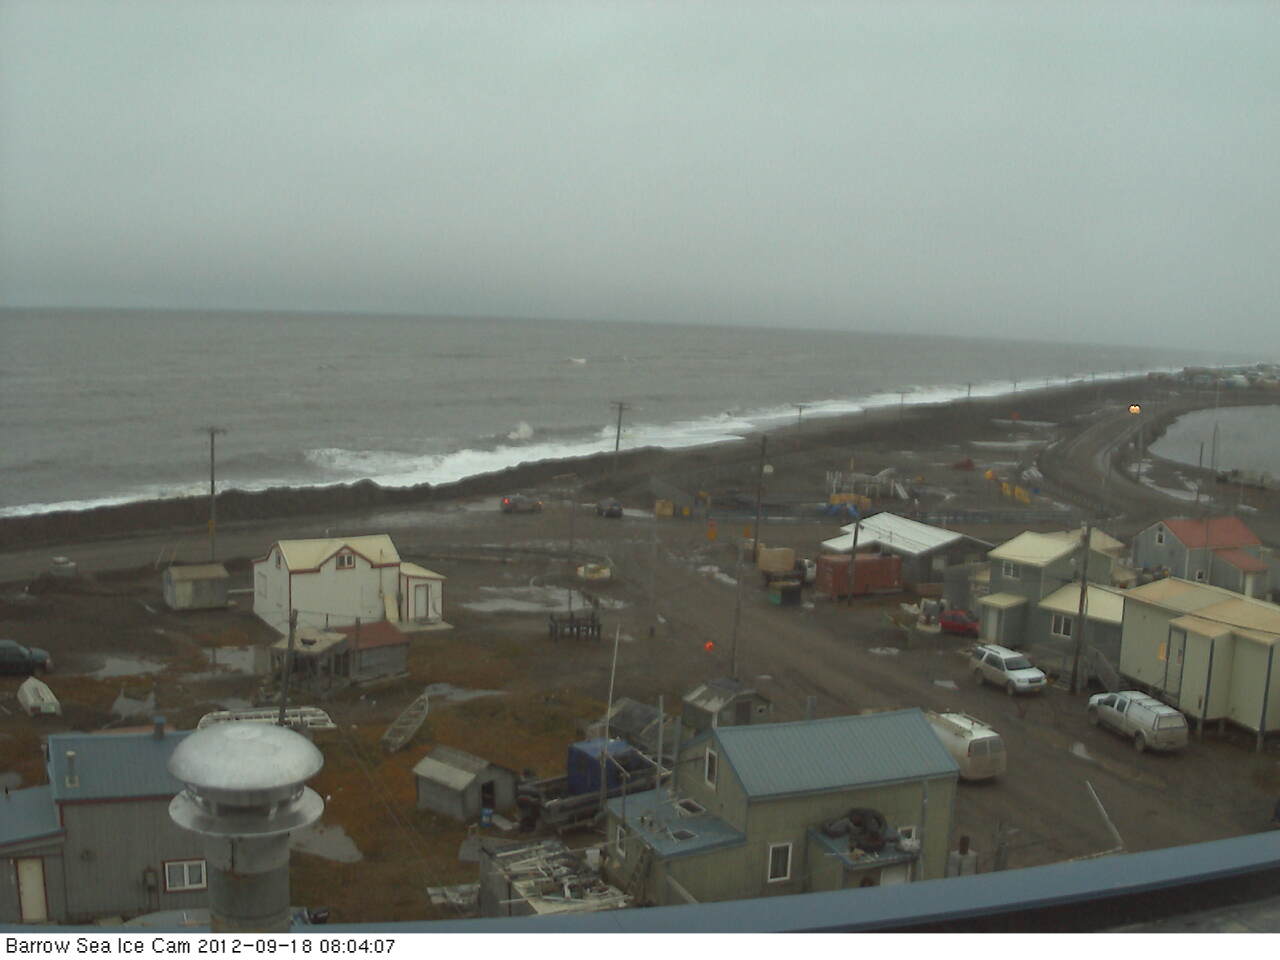
Three of the camera carrying O-Buoys also seem to have failed over the winter, which leaves us with only O-Buoy 14 to reveal the forthcoming melt to us:

O-Buoy 14 image from June 2nd 2016

O-Buoy 14 is currently colocated with Ice Tethered Profiler 89, the yellow object in the foreground, at 77.49° N, 153.92° W, to the north of the Beaufort Sea. ITP 89 measures the temperature and salinity of the water beneath the sea ice and revealed this the last time it managed to take a measurement, a month or so ago:

itp89-20160604

If you examine the extreme right hand edge of the charts carefully you will no doubt note that the water underneath the ice has recently become both warmer and saltier.

Watch this space!

[Edit – June 5th 2016]

The latest JAXA/ADS map shows that the area of sea ice undergoing surface melting has increased since yesterday, particularly over the Chukchi Sea:

AM2SI20160604A_SIT_NP

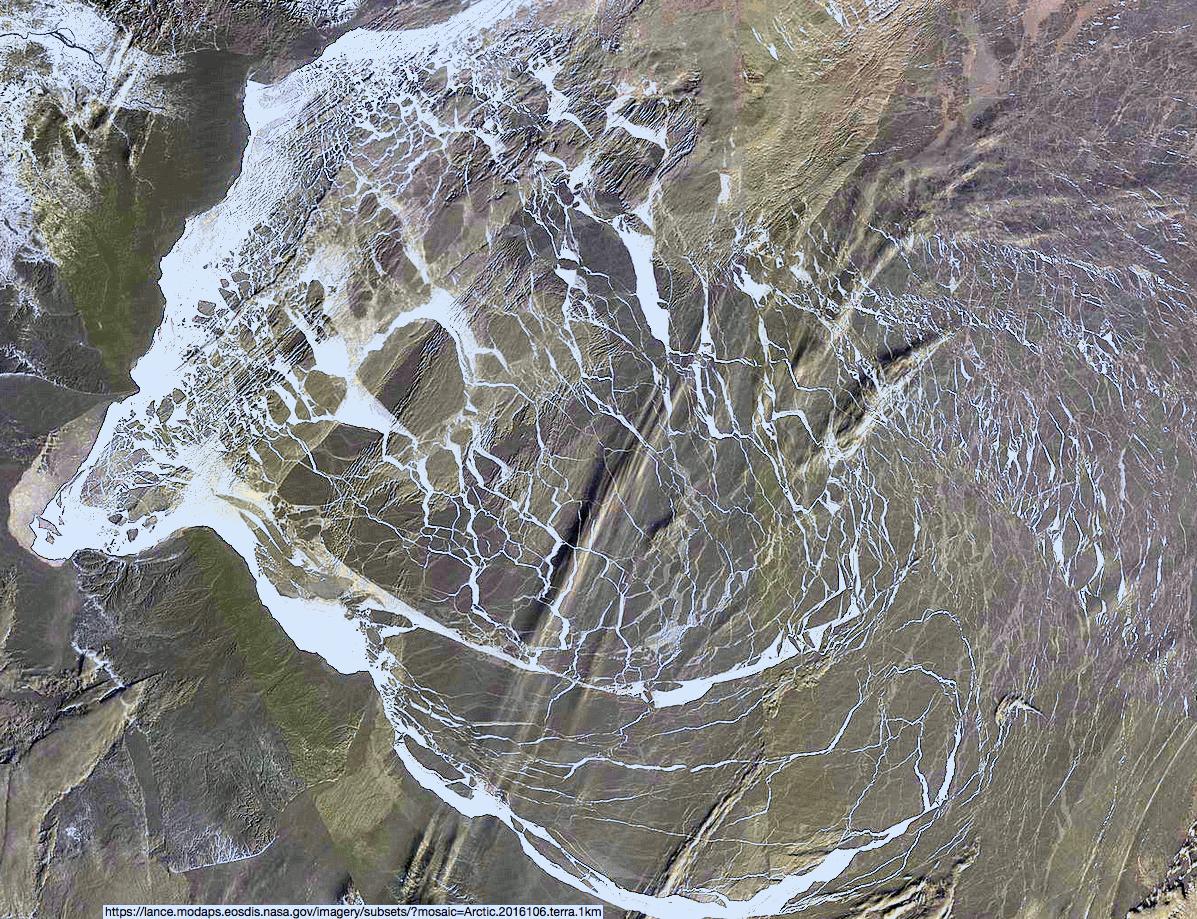
The recent clouds over the Beaufort Sea cleared yesterday. Here’s a close up view of the open water between the big floes from the Suomi satellite:

Beaufort-Floes-Suomi-20160604

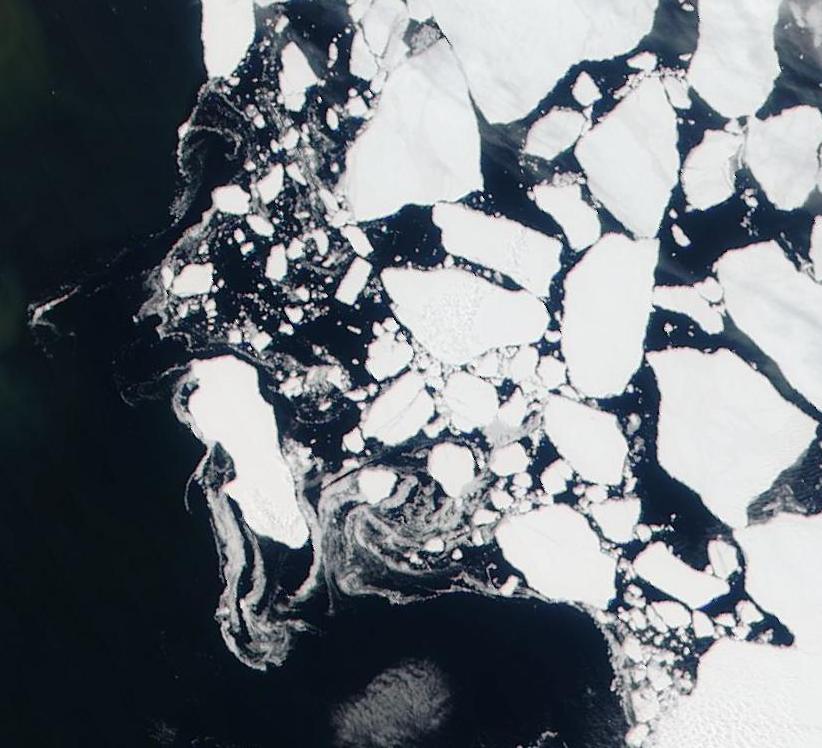
For a more distant perspective see our Summer 2016 image archive.

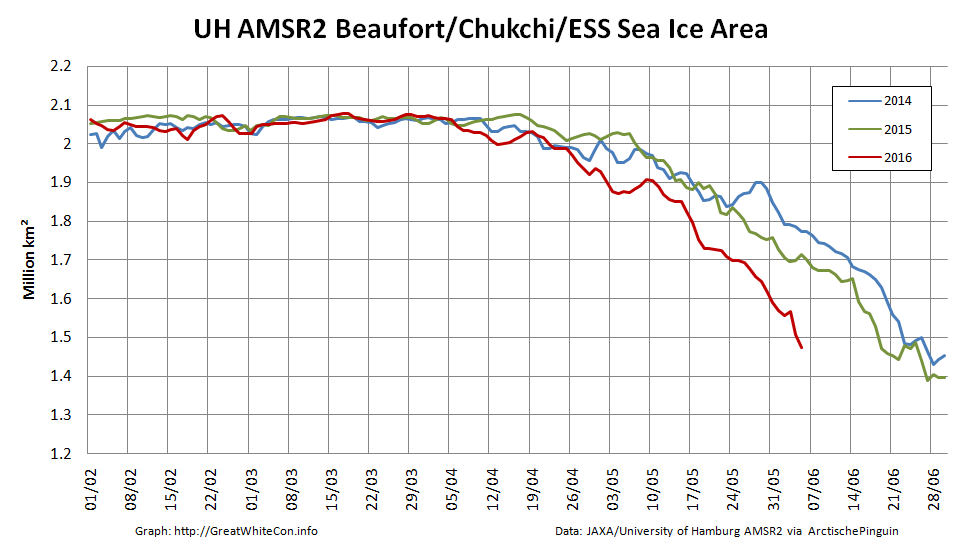
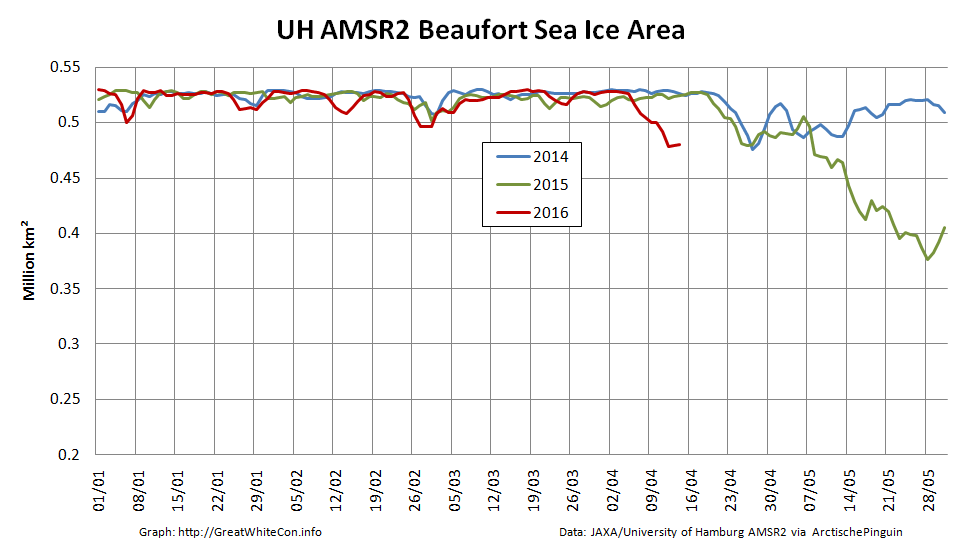
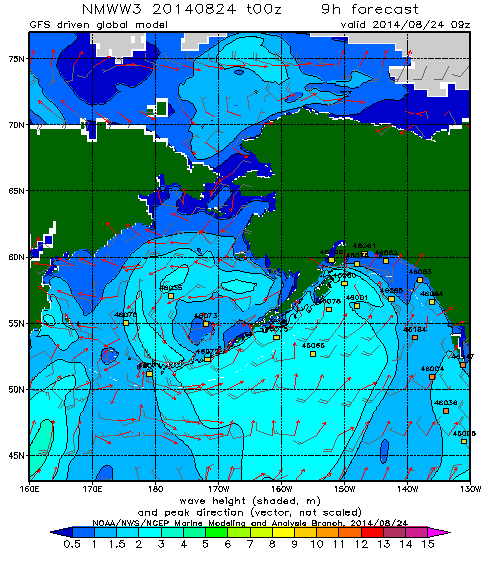
It’s not simply the surface that’s melting either. Here’s the latest “high resolution” AMSR2 sea ice area graph for the Pacific side of the Arctic:

2016-06-04-Pacific-AMSR2-Area

Wind Waves in the Beaufort Sea in April 2016

As regular readers will be aware we have been following the progress of the Great Arctic Anticyclone of 2016 for the last 3 weeks or so and the generation of increasingly large waves in the Beaufort Sea in August and September for the last 3 years or so. Today we combine the two to bring you news of anomalously large waves in the Beaufort Sea earlier this week. In actual fact any sort of waves in the Beaufort Sea at this time of year would be anomalous, since normally the Beaufort is still covered in sea ice in April!

Firstly a bit of background information. In the continuing absence of the DMSP F-17 satellite data used by the NSIDC for their Arctic sea ice metrics, here’s a close up look at Arctische Pinguin’s current Beaufort Sea ice area data:

2016-04-28-Beaufort-AMSR2-Area

Now here’s NOAA’s WaveWatch III “hindcast” of the winds over the Beaufort Sea on April 26th 2016:

WaveWatch III wind hindcast for the Beaufort Sea on April 26th 2016

Notice the continuing easterly winds from the persistent high pressure system centred to the north of the Beaufort Sea. Next here’s the resultant wind wave height:

WaveWatch III wave height hindcast for the Beaufort Sea on April 26th 2016

and the associated wind wave period:

WaveWatch III wave period hindcast for the Beaufort Sea on April 26th 2016

Wind waves with a height of around 1.5 meters and a period of 6 seconds wouldn’t tempt me to go out on a surfing expedition, but they would certainly be enough to interfere with the sea ice formation process, as you can see from this “pseudo-color” image of the Beaufort Sea on April 26th from the MODIS instrument on the Terra satellite:

NASA Worldview “false-color” image of the Beaufort Sea on April 26th 2016, derived from the MODIS sensor on the Terra satellite

Unfortunately the Jason 2 and recently launched Jason 3 satellites don’t measure wave heights in bodies of water as far north as the Beaufort Sea, so we’ll have to content ourselves with the modelled data from WaveWatch III. However here’s a brief video explaining how Jason 3 measurements are now used to assist WaveWatch forecasts further south:

Whilst Jason 3 won’t be watching waves in the Arctic Ocean it looks as though the European Space Agency’s Sentinel 3A satellite will be providing wave height data for the Beaufort Sea in the not too distant future:

S3A_Wave_height_20160304

It also looks as though CryoSat-2 is already potentially providing such data, but as far as I can ascertain it’s not available in handy gridded format in the same way that the CS2 near real time ice thickness data is.

The Beaufort Gyre Goes Into Overdrive

According to the US National Snow and Ice Data Center, the Beaufort Gyre is:

A clockwise circulation (looking from above the North Pole) in the Beaufort Sea, north of Alaska. This circulation results from an average high-pressure system that spawns winds over the region.

beaufort_gyre

Such a high pressure system has been in place over the Arctic Ocean for a few days now, and the effect of the clockwise circulation on the sea ice in the Beaufort Sea is already evident in these recent satellite images:

NASA Worldview “true-color” image of the Beaufort Sea on April 9th 2016, derived from the MODIS sensor on the Terra satellite
NASA Worldview “false-color” image of the Beaufort Sea on April 12th 2016, derived from the MODIS sensor on the Terra satellite

as well as in this animation of sea ice movement since February:

The high pressure is forecast to continue for several more days. Here’s the GFS forecast for April 20th, courtesy of MeteoCiel:

Northern Hemisphere surface pressure forecast for April 20th 2016

which shows a large system with a central pressure of 1040 hPa still sitting over the Northern Beaufort Sea. Next here’s an animation from the US Navy which forecasts ice thickness until April 19th:

April 13th 2016 ACNFS Beaufort Sea thickness forecast until April 19th

Note in particular the large area of open water forecast to be produced in the Chukchi sea off Barrow, Alaska by the end of the period. The continuing clockwise winds have already started reducing the area of sea ice in the Beaufort Sea at an unusually early date:

2016-04-13-Beaufort-AMSR2-Area_001

Amongst other things we’ll be keeping a close eye on the ice area in the Chukchi Sea over the next few days. The sun is already starting to bathe that area of our planet with its rays, and open ocean soaks up that heat much more readily than bright white ice.

[Edit – 16/04/2016]

Here’s an animation of the effect on sea ice of the Beaufort Gyre in overdrive from Neven at the Arctic Sea Ice Blog:

Neven-Gyre-20160414

Notice how towards the end of the animation another huge part of the ice pack, north of the Canadian Arctic Archipelago is pulled into the Gyre. This is mostly multi-year ice.

Here also is a MODIS image of the Beaufort Sea processed by A-Team at the Arctic Sea Ice Forum to highlight the areas of new ice:

ATeam-BeaufortDay106-2016

The 2016 Arctic Winter Sea Ice Puzzle

Professor Judith Curry recently posed the following rhetorical question on her “Climate Etc.” blog:

Arctic sea ice extent has been anomalously low this winter. The greatest anomalies are in the European sector, specifically in the Barents Sea. To what extent are the anomalies associated with warm temperatures?

Which she answered as follows:

So, what might be causing this particular anomaly? Some possibilities are:

  • Gobal warming (January 2016 was warmest Jan on record, according to the surface temperature analyses

  • Multidecadal oscillations (e.g. stadium wave) predicts ice recovery to be occurring in the same region (European Arctic) where we see the sea ice decline).

  • Seasonal weather circulation patterns – this has been a year with with unusual weather patterns, with both low temperature and high temperature records being set.

As regular readers will already be aware we have been blogging about anomalously warm temperatures in the Arctic all year and so felt well qualified to contribute to the “debate”. What a job that turned out to be! Early on in the proceedings the anticipated pronouncement was made by one of Judith’s “denizens”. A link to a ludicrously inaccurate article on Watts Up With That accompanied by the following words of wisdom:

Other measures are high.

Which of course they aren’t! Instead of stating the bleedin’ obvious Professor Curry replied:

I spotted this, no idea what to make of it.

You would think she and her denizens would therefore have been pleased when I attempted to explain to her what to make of it, but you would have been mistaken. The icing on the ad hominem cake was the aforementioned Anthony Watts driving by to accuse me of all sorts of nefarious activities without providing a single shred of evidence and then running for the hills when invited to actually prove his ludicrous allegations.

Since the denizens of “Climate Etc.” aren’t particularly interested let’s take stock here instead shall we? After every Arctic area and extent metric under the sun sitting at “lowest *ever” levels for weeks a recent increase in coverage on the Pacific side of the Arctic has changed that. The most up to date example of that is the JAXA/ADS extent, which currently looks like this:

vishop_extent-20160228

The latest reading is the merest whisker above 2015’s record low maximum. However in other respects things are most certainly not comparable with 2015. See for example this concentration comparison from Andrew Slater of the NSIDC:

ice_con_delt_20160227

Much more ice on the Pacific periphery where it will all have disappeared by September, as opposed to much less ice on the Atlantic side, even well to the north of 80 degrees latitude where the sun still does not shine. Here’s a video revealing how the sea ice North of the Pacific Ocean has been reacting to the sequence of hurricane force storms that have been passing through the area over the past couple of months:

Now let’s take a look at “near real time” Arctic sea ice thickness as measured by the CryoSat 2 satellite:

CryoSat2_20160225

Notice the absence of any thick ice in the Beaufort and Chukchi Seas, an obvious difference from last year? Notice too the large area of thick ice that looks as though it’s heading towards the Fram strait exit from the Central Arctic. Here’s another video, this time of sea ice movement over on the Atlantic side of the Arctic Ocean:

Those dark areas between Svalbard and the North Pole are suddenly starting to look as though they represent reality rather than a mere “artifact”, although perhaps they are merely transient evidence of yet another Arctic “heat wave”?

The New Normal In The Arctic

The latest headline on the so called “Real Science” blog reads as follows:

The New Normal In The Arctic – Cold Summers

According to “Steven Goddard”:

For the third year in a row, near-polar temperatures have dropped below normal in May.

meant_20150511

Both of the last two years, temperatures stayed below normal for the entire melt season.

The below normal summer temperatures are keeping the ice from melting, and have led to a large expansion in the amount of thick multi-year ice.

However the Arctic is unfortunately failing to cooperate with that narrative. Today we are unhappy to report that Tony Heller‘s favourite Arctic sea ice metric, the Danish Meteorological Institute 30% threshold extent, is at the lowest level ever for the date since their records began:

DMI-30_20150512

What is more, so is the JAXA 15% extent metric:

2015-05-12_JAXA

As if that wasn’t enough to be going on with, some big holes have already appeared in the middle of the supposedly multi-meter thick, multi-year sea ice in the Beaufort Sea, well away from the open water already warming up off the Mackenzie Delta:

NASA Worldview “true-color” image of The Beaufort Sea on May 11th, derived from bands 1, 4 and 3 of the MODIS sensor on the Aqua satellite

Sea Ice and Swells in the Beaufort Sea in the Summer of 2014

Today we’re going to delve into the application of surf science in the Arctic. If you’re not already familiar with the basics of how the best surf is created then perhaps you might first wish to take a detour to the StormSurf “Wave Basics” article:

Wind waves, though rideable, are not the optimal type of wave one likes to ride. Swells are much better. Wind waves are only the raw material that swells are made from. But, the more energy wind waves accumulate while being driven by wind, the greater the likelihood they will transform into a swell. Enough energy and the swell can travel the entire circumference of the globe with only a slow decay in size!

During a typical open ocean winter storm, one could expect to see winds of 45-55 kts blowing over 600-1000 nautical miles for 36 hours. In such a storm, the average highest wind waves (or ‘seas’) commonly reach 30-35 ft towards the center of the fetch area and produce a swell with a period of 17-20 secs.

Regular readers may recall that on August 24th 2014 we revealed this WaveWatch III “surf forecast” for the Beaufort Sea, which lies off the north coast of Alaska and the Canadian Northwest Territories (i.e. top center of the map):
alaska.hs.f009h-20140824and noted that the 2 meter waves depicted:

Have blasted past Point Barrow and are currently heading straight for the Beaufort Sea Marginal Ice Zone.

Here’s a video from the University of Washington’s Applied Physics Laboratory which explains that the Marginal Ice Zone is:

The area between declining unbroken sea ice and the expanding area of open water.

The theoretical significance of such swells has been discussed in a number of academic papers recently. Take for example these extracts from “Swell and sea in the emerging Arctic Ocean” by Jim Thomson from the University of Washington and W. Erick Rogers from the US Naval Research Laboratory. Note first of all that the authors distinguish between “wind seas” and “swells” as follows:

Pure wind seas have a wave age less than one, indicating that the wind is driving the waves, and these points cluster largely below the Pierson–Moskowitz limit. Swells have a wave age greater than one, indicating that the waves are outrunning the wind.

They then go on to use some more terms very familiar to the average surfer:

Ocean surface waves (sea and swell) are generated by winds blowing over a distance (fetch) for a duration of time. In the Arctic Ocean, fetch varies seasonally from essentially zero in winter to hundreds of kilometers in recent summers. Using in situ observations of waves in the central Beaufort Sea, combined with a numerical wave model and satellite sea ice observations, we show that wave energy scales with fetch throughout the seasonal ice cycle. Furthermore, we show that the increased open water of 2012 allowed waves to develop beyond pure wind seas and evolve into swells. The swells remain tied to the available fetch, however, because fetch is a proxy for the basin size in which the wave evolution occurs. Thus, both sea and swell depend on the open water fetch in the Arctic, because the swell is regionally driven. This suggests that further reductions in seasonal ice cover in the future will result in larger waves, which in turn provide a mechanism to break up sea ice and accelerate ice retreat.

It is possible that the increased wave activity will be the feedback mechanism which drives the Arctic system toward an ice-free summer. This would be a remarkable departure from historical conditions in the Arctic, with potentially wide-ranging implications for the air-water-ice system and the humans attempting to operate there.

In practice there were several more swells that impacted the Beaufort Sea marginal ice zone over the course of the next couple of weeks. Here’s what the charts looked like, as visualised by MagicSeaweed.com rather than NOAA:

Beaufort Sea on August 27th 2014 - Winds / Wave Height / Wave Period
Beaufort Sea on August 27th 2014 – Winds / Wave Height / Wave Period
Beaufort Sea on September 1st 2014 - Wind / Swell / Period
Beaufort Sea on September 1st 2014 – Winds / Wave Height / Wave Period
Beaufort Sea on September 7th 2014 - Wind / Swell / Period
Beaufort Sea on September 7th 2014 – Winds / Wave Height / Wave Period

Note that on the right of each set of three is a depiction of the period of the waves in question. As StormSurf points out:

Chop tends to have a period ranging from 3-8 seconds. That is, there is anywhere from 3-8 seconds between each wave crest. Wind waves range from 9-12 seconds. Ground swells range from 13-15 seconds, and strong ground swells have a period anywhere from 16-25 or more seconds.

Thus the final swell on September 7th was actually the best of the bunch, with a small area of waves over 10 feet in height and with a period of over 9 seconds. According to StormSurf those are merely “wind waves” and not yet a full blown “swell”. To give you a feel for such waves here’s what some “wind waves” hitting the beach at Barrow looked like on September 4th 2014:

BarrowCam_20140904_0834


Next here’s another video that reveals what effect those series of waves had on the sea ice in the Beaufort Sea:

For future reference here also is the same swell described by Thomson and Rogers, but illustrated in an identical “surfer friendly” format to the 2014 swells we’ve been looking at:

Beaufort Sea on September 18th 2012 - Wind / Swell / Period
Beaufort Sea on September 18th 2012 – Winds / Wave Height / Wave Period

whilst here is the swell produced by the “Great Arctic Cyclone” of early August 2012, also mentioned in passing by Thomson and Rogers:

Beaufort Sea on August 5th 2012 - Winds / Wave Height / Wave Period
Beaufort Sea on August 5th 2012 – Winds / Wave Height / Wave Period

As you can see, if you’re a surfer used to tracking swells across the world’s oceans at least, whilst the September 2012 swell was indeed rather more substantial than those we have looked at in 2014, with a height in excess of 20 feet, the period was too short to qualify as a full blown swell and it was in fact directed away from the ice edge rather than towards it. Here’s what that 2012 swell looked like once it reached Barrow:

BarrowCam_20120918_0804

All of which does rather make one wonder what might happen if a slightly longer period swell directed at the ice edge in the Beaufort Sea were to occur at some point in the not too distant future? Whilst we all wait with bated breath to discover what that future holds for the sea ice in the Arctic, not to mention the beach at Barrow, here’s another video about the 2014 Marginal Ice Zone Program, which summarises the year’s campaign as a whole:

Note that Craig Lee says that:

We had very little wave activity. It was surprisingly calm when we were out there in the Araon, both when we were in the ice and in the open water. There just wasn’t much wind, and so there weren’t very many surface waves.

However at least one of the “robots” he refers to did discover some significant wave activity. Here’s a visualisation of SWIFT 11‘s record of significant wave height as it floated across the Beaufort Sea in the summer of 2014:

2014-Swift11-WaveHeight

I don’t know about you, but I don’t think I would describe 4.5 meter waves as “surprisingly calm”, especially in the Arctic!


David Cameron Practices for Big Wave Surfing Contest

Shock News! It has recently been brought to our attention by the online version of the Western Morning News (WMN for short), our local daily newspaper, that the once Great Britain’s current Prime Minister (GBPM for short) has been secretly training for next week’s Arctic Basin big wave surfing contest just down the road from here in North Cornwall! According to the WMN:

David Cameron let criticism of his Cornish holiday wash over him today as he hit the waves. Today he spent the afternoon riding the waves on the beach at Polzeath, surrounded by ordinary holidaymakers. Mr Cameron took to the water in a three quarter-length wet suit and brightly-coloured bodyboard. He was accompanied by a detective who kept a discreet watch on him from the shallows.

Despite the discreet detective an intrepid paparazzo braved the pounding Polzeath surf and managed to grab this shot of Mr. Cameron in action:

DaveSponging

The next obvious question, to us here in the Great White Con Ivory Towers at least, is whether Dave would prefer to wear neoprene or fur for the competition next week. Which do you think suits him best?

In the meantime the surf on Barrow beach is building:

and even as we speak a pulse of swell has blasted past Point Barrow and is currently heading straight for the Beaufort Sea Marginal Ice Zone.

alaska.hs.f009h-20140824

“Real Science” Censorship – Episode 2

After having a brush with the “Real Science” censor last month I’ve really gone and done it now. Steven Goddard’s blog has been badmouthing Al Gore recently. I’m afraid I couldn’t let that slight on Al’s predictive abilities go unchallenged. Steve evidently didn’t care for my suggestion that he “is fond of poetic license”, so my alter ego is “now spam” there too:

I’ve cut out much of the gratuitous abuse in the ensuing conversation, but you can peruse an archived version if you so desire. Note amongst other things that Al Gore never mentioned “16 foot thick ice in the Beaufort Sea”. Here are the expurgated highlights:

Them:

Nobel Peace Prize Laureate Al Gore says that the 16 foot thick ice in the Beaufort Sea will all melt in the next few weeks.

http://www.examiner.com/article/gore-arctic-ocean-ice-free-as-early-as-2014

Us:

“Some of the models suggest that there is a 75 percent chance that the entire north polar ice cap during some of the summer months will be completely ice-free within the next five to seven years,” Gore said in 2009.

There’s still plenty of time left for some of the models to be proved 75% correct!


Them:

“Some models suggest.” I love that – so very scientific. Some do, others don’t.


Us:

I realise Steve is fond of poetic license, but my point is that in the article Steve references Al Gore did not “predict an ice free Arctic in 2014″. He didn’t even “predict an ice free Arctic by 2016 at the latest”


Them:

I have warned you numerous times about lying about me. This is your last warning
http://www.examiner.com/article/gore-arctic-ocean-ice-free-as-early-as-2014


Us:

Steve – My Gore quote from April 15, 2014 at 10:41 am is cut/pasted from the article you just linked to. Here’s another quote from the same article, presumably a journalist’s interpretation of Gore’s words:
“Today at the U.N. climate conference in Copenhagen, Al Gore said there is new computer modeling that suggests the Arctic Ocean may be nearly ice-free in the summertime as early as 2014.”


Them:

“Some of the models suggest that there is a 75 percent chance that the entire north polar ice cap during some of the summer months will be completely ice-free within the next five to seven years,” Gore said.
Attack Gore for being an idiot. Not me for reporting on it.


Us:

Unpublished comment on Steven Goddard's "Real Science" blog from Wednesday April 16th at 12:55 UTC
Unpublished comment on the “Real Science” blog from Wednesday April 16th at 12:55 UTC


Them:

They have so far neglected to publish the above comment.


Us:

We’ll keep you posted!

New Arctic Sea Ice Resources

Stung by some unusually constructive criticism from Anthony Watts we have (somewhat hurriedly) added several new pages to the Great White Con “Resources” section of this web site. They contain the sort of information that is rather tricky to update automatically on a daily basis, and concentrate on resources that help the interested searcher after truth get a handle on the thickness and hence volume of the sea ice in the Arctic, on a regional as well as pan Arctic scale.

The first section is entitled “Arctic Sea Ice Graphs“, and here’s an example of one graph which reveals the ice volume in various regions of the Arctic, based on the output of the PIOMAS model:

PIOMAS regional volume breakdown for March 2014

[Graph by Chris Reynolds on the Dosbat blog]

The second section is entitled “Ice Mass Balance Buoys“. As the name hopefully suggests, this section displays data reported by the Cold Regions Research and Engineering Laboratory’s currently active ice mass balance buoys in a variety of novel formats. These buoys are deployed on a regular basis at selected locations across the Arctic, and report on a number of different parameters including snow depth, ice thickness and temperature. By way of example here’s a couple of reports from IMB 2013F, which was originally deployed last August on what was then classified as “first year” ice in the Beaufort Sea. First of all here’s the Google Maps/Earth view that reveals how the buoy has moved around the Arctic since then, and shows how clicking on one of the “pushpins” reveals the values of a variety of interesting metrics on a daily basis:

Google map of the movement of IMB 2013F

As you can see, last August the thickness of the ice floe that the buoy is located upon was 1.4 metres thick. If you click through to the live map and experiment you will discover, amongst a variety of other things, that the ice under the buoy is now 1.68 meters thick, with an additional 49 cm of snow on top of that.

A second set of images shows graphs revealing the temperature above, below and within the ice, currently on a monthly basis:

2013F-Temp-20140401

Click on the graph to view a larger version. This one requires a certain amount of interpretation, but the first thing to note is that the numbers across the top represent the position of thermistors spaced 10 cm apart on a pole that is mounted vertically through the ice floe. Number 1 is in the air above the floe, the rightmost side of the graph (number 26 in this case) is in the water below the ice floe, and somewhere in between those extremes the temperature sensors can also be in the midst of either ice or snow.

At the end of March the interface between ice and snow in this case was somewhere between sensors 8 and 9, and hence at a temperature of around – 7 degrees Celsius, by which time the buoy had moved from the Canadian waters where it started into the area of the Beaufort Sea north of Alaska.

For further discussion about the interpretation of our new resources please use the comment section on the “About Our Arctic Sea Ice Resources” page. For technical observations and suggestions for improvements feel free to comment below!


The Truth About Arctic Sea Ice Thickness

Shock News! According to Steven Goddard last week “The Arctic continues to recover“. However some fresh new evidence has been uncovered today:

Them:

ACNFS forecast for Arctic sea ice thickness on March 11th 2014, from the March 3rd model run
ACNFS forecast for Arctic sea ice thickness on March 11th 2014

[Image from the 1/12° Arctic Cap HYCOM/CICE/NCODA archive]

Meanwhile over on Twitter:

Us:


 Them:


 Us:

PIOMAS gridded Arctic sea ice thickness for February 2014
SMOS Arctic sea ice thickness comparison for March 1st 2011-14

[Images courtesy of Wipneus on the Arctic Sea Ice Forum]