After having a brush with the “Real Science” censor last month I’ve really gone and done it now. Steven Goddard’s blog has been badmouthing Al Gore recently. I’m afraid I couldn’t let that slight on Al’s predictive abilities go unchallenged. Steve evidently didn’t care for my suggestion that he “is fond of poetic license”, so my alter ego is “now spam” there too:
I’ve cut out much of the gratuitous abuse in the ensuing conversation, but you can peruse an archived version if you so desire. Note amongst other things that Al Gore never mentioned “16 foot thick ice in the Beaufort Sea”. Here are the expurgated highlights:
Them:
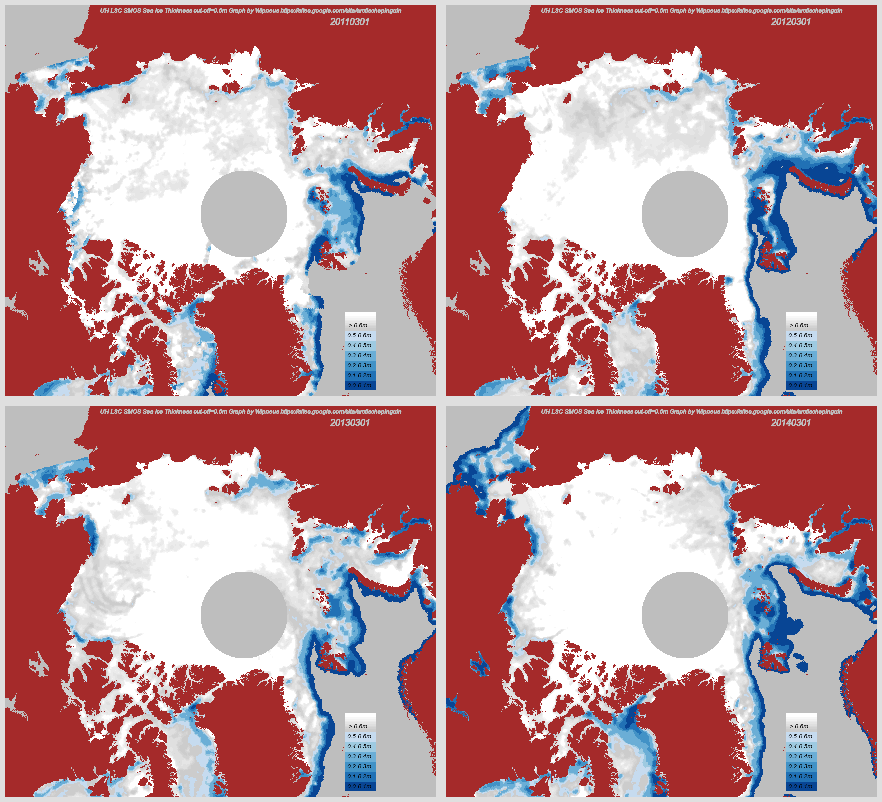
Nobel Peace Prize Laureate Al Gore says that the 16 foot thick ice in the Beaufort Sea will all melt in the next few weeks.
http://www.examiner.com/article/gore-arctic-ocean-ice-free-as-early-as-2014
Us:
“Some of the models suggest that there is a 75 percent chance that the entire north polar ice cap during some of the summer months will be completely ice-free within the next five to seven years,” Gore said in 2009.
There’s still plenty of time left for some of the models to be proved 75% correct!
Them:
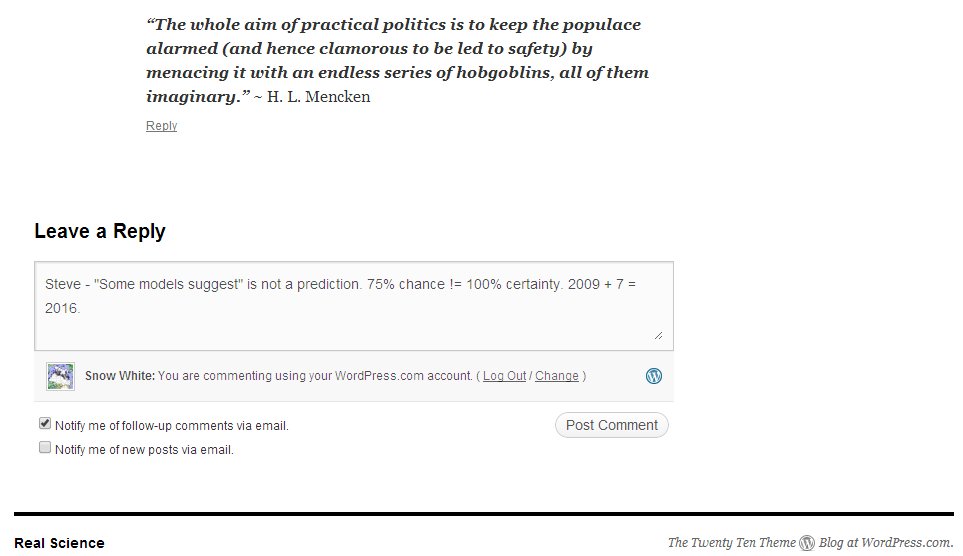
“Some models suggest.” I love that – so very scientific. Some do, others don’t.
Us:
I realise Steve is fond of poetic license, but my point is that in the article Steve references Al Gore did not “predict an ice free Arctic in 2014″. He didn’t even “predict an ice free Arctic by 2016 at the latest”
Them:
I have warned you numerous times about lying about me. This is your last warning
http://www.examiner.com/article/gore-arctic-ocean-ice-free-as-early-as-2014
Us:
Steve – My Gore quote from April 15, 2014 at 10:41 am is cut/pasted from the article you just linked to. Here’s another quote from the same article, presumably a journalist’s interpretation of Gore’s words:
“Today at the U.N. climate conference in Copenhagen, Al Gore said there is new computer modeling that suggests the Arctic Ocean may be nearly ice-free in the summertime as early as 2014.”
Them:
“Some of the models suggest that there is a 75 percent chance that the entire north polar ice cap during some of the summer months will be completely ice-free within the next five to seven years,” Gore said.
Attack Gore for being an idiot. Not me for reporting on it.
Us:
Them:
They have so far neglected to publish the above comment.
Us:
We’ll keep you posted!