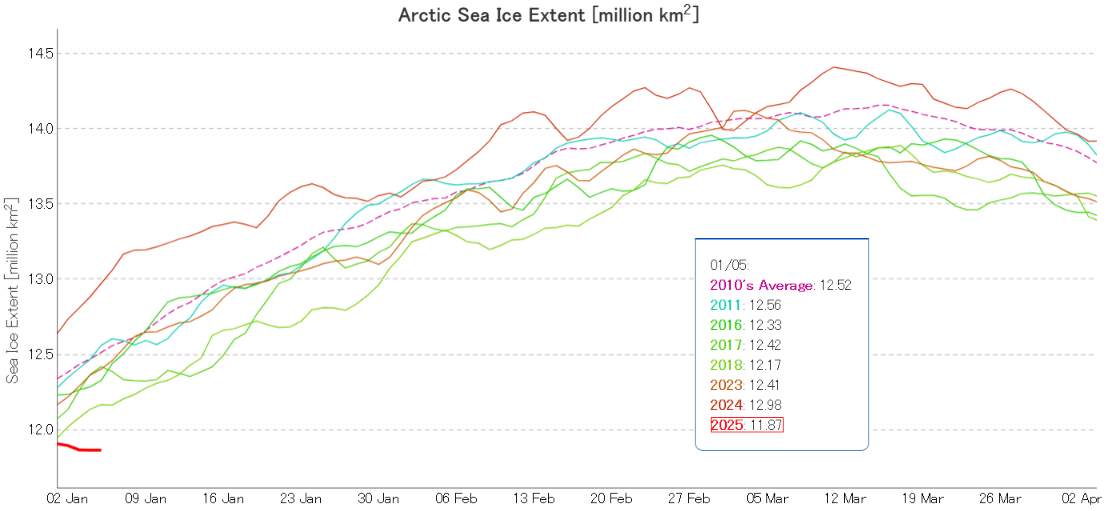
The New Year began with JAXA/ViSHOP extent lowest for the date in the satellite era, just below 2018 . Since then extent has reduced, and there is now a large gap:
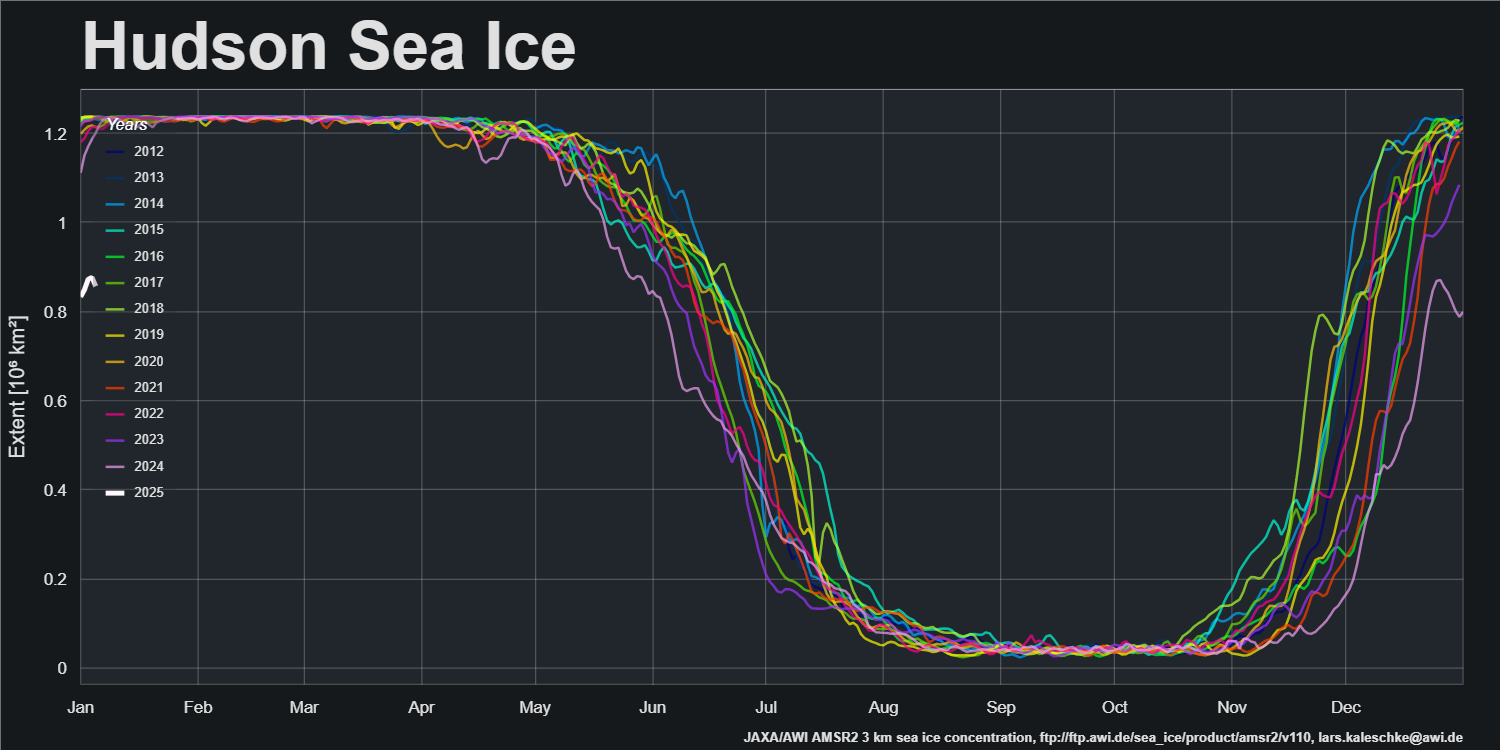
The primary reason for this is the remaining open water in Hudson Bay:
In previous years Hudson Bay has been covered by sea ice by this time of year, but in 2025 a large area remains unfrozen in early January!
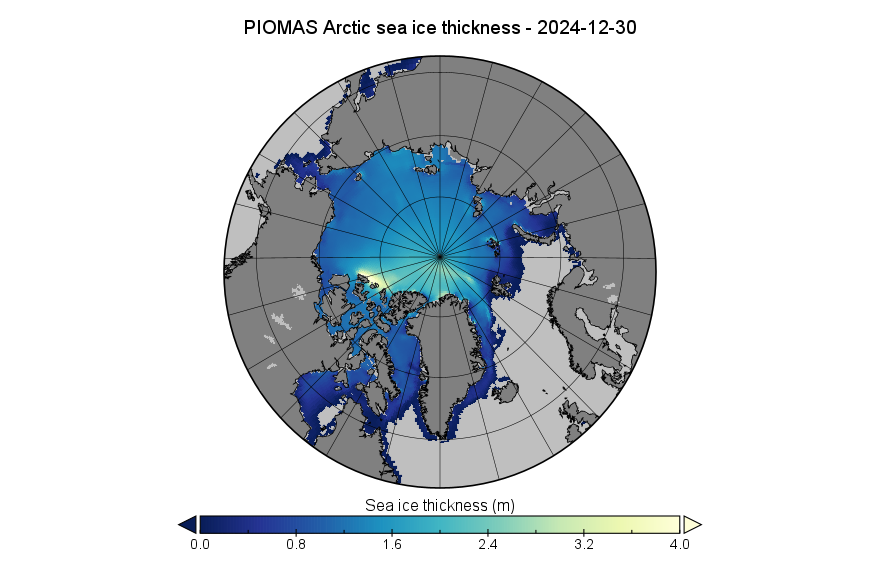
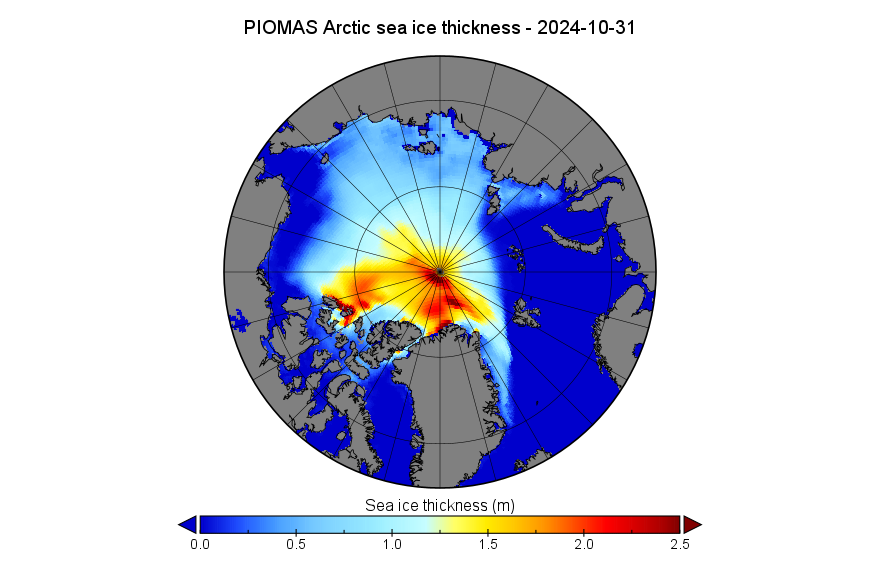
Due to the way PIOMAS handles the leap years the last gridded thickness data of 2024 is dated December 30th:
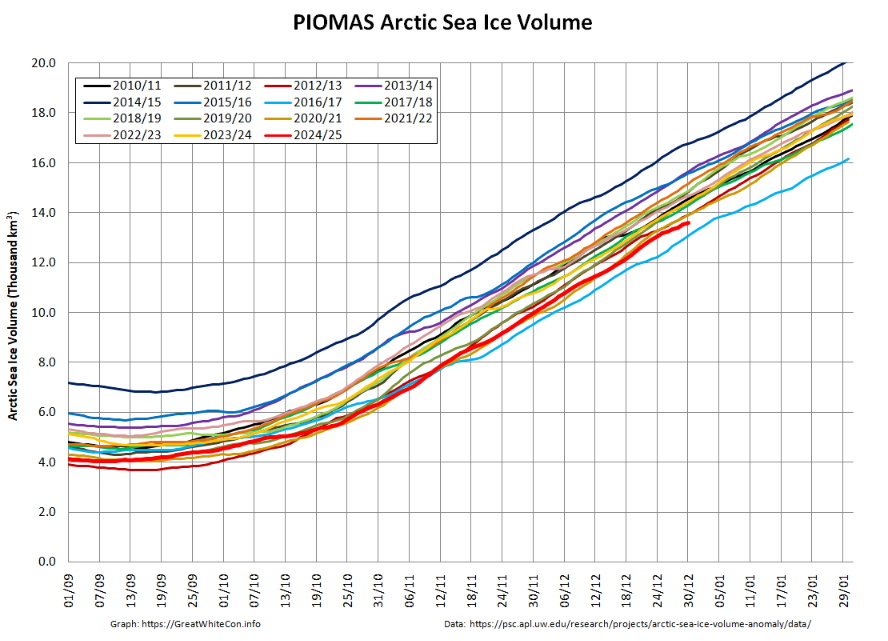
By December 30th Arctic sea ice volume had increased to 13.61 thousand km³, 2nd lowest for the date in the PIOMAS record:
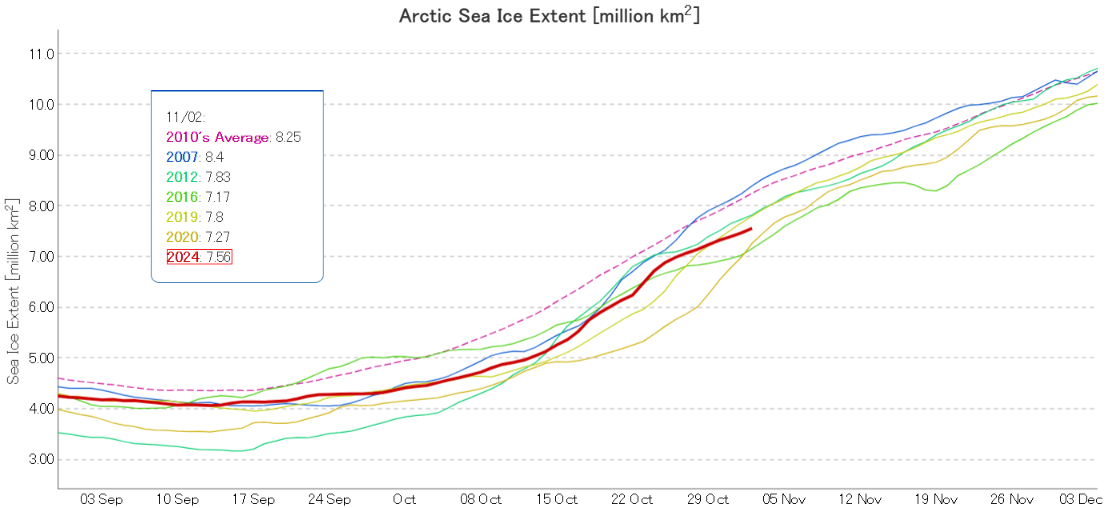
The Laptev and East Siberian Seas have now refrozen. Consequently Arctic sea ice extent is now increasing more slowly, and JAXA/ViSHOP extent is 3rd lowest for the date in the satellite era:
Note the change in scale from previous months, to allow for easier comparison with the “near real time” CryoSat-2/SMOS merged thickness data from the Alfred Wegener Institute:
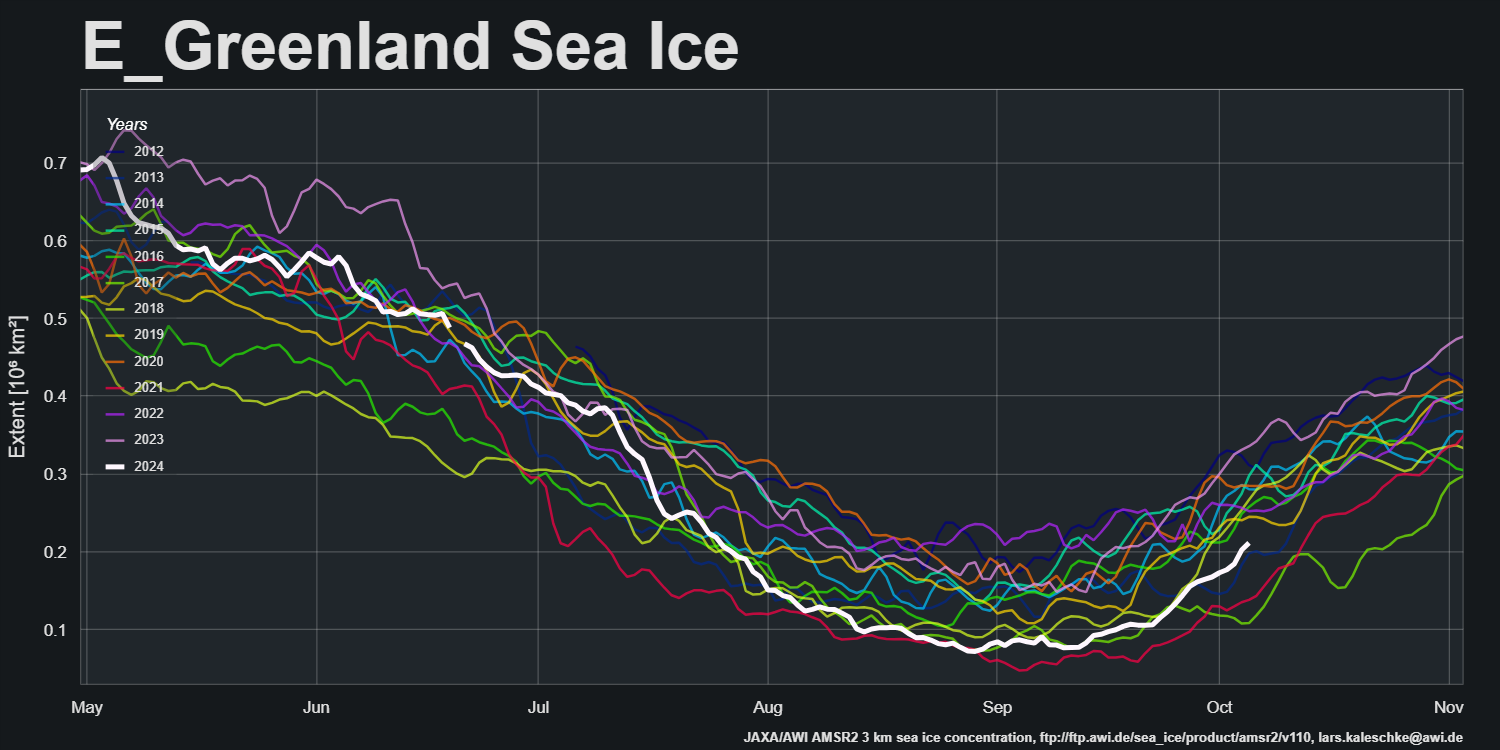
The JAXA extent graph is currently not updating, so let’s begin this month with the latest AMSR2 sea ice concentration map from the Alfred Wegener Institute. Click the image to see a ~10 Mb animation of the last four weeks:
Note in particular the restart of export into the East Greenland Sea via the Fram Strait:
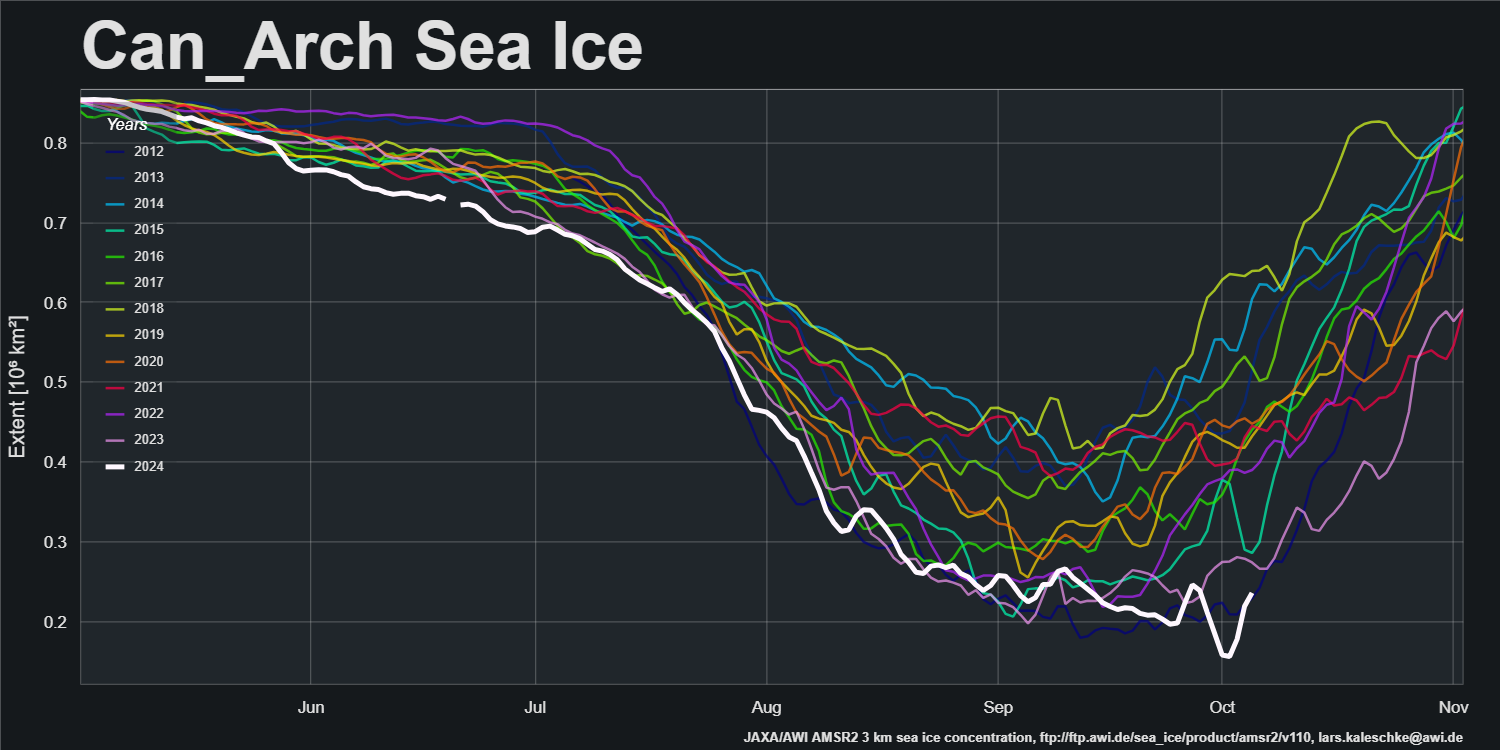
and the movement of ice within the Canadian Arctic Archipelago:
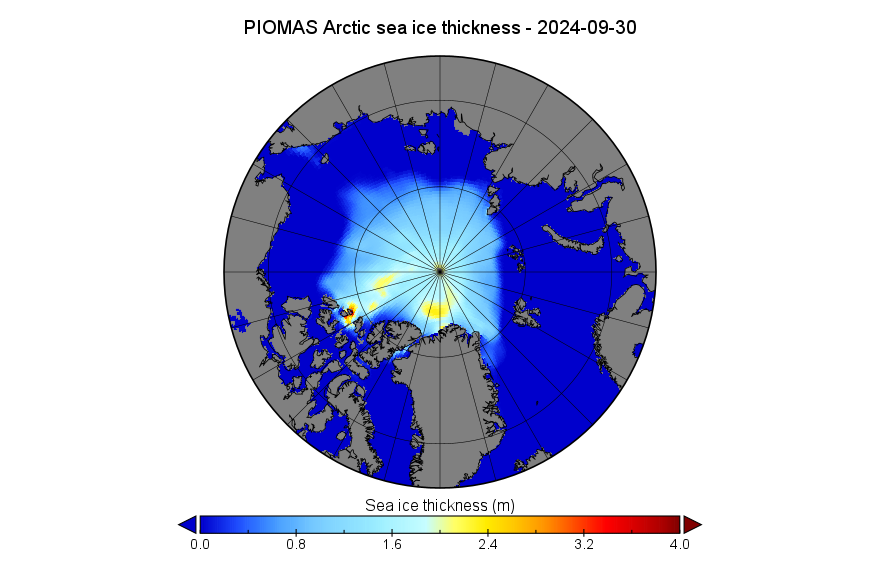
The PIOMAS gridded thickness data for September 2024 has been released:
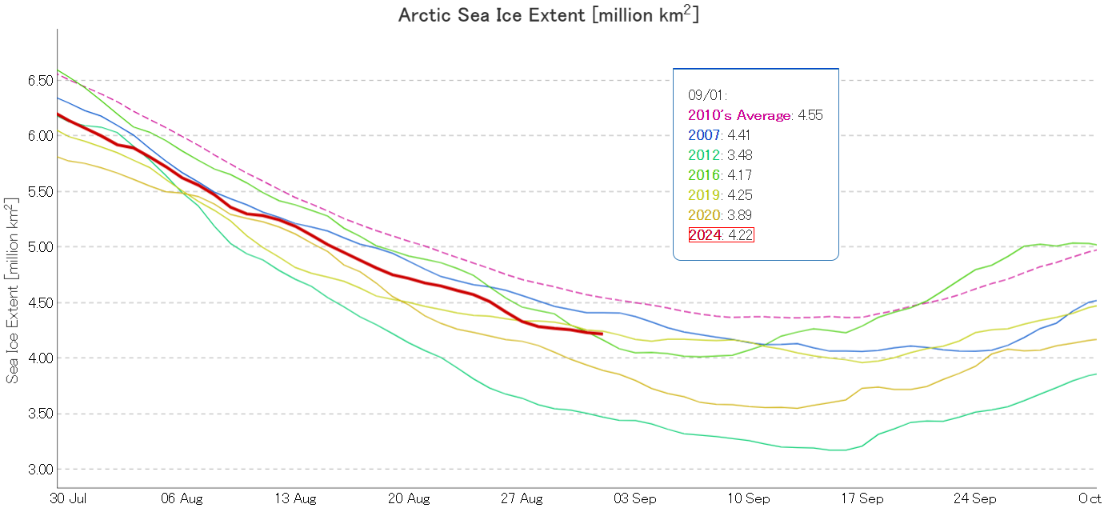
At the beginning of September JAXA/ViSHOP extent was 4th lowest for the date in the satellite era:
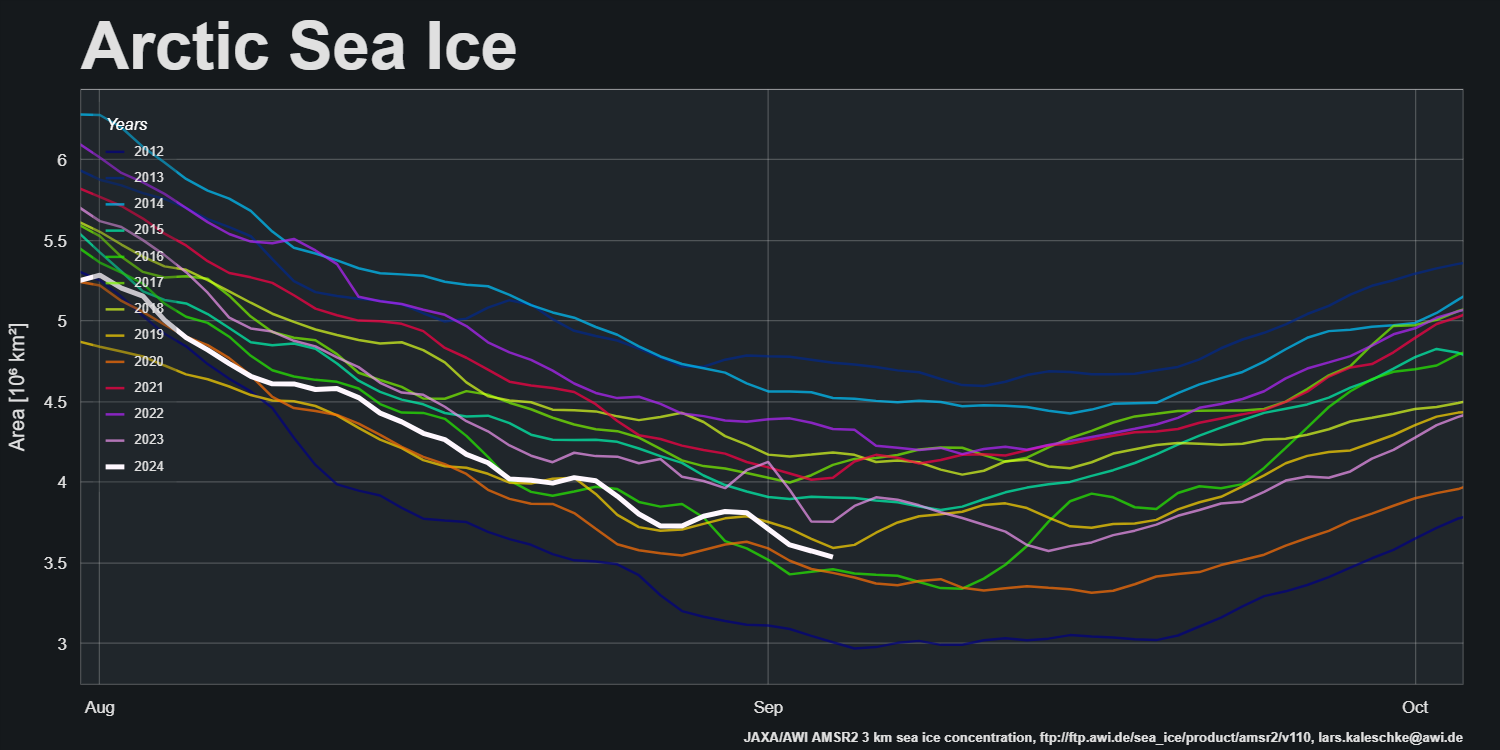
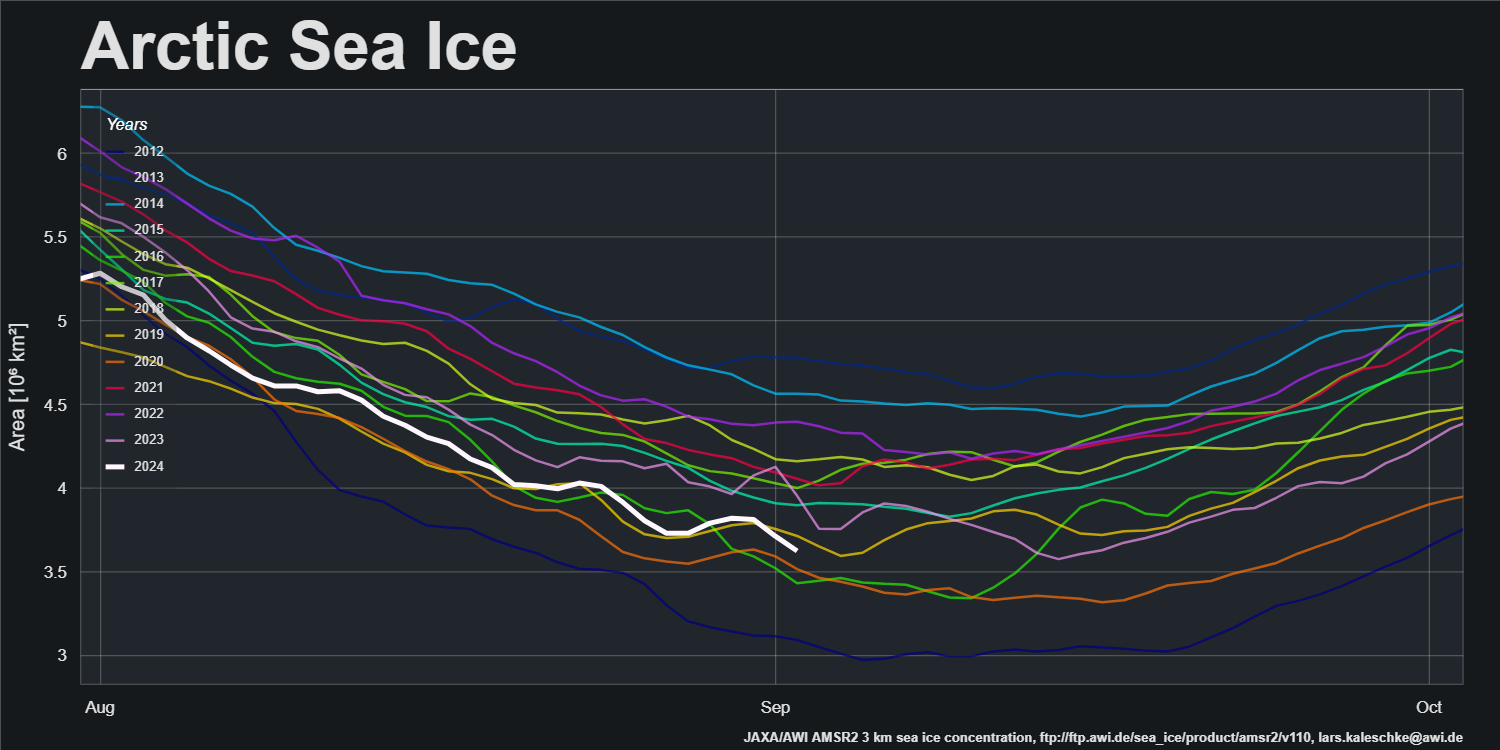
For much more detail on sea ice extent for the next few weeks please see the dedicated 2024 minimum thread. However, note that as extent has been flatlining sea ice area is still declining:
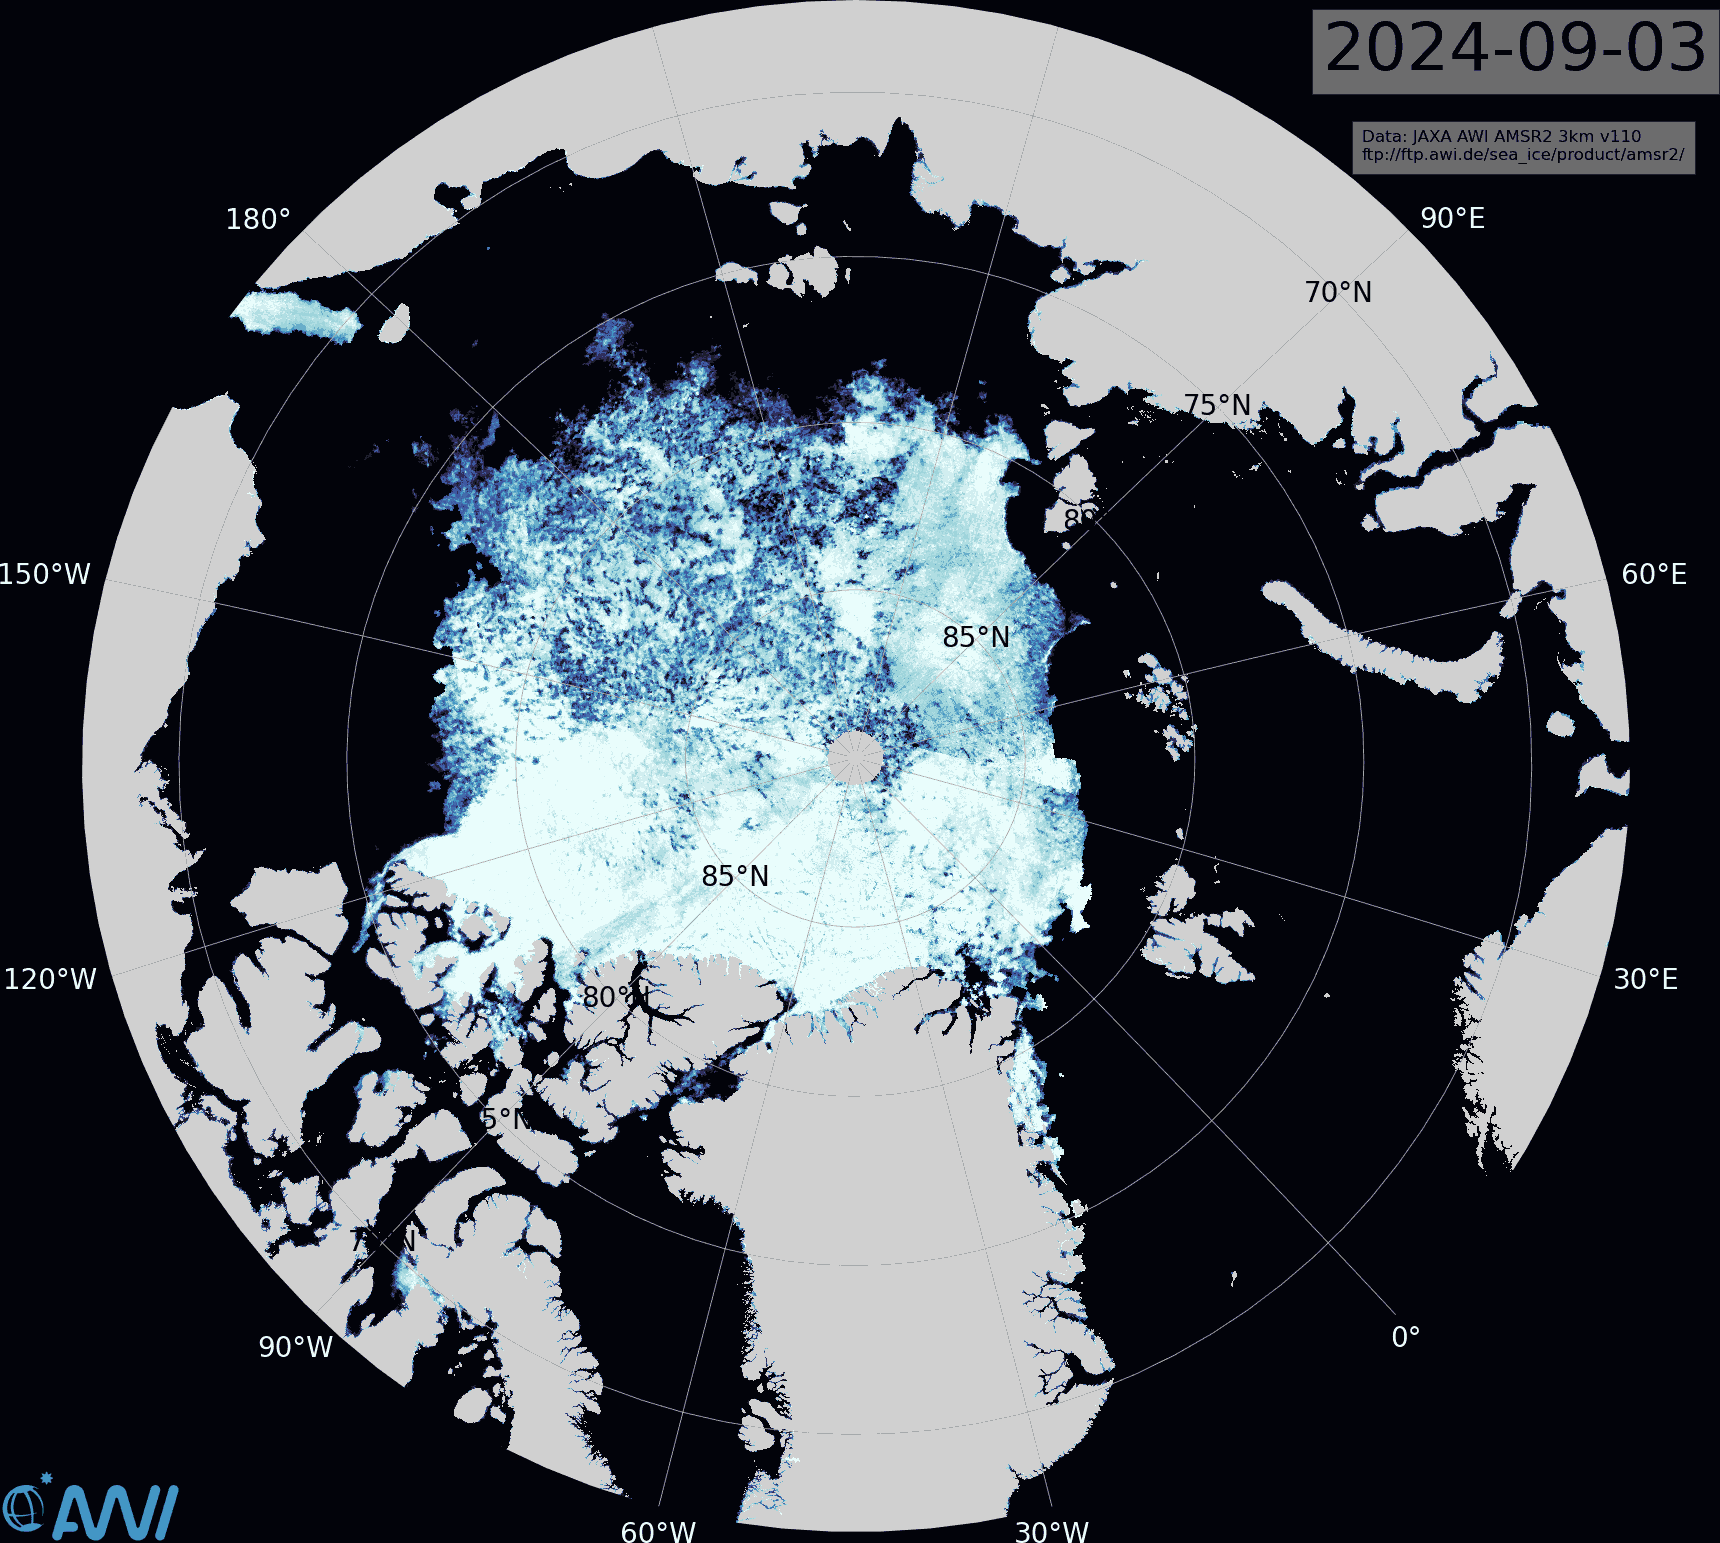
The latest AMSR2 sea ice concentration map from the Alfred Wegener Institute reveals that the area of thick ice in the Chukchi Sea has still not melted:
The most recent sea ice age map currently available dates from the beginning of August. Comparison with the concentration map shows that most of the remaining first year ice is highly fragmented, even close to the North Pole:
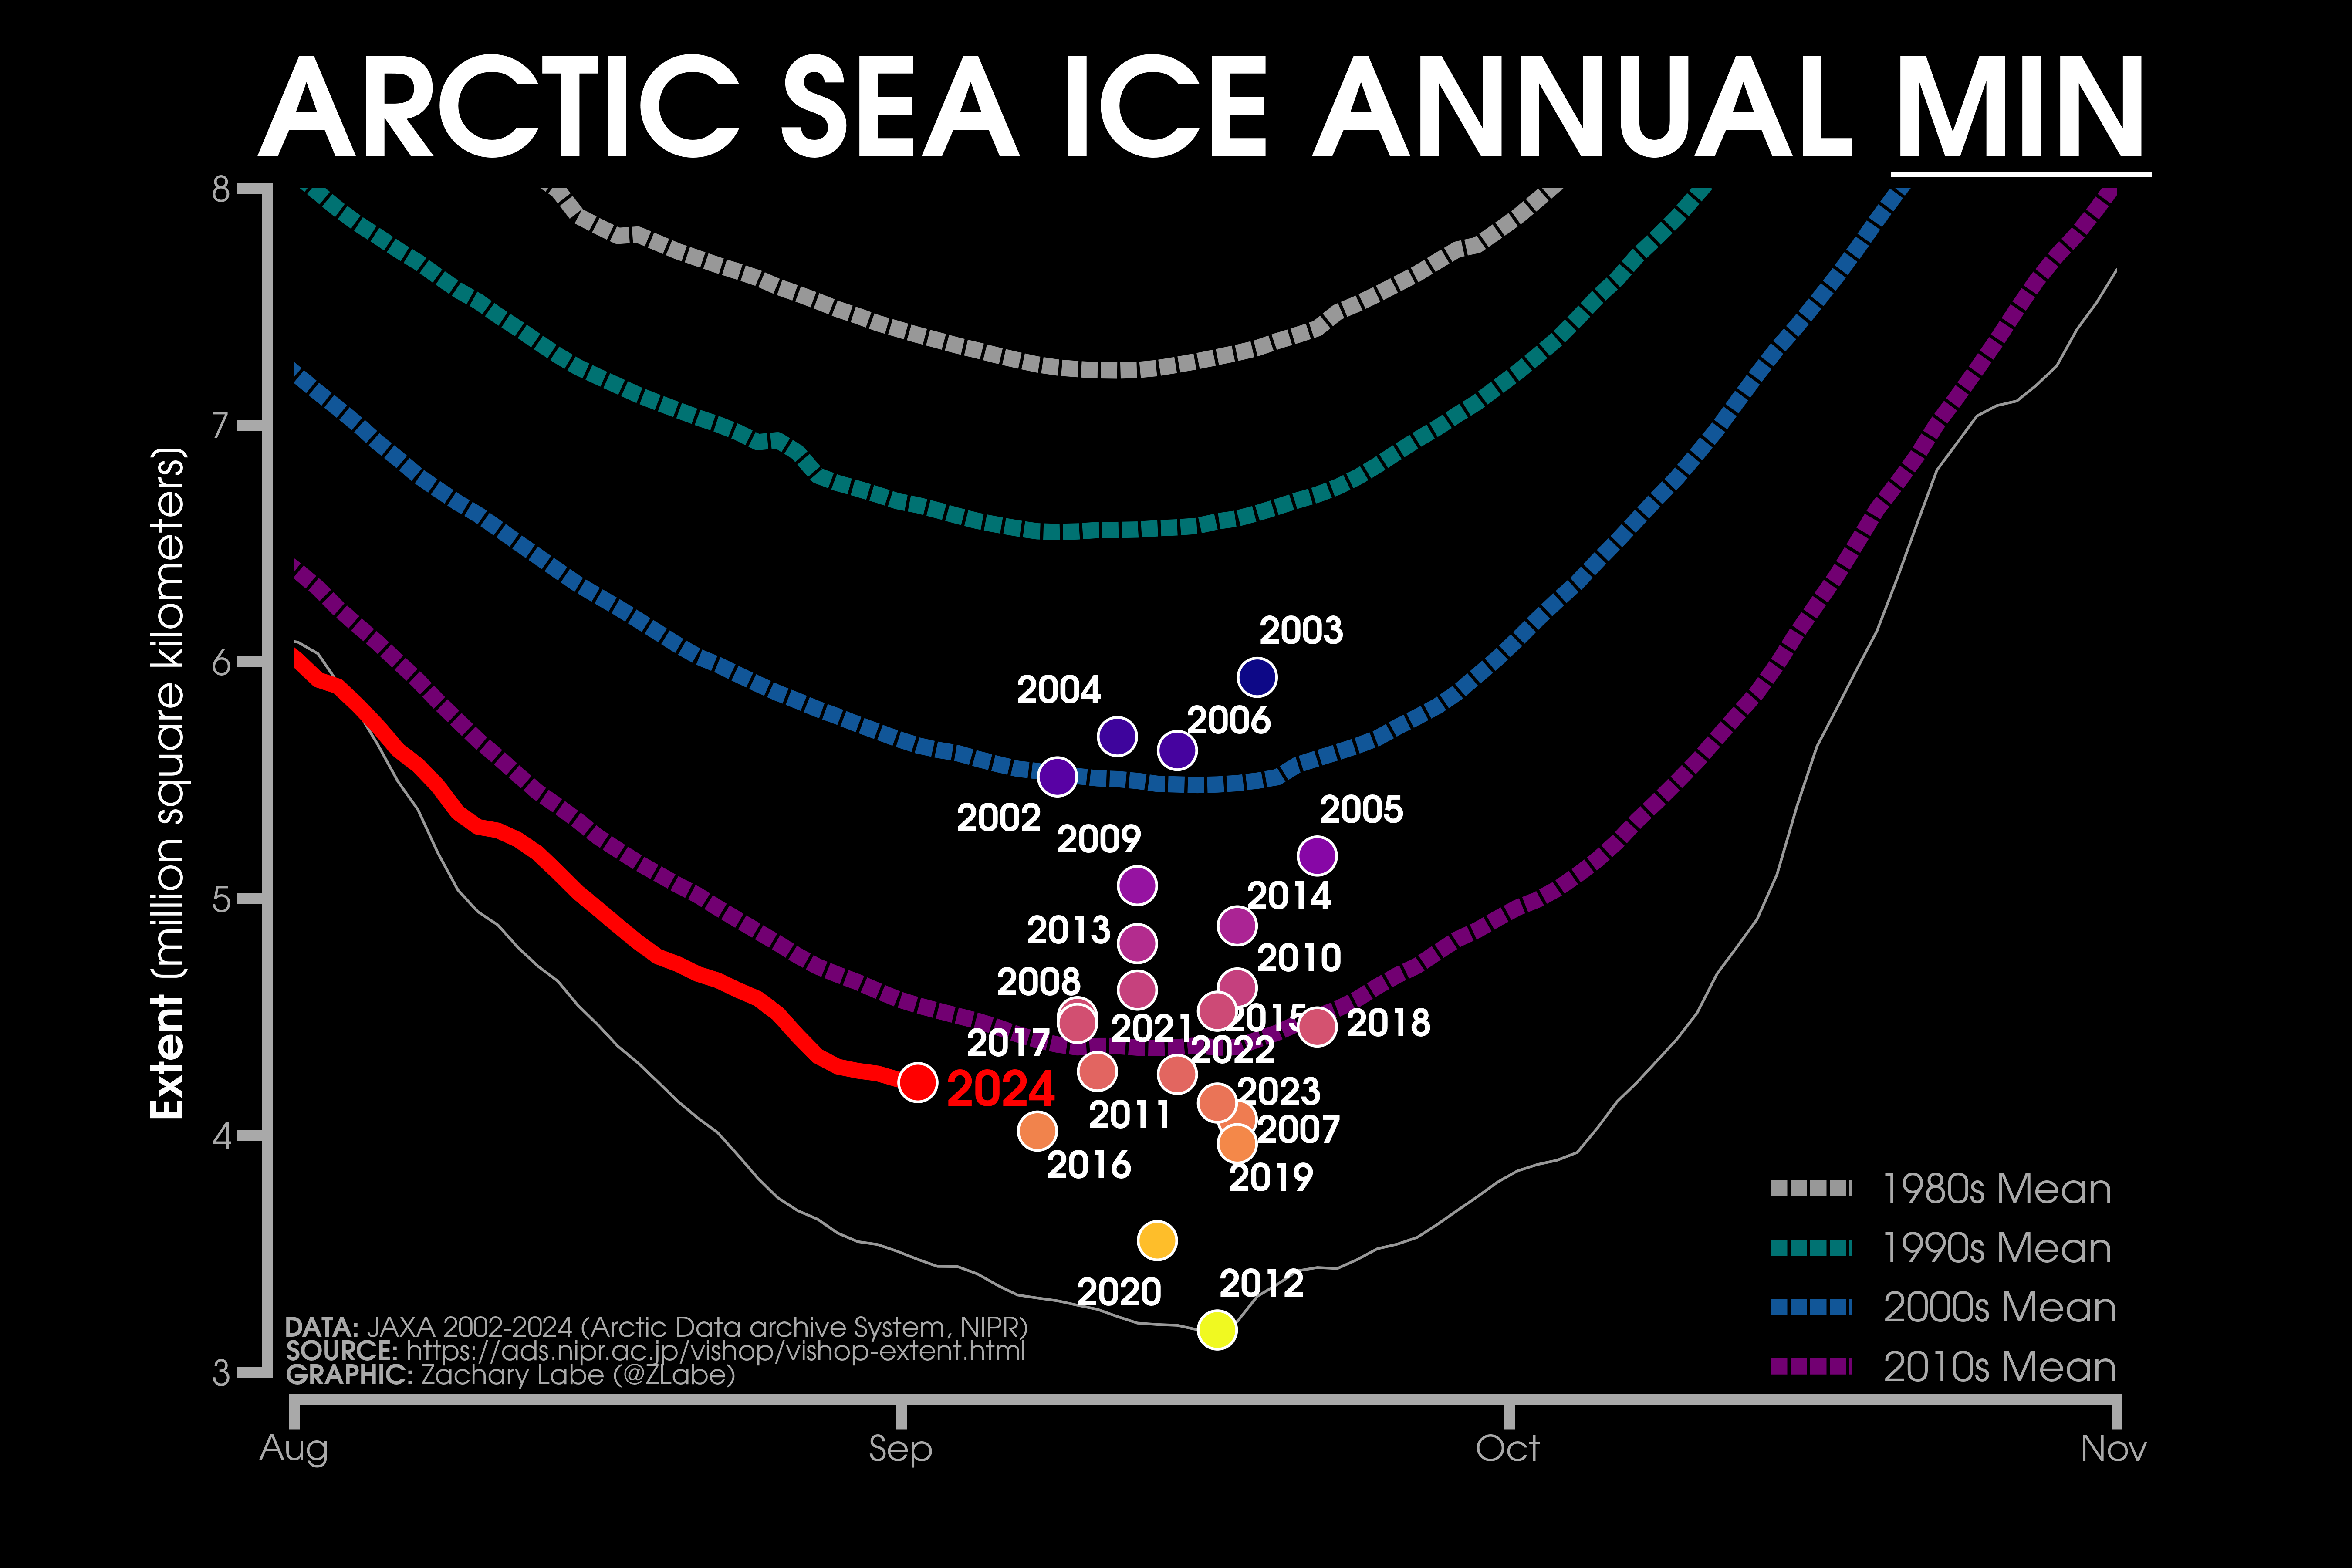
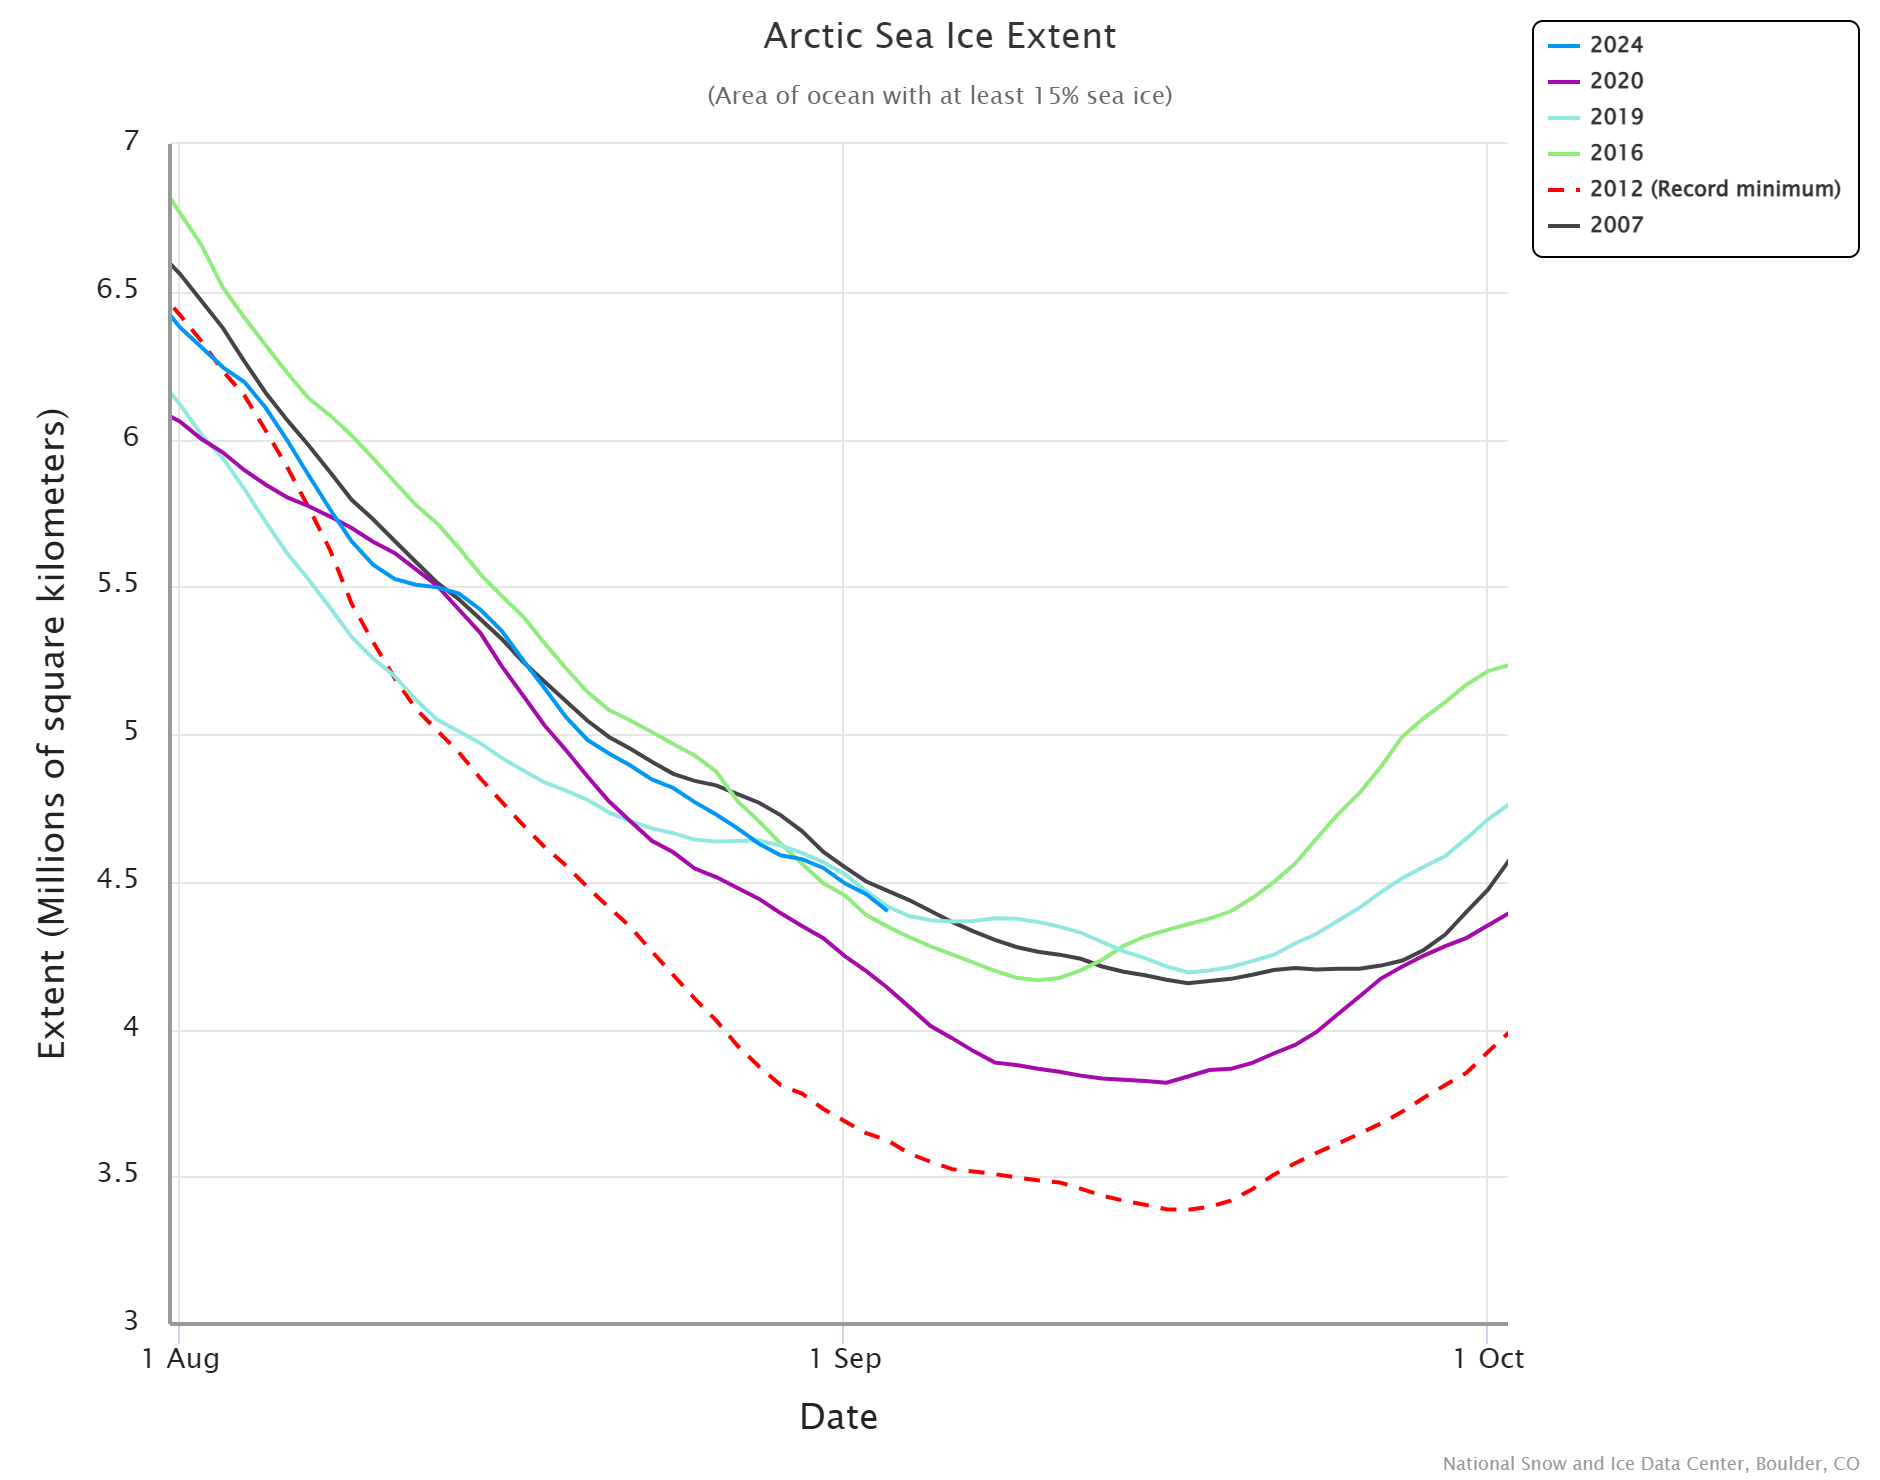
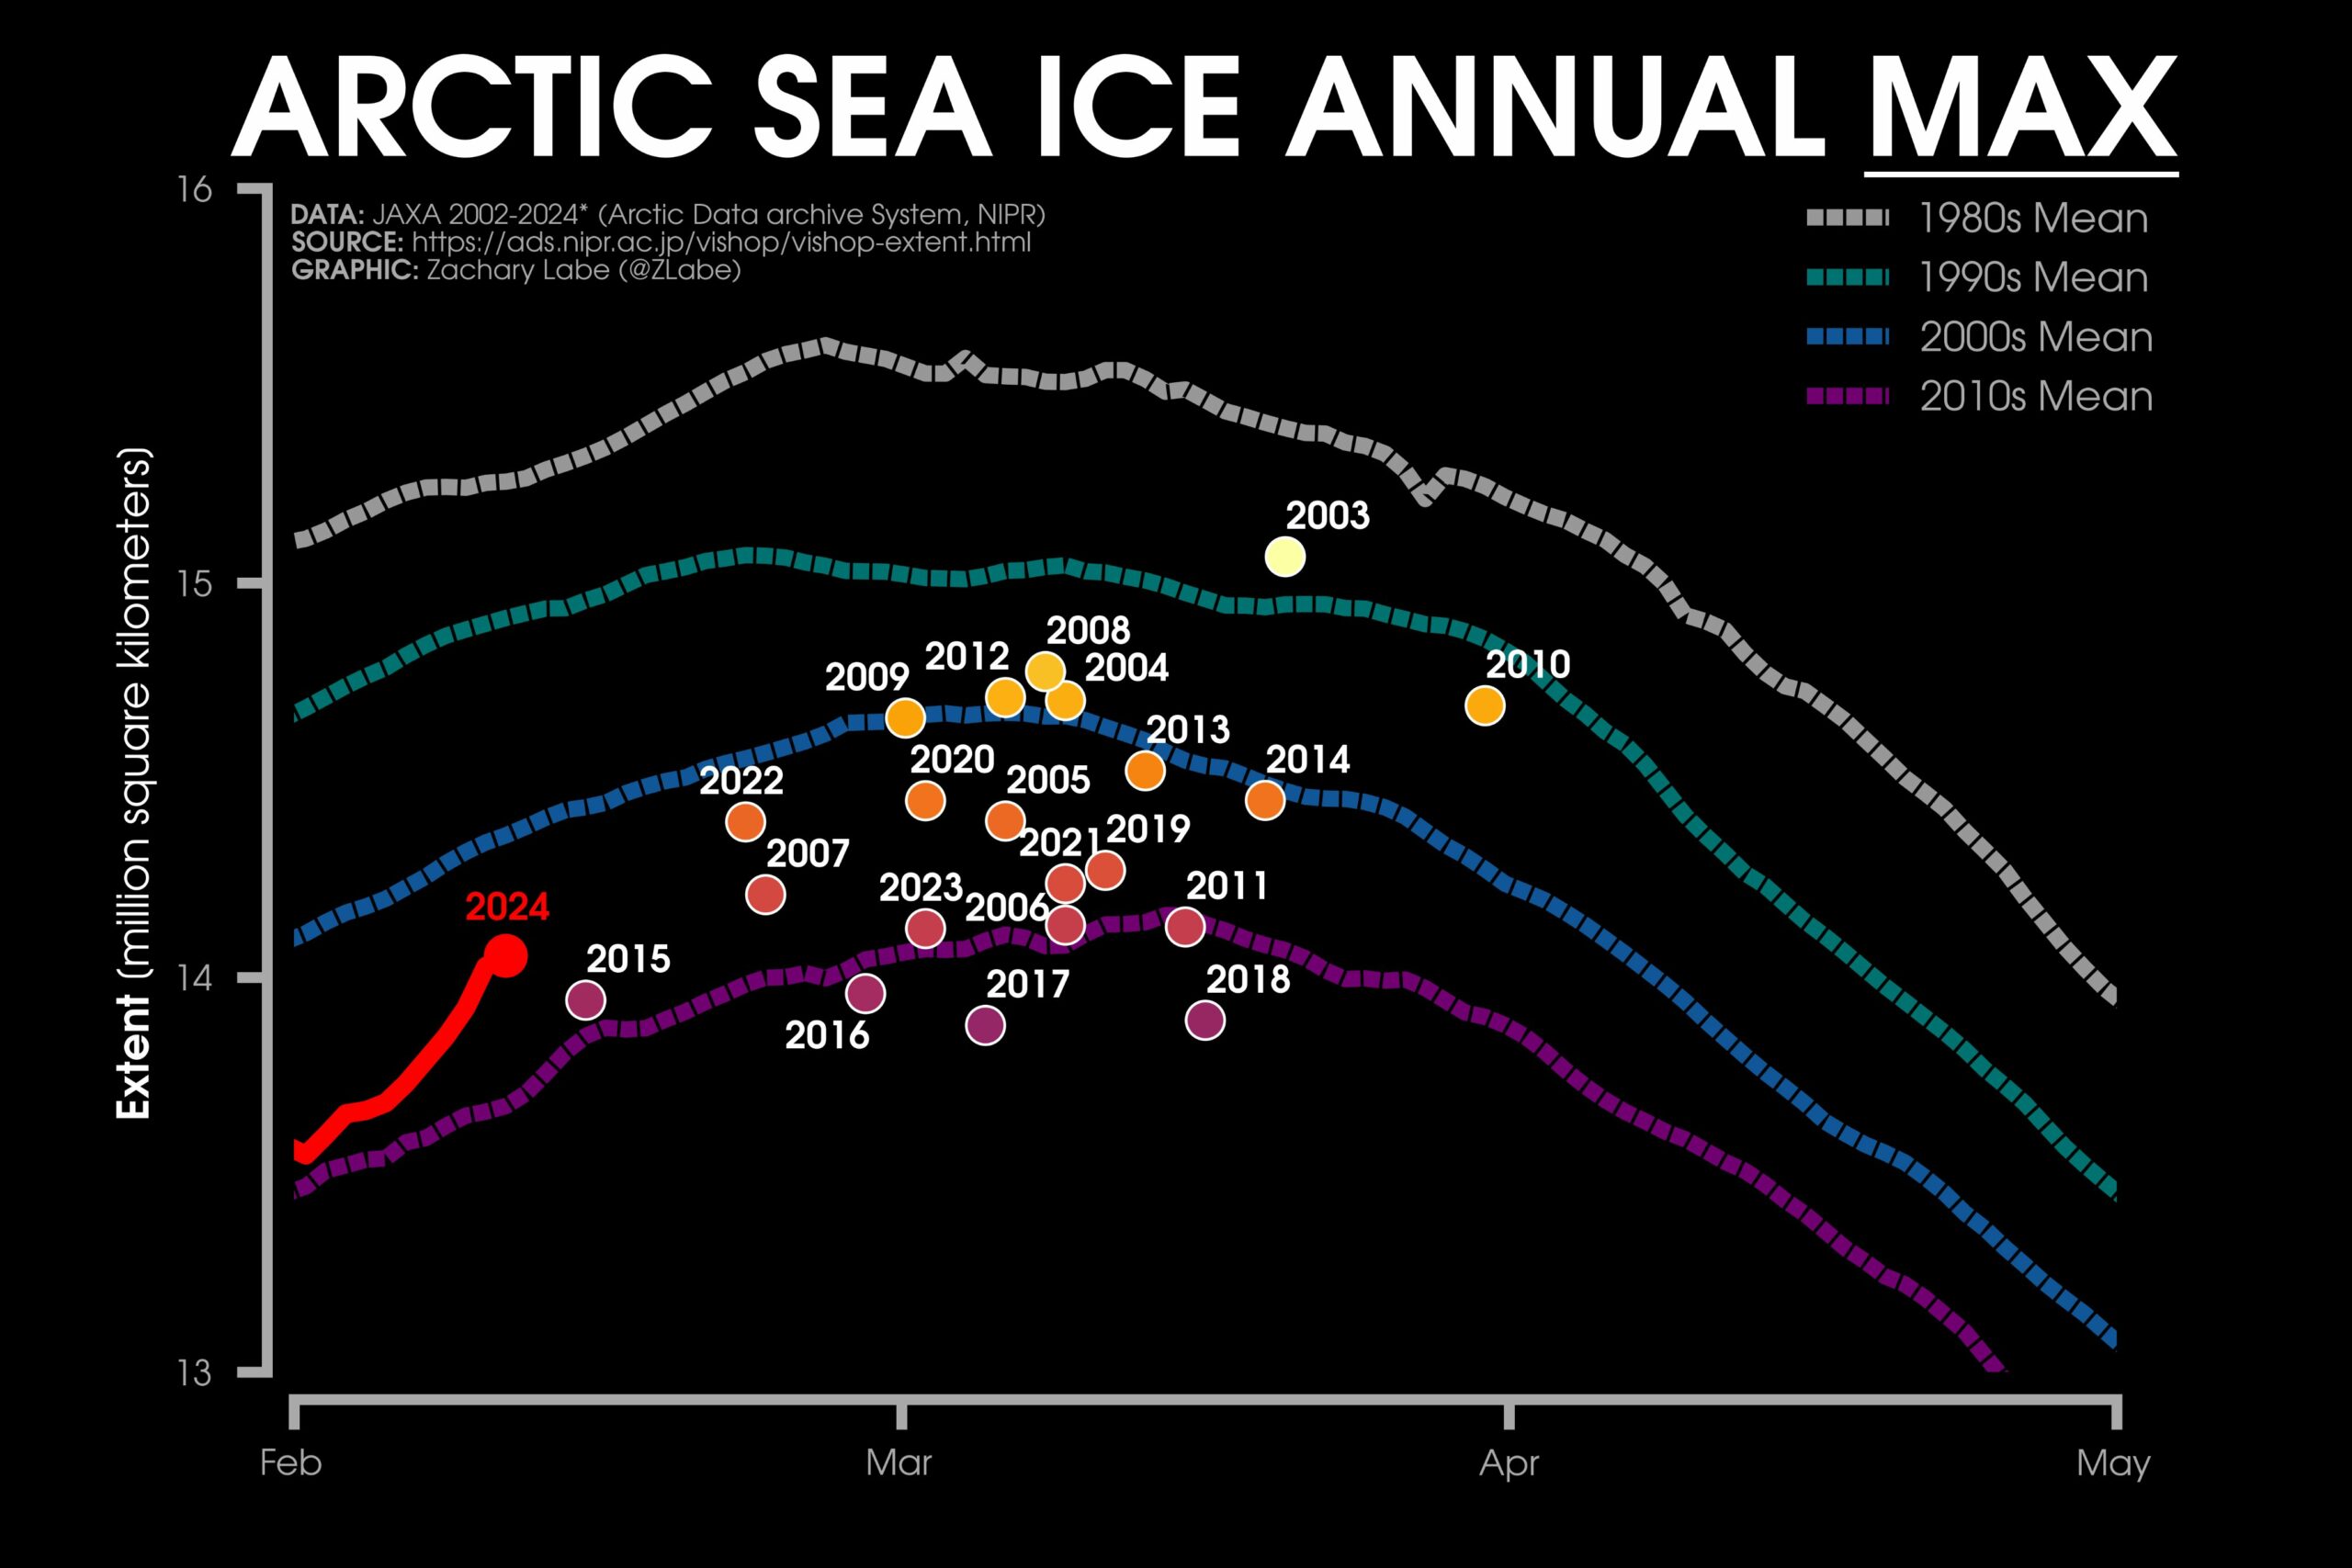
The 2024 Arctic sea ice minimum extent will almost certainly occur at some point over the next month. The exact date and level will vary from one extent metric to the next. Here’s a comparison of the current JAXA extent with previous minima, courtesy of Zack Labe:
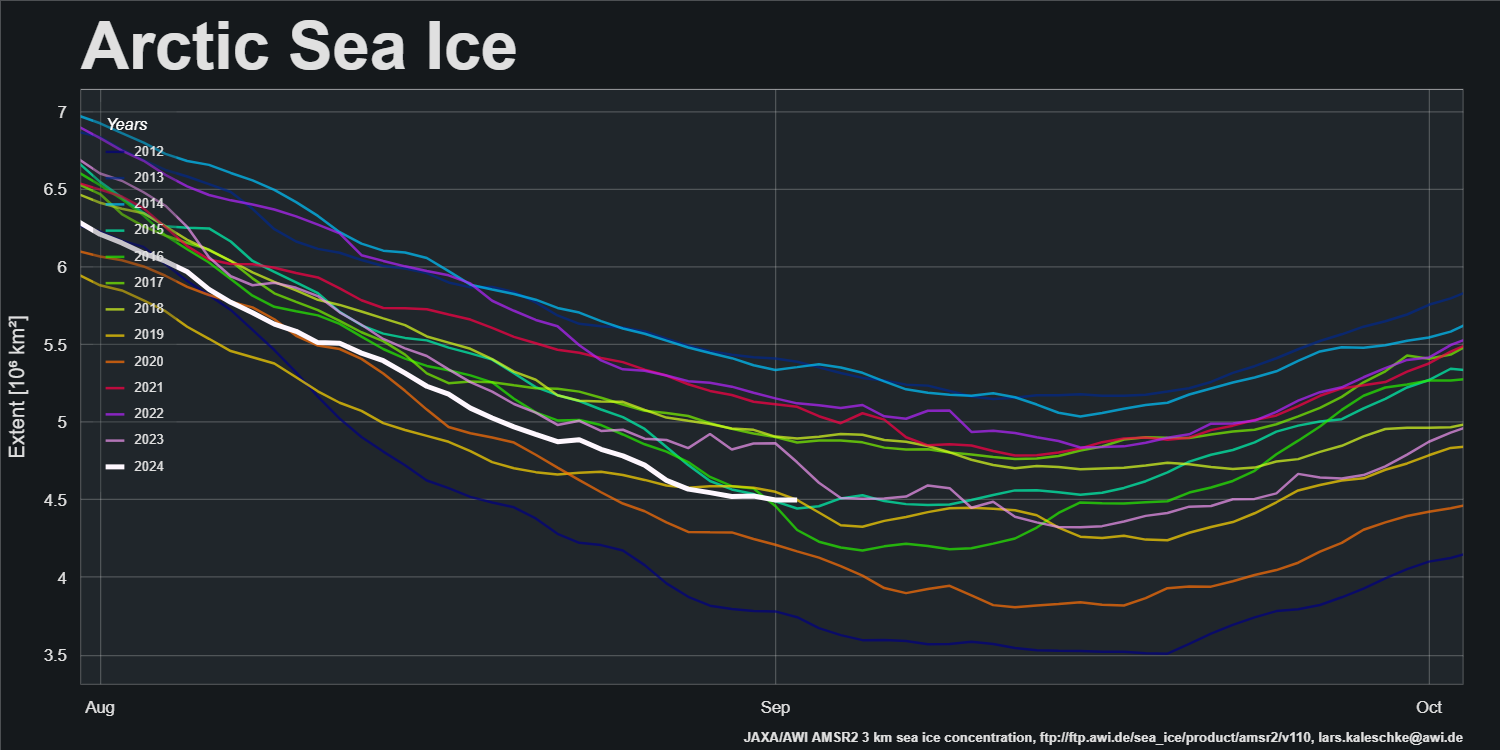
Here too is a more detailed look at 2024 extent compared with the 5 lowest annual minima in the JAXA record:
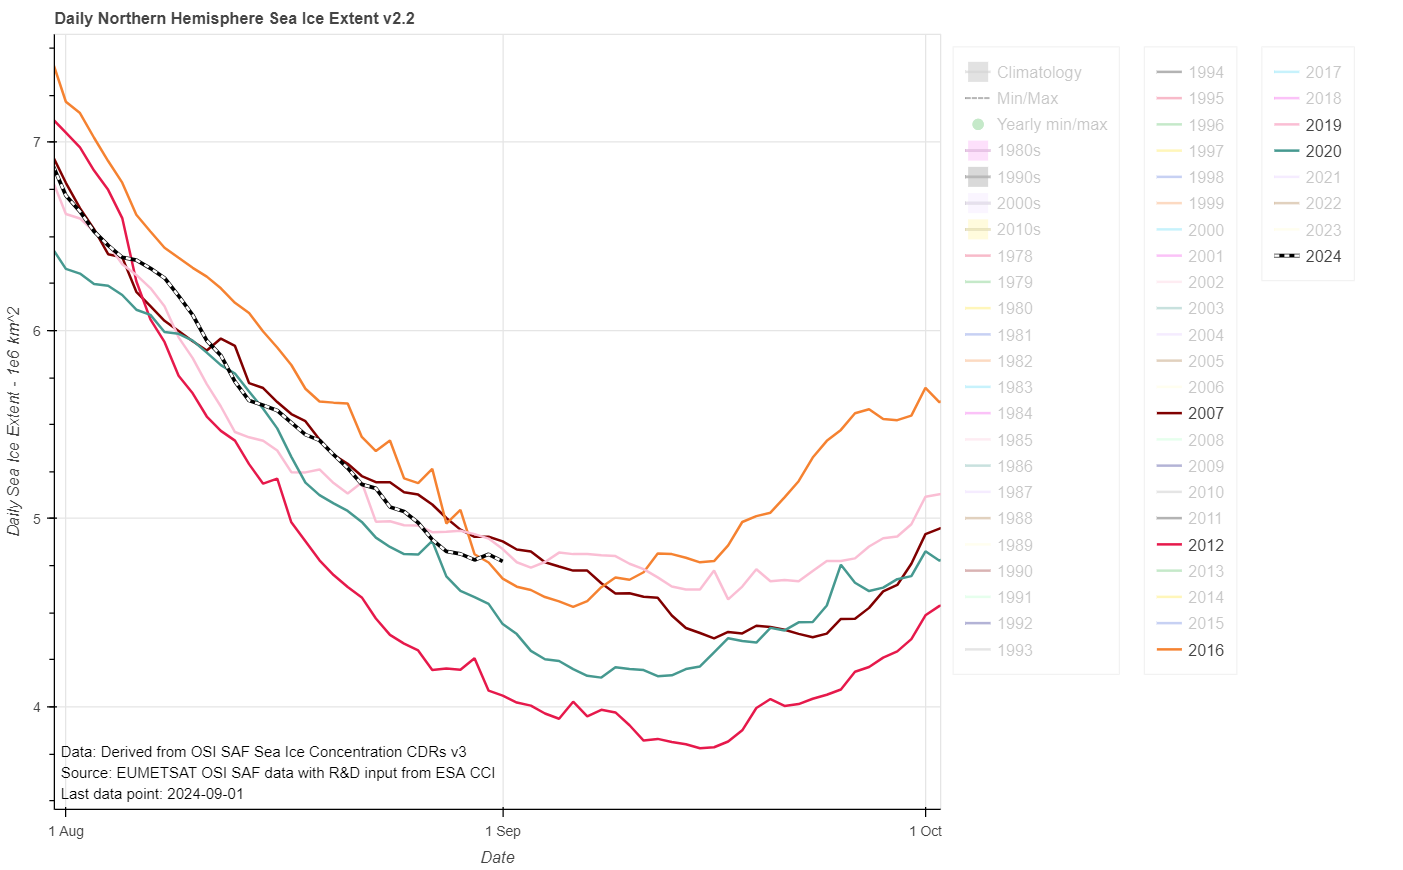
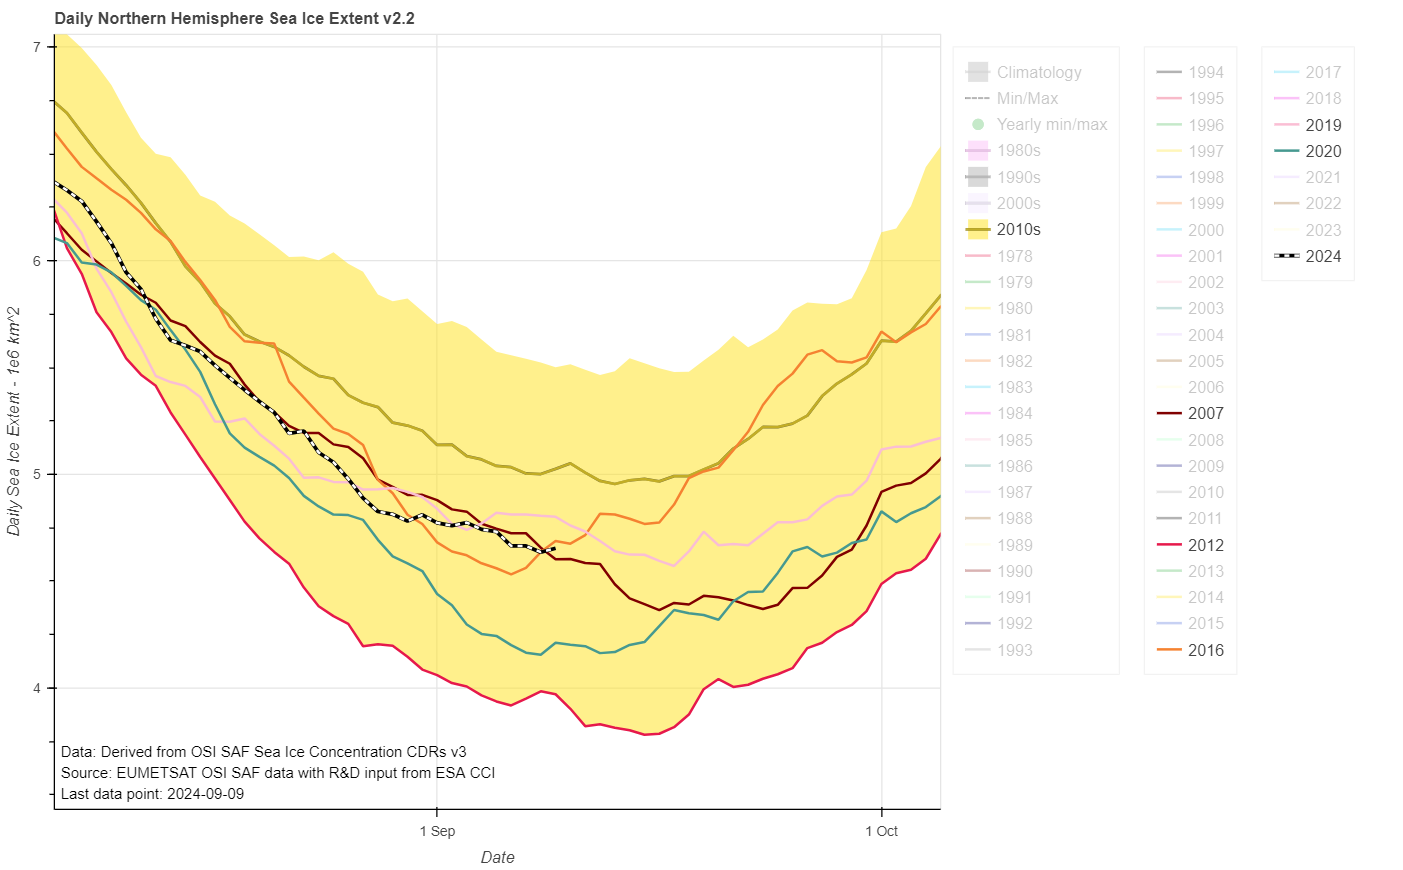
By way of comparison, here is the equivalent graph for the OSI SAF extent metric, which experienced an up tick yesterday but has now reached a new low for the year:
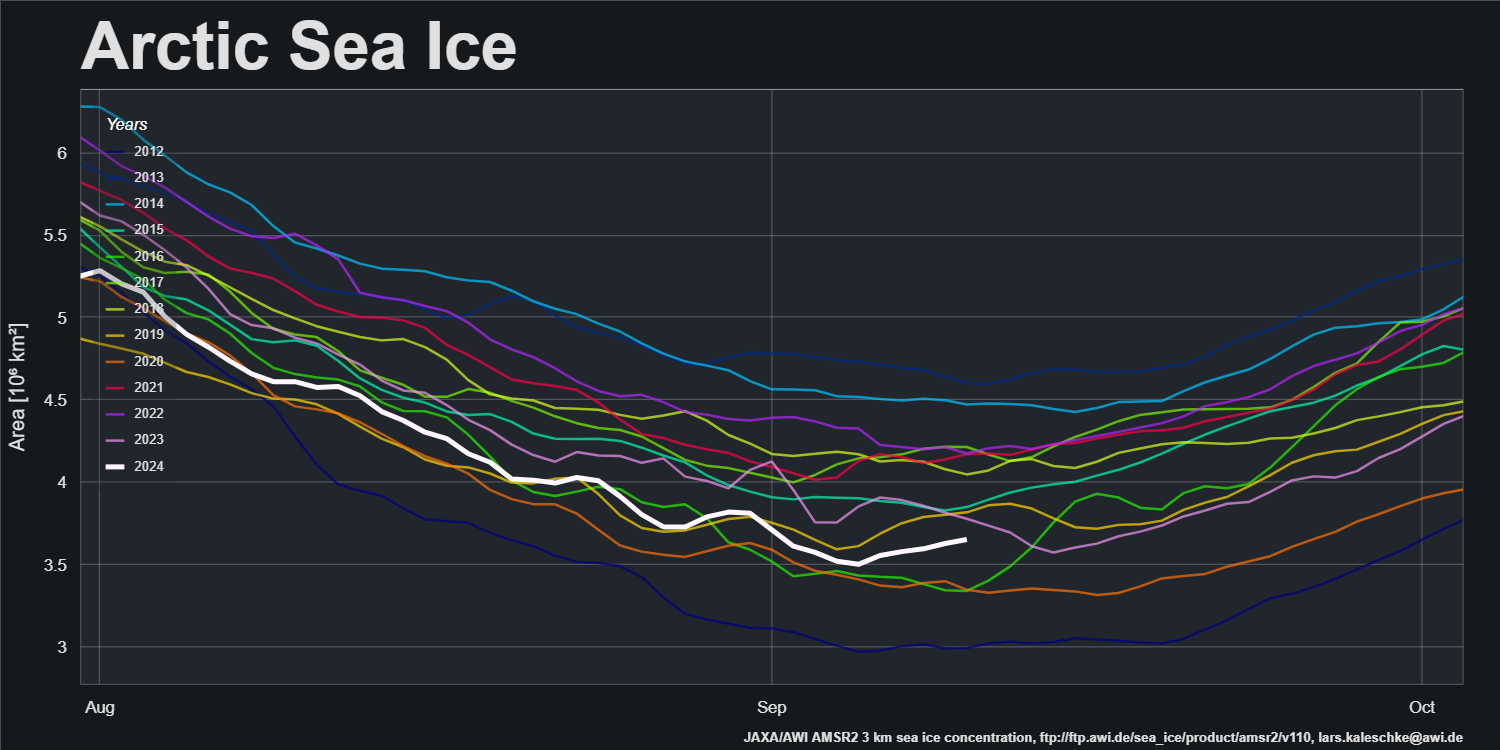
However AWI Arctic sea ice area is currently falling, which may well presage further significant falls in extent:
The NSIDC web site is currently “experiencing technical difficulties”, but hopefully we’ll be able to take a look at their extent graph in the very near future.
[Update – September 4th]
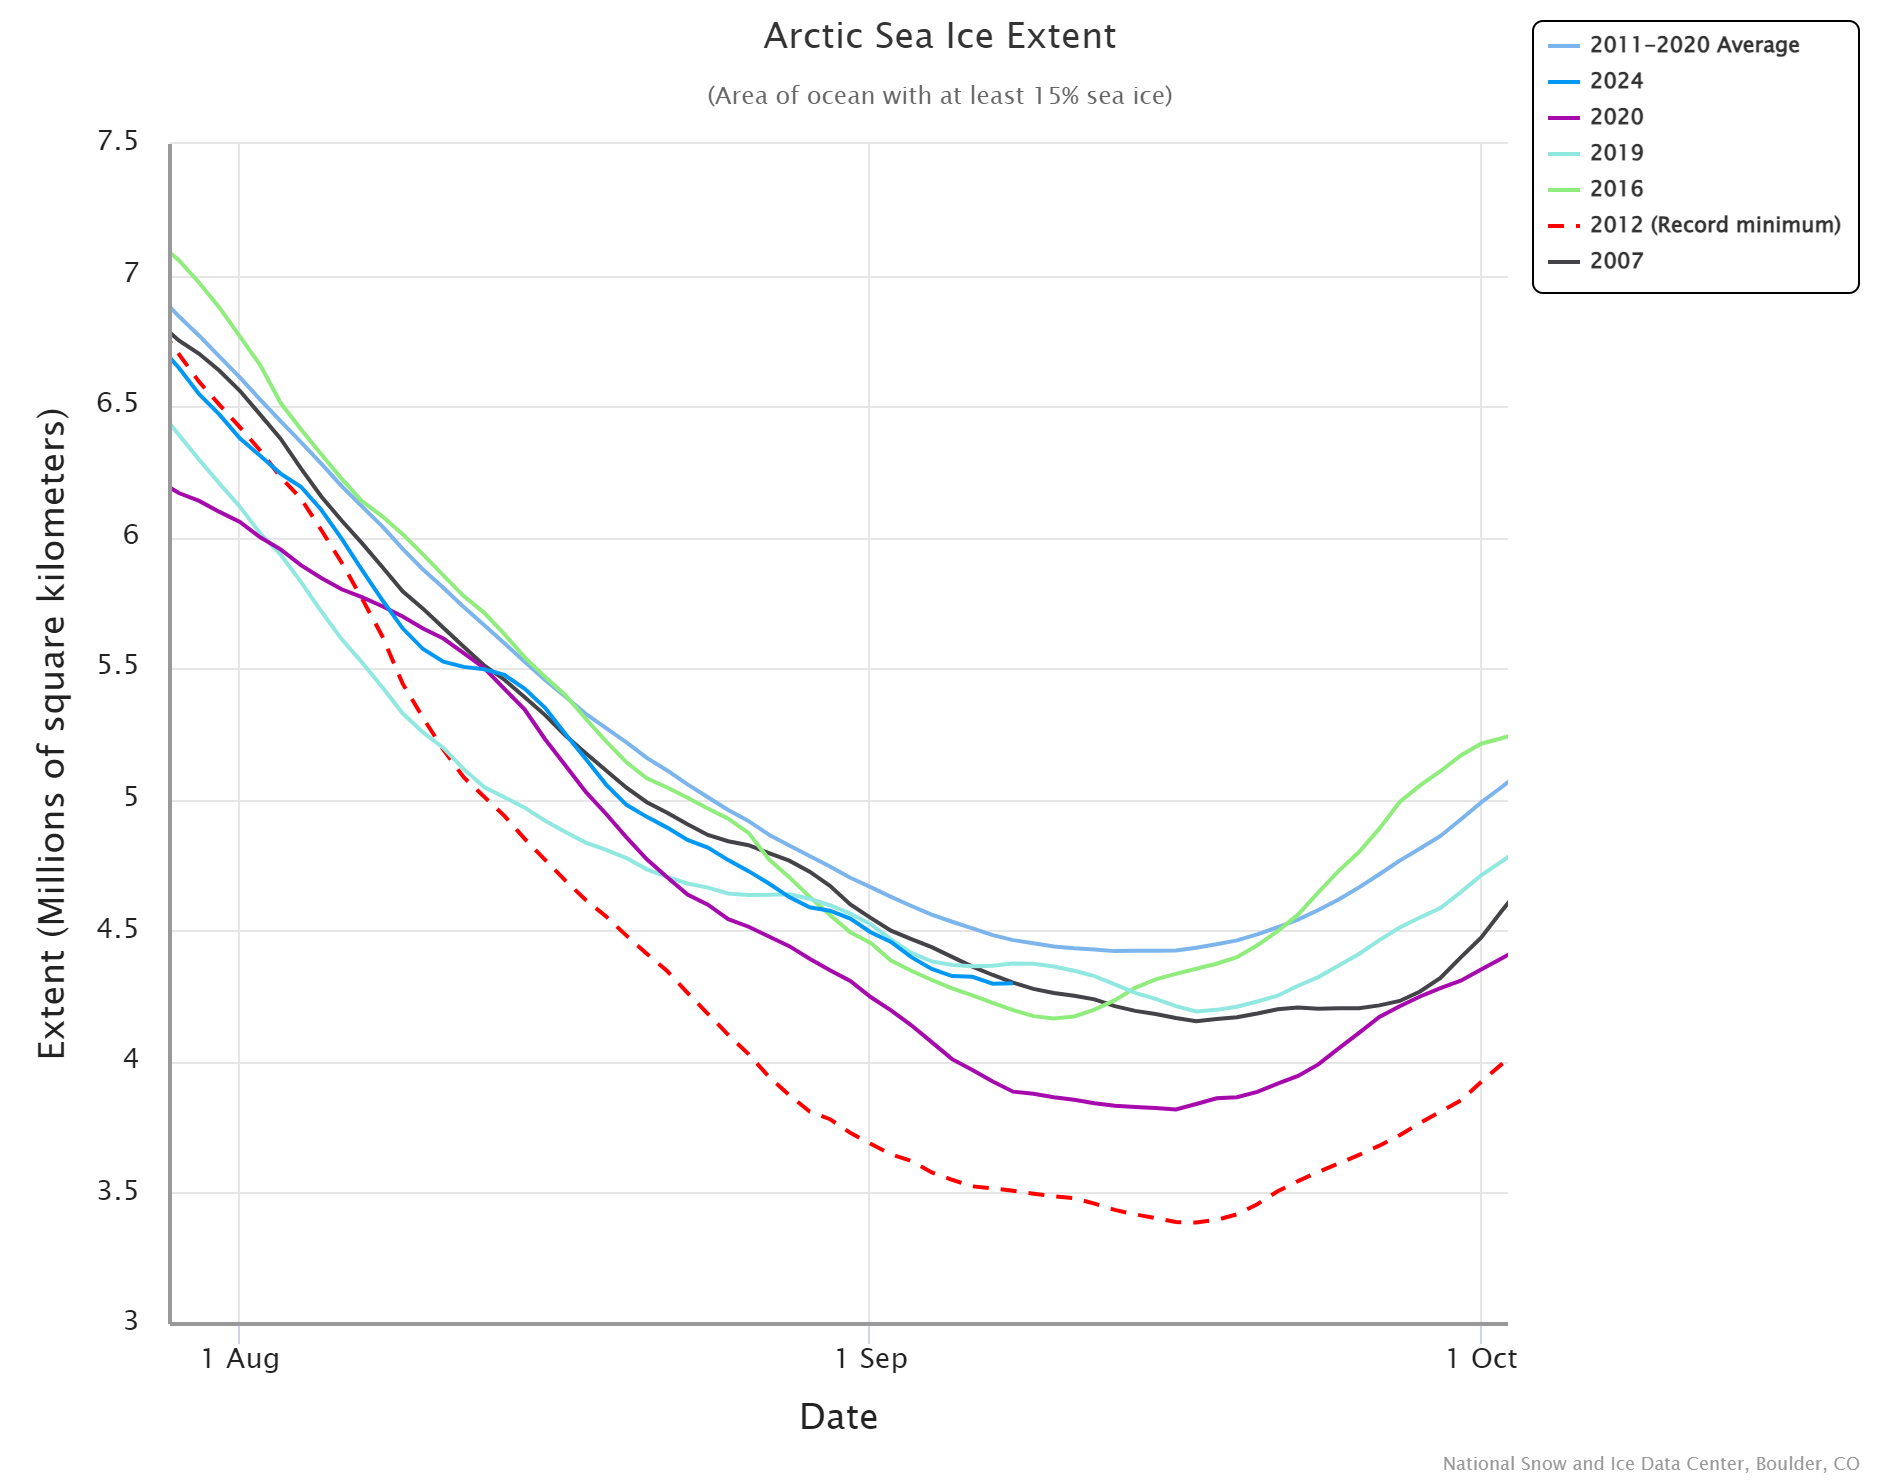
The NSIDC web site is back in action, and their 5 day averaged extent metric is currently still falling quickly:
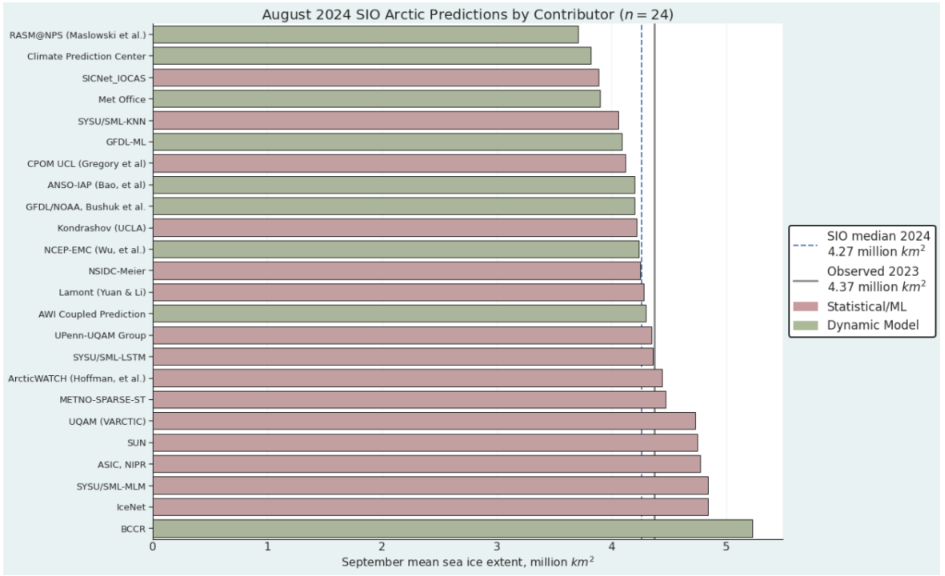
The ARCUS Sea Ice Prediction Network August report has been published. Note that the predicted numbers are for the September monthly average extent rather than the daily minimum:
For the August Outlook, we received 24 contributions of September pan-Arctic sea-ice extent forecasts…
The August 2024 median forecasted value for pan-Arctic September sea-ice extent is 4.27 million square kilometers with an interquartile range of 4.11 to 4.54 million square kilometers. This is about 200,000 square kilometers lower than the June median and about 250,000 square kilometers lower than the July median, which reflects the faster than average ice loss during July.
The lowest sea-ice extent forecast is 3.71 million square kilometers and the highest sea-ice extent forecast is 5.23 million square kilometers. These extremes are actually higher, particularly on the low end, than the estimates from July.
[Update – September 9th]
There’s been the tiniest of upticks in the NSIDC 5 day extent metric. 1 thousand km² to be precise. However, the others are still slowly declining:
[Update – September 10th]
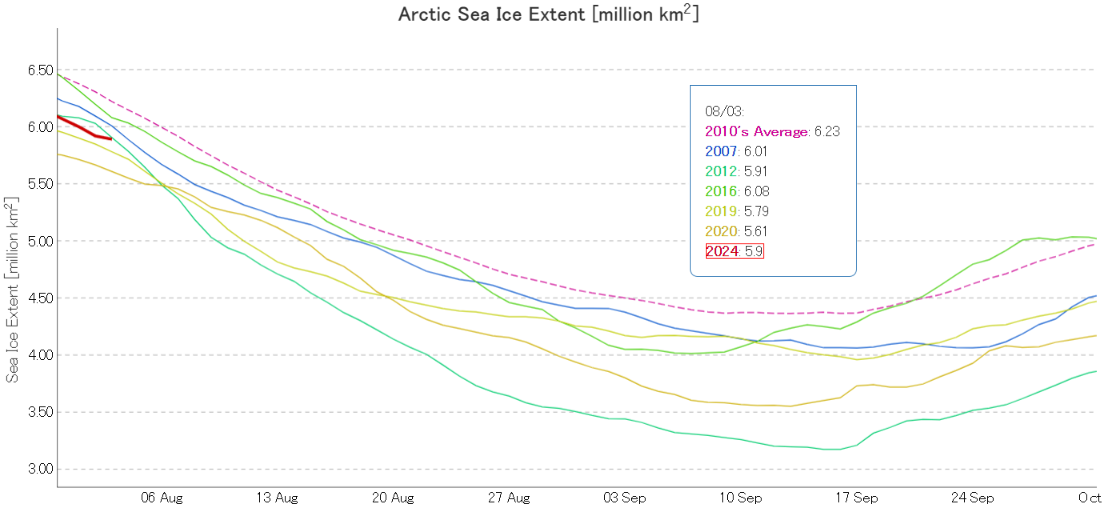
NSIDC extent has posted a new low for the year, and JAXA extent is still declining. However there has been a slightly more substantial uptick in the OSI SAF metric:
The current minimum is 4.64 million km² on September 8th.
AWI sea ice area has posted a convincing looking minimum on September 4th, which suggests that the central refreeze is already well under way:
[Update – September 17th]
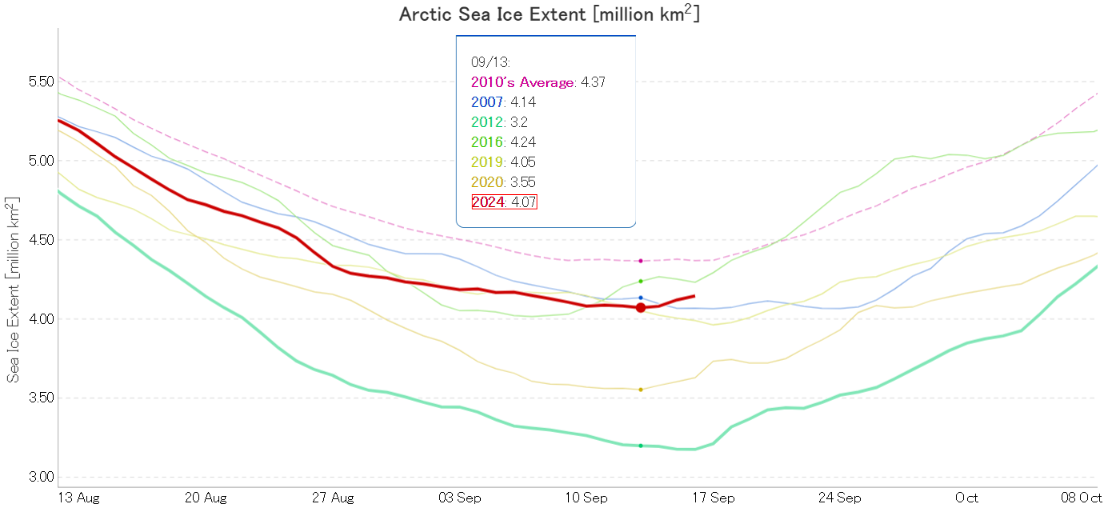
JAXA/ViSHOP/ADS extent has risen significantly over the last two days:
It now looks highly likely that the 2024 minimum will prove to be 4.07 million km² on September 13th. That is 4th lowest for the date, but equal 5th lowest minimum in the JAXA record.
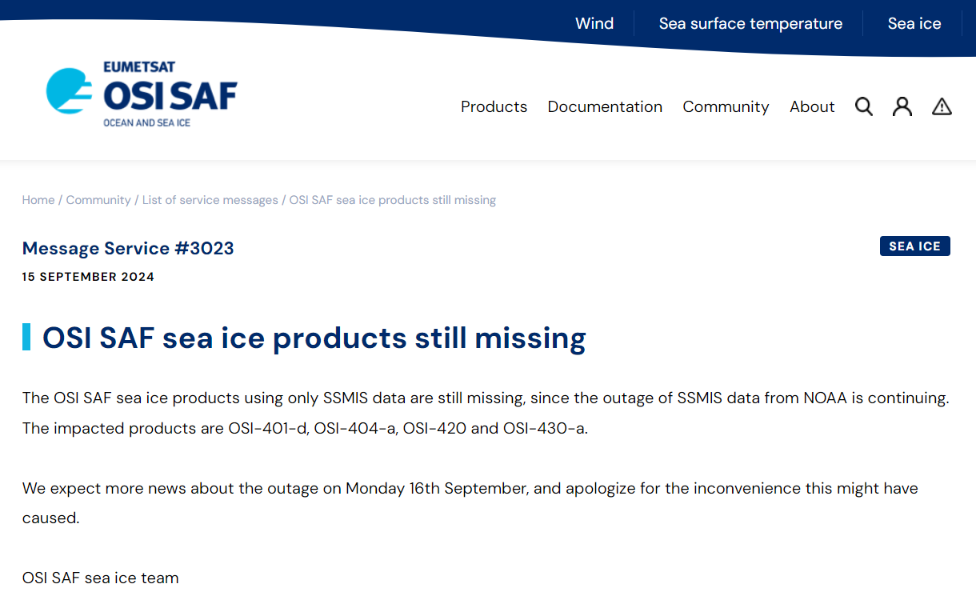
A closer look at some of the other extent metrics will have to wait until this problem is solved:
Not good timing for a data outage!
[Update – September 22nd]
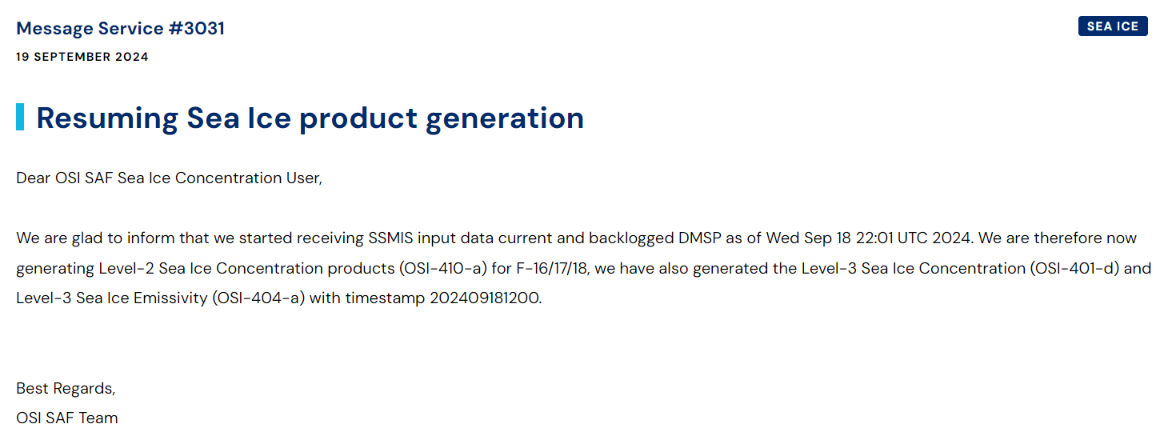
SSMIS data has been flowing again for a couple of days:
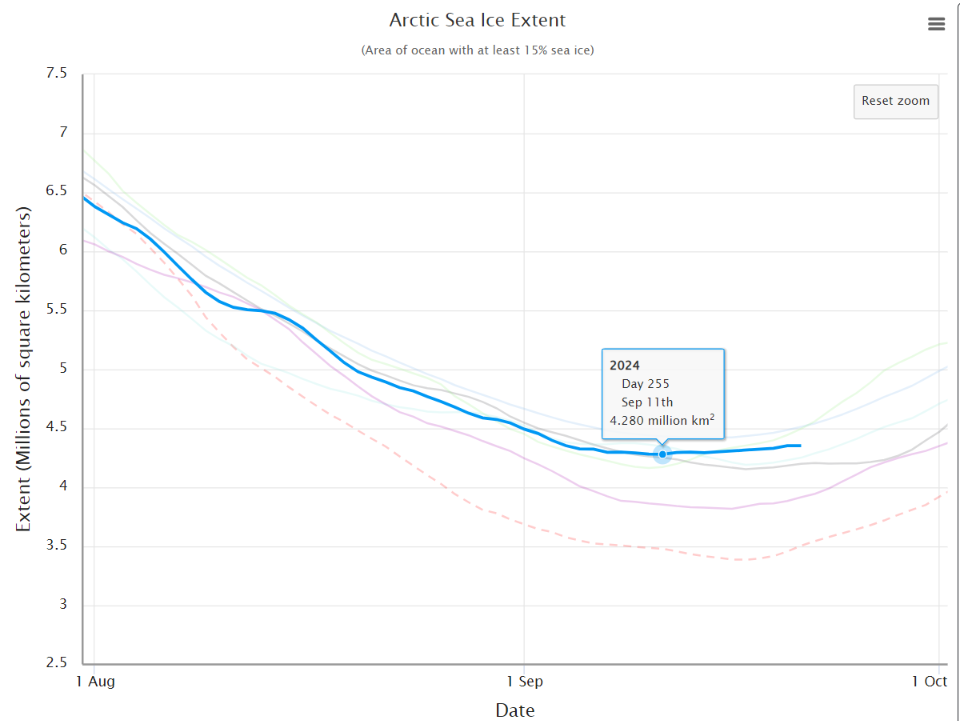
This graph may be subject to revision if and when the missing data is recovered, but currently it looks as though the 2024 minimum of the NSIDC 5 day averaged extent metric is 4.28 million km² on September 11th.
[Update – September 24th]
The National Snow and Ice Data Center formally announced today that:
On September 11, Arctic sea ice likely reached its annual minimum extent of 4.28 million square kilometers. The 2024 minimum is the seventh lowest in the nearly 46-year satellite record. The last 18 years, from 2007 to 2024, are the lowest 18 sea ice extents in the satellite record…
Note that this is a preliminary announcement. Changing winds or late-season melt could still reduce the Arctic ice extent, as happened in 2005 and 2010. NSIDC scientists will release a full analysis of the Arctic melt season, and discuss the Antarctic winter sea ice growth, in early October.
The NSIDC also addressed the recent missing SSMIS data issue mentioned above as follows:
Note that a gap exists in the input source data between September 12 and September 18. This gap somewhat lowers our confidence in the minimum extent estimate. However, it appears that September 11 is the mostly likely date of the minimum based on data trends in daily extent values leading up to the 5-day average on September 11 and the extent values after data restarted on September 18. If extent did drop further between September 11 and September 18, it would have been marginal. If the input source data becomes available to fill that gap, our team will update the minimum estimate if necessary.
At the beginning of August JAXA/ViSHOP extent is 3rd lowest for the date in the satellite era:
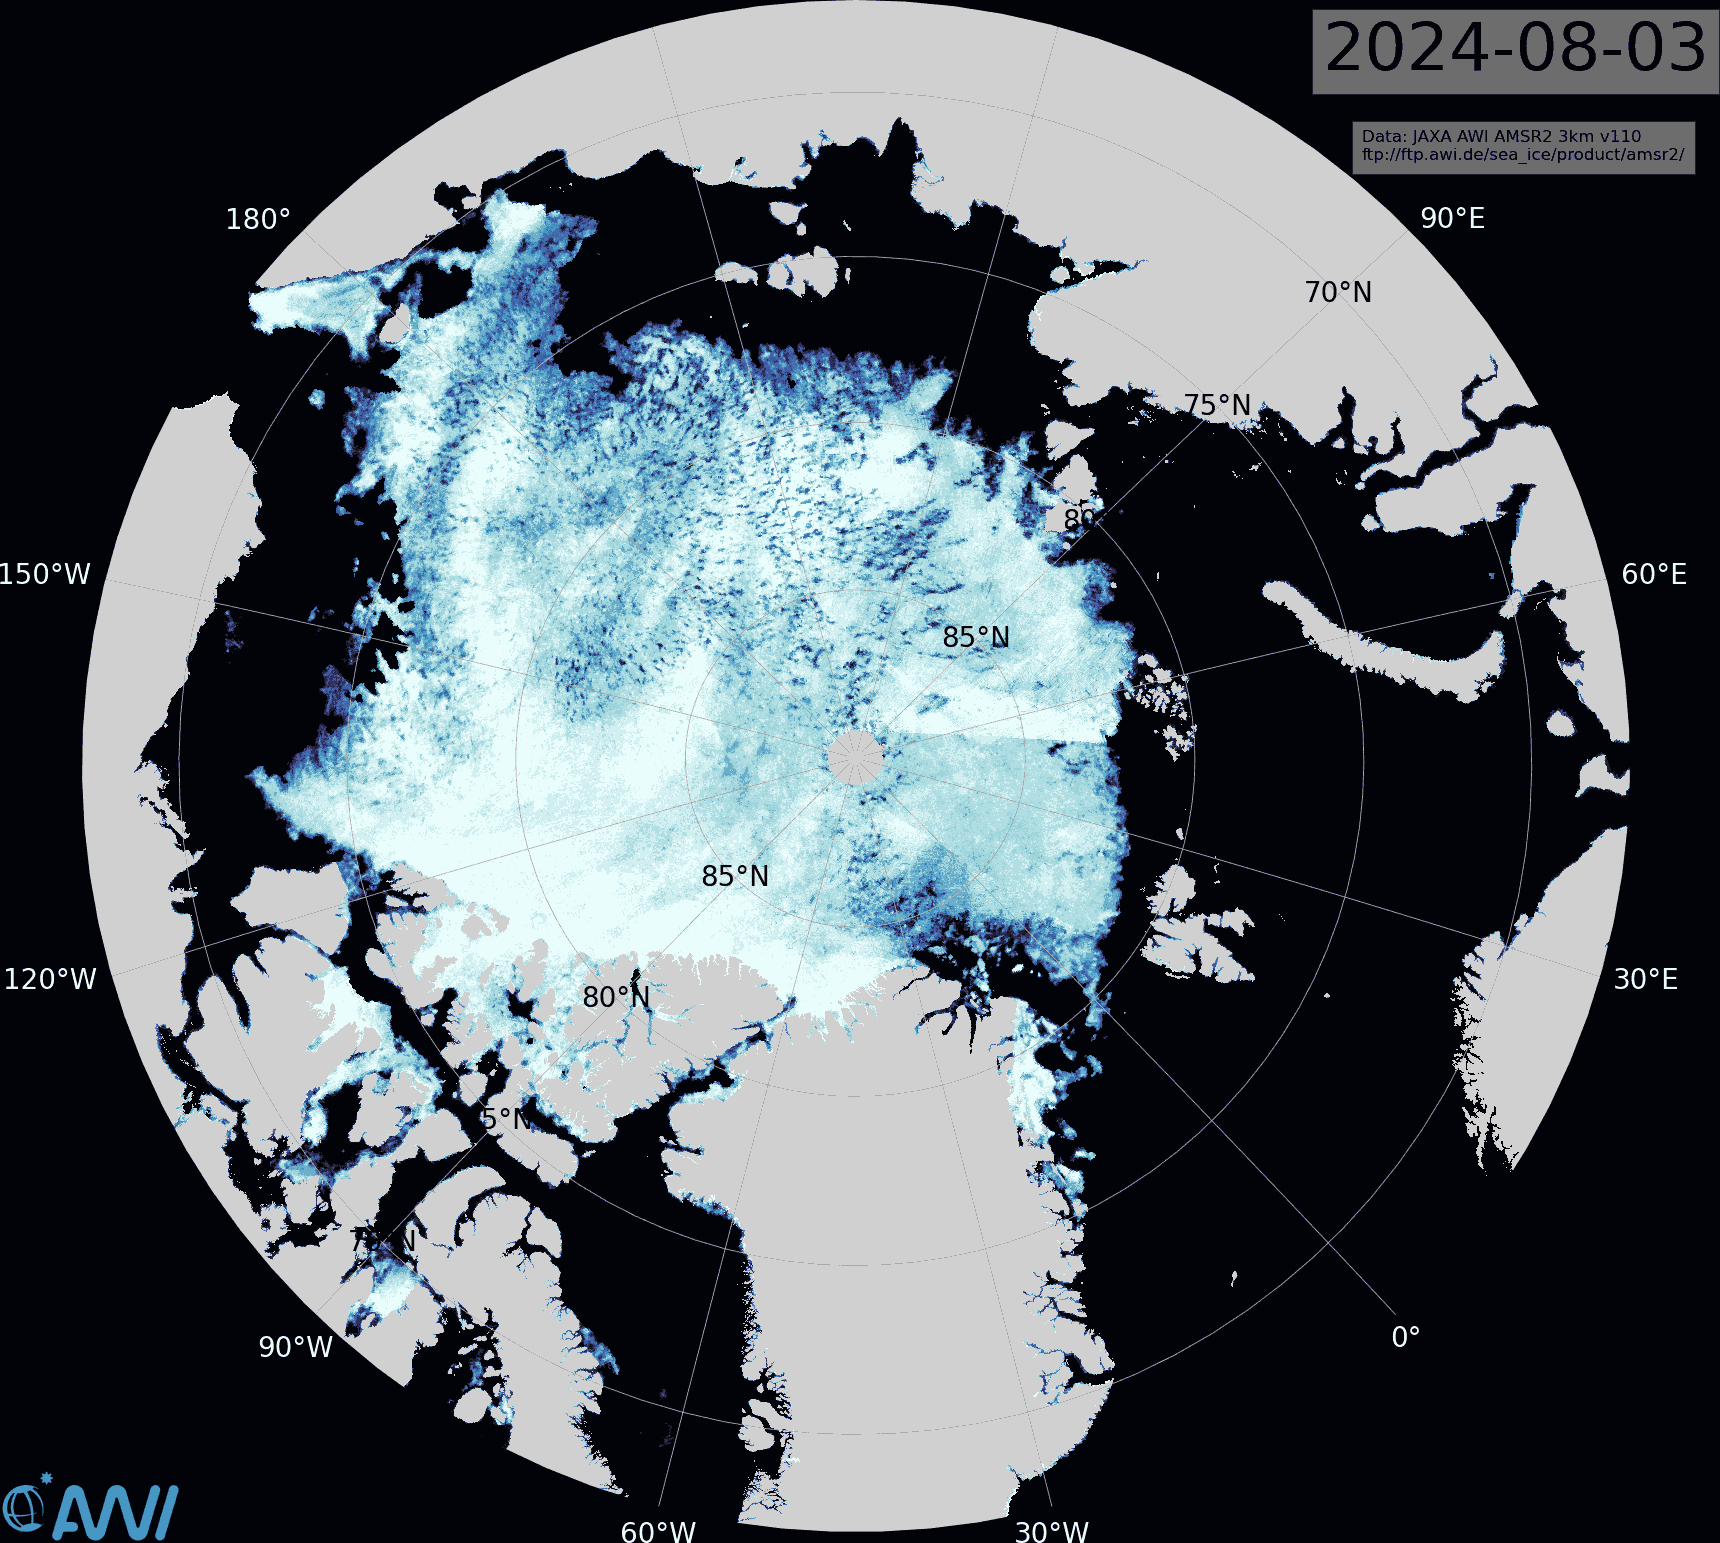
In 2012 extent had just started its unprecedented plunge towards the record September minimum, and 2024 seems certain to cross above the 2012 curve shortly. However, the latest AMSR2 sea ice concentration map from the Alfred Wegener Institute reveals areas of open water across the majority of the Central Arctic Basin:
In particular the sea ice between the North Pole and northern Greenland is remarkably fragmented:
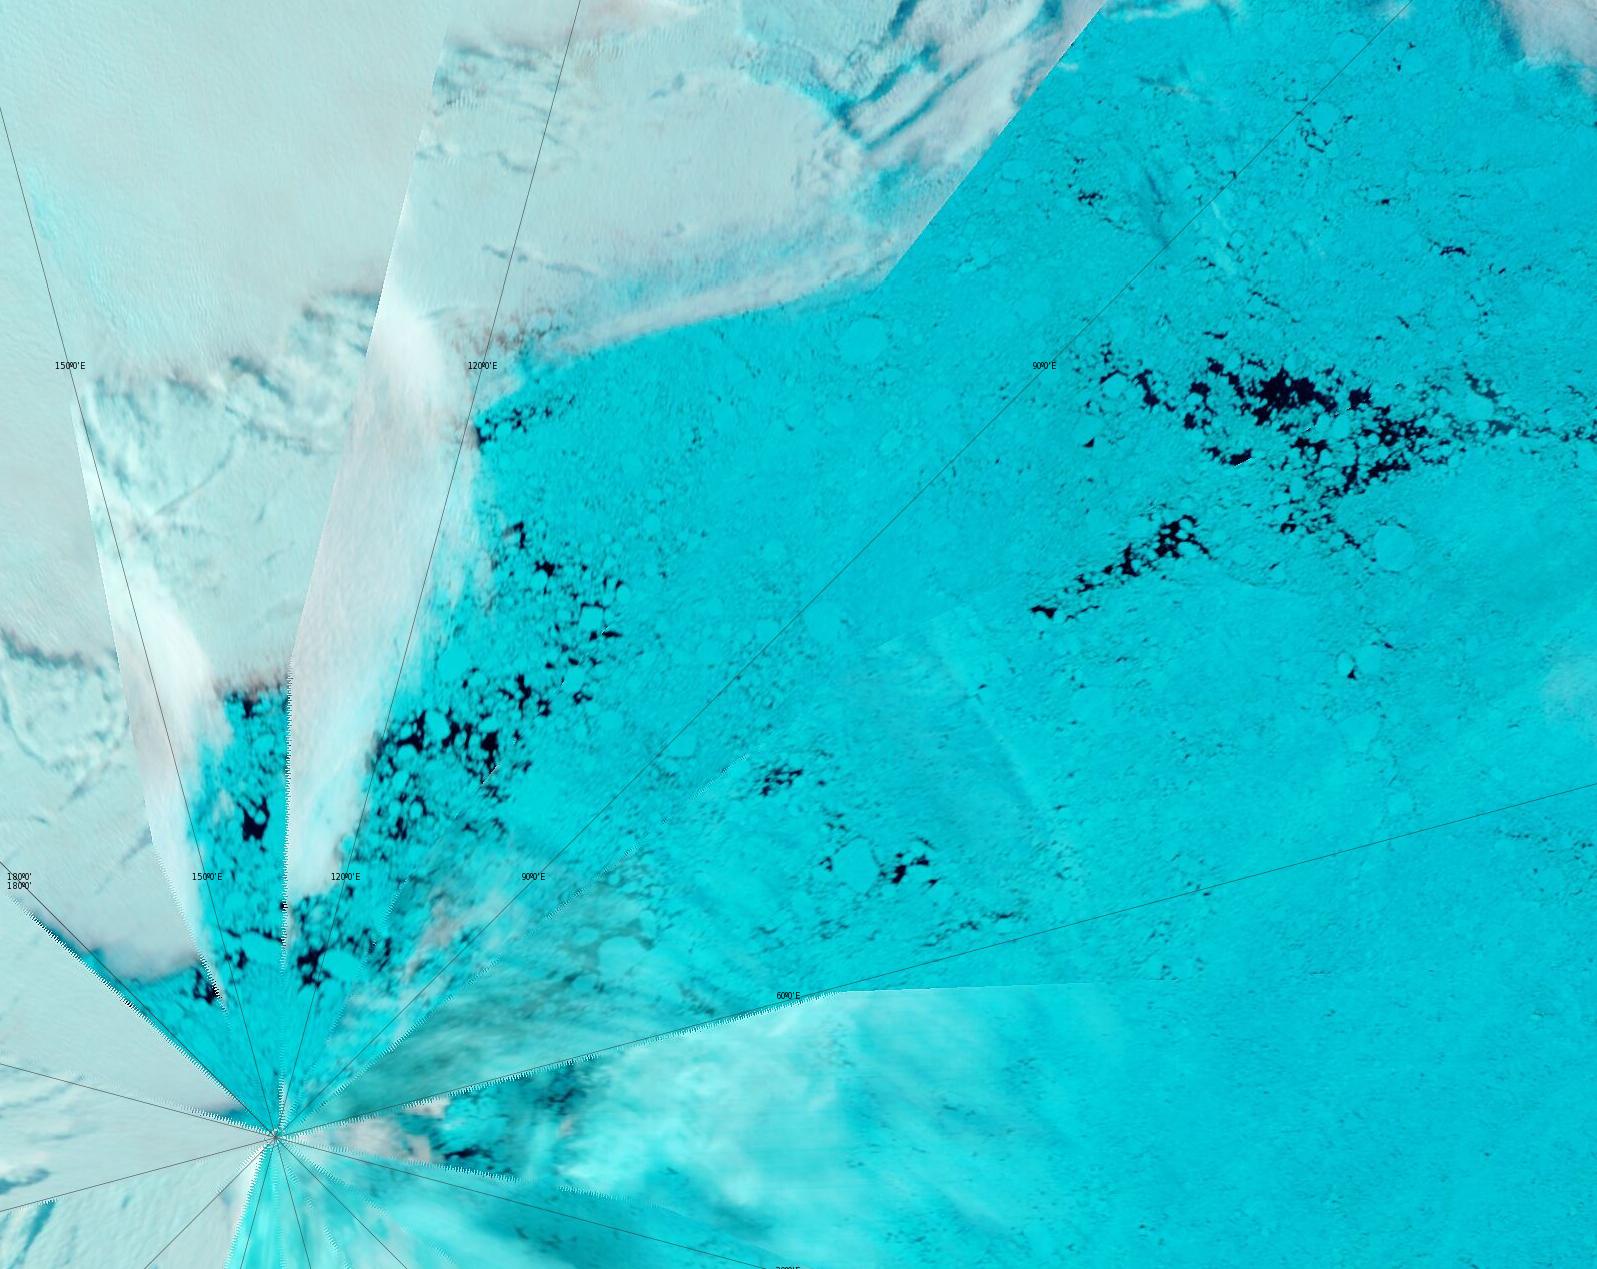
“False colour” image of the North Pole on August 3rd from the MODIS instrument on the Terra satellite
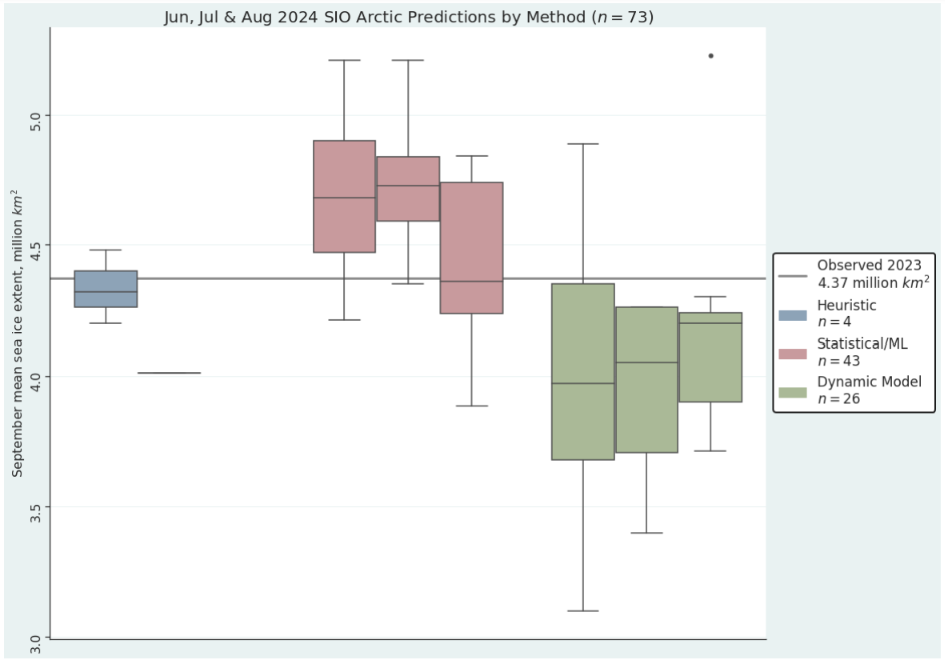
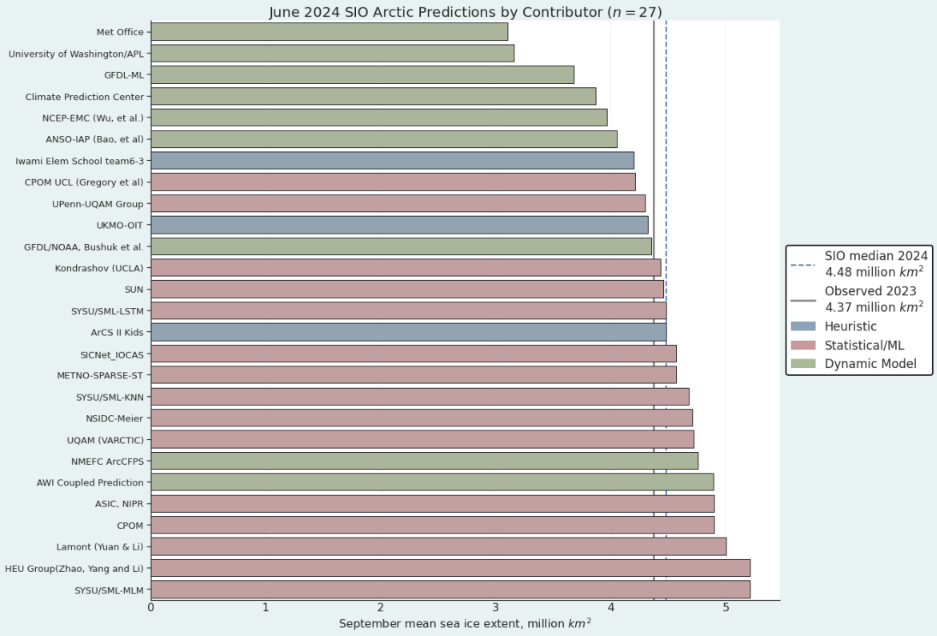
The first sea ice outlook report for 2024 has been published by the Sea Ice Prediction Network:
This year’s median forecasted value for pan-Arctic September sea-ice extent is 4.48 million square kilometers with an interquartile range of 4.21 to 4.74 million square kilometers. This is slightly lower than the 2022 (4.57 million square kilometers) and 2023 (4.54 million square kilometers) June median forecasts for September.
The lowest sea-ice extent forecast is 3.1 million square kilometers, from the UK Met Office, which would be a new record low for the satellite period (1979-present); the highest sea-ice extent forecast is 5.21 million square kilometers, submitted by both the HEU Group and SYSU/SML-MLM, which would be the highest September extent since 2015:
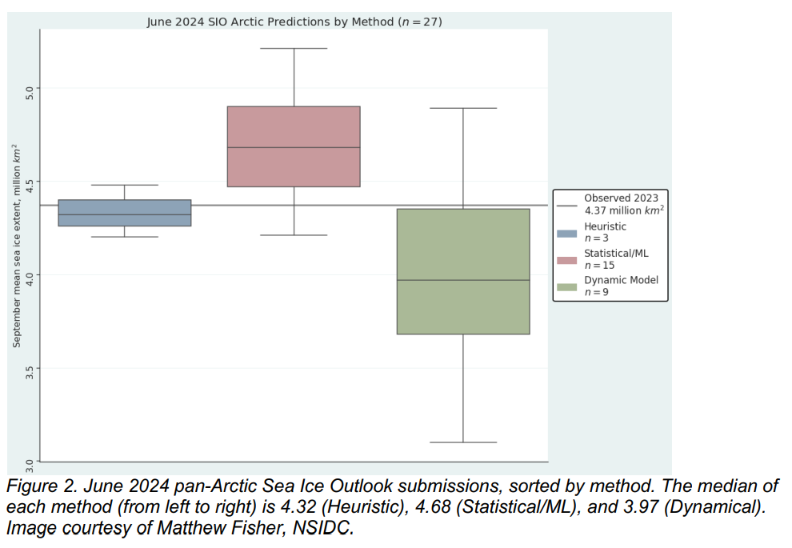
There are three heuristic Outlooks, with a median of 4.32 million square kilometers and an interquartile range of 4.26 to 4.4 million square kilometers. Statistical submissions total fifteen Outlooks with a median of 4.68 million square kilometers and an interquartile range of 4.47 to 4.9 million square kilometers. There are nine dynamical model contributions. The dynamical models have a median forecast of 3.97 million square kilometers with an interquartile range of 3.68 to 4.35 million square kilometers.
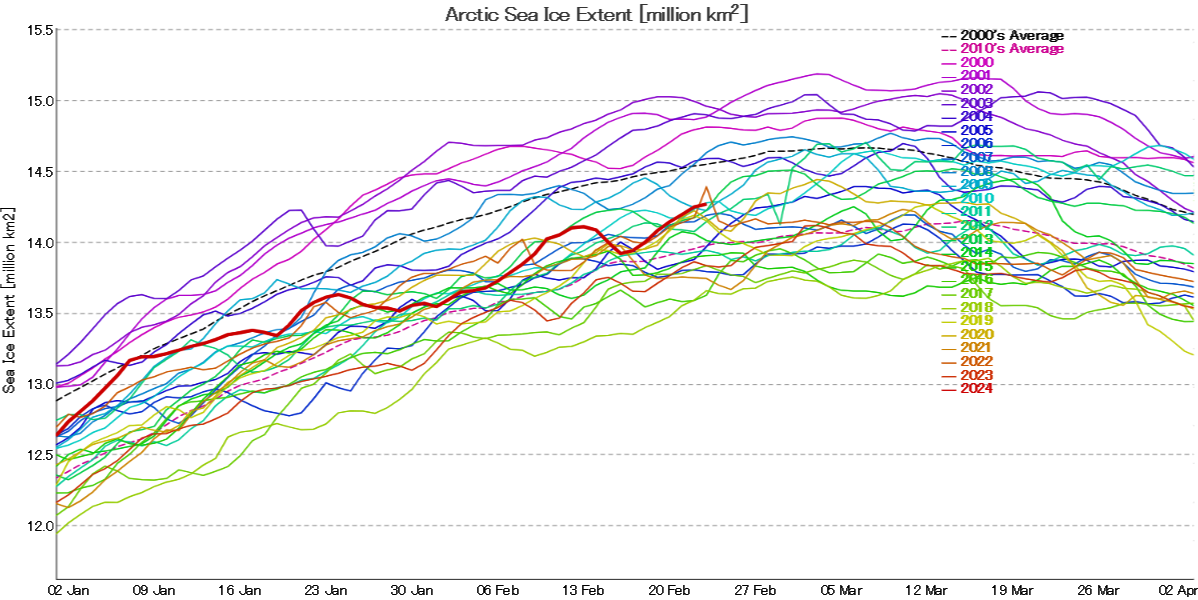
It looks as though the 2024 Arctic sea ice melting season has begun. For much greater detail see the 2024 maximum extent thread. However, here’s the latest JAXA Arctic sea ice extent graph:
Here too is an animation of sea ice motion on the Atlantic periphery, showing the effect of the passage of several Arctic cyclones through the area over the past 5 weeks or so:
[Update – March 4th]
My usual start of month processing hasn’t gone according to plan. Thanks to Lars Kaleschke at the Alfred Wegener Institute for the following information:
SMOS went into safe mode on 22 February 2024 at 05:10 UTC for reasons that are still under investigation.
The spacecraft has been back in nominal mode since 25 February 2024 and on 27 February 2024, the MIRAS instrument was switched on and is currently performing well.
The reload of the nominal acquisition planning is underway, and if all science data quality checks are positive, nominal data production and dissemination will resume in the coming days.
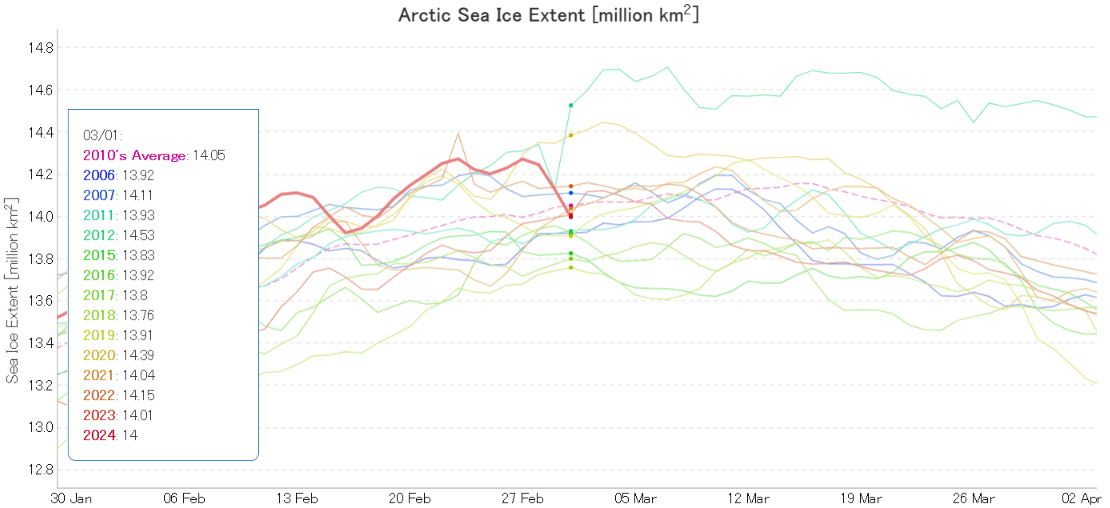
Zack’s graph displays the JAXA/ViSHOP version of Arctic extent, so here too is JAXA’s own graph of the current sea ice extent:
JAXA extent is based on data from the AMSR2 instrument on the GCOM-W satellite, and shows no evidence yet of a local maximum, let alone an annual one for 2024.
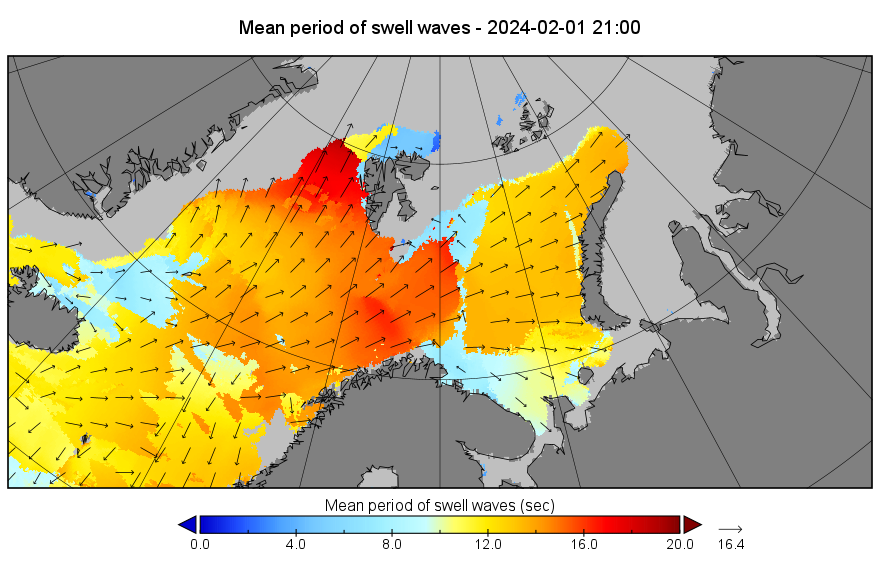
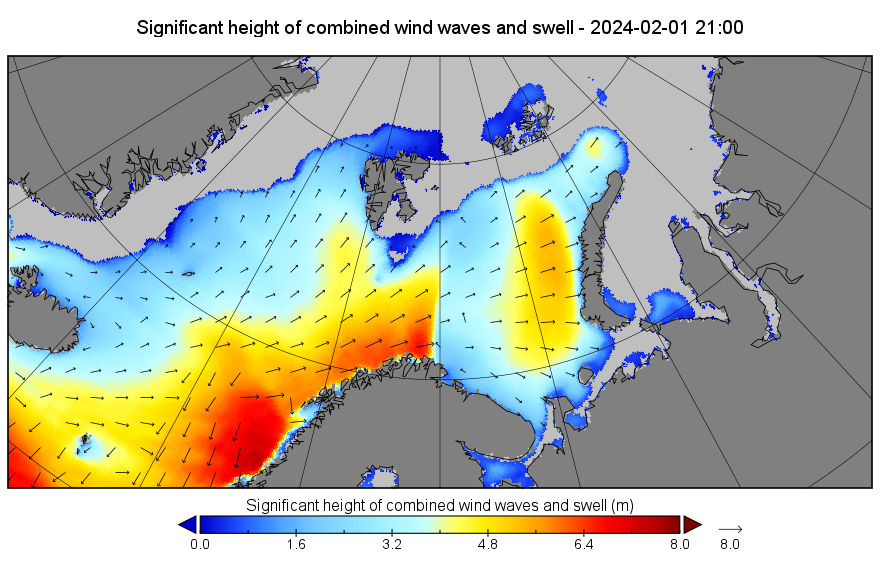
A change is perhaps even better than a rest? Let’s start February with a reminder that following close behind another recent Arctic cyclone, Storm Ingunn caused red weather warnings for high winds and avalanches in Norway two days ago:
By yesterday evening another long period, storm driven swell was arriving at the sea ice edge in the Fram Strait, and to a lesser extent in the Barents Sea:
By this morning Ingunn had merged with the remnants of the prior cyclone, as revealed in Climate Reanalyzer’s visualisation of the latest GFS model run::
This website uses cookies to improve your experience. We'll assume you're ok with this, but you can opt-out if you wish. Cookie settingsACCEPT
Privacy & Cookies Policy
Privacy Overview
This website uses cookies to improve your experience while you navigate through the website. Out of these, the cookies that are categorized as necessary are stored on your browser as they are essential for the working of basic functionalities of the website. We also use third-party cookies that help us analyze and understand how you use this website. These cookies will be stored in your browser only with your consent. You also have the option to opt-out of these cookies. But opting out of some of these cookies may affect your browsing experience.
Necessary cookies are absolutely essential for the website to function properly. This category only includes cookies that ensures basic functionalities and security features of the website. These cookies do not store any personal information.
Any cookies that may not be particularly necessary for the website to function and is used specifically to collect user personal data via analytics, ads, other embedded contents are termed as non-necessary cookies. It is mandatory to procure user consent prior to running these cookies on your website.