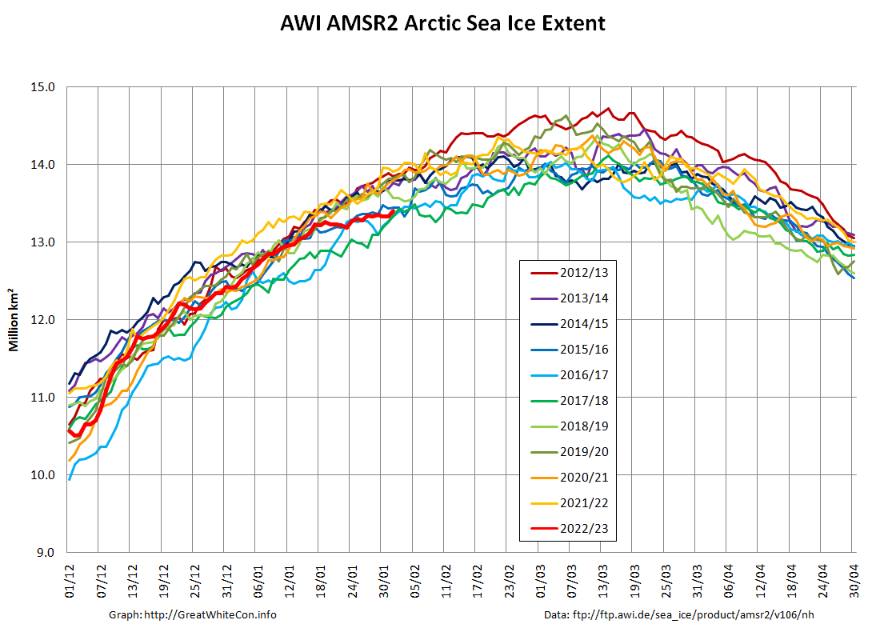
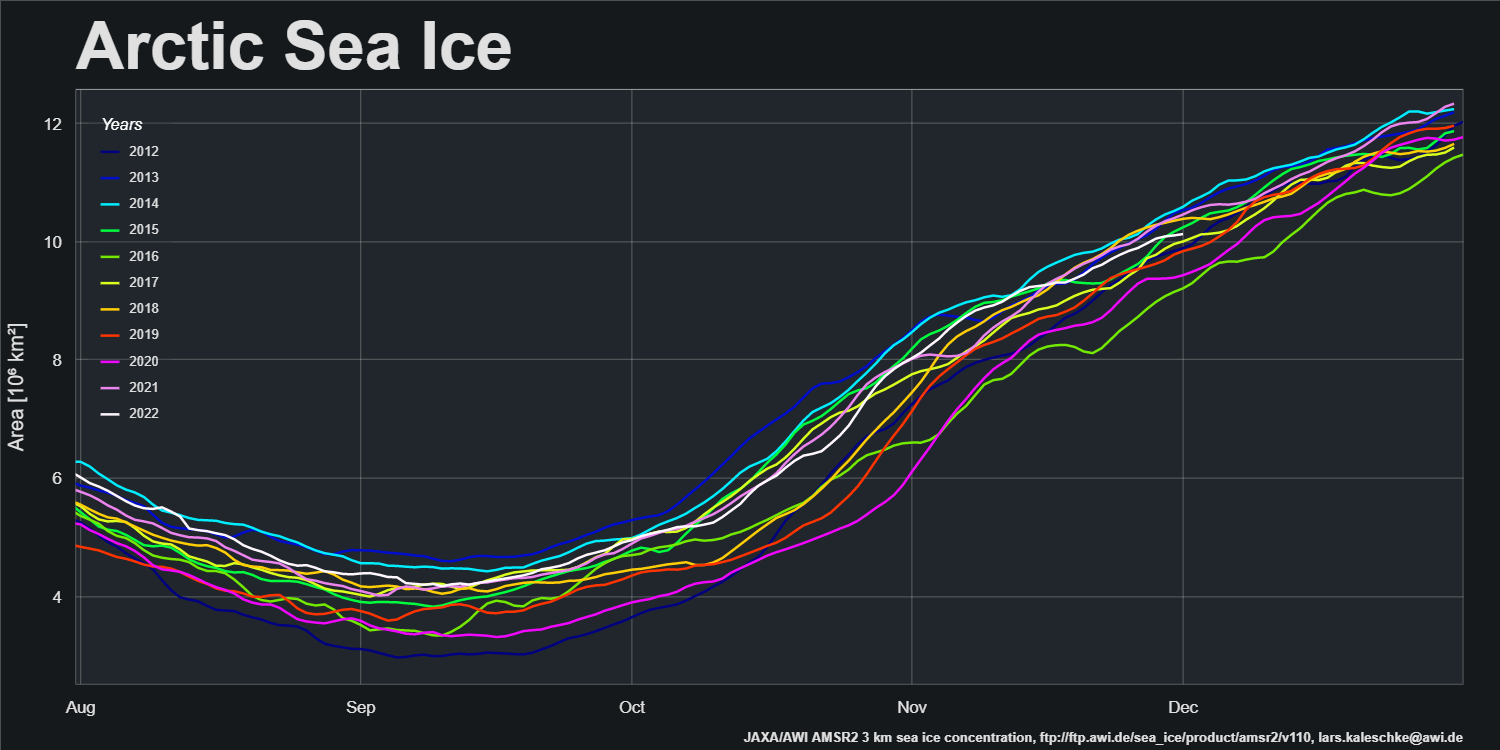
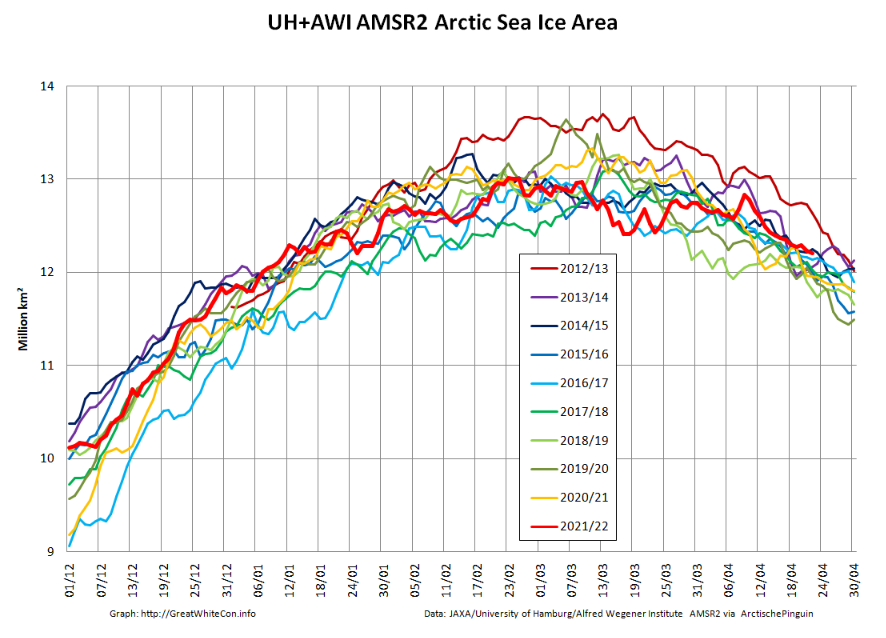
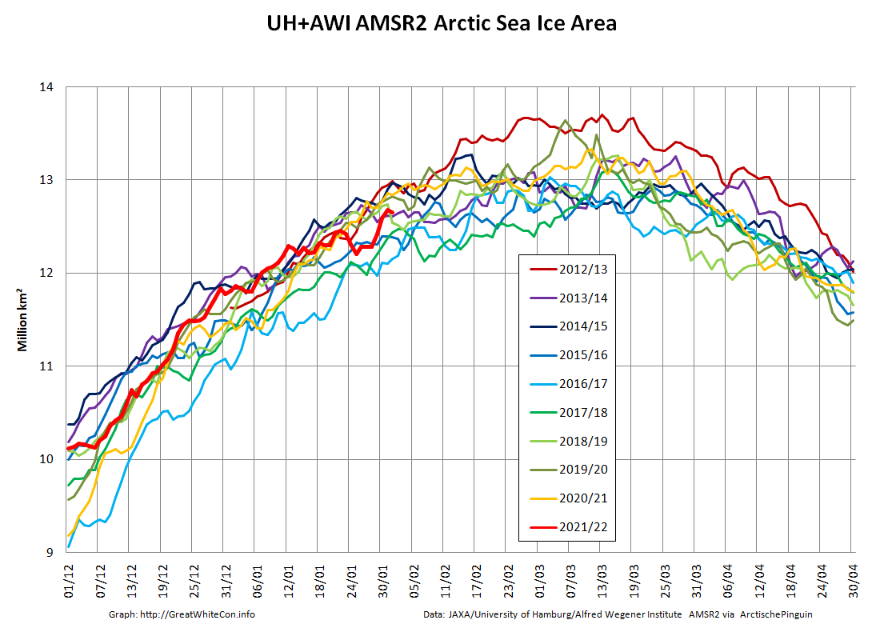
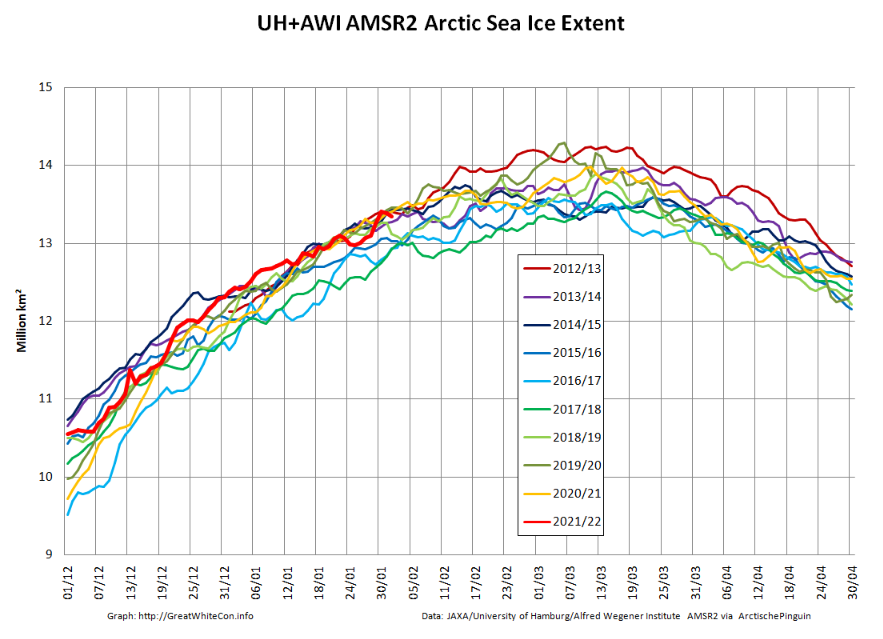
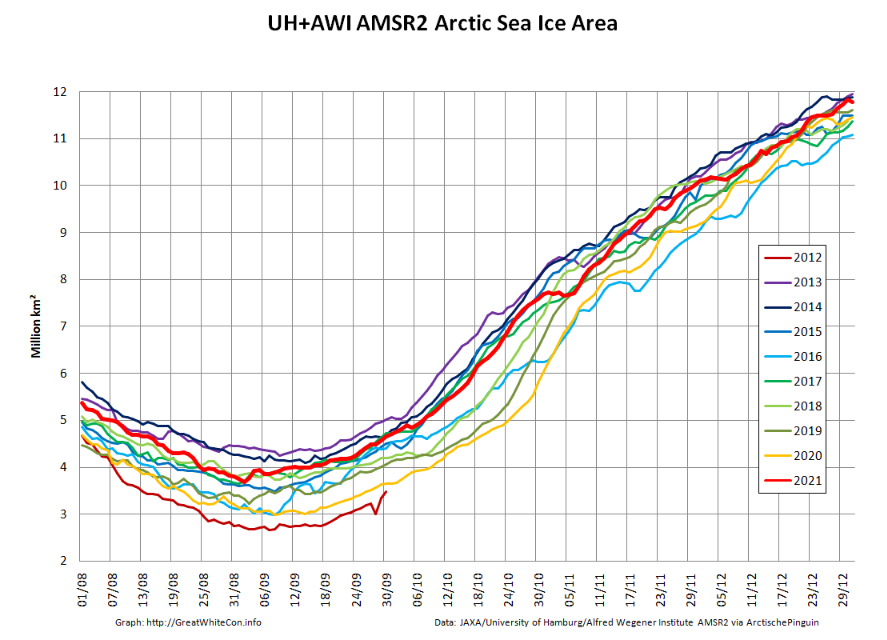
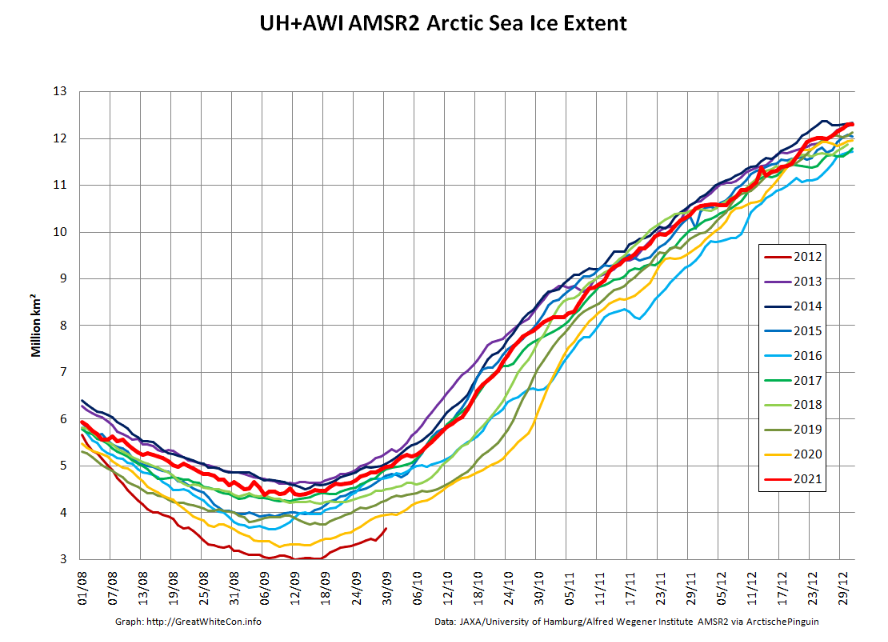
A new month has arrived, and during January several Arctic sea ice metrics have been drifting towards the bottom of their respective decadal ranges. To begin with here is AWI’s high resolution AMSR2 extent graph, which is currently very close to being lowest for the date in the AMSR2 record:
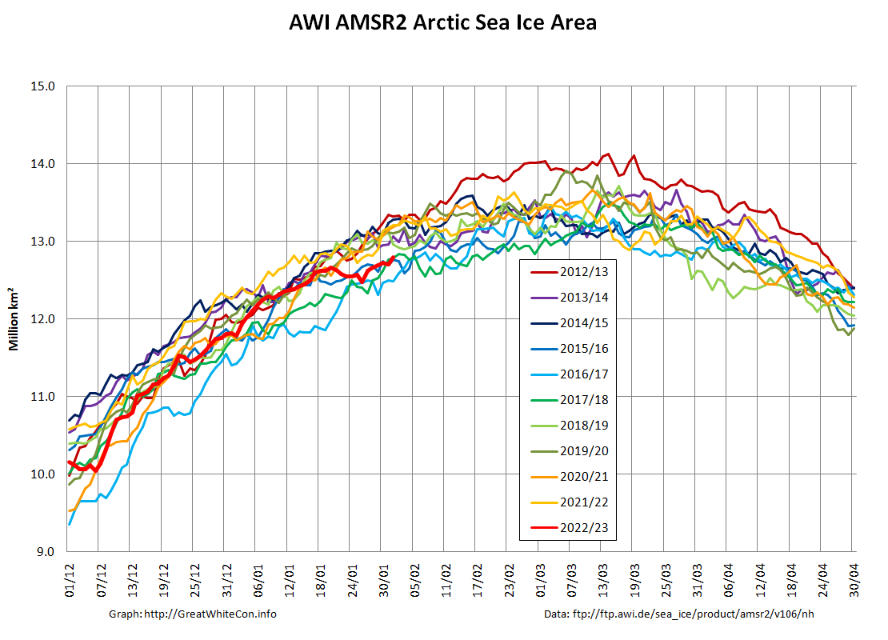
However that is less the case for area:
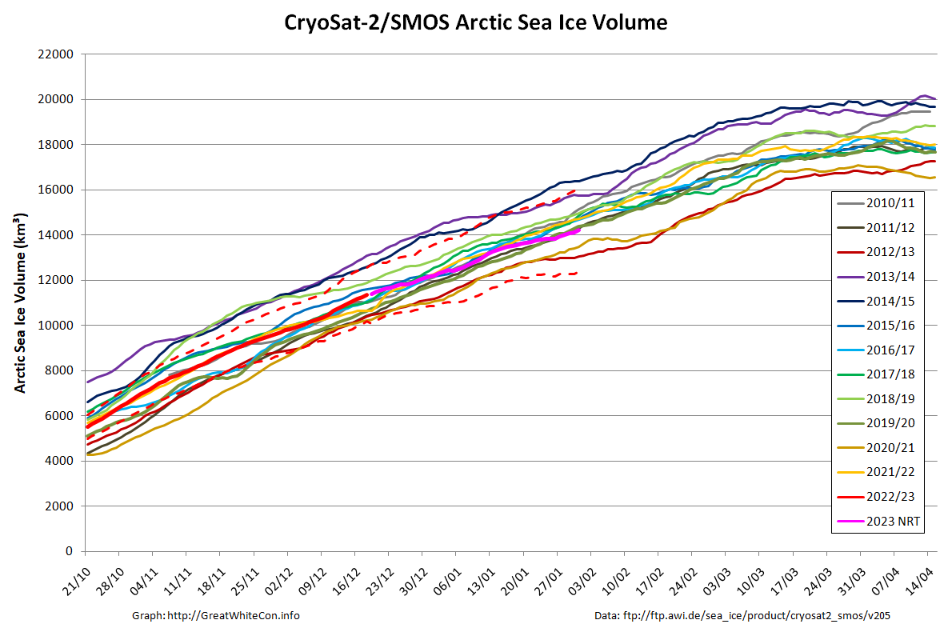
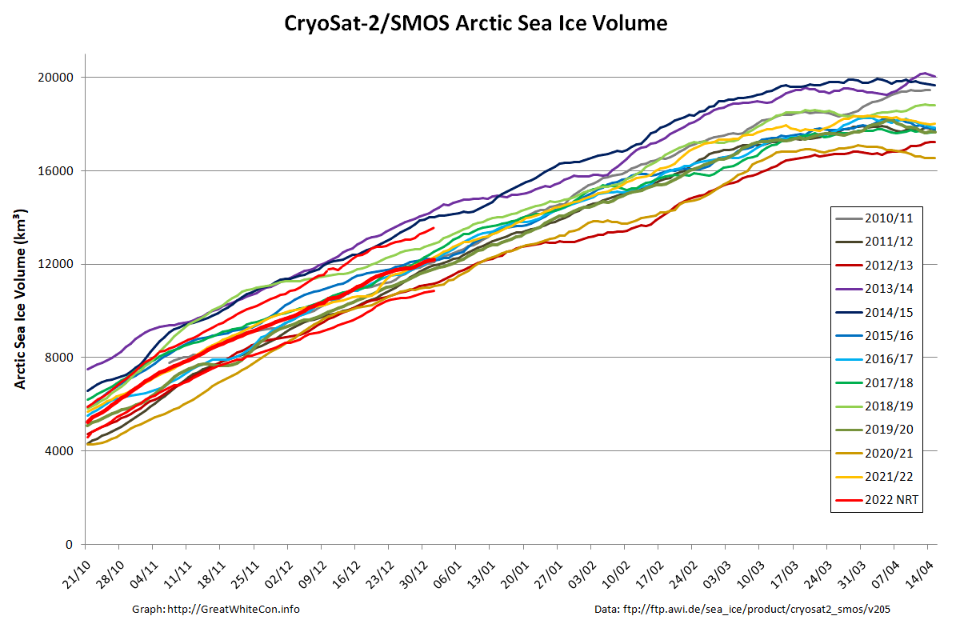
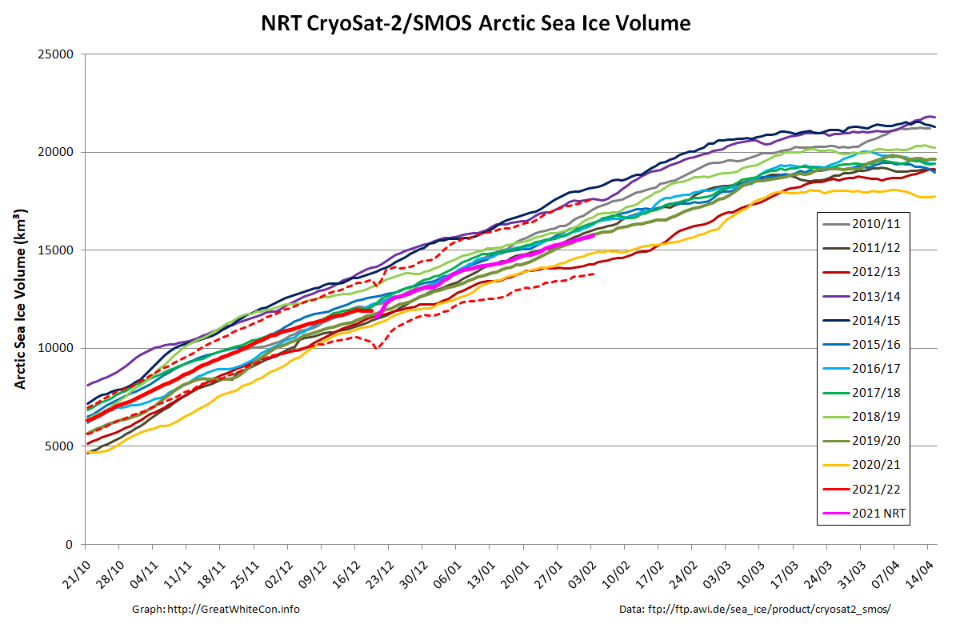
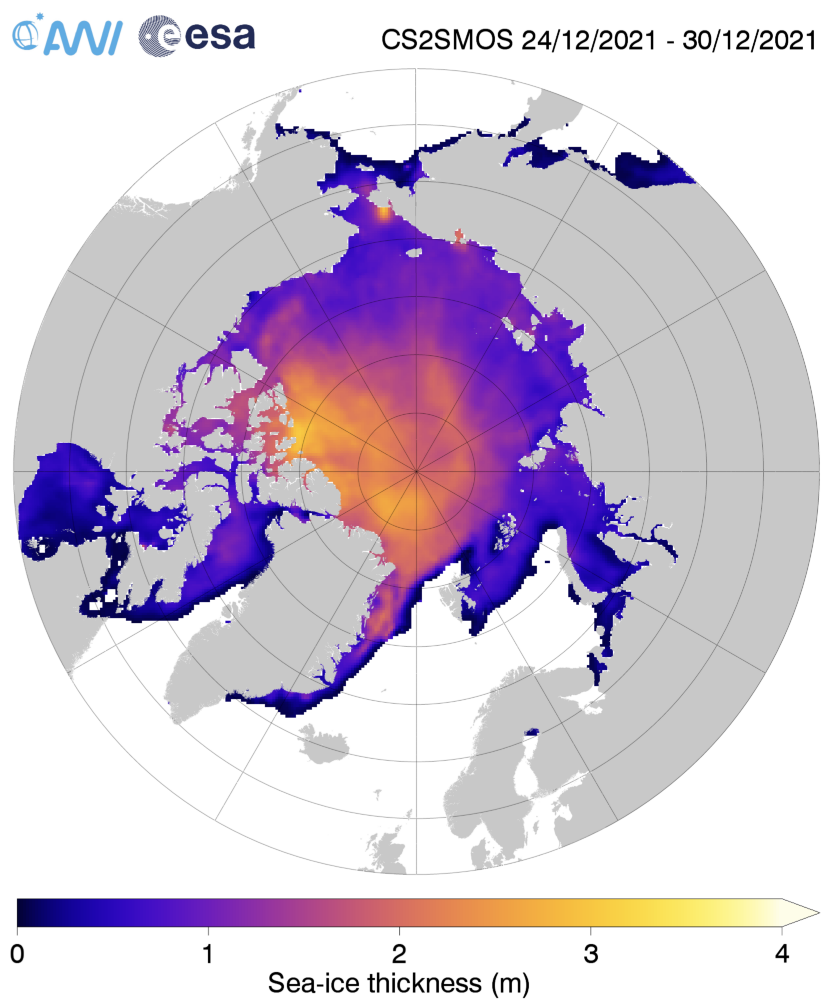
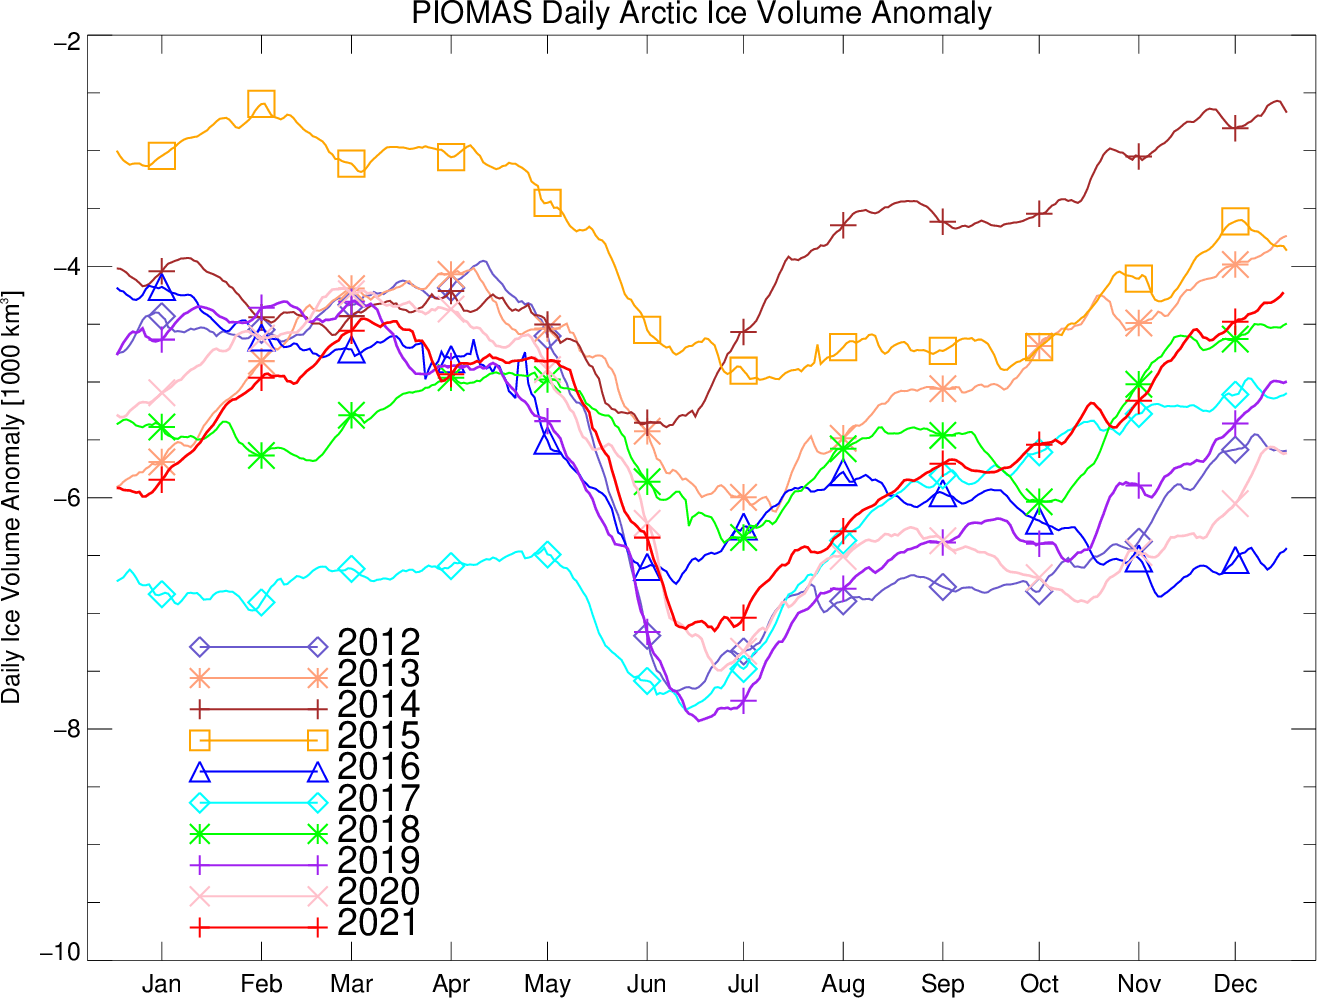
Taylor is keen to see the PIOMAS volume data for January, but whilst we wait for the latest Polar Science Center update here is the CryoSat-2/SMOS volume graph, which now includes a couple of month’s worth of reanalysed results as well as more recent near real time numbers:
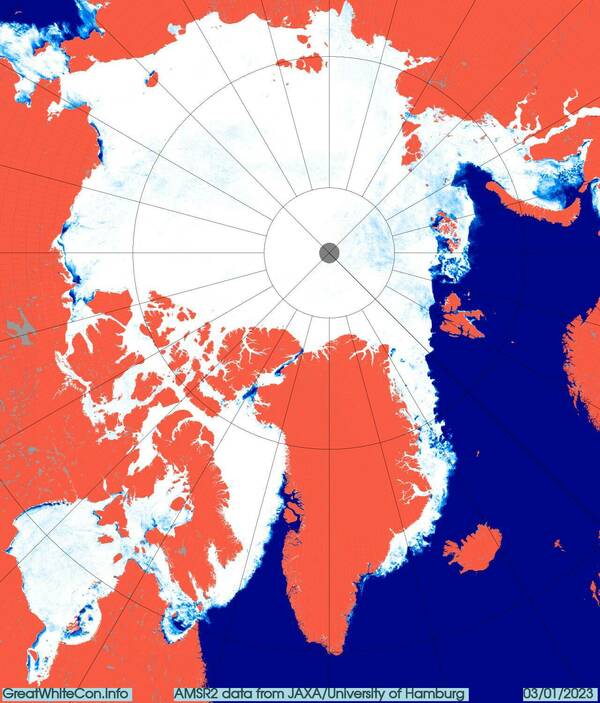
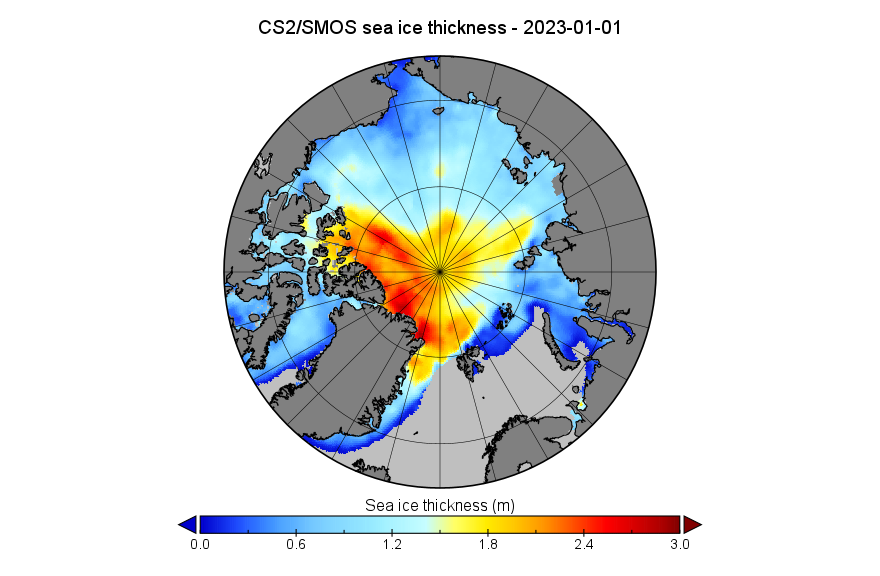
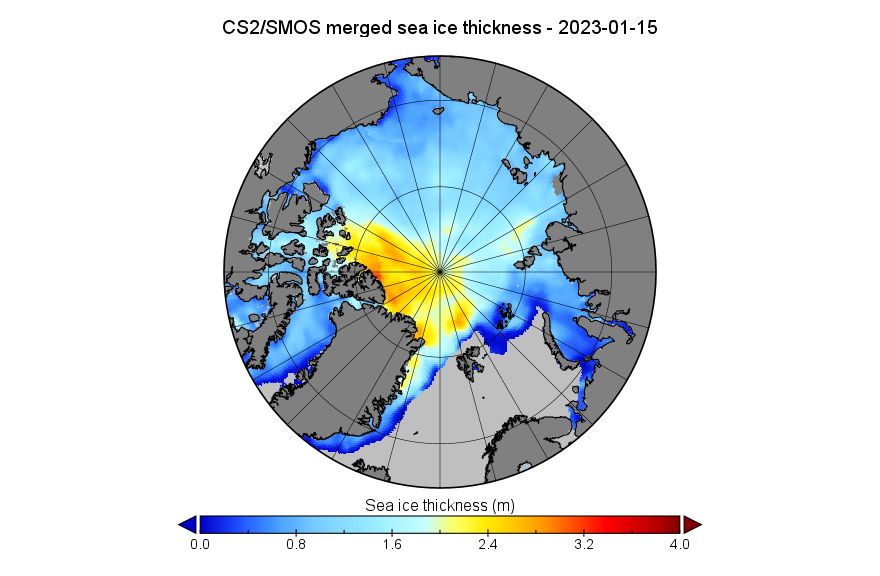
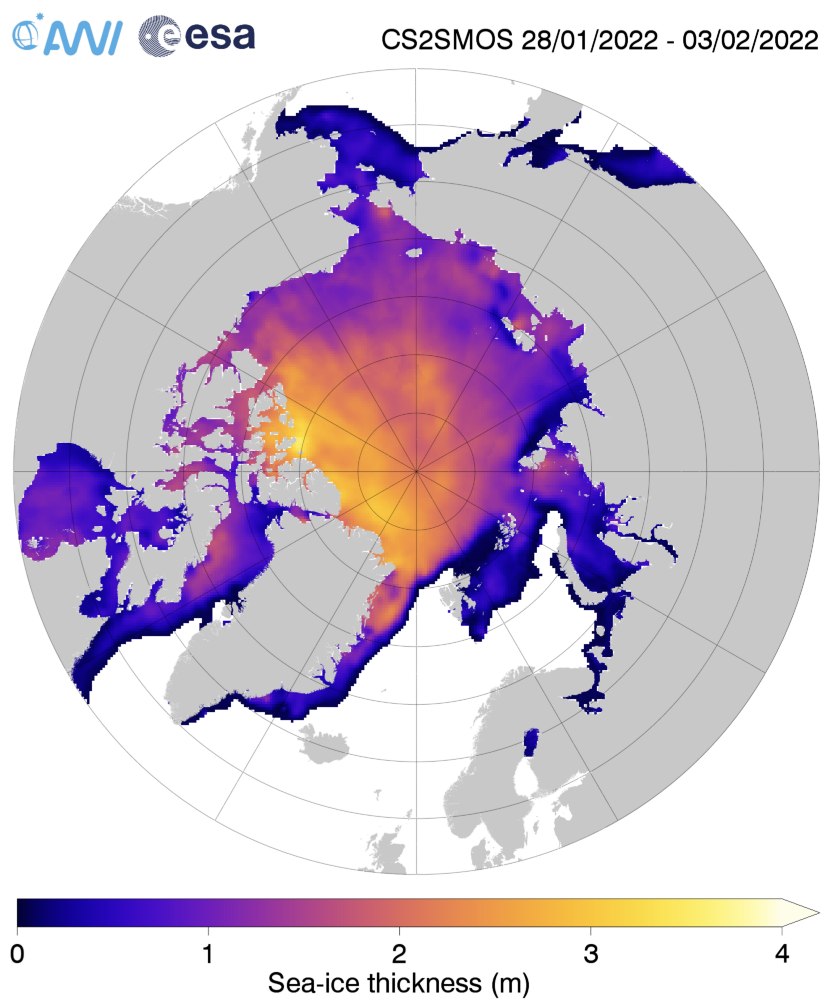
Here too is the start of month CS2/SMOS thickness map:
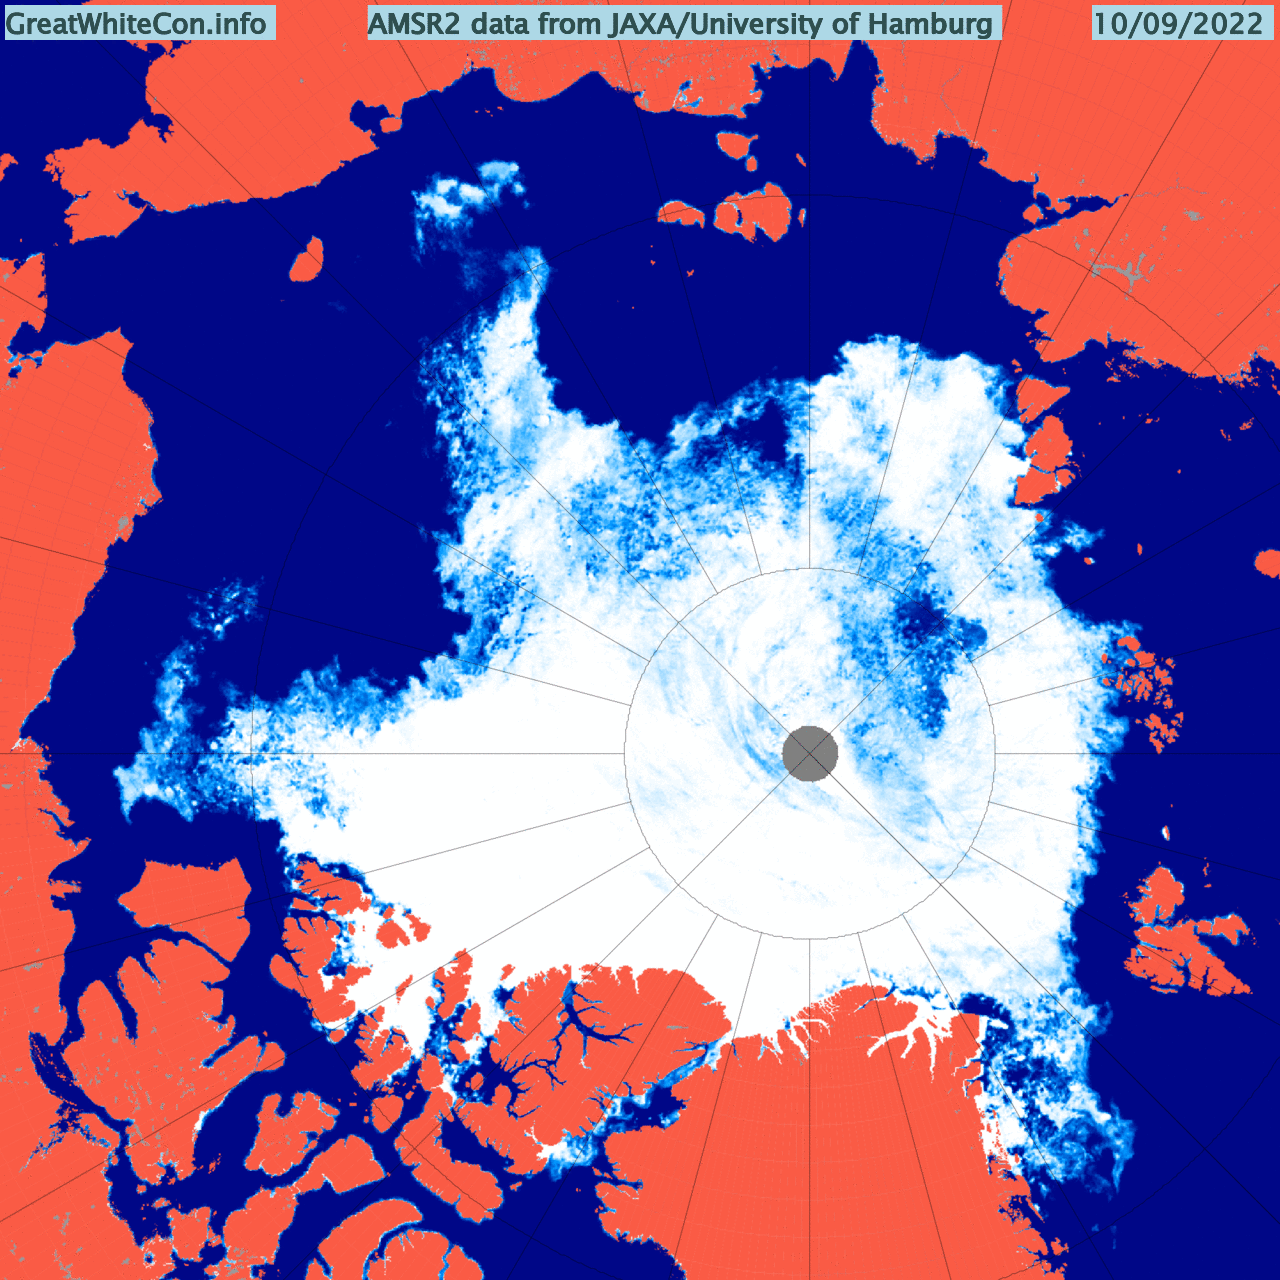
At the beginning of the New Year all the central regions of the Arctic are now refrozen apart from a small area of the Kara Sea:
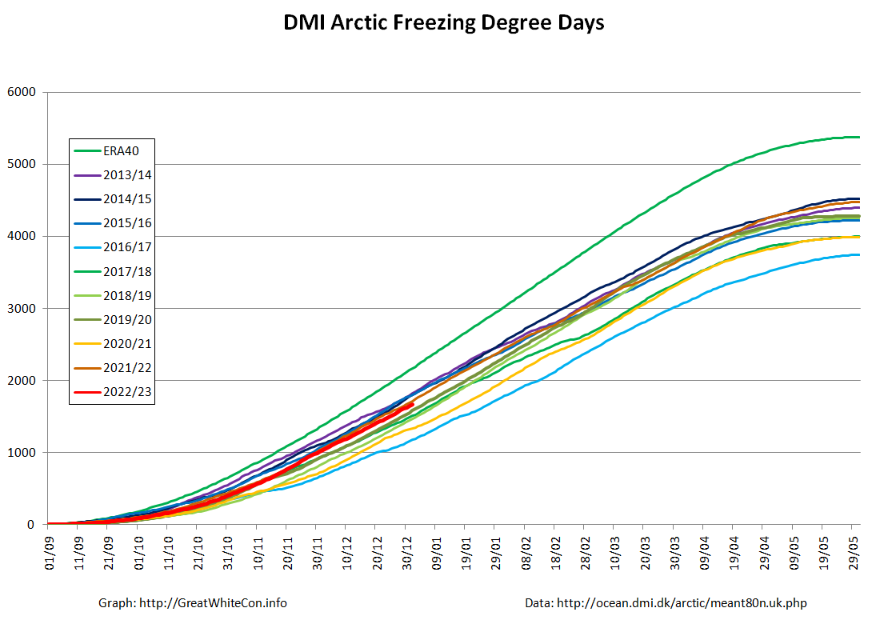
Most Arctic sea ice metrics are near the middle of their respective ranges over the last decade. By way of example, here is a graph of Arctic Freezing Degree Days based on the Danish Meteorological Institute’s temperature data for the area north of 80 degrees latitude:
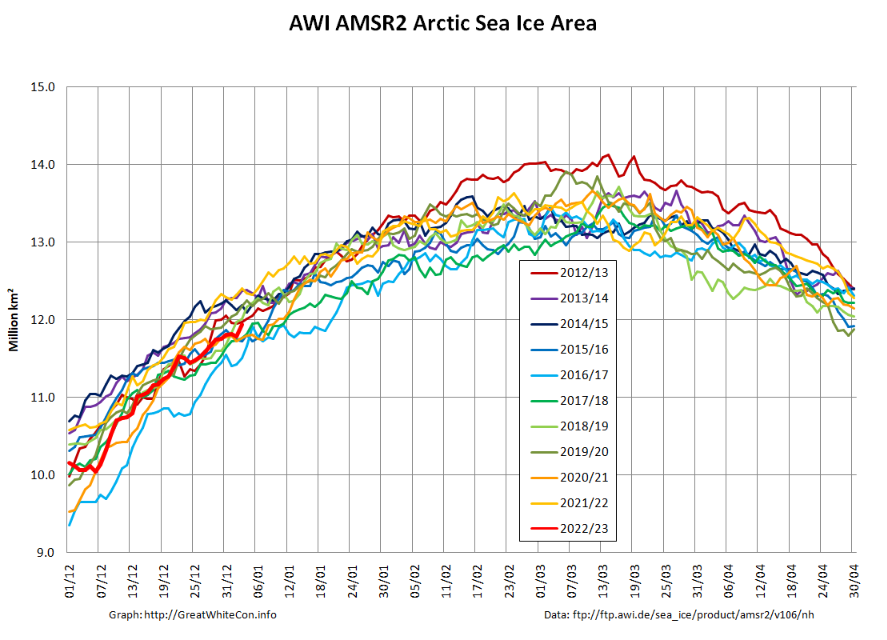
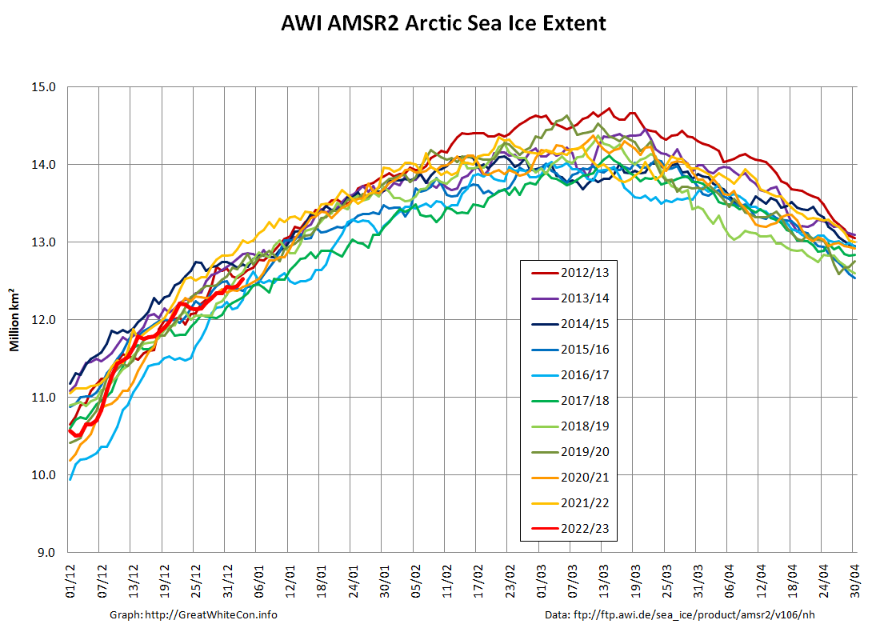
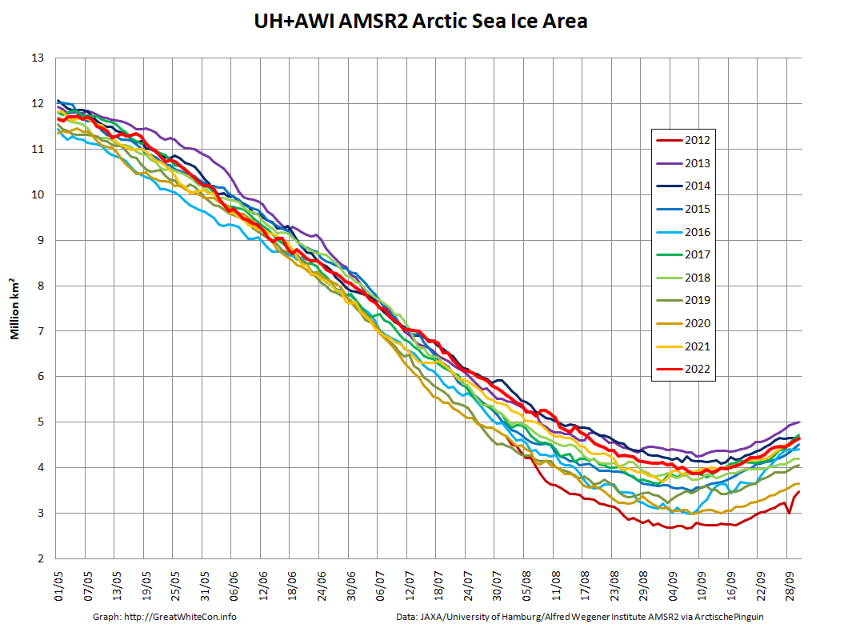
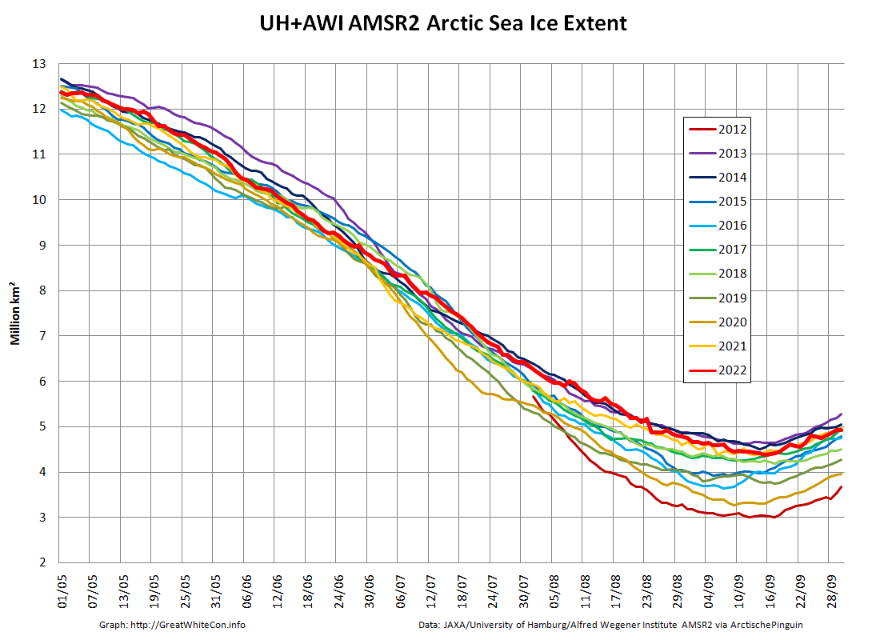
Here too are the high resolution AWI AMSR2 area and extent graphs:
The latest AWI CryoSat-2/SMOS volume graph tells a similar story:
Although overall volume is in the middle of the pack, the associated thickness map:
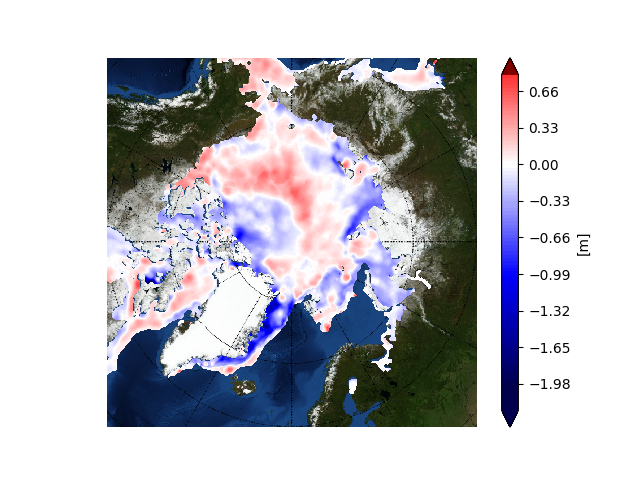
and the thickness anomaly map from the Finnish Meteorological Institute reveal an unusual distribution of thicker ice:
A considerable volume of ice currently situated between Svalbard and North East Greenland seems destined to exit the Central Arctic Basin via the Fram Strait over the coming months.
[Edit – January 24th]
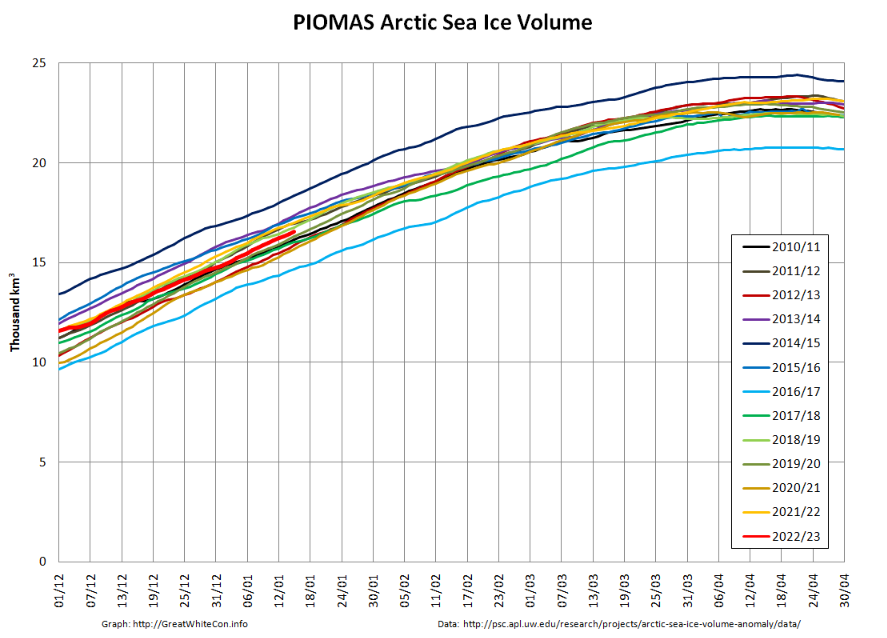
In a somewhat belated mid month update, here’s the PIOMAS daily Arctic sea ice volume graph:
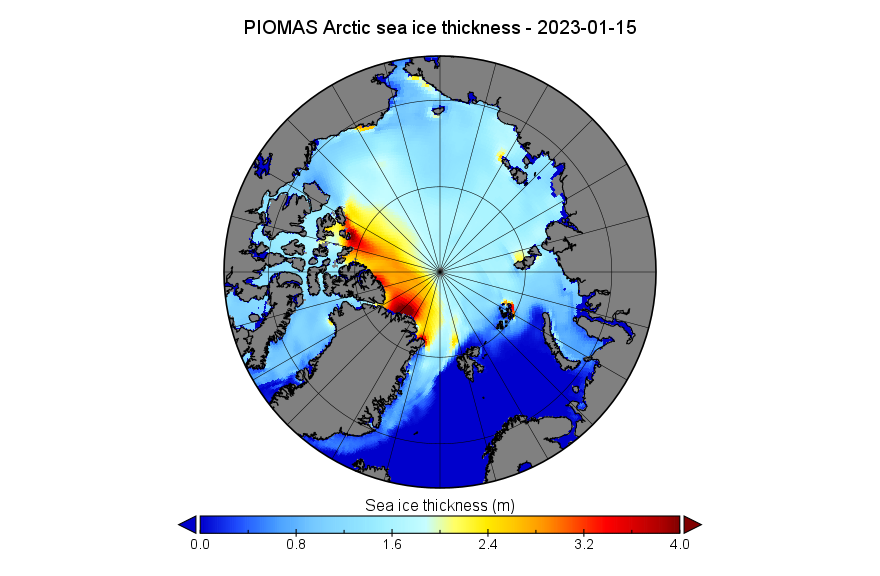
together with the PIOMAS thickness map on January 15th:
For comparison purposes here’s the AWI CryoSat-2/SMOS thickness map using the same scale:
Note the change of scale from the beginning of the month CS2/SMOS map at the top.
Here too is Lars Kaleschke’s animation of recent Arctic sea ice concentration, with the width of leads exaggerated to reveal ice motion:
Click to animate (10 Mb!)
Evidently sea ice export from the so called “last ice area” is continuing via the Nares Strait and in particular via the Fram Strait between Greenland and Svalbard.
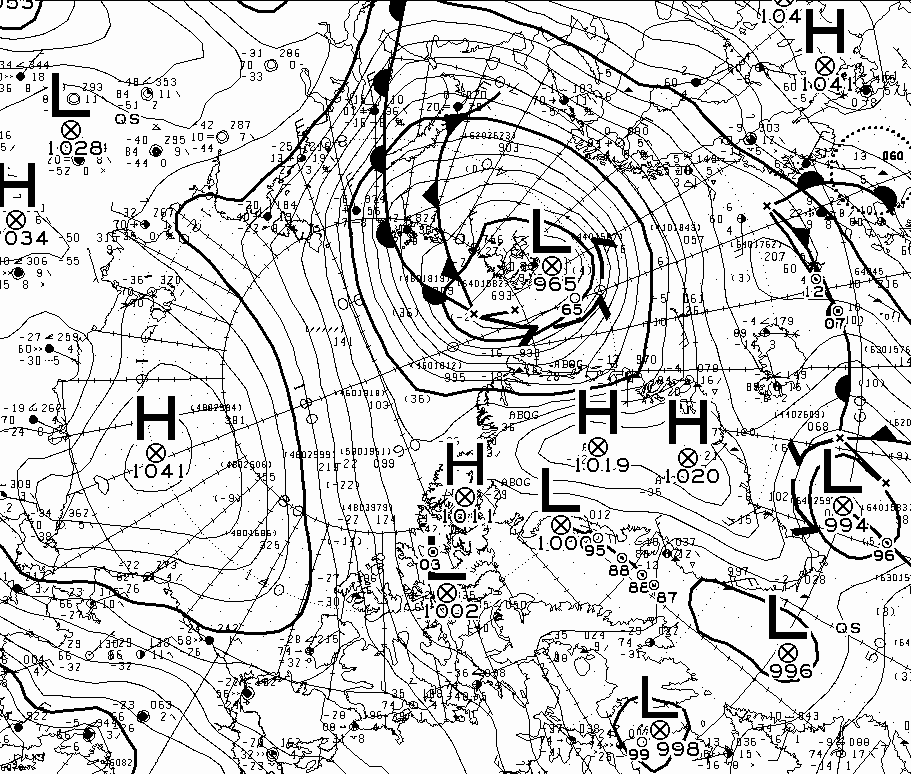
Although not on the same scale as the cyclone at around the same time last year, surface pressure of a storm near Svalbard bottomed out at 965 hPa yesterday:
It will be interesting to see what effect the storm has on the ice on the Atlantic periphery over the next few days.
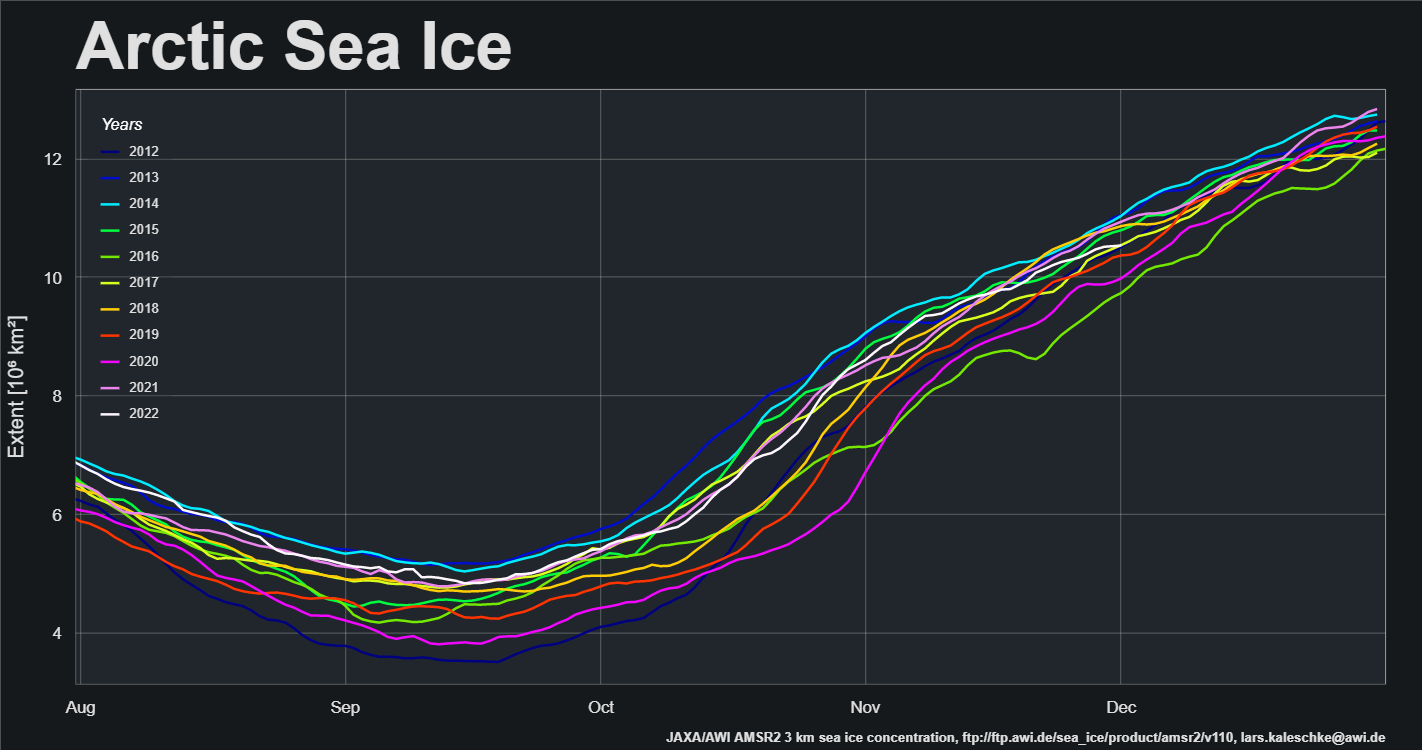
A new month is upon us and Christmas is coming! Here’s another look at Lars Kaleschke’s high resolution AMSR2 area and extent graphs for the Arctic as a whole:
Extent increase stalled for the last few days of November, and as a result extent is now in a “statistical tie” with 2017 for 4th lowest extent for the date in the AMSR2 record.
The 2022/23 freezing season has begun, so to begin with here are Arctic sea ice area and extent during its early stages:
Both metrics are currently tracking 2021 quite closely.
Here too is an AMSR2 animation of the transition from melting to freezing in the Central Arctic. Click to animate, and be warned that the file size is almost 10 Mb:
[Edit – October 4th]
Another big storm is heading for the Chukchi Sea. The GFS forecast currently shows a sub 960 hPa low developing on Thursday:
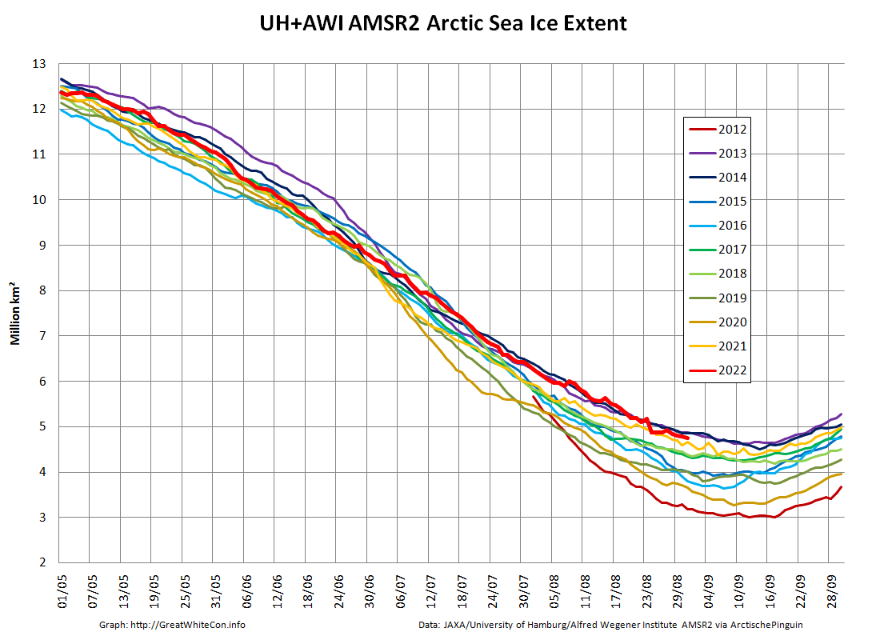
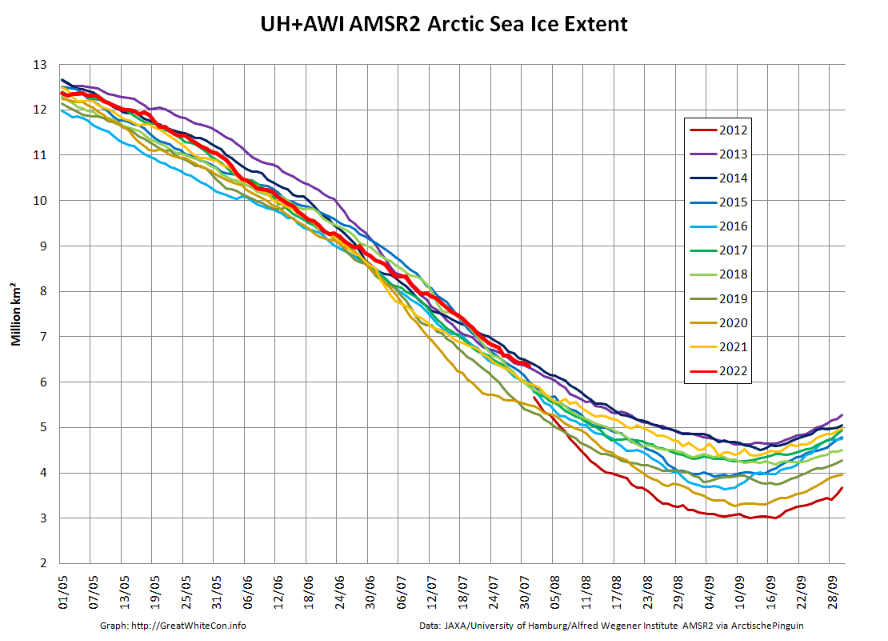
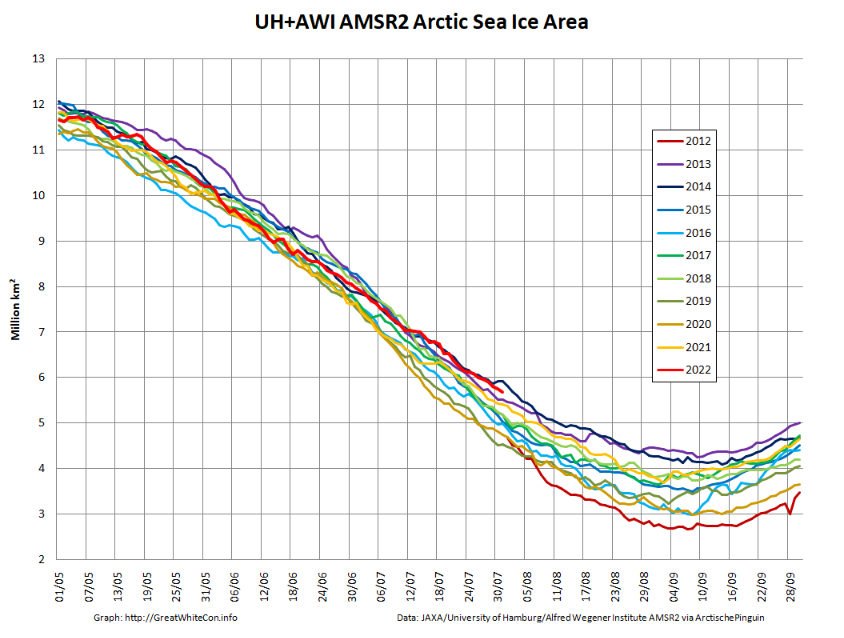
As in previous years there is already a thread devoted to this year’s minimum extent. By way of a summary here are the end of August numbers for our favourite “high resolution” AMSR2 area and extent metrics:
Extent is currently near the top of the range of the last 10 years.
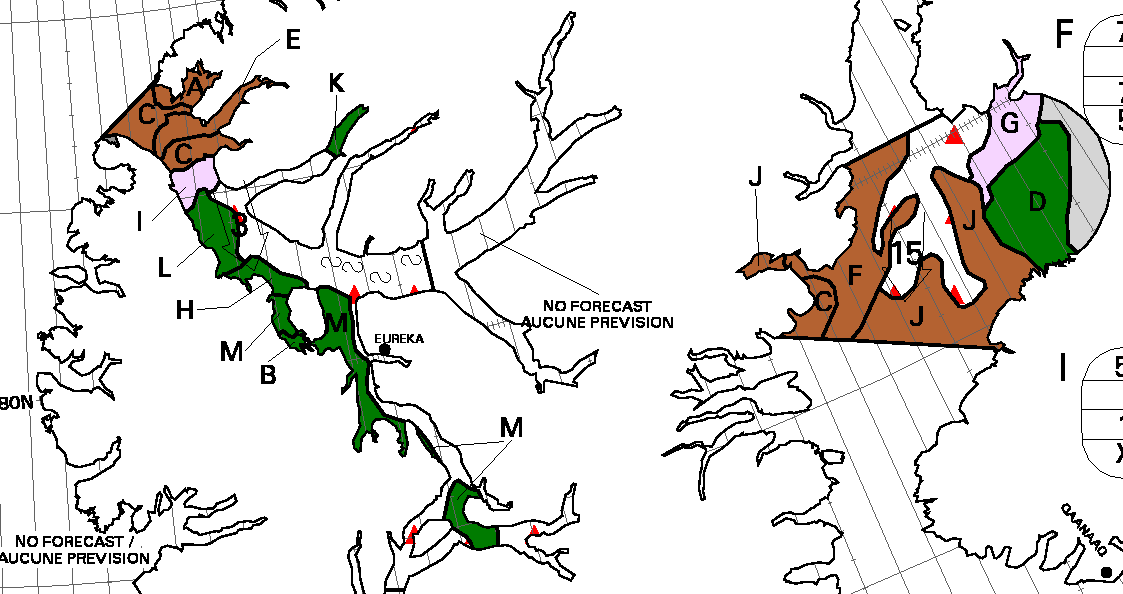
We have now reached the stage of the “melting season” when “refreezing” has started in the Central Arctic but melting at the periphery is outpacing it. However the Canadian Ice Service stage of development charts now show the arrival of new ice in the high latitudes of the Canadian Arctic Archipelago:
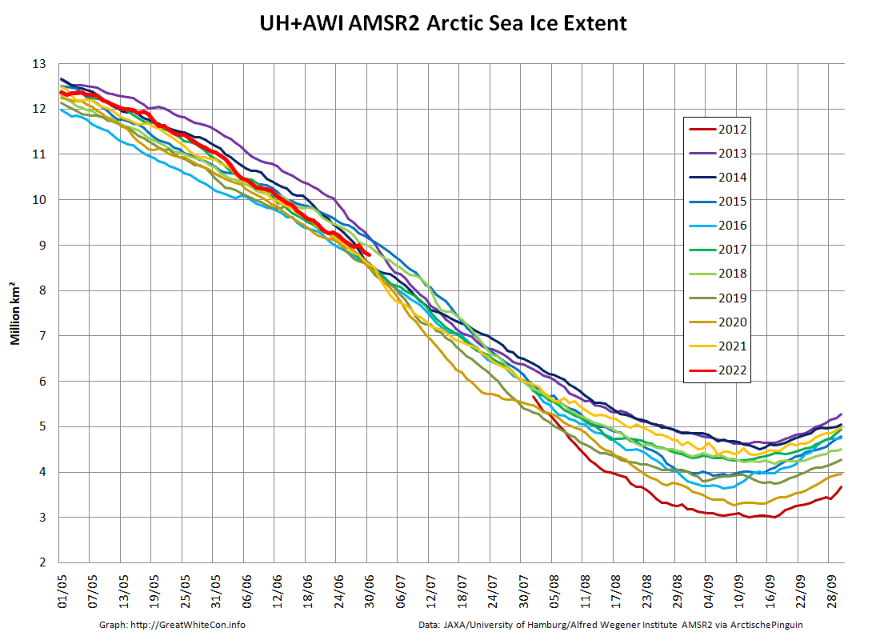
After a relatively rapid decline at the beginning of June Arctic sea extent is now very close to the 2010s average:
Both 2020 and 2021 began relatively rapid declines of their own at the beginning of July, so it will be interesting to see if 2022 follows suit.
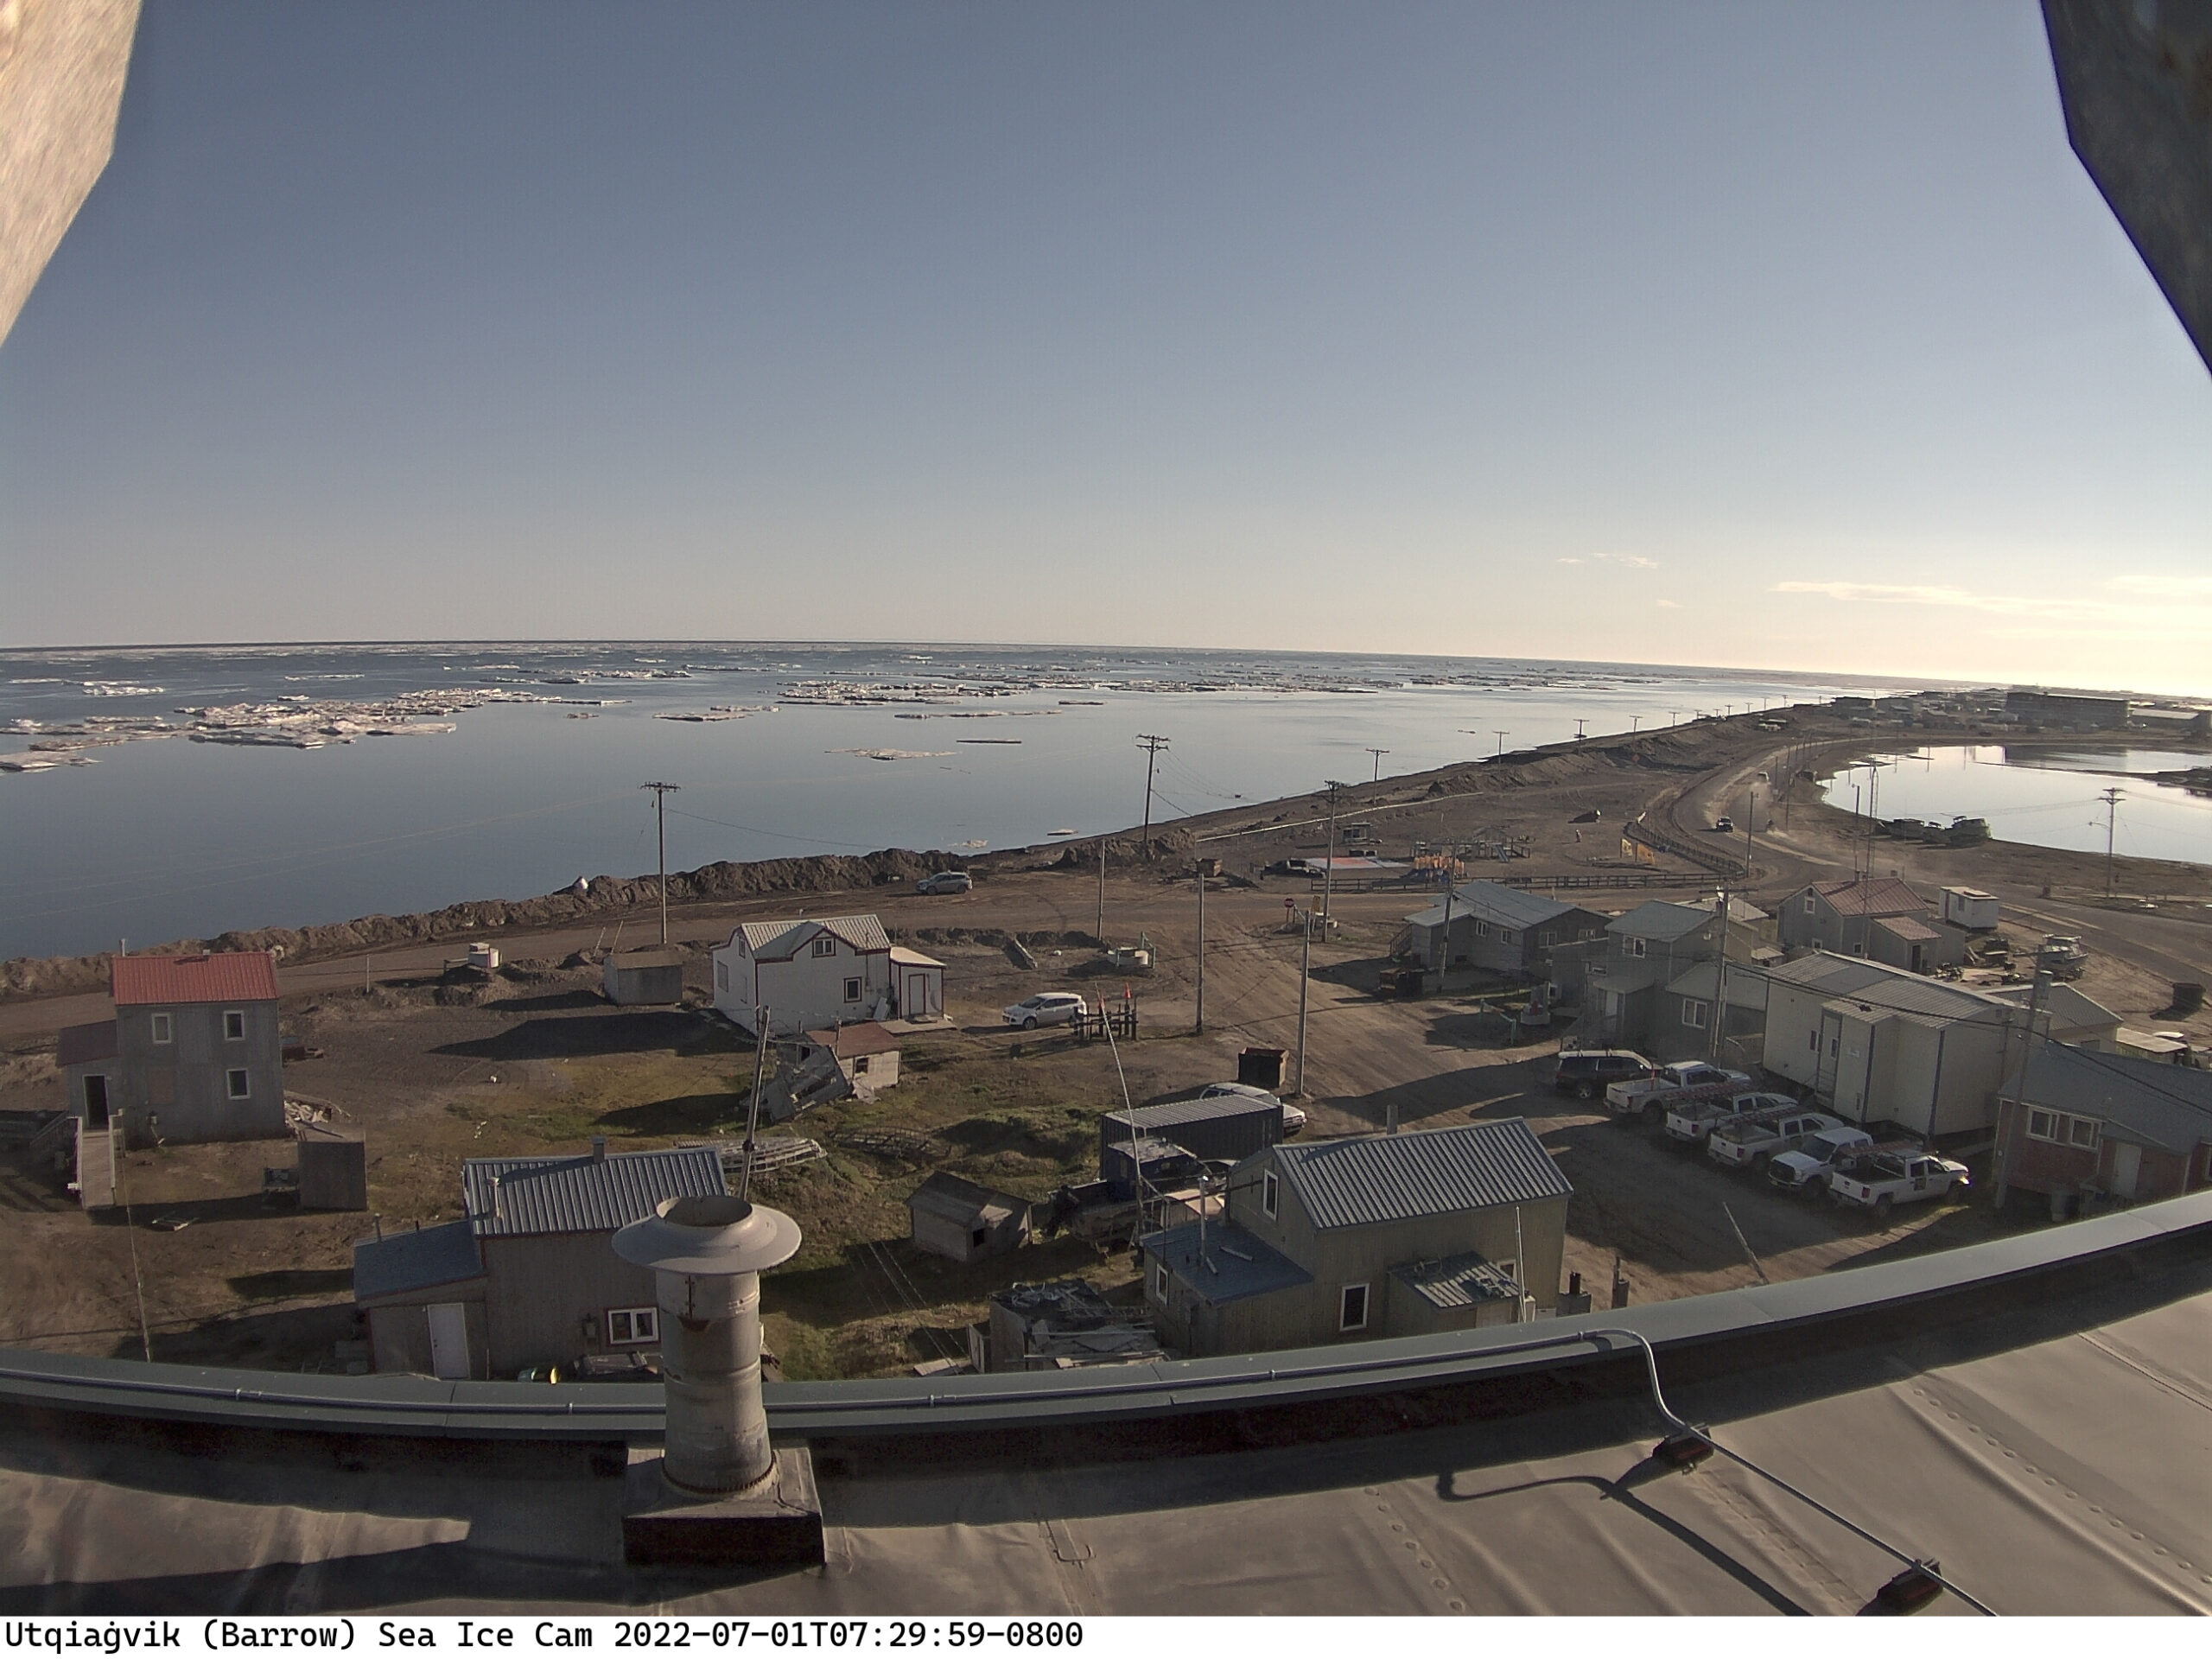
Most of the fast ice off Utqiaġvik has recently disappeared:
Meanwhile further out into the Chukchi Sea the sea ice looks to be in poor shape at the moment, with surface melting apparent across the entire region:
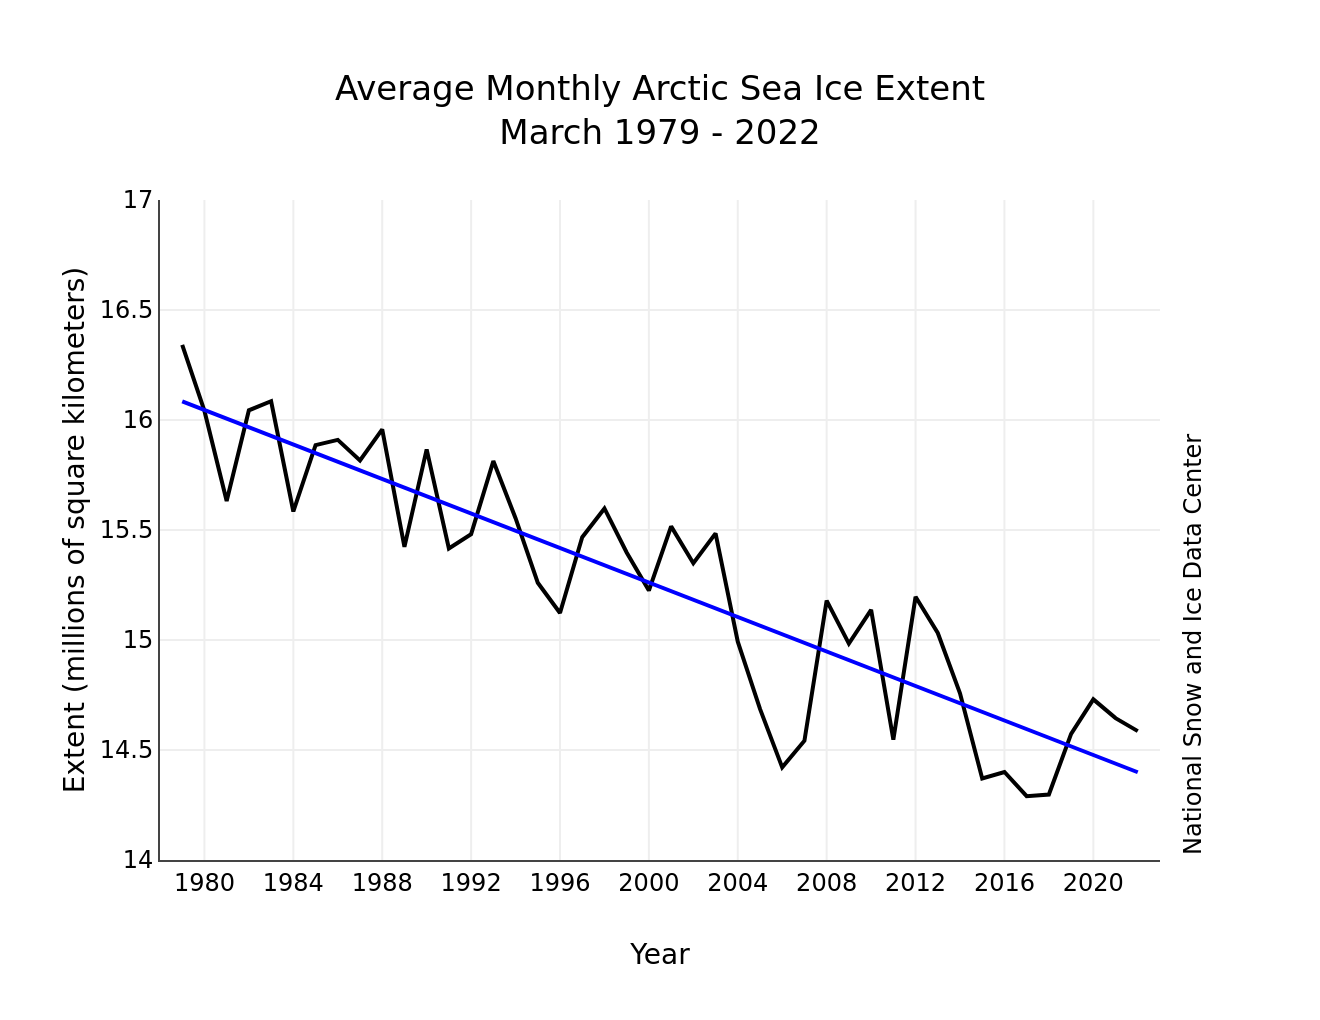
The April edition of the NSIDC’s Arctic Sea Ice News summarises March 2022 as follows:
Average Arctic sea ice extent for March 2022 was 14.59 million square kilometers (5.63 million square miles), ranking ninth lowest in the satellite record…
The total decline, after a series of small ups and downs, was only 250,000 square kilometers (96,500 square miles):
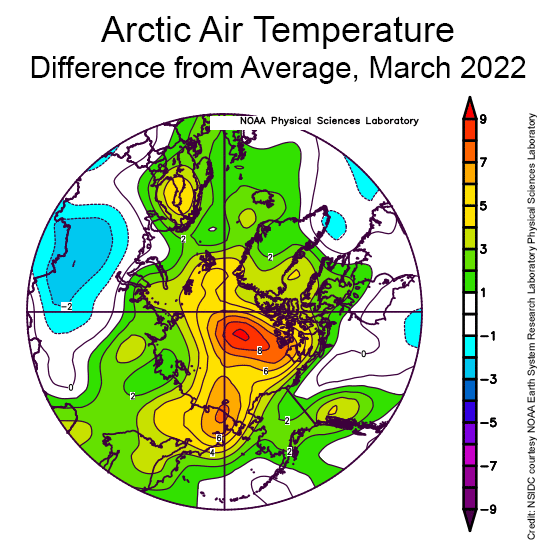
Counter to what might be expected given the very slow rate of sea ice loss over the month as a whole, air temperatures at the 925 millibar level (about 2,500 feet above the surface) were above average over all of the Arctic Ocean:
March temperatures were up to 9 degrees Celsius (16 degrees Fahrenheit) higher than average north of the Canadian Arctic Archipelago, up to 6 degrees Celsius (11 degrees Fahrenheit) above average in the East Siberian Sea, but up to 5 degrees Celsius (9 degrees Fahrenheit) above average over a wide area.
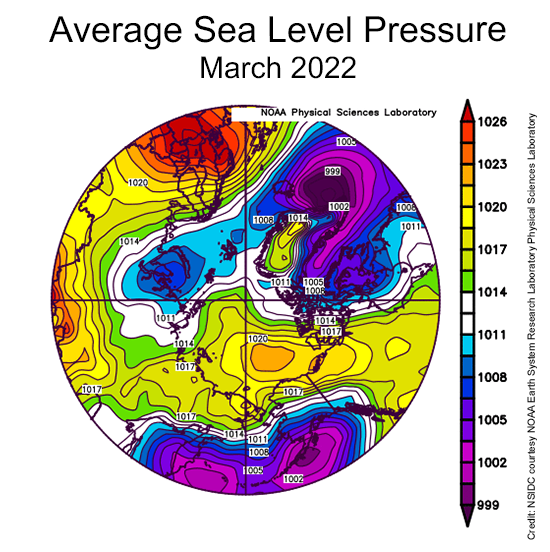
The key features of the sea level pressure pattern were high pressure (an anticyclone) over the central Arctic Ocean, a trough of low pressure extending into the Barents Sea, and an unusually high pressure over Northern Europe:
While having an anticyclone over the central Arctic Ocean is quite typical for this time of year, the combination of the high pressure over northern Europe and the pressure trough to the west led to a strong pressure gradient, leading to strong winds from south through the Norwegian and Barents Seas…
This can be tied to the extreme warm event over the Arctic Ocean seen in the middle of the month, associated with strong water vapor transport and the passage of several strong cyclones.
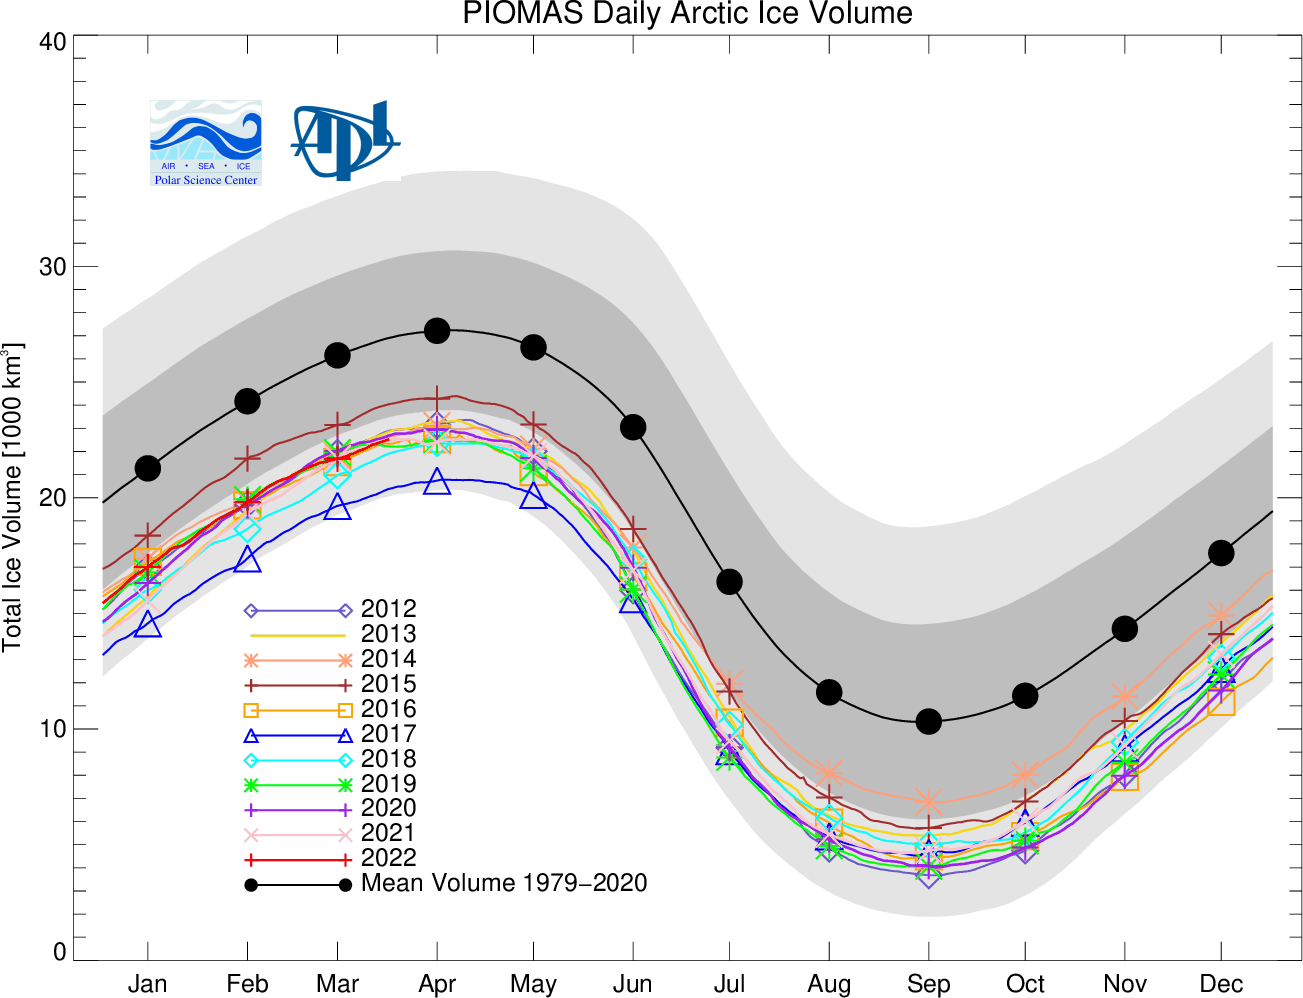
The Polar Science Center at the University of Washington has also released the PIOMAS volume data for March 2022:
Average Arctic sea ice volume in March 2022 was 21,700 km3. This value is the 6th lowest on record for March, about 2,200 km3 above the record set in 2017. Monthly ice volume was 38% below the maximum in 1979 and 25% below the mean value for 1979-2021:
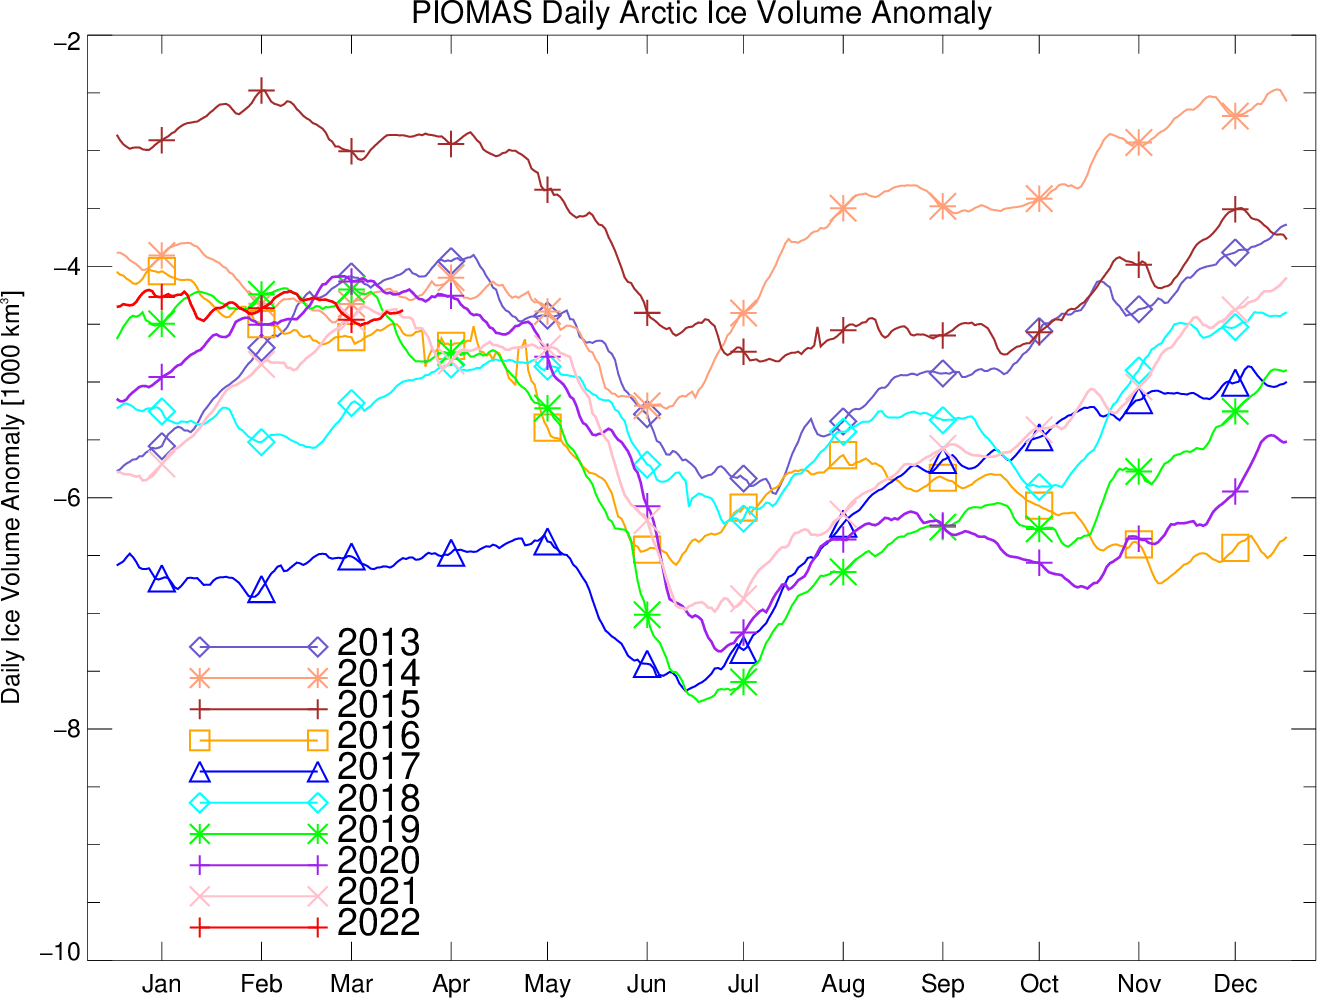
Ice growth anomalies for March 2022 continued to be at the upper end of the most recent decade with a mean ice thickness (above 15 cm thickness) at the middle of recent values:
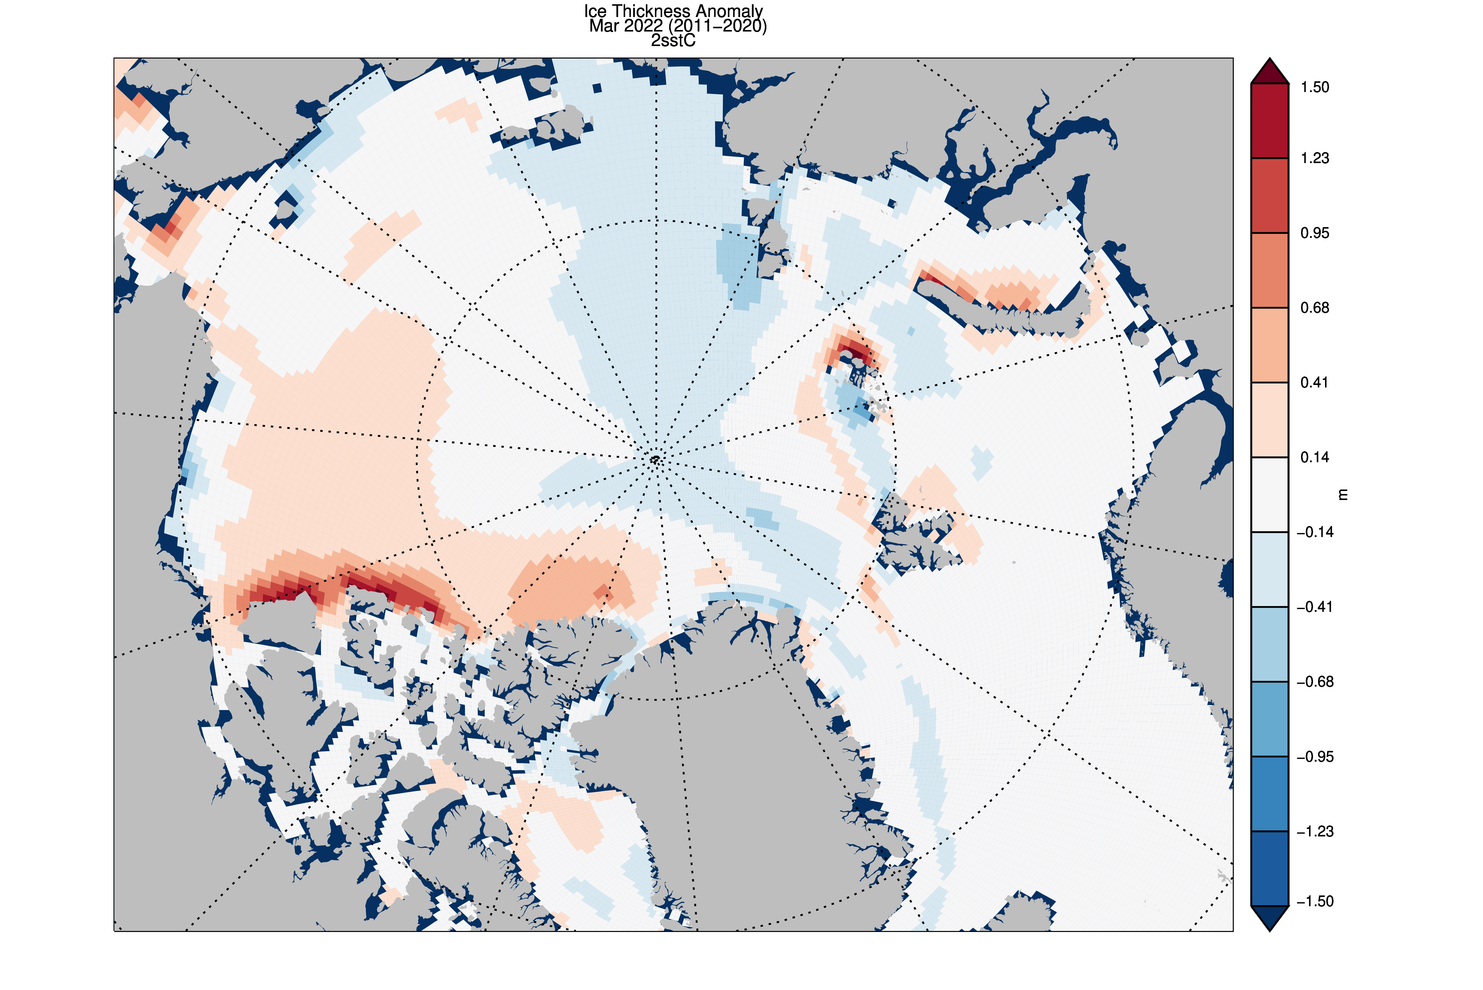
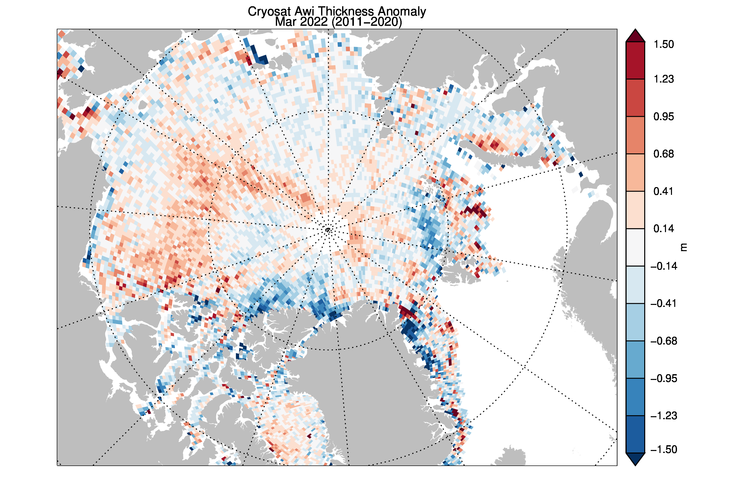
The ice thickness anomaly map for March 2022 relative to 2011-2020 divides the Arctic in two halves with positive anomalies in the “Western Arctic” but negative anomalies in “Eastern Arctic”. A narrow band of negative anomalies remains along the coast of North of Greenland but positive anomaly exists north of Baffin Island.
CryoSat 2 ice thickness shows an similar pattern of sea ice thickness anomalies though the areas North of Greenland and Baffin Bay show substantial differences:
[Edit – April 10th]
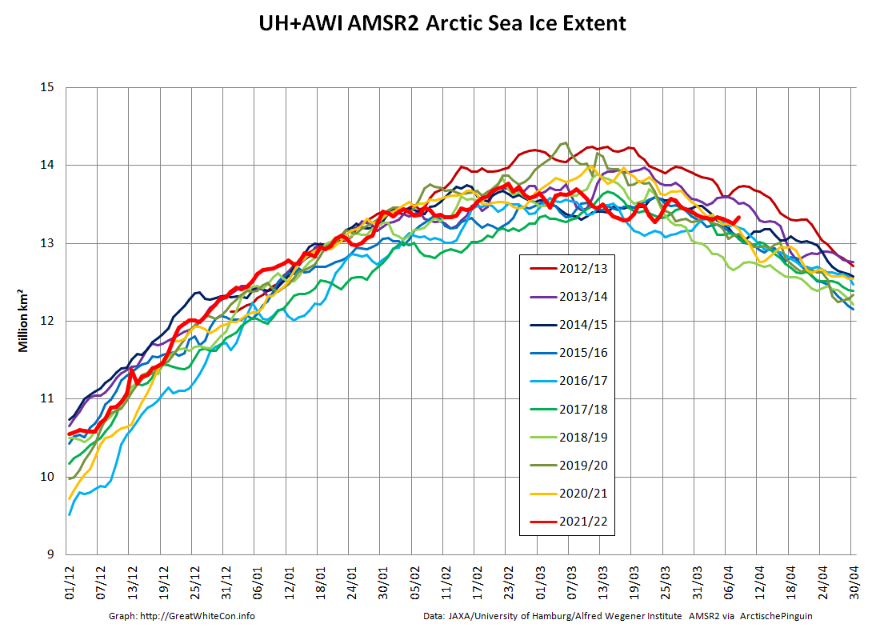
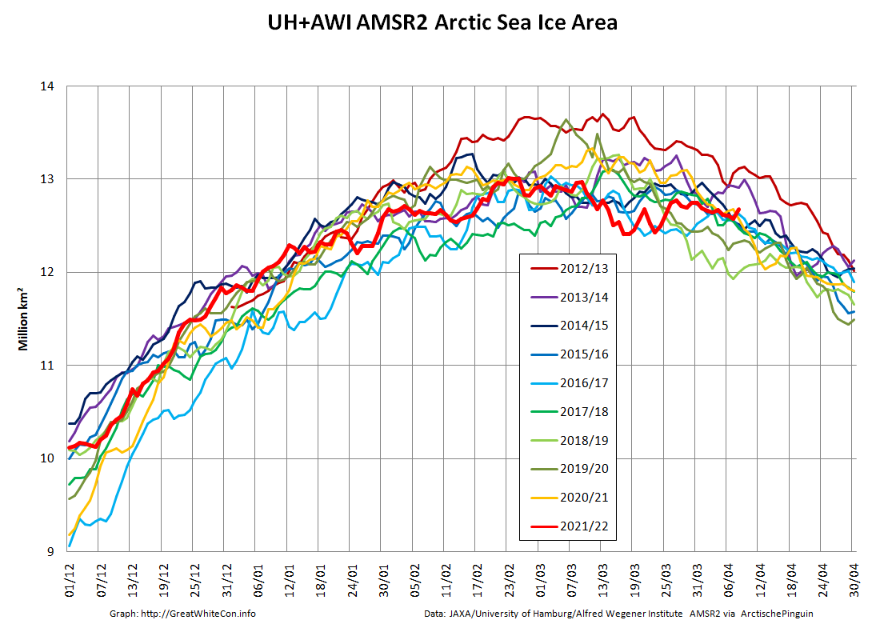
Here are the latest graphs of our favourite “high resolution” AMSR2 metrics, which combine recent data from the Alfred Wegener Institute with historical data from the University of Hamburg:
As you can see, there have indeed been a few ups and downs! Click the image below to see a 10 Mb animation of ice motion over the last few weeks:
The obvious point to note at the moment is that there are currently long flaw leads on both the Siberian and Canadian sides of the Arctic Ocean. The animation also reveals episodes of open water in the Beaufort and Chukchi Seas, as well as north of Franz Josef Land and Svalbard.
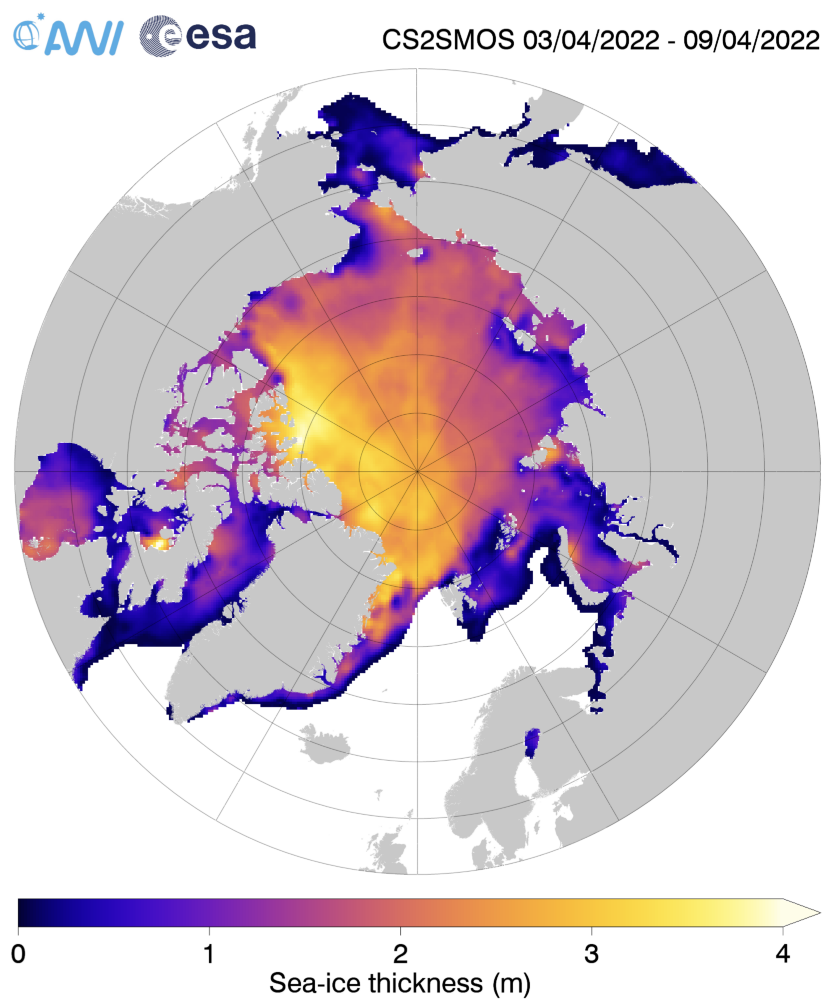
The ice in those areas is still very thin on the latest AWI CryoSat-2/SMOS sea ice thickness map:
[Edit – April 11th]
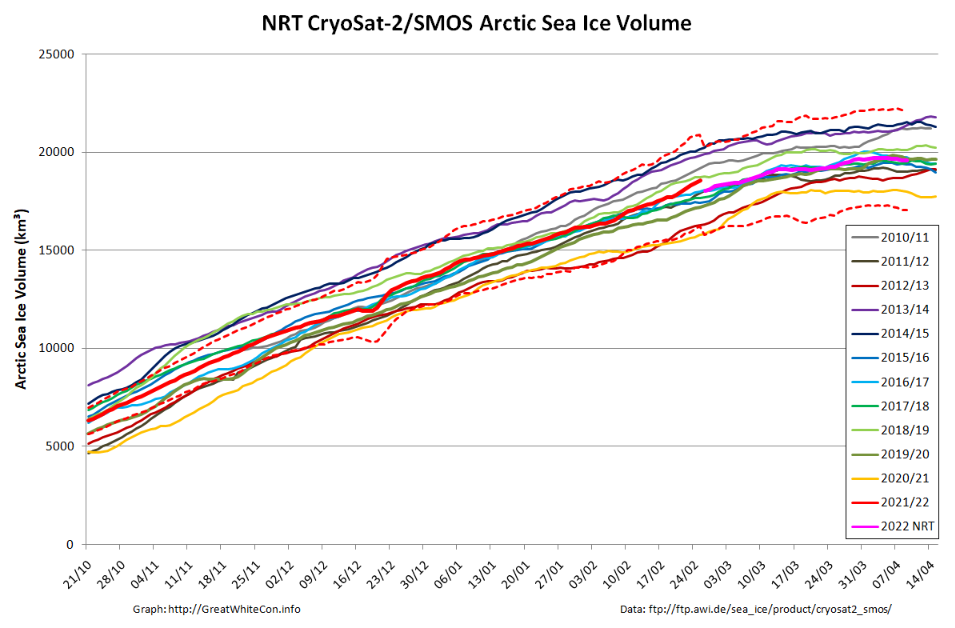
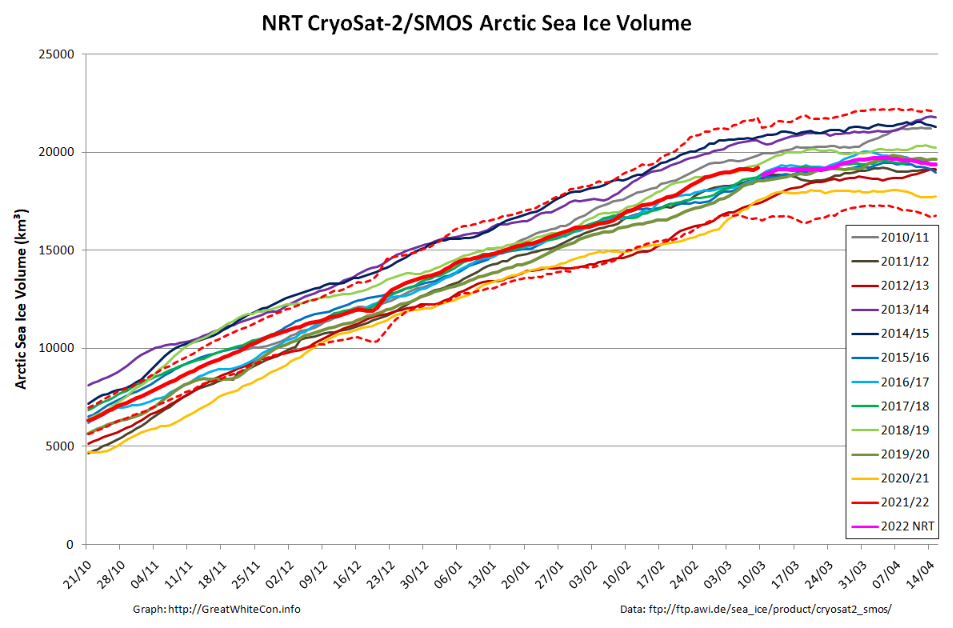
Here too is the latest AWI CryoSat-2/SMOS volume graph:
The reanalysed data is now showing something of a surge towards the end of February.
[Edit – April 23rd]
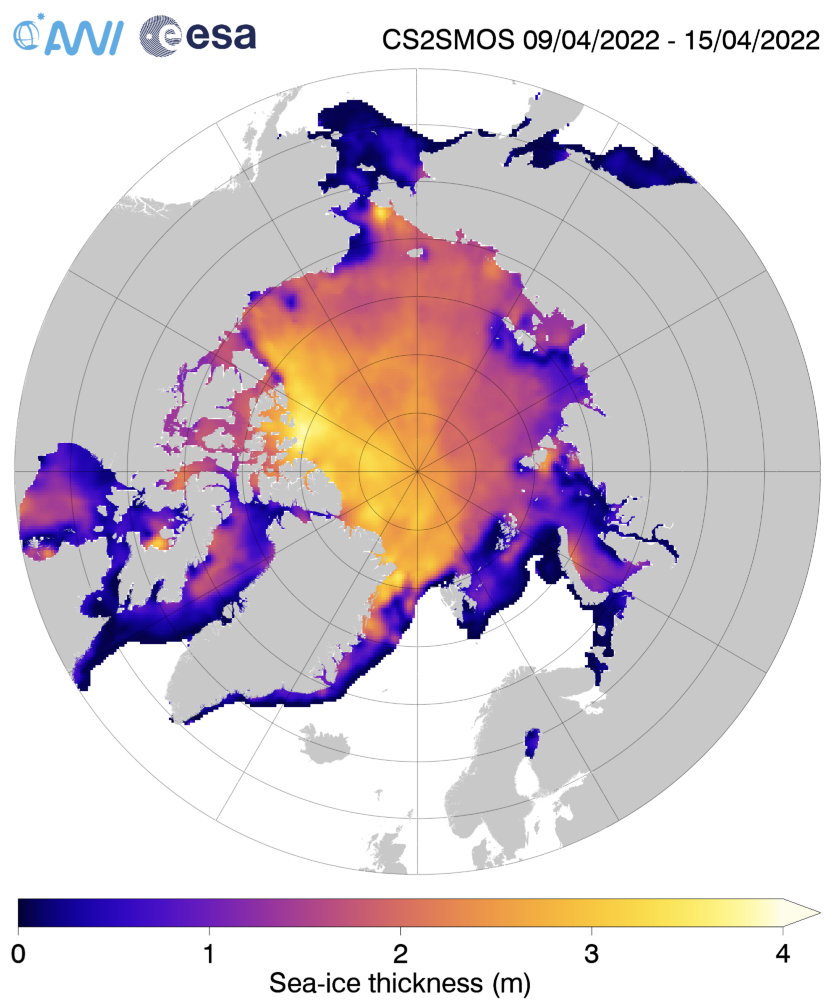
Here’s the last “near real time” AWI CryoSat-2/SMOS Arctic sea ice thickness map for Spring 2022:
The significantly thinner areas in the Beaufort and Chukchi Seas are even more pronounced than previously. Here also is the associated CS2/SMOS volume graph:
The 2022 maximum volume based on NRT data is 19719 km³ on April 5th. Expect that to be revised upwards when the reanalysed data is ultimately published.
Going back to 2 dimensions, the assorted “ups and downs” now seem to have resolved into the melting season proper:
The peripheral sea have been responsible for most of the recent decline:
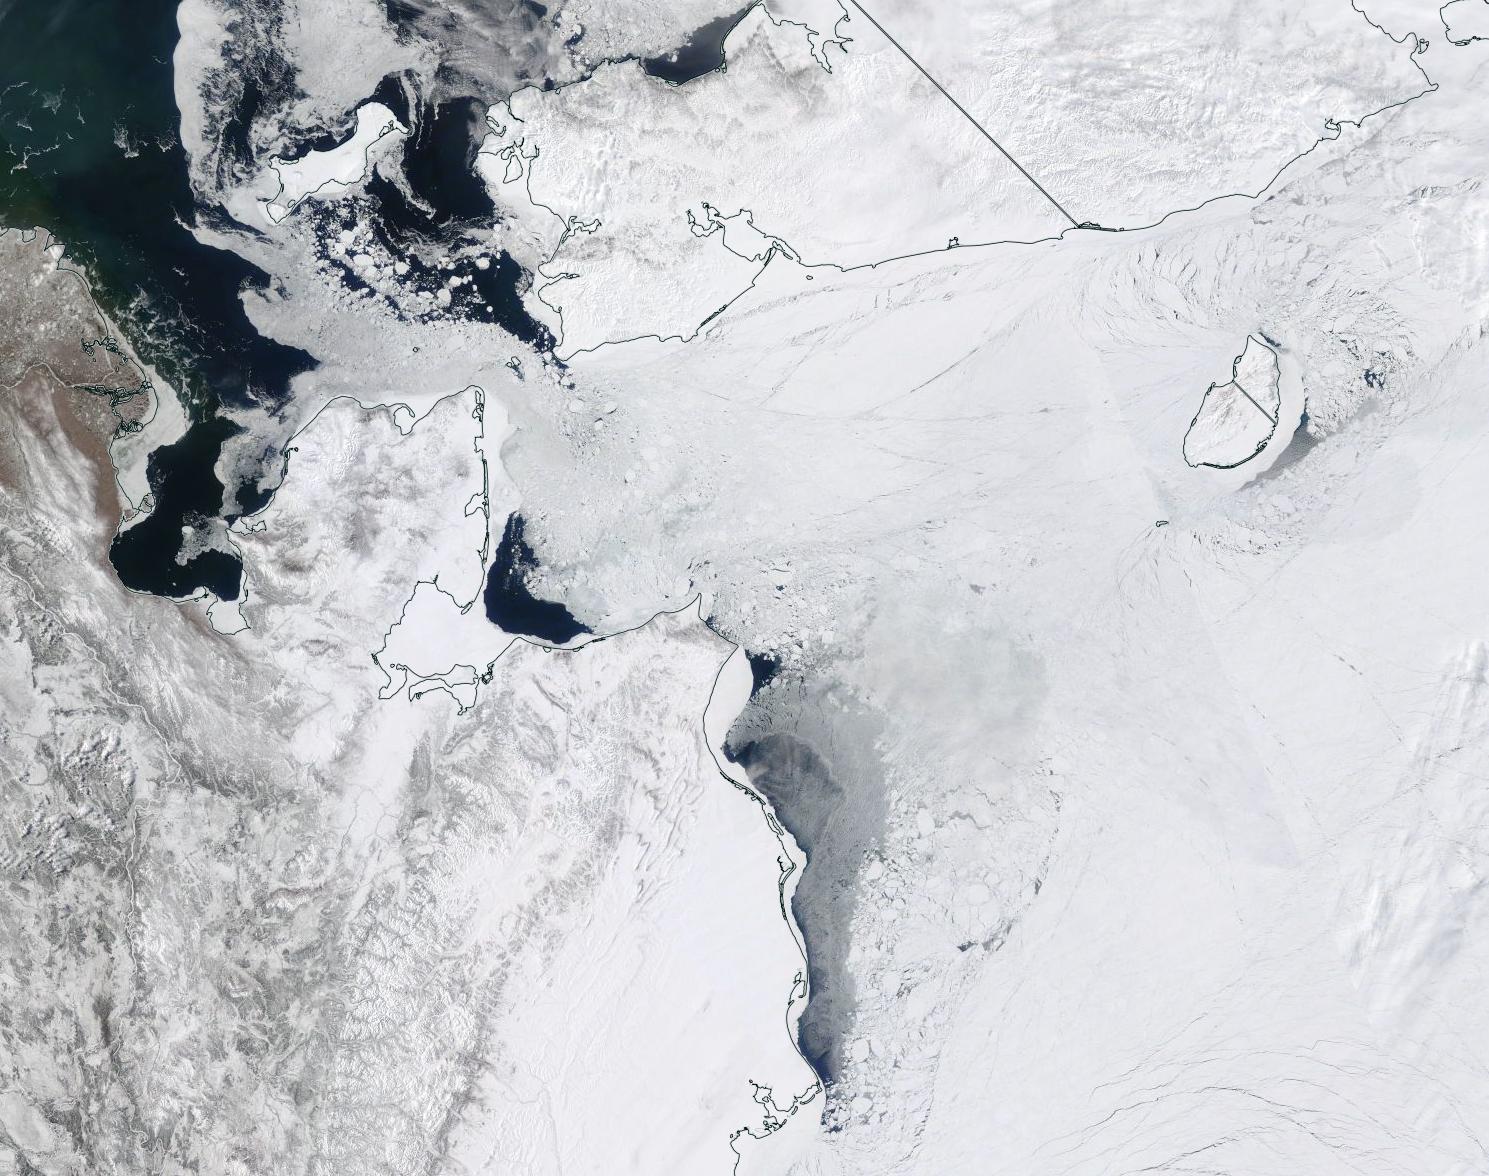
However as mentioned above, the Chukchi Sea has been experiencing some ups and downs of its own. Perhaps the sun is now high enough in the sky for the most recent “down” to stick around for the summer?
“True colour” image of the Chukchi Sea on April 21st from the MODIS instrument on the Terra satellite[Edit – April 24th]
Over the last couple of days some open water has appeared in the Beaufort Sea off the Mackenzie Delta:
“True colour” image of the Beaufort Sea on April 23rd from the MODIS instrument on the Terra satellite [Edit – April 25th]
Especially for Taylor, here’s the GFS Arctic snow depth forecast for 10 days into the future:
Following the “Great Arctic Winter Cyclone” towards the end of January, here are the latest high resolution AMSR2 area and extent graphs:
The sudden reduction in sea ice area due to the cyclone is very apparent, as is the subsequent refreeze of the affected area. Here’s an animation of AMSR2 concentration revealing more detail:
Here too is the latest AWI CryoSat-2/SMOS Arctic sea ice volume graph:
It doesn’t reveal a similar “blip” towards the end of January, suggesting that reduction in area was due to compaction rather than melt. The current AWI thickness map shows the freshly formed ice north east of Svalbard is still very thin:
The latest thickness anomaly map from the Finnish Meteorological Institute shows that the ice which was exported from the Central Arctic via the Fram Strait is nevertheless still anomalously thin, although there is now an area of thicker ice north of Greenland:
2021 has been and gone, so first of all may I wish all our readers a very Happy New Year.
Sadly it’s not been a happy start to 2022 for the inhabitants of Boulder, Colorado, home of the National Snow and Ice Data Center. According to the Denver Post:
The Marshall fire destroyed an estimated 991 homes in Boulder County, damaged 127 more and may have killed three people, Sheriff Joe Pelle said Saturday afternoon.
Pelle added that the cause of the fire — the most damaging in Colorado history — remains under investigation, and confirmed that sheriff’s officials have served a search warrant on at least one property based on a tip.
Currently, two people are missing in Superior and another is missing in the Marshall area, Pelle said. All three are feared dead as each of their homes was lost to the fire, the sheriff said…
So far, officials say Thursday’s wildfire — exacerbated by 100-mph winds — burned more than 6,000 acres across Boulder County.
The fire destroyed 553 homes in Louisville, damaging 45, Pelle said Saturday. It also destroyed 332 homes in Superior, damaging 60 in that town, and destroyed 106 homes in unincorporated Boulder County, damaging 22…
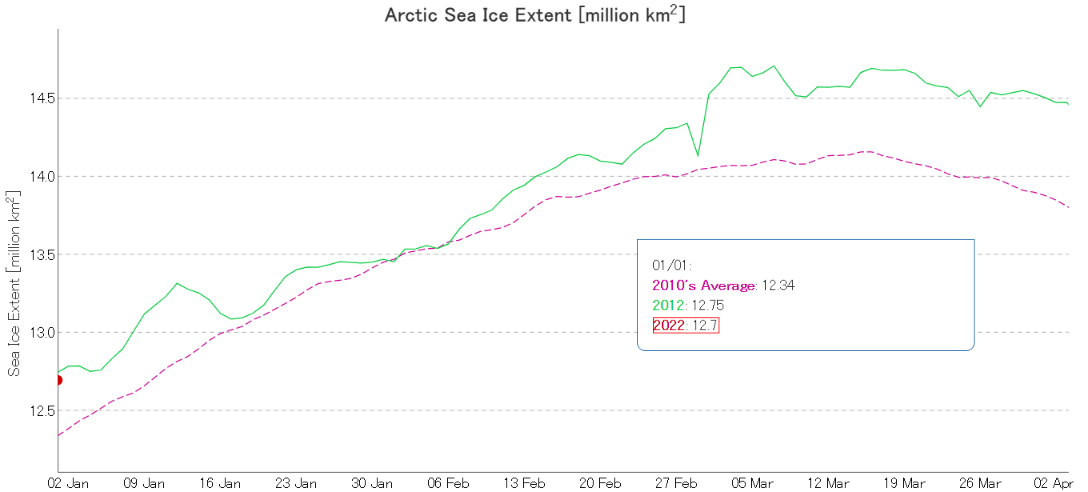
Moving north to examine snow and ice data from the Arctic, let’s start 2022 in traditional fashion with a look at high resolution AMSR2 area and extent:
Both metrics are now near the upper boundary of the last 10 years’ range. The AMSR2 instrument wasn’t launched into orbit until summer 2012, but according to both JAXA and NSIDC data extent on January 1st 2022 is almost identical to the same date in 2012. Regular readers will recall that year went on to produce the lowest annual minimum extent in the satellite era despite recording the highest annual maximum in the decade of the 2010s:
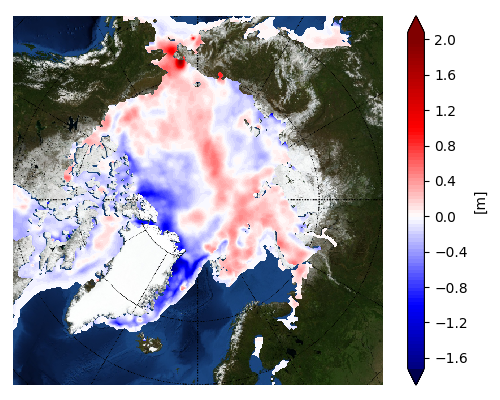
Note that sea ice volume tells a rather different story. Here’s the latest AWI CryoSat-2/SMOS volume graph:
The current near real time data is likely to be revised upwards slightly when the final reanalysis is complete, but even so volume seems likely to remain in the lower half of the recent range at the end of 2021.
Once again the ice in the so called “last ice area” north of Greenland and Ellesmere Island is thinner than usual, as is the ice in the Fram Strait and East Greenland Sea.
[Edit – January 11th]
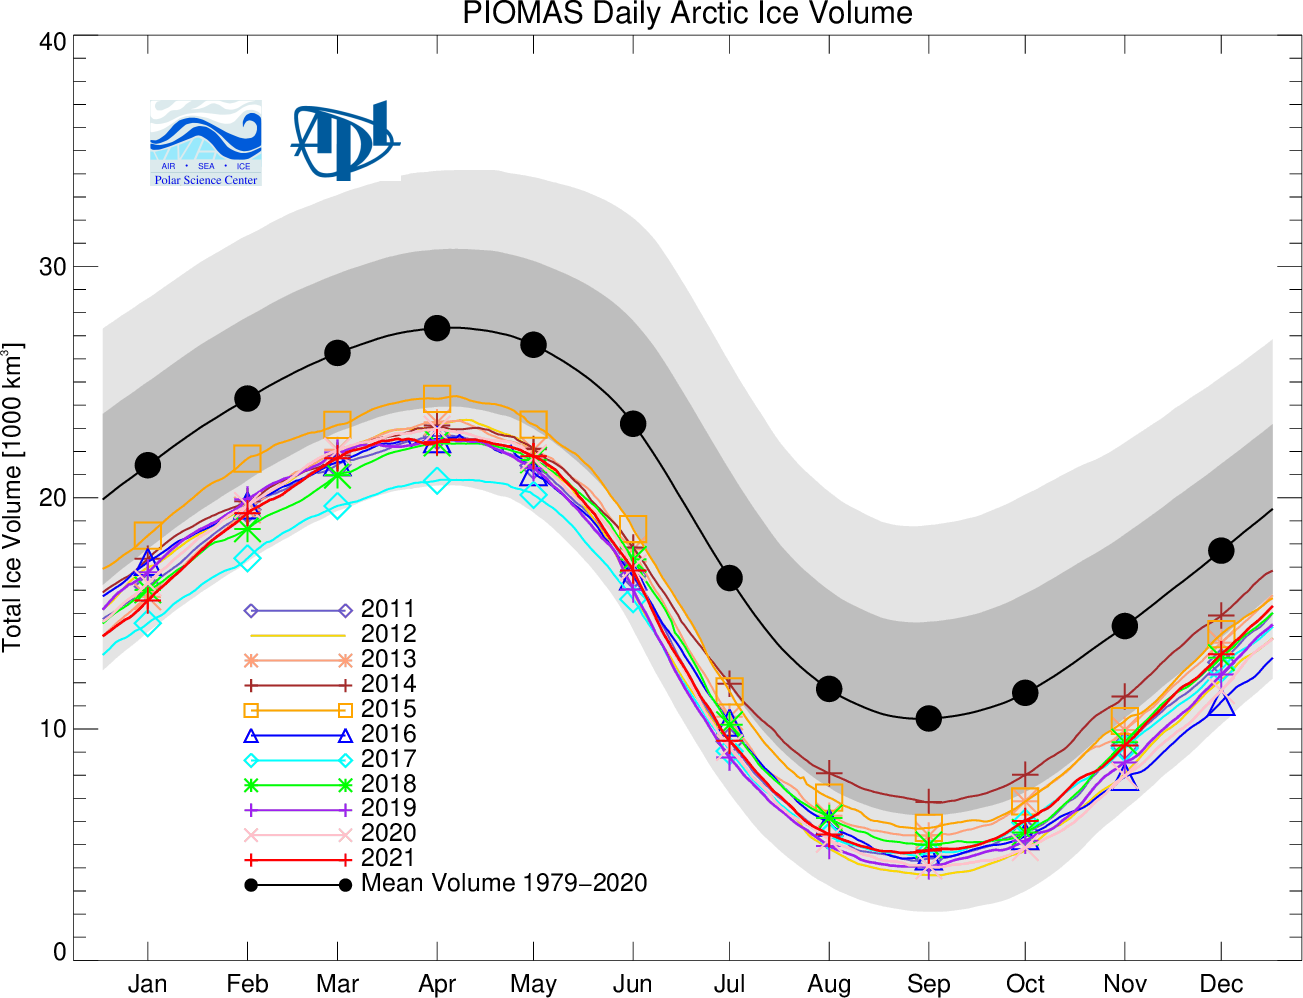
As has been pointed out below, the Polar Science Center has now released the PIOMAS volume data for December 2021:
Average Arctic sea ice volume in December 2021 was 13,300 km3. This value is the 9th lowest on record for December, about 2100 km3 above the record set in 2016. Monthly ice volume was 51% below the maximum in 1979 and 37% below the mean value for 1979-2020. Average December 2021 ice volume was 1.2 standard deviations above the 1979-2020 trend line.
November and December of 2021 saw relative rapid ice growth for recent years, bringing the mean ice thickness (above 15 cm thickness) towards the thicker end of the recent values.
The ice thickness anomaly map for December 2021 relative to 2011-2020 continues to show anomalies divided into positive and a negative halves with areas of positive anomalies increasing since the two prior months and stretching from the Beaufort, over the pole and into the Barents. Negative anomalies stretching from Fram Strait, North of Greenland and along the Canadian Archipelago. Areas North of Greenland again feature low ice thickness as in prior years.
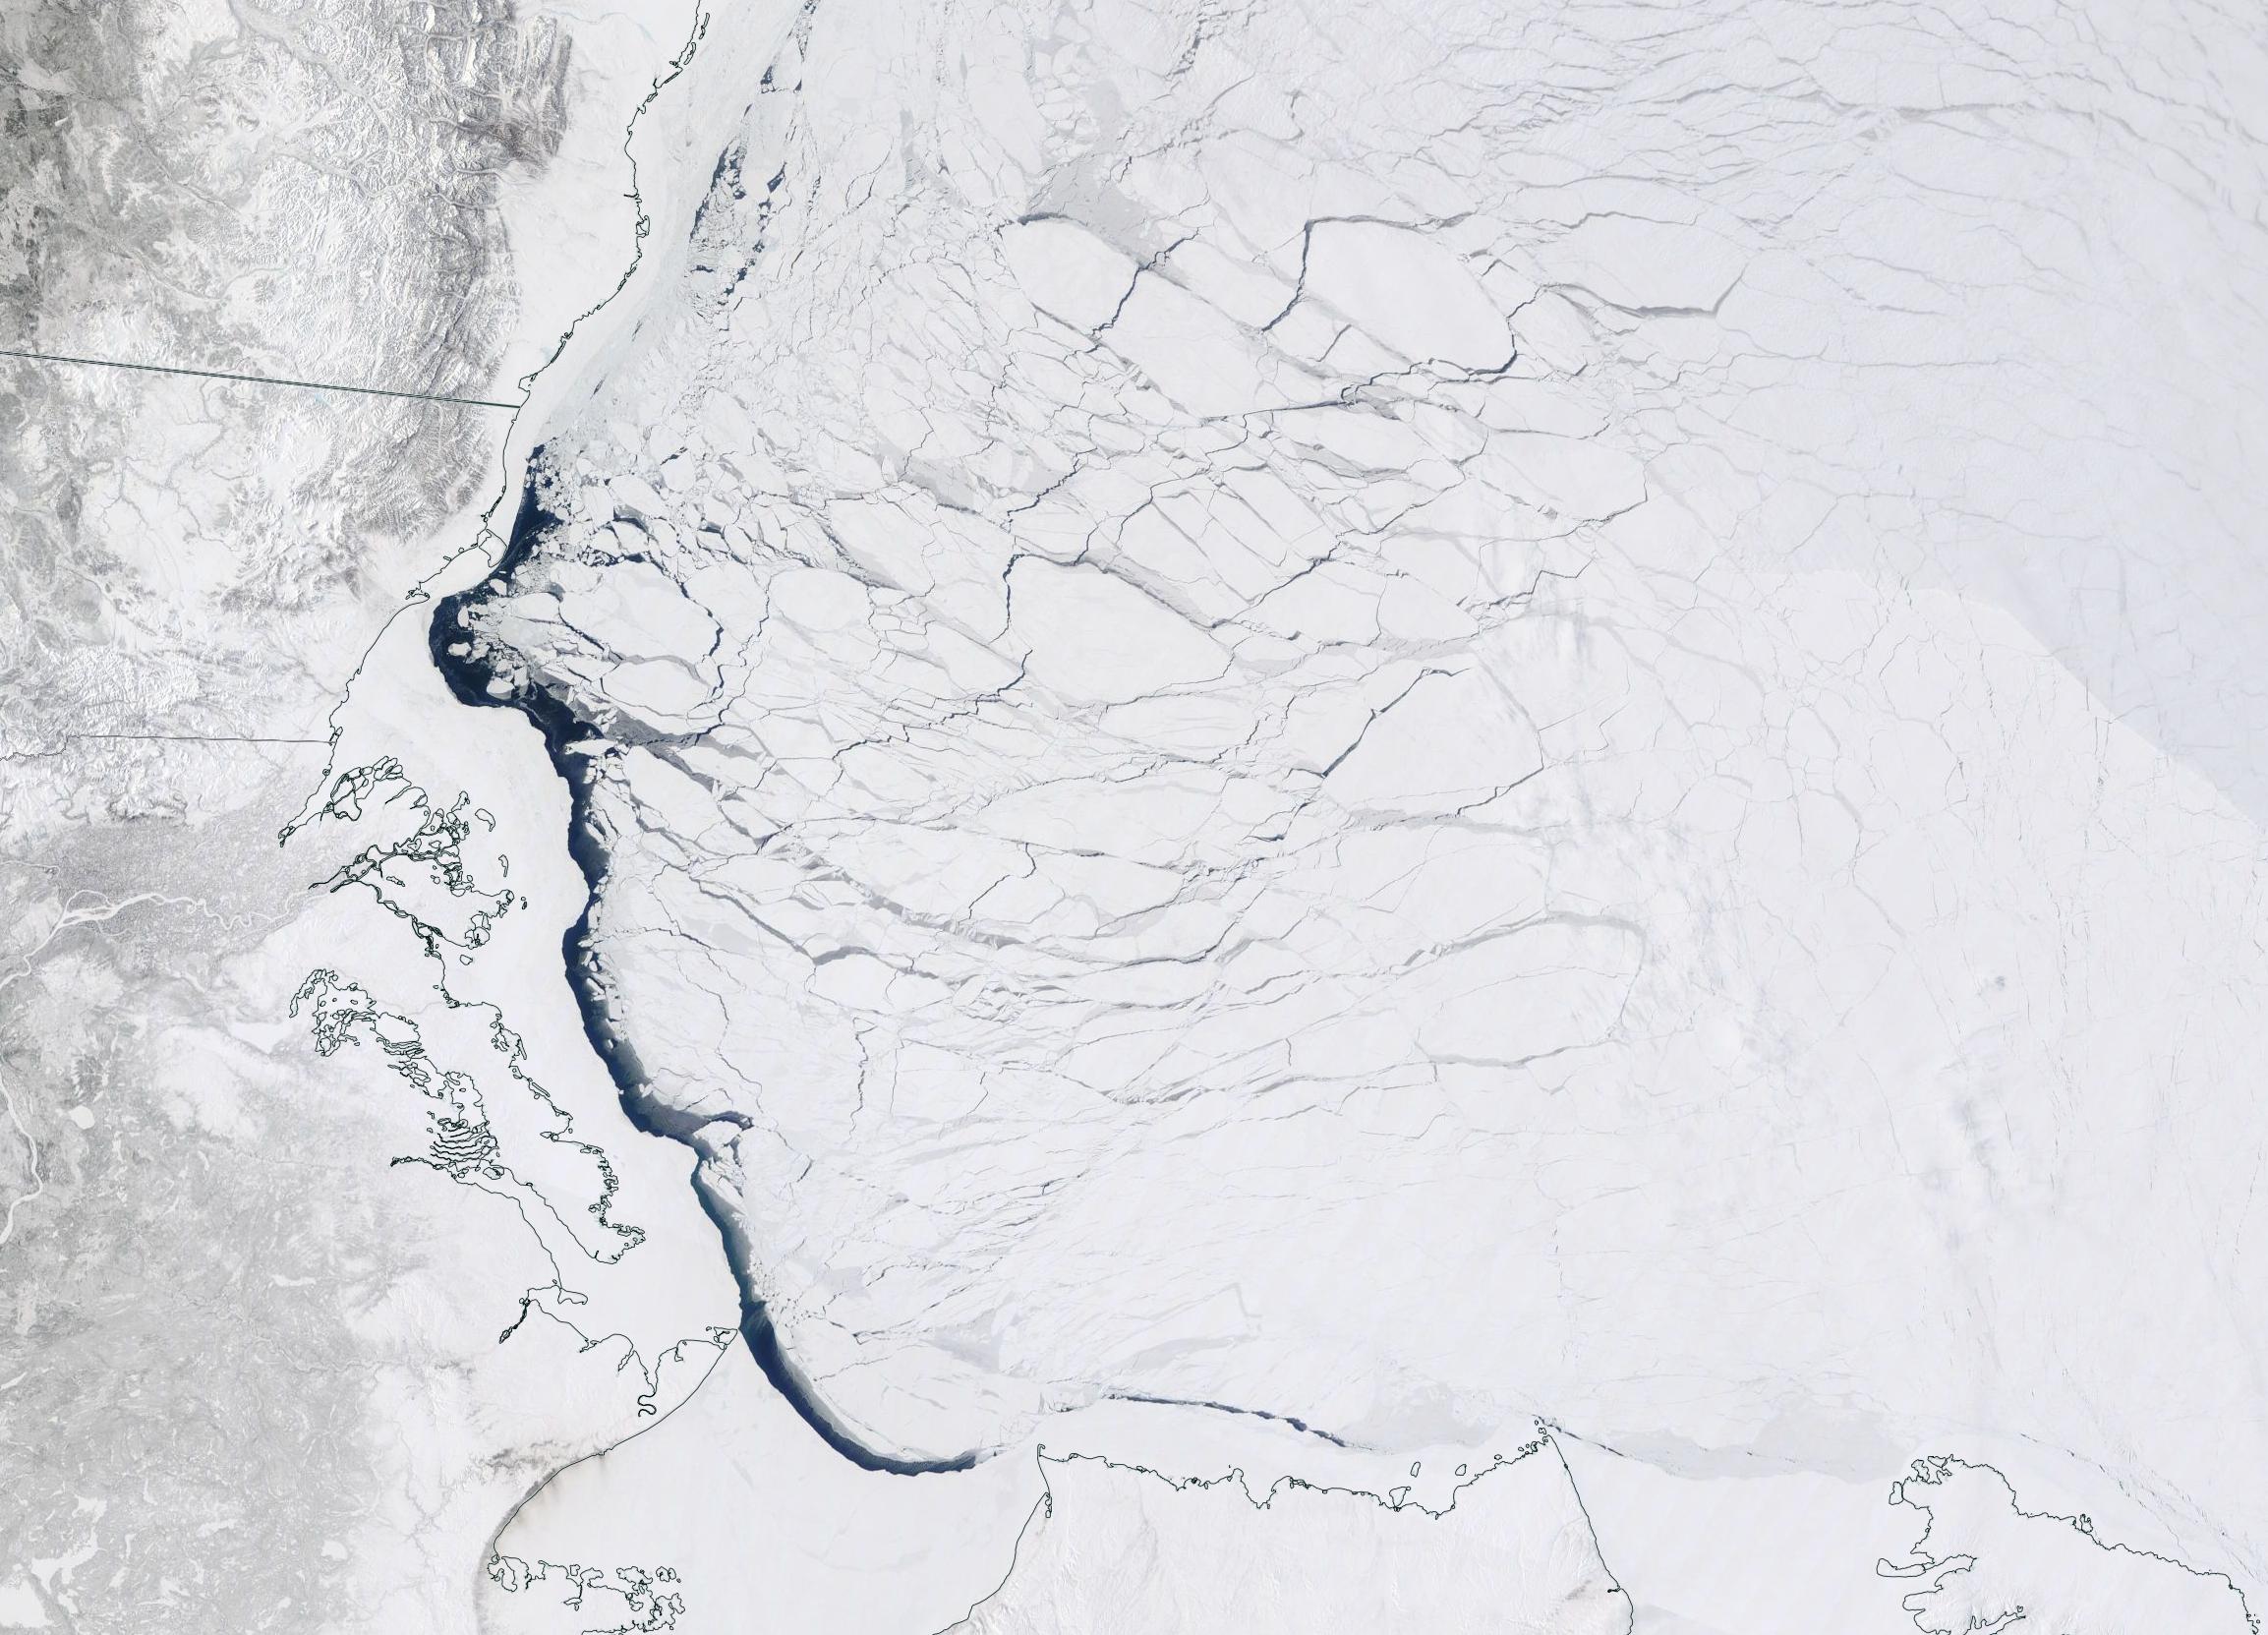
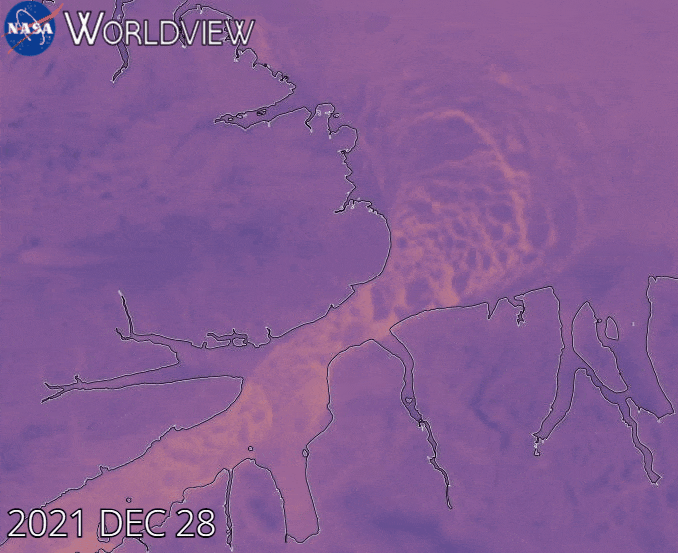
Note that as revealed by this animation from NASA Worldview the sea ice in the Lincoln Sea is currently still breaking up and being exported from the Central Arctic via the Nares Strait:
[Edit – January 25th]
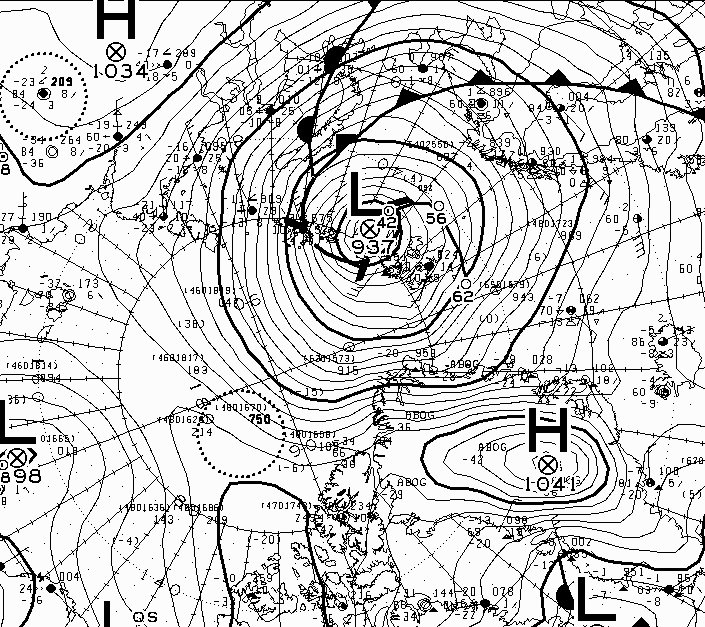
The Atlantic side of the Arctic Ocean has been taking a bit of a battering from what I shall henceforth refer to as the Great Arctic Winter Cyclone of 2022, or GAWC 2022 for short. Unless there’s an even deeper one later in the year of course!
According to the Canadian Meteorological Centre the storm achieved a minimum Mean Sea Level Pressure of 937 hPa at 12 noon UTC yesterday:
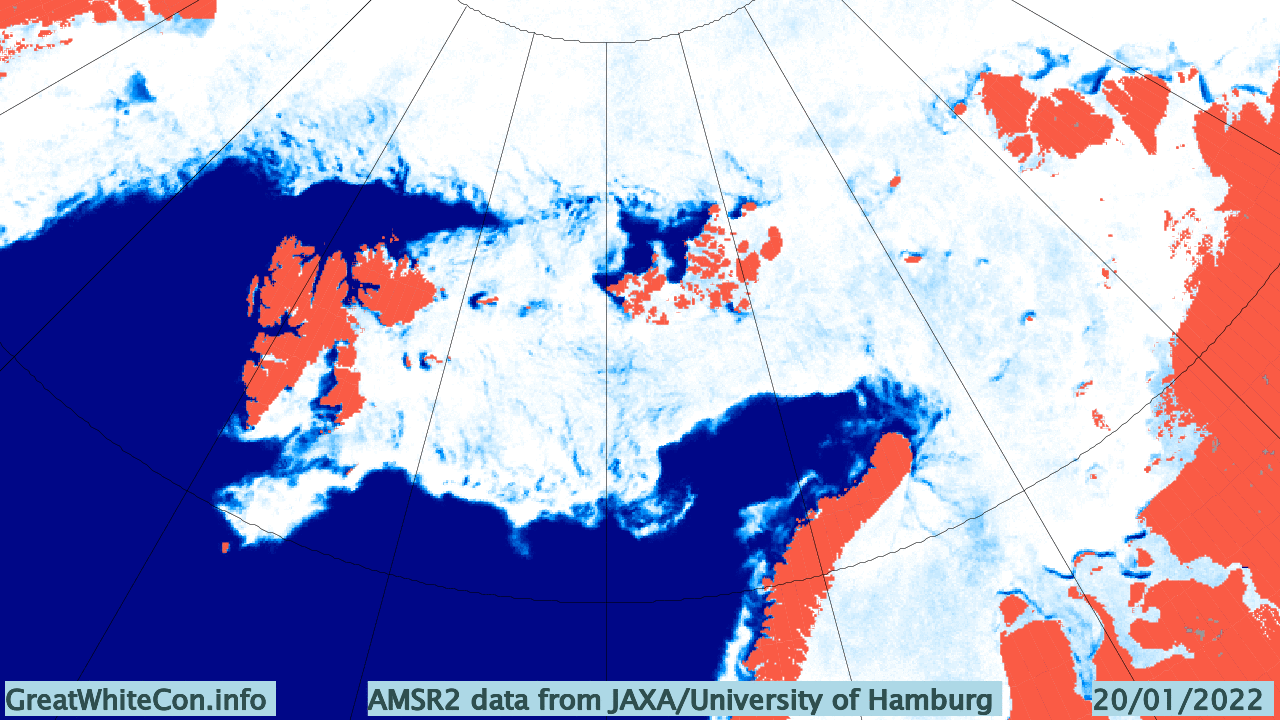
Here are the visible effects of the storm on the sea ice in the area so far, now updated to January 25th:
Watch this space!
This website uses cookies to improve your experience. We'll assume you're ok with this, but you can opt-out if you wish. Cookie settingsACCEPT
Privacy & Cookies Policy
Privacy Overview
This website uses cookies to improve your experience while you navigate through the website. Out of these, the cookies that are categorized as necessary are stored on your browser as they are essential for the working of basic functionalities of the website. We also use third-party cookies that help us analyze and understand how you use this website. These cookies will be stored in your browser only with your consent. You also have the option to opt-out of these cookies. But opting out of some of these cookies may affect your browsing experience.
Necessary cookies are absolutely essential for the website to function properly. This category only includes cookies that ensures basic functionalities and security features of the website. These cookies do not store any personal information.
Any cookies that may not be particularly necessary for the website to function and is used specifically to collect user personal data via analytics, ads, other embedded contents are termed as non-necessary cookies. It is mandatory to procure user consent prior to running these cookies on your website.