Category Archives: News

Facts About the Arctic in July 2020

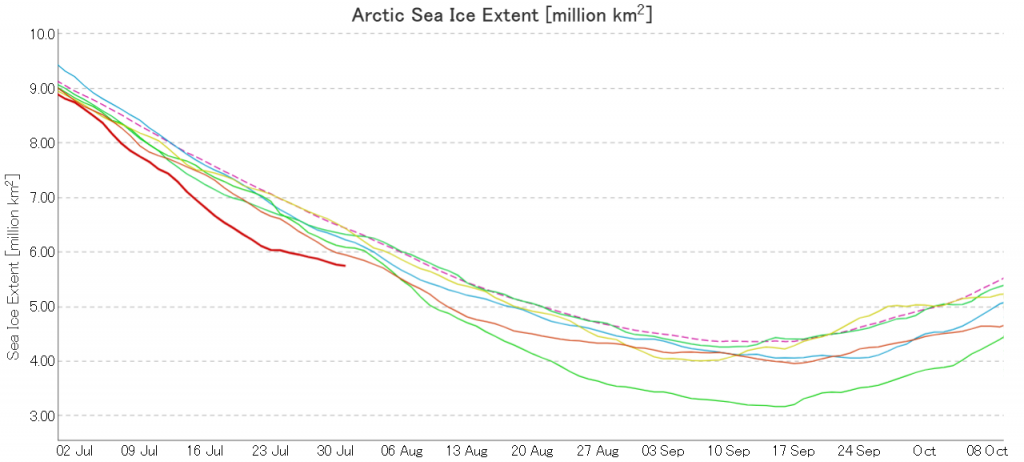
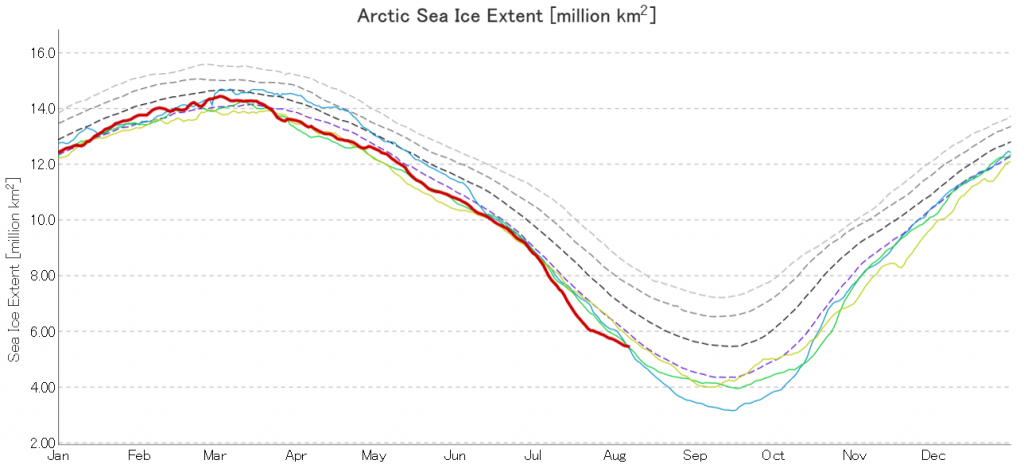
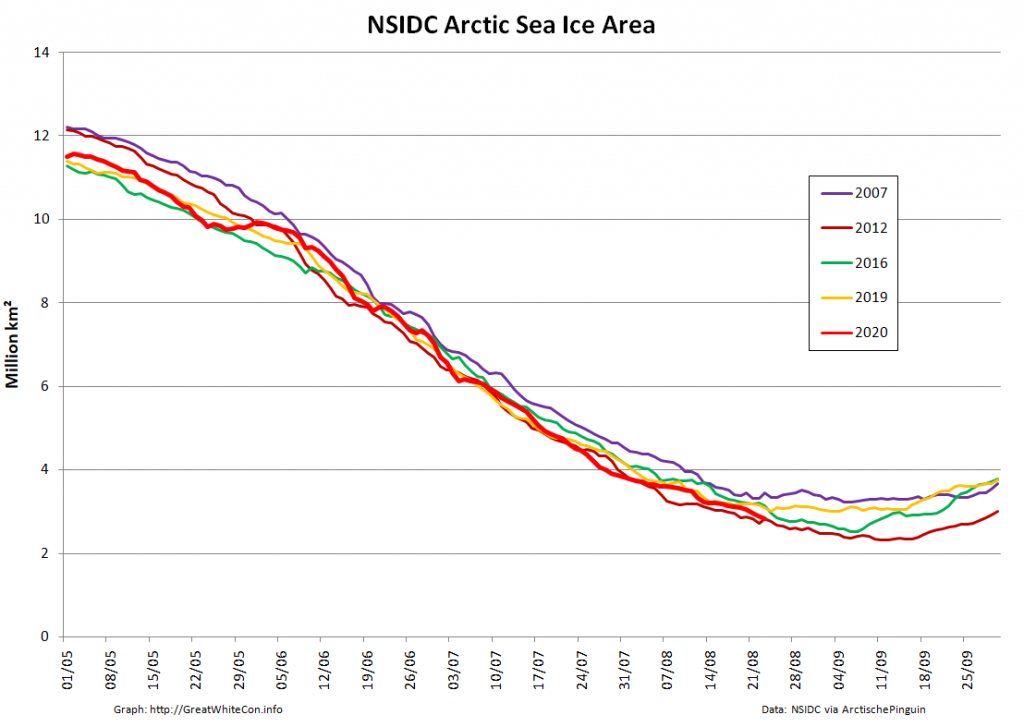
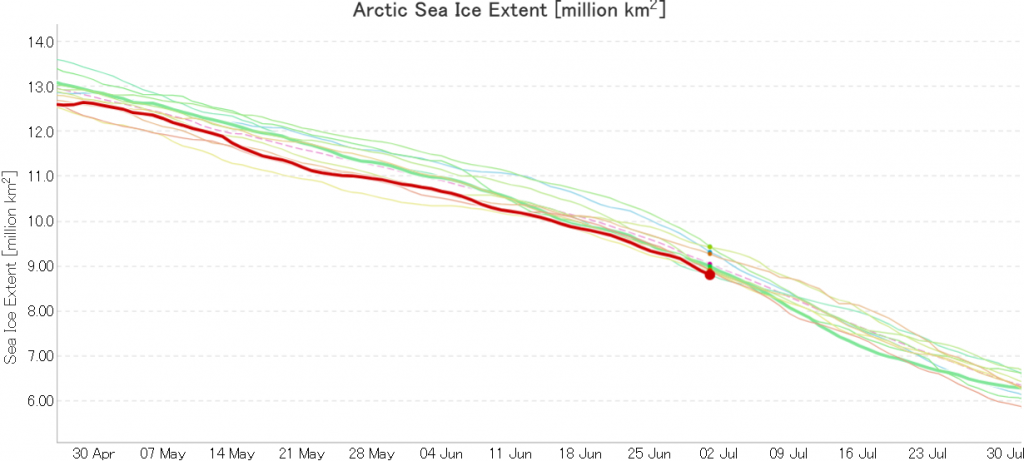
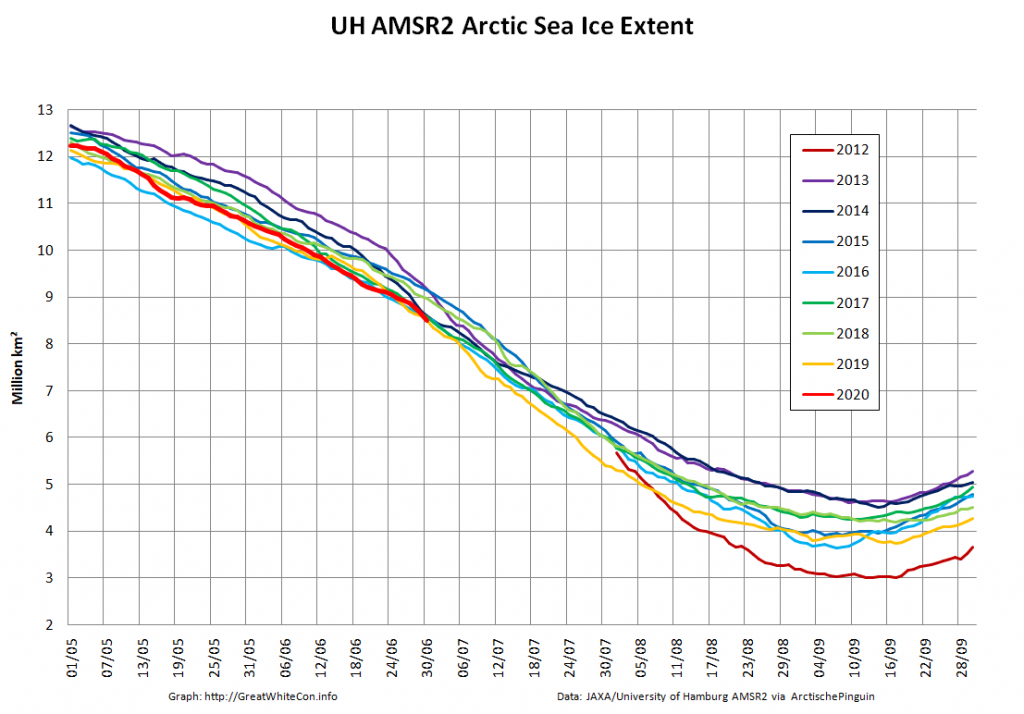
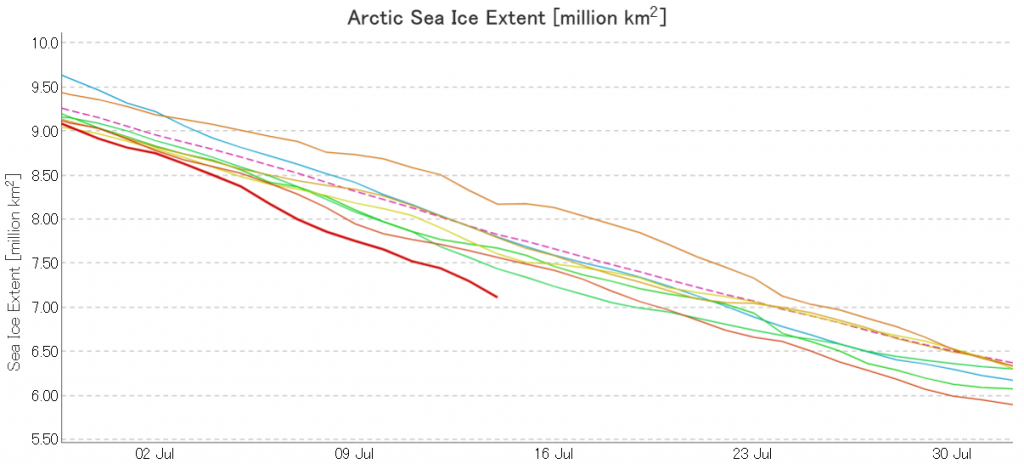
The new month starts with JAXA extent “lowest for the date in the satellite record” by a whisker:

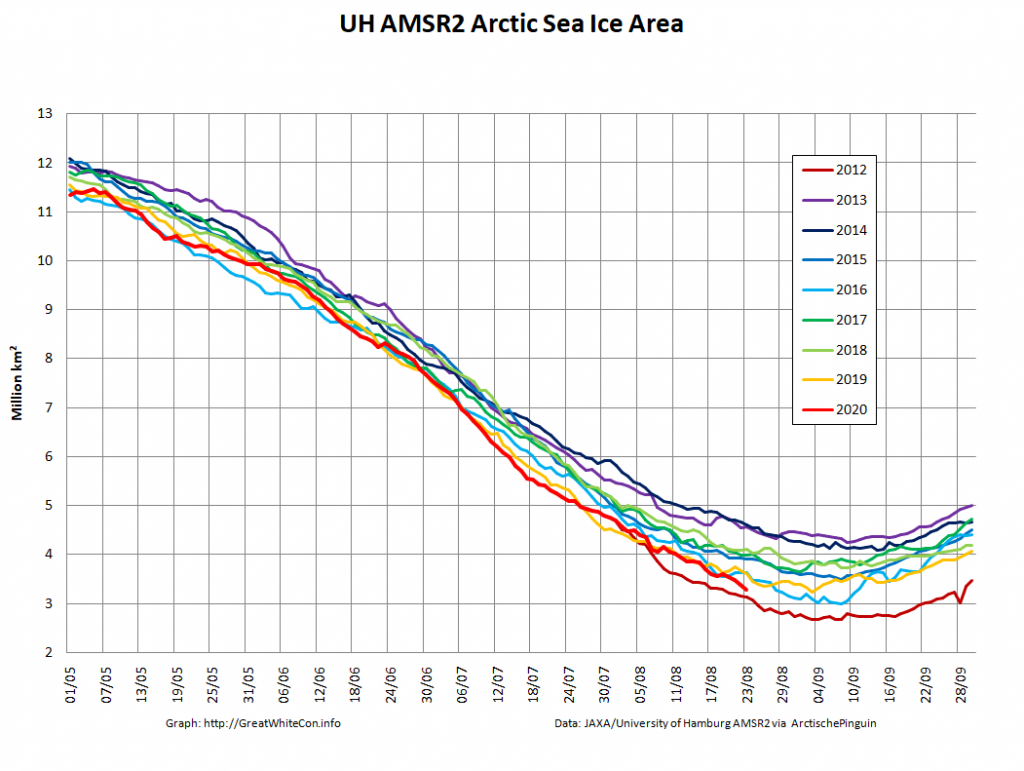
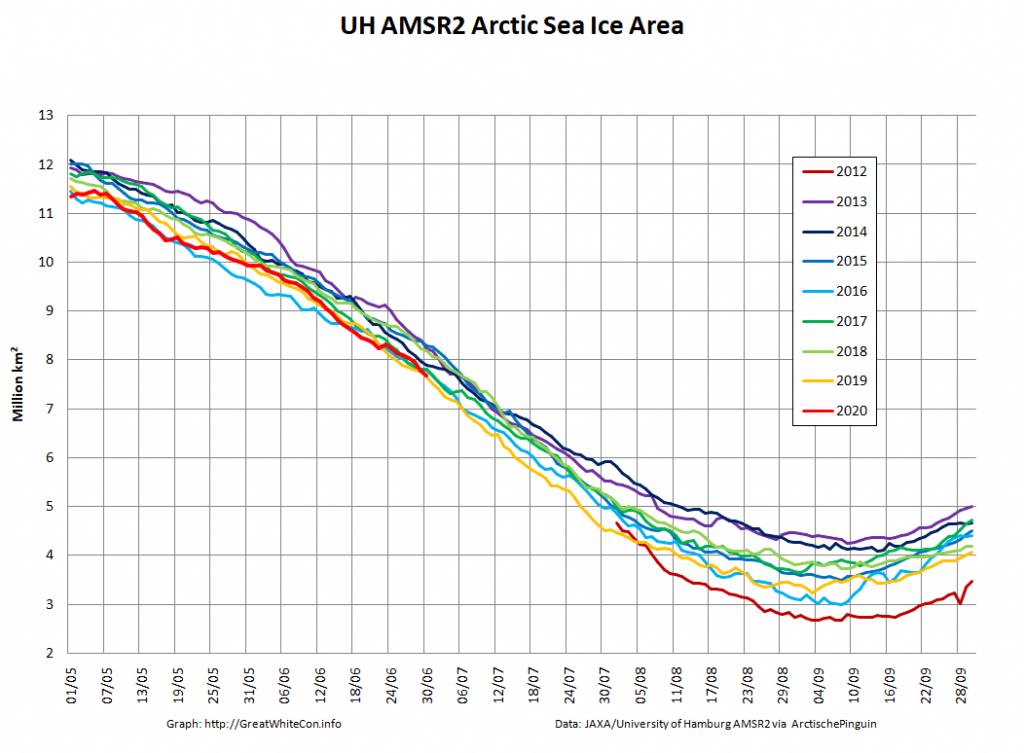
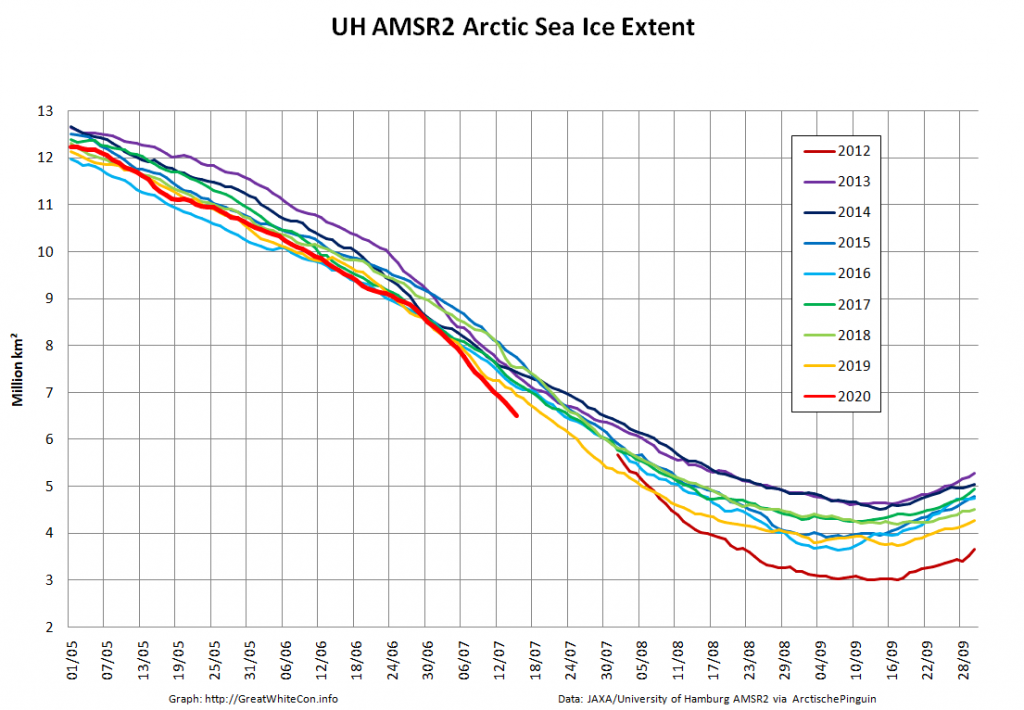
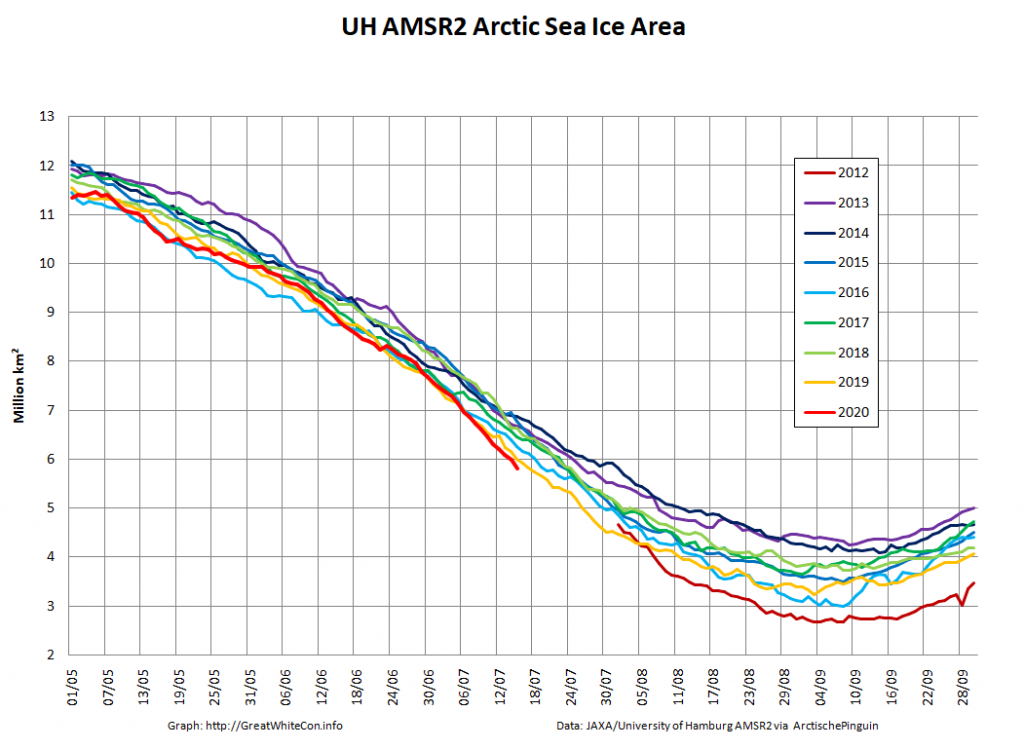
The high resolution Arctic sea ice area and extent graphs based on the University of Hamburg’s AMSR2 concentration data are also in “statistical ties” for that honour, in records going back to 2013:

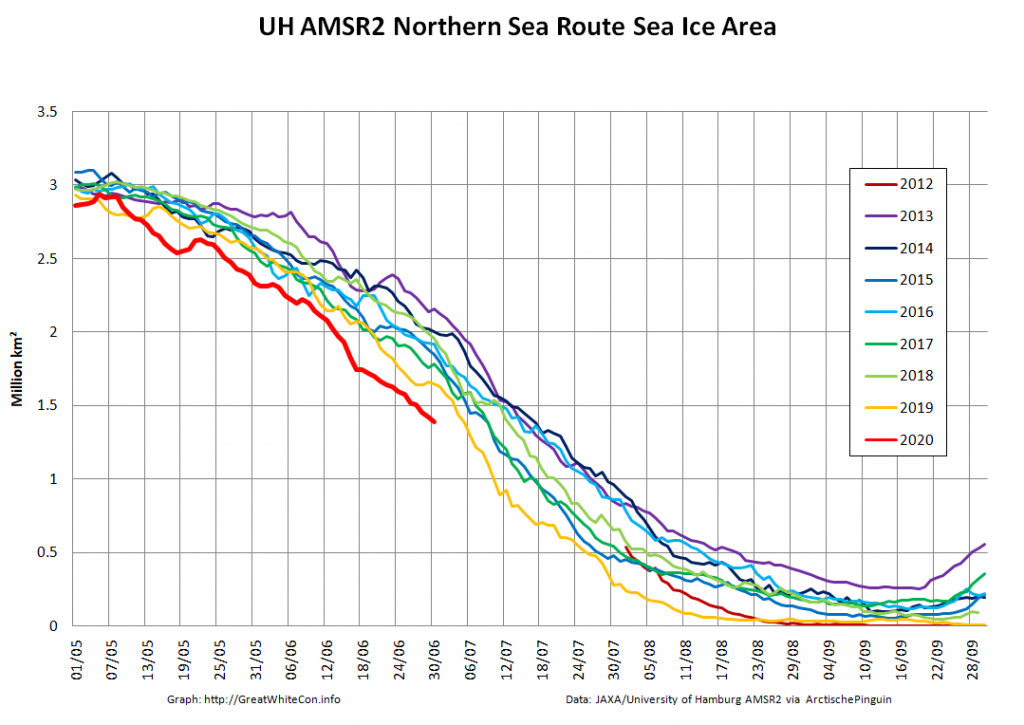
The 2020 melting season currently seems to be a game of two (geographical) halves. The sea ice on the Siberian side of the Arctic is currently at record lows:

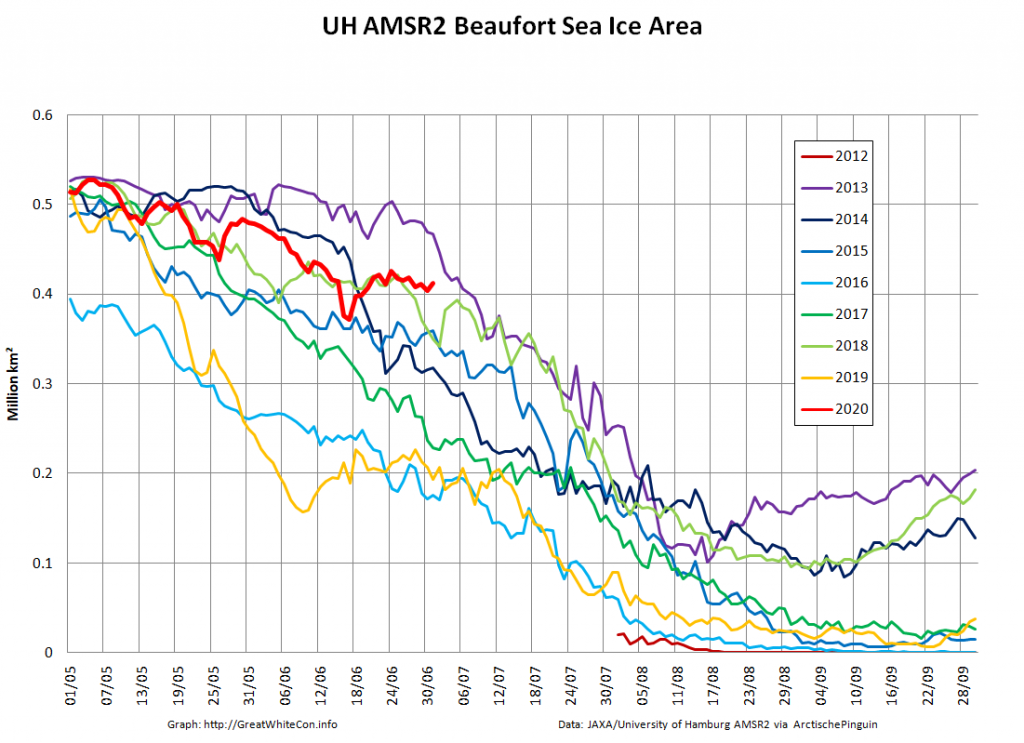
Whereas the Beaufort Sea is near a record high:

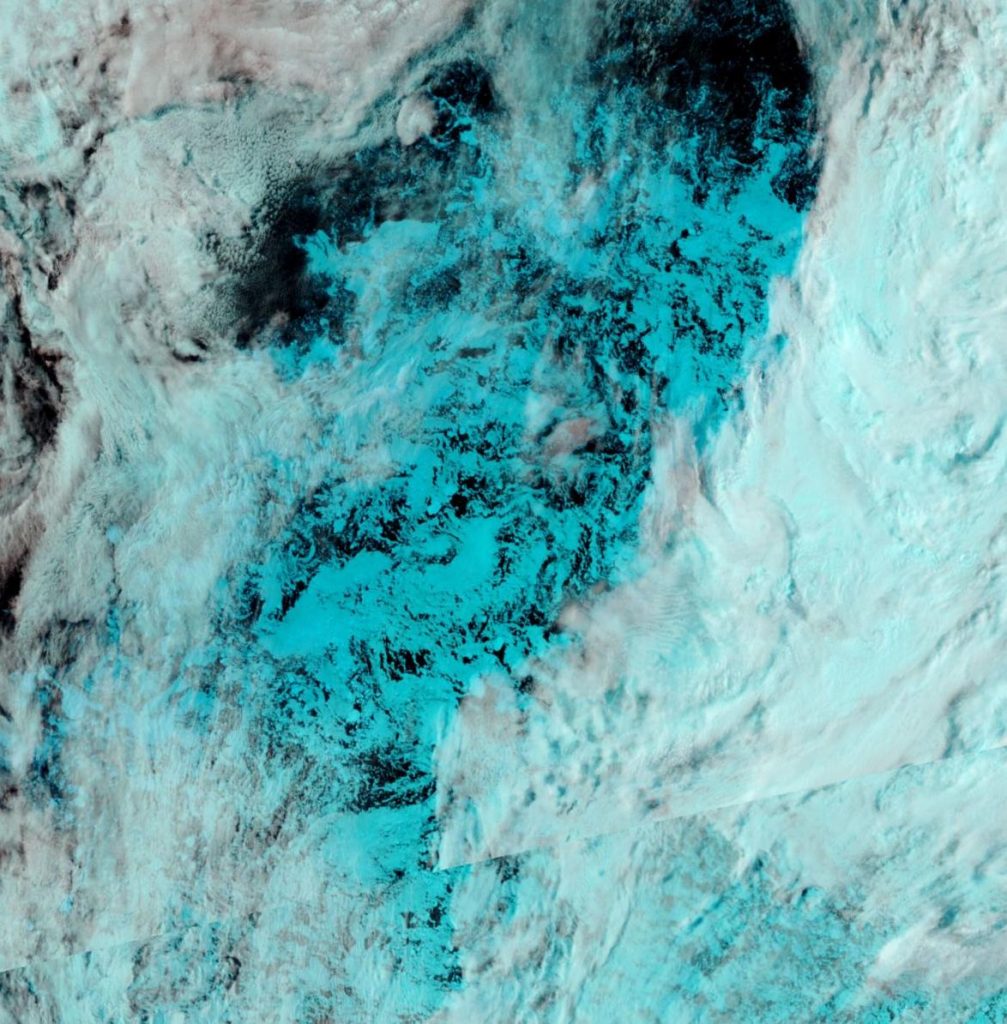
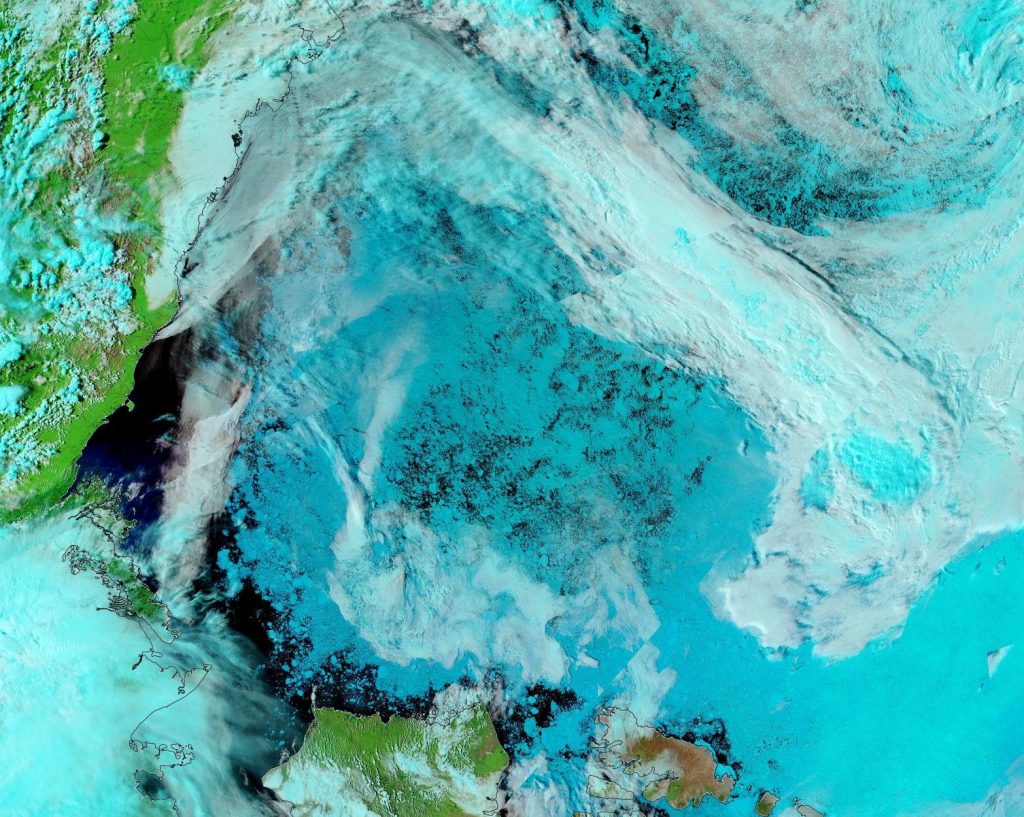
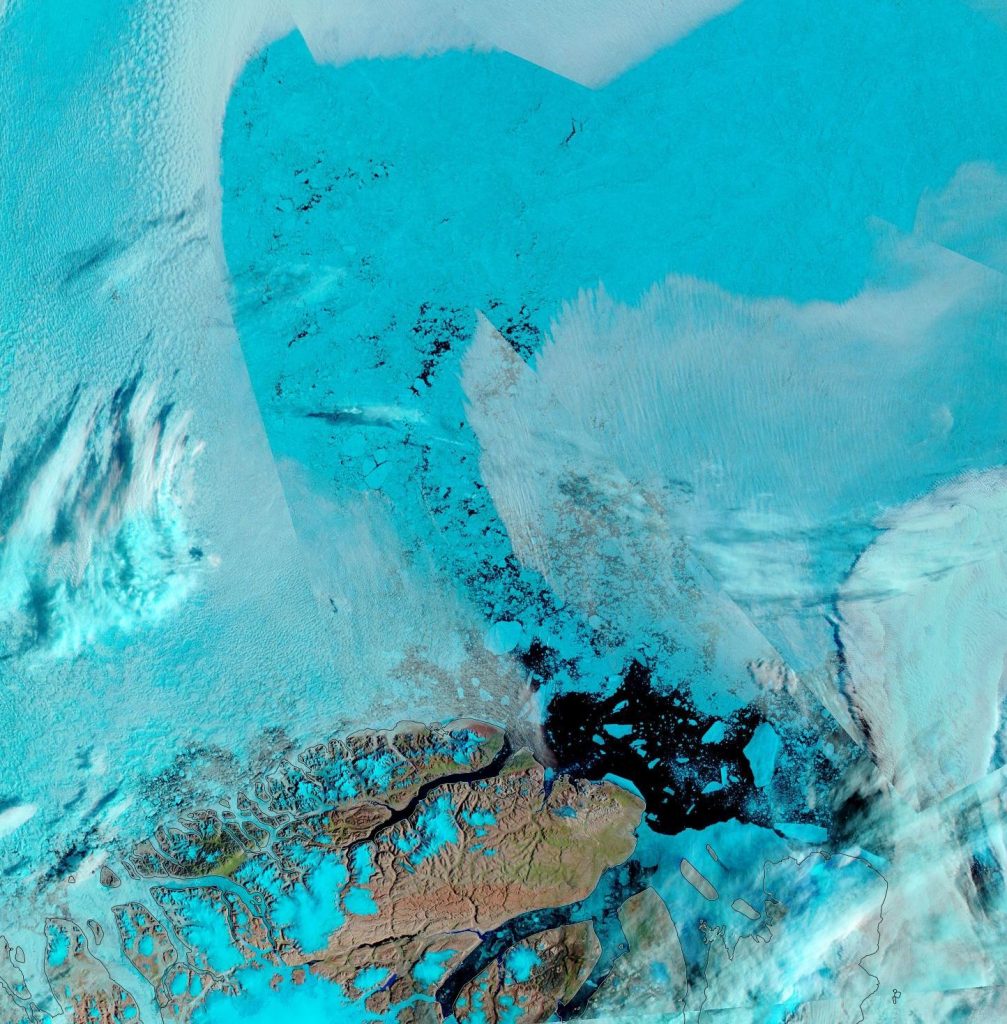
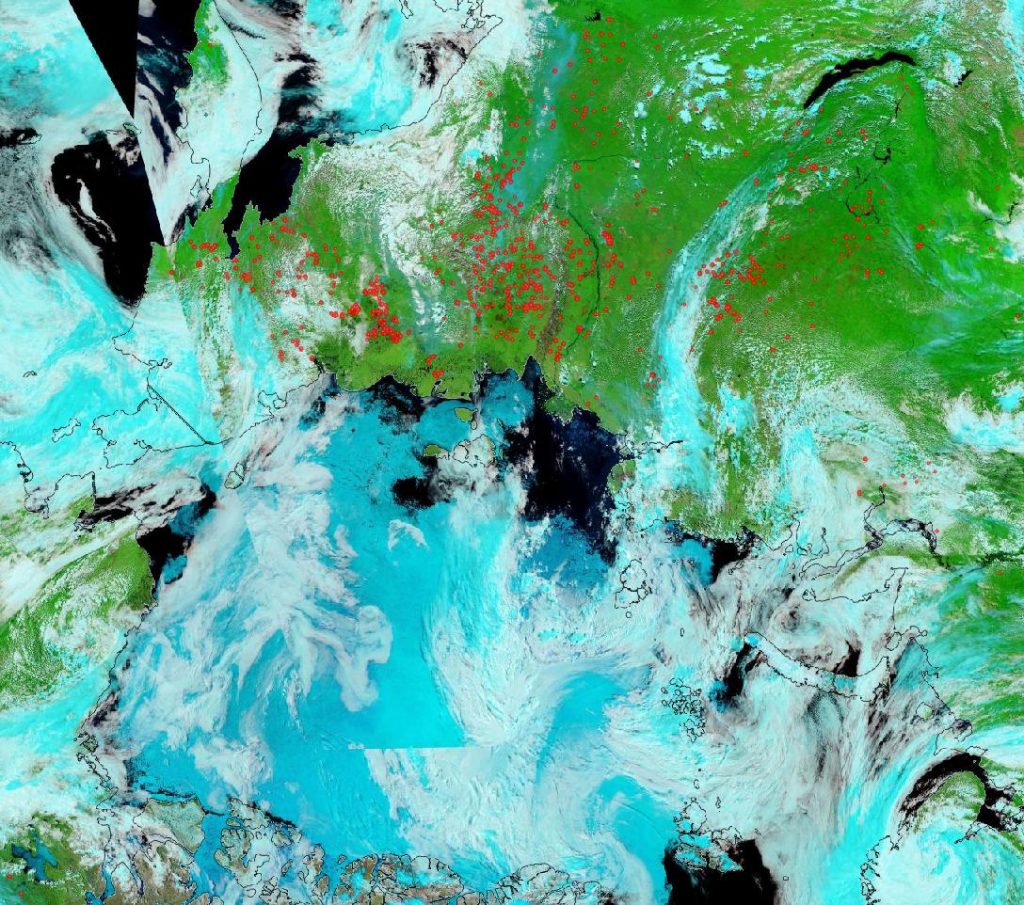
Currently the tell tale signs of surface melt are visible across most of the central Arctic, as are the large number of wildfires across Arctic Siberia:

NASA Worldview “false-color” image of the Arctic on July 1st 2020, derived from the MODIS sensor on the Terra satellite

[Edit – July 4th]

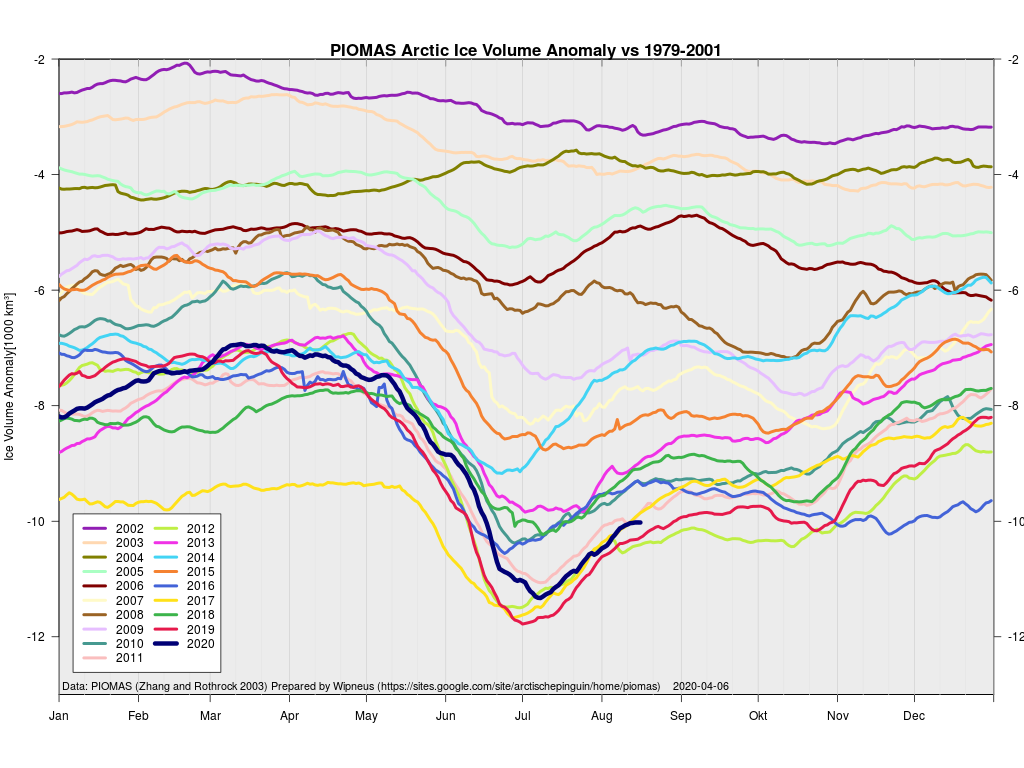
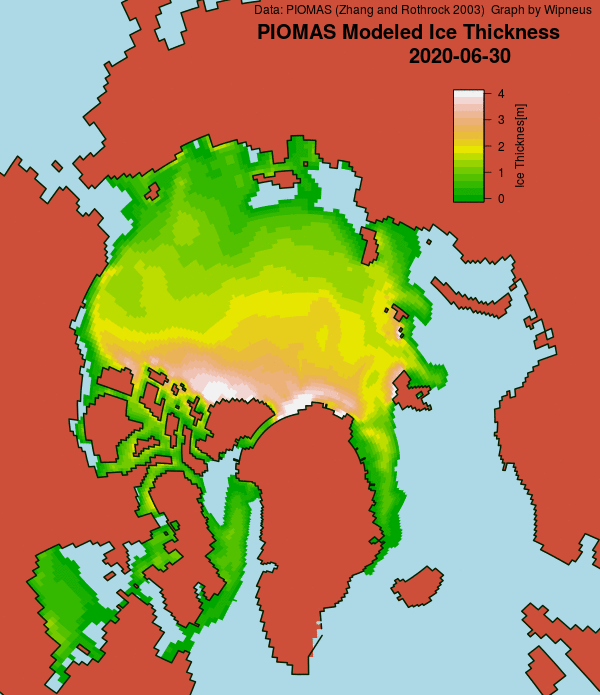
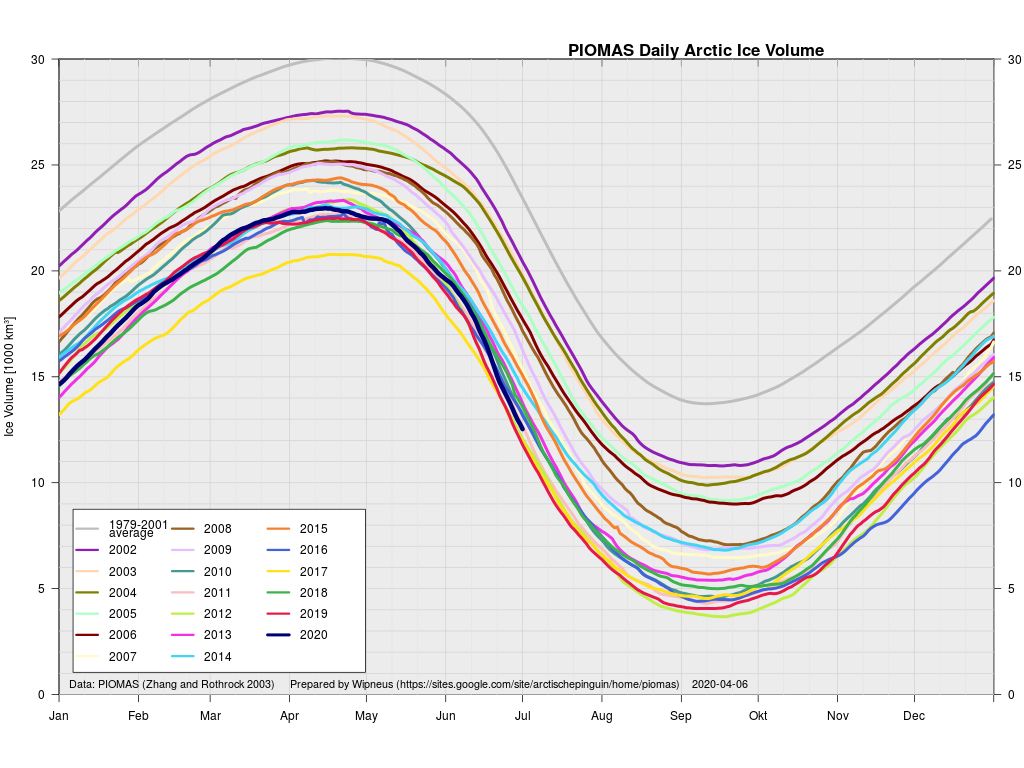
The June 30th PIOMAS gridded thickness numbers have been released, and here are the results of Wipneus’s number crunching:

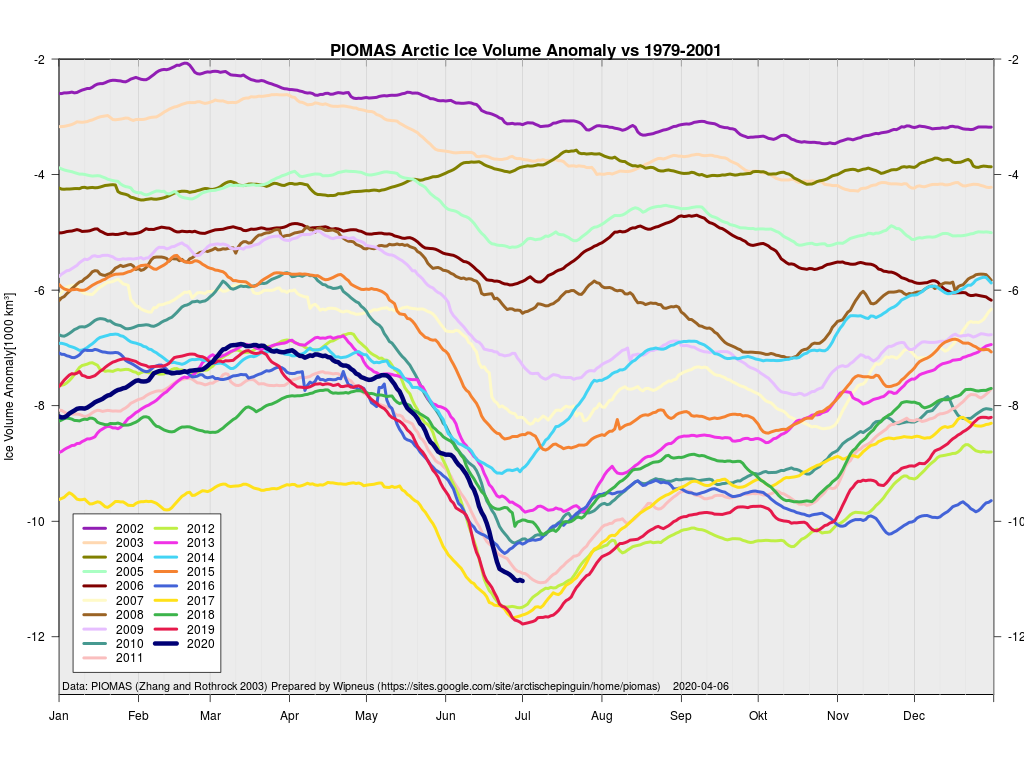
This month including a visualisation of the increasing negative anomaly:

[Edit – July 6th]

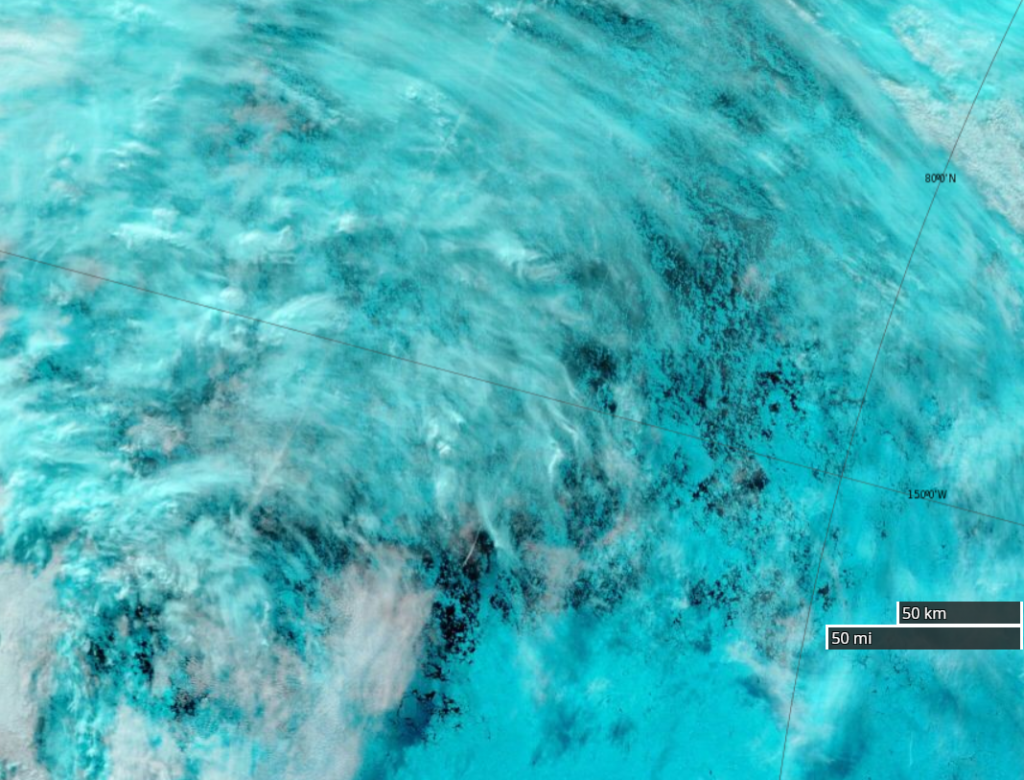
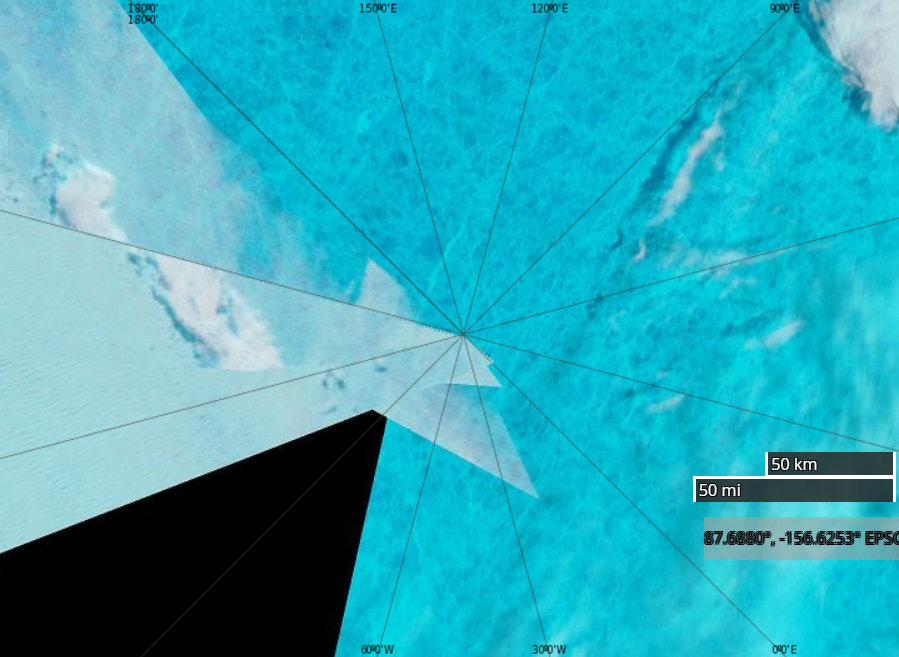
A break in the clouds over the North Pole reveals the onset of surface melt:

NASA Worldview “false-color” image of the North Pole on July 6th 2020, derived from the MODIS sensor on the Terra satellite

[Edit – July 8th]

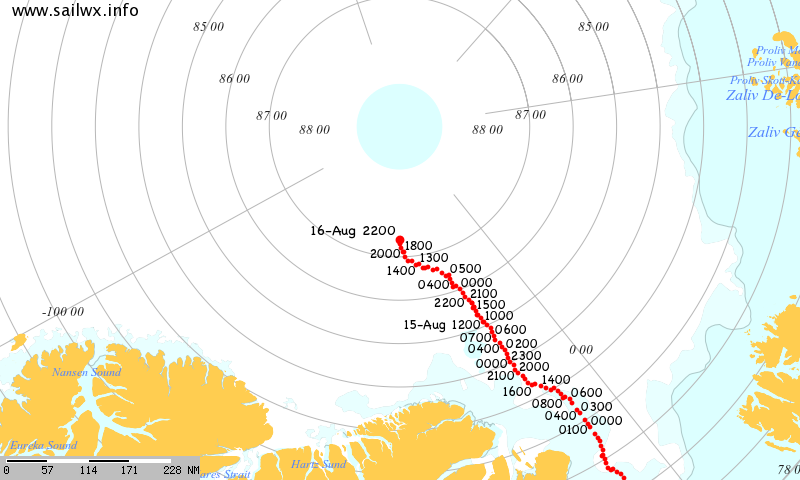
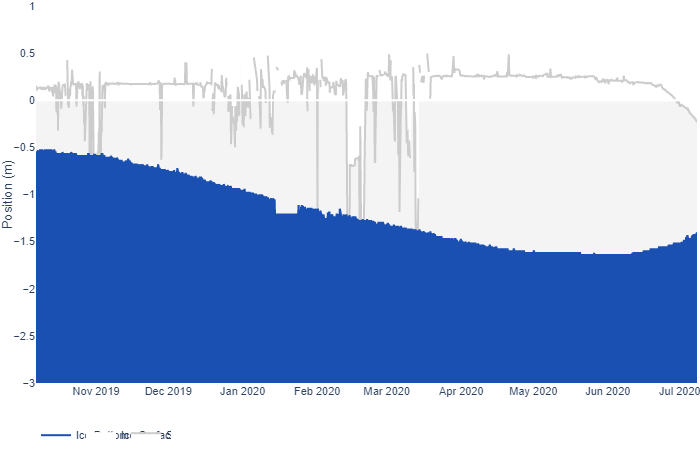
After a brief hiatus there are once again some ice mass balance buoys installed at assorted locations across the Arctic. Some have ceased to function, but one of the buoys installed as part of the MOSAiC expedition is still sending back data as it heads towards the Fram Strait. Buoy 387850 is currently located at 81.66 N, 4.19 E. Here’s its ice mass balance plot:

As you can see, both surface and bottom melt are well under way, with just over a meter of ice still remaining.

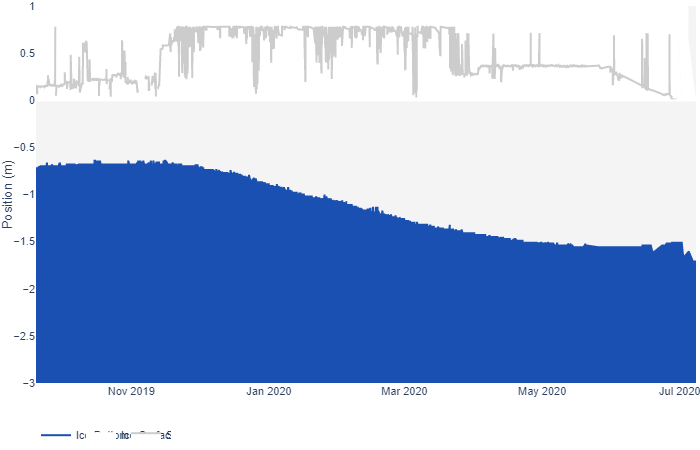
Now let’s take a look at buoy 386840, currently located at 74.30 N, 132.60 W in the Beaufort Sea:

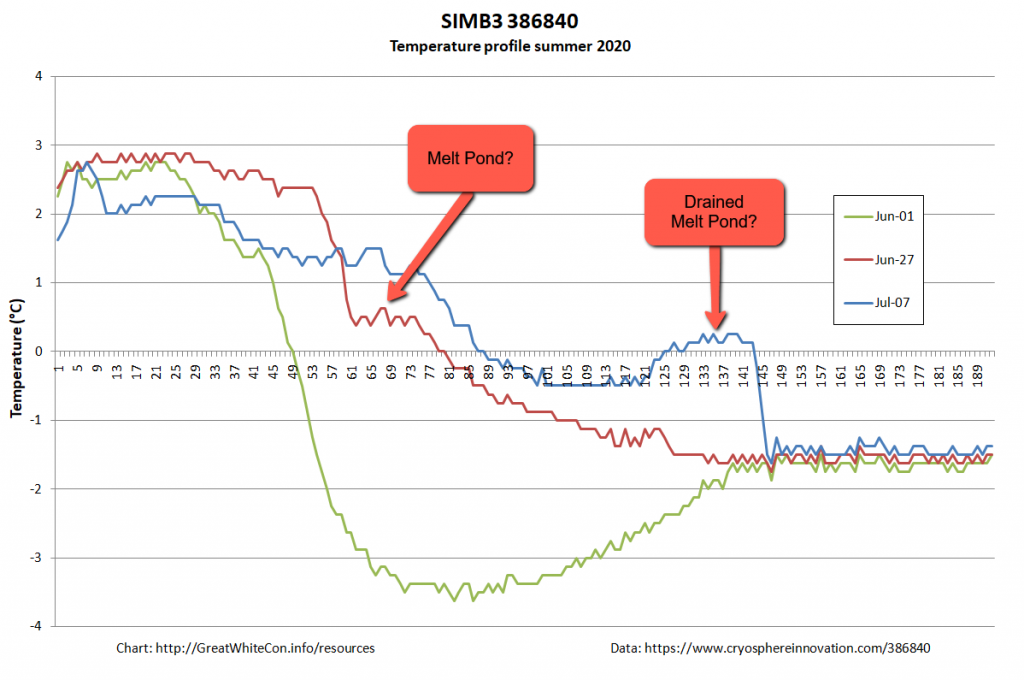
It looks as though the ice thickness has increased, but surely that can’t be right at this time of year? To try and find out I downloaded the raw data and plotted the temperature readings from the buoy’s thermistor string:

It looks to me as though the ice floe carrying the buoy is currently floating on some warm fresh water from a recently drained melt pond, which is confusing the sensor designed to measure the position of the bottom of the ice. There certainly seems to be far less than the claimed “1.653 m snow and ice thickness” still remaining to be melted!
[Edit – July 15th]

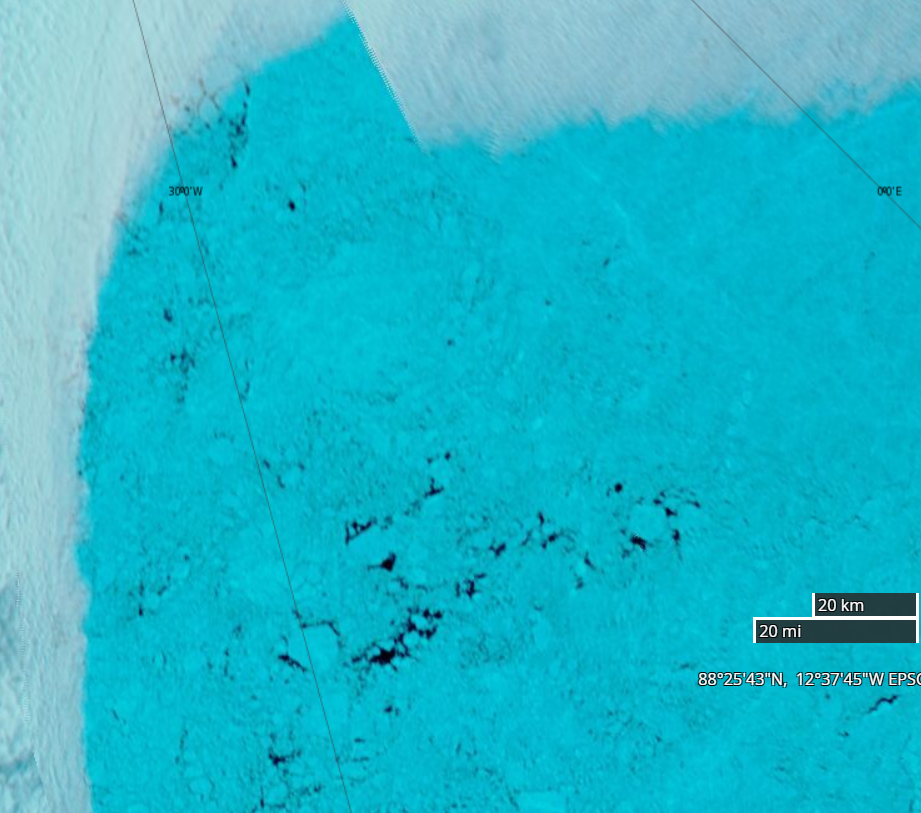
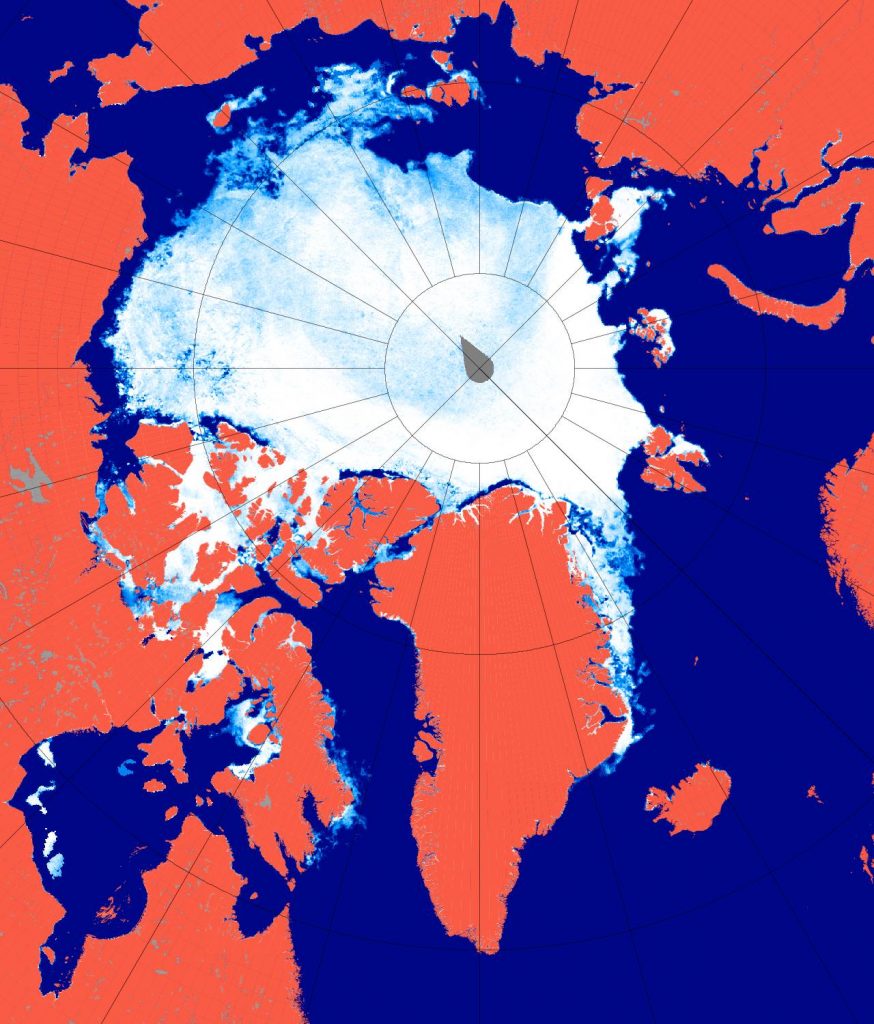
A very unusual image. Hardly a cloud in the sky over the North Pole yesterday:

NASA Worldview “false-color” image of the North Pole on July 14th 2020, derived from the MODIS sensor on the Terra satellite

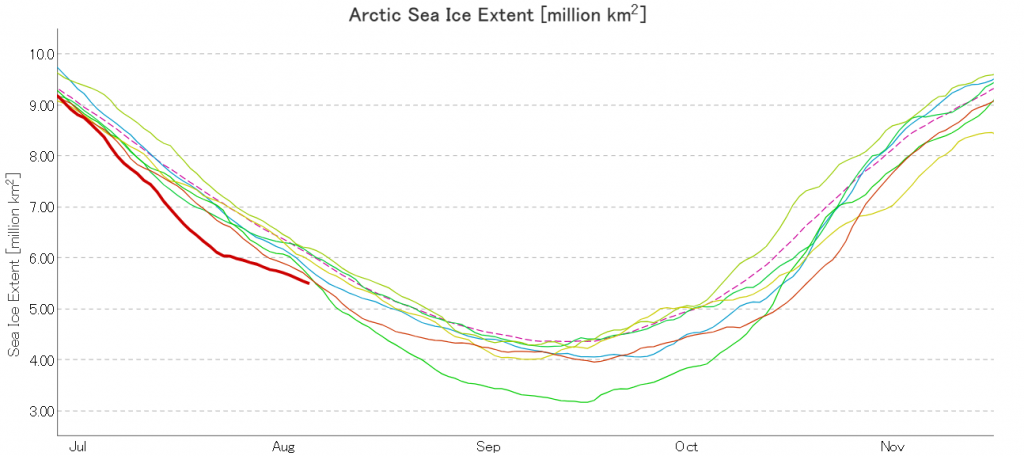
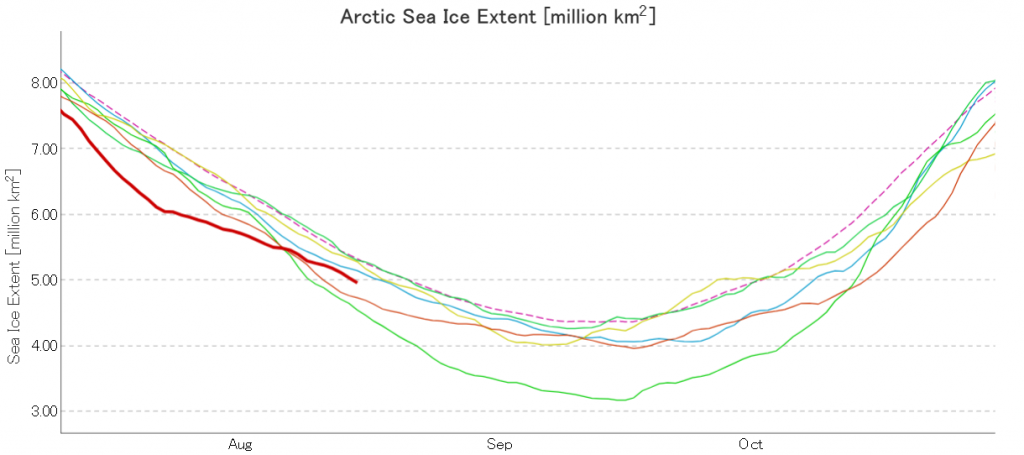
The July 2020 extent “plummet” shows no signs of ending just yet. Here’s the JAXA/ViSHOP version:

[Edit – July 17th]

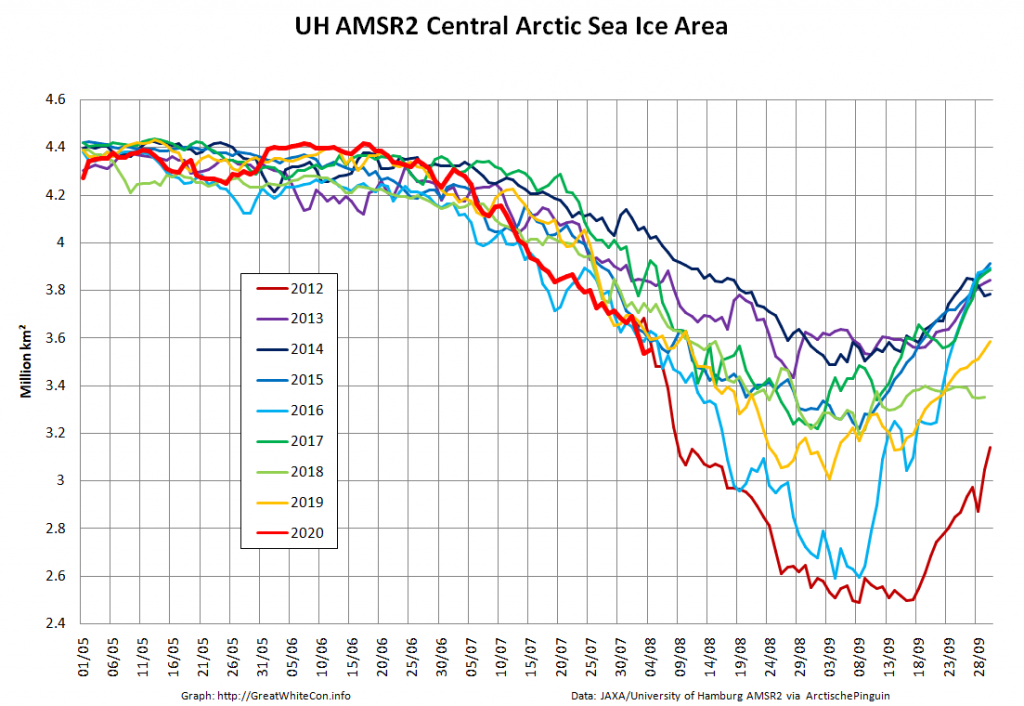
JAXA AMSR2 extent is now below 7 million km², and the high resolution version is lower still:

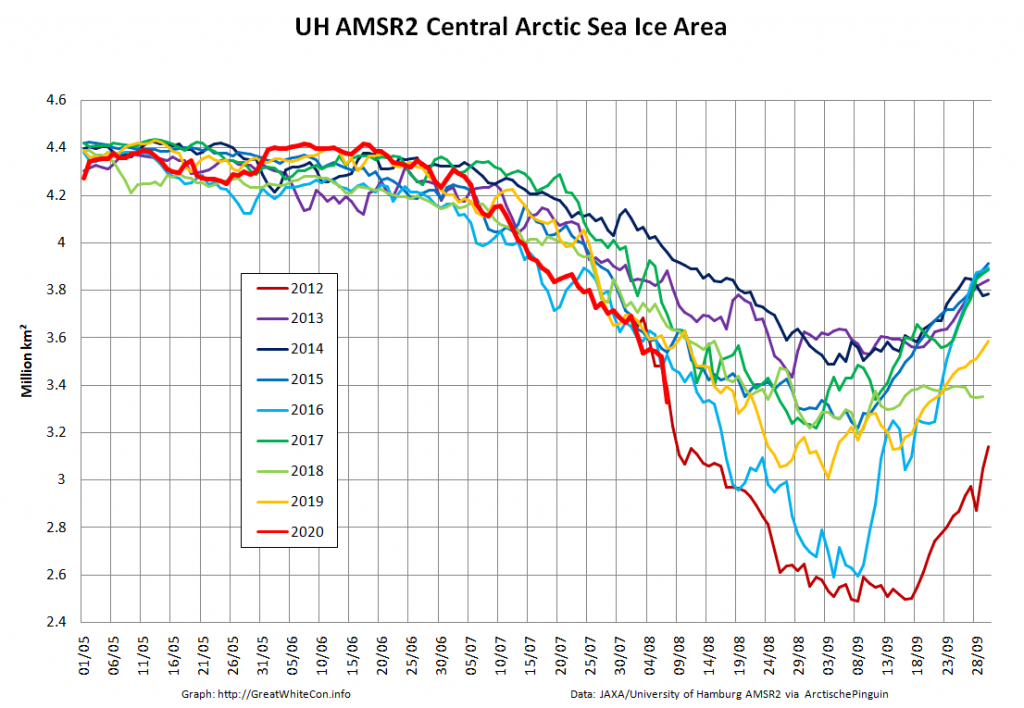
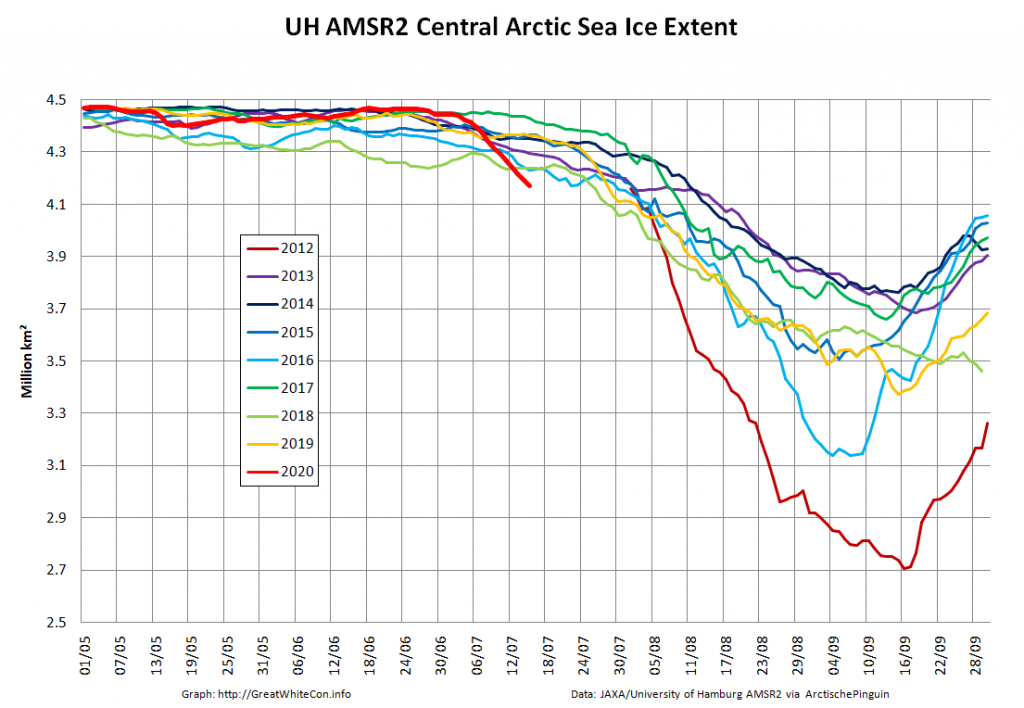
As the “Laptev Bite” and the Atlantic periphery of open water extends further towards the North Pole, Central Arctic Basin extent is now also at record lows for the date in the AMSR2 record:

[Edit – July 19th]

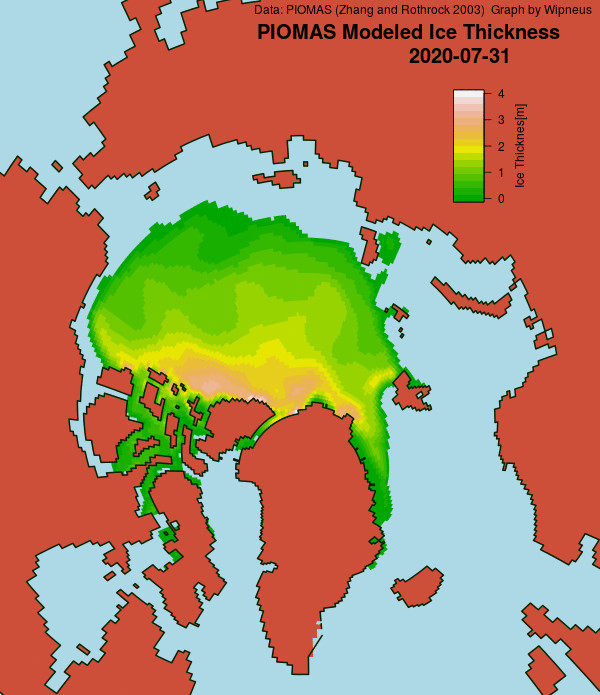
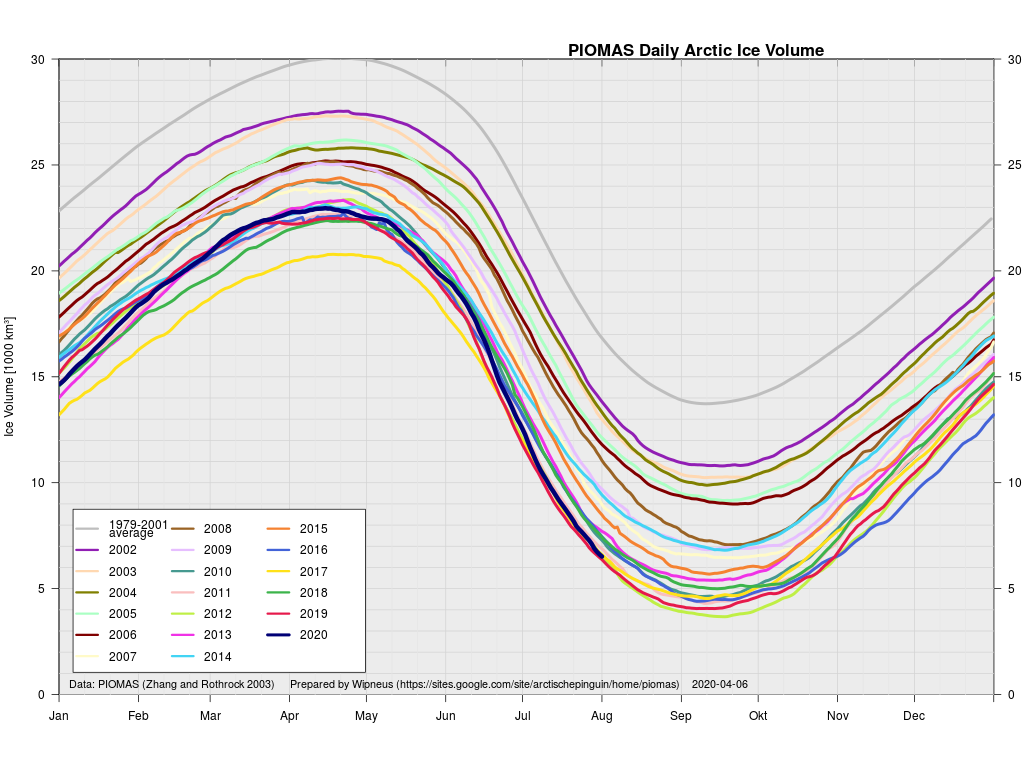
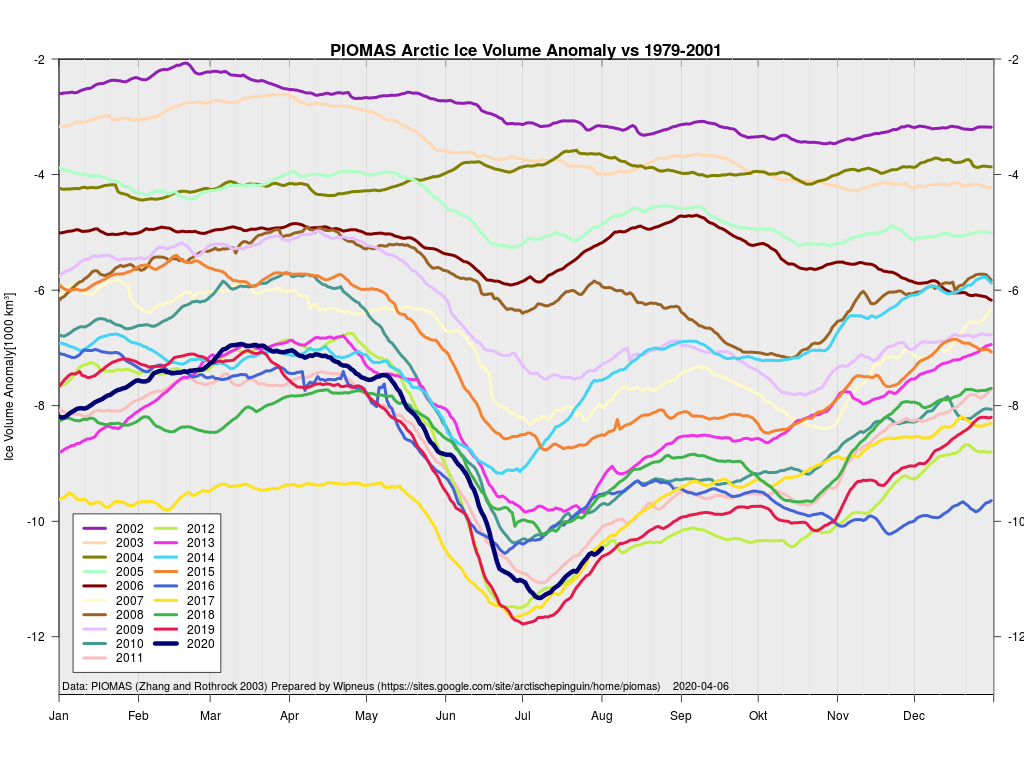
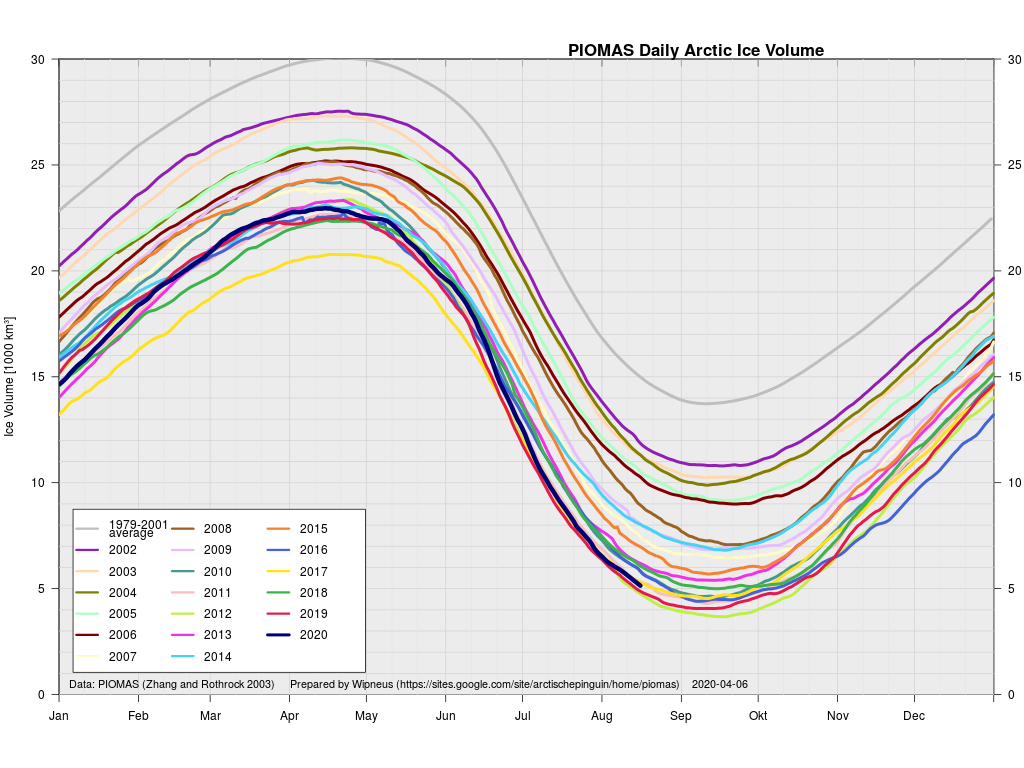
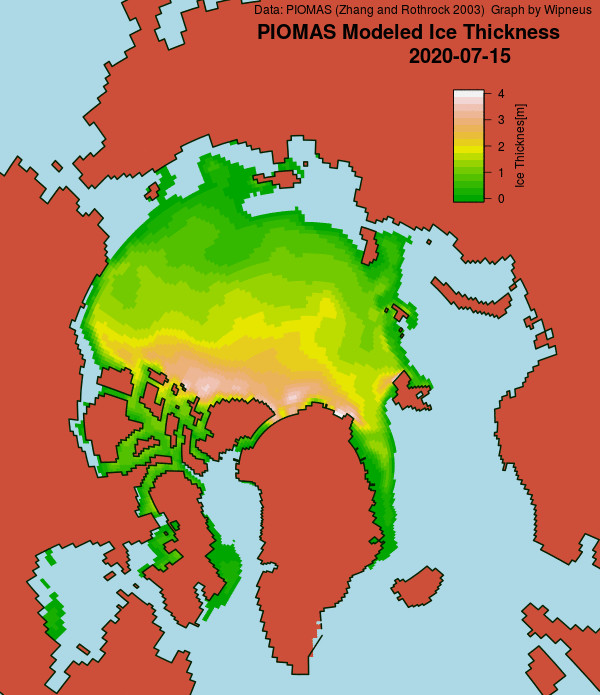
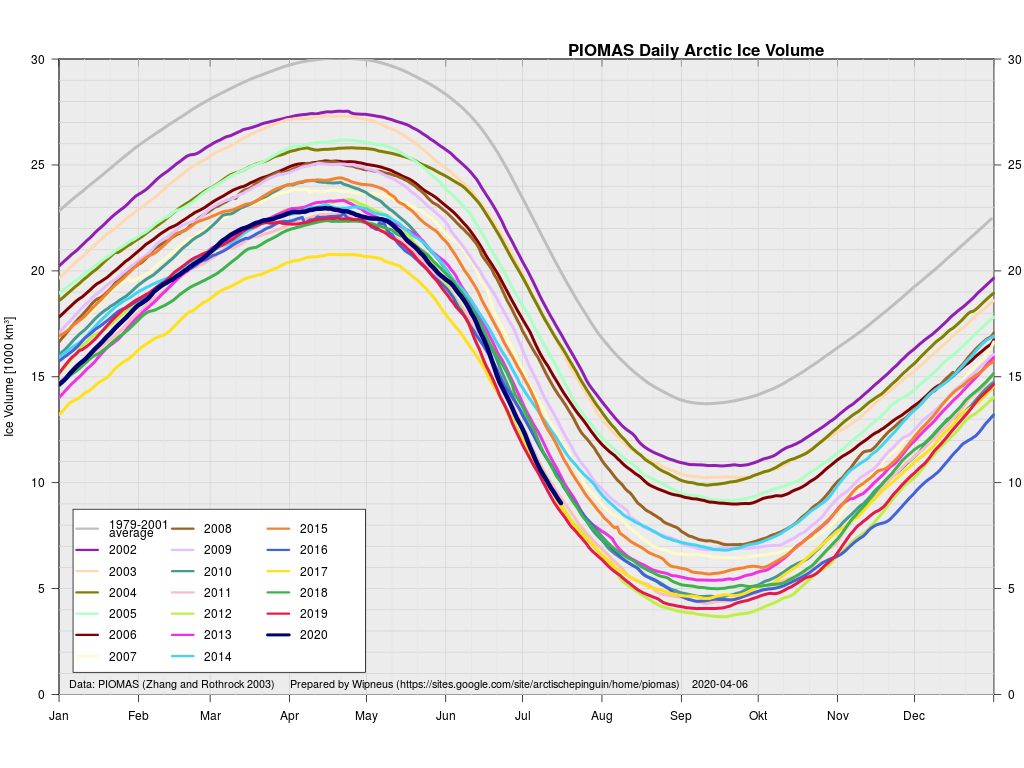
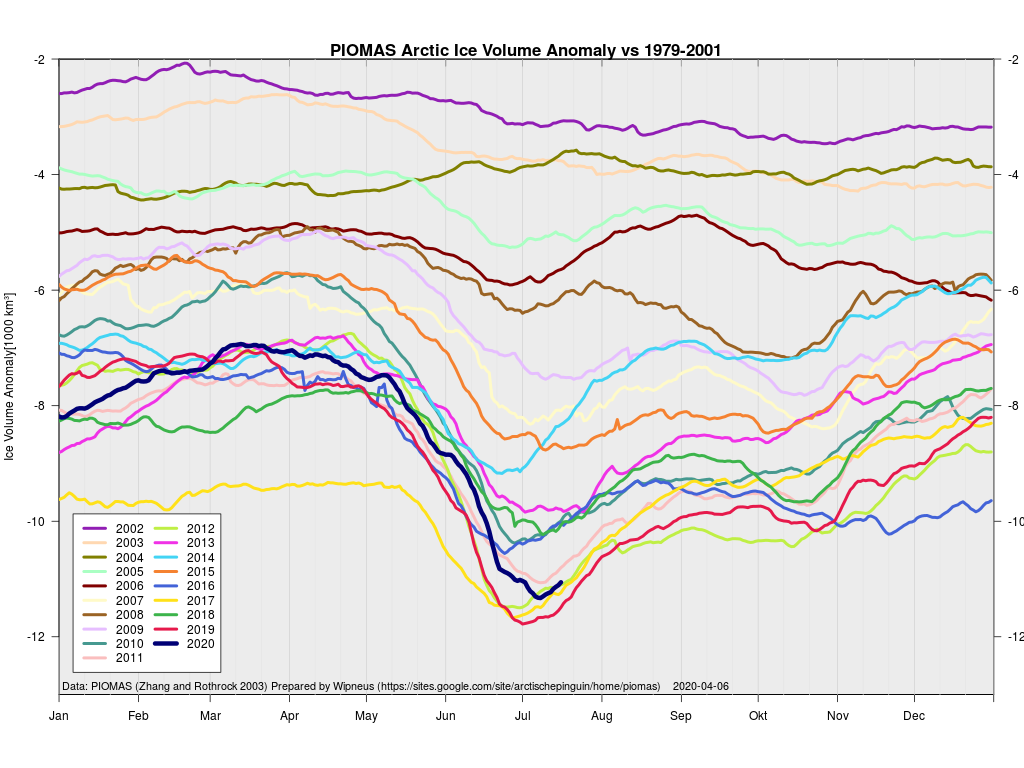
Wipneus has crunched the mid month PIOMAS gridded thickness numbers, and here are the results:

Extent is currently lowest in the satellite era by a long way, but modelled volume is only fourth lowest!

Watch this space!

[Edit – July 21th]

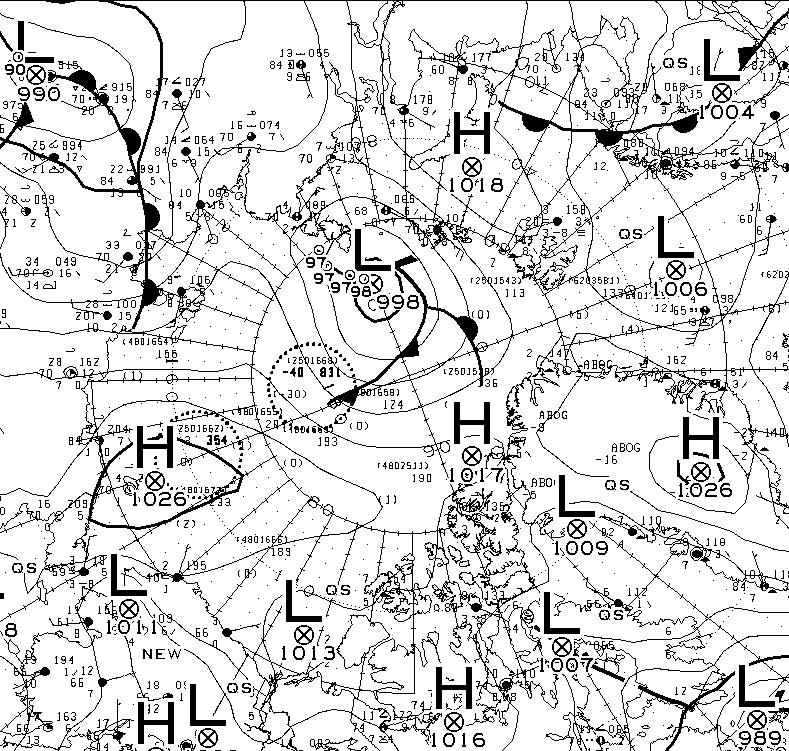
At long last there’s a sub 1000 hPa MSLP low pressure area slowly wending its way across the central Arctic:

It seems to have bottomed out at 997 hPa. Perhaps this will inhibit the ongoing “plummet” in extent? JAXA extent fell by 114,342 km2 yesterday.

[Edit – July 23rd]

The Northern Sea Route has opened unusually early this year:

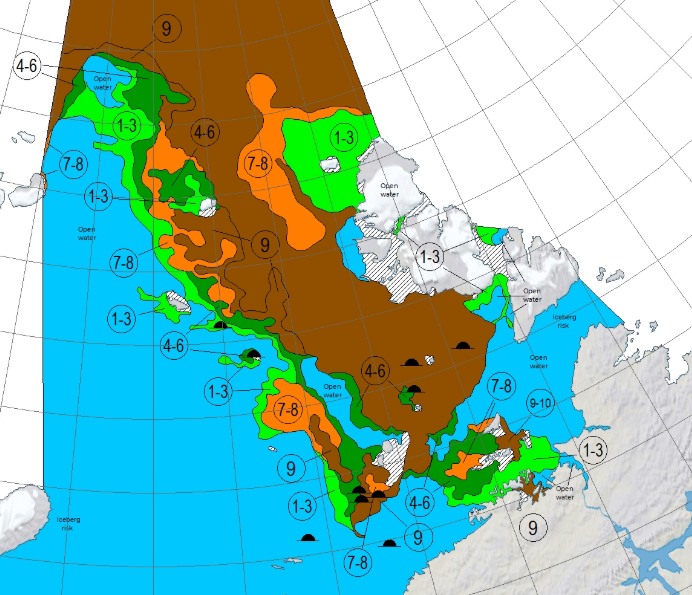
Based on the AMSR2 concentration maps from the University of Hamburg that happened on July 13th. The final choke point, as is so often the case, was the Vilkitsky Strait. According to the charts from the Russian Arctic and Antarctic Research Institute, by the 14th there was a narrow way through occupied by no more than 3/10 concentration ice:

[Edit – July 25th]

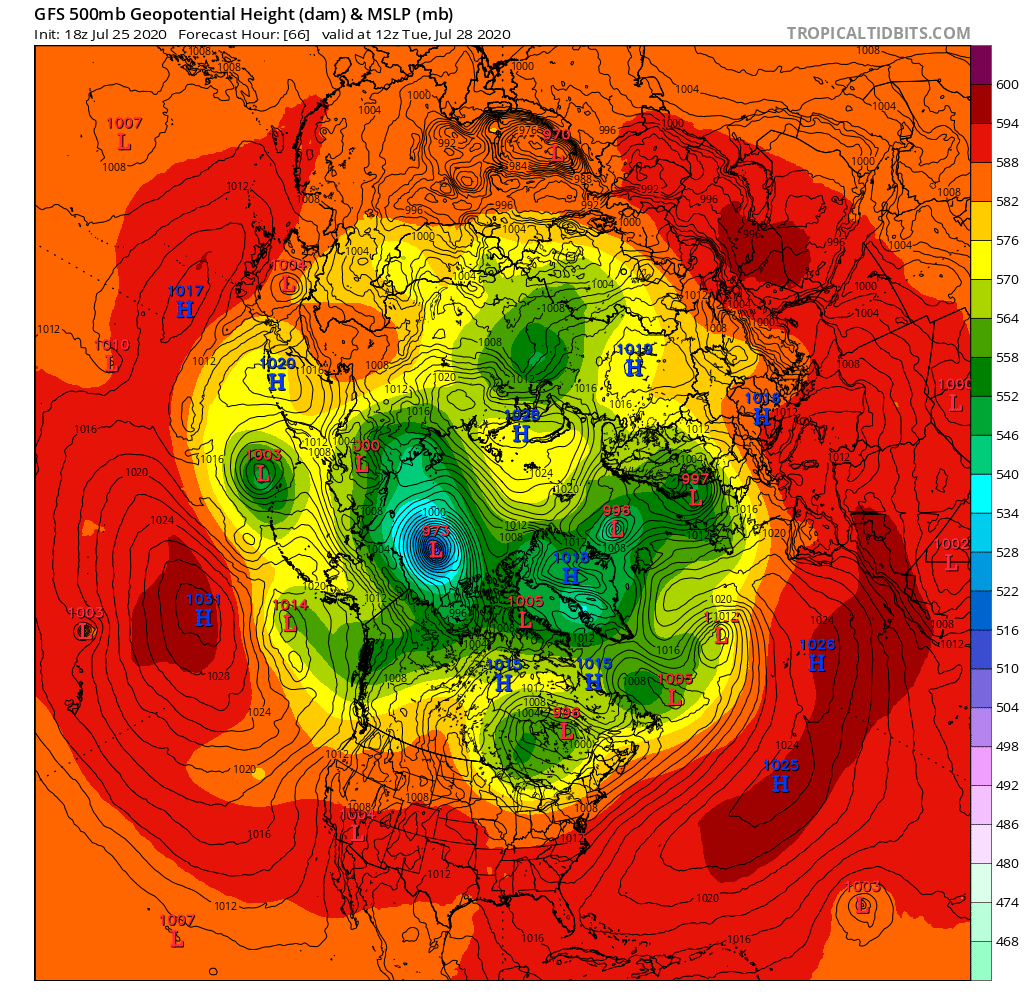
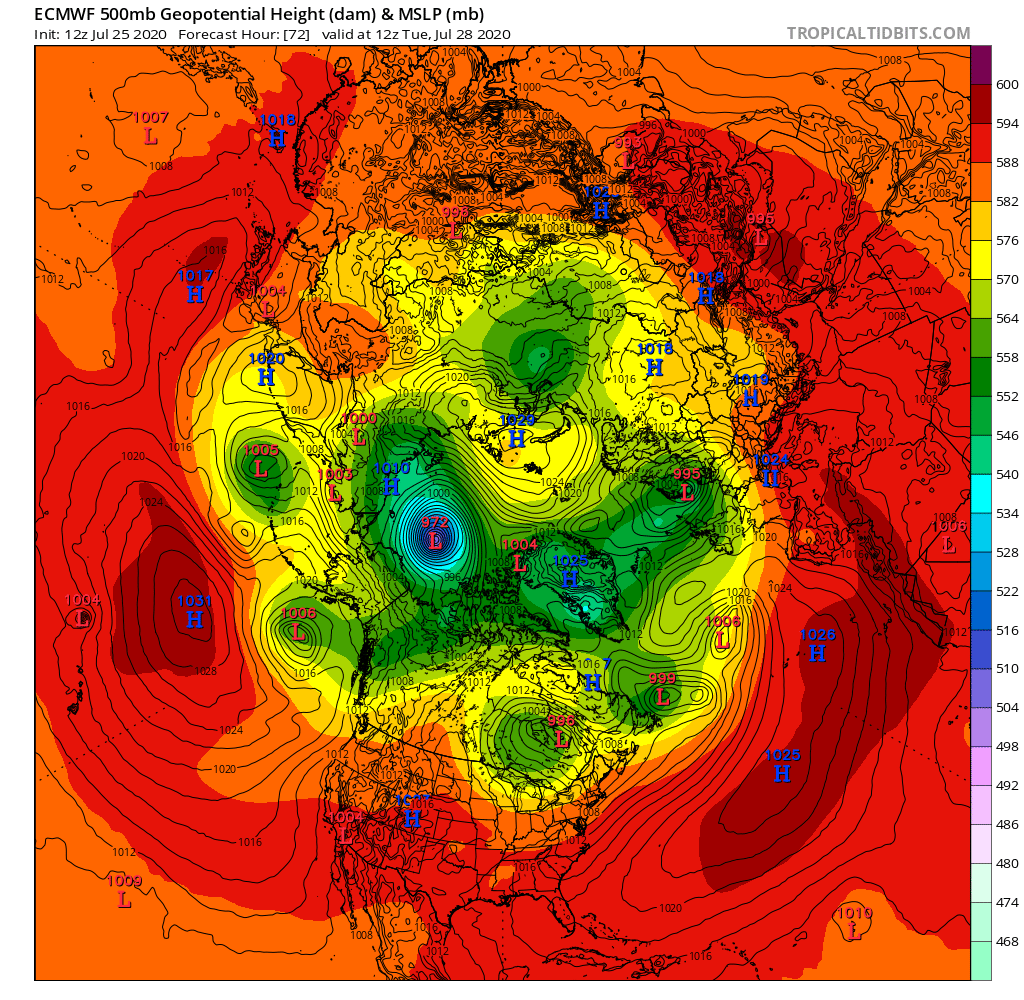
A mere three days away, and the GFS and ECMWF forecasts are in agreement, so there is a decent chance this setup will materialise in the real world:

Graphics via Tropical Tidbits

A 972(ish) hPa MSLP cyclone sitting over the ice Beaufort Sea by 12Z on Tuesday.

[Edit – July 27th]

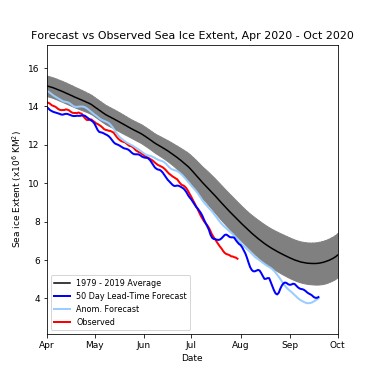
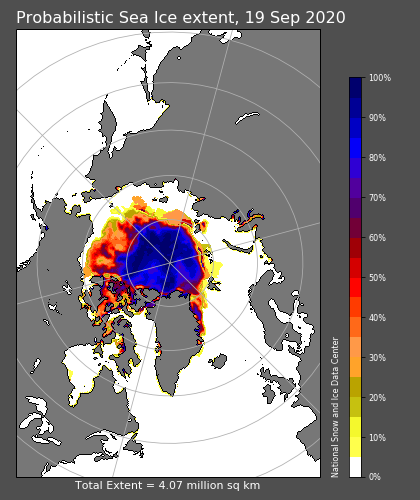
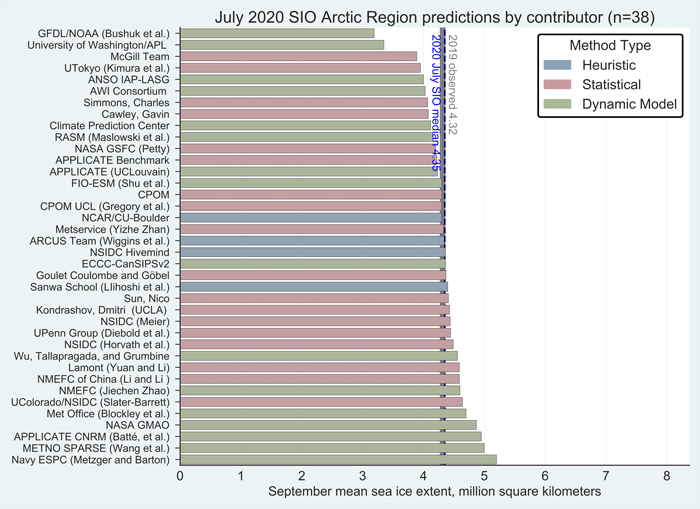
The Sea Ice Prediction Network July forecast for this year’s September minimum extent have been released. Here’s the graphical overview:

This year’s median projected value from the July forecasts of 4.3 million square kilometers is essentially identical to the median from the June forecasts. Quartiles are 4.1 and 4.6 million square kilometers. As was also the case for June, only two projections, both by dynamic models, are for a new record low, below the mark of 3.57 million square kilometers set in 2012. One dynamical model predicts the September sea-ice extent above 5.0 million square kilometers, compared to two in the June report.

Note that the numbers quoted are for the average NSIDC extent across the month of September, not the lowest daily JAXA extent, which I suggested earlier would be “below 4 million km²” this year.

Meanwhile over on Twitter this evening (UTC):

[Edit – July 28th]

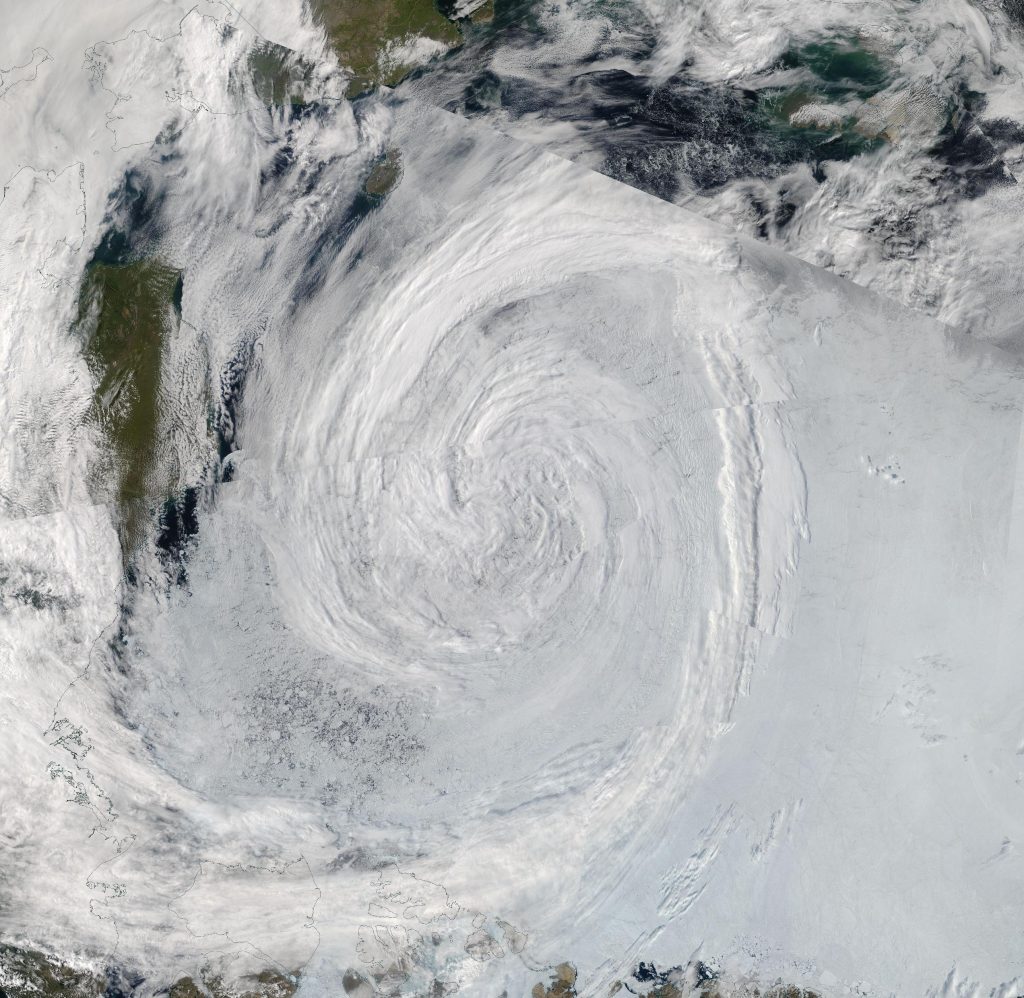
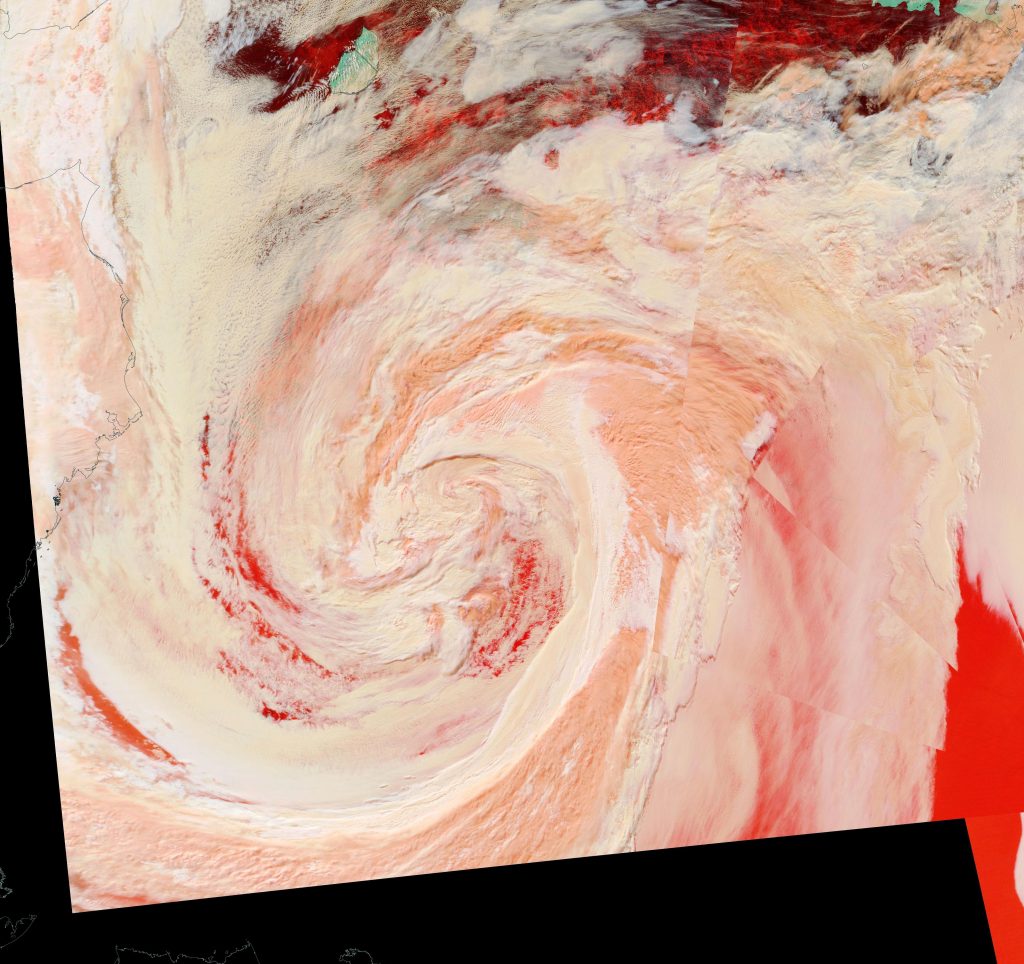
The MSLP of the (Great?) Arctic cyclone sank below 970 hPa overnight:

Here’s an early false colour snapshot of how (s)he looks from on high this afternoon (UTC), courtesy of the MODIS instrument on the Terra satellite:

[Edit – July 29th]

First up today we have a more complete “true colour” image of the cyclone doing its worst yesterday, including a fairly clear view in the bottom left corner of the initial damage to the sea ice covering the eastern Beaufort Sea. This one is from the Aqua satellite:

Watch this space!

Facts About the Arctic in June 2020

As is our current habit this month’s report begins with the high resolution Arctic sea ice area and extent graphs based on the University of Hamburg’s AMSR2 concentration maps:

Area and extent are currently vying for second place with 2019 on the “lowest for the date” leader board, a little behind 2016 at this point in the 2020 melting season.

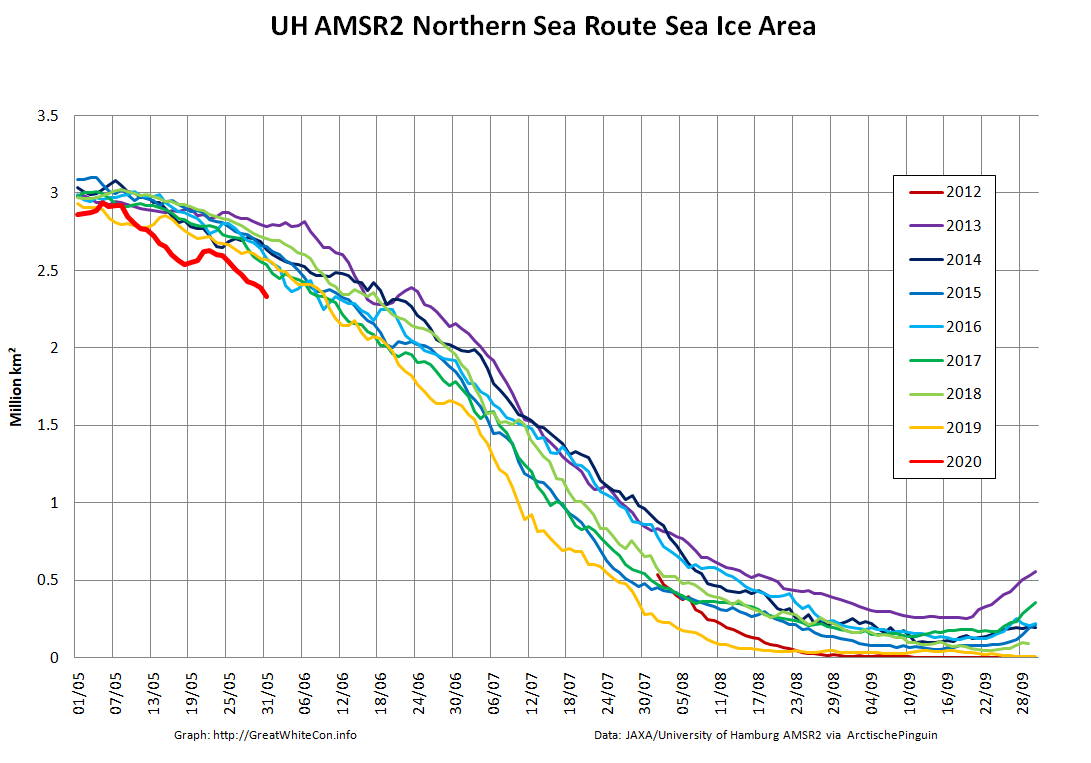
However following the extremely warm spring in Siberia, the sea ice area along the assorted sea that comprise the Northern Sea Route is well below all previous years in the AMSR2 record:

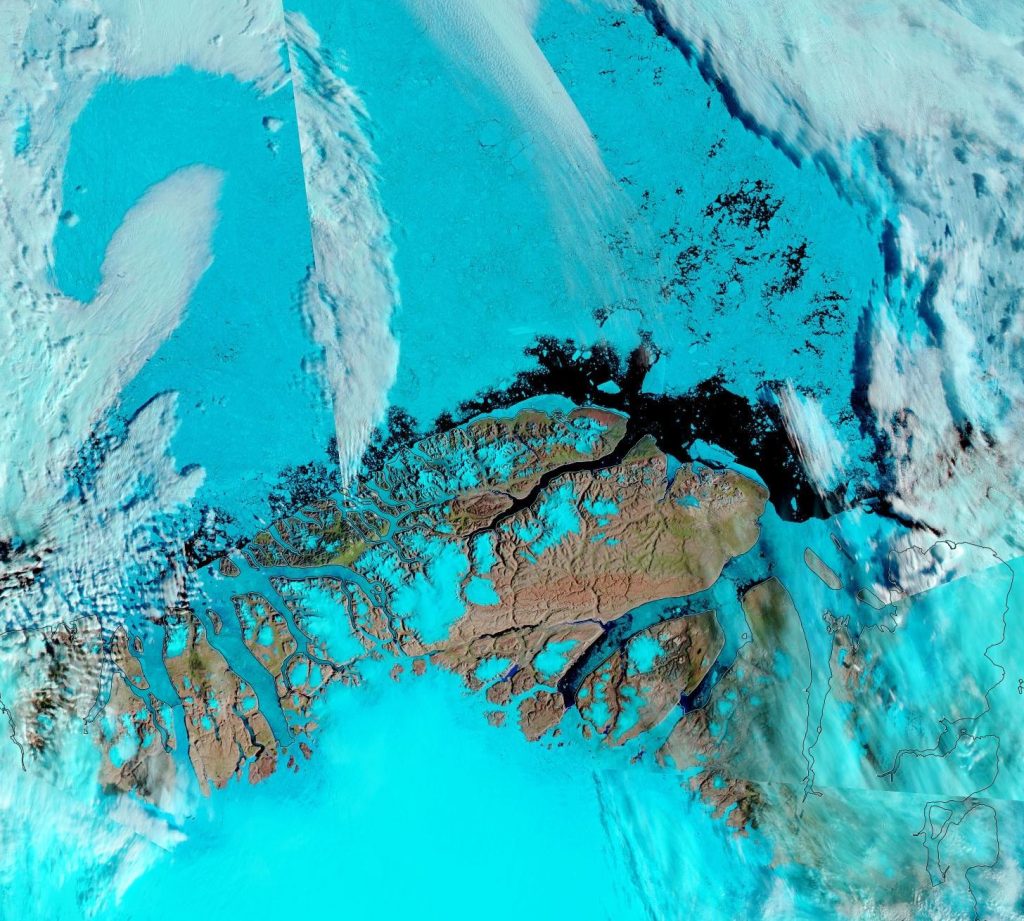
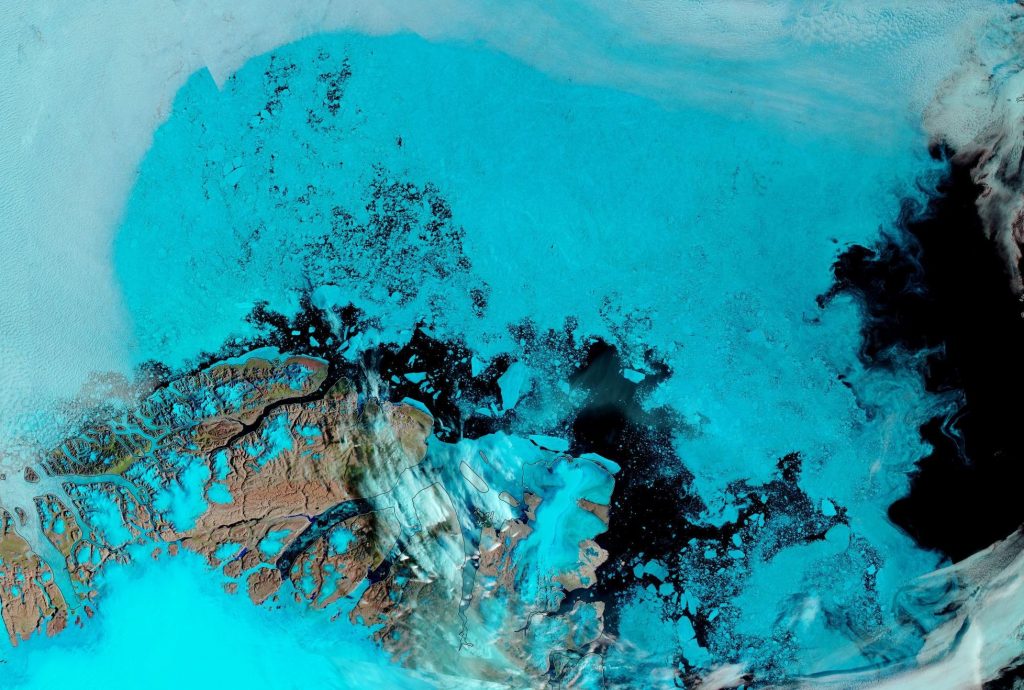
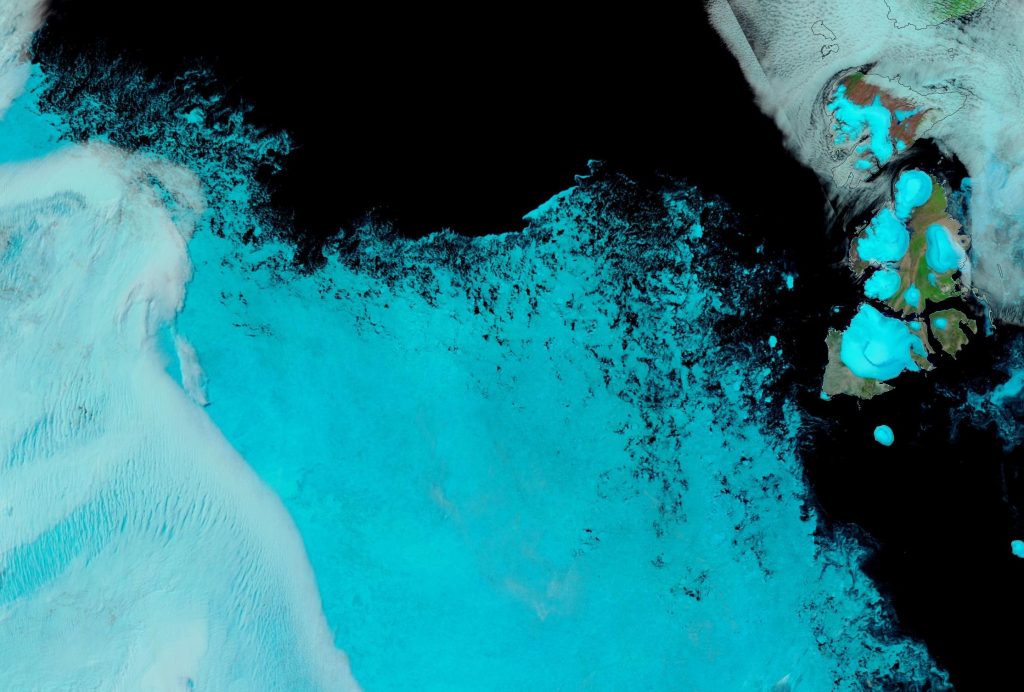
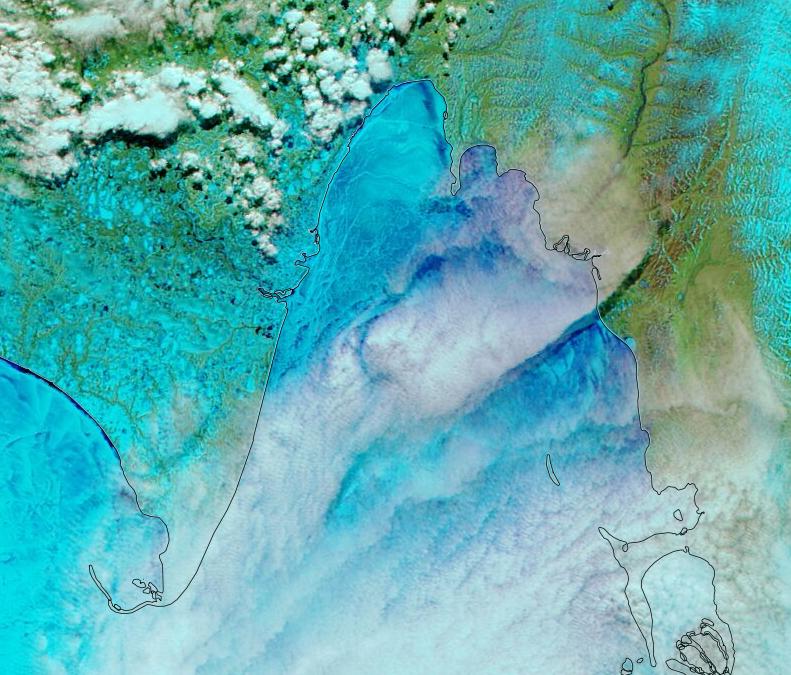
Another effect of the sweltering Siberian spring is evident in the melt ponds visible below the clouds across the southernmost parts of the Laptev Sea:

NASA Worldview “false-color” image of the Laptev Sea on June 1st 2020, derived from the MODIS sensor on the Aqua satellite

plus the East Siberian Sea and Chaunskaya Bay:

NASA Worldview “false-color” image of the East Siberian Sea on June 1st 2020, derived from the MODIS sensor on the Terra satellite

[Edit – June 4th]

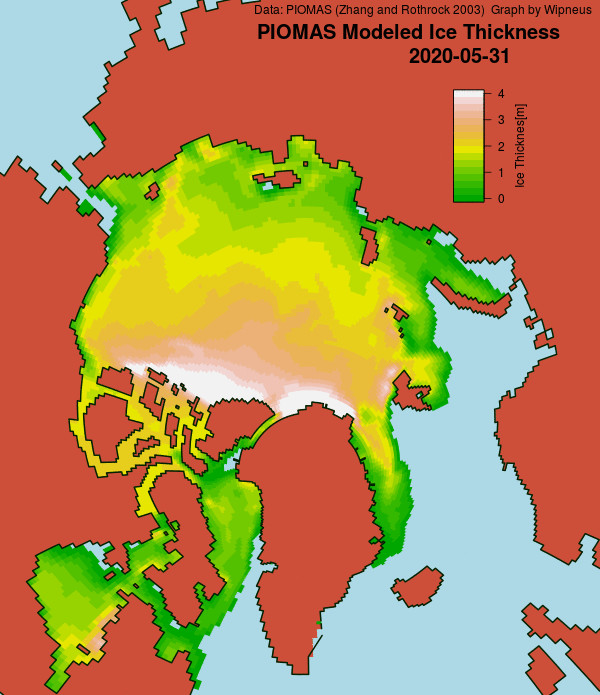
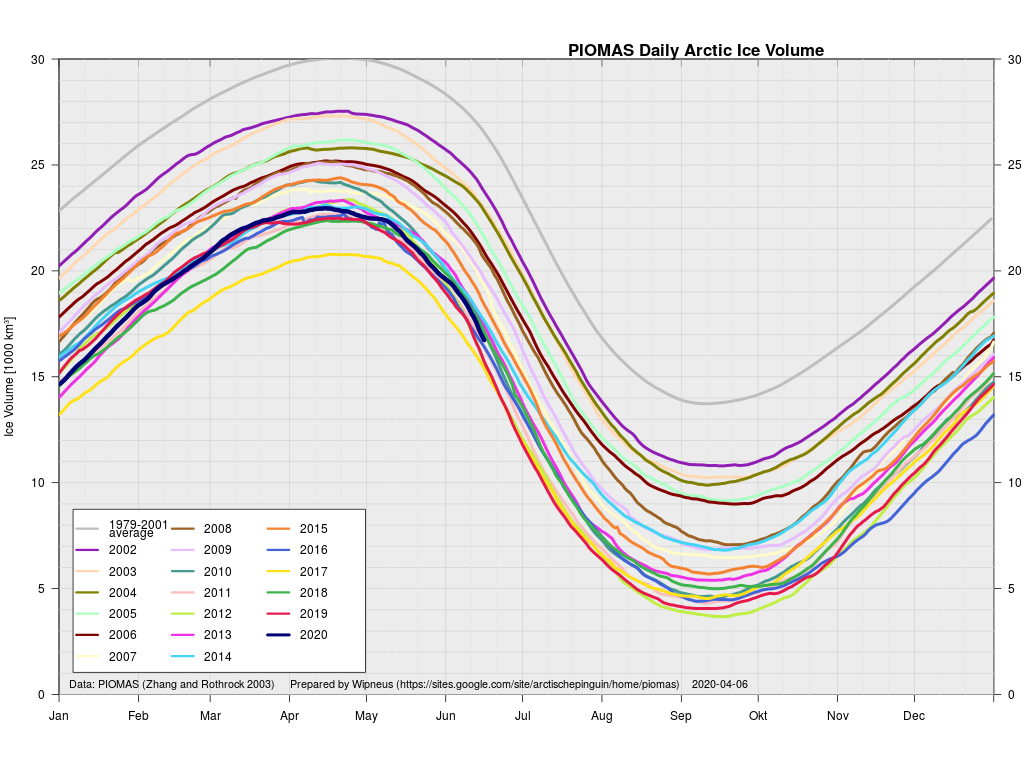
The May 31st PIOMAS gridded thickness numbers have been released, and Wipneus has crunched the numbers:

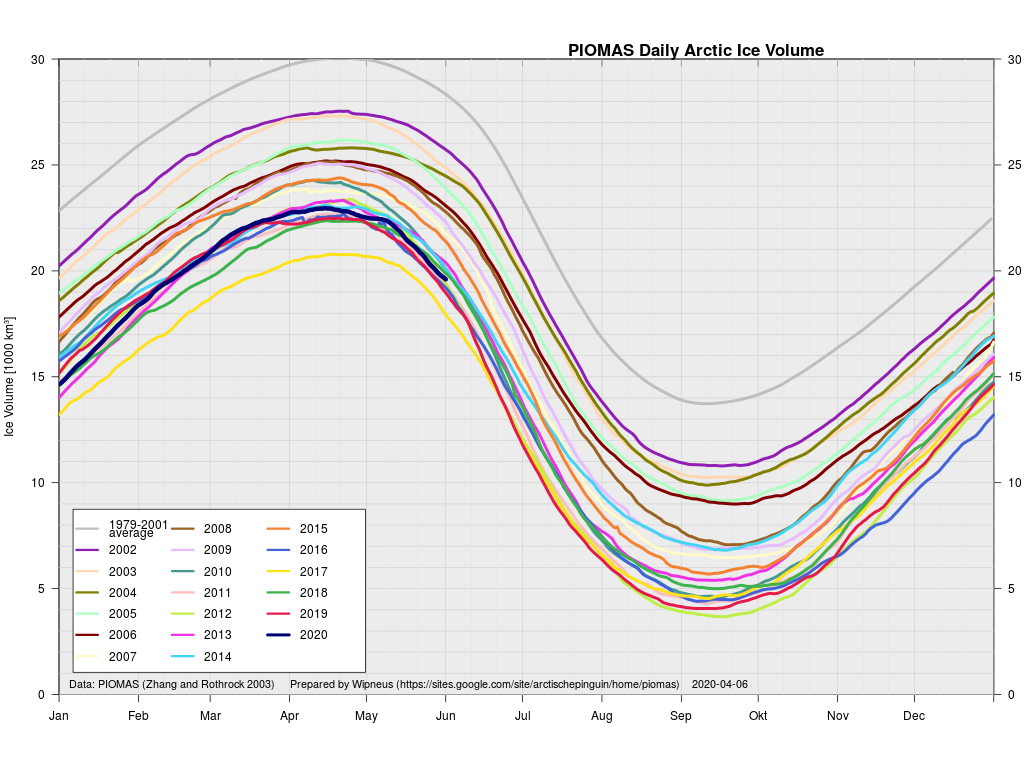
Here too is the latest volume graph:

According to the Polar Science Center’s May 2020 update:

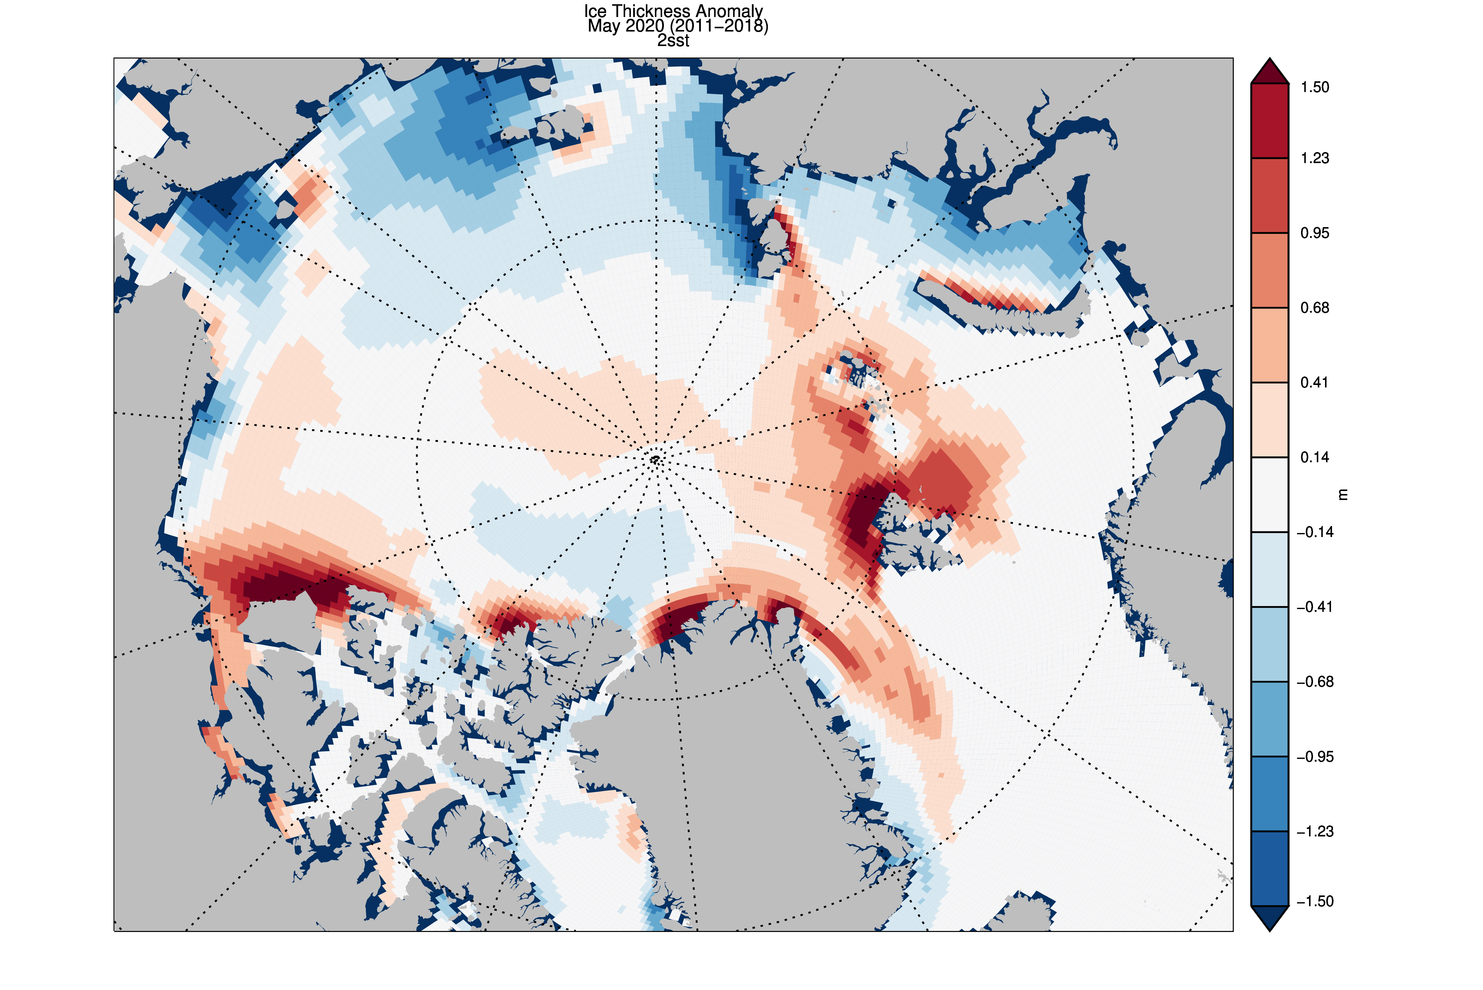
Average Arctic sea ice volume in May 2020 was 21,500 km3. This value is 1700 km3 above the record minimum value of 19,800 km3 set in 2017, making it the sixth lowest on record. Monthly ice volume was 39% below the maximum in 1979 and 25% below the mean value for 1979-2019. May 2020 ice volume falls 0.8 standard deviations above the trend line. Daily volume anomalies for May progressed at a fairly normal pace for recent years. Average ice thickness is in the middle of the pack for the more recent years. Ice thickness anomalies for May 2020 relative to 2011-2018 continue the April pattern and show relatively thin ice along the Russian Coast and thicker than normal sea ice in the Barents sea. There are some fairly strong positive anomalies in the eastern Beaufort and north of Greenland. This anomaly pattern is likely due to the very strong positive Arctic-Oscillation index pattern that occurred during the Winter of 2020.

There looks to be a lot of anomalously thick ice waiting to melt out on the Atlantic periphery, and it will be interesting to see how the thicker ice in the eastern Beaufort Sea fares as the melting season progresses.

As also suggested by the area graph above, the Northern Sea Route is going to be open early in 2020. In fact a ice hardened tanker has already begun its journey through, unsupported by an icebreaker:

It was the “Christophe de Margerie” that on the 19th May kickstarted this year’s shipping season across the eastern part of the Northern Sea Route. The vessel owned and operated by Russian shipping company Sovcomflot loaded up liquefied natural gas in Sabetta and is due to arrive in the Chinese port of Jingtang on the 11th June. It was the earliest east-bound shipment on the route ever for this kind of vessel.

Shipments in the Northern Sea Route 27th May 2020. Map by MarineTraffic

By 27th May, the ship had made it almost to Wrangel Island, information from ship tracker service MarineTraffic shows. The “Christophe de Margerie” is accompanied by nuclear powered icebreaker “Yamal”.

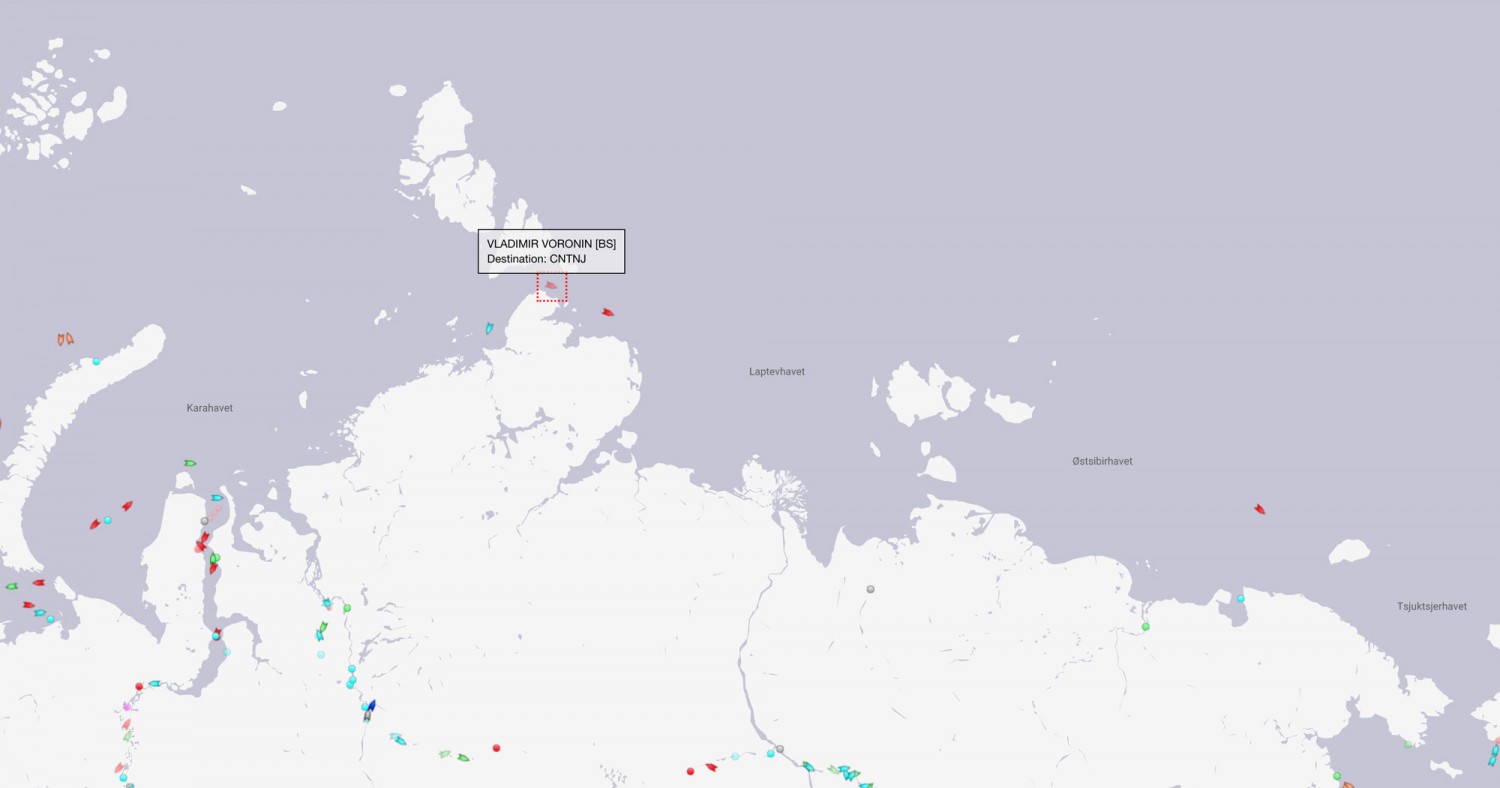
In the wake of the almost 300 meter long vessel now follows the “Vladimir Voronin”, a vessel that is operated by company Teekay. The “Vladimir Voronin” on the 25th May left Sabetta and was on May 27th located in the Vilkitsky Strait north of the Taymyr Peninsula.

The ”Vladimir Voronin” is not accompanied by icebreaker. The “50 Let Pobedy” that escorted the ship out of Sabetta and eastwards towards the Vilkitsky Strait has now returned and appears to be on its way back to Sabetta.

[Edit – June 17th]

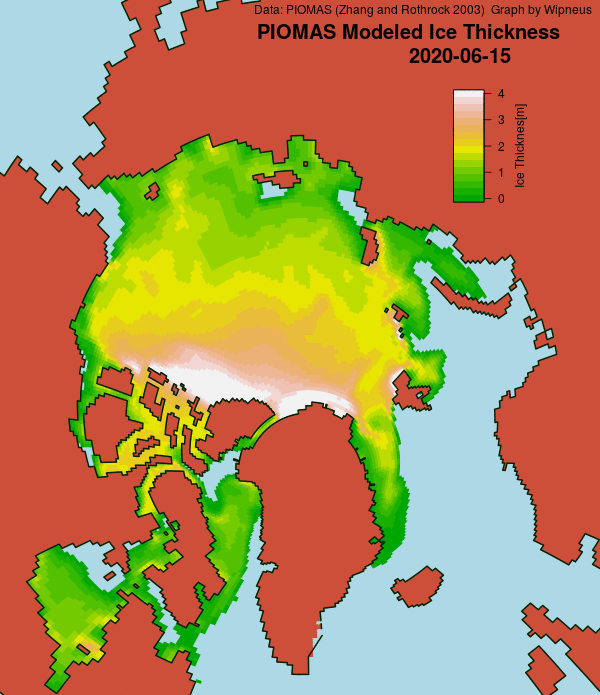
The mid month PIOMAS gridded thickness numbers have just been released. Here’s the thickness map:

and the volume graph:

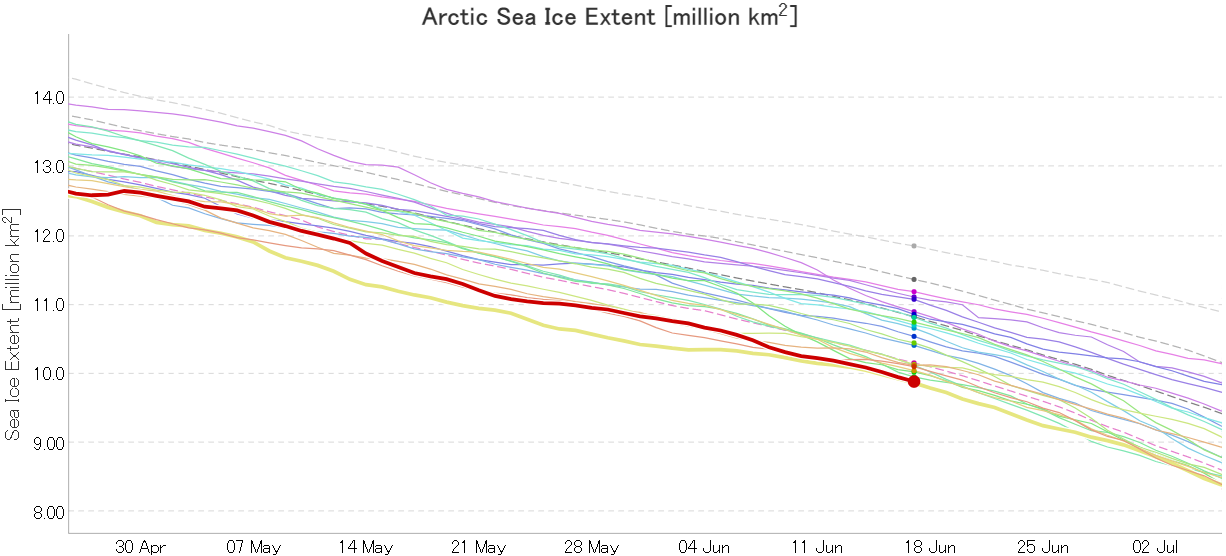
In addition JAXA extent is now in a “statistical tie” with 2019 in the “lowest for the date” competition:

Watch this space!

Facts About the Arctic in May 2020

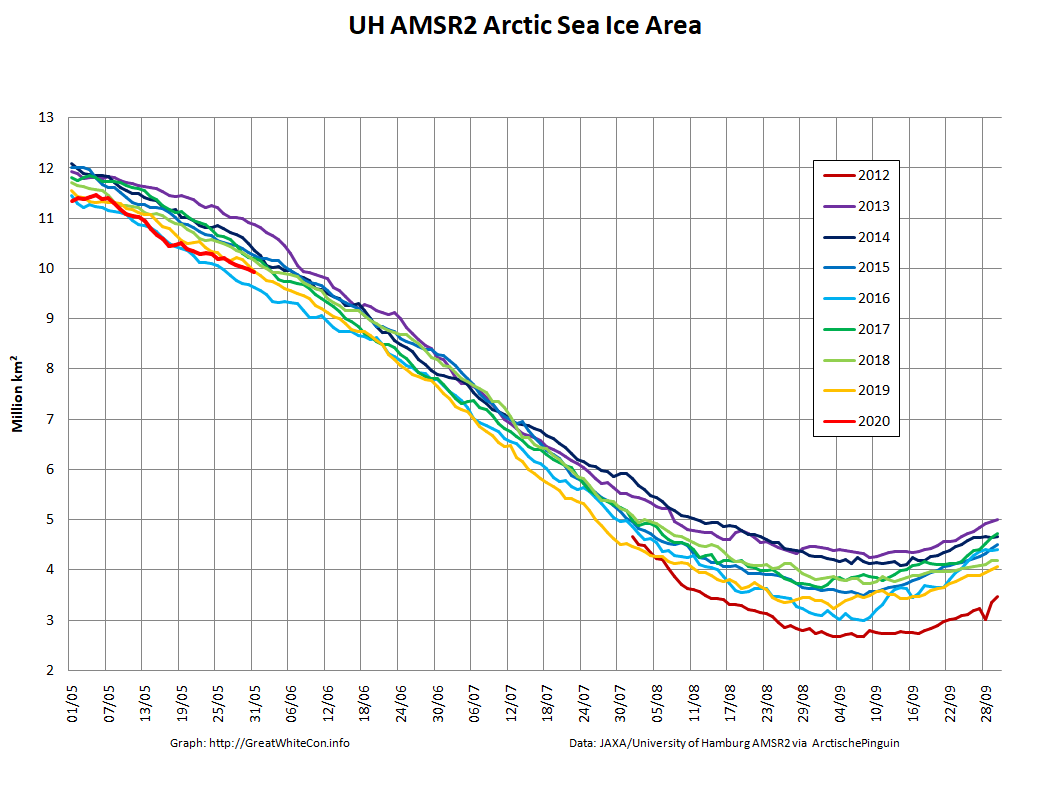
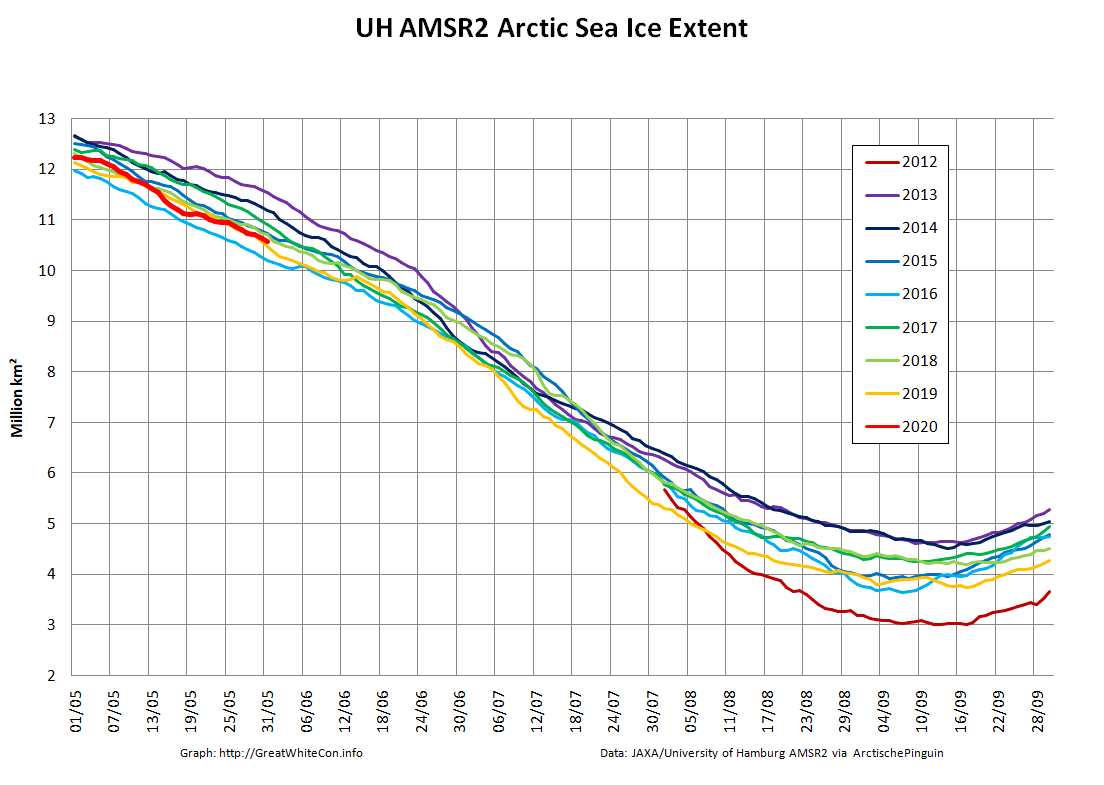
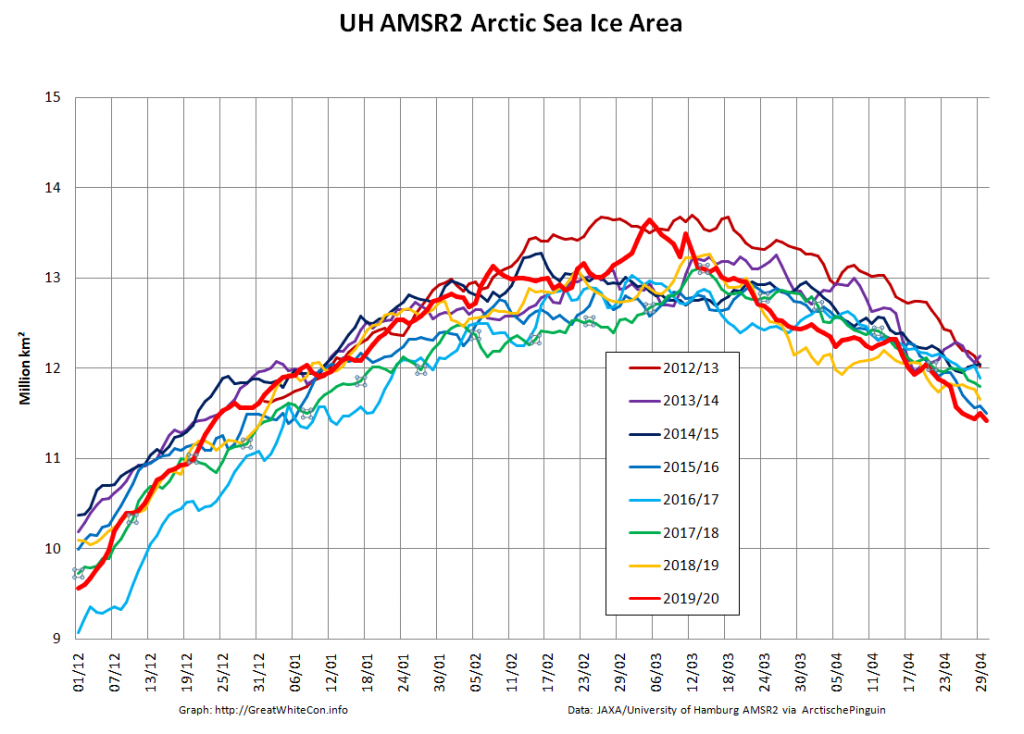
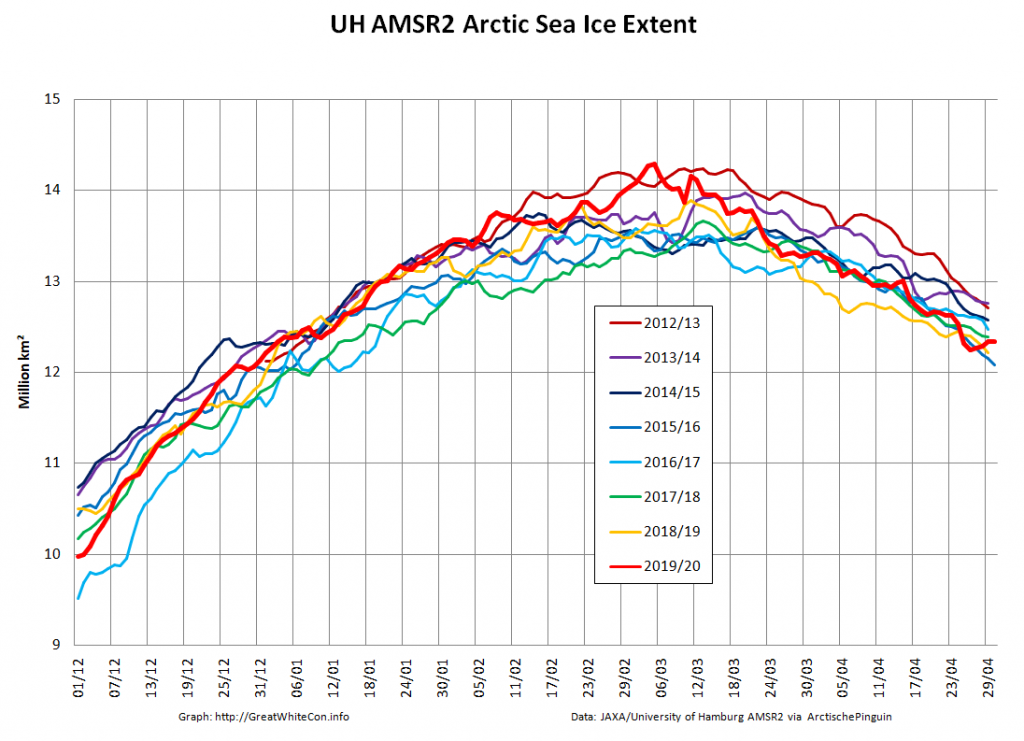
Let us begin this month’s report from the far north with the high resolution Arctic sea ice area and extent graphs based on the University of Hamburg’s AMSR2 concentration maps:

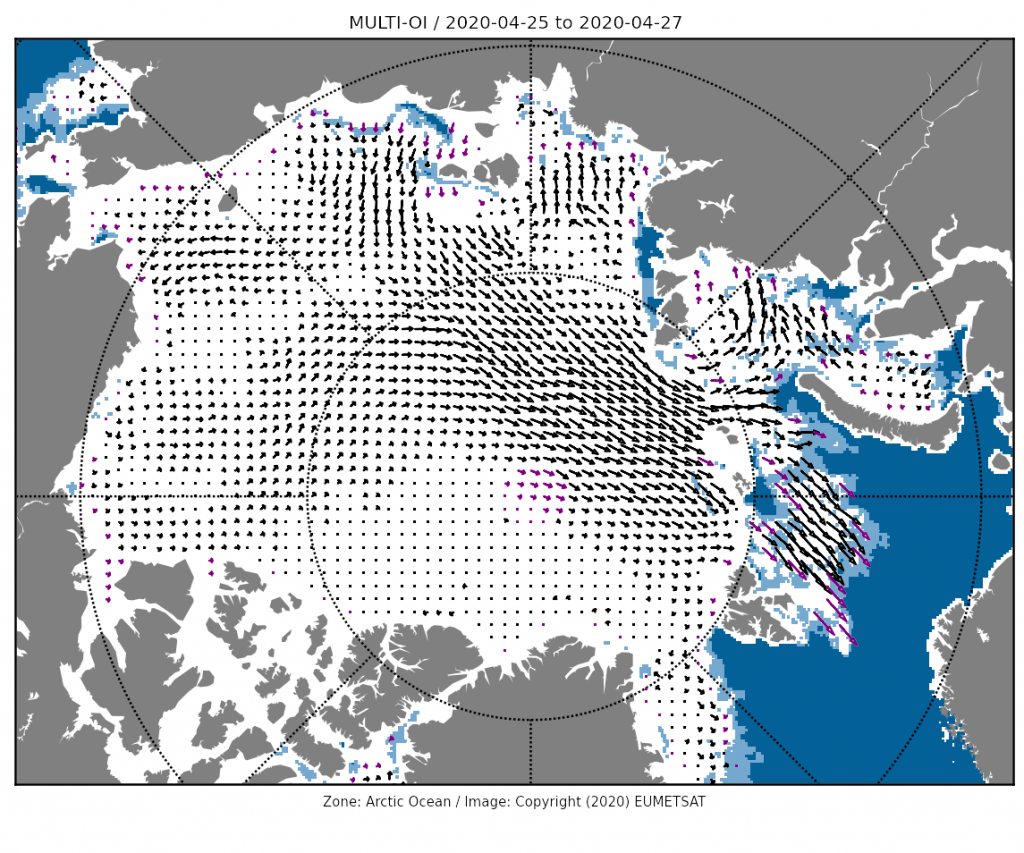
Area is currently lowest for the date in the AMSR2 record. After briefly occupying that position extent has increased over the last few days of April due to winds causing sea ice to move in the direction of the far North Atlantic:


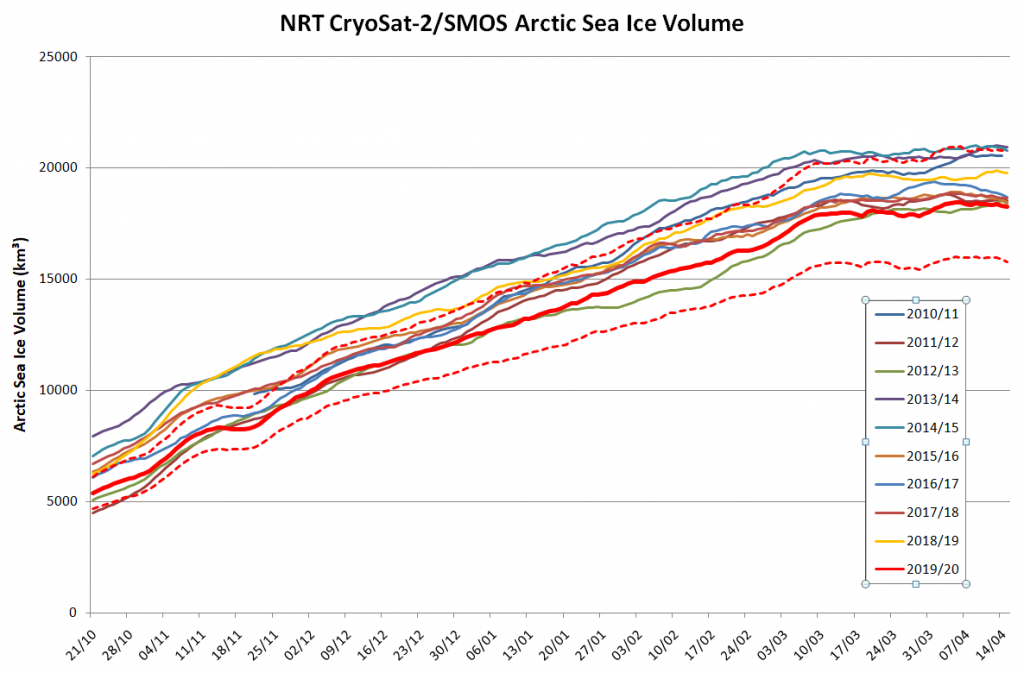
The Alfred Wegener Institute has now finished reanalysing their CryoSat-2/SMOS thickness data, and the resulting volume graph looks like this:

“Measured” Arctic sea ice volume is the lowest in the CryoSat-2 era as we head towards the main 2020 melting season, which in my calendar at least begins on June 1st. The PIOMAS modelled volume numbers should be released shortly.

[Edit – May 5th]

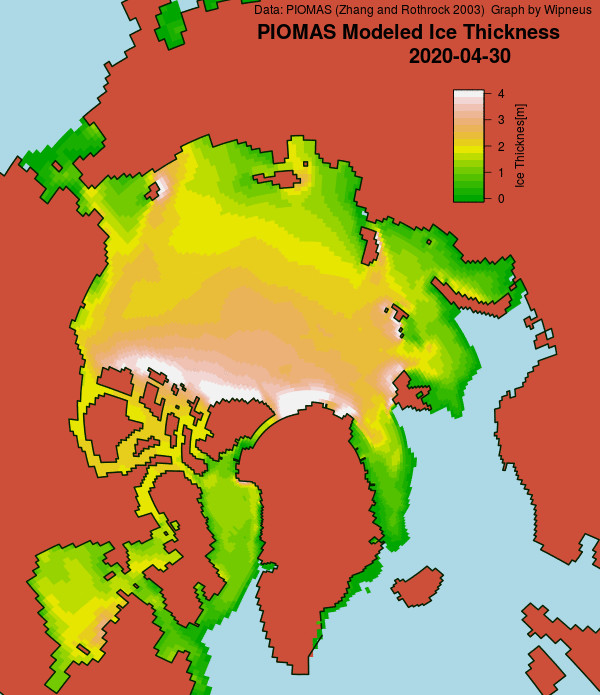
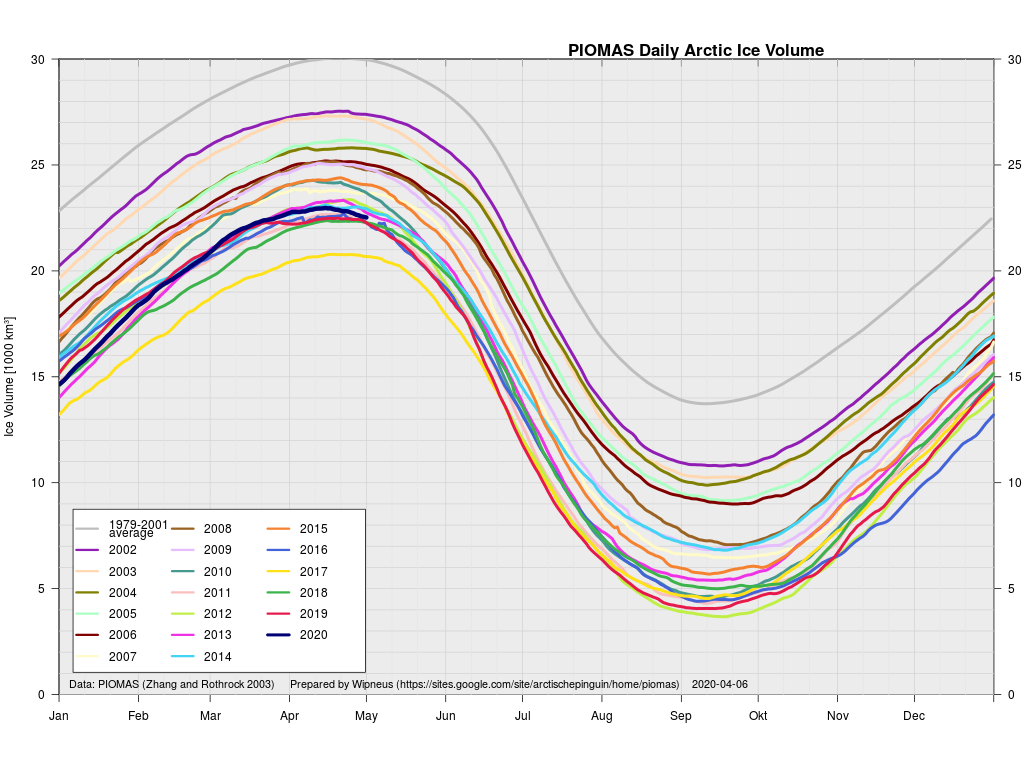
The April 30th PIOMAS gridded thickness numbers have been released, and Wipneus has worked his usual magic. By way of comparison with the AWI metric:

Obviously differing from CryoSat-2/SMOS, PIOMAS has 2020 volume a long way above 2017, in amongst a gaggle of other years.

[Edit – May 13th]

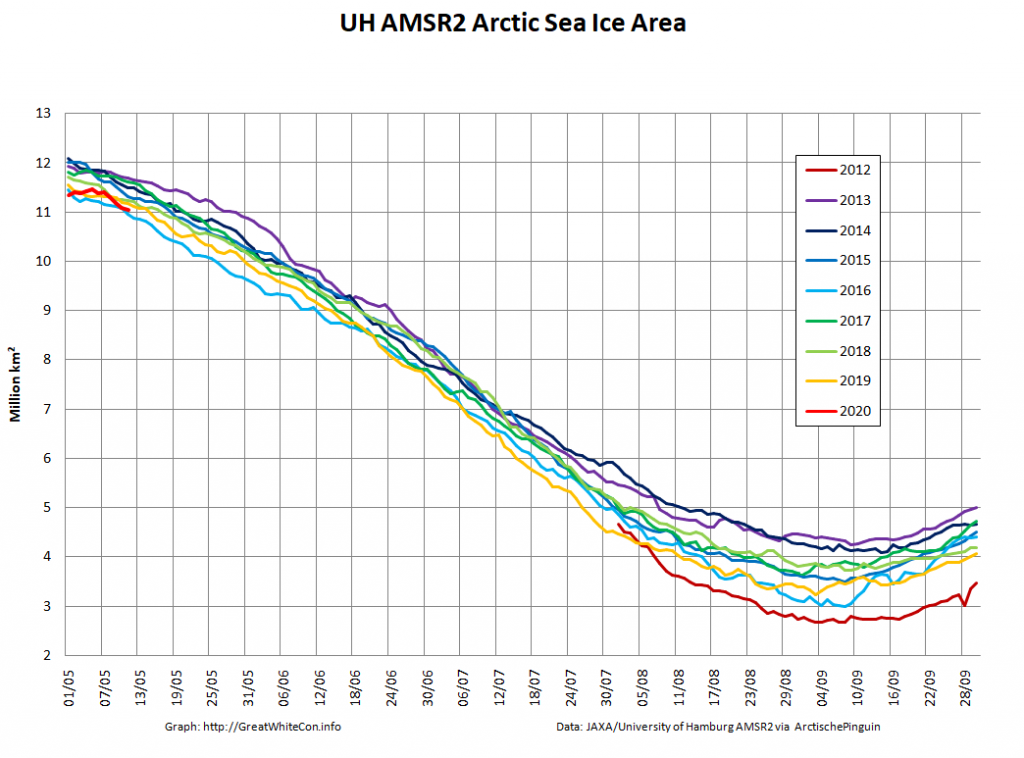
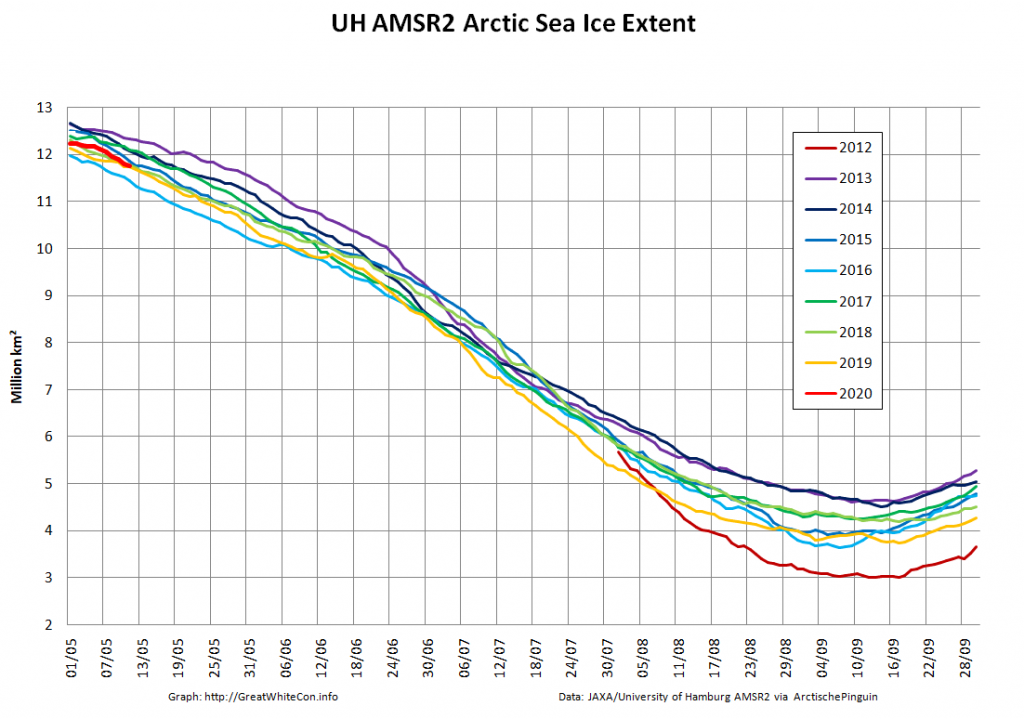
The middle of May is rapidly approaching, so let’s start to set the scene for the forthcoming melting season. First off here are the hi res AMSR2 area and extent graphs:

Extent is currently significantly above 2016 due to the recent “dispersion” mentioned above, but area is very close to an all time low for the date.

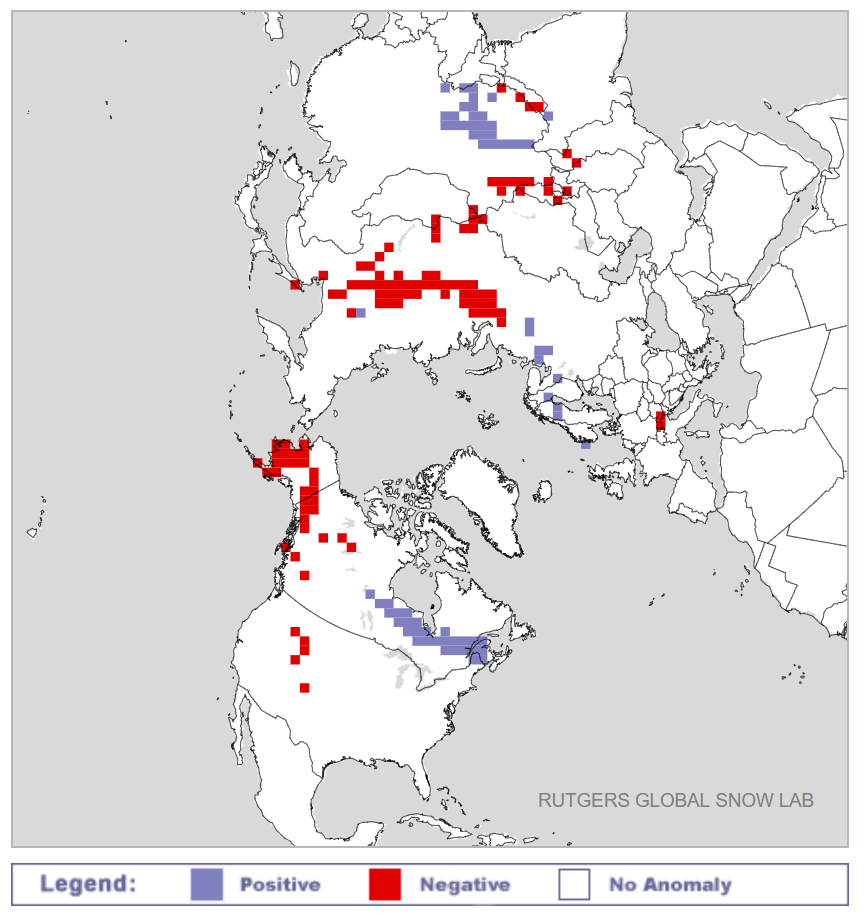
Next take a look at the current northern hemisphere snow cover anomalies from the Rutgers University Snow Lab:

Whilst there is a positive anomaly near Hudson Bay, there are significant negative anomalies across Siberia and Alaska. This does not augur well for sea ice retention along both the Northern Sea Route and Northwest Passage by September 2020.

Watch this space!