Tag Archives: Shock News

“Steve Goddard” Busted

Our headline today is inspired by Tony Heller, probably still better known by his nom de guerre “Steven Goddard”, who excitedly tells the world:

NSIDC Busted!

Reader Chris71 has discovered the smoking gun on the NSIDC web site. Read on.

A few weeks ago, NSIDC put out this press release, claiming that 5+ year old ice is at its smallest level on record.

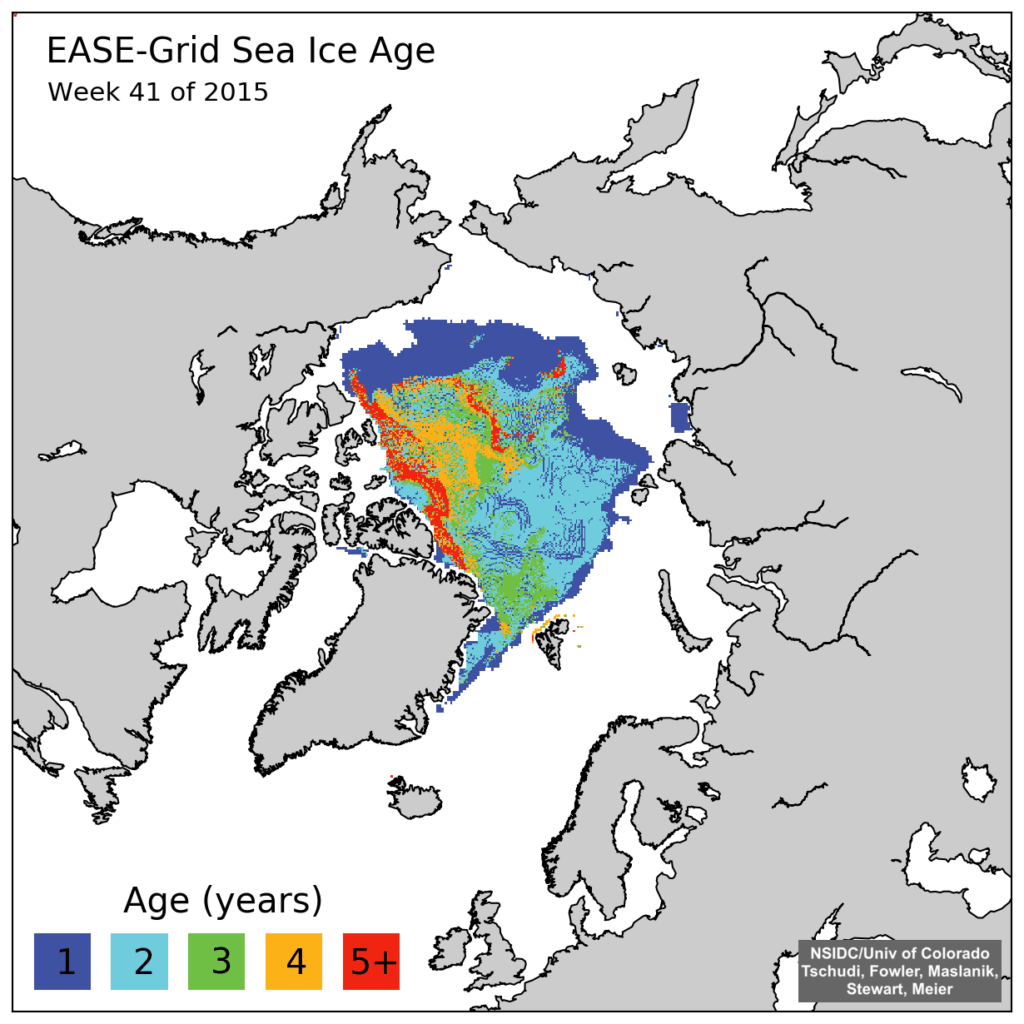
The press release included the map below. This is a new style map which they just started in week 39 2015. The map below is for week 41 2015. All of their previous 1984-2015 maps have been deleted from their archive.

iceage_browse_week_n_2015_41-1024x1024

The good news is that Chris found one of their old style maps which had not been scrubbed from their website. NSIDC has deleted the original graphs, but seem to have forgotten to get rid of the copy.

iceage-2015-41

For some strange reason “Steve” neglects to mention this text that accompanied the “old style map” he so proudly displays:

Here are some graphs from the Arctic – automatically saved here, and some of them archived Enjoy! Fred aka DungeonMaster on http://forum.arctic-sea-ice.net/.

Have I got news for Chris and “Steve”? Indeed I have! If one were to bother to go to the relevant section of the NSIDC web site instead of inventing bizzare fairy tales one would be able to read this:

EASE-Grid Sea Ice Age, Version 3

This data set provides weekly estimates of sea ice age for the Arctic Ocean from remotely sensed sea ice motion and sea ice extent.

The input ice motion data used for this data set is now derived from NSIDC-0116 Version 3 data.

Checking out the detailed information provided about the NSIDC-0116 Polar Pathfinder Daily 25 km EASE-Grid Sea Ice Motion Vectors, Version 3 would also reveal:

Version 3 – February 2016.

  • Eliminated unrealistic AVHRR and IABP buoy velocities

  • Extended buoy ice motion estimates to the present

  • Improved browse images

  • Reprocessed SSMI fields using GDAL map transformations on the DMSP SSM/I-SSMIS

  • Daily Polar Gridded Brightness Temperatures Data Set, NSIDC-0001.

  • Used Ice concentration estimates greater than 15 percent from the Sea Ice Concentrations from Nimbus-7 SMMR and DMSP SSM/I-SSMIS Passive Microwave Data Set, NSIDC-0051, to indicate where ice extent is present.

Checking out the detailed information provided about the NSIDC-0611 EASE-Grid Sea Ice Age, Version 3 would further reveal:

The sea ice age data in these files are derived using data from satellite passive microwave instruments, drifting buoys, and a weather model. With these data sources, the formation, movement, and disappearance of sea ice can be observed; and these observations can, in turn, be used to estimate ice age (Maslanik et al. 2007). The ice age data are derived from a number of passive microwave imagers: the Scanning Multichannel Microwave Radiometer (SMMR), the Special Sensor Microwave/Imager (SSM/I), and the Special Sensor Microwave Imager Sounder (SSMIS). Visible and infrared data from the Advanced Very High Resolution Radiometer (AVHRR) were also utilized through 2004. In addition, International Arctic Buoy Program (IABP) drifting-buoy vectors and the National Centers for Environmental Prediction (NCEP)/National Center for Atmospheric Research (NCAR) Reanalysis Project (CDAS) are used to augment the satellite data (Tschudi 2010).

Version 3 – April 2016.

So there you have it “Steve”. Thanks to the sterling (albeit uncredited!) efforts of the all volunteer members of the Arctic Sea Ice Forum and the (presumably still paid?) scientists at the National Snow and Ice Data Center you can now explain the truth, the whole truth, and nothing but the truth of the matter to your own loyal readers.

A few weeks ago the NSIDC upgraded their sea ice age product from version 2 to version 3. Here’s what the latest version of 1984 week 41 looks like:

iceage.week.1984.41.n.v3

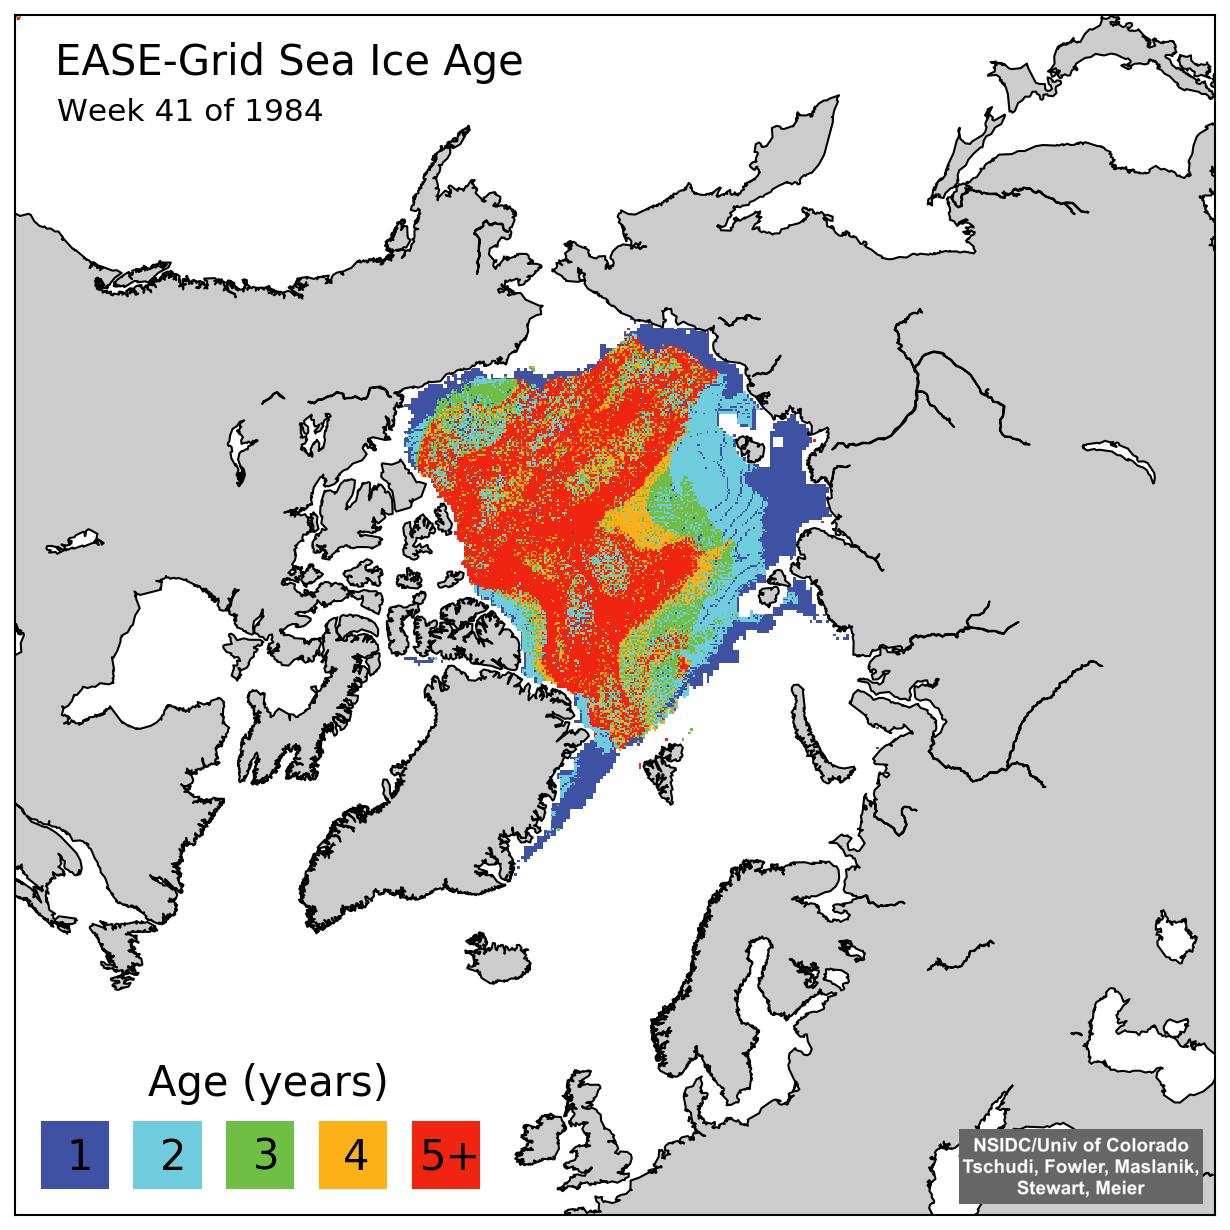
Can you spot the difference Tony?

[Edit – May 1st 2016]

In partial answer to a question posed below, here’s an animation of Arctic sea ice age from September 2010 to May 2015. Can you see what has happened to the old ice Tony?


Original Arctic sea ice age images from: Tschudi, M., C. Fowler, J. Maslanik, J. S. Stewart, and W. Meier. 2016. EASE-Grid Sea Ice Age, Boulder, Colorado USA: NASA National Snow and Ice Data Center Distributed Active Archive Center. http://dx.doi.org/10.5067/PFSVFZA9Y85G.

[Edit – May 30th 2016]

Here’s a “Storified” summary of my Twitter “debate” with Tony Heller and Patrick Moore:

Global Sea Ice Area at Lowest *Ever Level

Regular readers will recall that we recently announced this “Shock News!” in a comment below our “Arctic Sea Ice Area and Extent Lowest ^Ever” article. Here is the graphic evidence again:

CT-Global-2016-02-08


And here is a story about what it takes to convince a “climate change skeptic” about the crysopheric facts of life:


There’s more on this sorry tale of woe over at Neven’s Arctic Sea Ice Blog.

This measure doesn’t tell us all that much about the health of either Arctic or Antarctic regions, if only because the seasons move in opposite directions (nevertheless, the Global sea ice trend is down). It’s just an interesting statistical factoid.

However, climate risk deniers often use the Global sea ice metric as an argument that nothing is wrong and AGW is a hoax. In other words, the recent growth in Antarctic sea ice offsets the loss of Arctic sea ice (it doesn’t), even though the poles are literally worlds apart and are pretty much incomparable (except for the sea ice bit).

Using this logic, it would seem that this new record minimum means there is something wrong with sea ice and AGW isn’t a hoax. I wonder how they will spin this one. If they report it to their loyal readers, that is.

So far none of the “climate risk deniers” I’ve pinged on Twitter have brought this “interesting statistical factoid” to the attention of “their loyal readers”.

* Since satellite records began
^ For the day of the year

The Greatest Scandal in the History of Science!

Christopher Booker has raised the stakes in the “ClimateGate 2.0” edition of ClimateBall™ in his article in this morning’s edition of the Sunday Telegraph:

It was only the adjusted surface records which showed 2014 to have been “the hottest year on record”. The other two official records, based on satellite measurements, which only go back to 1979, show nothing of the kind.

The international fallout from my two articles has been huge. The second, headed “The fiddling of temperature data has been the biggest science scandal ever”, scored a record 30,000 comments on The Telegraph website. But what is particularly telling has been the silence of GHCN and the compilers of the other surface records in response to requests from Homewood and others for a proper explanation of how and why they had needed to make so many adjustments to the original data.

What is now needed is a meticulous analysis of all the data, to establish just how far these adjustments have distorted the picture the world has been given. Although I cannot yet reveal any details, I gather that a responsible foundation is gathering an expert team to do just that. If the results confirm what has already been unearthed by Homewood and other analysts, from the US to New Zealand, this may indeed turn out to have been the greatest scandal in the history of science.

He is apparently being aided and abetted in his latest outlandish bid by BBC Radio 4 News, who reported on his article as follows in their 07:07:25 review of the Sunday newspapers this morning:

Christopher Booker in the Sunday Telegraph demands a meticulous analysis of the data used to justify the claim that last year was the warmest on record, something he suggests could turn out to be one of the greatest scandals in science. He says a growing number of experts around the world have found that the raw data originally gathered by weather stations was comprehensively adjusted to justify the claim.

This is of course all spectacularly shoddy science (SSS for short) by Homewood, Booker et. al. , as we informed Ian Marsden at the Telegraph Group after Booker’s previous climate bluff was trumped by a long list of climate scientists, who have in fact been anything but “particularly silent” this time around. By way of example, since Ian Marsden evidently hasn’t watched this video yet, here once again is a video by a scientist who has studied such matters, which explains the truth:


Once more unto the breach, dear friends!

Us:

not to mention:

https://www.facebook.com/GreatWhiteCon/posts/676792169109481


Next I called the Beeb’s complaints number (03700 100 222 – 24 hours, charged as 01/02 geographic numbers) and told Rachel that I wished to register a complaint. I manfully resisted the temptation to emit any expletives, and informed her that the BBC’s apparent belief that Mr. Booker’s article provides some sort of “scientific balance” to Ed Milibands remarks about the need for UK plc to up its “climate change” game is so utterly ludicrous that words had totally failed me.

Rachel wondered if I was talking about this morning’s edition of “Broadcasting House“. I assured her I was not, but it sounds as though I now ought to go away and listen to that from cover to cover!

It’s now the morning of Monday February 23rd 2013. I haven’t received the email confirmation from the BBC that Rachel promised me yet, so…..

BBC Radio 4 Swallows Booker’s Bait

I’ve also just spoken to Ian Marsden of the Telegraph Group once again. He assures me that my complaint about a previous article by Christopher Booker is being dealt with, and suggests that I file another one to ensure that I have “a proper audit trail” in this instance as well.

An IPSO complaints officer suggests following up our previous complaint via said complaints form, so….

Them:

We’ll keep you posted!

Shock News – IJIS Arctic Sea Ice Extent Lowest Ever!

You can of course argue that this is mere cherry picking on our part,  not to mention the slight economy with the truth in our necessarily punchy headline today. Nonetheless it is an actual fact that the IARC-JAXA Information System AMSR2 Arctic sea ice extent metric for February 17th 2015 reads 13,770,330 km² which is the lowest ever for the day of the year in a record going back to 2003. This follows a remarkably large fall (for the time of year) of  113,505 km² from yesterday’s reading of 13,883,835 km². Here’s our evidence:

IJIS_Sea_Ice_Extent_N_20150217

If you prefer to look at numbers instead of pictures then by all means try here instead for proof of the latest shock news from the Arctic.

If instead you prefer moving pictures, here’s an animation based on high resolution AMSR2 data from the University of Hamburg that may provide a few clues about how all this came about:

Can you see how the recent storms in the North Atlantic have “pulled” and then “pushed” the sea ice to thisese new record lows?

Please also note this warning message on the IJIS “Arctic Sea Ice Monitor” web page:

Thank you for visiting our website.

This site will be closed on February 22, and might be unstable from February 15, 2015.

New sea ice monitor website will be coming soon. Stay tuned.

Meanwhile, almost equivalent information can be available at:

JAXA:

http://kuroshio.eorc.jaxa.jp/JASMES/daily/polar/index.html
http://kuroshio.eorc.jaxa.jp/JASMES/climate/index.html

NIPR: National Institute of Polar Research , Japan

https://ads.nipr.ac.jp/vishop/vishop-monitor.html?N
https://ads.nipr.ac.jp/vishop/vishop-extent.html?N
https://ads.nipr.ac.jp/vishop/data/graph/Sea_Ice_Extent_N_v2.png
https://ads.nipr.ac.jp/vishop/data/graph/Sea_Ice_Extent_N_v2_L.png

New Antarctic Sea Ice Resources

In the Arctic the refreeze is slowing down as the March maximum extent approaches. Meanwhile in the southern hemisphere Antarctic sea ice extent has taken a tumble as the annual minimum extent approaches.

Over the long cold Arctic winter “Wipneus” of ArctischePinguin fame has been porting his northern hemisphere regional sea ice area/extent methodology to cover the South Pole as well. We are pleased to be able to reveal the fruits of his labours on our new regional Antarctic Sea Ice Graphs page. The ultimate source of the information is the University of Hamburg’s sea ice concentration data based on a 3.125 km grid that uses data from the from the AMSR2  instrument on board the Japan Aerospace Exploration Agency’s SHIZUKU satellite. Here’s an overview of Antarctic sea ice area:

2015-02-07-Ant-Area and here’s a close up on the sea ice extent in the Bellingshausen and Amundsen Seas region, where what sea ice there is helps buttress the West Antarctic Ice Sheet:

2015-02-07-West-Extent

In future we will also be bringing you satellite images from Antarctica. By way of example, here’s the latest “Shock News!!!” from the Antarctic, courtesy of LandSat 8:

I
NASA report that:

While large icebergs calve regularly from fast-flowing ice shelves in West Antarctica, the coast of cooler, drier East Antarctica tends to be less active. That made it a mild surprise when a 70-square-kilometer chunk of ice broke off from the King Baudouin Ice Shelf in January 2015. The last time that part of King Baudouin calved such a large iceberg was in the 1960s.

and you can track the current position of the latest large chunk of ex ice shelf on their WorldView web site:

The recently calved King Baudouin Ice Shelf on February 3rd 2015

Thanks also to “Arcticio” from the Arctic Sea Ice Blog who pointed me in the direction of PolarView, where it was remarkably easy to locate this Sentinel-1A synthetic aperture radar image of the large iceberg in question on January 30th 2015:

RoiBaudouin-600

A Few Players Short of a Great Green Con Surf Team

Shock News! Over in the denialosphere at the (un)Real Science blog I’ve been challenged to yet another Arctic sea ice bet. This one now seems to be signed and sealed, but will probably have to wait a few years before it is delivered:

Them:

Have you come up with the terms of our bet yet? I have yet to find one single alarmist willing to bet their house on an ice free Arctic at any time over the next 20 years, I may have to extend to 30 years, though the amount of cigarettes I smoke, I doubt I will be around that long.

Us:

Having personally discussed the matter with Rear Admiral Jon White:

http://econnexus.org/the-economist-being-economical-with-the-truth-about-climate-change/

and having since publicly stated that I’m more pessimistic than him, how about $1000 in favour of ShelterBox on CT area < 1 mio square kilometers by the summer of 2022 at the latest?

Them:

$1000 on CT area being less than 1 million square kilometres at some point between now and 2022 sounds fine to me, we have a bet. Remember, this is where to send your $1000

http://www.chas.org.uk/how_we_help_families/our_hospices/rachel_house

Meanwhile I’ve been trying to find someone, anyone, willing to don a polar bear suit and then stand up on a surf board. I have yet to find one single “skeptic” willing to accept my challenge to become part of the “Great Green Con” Arctic surf team.  First in line for an invitation was “Steve Goddard” (AKA Tony Heller):

Them:

Within a week, a cyclone will be spreading Arctic sea ice, and extent will flat line or increase.

Us:

I’m following that cyclone with much interest too Tony! What’s your Arctic surf forecast?

https://greatWhiteCon.info/2014/08/the-arctic-surf-forecast-for-late-august-2014/

Do you fancy joining the GGC team?

Them:

[Abject silence]

Meanwhile over on Twitter Matt Ridley has been having a “debate” with Bob Ward about Bob’s latest article in the New Statesman:

Us:


Them:

[Abject silence]

Whilst we wait for a “skeptic” willing to stop doing a chicken impression and start impersonating a polar bear to reveal themself, how is the surf in the Chukchi Sea coming along?  There are already some signs of a building swell to be seen. The US icebreaker USCGC Healy is currently bobbing about on a modest swell off Barrow:

Healy-20140822-1801_595

Whilst onshore a modest wave can currently be seen breaking on Barrow beach:

ABCam_20140822_1137

Here’s what that swell looks like on the WaveWatch III nowcast:

alaska.hs.h000h-20140822Meanwhile the cyclone brewing in the Arctic is now forecast to have a central pressure below 990 mb next week, by GFS at least:

gfsnh-0-114-20140822

We’ll keep you posted!

“Steve Goddard” Reveals How David Rose Misled Mail Readers!

Shock News! In an astonishing revelation over on “Steven Goddard’s” (un)Real Science blog a commenter has revealed exactly how David Rose pulled the wool over the eyes of millions of Mail on Sunday readers last September.

I was eagerly engaged in a “debate” about “The Arctic Catastrophe” with Steve/Tony and his band of merry (mostly) men when the conversation took an unexpectedly enlightening turn:

Them:

If you have eleven minutes to spare, there is a movie made of all last summer’s pictures taken by O-Buoy 7. It gives you something to compare this summer with. It is a little annoying because the ice got slushy and the camera gradually tilted. You may get a crick in your neck, if your head tilts as you watch. Finally you spend around four minutes basically looking at your feet, but the redeeming thing is that the ice cracks up and you are looking at the edge of the water. Then you fall in. You are blown south and bob about in ice-free waters briefly, before the refreeze swallows you up in advancing ice, and you get to see winter set in:

http://obuoy.datatransport.org/monitor#buoy7/movie


Us:

Caleb – Here’s an O-Buoy 7 movie I hurriedly put together in October last year, that also shows winter setting in. Since you’re evidently an “Arctic sea ice nutter” too I’d be very interested to hear your comments:

The Great White Con – Update 3 from Jim L. Hunt on Vimeo.


Them:

In that particular case you apparently did catch a reporter making a mistake. He likely took a quick glance at an extent map, and didn’t dig deeper. Some of those maps show all “extent”, even down to 15% ice and 85% water, as solid white. (For example, this map:  )

NSIDC high resolution Arctic sea ice extent visualisation on August 16th 2014

Because the map shows pure white, the reporter likely jumped to the wrong conclusion that the ice was “Unbroken.” Then it is likely a week passed between when he researched and the piece was printed, and further ice melted during that week.

It is not hard to catch the MSM making such mistakes about sea-ice. Either they are in too much of a hurry, or are lazy, or perhaps have an agenda. The best thing to do is to gently and politely educate them to what the actual facts are. In some cases they really do not know that what is solid white on the map can be as much as 85% open water in reality. Some actually appreciate you doing the research they don’t have the time (or are too lazy) to do.

But make sure you educate them with actual facts. If you feed them bull, and they catch you at it, they never forget it and very rarely forgive it, even if you confess and apologize.


Us:

I have made it my mission in life to educate all and sundry with actual facts!

If David Rose appreciates me doing all this research on his behalf he has been remarkably backward in coming forward to convey his eternal gratitude 😥


Them:

We’ll keep you posted!


The Greatest Arctic Sea Ice Prophet on the Planet?

The “Shock News” about Arctic sea ice is coming thick and fast as the 2014 melting season reaches its peak. I’ve been debating the meaning all of the various metrics with none other than my old sparring partner “Steve Goddard” AKA Tony Heller. The theory which is mine (in brief!) is that the ice is actually getting thinner and hence travelling faster. As regular Great White Con readers may well suspect by now, Steve/Tony has other ideas. Here are the edited highlights:


Them:

Steve/Tony’s latest Arctic sea ice prophecy is entitled “My Arctic Forecast“, although it’s actually his fourth of the season. Here’s his take:

Arctic ice extent will continue to decline for a couple of days, then a cyclone near the North Pole will begin spreading the ice, and the extent curve will turn back towards the median.

The minimum this summer will likely be close to the 2006 minimum, which was the highest minimum of the past decade.


Us:

My latest Arctic forecast is more short term than yours Tony, and rather more precise too.

https://archive.today/YpoRm#selection-3929.0-3941.25

“CT area decline of around 180 k over the next two days”. I guess that equates to “CT Arctic sea ice area will reverse and then decline for a couple of days”?


Them:

Gutsy to go with a forecast, but then the great ones risk it to gain the glory.


Us:

Many thanks for your kind words Phil.

Time passes……

CT Area has just come in at 44,288 square kilometers below yesterday. The “turn on the proverbial dime” has come to pass, and there is only another 135,712 to go!


Them:

CT doesn’t measure extent. This post is about extent. Stop being a moron and wasting my time.

Time passes……

icecover_15_20140414I do appreciate you demonstrating so graphically the dissonance and dishonesty of climate alarmists.


Us:

The pleasure is all mine Tony.

I’ve asked this before without receiving an answer, but is there any way for commenters on here to include an image?

Failing that is there any way you might be willing and able to display the graph at my JAXA link here?

JAXA_Ice_Extent_20140801

Time passes……

Whoops! The decline was a mere 129,850  🙁


Them:

DedaEda says: August 1, 2014 at 2:48 pm

You do have a working knowledge of English. Congratulation!


Us:

Thanks for your kind words DedaEda, once again.

A new month means some masks have changed, so the GWC patent pending crystal ball is cloudier than usual. Undaunted the CT oracle hoarsely whispers “Expect a couple more 100 k declines next. Around 225 k in total”


Them:

We’ll keep you posted!

Shock News! Breathtakingly Ignorant Deranged Blogger Batting 1,000 This Summer

Tony Heller (AKA Steven Goddard) has just posted a new article on his (un)Real Science blog. I’ve shamelessly plagiarised the title!

Shock News : Breathtakingly Ignorant Deranged Blogger Batting 1,000 This Summer

Them:

I also have been forecasting for the past three years that the amount of multi-year ice in the Arctic will increase, during a time when Arctic experts were predicting an ice-free Arctic

Why I Expect MYI To Increase Over Last September | Real Science

The difference between my approach and that of Arctic experts, is that I use the scientific  method. They rely on superstition about a harmless trace gas. Real Science always beats superstition.

Steve/Tony was good enough to provide me with a link to his new post immediately following its publication, so I was lucky enough to be able to post the very first comment:

Us:

2014-07-30_1114_RealScience

Them:

Jim, thank you demonstrating once again that you and your ilk are complete morons.


Us:

My pleasure Steve/Tony.


Them:

Take a good long look through the archive footage linked to at the top. Try not to inadvertently end up on (un)Real Science!


Us:


Them:

We’ll keep you posted!


Does Tony Heller Need To Be Prosecuted?

In some recent shock news over at the “Real Science” blog “Steven Goddard” asked “Who is Steven Goddard” and then answered himself as follows:

My name is Tony Heller. I am a whistle blower. I am an independent thinker who is considered a heretic by the orthodoxy on both sides of the climate debate.

I’m highly unorthodox, so I’ll consider him as a schizoidal cherry picking pseudo-skeptic instead. Steve/Tony finishes his “coming out” article as follows:

I am more than happy to debate anyone who feels up to the challenge, including the President of The United States. Science works through research and debate – not censorship, propaganda, faith, or intimidation.

Steve/Tony has been blogging about Arctic sea ice again recently. His most recent post is entitled “Does The Arctic Need To Be Prosecuted?“, but it seems he’s unwilling to engage in debate about that topic with me.

Them:

Some climate experts want to make skepticism of junk science a felony, and every day it becomes more clear that the Arctic has no respect for climate models or eminent government scientists. This is shocking, and it is time for the Arctic to be prosecuted. The Arctic is aiding and abetting climate deniers, as well as making obscene gestures towards the world’s leading academics.

DMI "new" Arctic sea ice extent graph on July 26th 2014

DMI “new” Arctic sea ice extent graph on July 26th 2014


Us:

Needless to say Steve/Tony has yet to approve my comment on his ruminations, which reads as follows:

2014-07-26_1314_RealScienceThis is what the Cryosphere Today graph of Arctic sea ice area I linked to looks like at the moment:

Cryosphere Today interactive Arctic sea ice area graph on July 26th 2014

This is what the NORSEX extent chart that Eliza linked to looks like this morning:

NORSEX SSM/I Arctic sea ice extent graph on July 26th 2014

Here’s another one for good measure, this time showing NSIDC Arctic sea ice extent:

NSIDC interactive Arctic sea ice extent graph on July 26th 2014

As far as I am aware there is no law against being a schizoidal cherry picking pseudo-skeptic in the United States of America, or anywhere else for that matter. Please feel free to comment below if you know otherwise and/or think that there should be!


Them:

After a protracted exchange on Twitter a copy of my comment eventually saw the light of day:


Us:

We’ll keep you posted!