Tag Archives: Santa Claus

Facts About the Arctic in December 2023

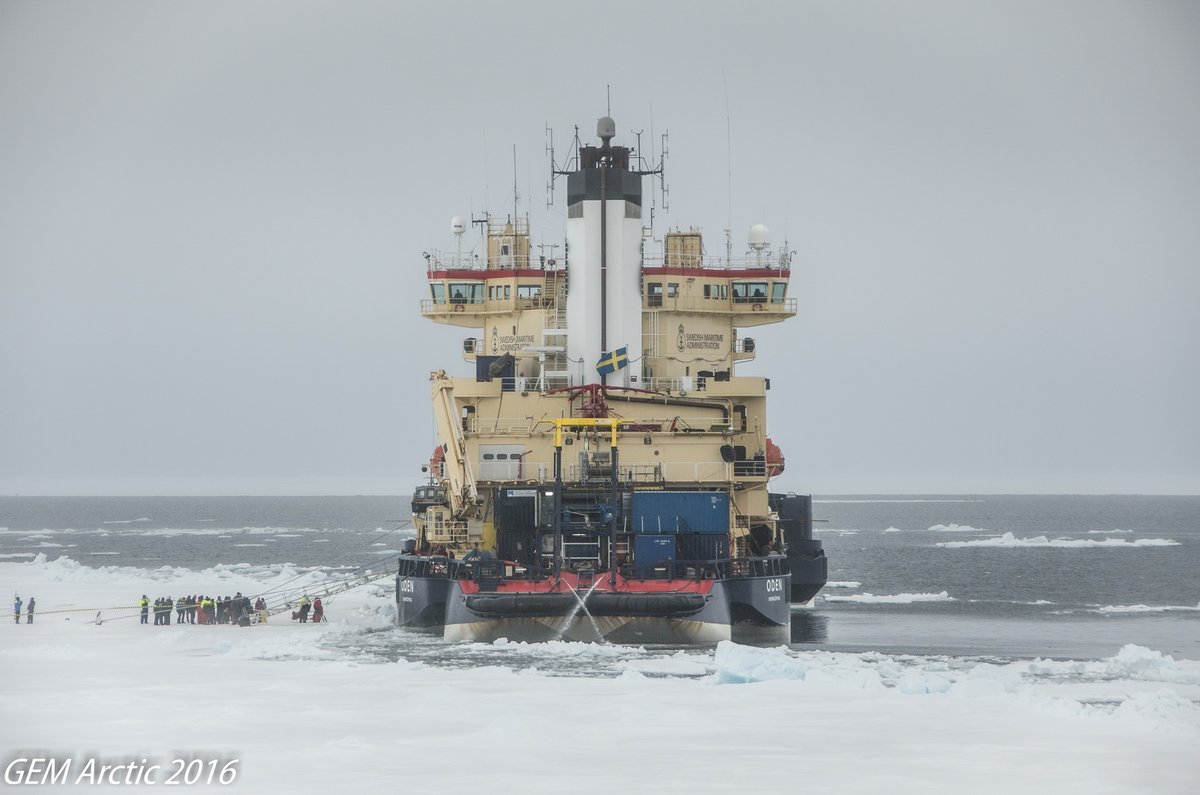
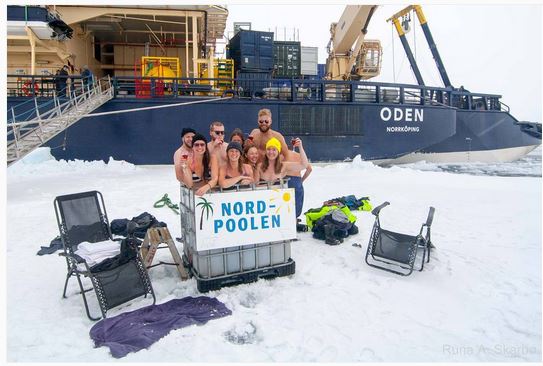
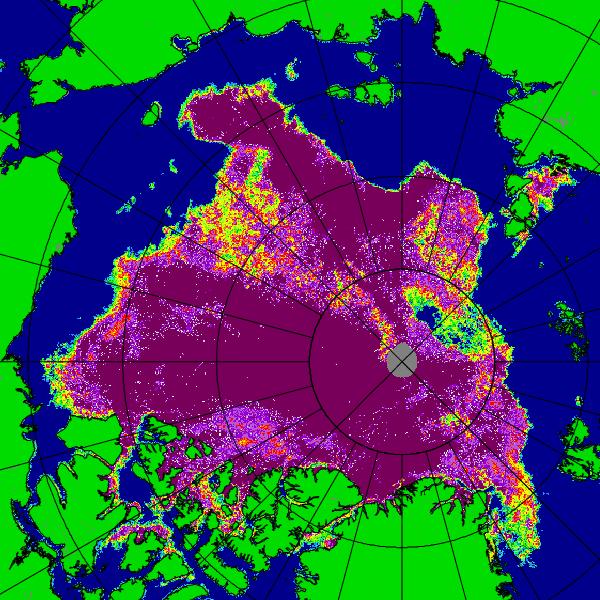
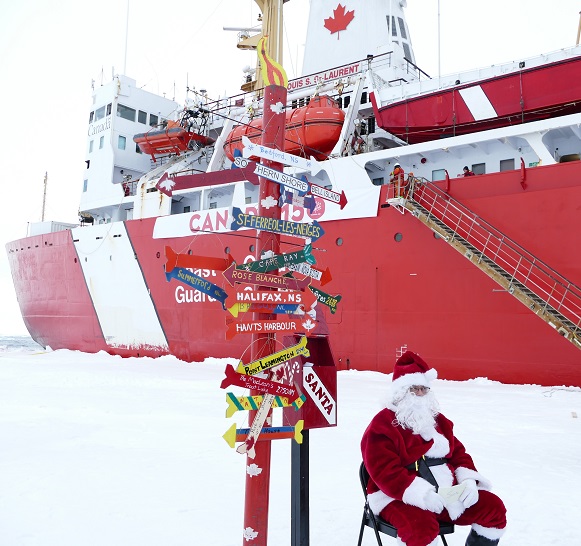
Christmas is rapidly approaching, and Santa and Snow White send festive greetings to one and all from the North Pole:

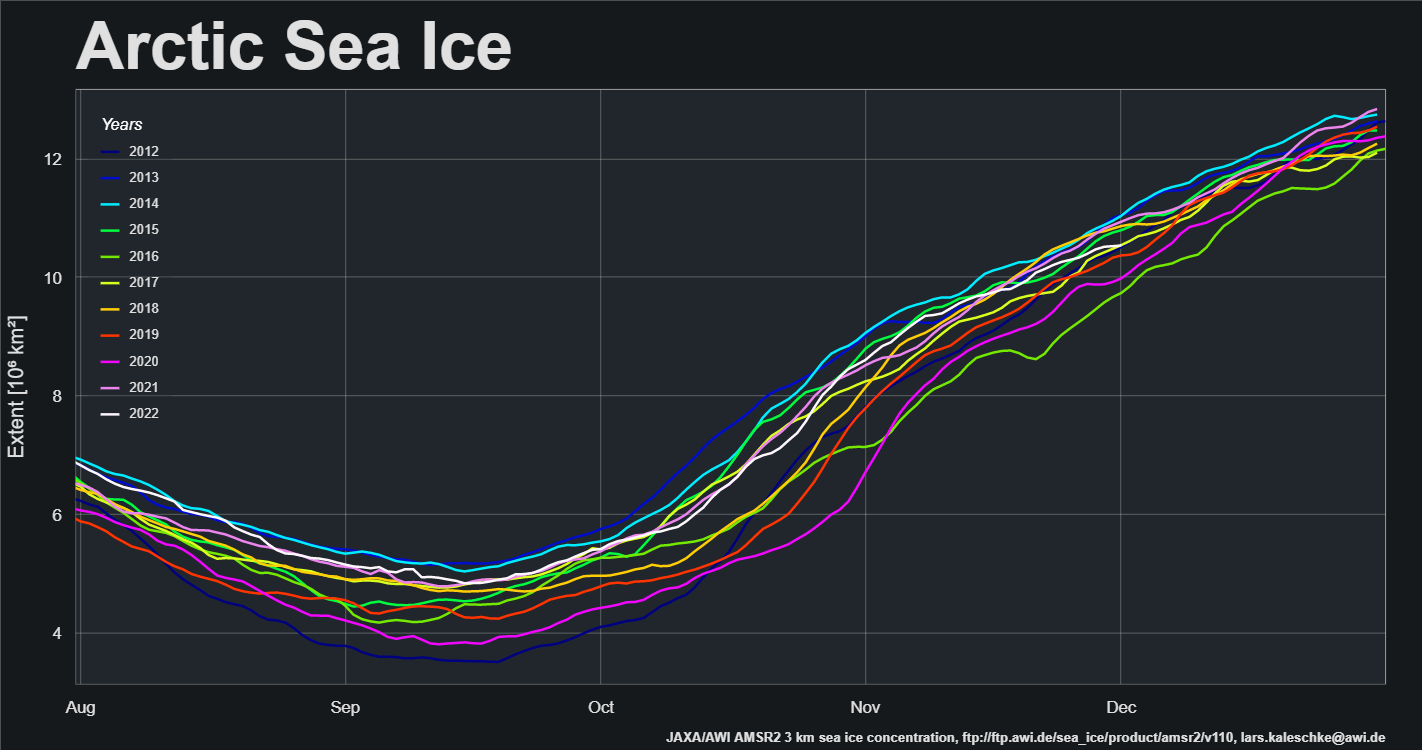
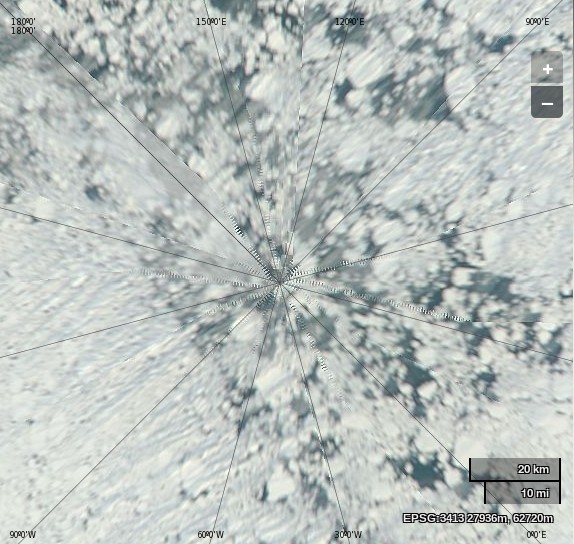
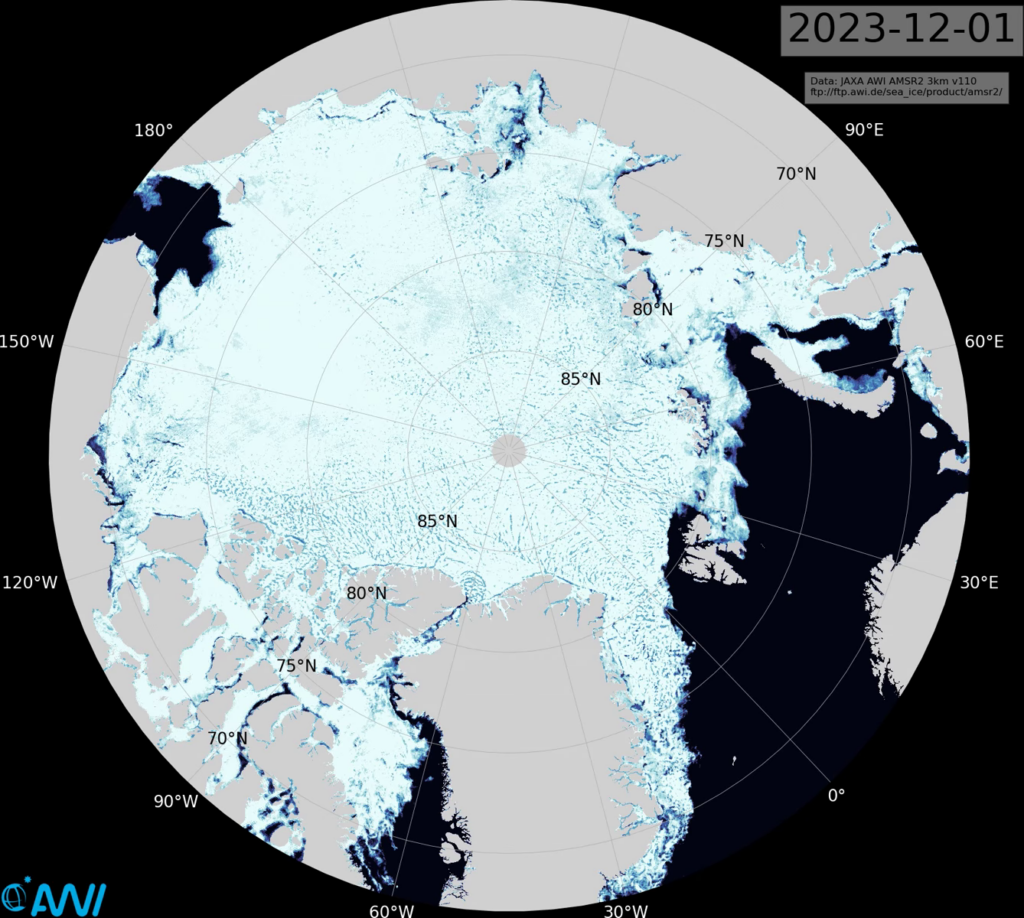
JAXA extent currently seems to be stuck on December 17th, but here’s how it looked a couple of days ago:

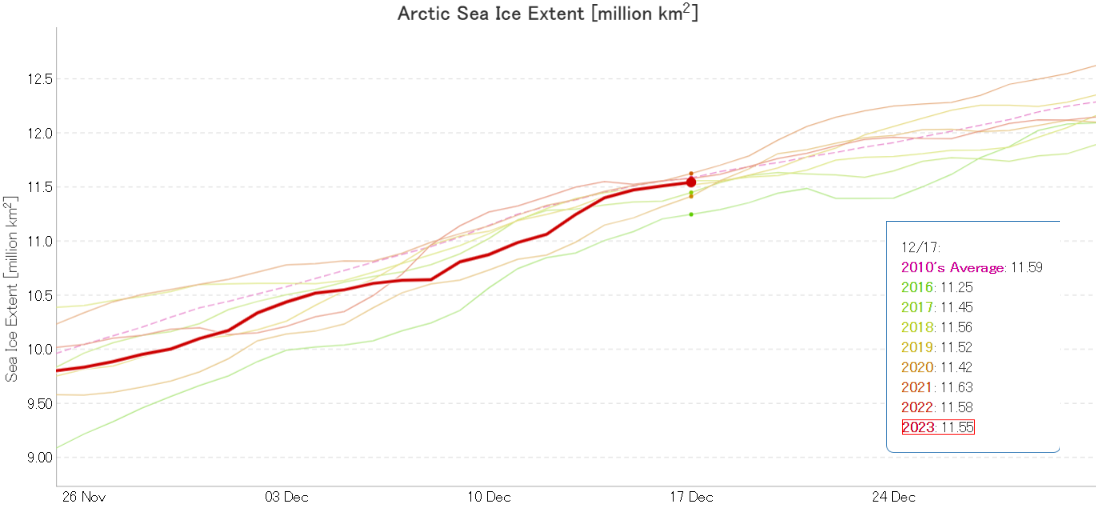
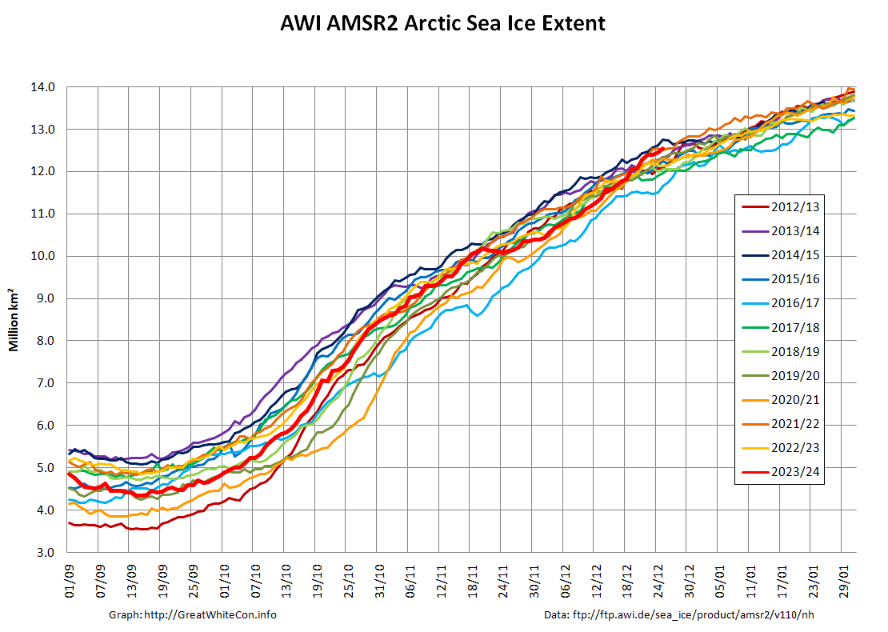
Having been comfortably in 3rd lowest position in the satellite era a few days ago, AMSR2 extent is now 5th lowest and very close to the 2010s average for the date.

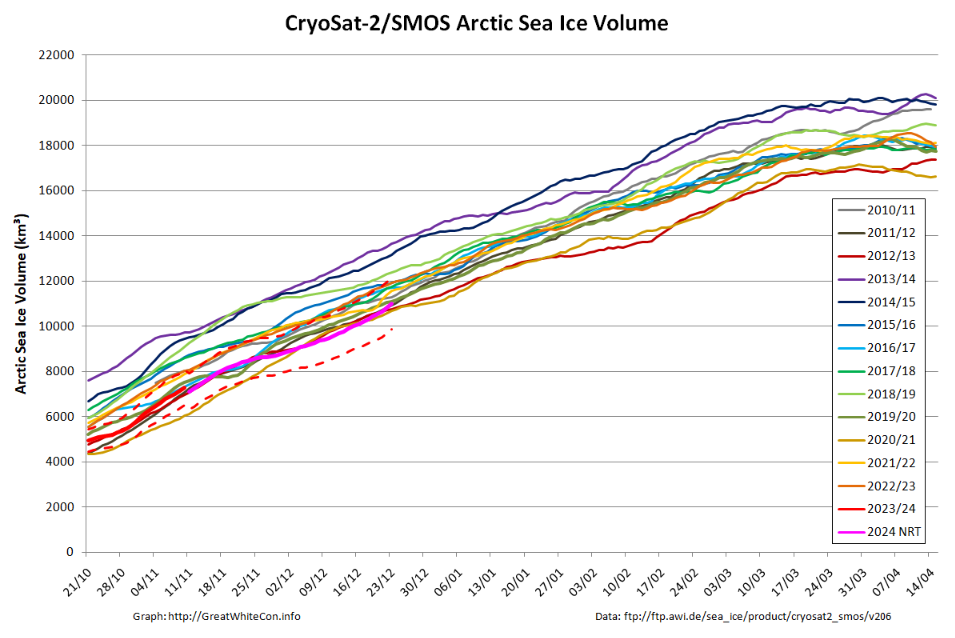
The Alfred Wegener Institute have been releasing reanalysed CryoSat-2/SMOS merged thickness data for a few days, and here is the resulting Arctic sea ice volume chart:

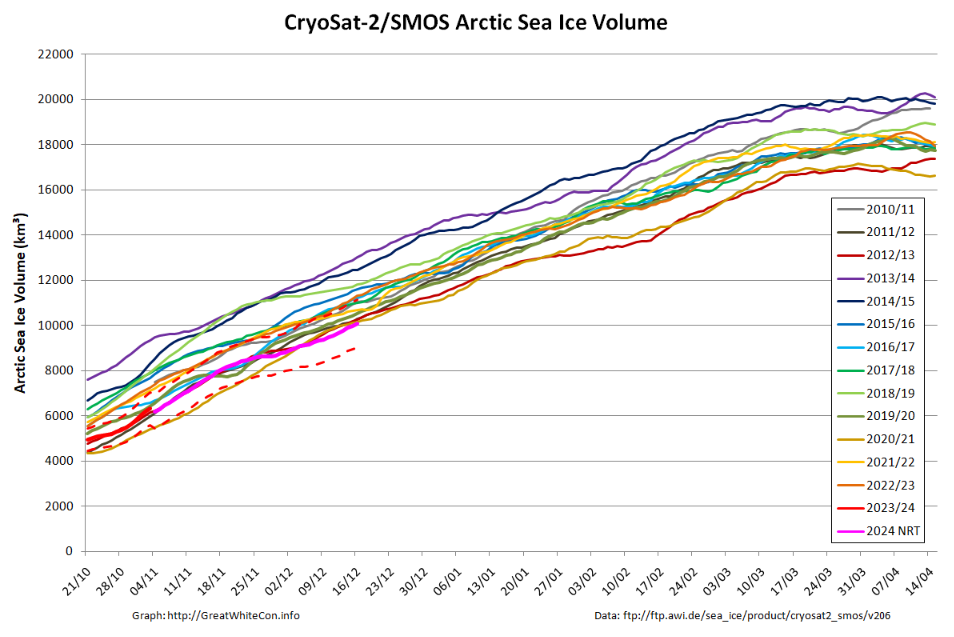
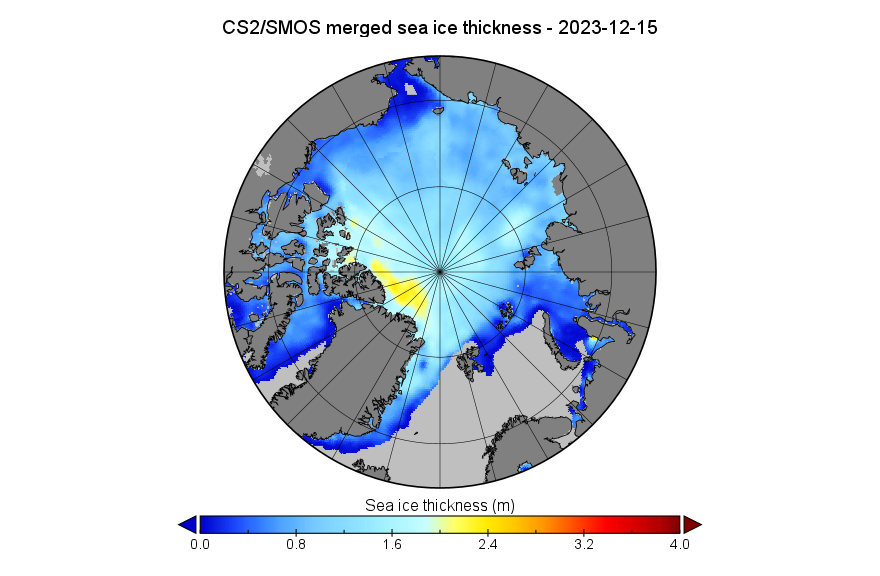
Near real time volume is currently lowest for the date in the CS2 record, but is likely to be revised upwards when the reanalysed data is eventually released. The associated NRT thickness map looks like this for December 15th:

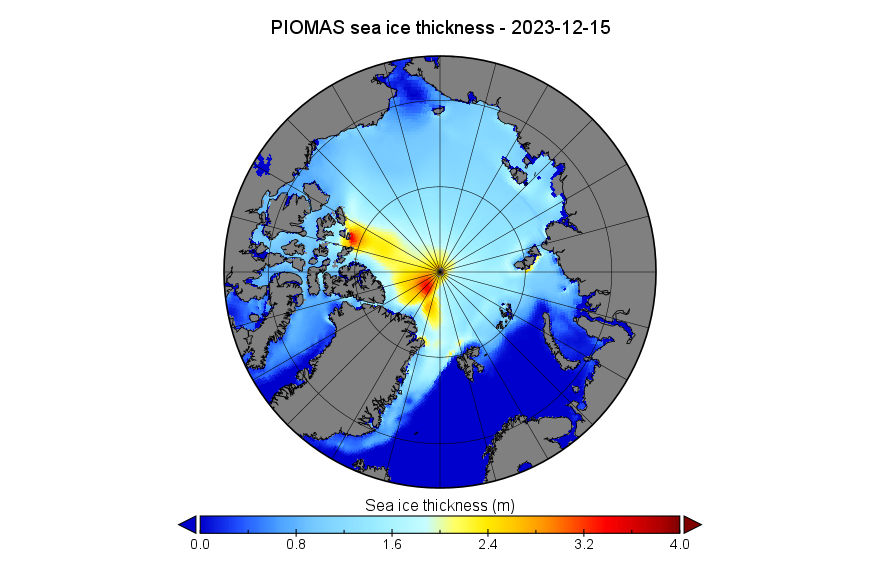
The mid-month PIOMAS modelled gridded thickness data has also been released. The calculated volume is 5th lowest in the satellite era:

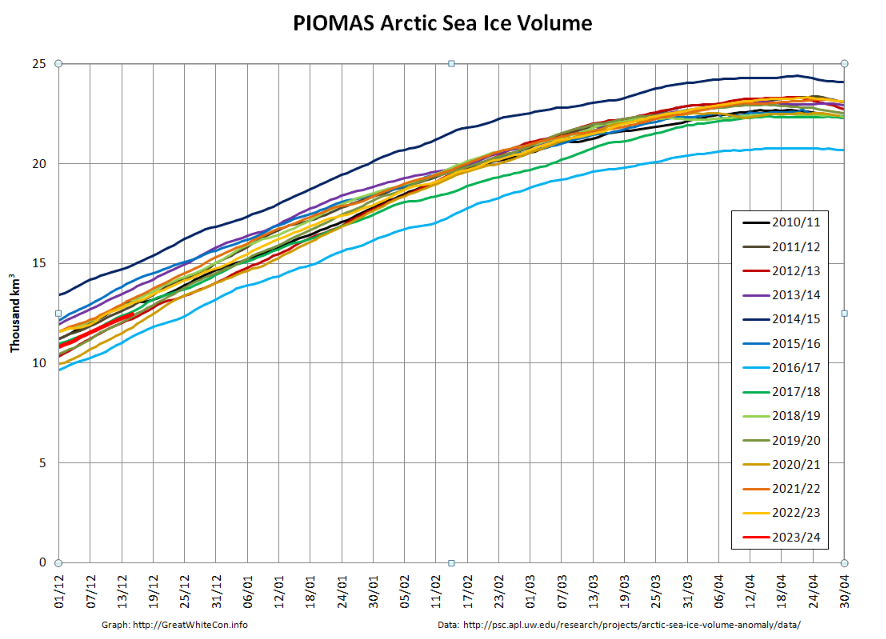
Here too is the PIOMAS thickness map for December 15th:

[Update – December 24th]

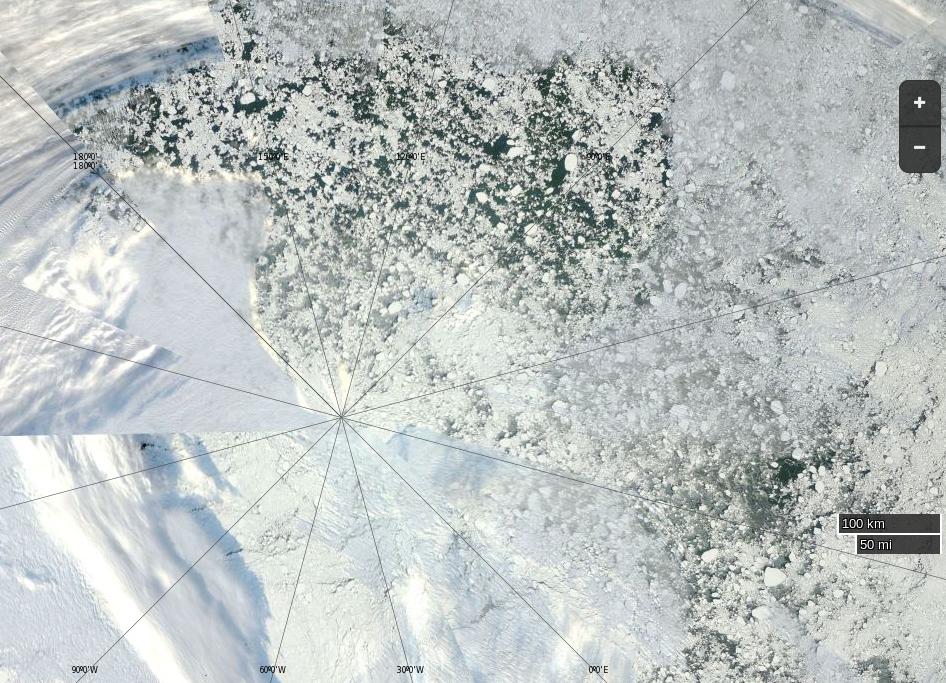
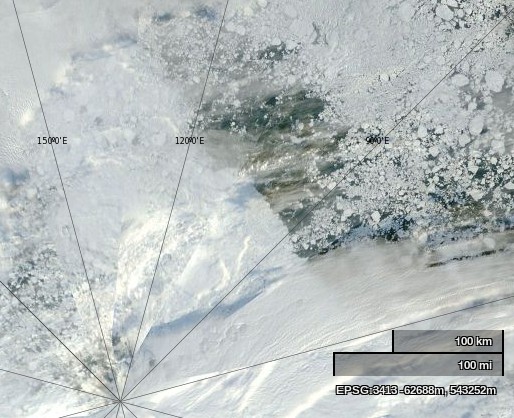
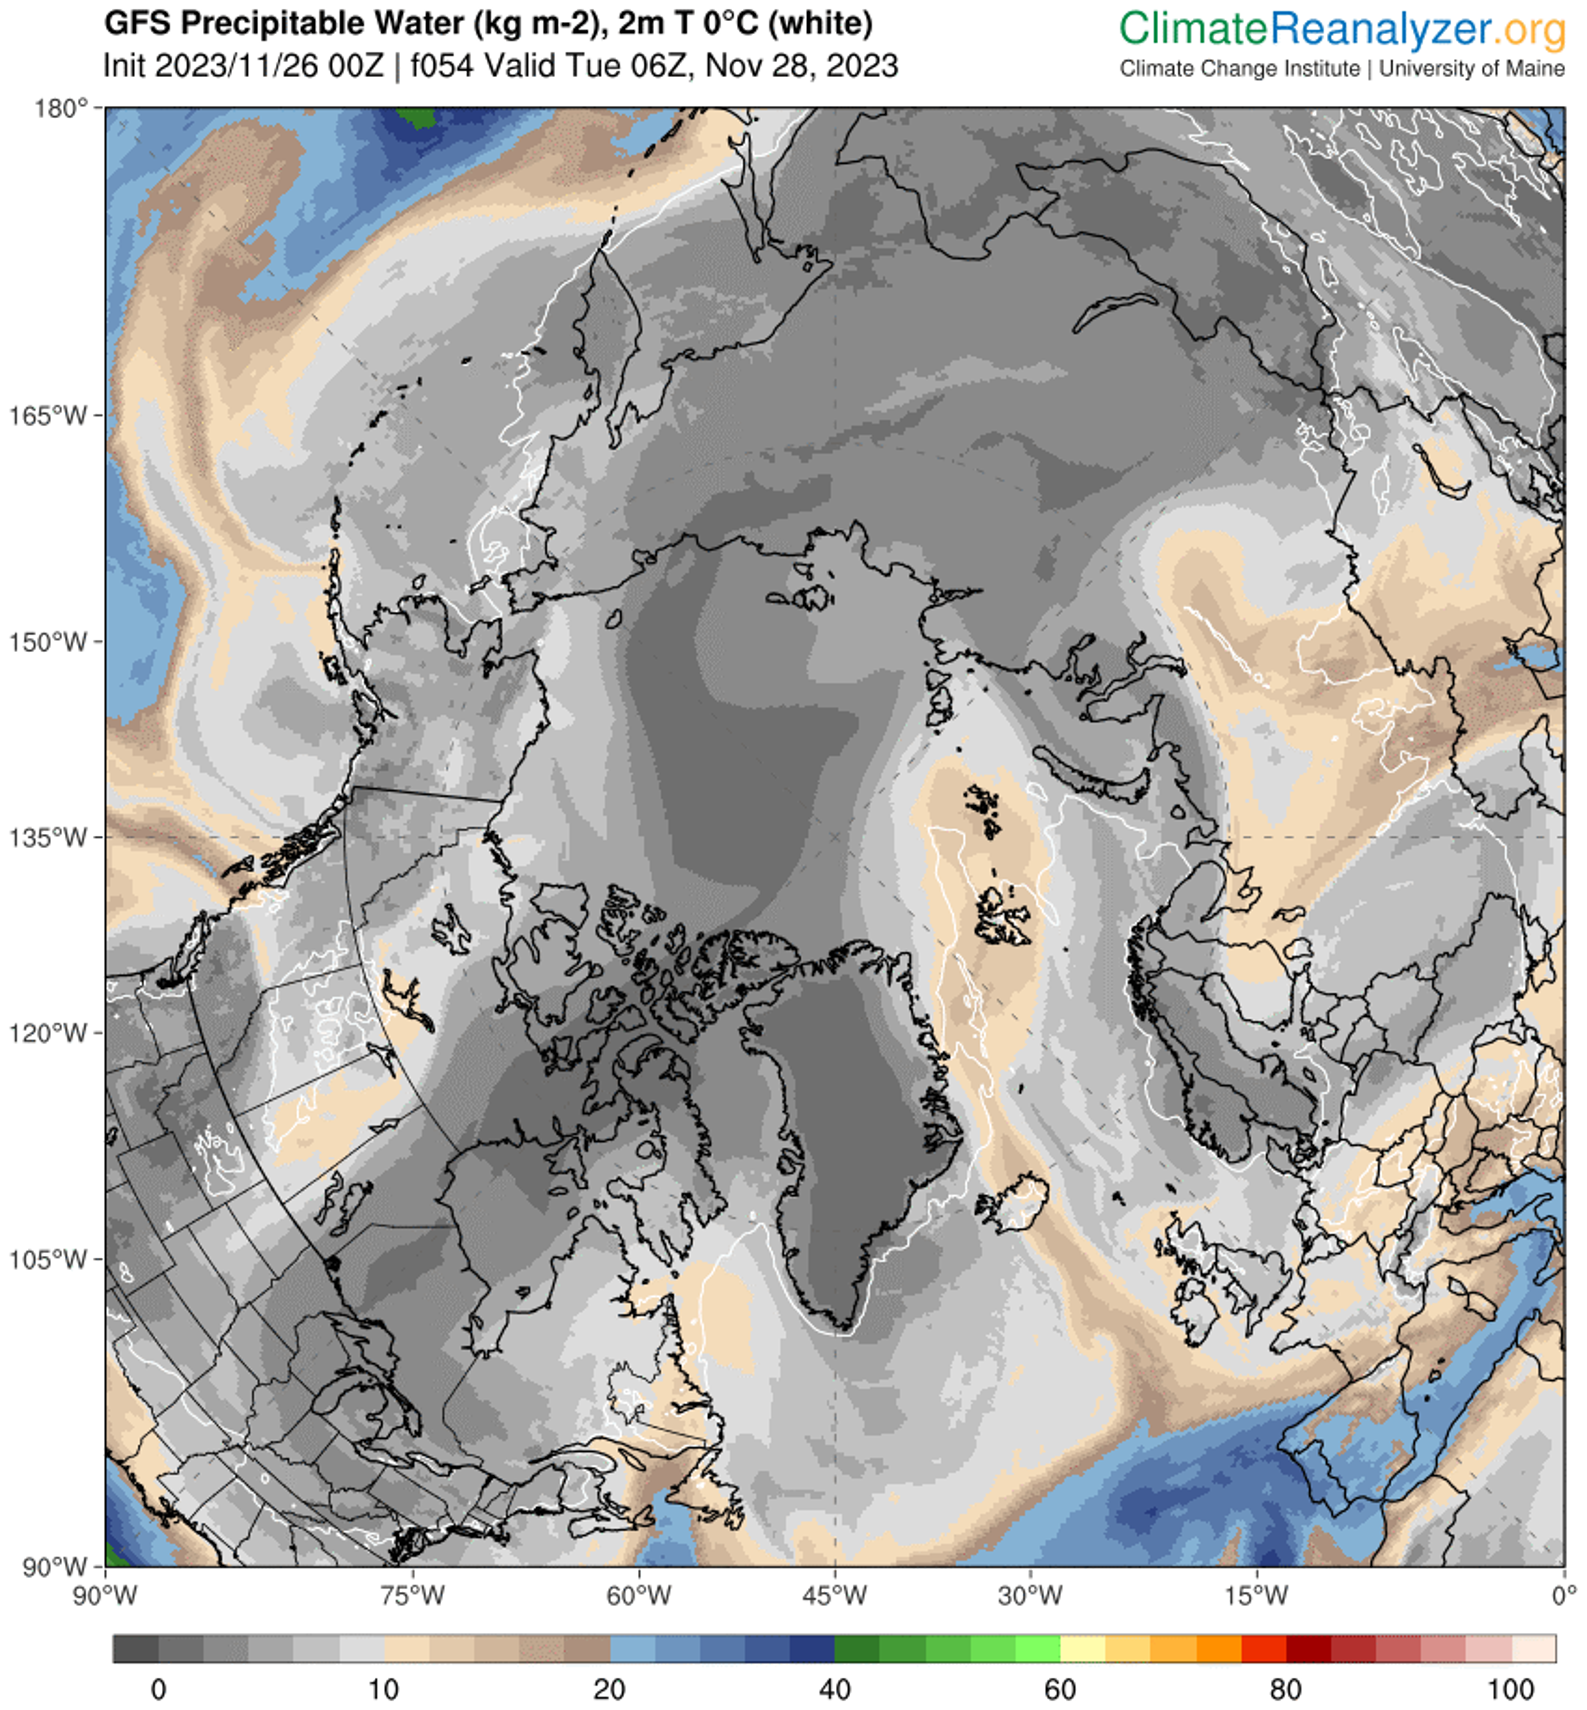
Merry Xmas everyone, especially Matt! Here’s a couple of images from the National Snow and Ice Data Center’s latest edition of Arctic Sea Ice News. In the short term sea ice is always melting somewhere:

From November 21 to 28, a series of three extratropical cyclones followed a common track from the northeast coast of Greenland eastward along the northern edge of the Barents, Kara, and Laptev Seas. As each storm moved into the Arctic Ocean, it merged with its predecessors, creating a persistent cyclonic (counter clockwise) wind regime. The first and third of these storms originated in the Icelandic Low region before migrating up the east side of Greenland. The second storm originated just north of Greenland. Simultaneously, a center of high pressure developed over the ice-free part of the Barents Sea, becoming especially strong on November 26 to 28.

This combination of persistent low pressure to the north and west of Svalbard and a high-pressure center to the southeast created a strong, persistent flow from the south of relatively warm and moist air from the North Atlantic Ocean toward Svalbard, which then turned eastward along the marginal ice zone. This is seen as an extension of an atmospheric river into the Arctic. Atmospheric rivers are long narrow corridors that carry a large amount of water vapor. A recent study suggests that atmospheric rivers lead to ice loss by transporting warm, moist air into the Arctic that can limit sea ice growth. This is consistent with the observed pause in seasonal ice growth in late November.

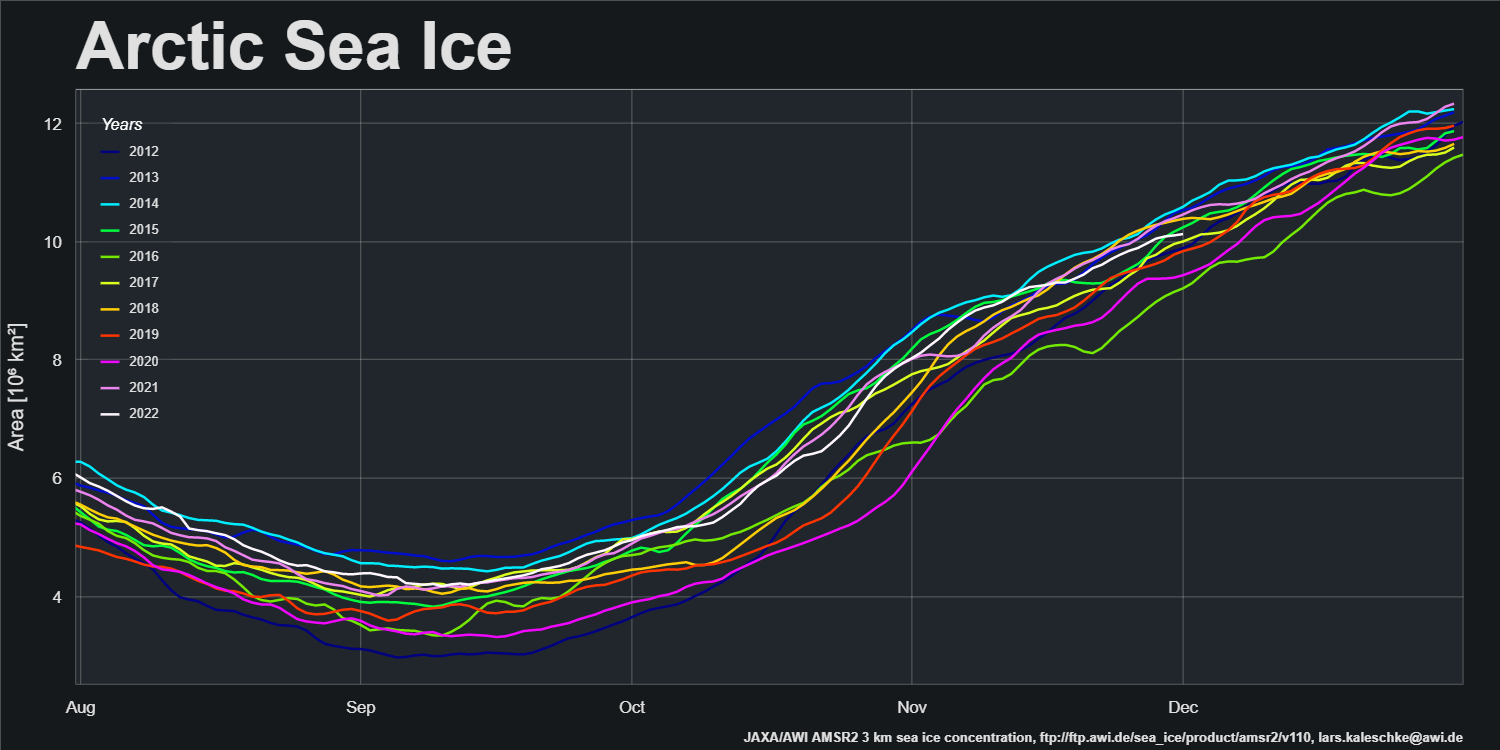
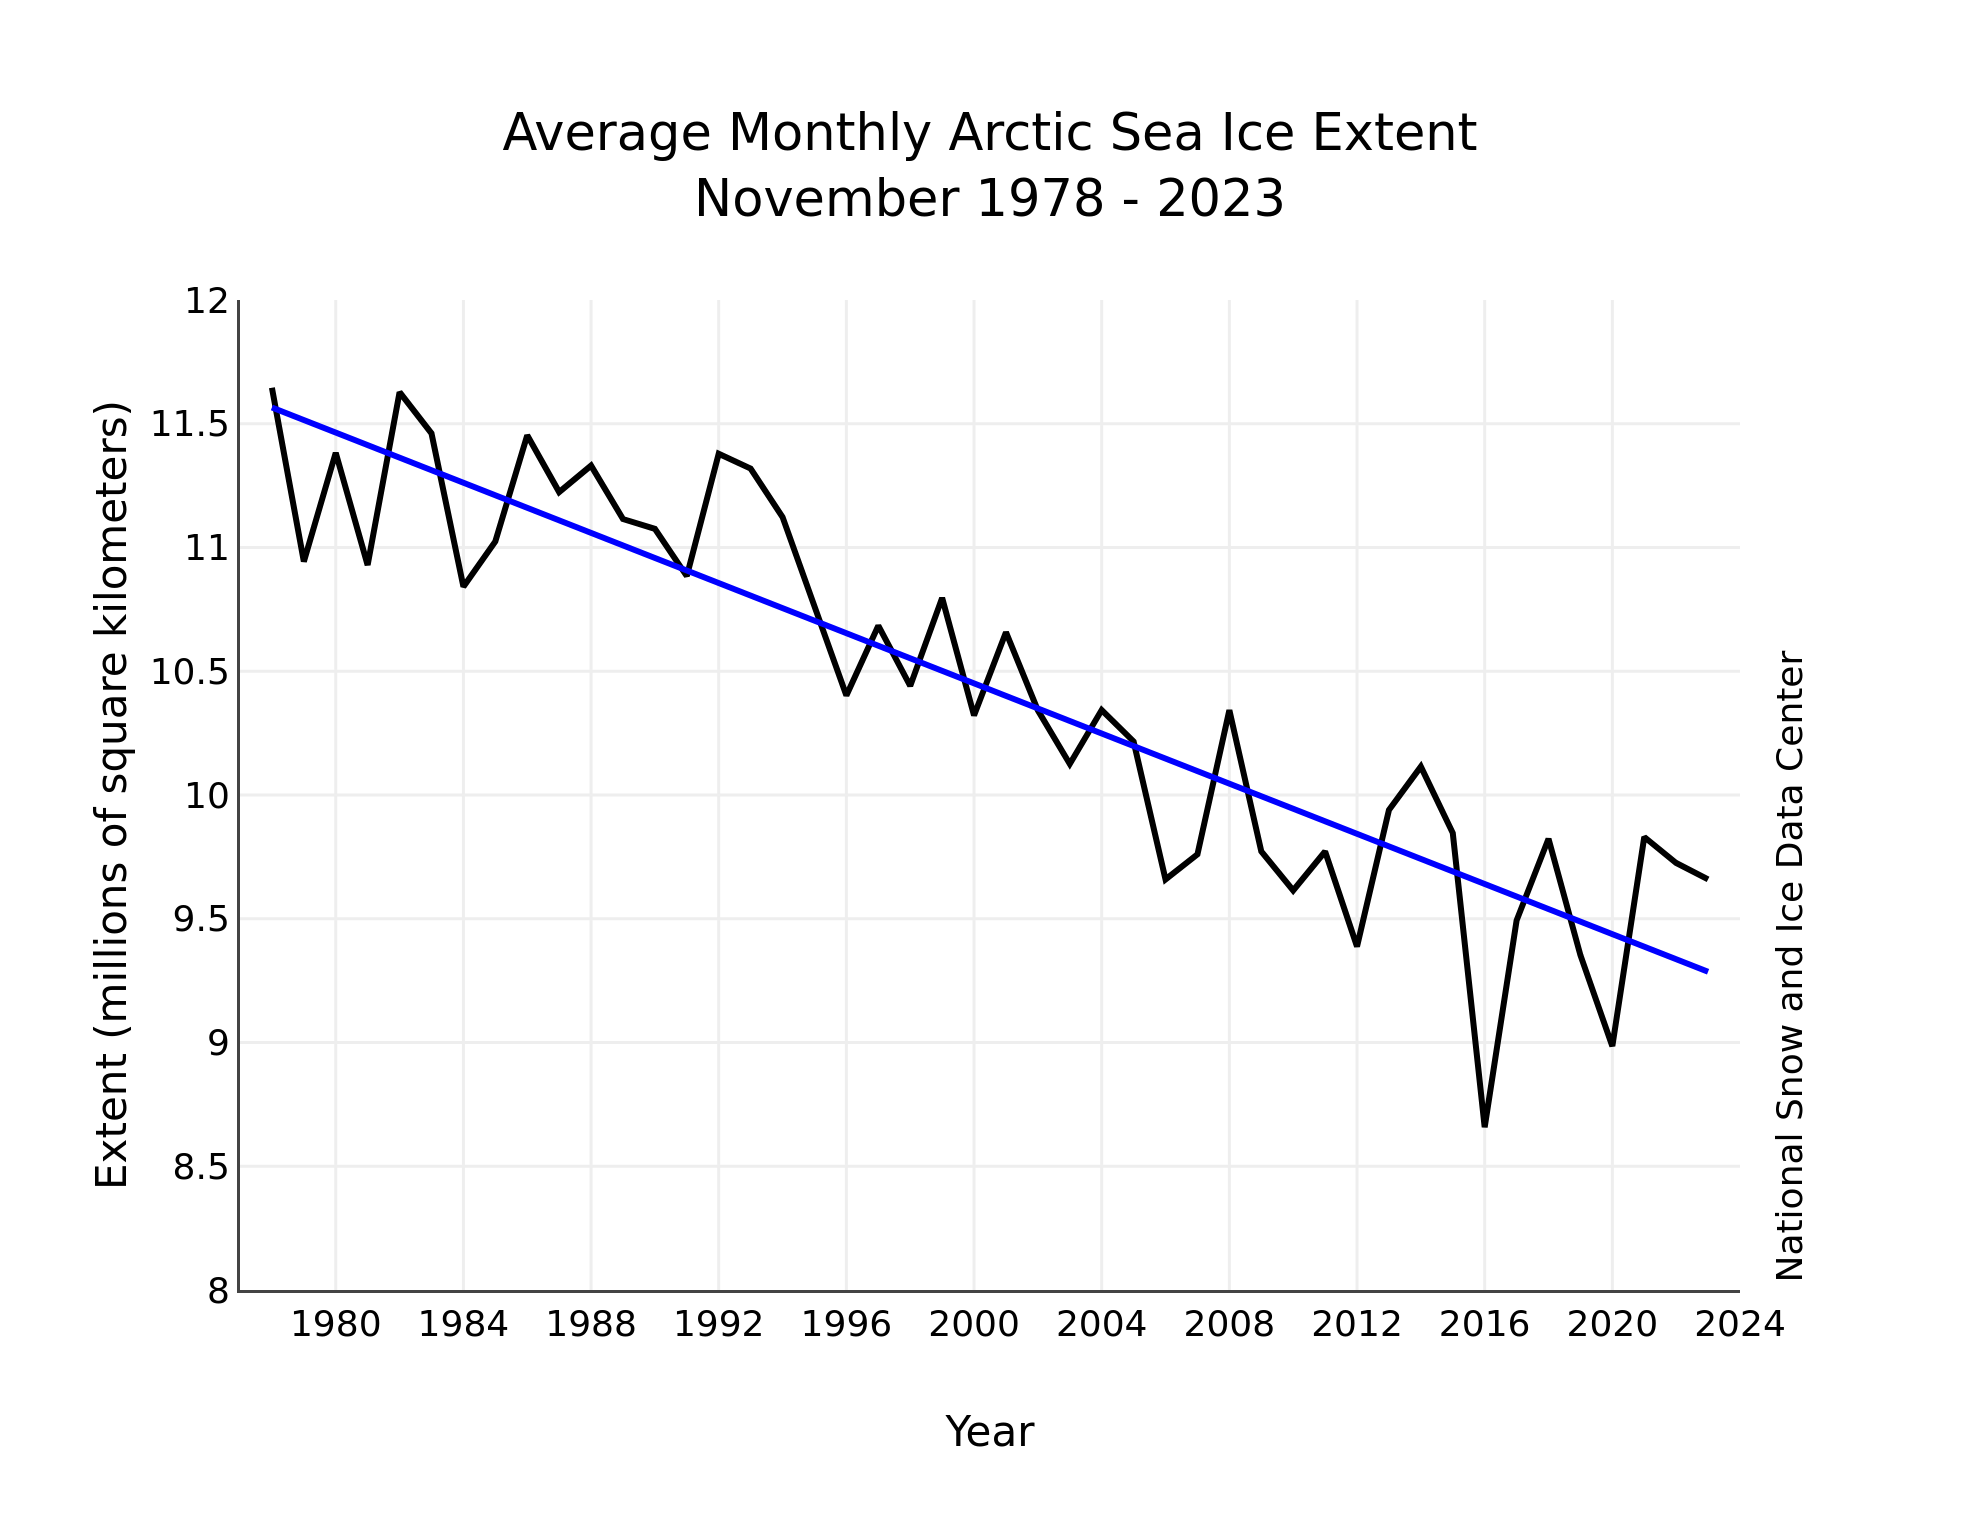
And over the longer term:

[Update – December 26th]

From being near the bottom of the recent pack at the end of November, Arctic sea ice extent is now edging towards the top of the 2010s range. Here’s the AWI high resolution AMSR2 metric:

However sea ice volume has not followed suit, and remains near the bottom of the range:

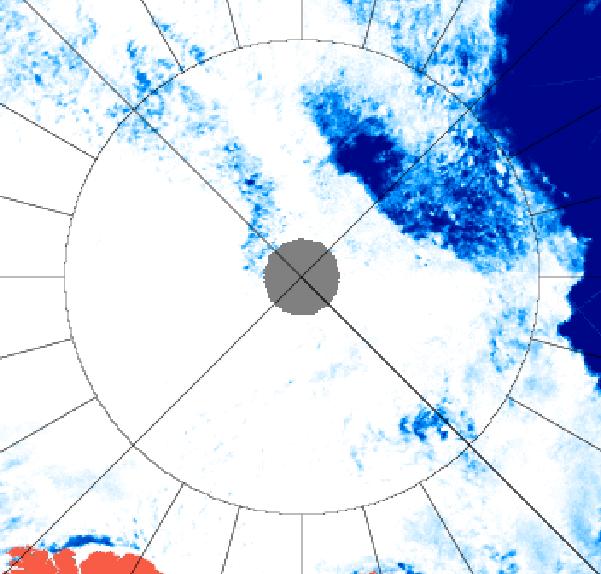
Here’s an animation of sea ice motion over the last month, revealing amongst other things the recent rapid refreeze of the Chukchi Sea (click to animate):

[Update – December 29th]

Matt is getting very excited about the allegedly “high Arctic sea ice extent” over on XTwitter. So is Tony Heller, although he has also helpfully provided convincing empirical evidence that the IPCC’s global warming “predictions” are correct!

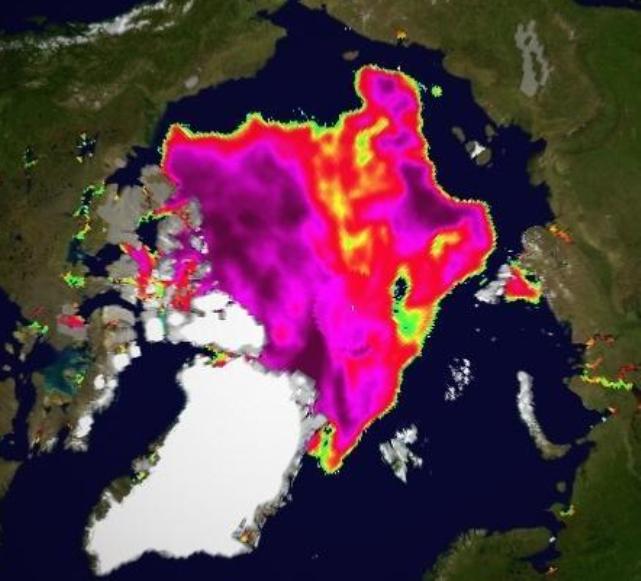
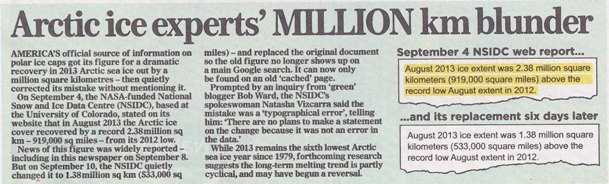
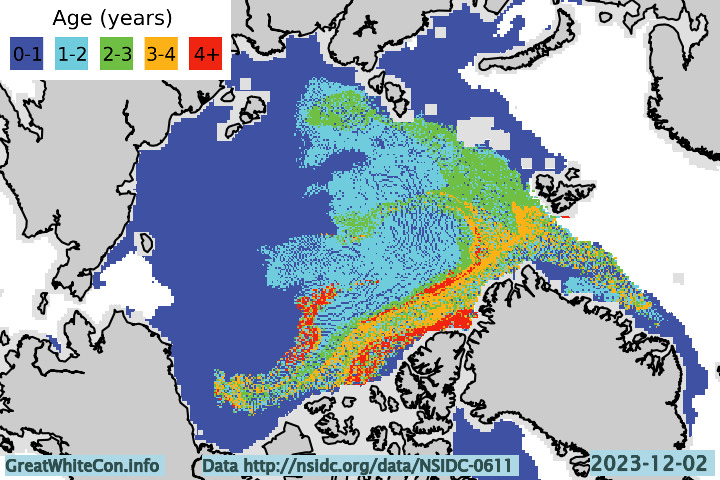
However neither of them seem to be at all interested in the age of Arctic sea ice. Here’s the early December update:

Drifting off topic only slightly, whilst perusing social media I also found this animation from Kev Pluck highly amusing:

https://twitter.com/kevpluck/status/1740174122850930979

The conversation continues on the New Year 2024 open thread.


Facts About the Arctic in December 2022

A new month is upon us and Christmas is coming! Here’s another look at Lars Kaleschke’s high resolution AMSR2 area and extent graphs for the Arctic as a whole:

Extent increase stalled for the last few days of November, and as a result extent is now in a “statistical tie” with 2017 for 4th lowest extent for the date in the AMSR2 record.

Continue reading Facts About the Arctic in December 2022

Santa Extends His Secret Summer Swimming Pool

The Swedish icebreaker Oden and the Canadian icebreaker Louis S. St. Laurent recently met up at the North Pole on a joint scientific expedition. To be more precise the Oden’s Captain’s log recorded her position at 11:03 UTC on August 22nd as N 89° 59,998´ W 046° 40,558´.

Take a look at who was waiting for them:

santa-pole-201608

and then take a look at his newly extended swimming pool:

oden-pole-20160828

What could be more refreshing after a long voyage than a quick dip followed by a Piña colada by the pool?

swim-pole-201608

Santa’s secret summer swimming pool is obviously big enough this year to accommodate all the icebreakers and nuclear submarines on the planet. All his little helpers have a giant pool of their very own too:

NASA Worldview “true-color” image of the North Pole on September 8th 2016, derived from the MODIS sensor on the Terra satellite

Santa’s Secret Summer Swimming Pool Revisited

Regular readers may recall that way back when in September 2013 we wondered why David Rose hadn’t seen fit to reproduce any visualisations of Arctic sea ice concentration in a previous article about Arctic sea ice, particularly when his source materials from the NSIDC contained some very nice examples.

Today we are pleased to be able to inform you that David has now followed our long standing advice, and his article in the Mail on Sunday  yesterday included two such “stunning satellite images”. Of course they are not really “photographic” images, any more than the visualisations of Arctic sea ice extent that David was so keen to show his loyal readers last time around were. Unfortunately David neglected to include a “stunning satellite concentration visualisation” for August 25th 2013 in yesterday’s article. We are pleased to be able to help correct that no doubt inadvertent oversight, albeit somewhat belatedly, with the able assistance of the Department of Atmospheric Sciences at the University of Illinois and their Cryosphere Today web site:

Cryosphere Today Arctic sea ice concentration on August 25th 2013

Paraphrasing David Rose’s article yesterday, can you see all the yellow and green areas denoting regions where the ice pack is least dense?

Can you see “an unbroken ice sheet more than half the size of Europe stretch[ing] from the Canadian islands to Russia’s northern shores”?

Can you see Santa’s secret summer swimming pool, just a short sleigh ride away from his natty North Pole residence?

Answers on a virtual post card please, to the address below.

How Many Subs In Santa’s Swimming Pool?

An extract from a  discussion about submarines surfacing at the North Pole, courtesy of Steven Goddard’s “Real Science” blog. One of us must be blind!

Them:

Hey spambot, what is this picture of?

USS Skate (SSN-578) made submarine history on 11 August 1958 when it became the first submarine to surface at the North Pole

Us:

It would seem to be the USS Skate on 11 August 1958 when it became the first submarine to surface at the North Pole. What is this picture of?

NASA Worldview “true-color” image of the North Pole area on September 2nd 2013

NASA Worldview “true-color” image of the North Pole area on September 2nd 2013, derived from bands 1, 4 and 3 of the MODIS sensor on the Terra satellite

Them:

Frozen ice. What is my prize?

And basically yours is just a snipe hunt. Mine disproves your hysteria.

Us:

No prize I’m afraid. The correct answer is vast areas of open ocean. Plenty of room for every submarine on the planet.

Them:

Sorry, there is no open water. Check your picture again. So you are reneging? Typical.

Us:

I have checked again, and I still see lots of open water underneath a thin veil of cloud. Perhaps you should arrange a hasty visit to an optician? Luckily microwaves can see through clouds, even if you cannot. Here’s another satellite image of the North Pole area from September 2nd 2013, this time a University of Hamburg visualisation of data from the AMSR2 sensor on board the Japanese SHIZUKU satellite.

AMSR2 image of the North Pole area on September 2nd 2013

AMSR2 image of the North Pole area on September 2nd 2013

The circle is 85 degrees North. How many subs do you suppose will fit into Santa’s secret summer swimming pool?

Them:

You have X-ray vision? I am sorry! I did not realize you were stuper girl! Want to try again? This time with normal vision.

BTW. for the SLOOOOOW learners. 85 North +/= North pole. The North Pole is WITHIN 85 North. But it is NOT 85 North.

The Skate is at 90 North. The NORTH POLE.

You may have x-ray vision, but you still cannot read a map. neither picture shows open water AT the north pole.

How many submarines are on the planet Snowy? better recheck your figures. They are not tinker toys.

Us:

You’re a hard man to please Phil! Feast your eyes on this picture instead then:

NASA Worldview “true-color” image of the North Pole area on August 28th 2013, derived from bands 1, 4 and 3 of the MODIS sensor on the Aqua satellite

NASA Worldview “true-color” image of the North Pole area on August 28th 2013, derived from bands 1, 4 and 3 of the MODIS sensor on the Aqua satellite

Them:

We’ll keep you posted!

Santa’s Secret Summer Swim

This weekend the Mail on Sunday admitted that the headline numbers in David Rose’s  “And now it’s global COOLING!” article published on September 8th were inflated by a factor of approximately two. This is how they explained that discrepancy to their faithful readers:

Scan of the bottom of page 31 in the September 29th 2013 edition of the Mail on Sunday
The bottom of page 31 in the September 29th 2013 edition of the Mail on Sunday

Can you spot the MILLION square km blunder by the Mail on Sunday? For the benefit of the scientifically illiterate amongst you I’ll explain, as I did yesterday in an email to the Mail on Sunday’s Managing Editor:

It appears that whoever writes your headlines is unaware of the difference between “A MILLION km” and “a million square km”. The former is a distance, and hence has no area. The latter IS an area.

Them:

As you can clearly see, the Mail reported yesterday that:

On September 4, NSIDC, based at the University of Colorado, stated on its website that in August 2013 the Arctic ice cover recovered by a record 2.38 million sq km – 919,000 sq miles – from its 2012 low.

News of this figure was widely reported – including by MailOnline – on September 8.

Us:

The headline of the report published on the NSIDC website on September 4th reads as follows:

A real hole near the pole

The related text reads as follows:

A large hole (roughly 150 square kilometers or 58 square miles) of near-zero ice concentration appears to have opened up at about 87 degrees North latitude. Small areas of open water are common within the ice pack, even at the North Pole, as the ice pack shifts in response to winds and currents, resulting in cracks (called leads) in the ice. The current opening seen in our satellite imagery is much larger.

and the relevant area of the accompanying satellite imagery looks like this:

University of Bremen colour visualisation of Arctic sea ice concentration for September 2nd 2013
University of Bremen AMSR2 colour visualisation of Arctic sea ice concentration for September 2nd 2013

Them:

Since the Mail’s intrepid reporter evidently read those words and looked at that picture, why on Earth do you suppose that the Mail on Sunday printed these words four days later?

Days before the annual autumn re-freeze is due to begin, an unbroken ice sheet more than half the size of Europe already stretches from the Canadian islands to Russia’s northern shores.

Even more to the point, why on Earth do you suppose that the Mail on Sunday left those words unaltered following their September 28th edit of the online version of that article?

Us:

Here’s our latest video update on the 2013 Arctic sea ice refreeze. The “Polar Polynya” is prominent by its presence, as is the broad band of open water between the “broken ice sheet” and “Russia’s northern shores”: