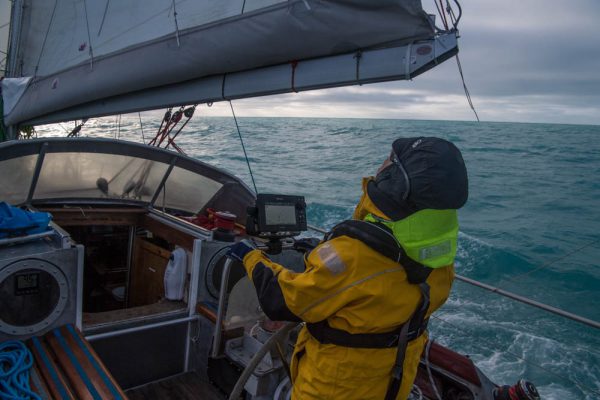
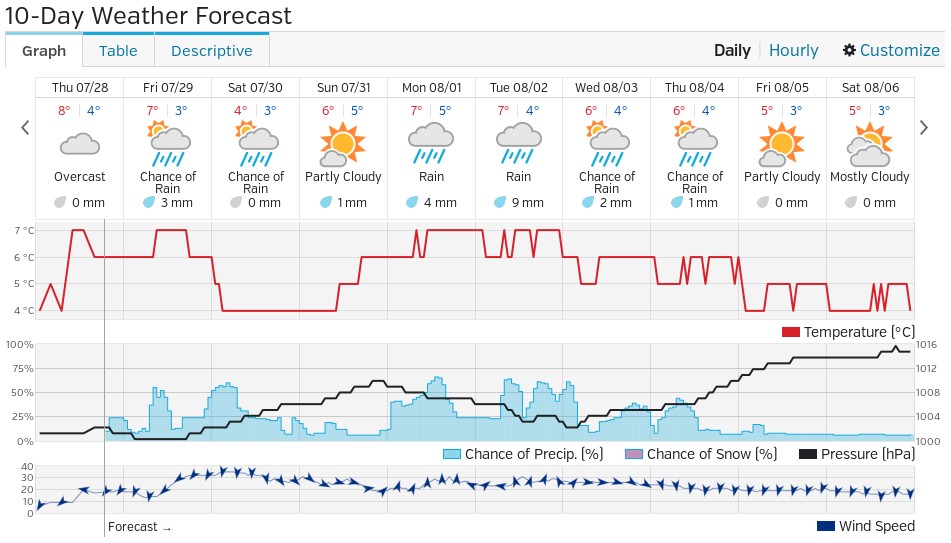
A storm is brewing in the Arctic. A big one! The crew of the yacht Northabout are currently sailing along the western shore of the Laptev Sea and reported earlier today that:
The sea is calm. Tomorrow a gale 8. But this moment is perfect.
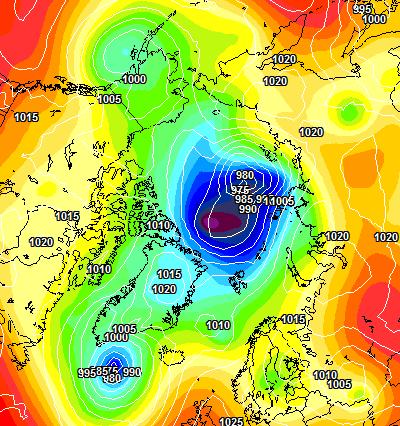
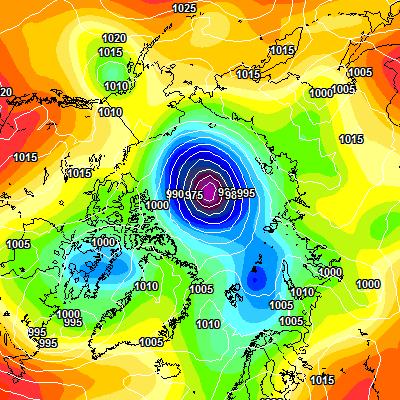
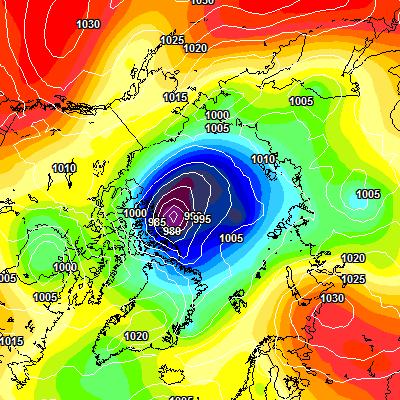
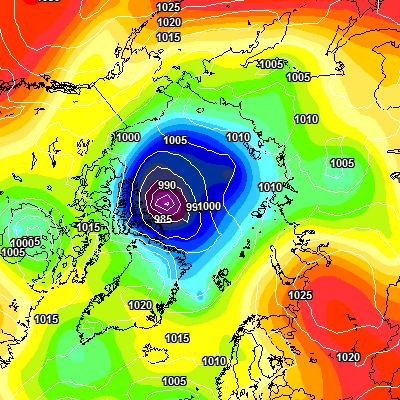
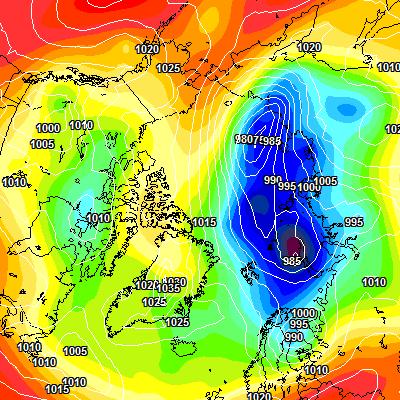
That perfect moment will not last long. Here is the current ECMWF forecast for midnight tomorrow:
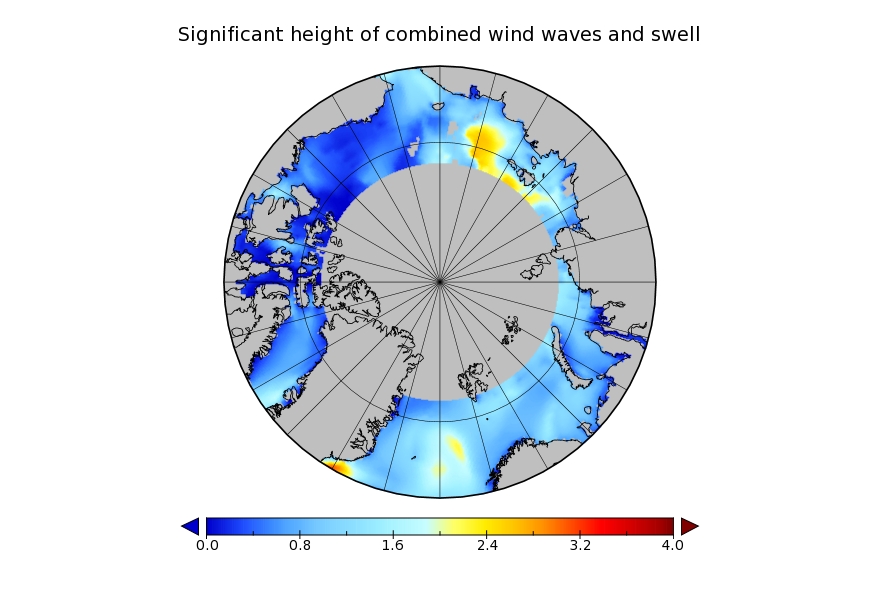
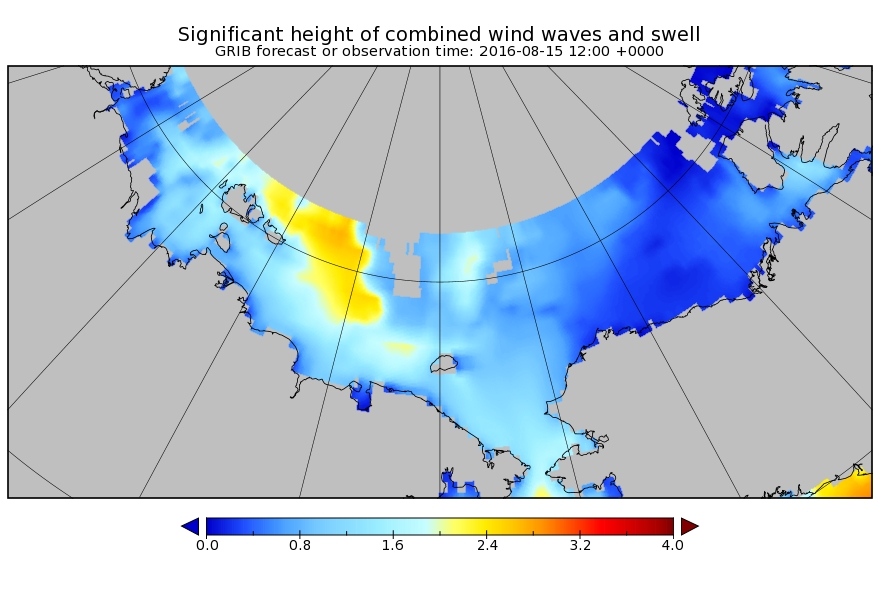
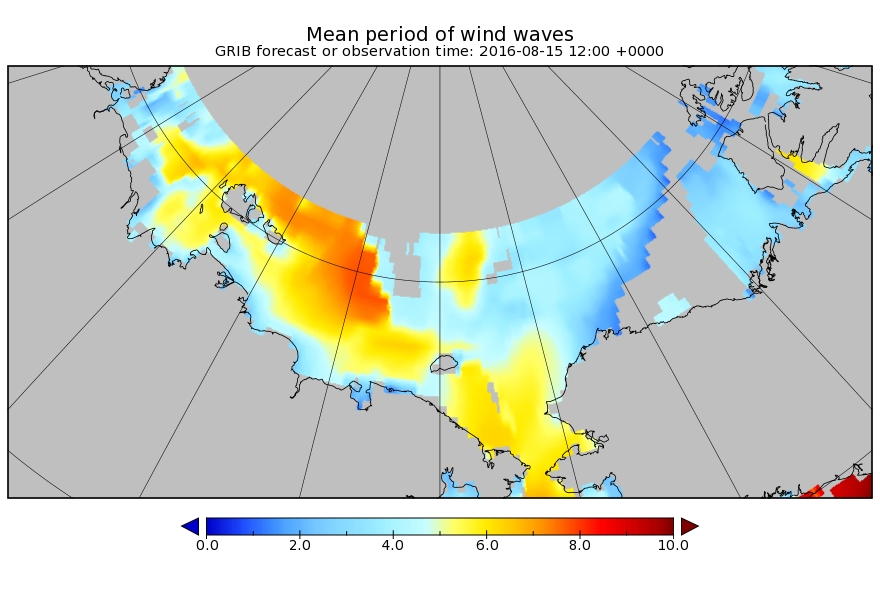
and here is the current Arctic surf forecast for 06:00 UTC on Monday:
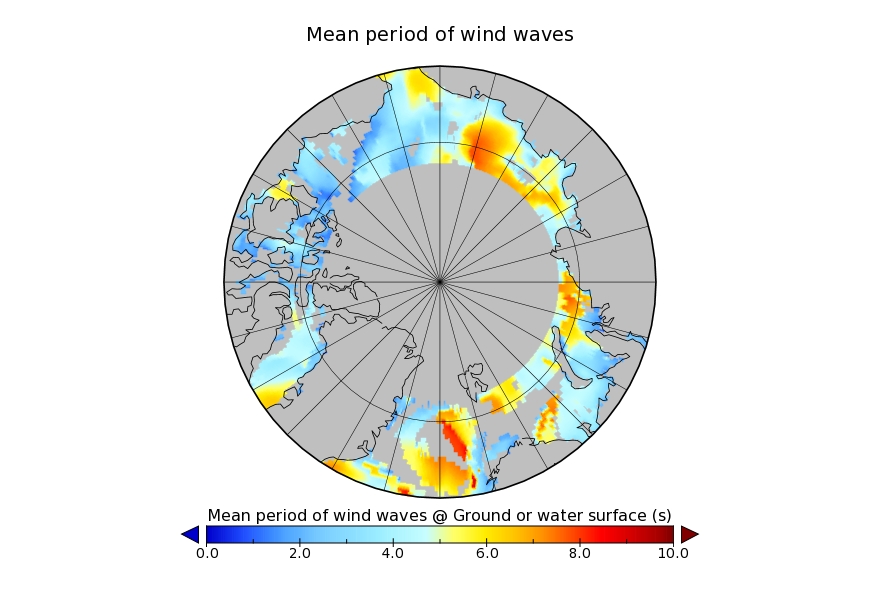
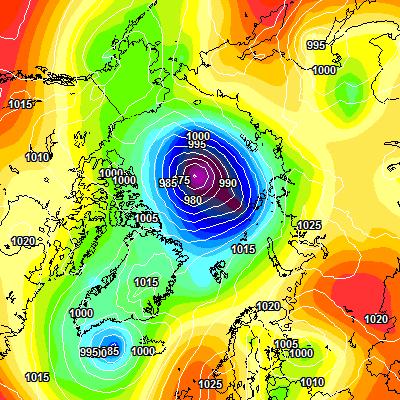
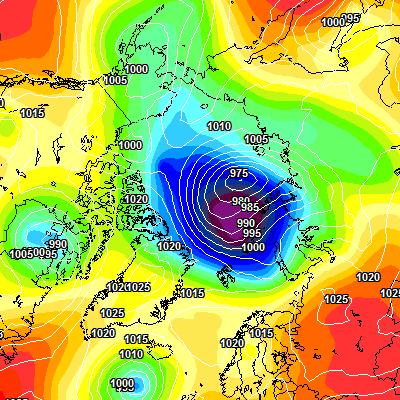
A 975 hPa low pressure system will be creating 3 meter waves with a period of around 8 seconds heading across the East Siberian Sea in the direction of the ice edge. By midnight on Monday the cyclone is forecast to have deepened to a central pressure below 970 hPa:
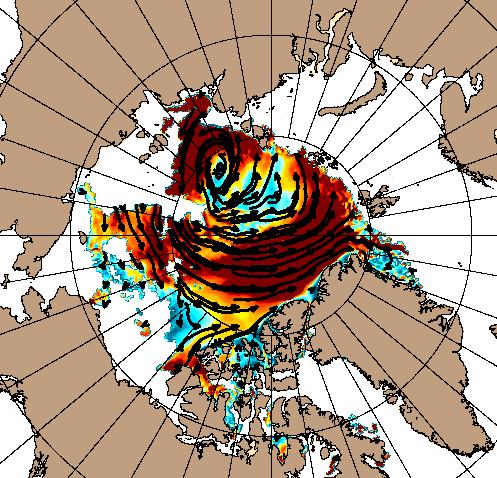
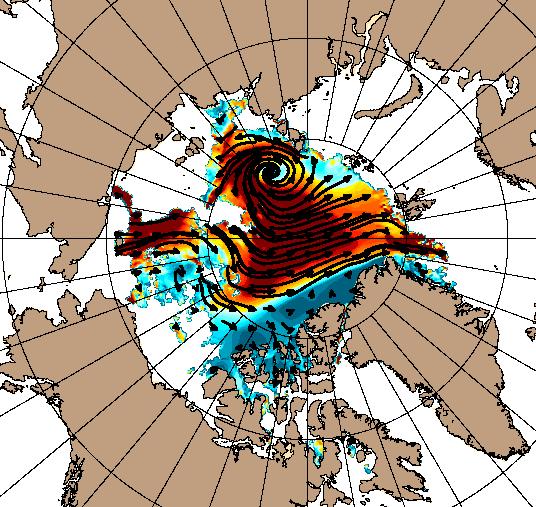
All of this is rather reminiscent of the “Great Arctic Cyclone” in the summer of 2012, which looked like this on August 7th:
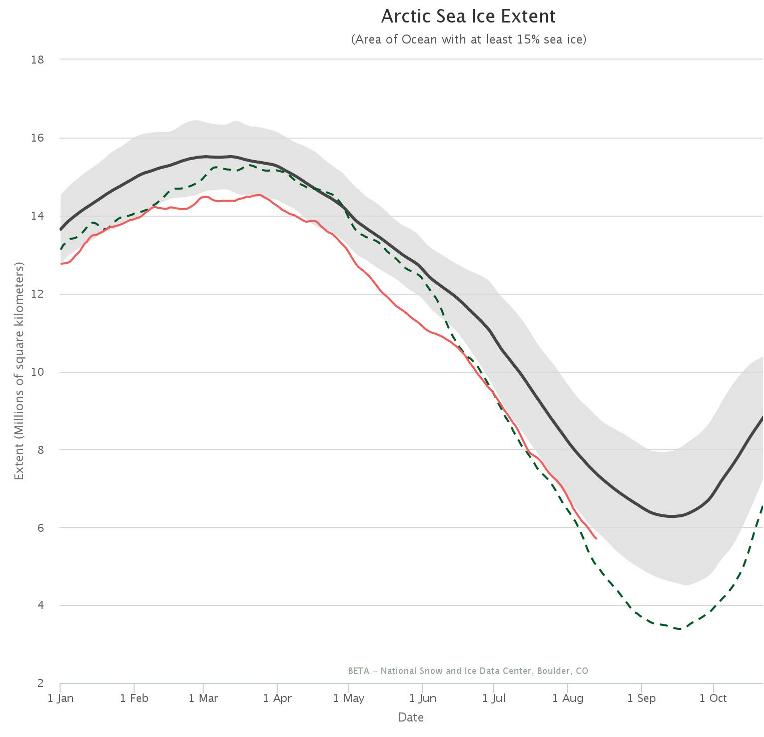
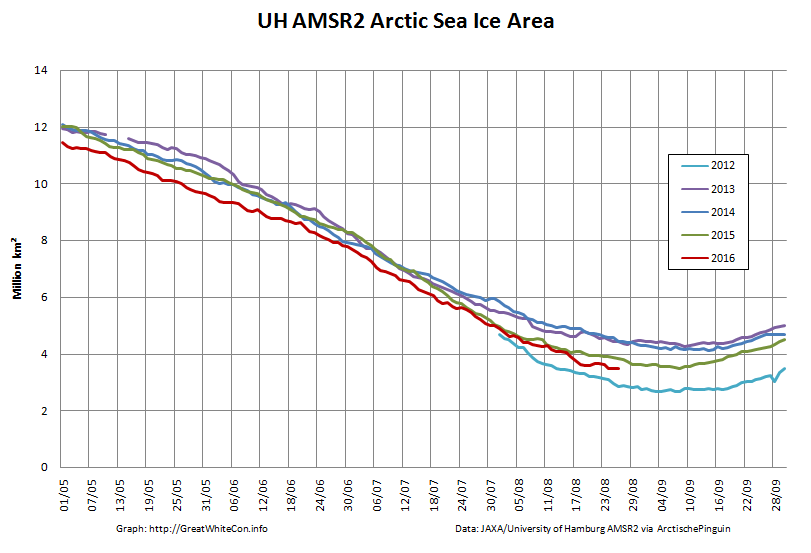
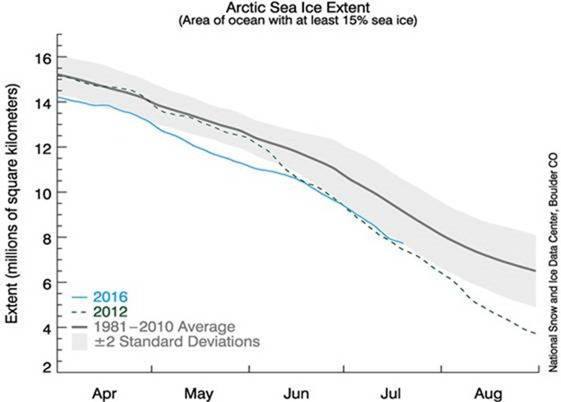
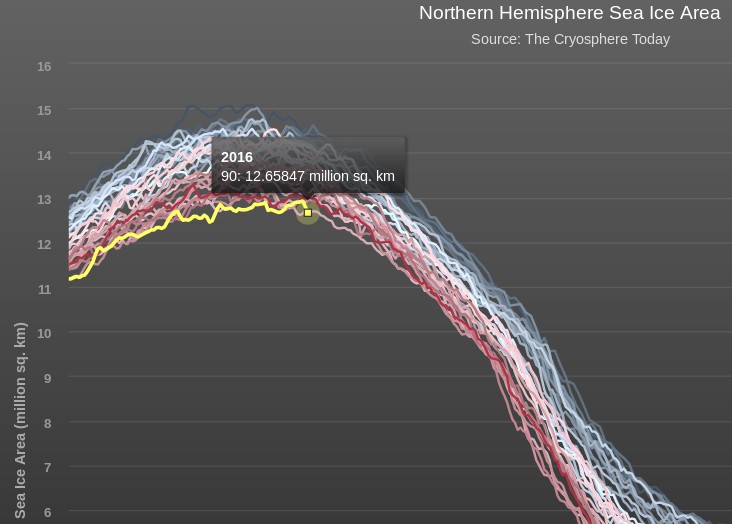
and which ultimately led to the lowest Arctic sea ice extent in the satellite record. Using the National Snow and Ice Data Center’s numbers that was 3.41 million square kilometers on September 16th 2012. Here’s the NSIDC’s current graph comparing 2012 with this year:
I wonder what the minimum for 2016 will be, and on what date?
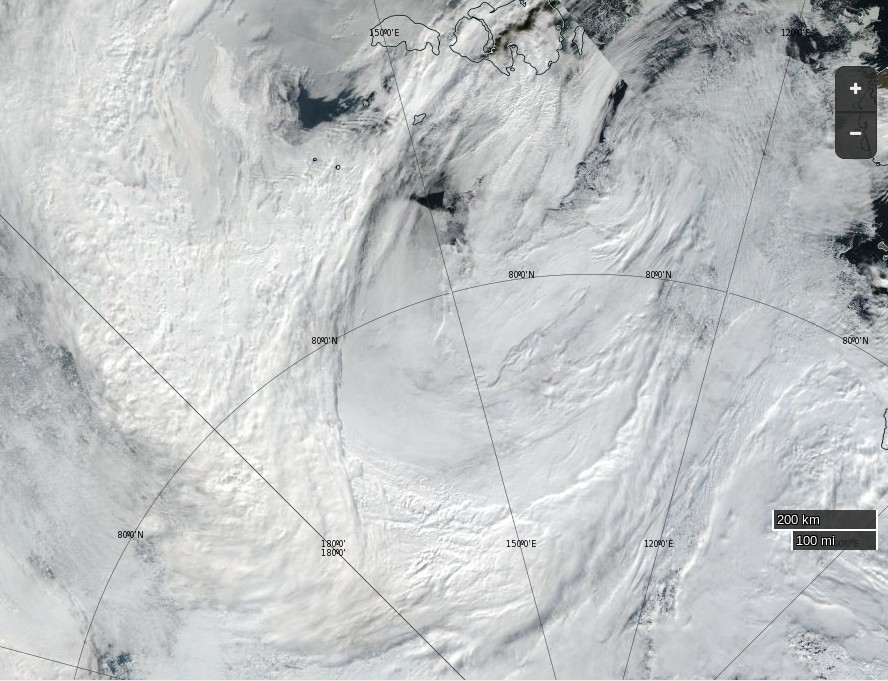
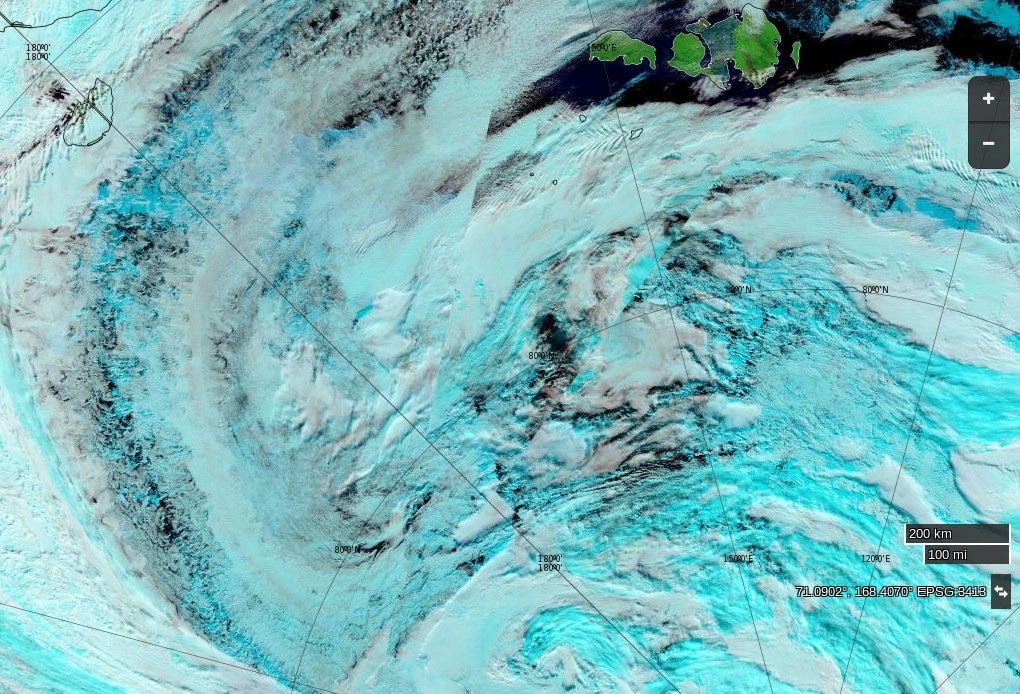
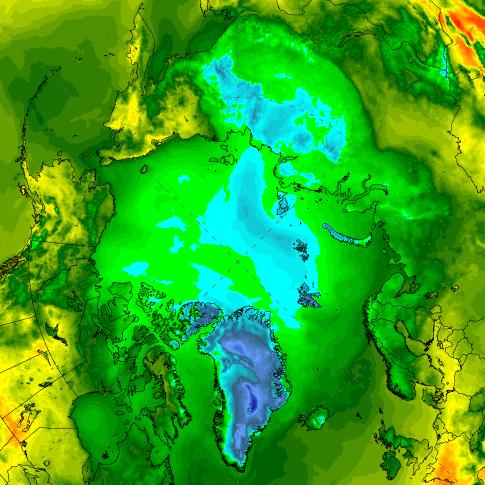
Here’s how the Great Arctic Cyclone of 2016 looks from on high this morning:
NASA Worldview “true-color” image of the ‘Great Arctic Cyclone’ on August 15th 2016, derived from the VIIRS sensor on the Suomi satellite
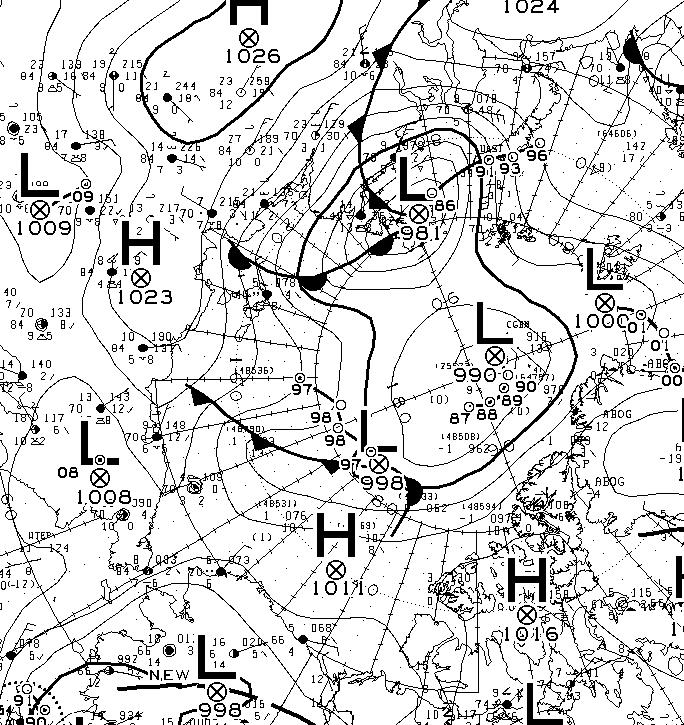
The latest synopsis from Environment Canada shows that the central pressure of the cyclone is now down to 974 hPa:
The WaveWatch III forecast for noon today UTC confirms the forecast of two days ago:
P.S. The Canadian 0600Z synopsis has the cyclone’s SLP down to 971 hPa:
[Edit – August 16th]
This morning the cyclone’s SLP is down to 969 hPa:
and the clouds over the Central Arctic are parting:
NASA Worldview “false-color” image of the Arctic Basin on August 16th 2016, derived from the MODIS sensor on the Terra satellite
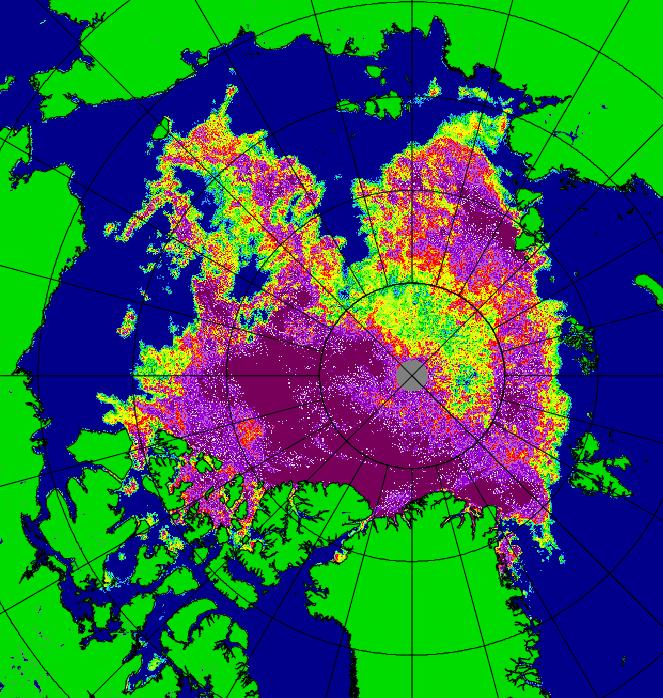
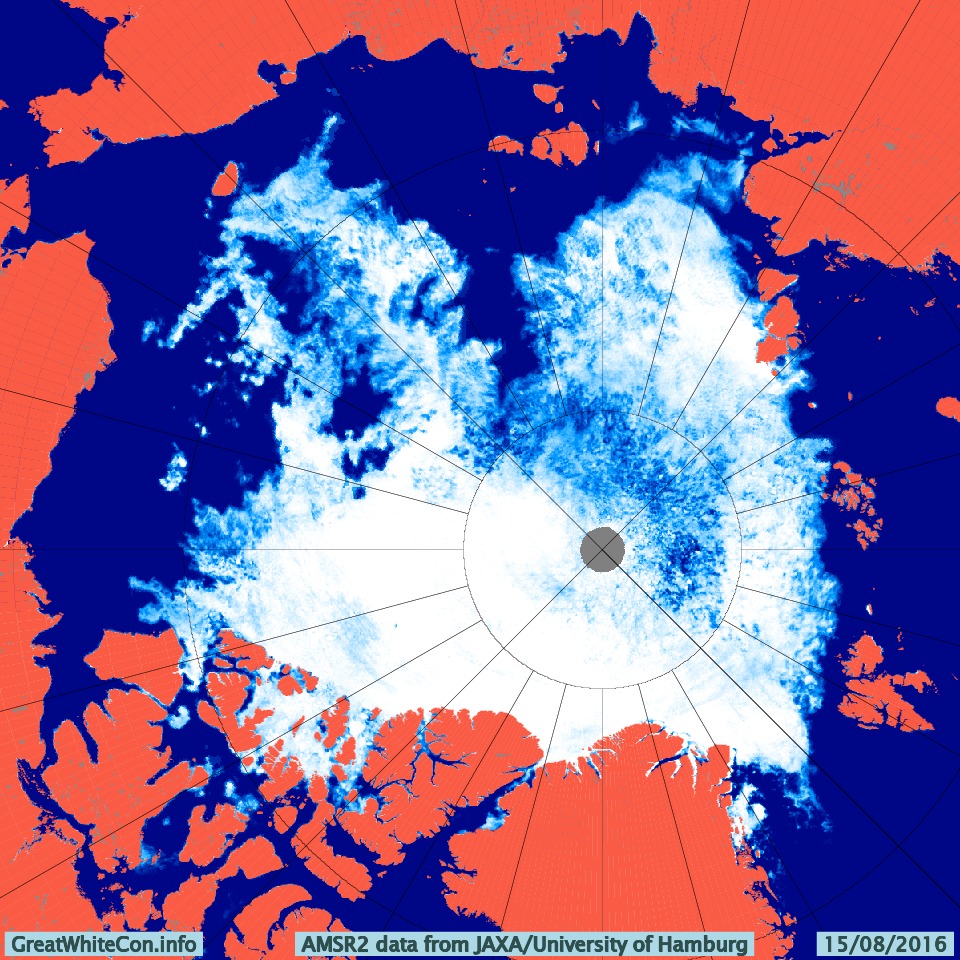
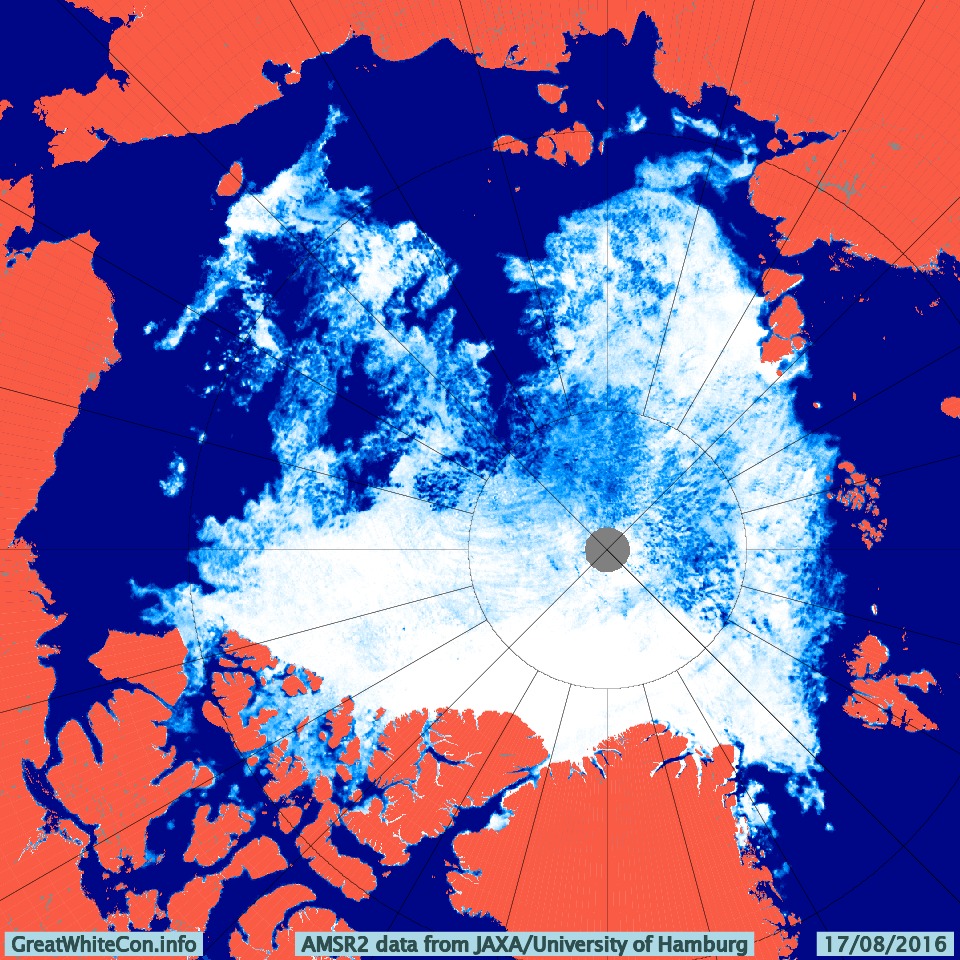
Our favourite method of seeing through the clouds using the AMSR2 maps from the University of Hamburg doesn’t seem to working at the moment, so here’s one from the University of Bremen instead:
The cyclone central pressure is now up to 983 hPa, and some indications of the effect it has had on the sea ice in the Arctic are being revealed:
[Edit – August 19th]
According to Environment Canada the cyclone’s central pressure rose to 985 hPa earlier today:
However the 987 hPa low near the Canadian Arctic Archipelago is currently forecast to deepen below 980 hPa over the next 24 hours. Here’s the ECMWF forecast for first thing tomorrow morning:
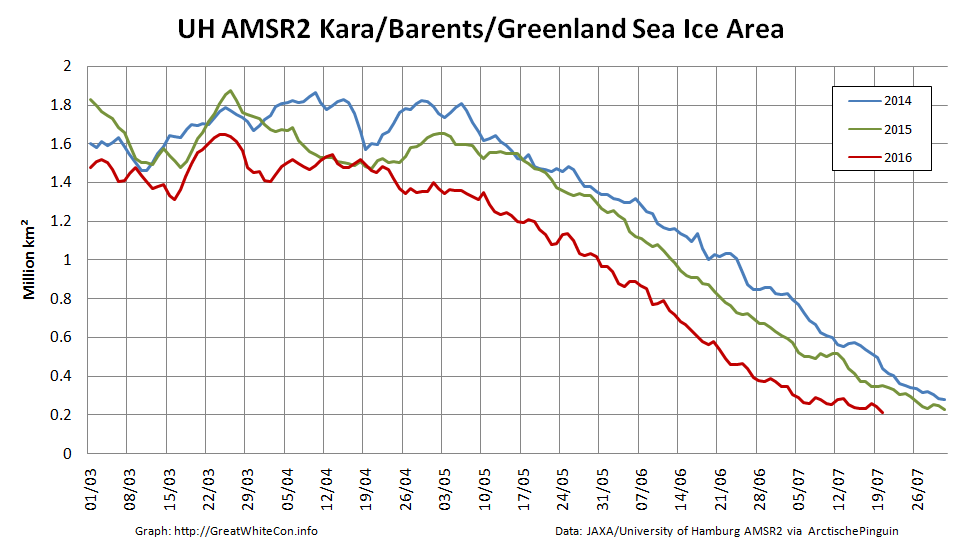
The high resolution AMSR2 Arctic sea ice area has reduced by another 133.5 thousand square kilometers since yesterday. A similar drop tomorrow will take us below the 2015 minimum.
[Edit – August 19th PM]
The MSLP of the rejuvenated cyclone had dropped to 976 hPa by 12:00 UTC today:
The ECMWF forecast for lunchtime tomorrow is for something similar:
[Edit – August 20th]
The current incarnation of the cyclone bottomed out at 971 hPa near the Canadian Arctic Archipelago:
The 72 hour forecast from ECMWF for the next phase of GAC 2016 is beginning to enter the realms of plausibility. Here’s what it reveals:
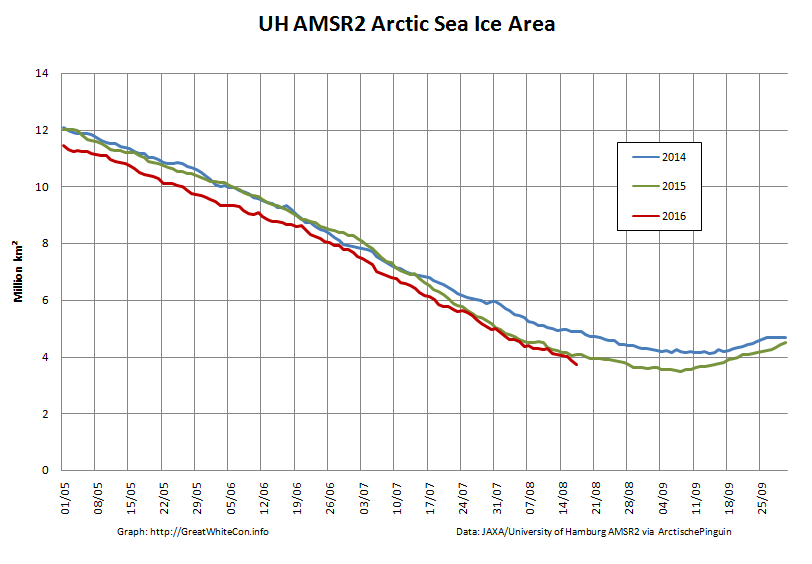
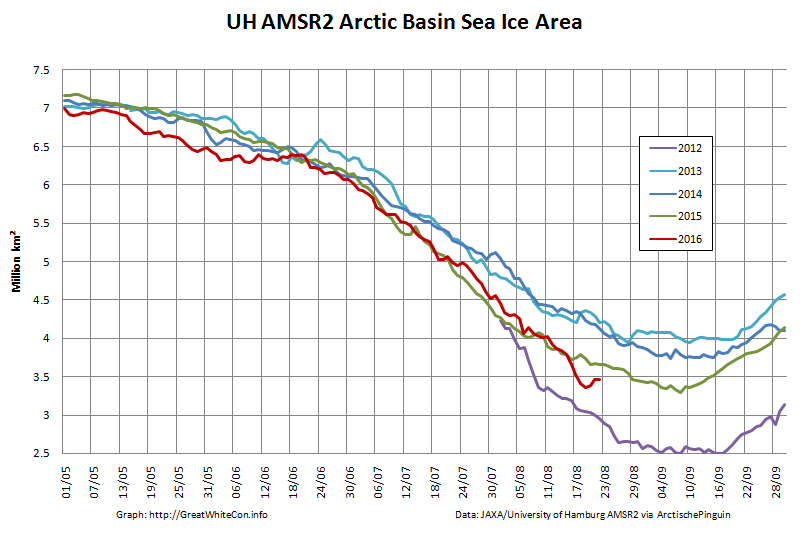
The University of Hamburg have been processing more AMSR2 data from 2012. You can argue until the cows come home about which is the best metric to peruse at this time of year, but try this one for size:
That’s the high resolution AMSR2 sea ice area for the Arctic Basin, comprising the CAB plus Beaufort, Chukchi, East Siberian and Laptev Seas.
[Edit – August 25th]
There’s a bit of a gap in the clouds over the Central Arctic today:
NASA Worldview “true-color” image of the Central Arctic Basin on August 25th 2016, derived from the MODIS sensor on the Terra satellite
This is merely the calm before the next storm. Here is the current ECMWF forecast for Saturday lunchtime (UTC):
Low pressure on the Siberian side of the Arctic and high pressure on the Canadian side producing an impressive dipole with lots of sea ice “drift” towards the Atlantic:
[Edit – August 27th]
Saturday morning has arrived, and so has the predicted storm. As the centre of the cyclone crossed the coast of the East Siberian Sea its central pressure had fallen to 967 hPa, whilst the high pressure over Alaska had risen to 1028 hPa:
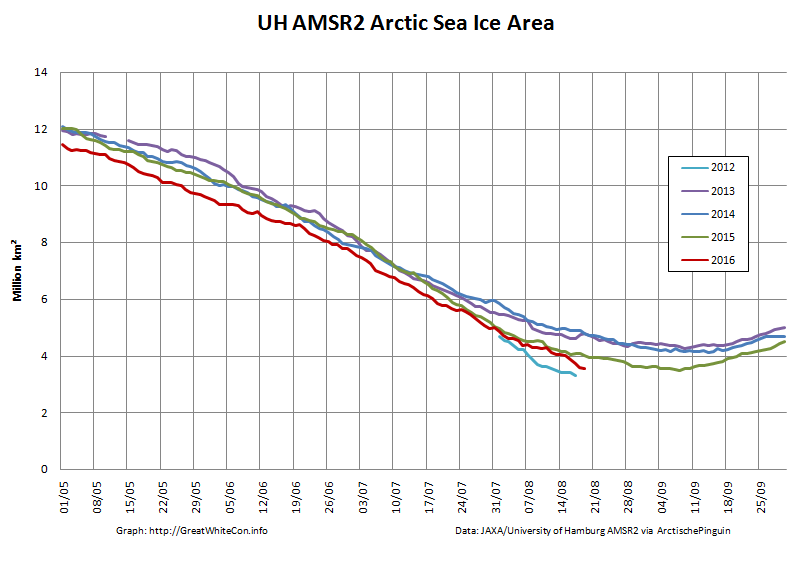
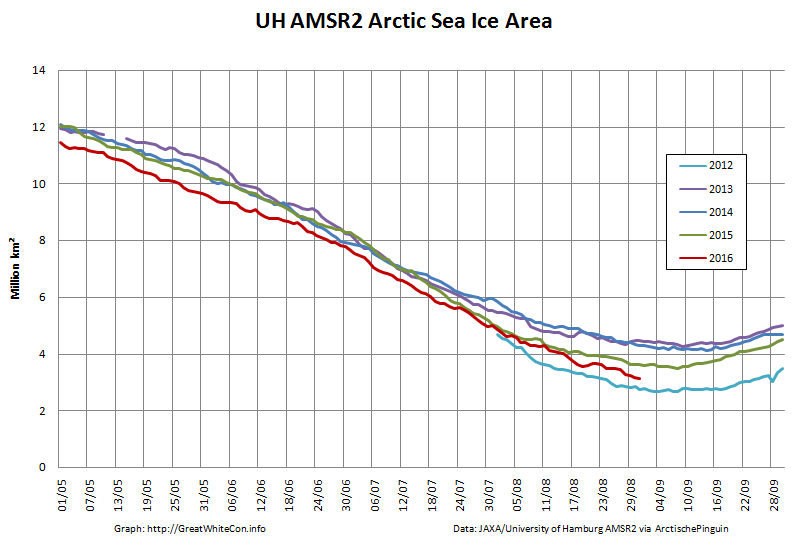
The effect of the earlier bursts of high wind is apparent in the high resolution AMSR2 sea ice area graph:
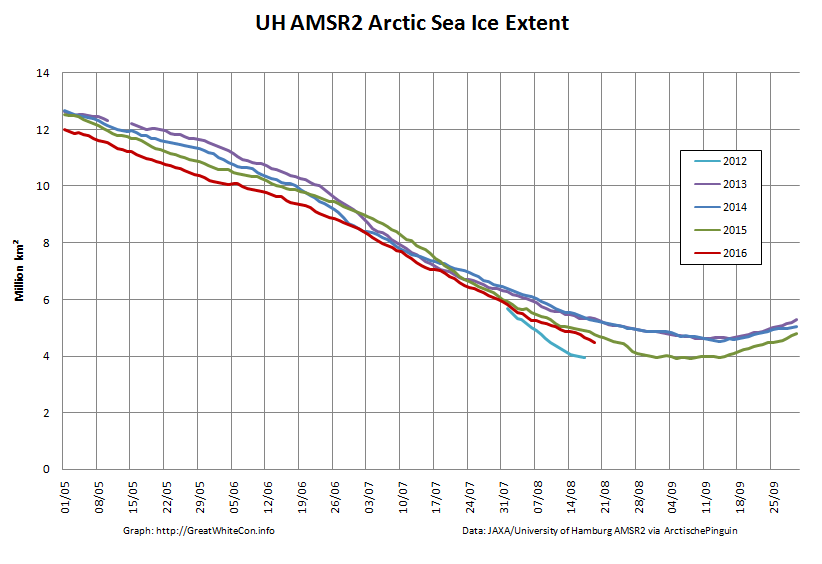
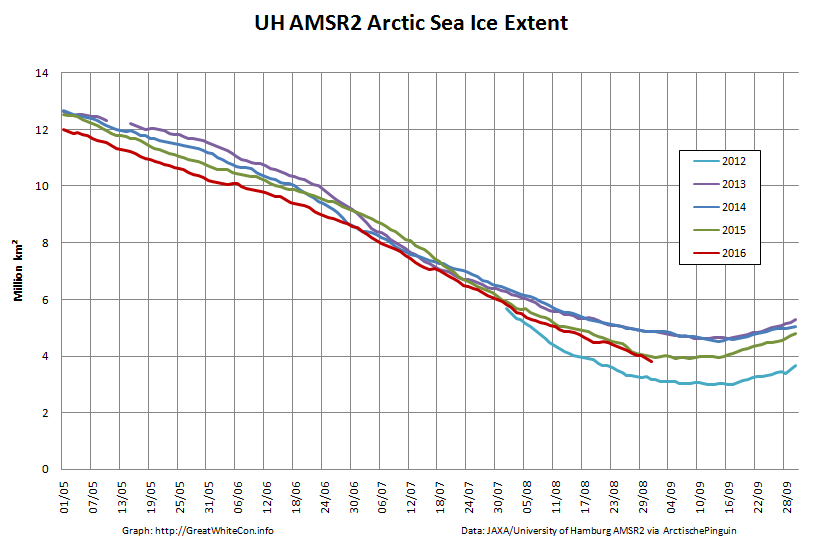
However they are not as apparent in the corresponding extent graph:
[Edit – August 28th]
As the centre of the cyclone heads for the North Pole the isobars are tightening across the last refuge of multi-year sea ice north of the Canadian Arctic Archipelago and Greenland:
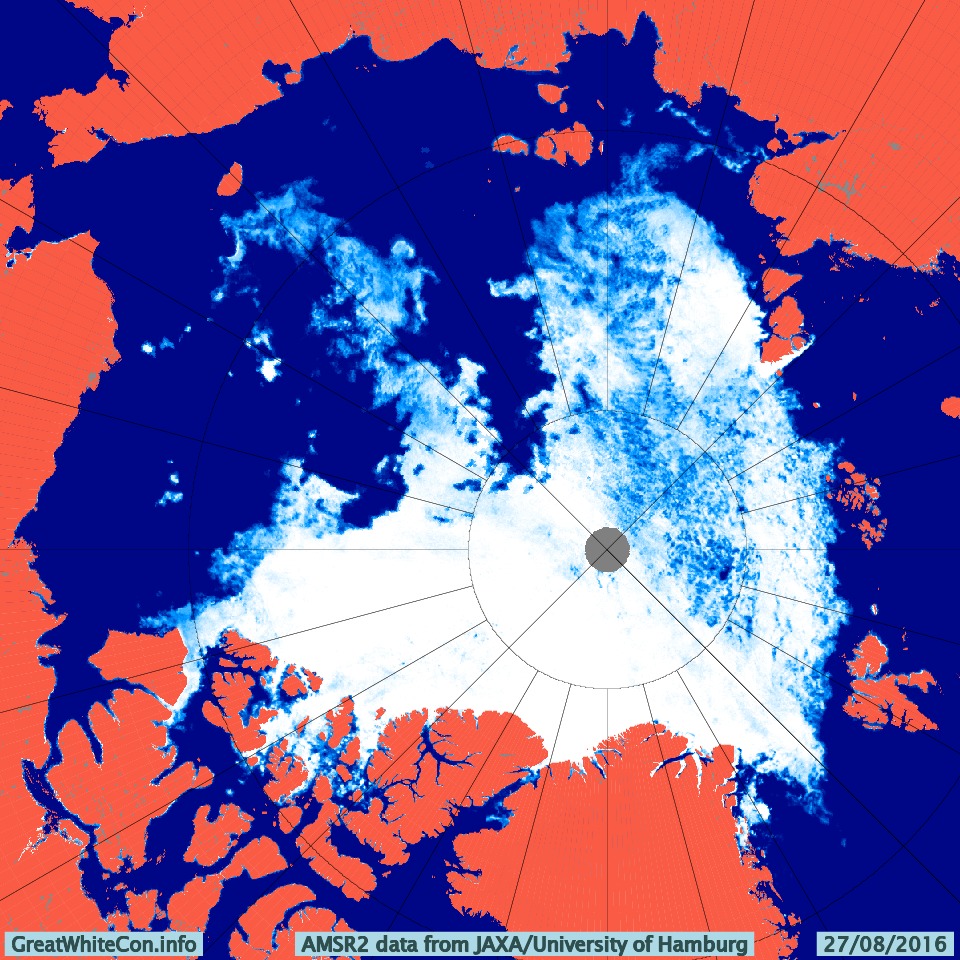
The area north of the East Siberian Sea that was predicted to bear the brunt of the wind and waves overnight is still covered in cloud. However the latest AMSR2 update from the University of Hamburg suggests that open water now stretches as far as 86 degrees north:
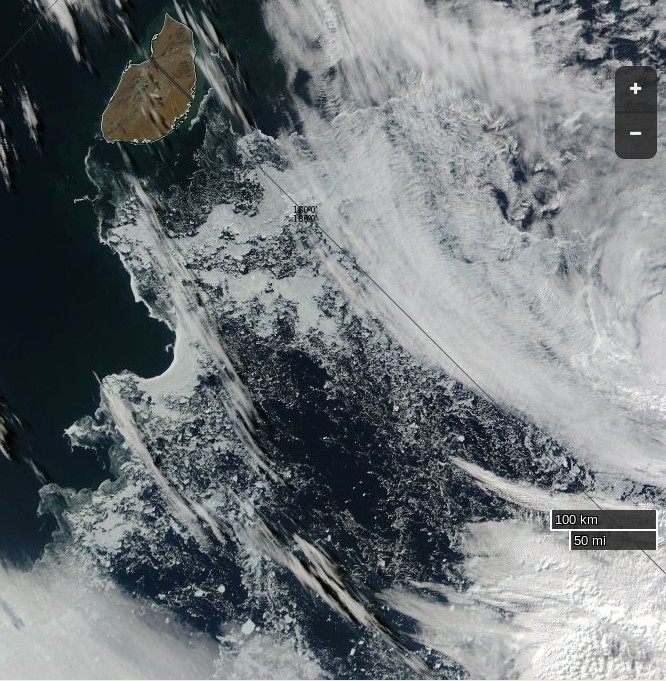
The skies over the northern Chukchi Sea have cleared to reveal this:
NASA Worldview “true-color” image of the northern Chukchi Sea on August 28th 2016, derived from the MODIS sensor on the Aqua satellite
[Edit – August 29th]
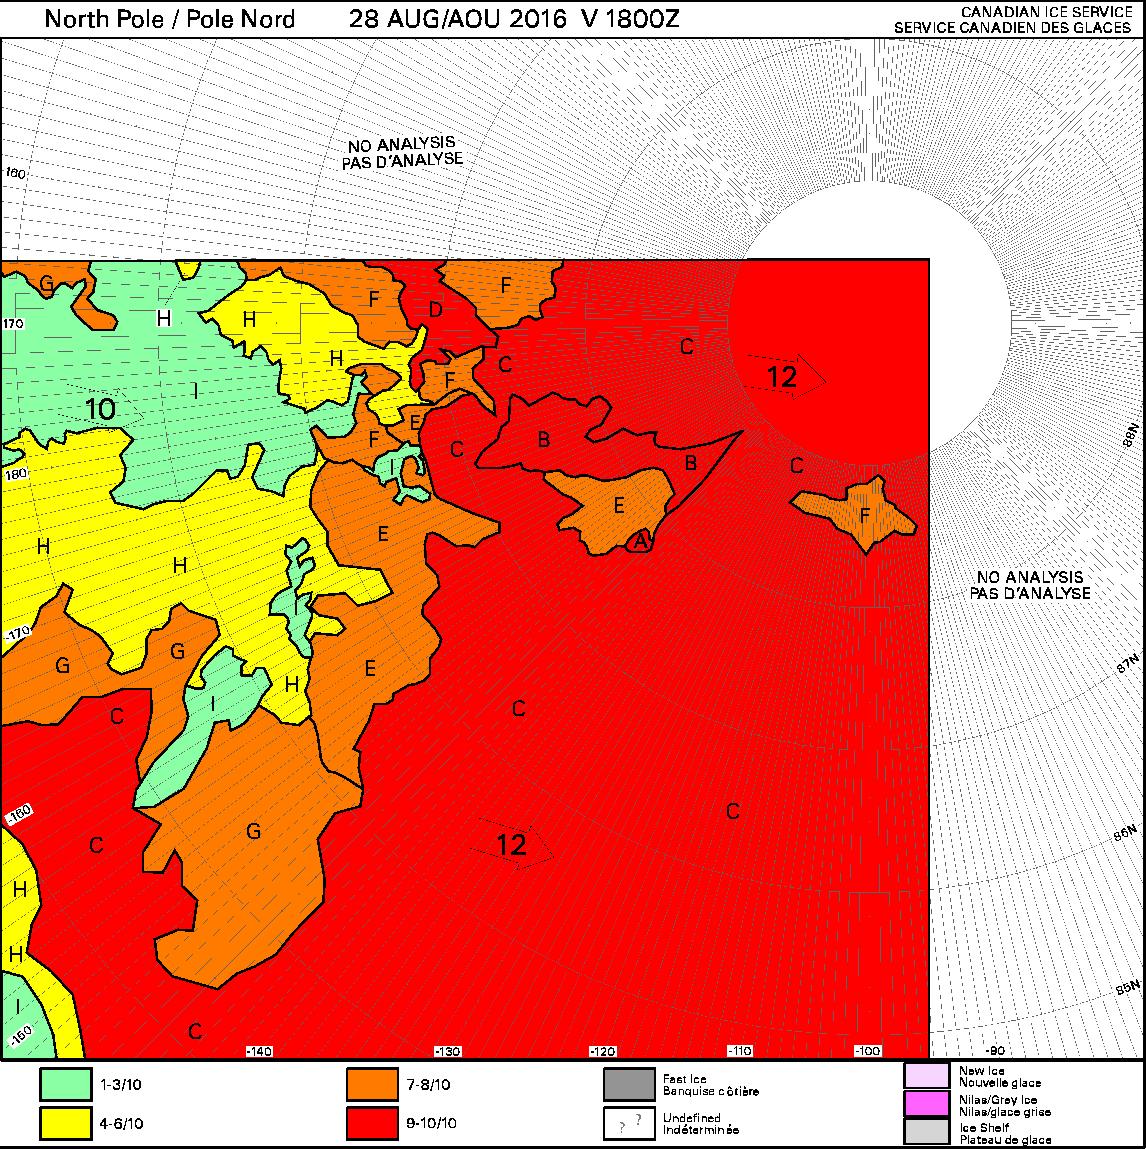
Some of the effects of the recent high winds can be judged by this Canadian Ice Service chart of ice concentration near the North Pole:
[Edit – September 1st]
Arctic sea ice area continues to fall quickly for the time of year:
The recent dipole has finally caused some compaction of the scattered sea ice. Hence the high resolution AMSR2 extent is following suit and is now below last year’s minimum:
According to the old saying “A change is as good as a rest”, so rather than plagiarise today’s title from a “skeptical” web site we’ve invented this one all by ourselves. Northabout is a small yacht with big ideas. (S)he wants to circumnavigate the North Pole in one summer season. However certain cryoblogospheric commenters are somewhat skeptical that this can be achieved this year. Take Tony Heller for example:
There has been very little melt going on in the Arctic Ocean the last few days, due to cold cloudy weather.
A group of climate clowns were planning on sailing around the entire Arctic Ocean through the Northeast and Northwest Passages (to prove there isn’t any ice in the Arctic) but are stuck in Murmansk because the Northeast Passage is completely blocked with ice.
The “group of climate clowns” aboard Northabout that Mr. Heller refers to are led by David Hempleman-Adams. According to the Polar Ocean Challenge web site:
David is one of the most experienced and successful adventurers in the world.
In his forty years as an adventurer, David was the first person to reach the highest peaks on all seven continents and journey fully to the North and South Geographical and Magnetic Poles. He has broken forty-seven Federation Aeronautique Internationale ballooning records
My name is Tony Heller. I am a whistle blower. I am an independent thinker who is considered a heretic by the orthodoxy on both sides of the climate debate.
I have degrees in Geology and Electrical Engineering, and worked on the design team of many of the world’s most complex designs, including some which likely power your PC or Mac. I have worked as a contract software developer on climate and weather models for the US government.
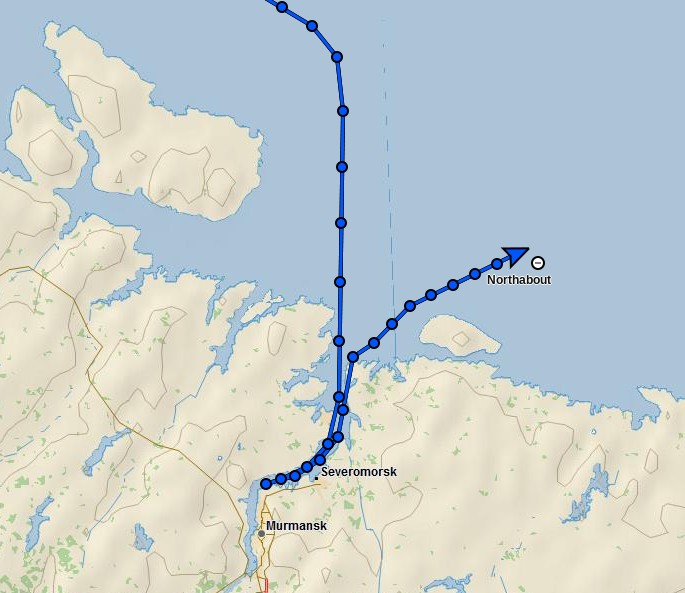
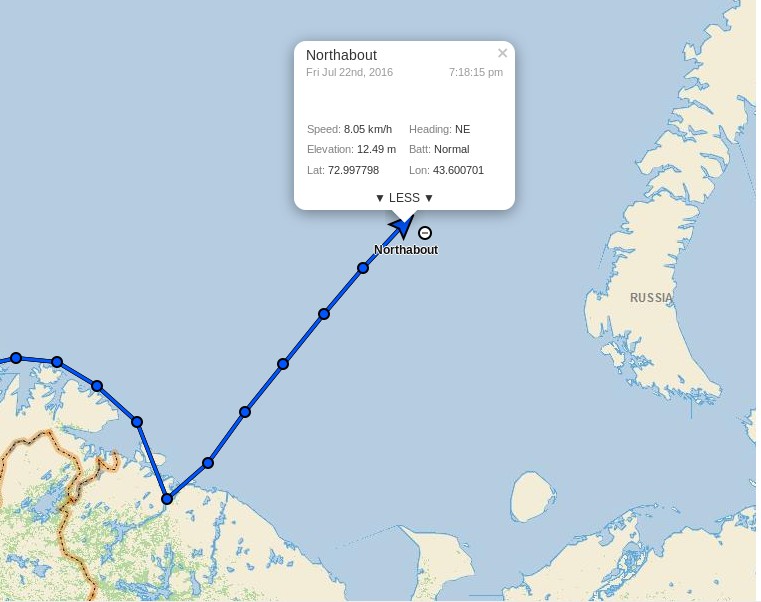
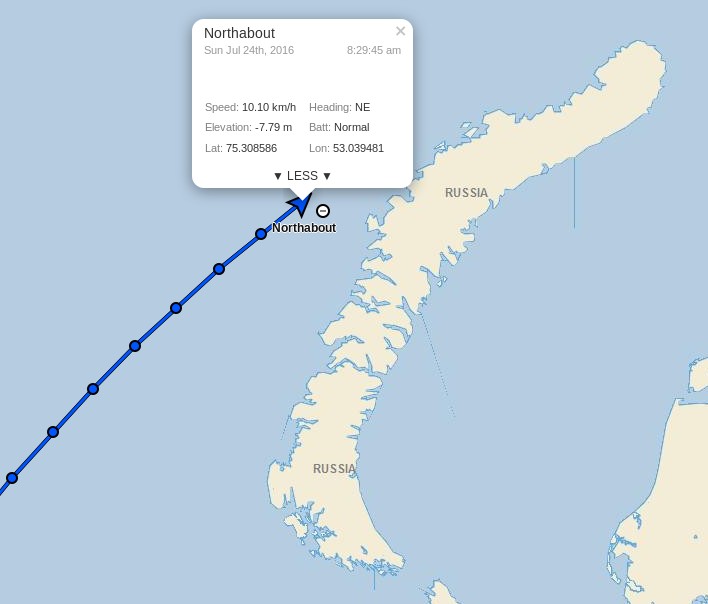
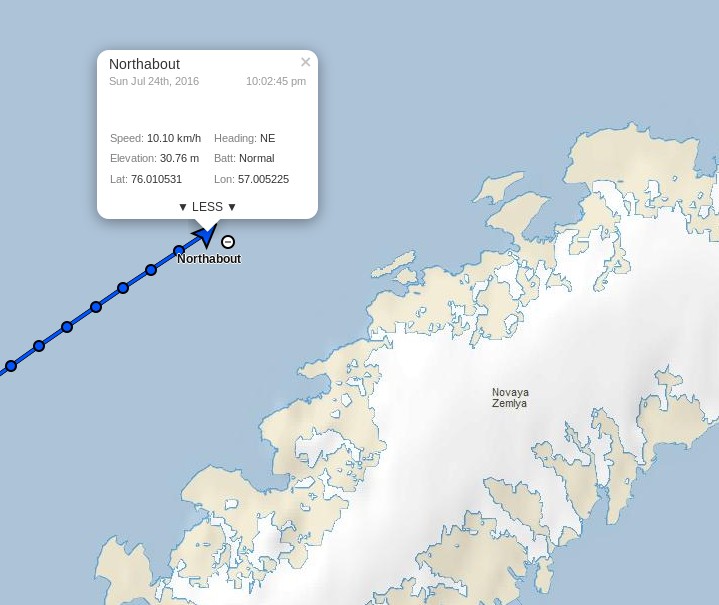
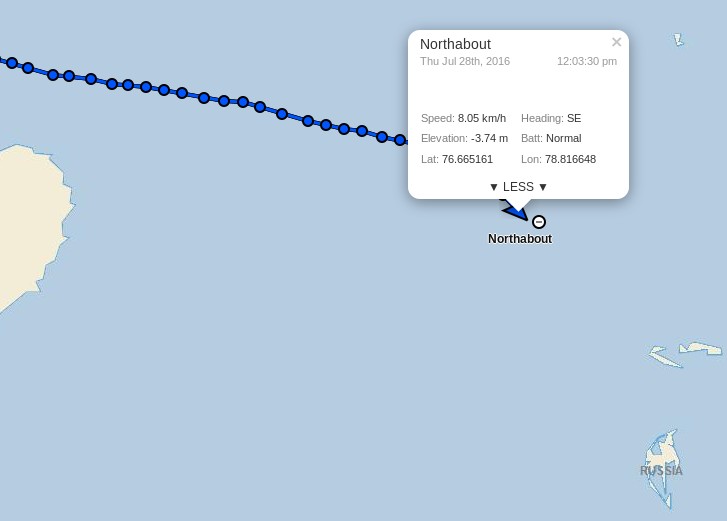
However despite Tony’s long list of qualifications he is evidently currently quite confused, since according to the Polar Ocean Challenge live tracking map David and Northabout are not in actual fact “stuck in Murmansk” at all:
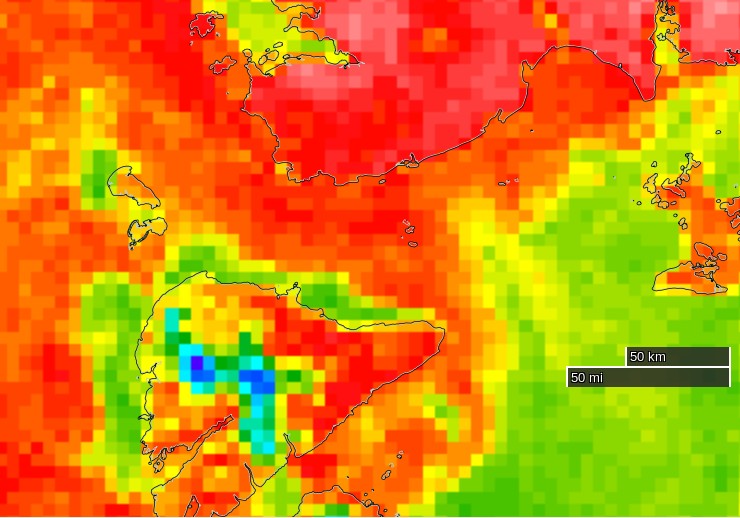
This shouldn’t come as surprise to anyone with an internet connection and a desire to check the facts, since as we speak there is currently remarkably little sea ice cover on the Atlantic side of the Arctic Ocean:
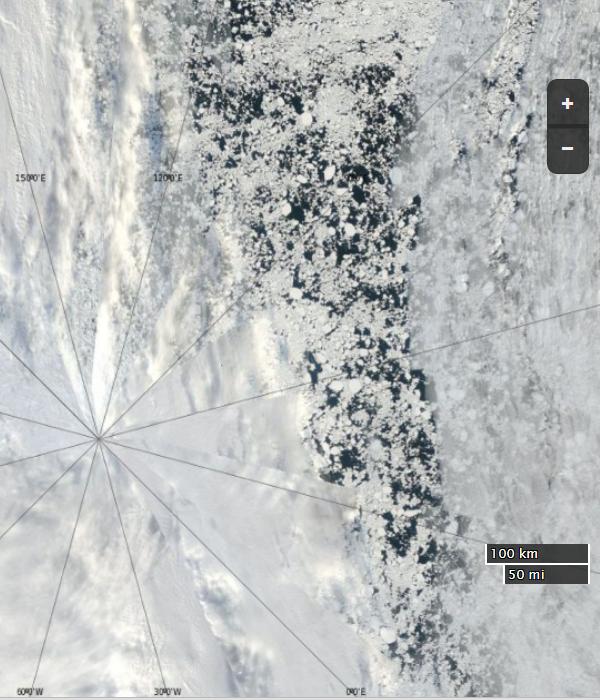
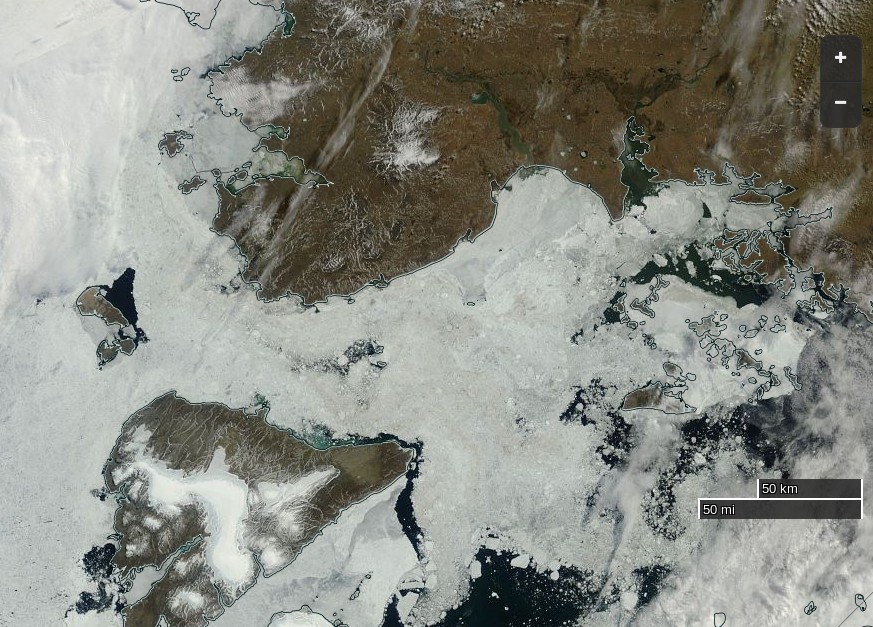
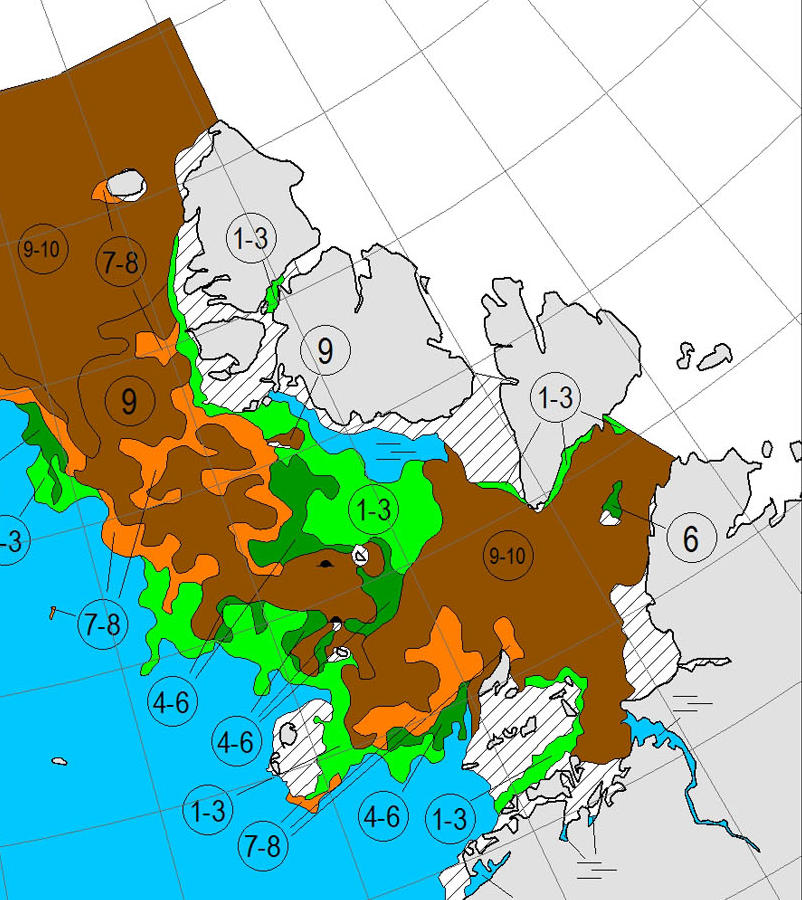
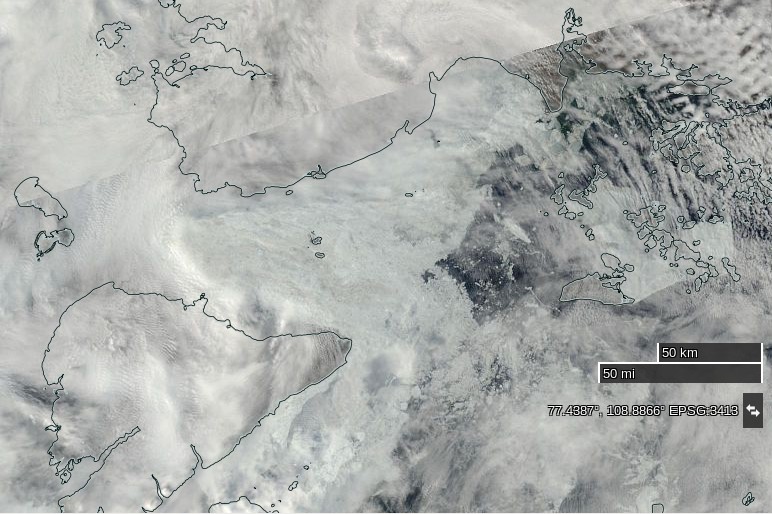
Hence Northabout should find the next leg of his/her voyage across the Barents and Kara Seas pretty plain sailing. However Vilkitsky Strait, the passage from the Kara into the Laptev Sea, is currently looking a trifle tricky:
NASA Worldview “true-color” image of the Vilkitsky Strait on July 20th 2016, derived from the MODIS sensor on the Terra satellite
Do you suppose Tony Heller suffers from precognitive dreams?
[Edit – July 22nd 2016]
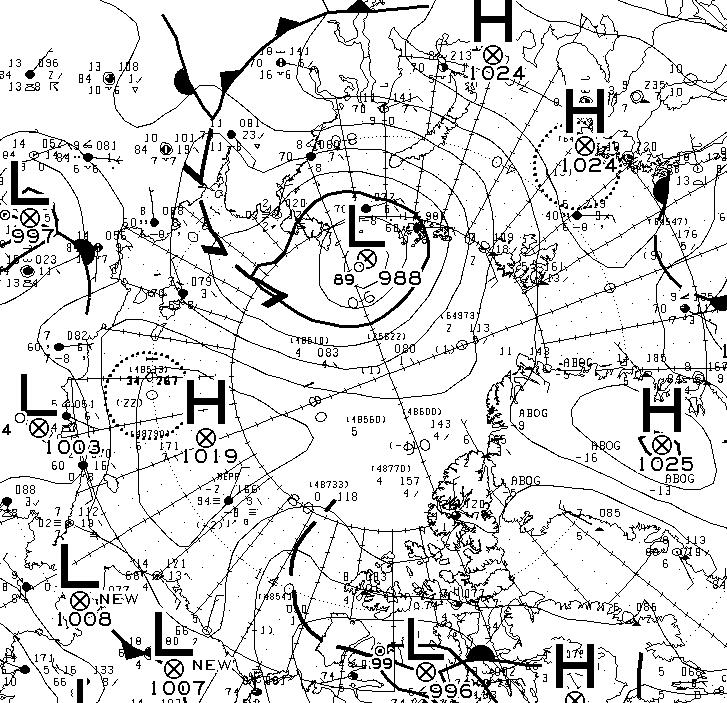
According to Environment Canada this morning there’s a 988 hPa central pressure cyclone causing a bit of a blow in the Vilkitsky Strait at the moment:
Sea and air temperature getting colder as we venture further north. Saw quite a lot of Dolphins for the first time around the Yacht. Still sea gulls flying behind and skimming the waves.
Had some promising Canadian ice charts yesterday, but that’s a long way off. Today we should get an update with the Russian side. fingers crossed it is still not solid around the cape and Laptev sea. That could slow us down considerably. The wind has been blowing the pack ice against the land, so very difficult to get around the shore, but let’s see what Santa brings.
P.S. Maintaining his usual modus operandi, Tony Heller has penned a new article today, containing a satellite image remarkably similar to the one just above. Under the headline “The 2016 Franklin Expedition” he tells his loyal readership:
The Polar Ocean Challenge is headed off into the ice.
They will run into this in three days – hundreds of miles of solid ice. Without an icebreaker, they are going nowhere. I asked them on Twitter if they have an icebreaker. I haven’t received a response, and will be monitoring them by satellite to see if they are cheating.
By some strange coincidence we’re “monitoring them by satellite” too:
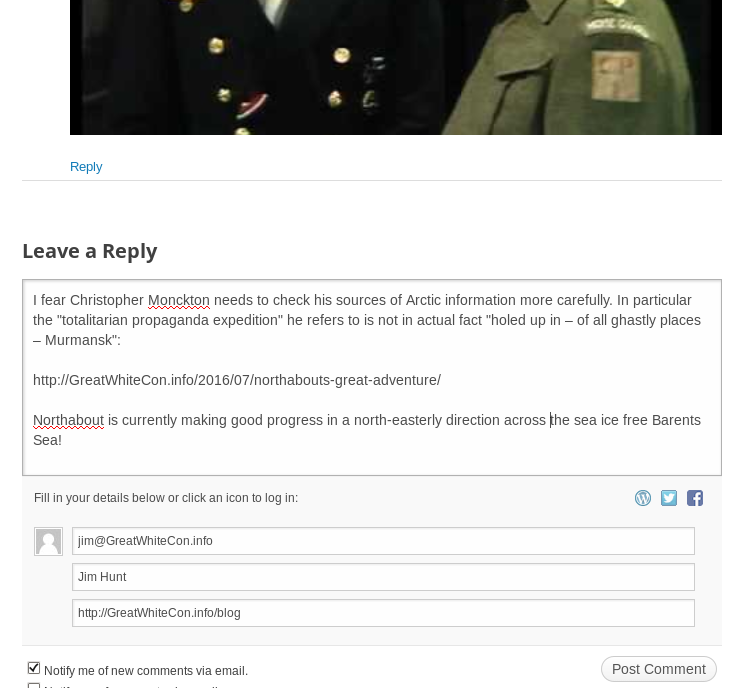
As for ice melt, yet another totalitarian propaganda expedition intended to “raise awareness” of climate “catastrophe” by trying to sail around the Arctic in the summer has just come a cropper owing to – er – too much ice. Neither the North-East Passage nor the North-West Passage is open, so the expedition is holed up in – of all ghastly places – Murmansk. That’ll teach Them.
However my corrective comment has yet to see the light of day at WUWT:
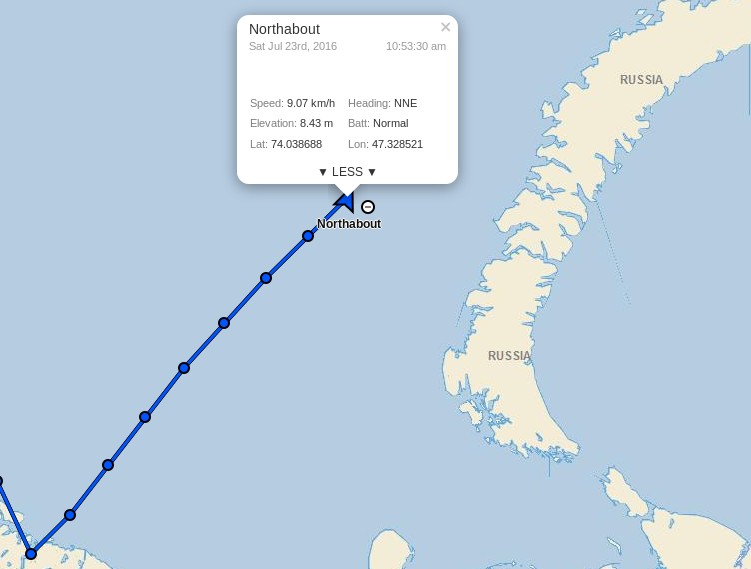
Meanwhile Northabout resolutely presses on regardless, and has just passed 74 degrees North:
whilst the sea ice edge in the north-eastern Kara Sea has retreated somewhat over the last three days:
NASA Worldview “true-color” image of the Vilkitsky Strait on July 23rd 2016, derived from the MODIS sensor on the Terra satellite
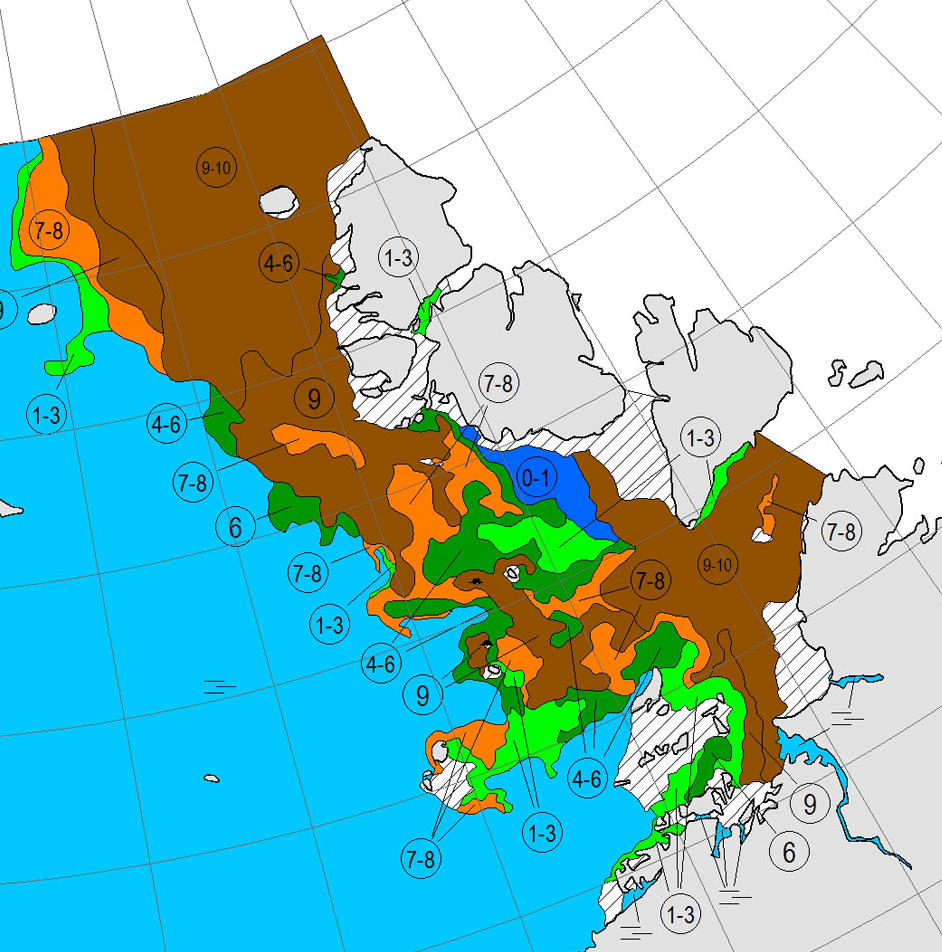
Here’s the July 20-22nd AARI map of the Vilkitsky Strait area:
On the topic of Arctic sea ice melt in general Viscount Monckton opines over on WUWT that:
According to the National Snow and Ice Data Center’s graph, also available at WUWT’s sea-ice page, it’s possible, though not all that likely, that there will be no Arctic icecap for a week or two this summer:
Even if the ice disappears for a week or two so what? The same was quite possibly true in the 1920s and 1930s, which were warmer than today in the northern hemisphere, but there were no satellites to tell us about it.
The Good Lord seems to have a very tenuous grasp on reality, since the NSIDC’s graph shows nothing of the sort. Perhaps he is merely indulging in irony?
[Edit – July 24th 2016]
Northabout passed the 75 degrees North milestone overnight:
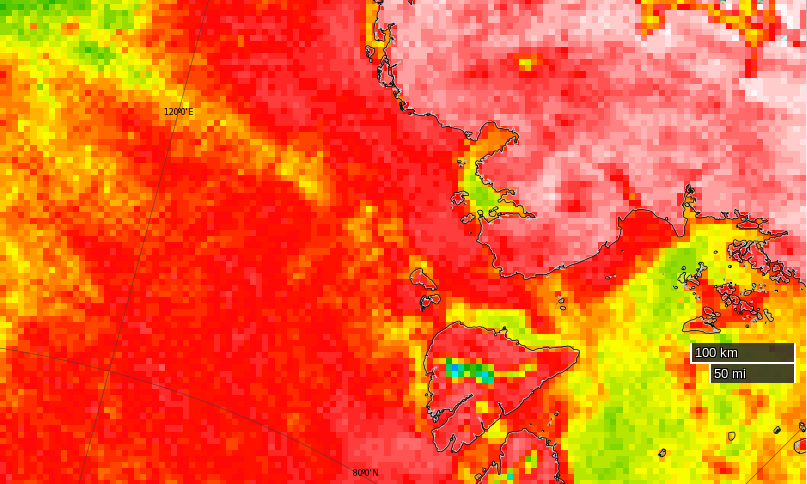
Clouds obscure the Vilkitsky Strait in visible light this morning but passive microwaves make it through the murk, albeit with reduced resolution. They reveal the sea ice edge in the Kara Sea receding and a narrow passage opening up along the Northern side of the Strait (North is down in the image):
NASA Worldview passive microwave image of the Vilkitsky Strait on July 24th 2016, derived from the AMSR2 instrument on the Shizuku satellite
According to Ben Edwards’ latest blog post from the Barents Sea:
I just wore a T-shirt on my first watch out of Murmansk. Today I wore my trawler suit and a primaloft under it with gloves and a hat….
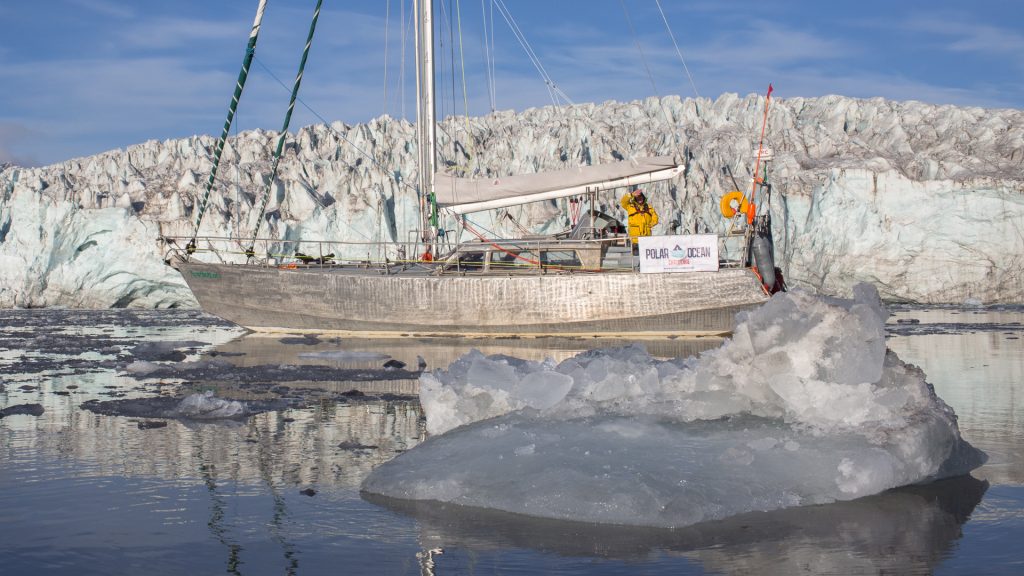
As the cryodenialosphere continue to retweet and reblog their regurgitated rubbish here’s a picture from last year of Northabout amidst some ice, especially for those apparently unable to distinguish a small yacht from a large icebreaker:
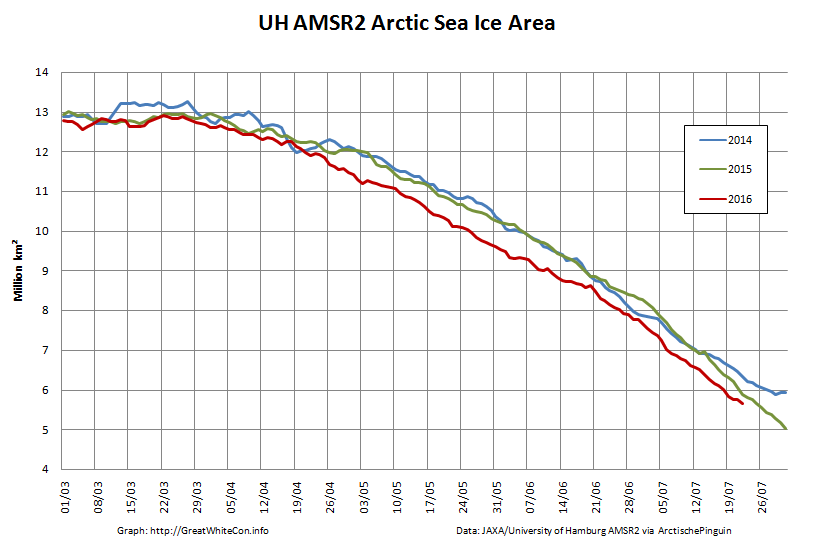
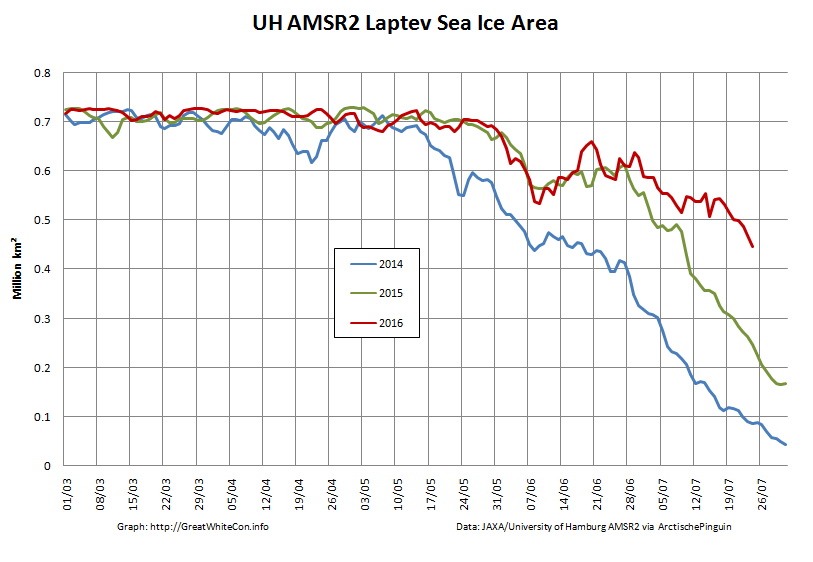
Meanwhile Arctic sea ice continues its inexorable decline:
[Edit – July 24th 2016 PM]
Shock News! Tony Heller has just published yet another article about Northabout’s Great Adventure, and yours truly gets a mention. In the headline no less!! Read all about it at:
Meanwhile the commenters over at unReal Science keep blathering on about icebreakers even though one of the more inquisitive denizens posted thisextract from the “Ship’s Log” over there yesterday:
Partly checked the new ice charts on www.nsra.ru, we still have no chance of getting through yet, not past the cape or through the Laptev sea. Nikolai, Our Russian Captain who is very familiar with this route, impresses on me that this is a very unusual year and normally clear, Not what I want to hear. We are under sail, so saving fuel, and will find a small island to shelter until we get improvements. We are still 5 days from the ice, so lets hope for some southerly winds to push the ice from shore.
Northabout is heading for the Kara Sea past the northern tip of Novaya Zemlya, and has now passed 76 degrees North:
[Edit – July 25th 2016]
The skies are still cloudy over the Vilkitsky Strait and Cape Chelyuskin, so here’s another AMSR2 passive microwave visualisation of the state of play. Note the change of scale:
NASA Worldview passive microwave image of the Vilkitsky Strait on July 25th 2016, derived from the AMSR2 instrument on the Shizuku satellite
The sea ice area in the Laptev Sea has finally started decreasing at a more “normal” rate for late July, but still has a lot of catching up to do compared to recent years:
Meanwhile over at “Watts Up With That” at least one reader of Christopher Monckton’s purple prose is clearly confused. Needless to say my clarifying comment is still invisible to him:
Finally, for the moment at least, here’s some moving pictures of dolphins having fun in the Barents Sea:
[Edit – July 26th 2016]
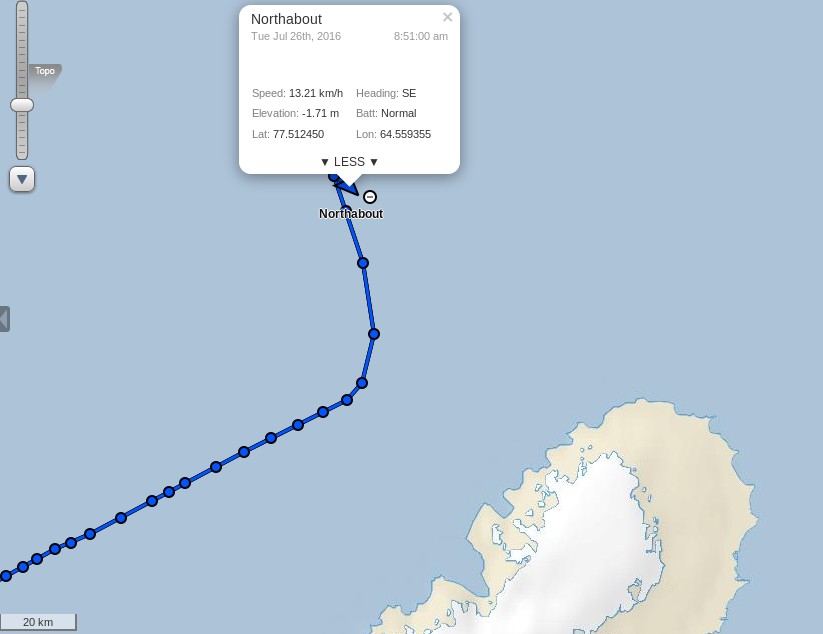
I was expecting Northabout to have entered the Kara Sea by now, but instead (s)he has headed north, and is now well above the 77th parallel:
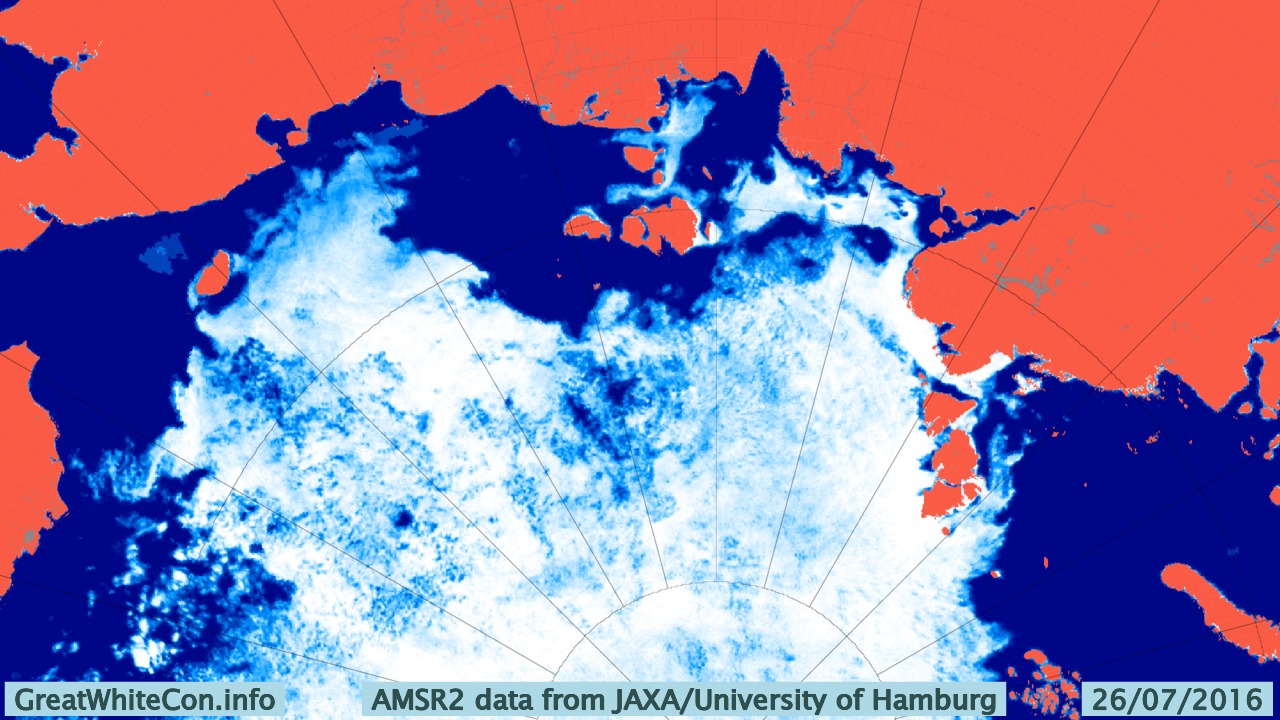
It’s still pretty cloudy up there so here once again is the latest AMSR2 passive microwave visualisation of the Vilkitsky Strait area, with a few place names added for a bit of variety:
NASA Worldview passive microwave image of the Vilkitsky Strait on July 26th 2016, derived from the AMSR2 instrument on the Shizuku satellite
P.S. The Polar Ocean Challenge team explain via Twitter:
@GreatWhiteCon Ha ha! Thanks for interest! Waiting game, manoeuvring, strategy. Difficult to update in choppy conditions! New SHIPSLOG now
— PolarOceanChallenge (@PolarOceanChall) July 26, 2016
Choppy sea, taking four hour tacks. These sea conditions make it hard to sleep, cook or relax.
We are considering many elements all the time. We are due new Russian Ice charts today.
We know the North west is pretty clear, but this year is a very unusual year in the north east passage. Normally the Laptev Sea would be pretty open now as in previous years. It is not. This is also partly due to the wind blowing the pack ice down south and consolidating next to the land.
So, we need to get through the straight and through the Laptev Sea. So where do we wait until we can do this? We have deliberately taken our time to get to this point, and used the wind as much as we can to conserve fuel.
Now the weather has changed, the wind direction has also changed. From the calm turquoise seas, to choppy short seas, wet, windy and cold.
So we took a long tack north, and then tacked east again. There is No hurry. We will slowly make our way east, and if we can find an island with no fast ice around, will look for a sheltered spot, until we get better ice conditions.
The other options are to Heave to and wait, but this is a sailing Yacht, she needs to sail. And if we get a Southerly blow, it could change our chances very quickly to get around, so we need to be close to react.
So, another day at the office.
There was a report on the BBC Radio 4 Today programme this morning from the crew of Northabout, and an interview with Dr. Ed Blockley from the UK Met Office about the current state of sea ice in the Arctic:
Note in particular the part at 2:59:00 where Justin Webb says to Ed:
I thought that I’d read somewhere that [Northabout] had got stuck.
I cannot help but wonder what on Earth gave him that idea?
[Edit – July 27th 2016]
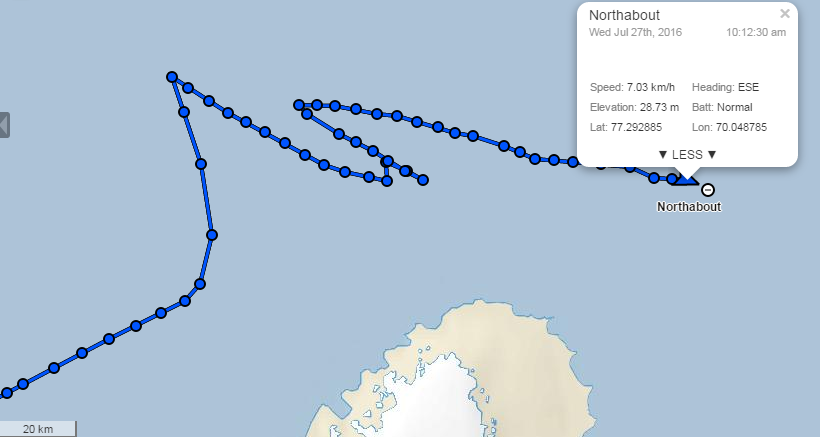
After “going round in circles” north of Novaya Zemlya yesterday Northabout is now heading East across the Kara Sea:
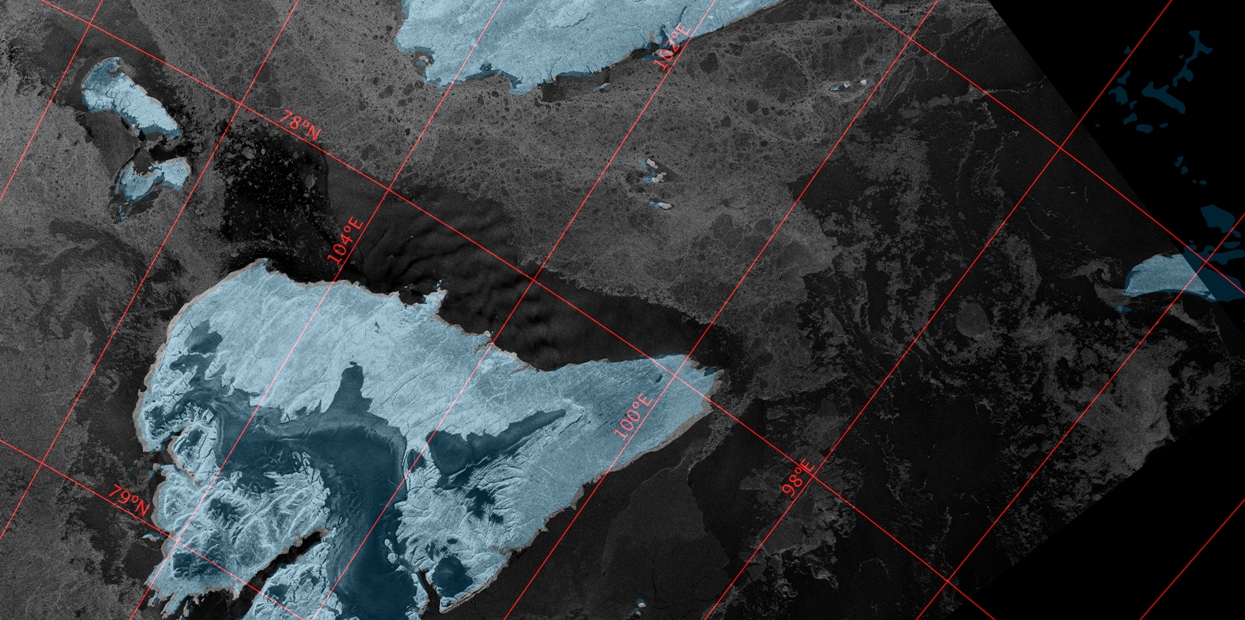
Synthetic aperture radar images from the European Space Agency’s Sentinel 1A satellite have started flowing through Polarview once again, so here’s one of where Northabout is heading:
Sentinel 1A synthetic aperture radar image of the Vilkitsky Strait on July 26th 2016
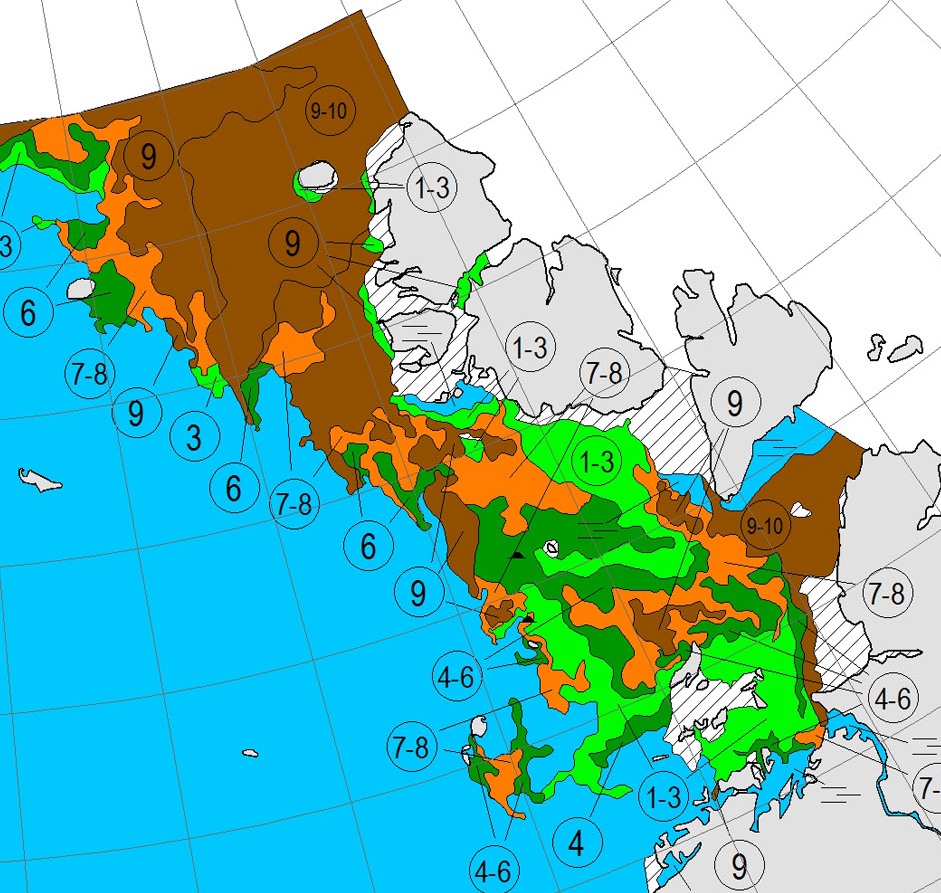
Here’s the current Arctic and Antarctic Research Institute map of the same area:
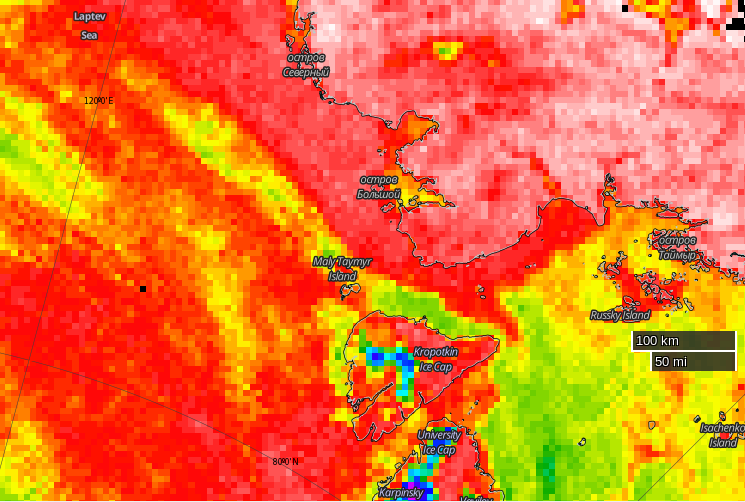
There’s still no way through by which Northabout might avoid an encounter with 9-10 tenths sea ice coverage. Then of course there’s the Laptev Sea to contend with too. Here’s the latest AMSR2 visualisation from the University of Hamburg:
It’s not exactly plain sailing there either just yet!
[Edit – July 28th 2016]
This morning Northabout has almost reached 79 degrees East, and appears to be heading in the direction of Ostrov Troynoy:
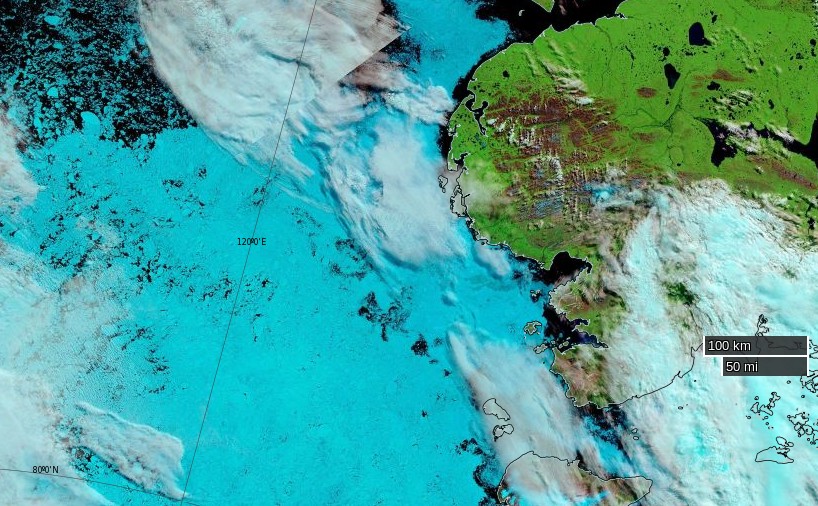
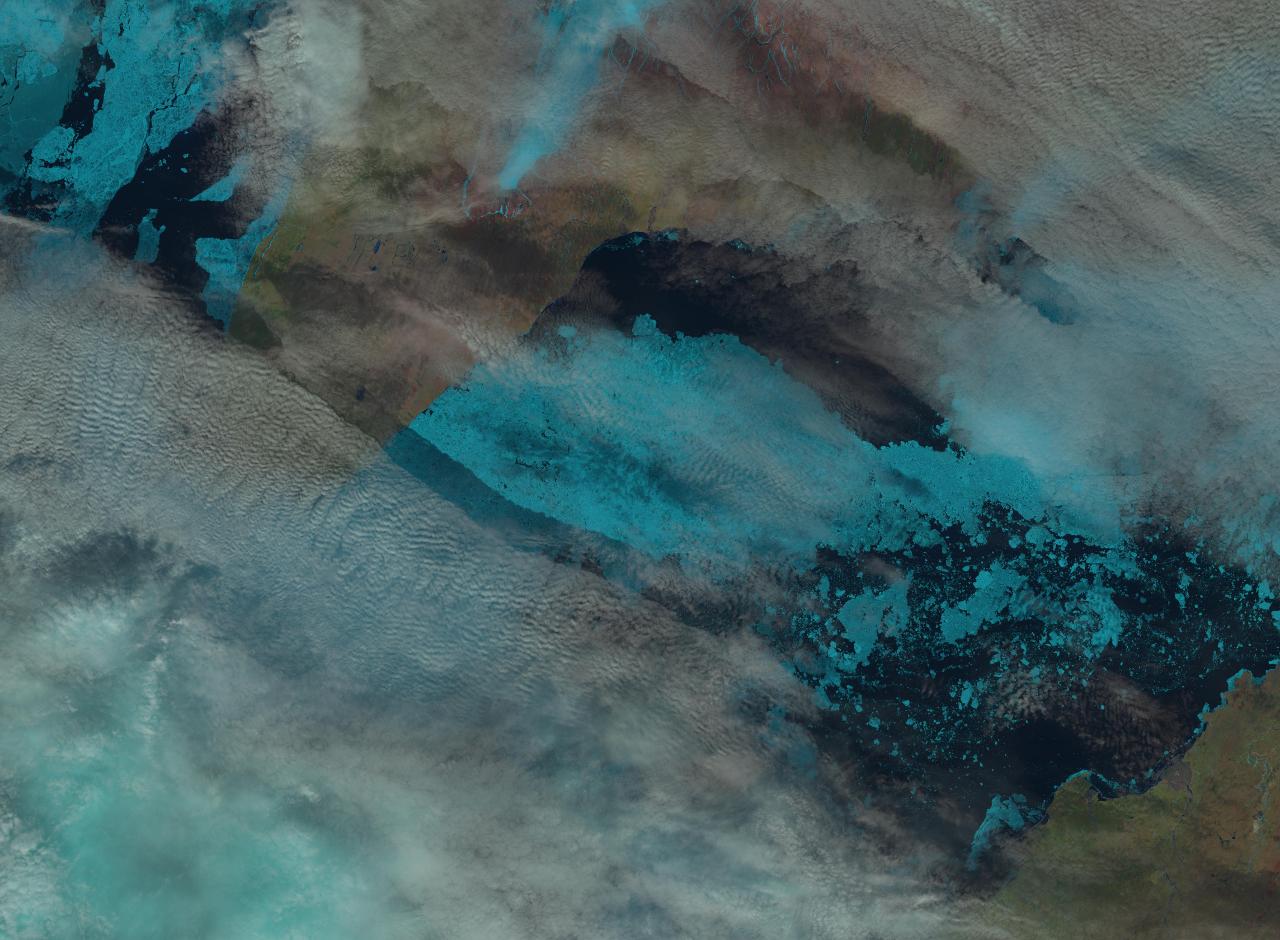
The clouds over the Laptev Sea have cleared somewhat as the recent cyclone heads for the Beaufort Sea, to reveal that the “brick wall” of ice referred to in certain quarters now looks more like Swiss cheese:
NASA Worldview “false-color” image of the Laptev on July 28th 2016, derived from the MODIS sensor on the Terra satellite
Here’s a close up look at the Vilkitsky Strait from the Landsat 8 satellite this morning. Note that unlike the MODIS image above, north is at the top of this one:
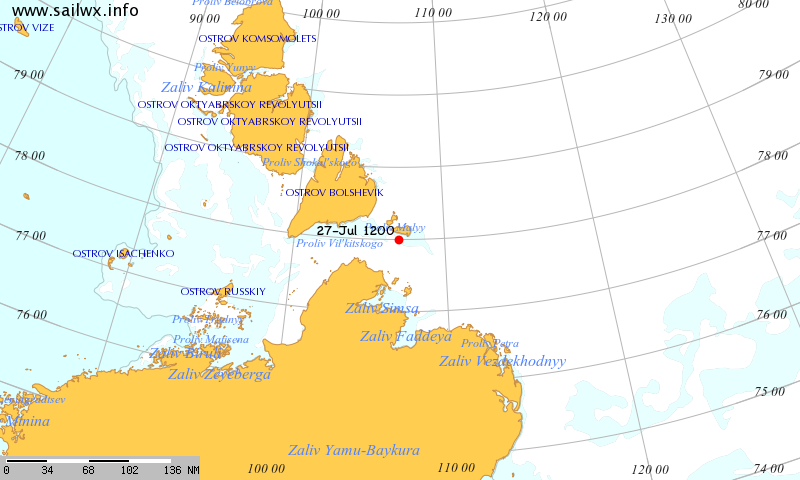
Meanwhile according to SailWX the Russian icebreaker Yamal is traversing the Vilkitsky Strait from east to west:
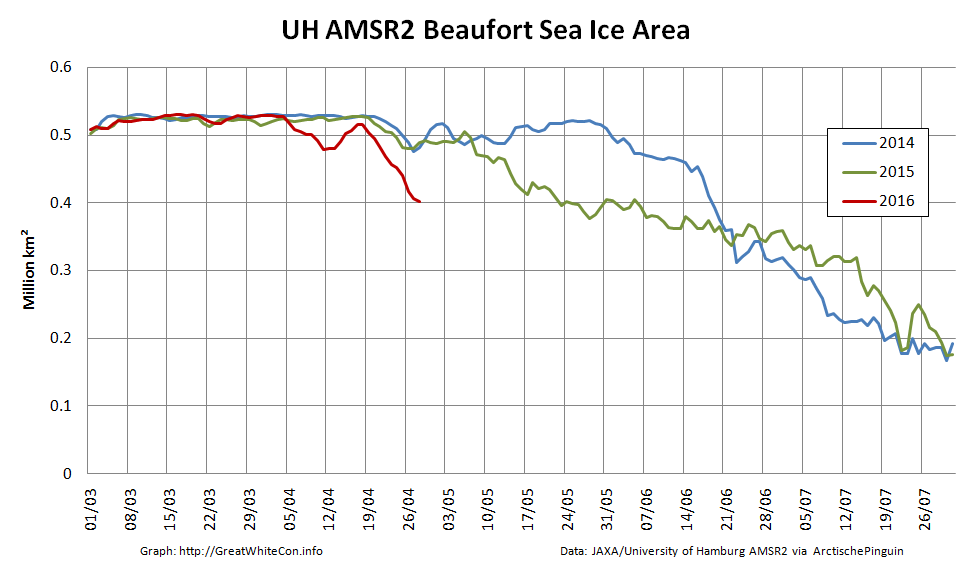
As regular readers will be aware we have been following the progress of the Great Arctic Anticyclone of 2016 for the last 3 weeks or so and the generation of increasingly large waves in the Beaufort Sea in August and September for the last 3 years or so. Today we combine the two to bring you news of anomalously large waves in the Beaufort Sea earlier this week. In actual fact any sort of waves in the Beaufort Sea at this time of year would be anomalous, since normally the Beaufort is still covered in sea ice in April!
Firstly a bit of background information. In the continuing absence of the DMSP F-17 satellite data used by the NSIDC for their Arctic sea ice metrics, here’s a close up look at Arctische Pinguin’s current Beaufort Sea ice area data:
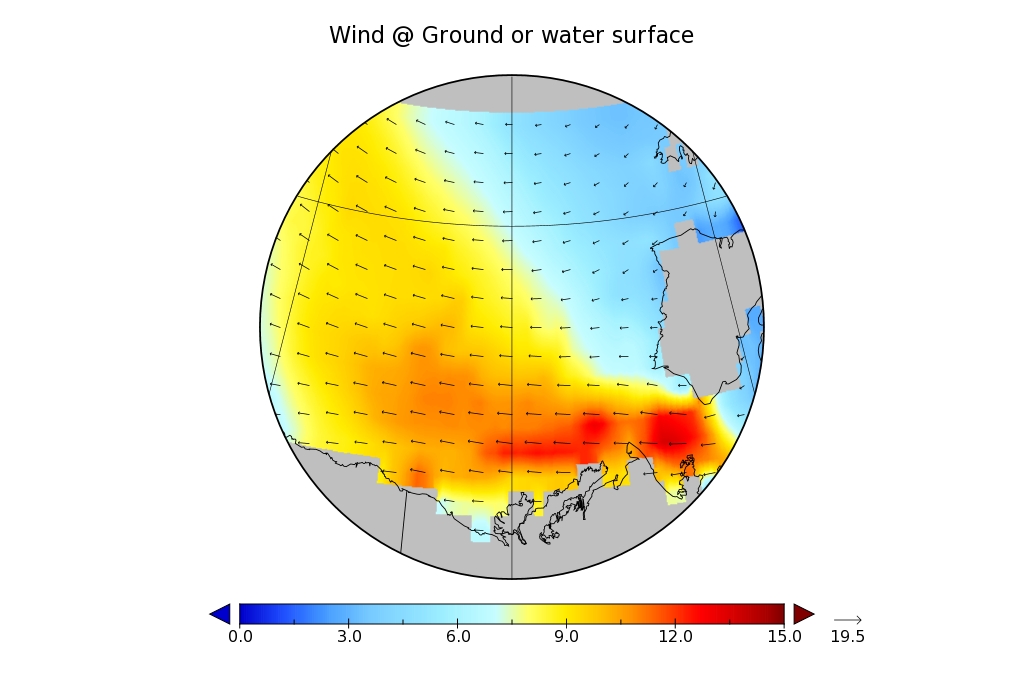
Now here’s NOAA’s WaveWatch III “hindcast” of the winds over the Beaufort Sea on April 26th 2016:
WaveWatch III wind hindcast for the Beaufort Sea on April 26th 2016
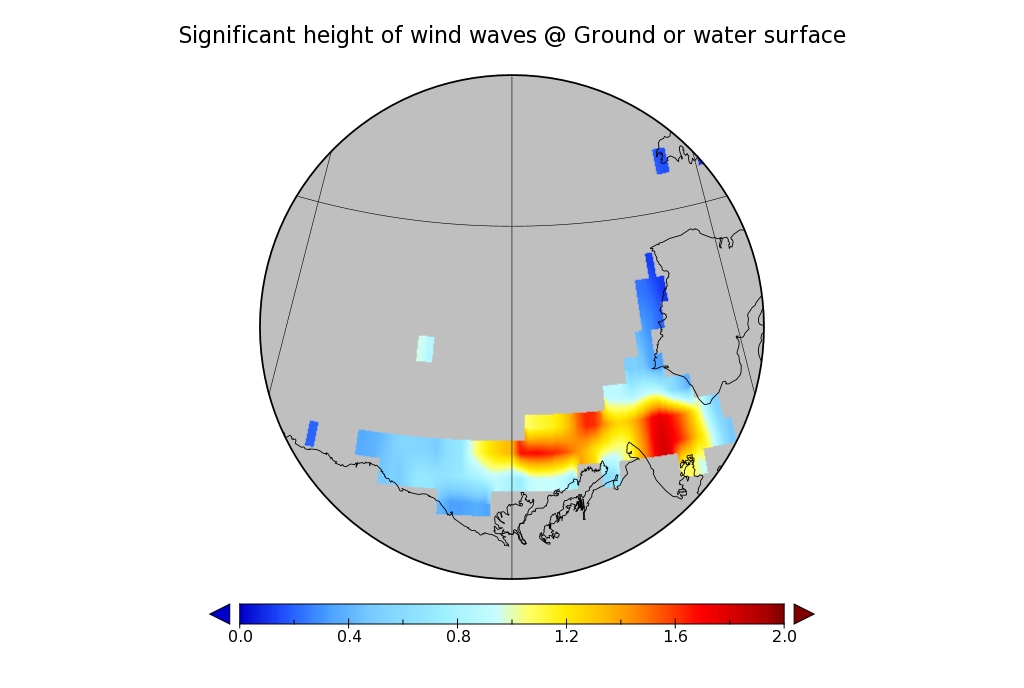
Notice the continuing easterly winds from the persistent high pressure system centred to the north of the Beaufort Sea. Next here’s the resultant wind wave height:
WaveWatch III wave height hindcast for the Beaufort Sea on April 26th 2016
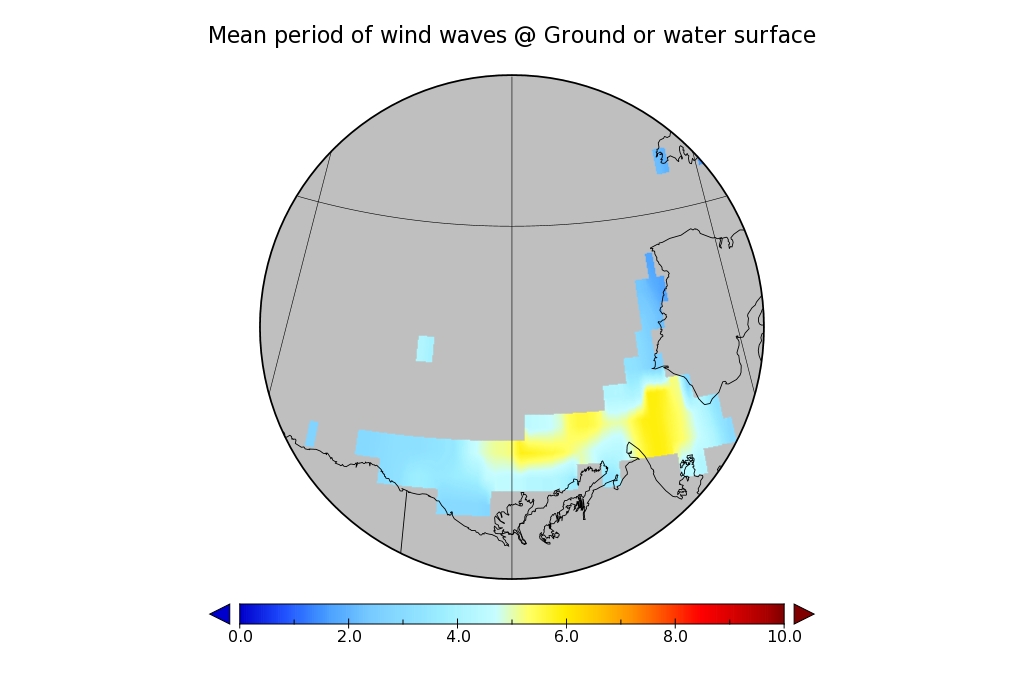
and the associated wind wave period:
WaveWatch III wave period hindcast for the Beaufort Sea on April 26th 2016
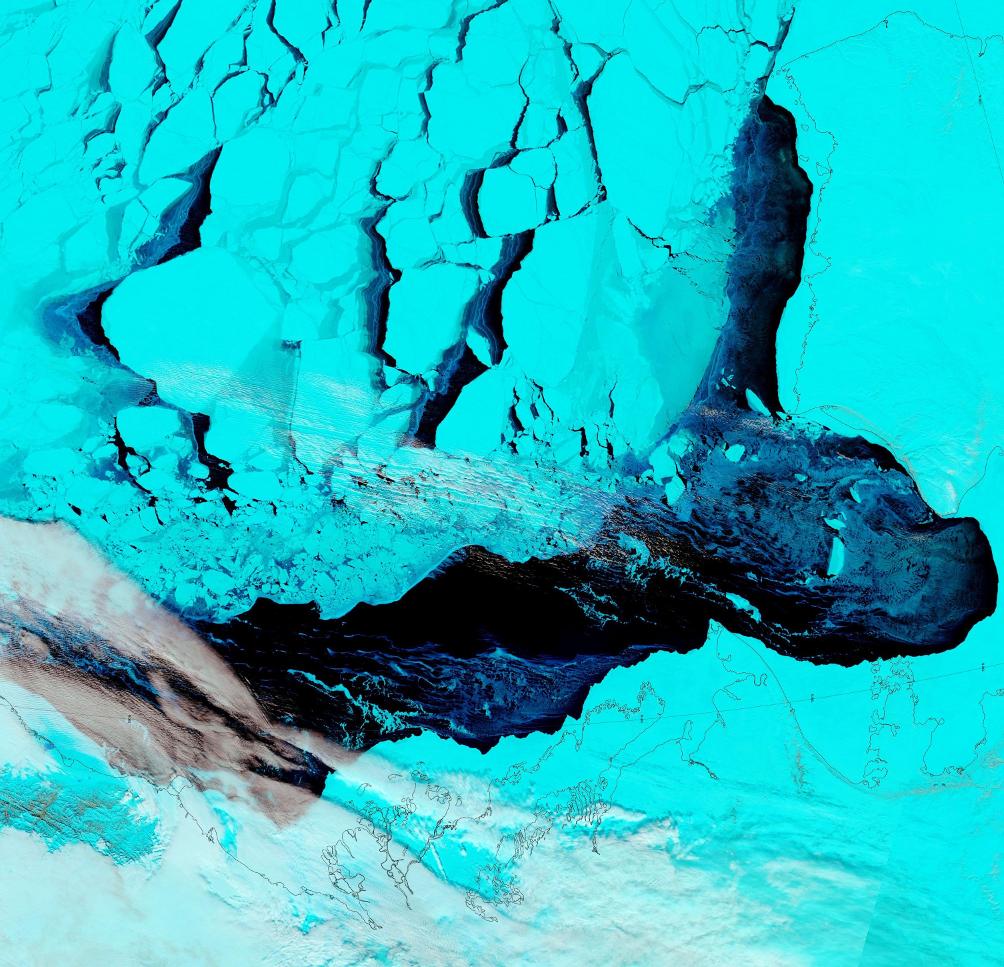
Wind waves with a height of around 1.5 meters and a period of 6 seconds wouldn’t tempt me to go out on a surfing expedition, but they would certainly be enough to interfere with the sea ice formation process, as you can see from this “pseudo-color” image of the Beaufort Sea on April 26th from the MODIS instrument on the Terra satellite:
Unfortunately the Jason 2 and recently launched Jason 3 satellites don’t measure wave heights in bodies of water as far north as the Beaufort Sea, so we’ll have to content ourselves with the modelled data from WaveWatch III. However here’s a brief video explaining how Jason 3 measurements are now used to assist WaveWatch forecasts further south:
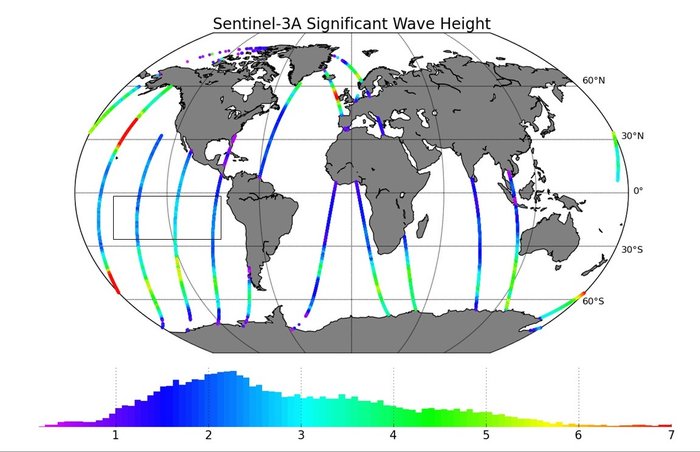
Whilst Jason 3 won’t be watching waves in the Arctic Ocean it looks as though the European Space Agency’s Sentinel 3A satellite will be providing wave height data for the Beaufort Sea in the not too distant future:
It also looks as though CryoSat-2 is already potentially providing such data, but as far as I can ascertain it’s not available in handy gridded format in the same way that the CS2 near real time ice thickness data is.
Our headline today is inspired by Tony Heller, probably still better known by his nom de guerre “Steven Goddard”, who excitedly tells the world:
NSIDC Busted!
Reader Chris71 has discovered the smoking gun on the NSIDC web site. Read on.
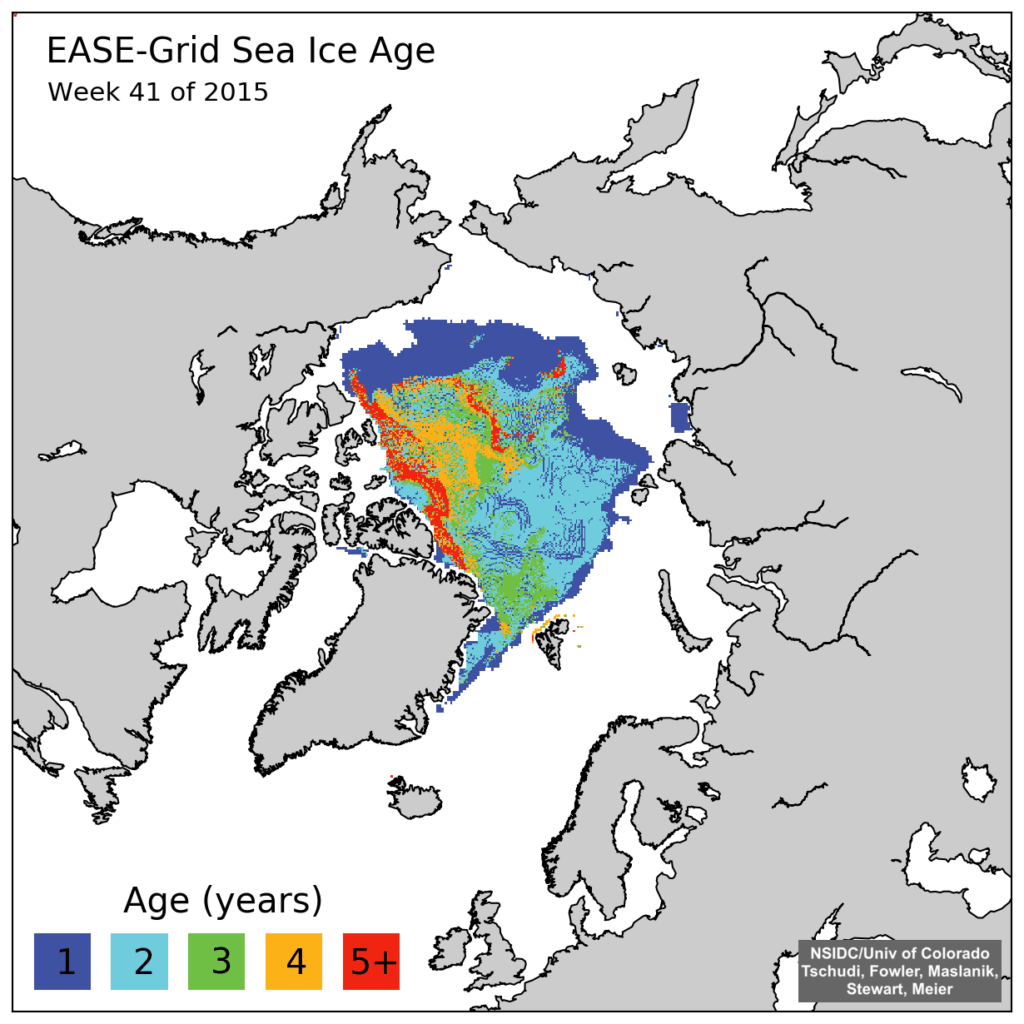
A few weeks ago, NSIDC put out this press release, claiming that 5+ year old ice is at its smallest level on record.
The press release included the map below. This is a new style map which they just started in week 39 2015. The map below is for week 41 2015. All of their previous 1984-2015 maps have been deleted from their archive.
The good news is that Chris found one of their old style maps which had not been scrubbed from their website. NSIDC has deleted the original graphs, but seem to have forgotten to get rid of the copy.
For some strange reason “Steve” neglects to mention this text that accompanied the “old style map” he so proudly displays:
Here are some graphs from the Arctic – automatically saved here, and some of them archived Enjoy! Fred aka DungeonMaster on http://forum.arctic-sea-ice.net/.
Have I got news for Chris and “Steve”? Indeed I have! If one were to bother to go to the relevant section of the NSIDC web site instead of inventing bizzare fairy tales one would be able to read this:
EASE-Grid Sea Ice Age, Version 3
This data set provides weekly estimates of sea ice age for the Arctic Ocean from remotely sensed sea ice motion and sea ice extent.
The input ice motion data used for this data set is now derived from NSIDC-0116 Version 3 data.
Checking out the detailed information provided about the NSIDC-0116 Polar Pathfinder Daily 25 km EASE-Grid Sea Ice Motion Vectors, Version 3 would also reveal:
Version 3 – February 2016.
Eliminated unrealistic AVHRR and IABP buoy velocities
Extended buoy ice motion estimates to the present
Improved browse images
Reprocessed SSMI fields using GDAL map transformations on the DMSP SSM/I-SSMIS
Daily Polar Gridded Brightness Temperatures Data Set, NSIDC-0001.
Used Ice concentration estimates greater than 15 percent from the Sea Ice Concentrations from Nimbus-7 SMMR and DMSP SSM/I-SSMIS Passive Microwave Data Set, NSIDC-0051, to indicate where ice extent is present.
Checking out the detailed information provided about the NSIDC-0611 EASE-Grid Sea Ice Age, Version 3 would further reveal:
The sea ice age data in these files are derived using data from satellite passive microwave instruments, drifting buoys, and a weather model. With these data sources, the formation, movement, and disappearance of sea ice can be observed; and these observations can, in turn, be used to estimate ice age (Maslanik et al. 2007). The ice age data are derived from a number of passive microwave imagers: the Scanning Multichannel Microwave Radiometer (SMMR), the Special Sensor Microwave/Imager (SSM/I), and the Special Sensor Microwave Imager Sounder (SSMIS). Visible and infrared data from the Advanced Very High Resolution Radiometer (AVHRR) were also utilized through 2004. In addition, International Arctic Buoy Program (IABP) drifting-buoy vectors and the National Centers for Environmental Prediction (NCEP)/National Center for Atmospheric Research (NCAR) Reanalysis Project (CDAS) are used to augment the satellite data (Tschudi 2010).
Version 3 – April 2016.
So there you have it “Steve”. Thanks to the sterling (albeit uncredited!) efforts of the all volunteer members of the Arctic Sea Ice Forum and the (presumably still paid?) scientists at the National Snow and Ice Data Center you can now explain the truth, the whole truth, and nothing but the truth of the matter to your own loyal readers.
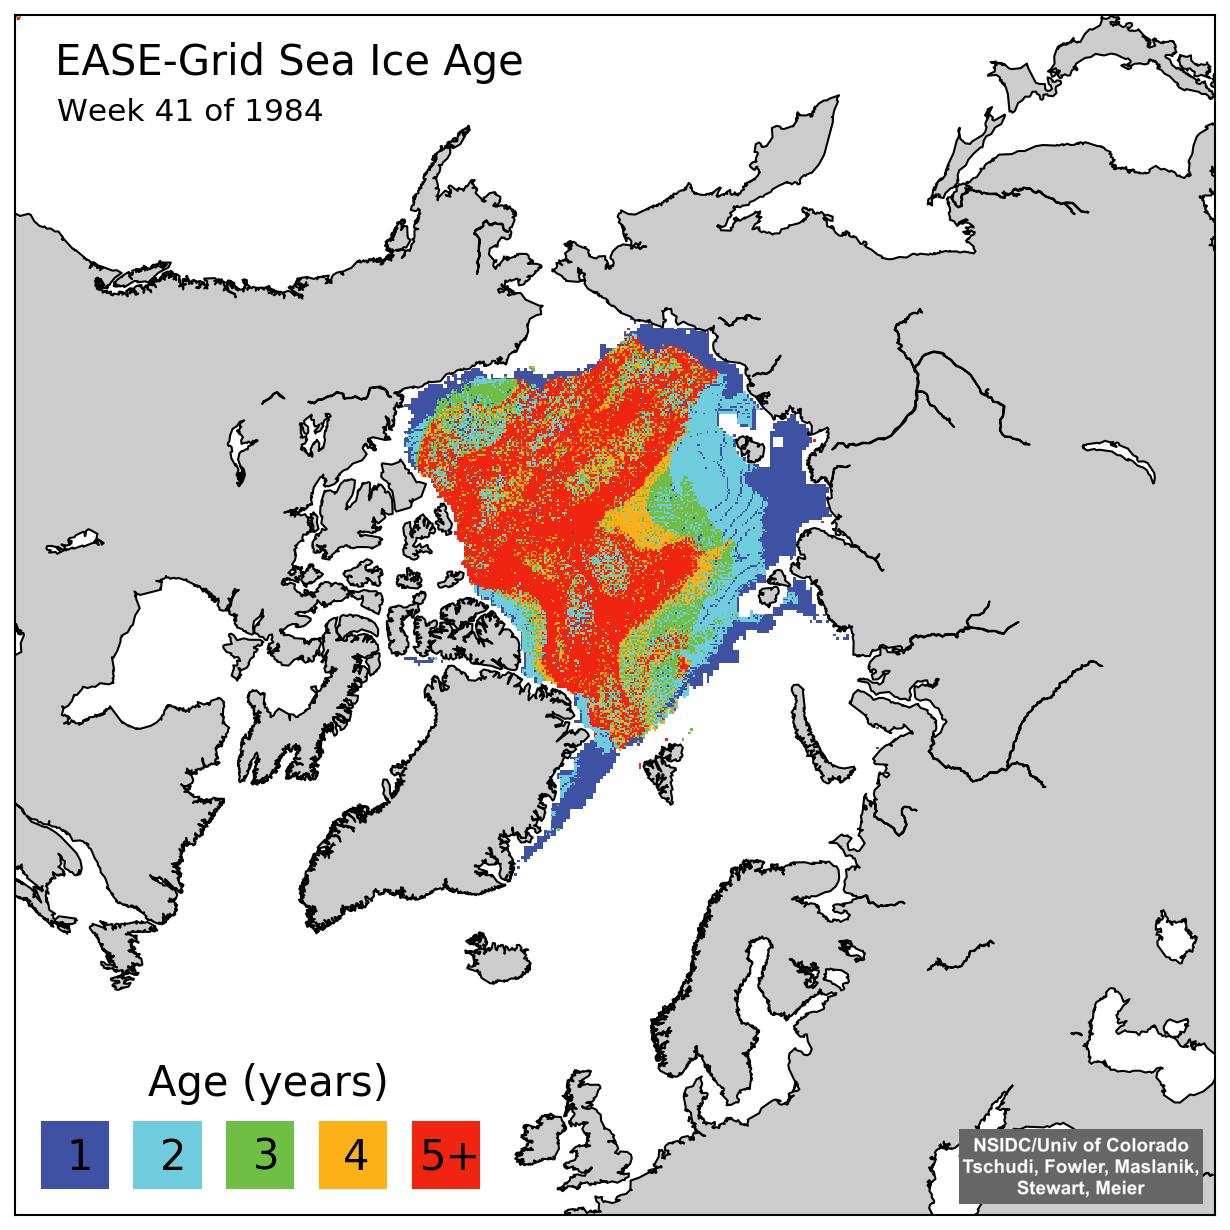
A few weeks ago the NSIDC upgraded their sea ice age product from version 2 to version 3. Here’s what the latest version of 1984 week 41 looks like:
Can you spot the difference Tony?
[Edit – May 1st 2016]
In partial answer to a question posed below, here’s an animation of Arctic sea ice age from September 2010 to May 2015. Can you see what has happened to the old ice Tony?
Original Arctic sea ice age images from: Tschudi, M., C. Fowler, J. Maslanik, J. S. Stewart, and W. Meier. 2016. EASE-Grid Sea Ice Age, Boulder, Colorado USA: NASA National Snow and Ice Data Center Distributed Active Archive Center. http://dx.doi.org/10.5067/PFSVFZA9Y85G.
[Edit – May 30th 2016]
Here’s a “Storified” summary of my Twitter “debate” with Tony Heller and Patrick Moore:
You will note that we were not the only ones to swiftly conclude that Judy’s assertion was lacking both veracity and verisimilitude! Then this morning came our old friends at the Global Warming Policy Forum with:
You will note that the GWPF adorned their “Tweet” with a graph purporting to show “Global sea ice anomalies”. We can only assume that Benny Peiser hadn’t read this April 11th article of ours, which pointed out that:
NSIDC has suspended daily sea ice extent updates until further notice, due to issues with the satellite data used to produce these images. The problem was initially seen in data for April 5 and all data since then are unreliable, so we have chosen to remove all of April from NSIDC’s archive.
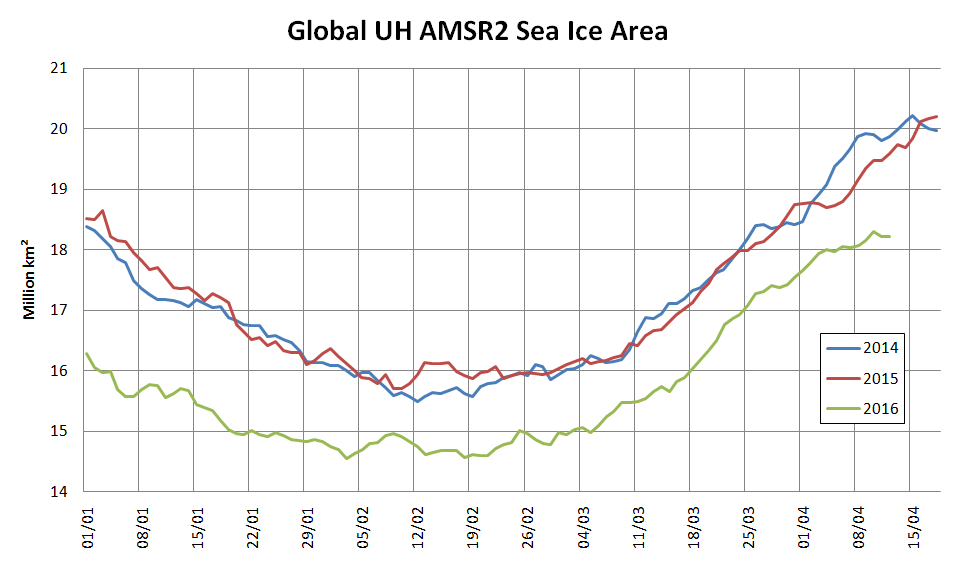
To remedy that (no doubt?) inadvertent oversight on Benny’s part here is a graph we prepared earlier of absolute global sea ice area using reliable data from the AMSR2 instrument on the Japan Aerospace eXploration Agency’s SHIZUKU satellite:
The GWPF were followed this afternoon by Anthony Watts with:
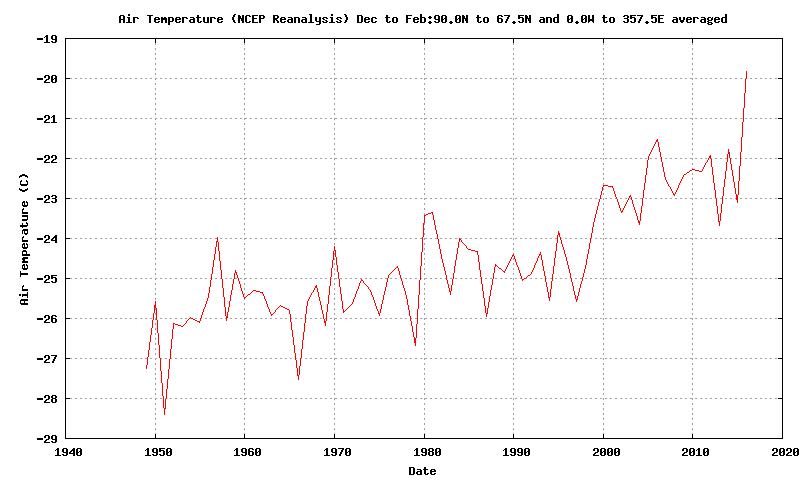
Both Prof. Curry and non Prof. Watts adorned their “Tweets” with a graph allegedly comparing “global temperature” with “tropical temperature”, but provided no graph of “polar temperature”. To remedy that (no doubt?) inadvertent oversight here is one we prepared earlier:
All members of this team of synchronised “Tweeters” provided links to an April 11th article by a certain Paul Dorian entitled, believe it or not:
In an interesting twist, the recent analysis found that the global ice area remained stable throughout the 1980s and the 1990s, while temperatures climbed suggesting “the global sea ice area is not particularly a function of the global average surface temperature.” [Source: Willis Eschenbach/”Watts Up With That” web site]
We can only assume that Paul Dorian hadn’t read this April 10th article of ours, which pointed out amongst other things that:
One feels compelled to ask why Willis’s global average temperature graph neglects to mention 2015 when he implies that it does?
Here’s an up to date version of one of those that Bill The Frog prepared for us earlier:
We must further assume that Paul hadn’t read this April 11th article by Mr. Watts either. It stated that:
A few years ago in 2009, I was the first to notice and write about a failure of the instrumentation for one of the satellites used by the National Snow and Ice Data Center (NSIDC) to show Arctic Sea Ice extent. Today, we have what appears to be a similar problem with satellite sea ice measurement.
It seems that Paul Dorian has finally read at least one out of all these informative articles, because the latest revision of his own piece of imaginative fiction now starts:
The source of global sea ice information cited in this posting was NOAA’s National Snow and Ice Data Center (NSIDC). They are now reporting issues with the satellite data used to produce these images and this information was not known at the time of the writing of this article.
Do you suppose we can now expect a similarly “fulsome apology” from the other players in this tragi-comic farce, together with all their rebloggers, retweeters, plagiarisers and other assorted acolytes?
Today’s Arctic sea ice claim comes from the Bishop Hill blog of Andrew Montford, which recently stated that:
This morning’s story appears to be the hoary old “Arctic sea ice in freefall” one.
“The Arctic is in crisis. Year by year, it’s slipping into a new state, and it’s hard to see how that won’t have an effect on weather throughout the Northern Hemisphere,” said Ted Scambos, lead scientist at the Colorado-based NSIDC.”
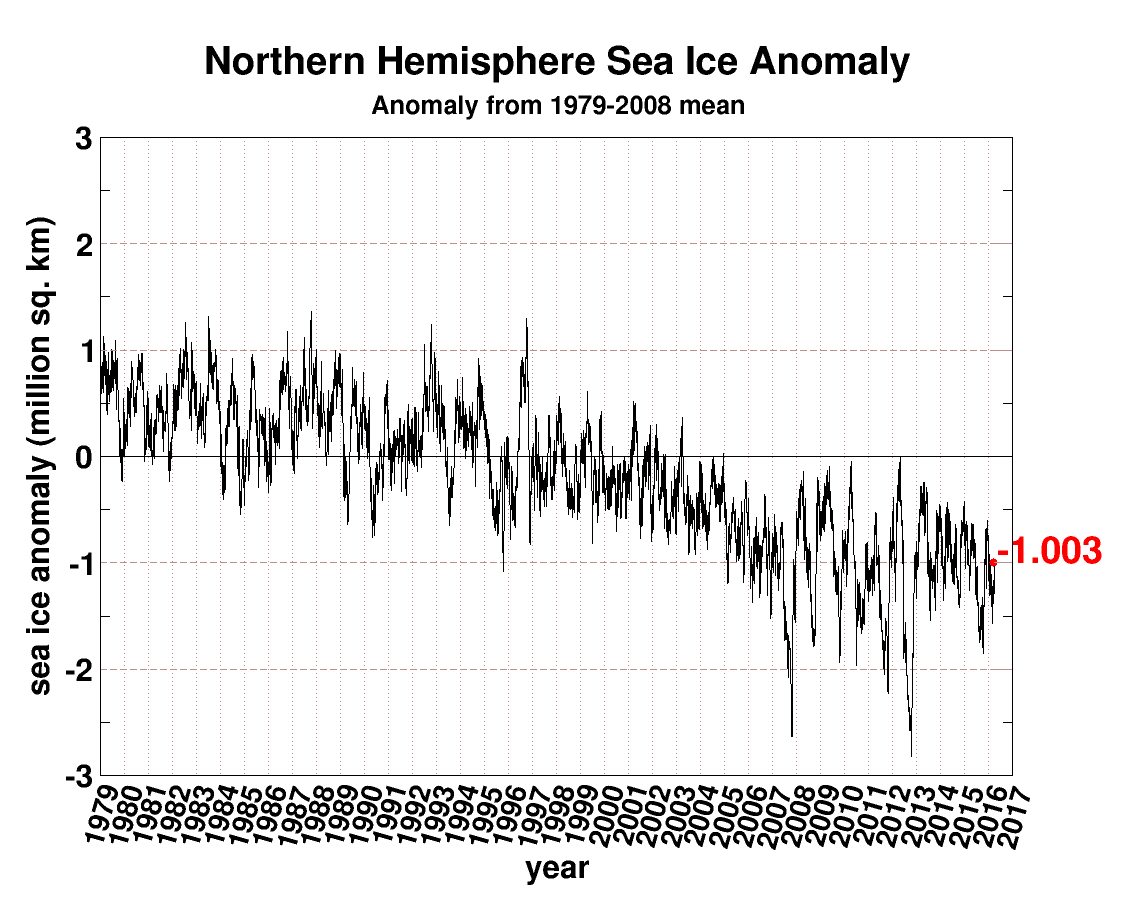
As usual on these occasions, I take a quick look at the Cryosphere Today anomaly page, where I find the sea ice apparently still stuck firmly in “pause” mode.
Having inadvertently wended my way onto The Bishop’s Hill via the northerly extension to Eli’s Rabett Warren I felt compelled, as usual, to quibble with Andrew’s “apparently firmly in ‘pause’ mode” claim. Since graphs in comments are not available over on The Hill, or The Rabett Run for that matter, let’s take a look at some graphic representations of the available data over here instead. Commenter “Golf Charlie” asks at The Bishop’s:
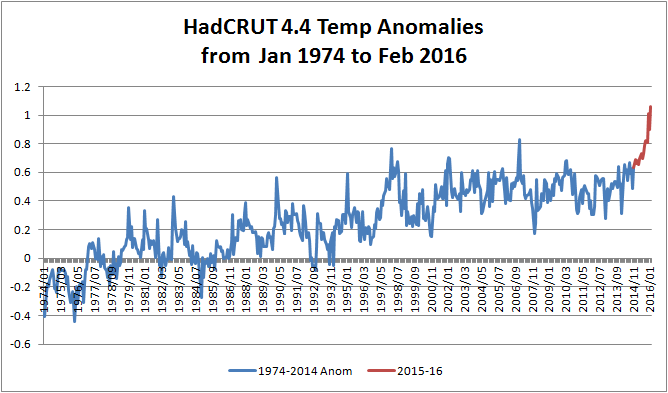
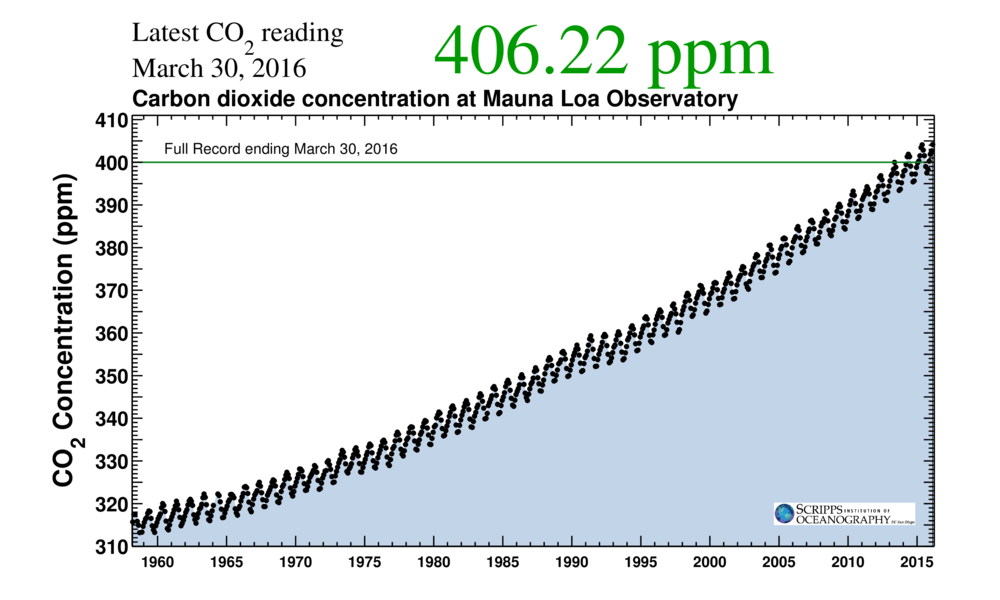
With CO₂ levels continuing to rise, why hasn’t temperature risen, and the ice disappeared as predicted?
Let’s see shall we? CO₂ levels are indeed continuing to rise:
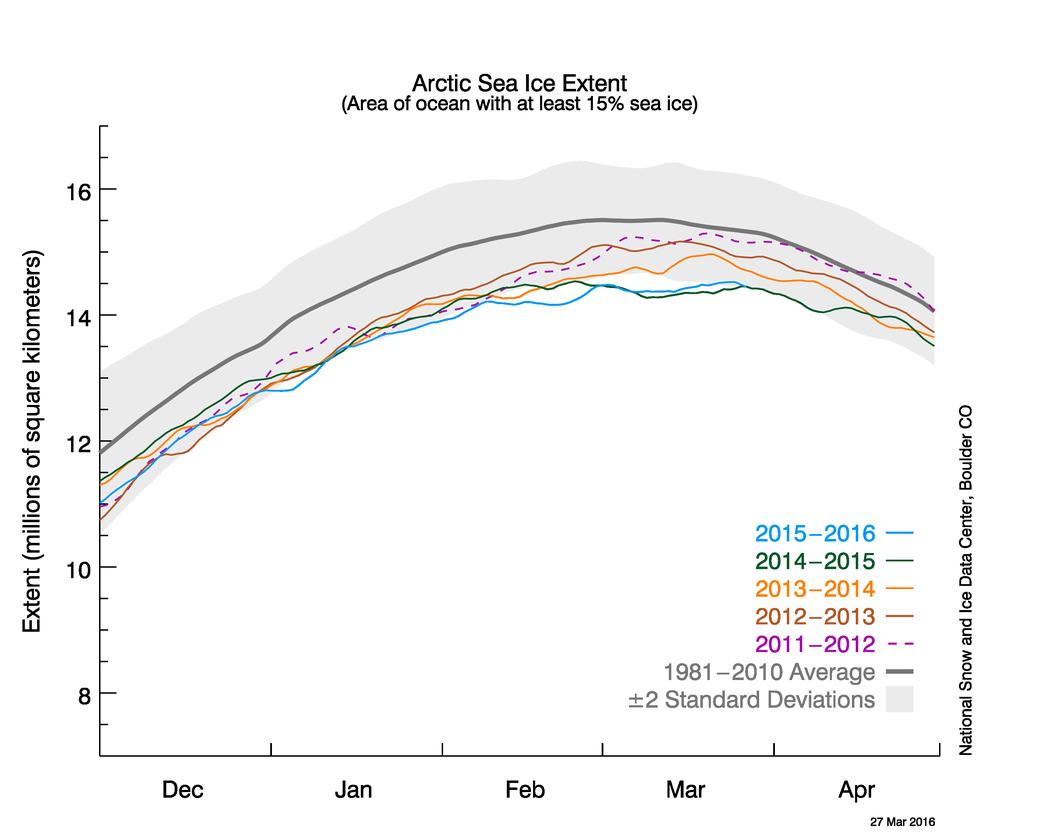
In the latest edition of their “Arctic Sea Ice News” the United States’ National Snow and Ice Data Center have announced that:
Arctic sea ice appears to have reached its annual maximum extent on March 24, and is now the lowest maximum in the satellite record, replacing last year’s record low. This year’s maximum extent occurred later than average. A late season surge in ice growth is still possible. NSIDC will post a detailed analysis of the 2015 to 2016 winter sea ice conditions in early April.
On March 24, 2016, Arctic sea ice likely reached its maximum extent for the year, at 14.52 million square kilometers (5.607 million square miles). This year’s maximum ice extent was the lowest in the satellite record, with below-average ice conditions everywhere except in the Labrador Sea, Baffin Bay, and Hudson Bay. The maximum extent is 1.12 million square kilometers (431,000 square miles) below the 1981 to 2010 average of 15.64 million square kilometers (6.04 million square miles) and 13,000 square kilometers (5,000 square miles) below the previous lowest maximum that occurred last year. This year’s maximum occurred twelve days later than the 1981 to 2010 average date of March 12. The date of the maximum has varied considerably over the years, occurring as early as February 24 in 1996 and as late as April 2 in 2010.
NASA’s Goddard Space Flight Center has also made a similar announcement, which includes this video:
The new record low follows record high temperatures in December, January and February around the globe and in the Arctic. The atmospheric warmth probably contributed to this lowest maximum extent, with air temperatures up to 10 degrees Fahrenheit above average at the edges of the ice pack where sea ice is thin, said Walt Meier, a sea ice scientist at NASA’s Goddard Space Flight Center in Greenbelt, Maryland.
The wind patterns in the Arctic during January and February were also unfavorable to ice growth because they brought warm air from the south and prevented expansion of the ice cover. But ultimately, what will likely play a bigger role in the future trend of Arctic maximum extents is warming ocean waters, Meier said.
“It is likely that we’re going to keep seeing smaller wintertime maximums in the future because in addition to a warmer atmosphere, the ocean has also warmed up. That warmer ocean will not let the ice edge expand as far south as it used to,” Meier said. “Although the maximum reach of the sea ice can vary a lot each year depending on winter weather conditions, we’re seeing a significant downward trend, and that’s ultimately related to the warming atmosphere and oceans.” Since 1979, that trend has led to a loss of 620,000 square miles of winter sea ice cover, an area more than twice the size of Texas.
This year’s record low sea ice maximum extent will not necessarily result in a subsequent record low summertime minimum extent, Meier said. Summer weather conditions have a larger impact than the extent of the winter maximum in the outcome of each year’s melt season; warm temperatures and summer storms make the ice melt fast, while if a summer is cool, the melt slows down.
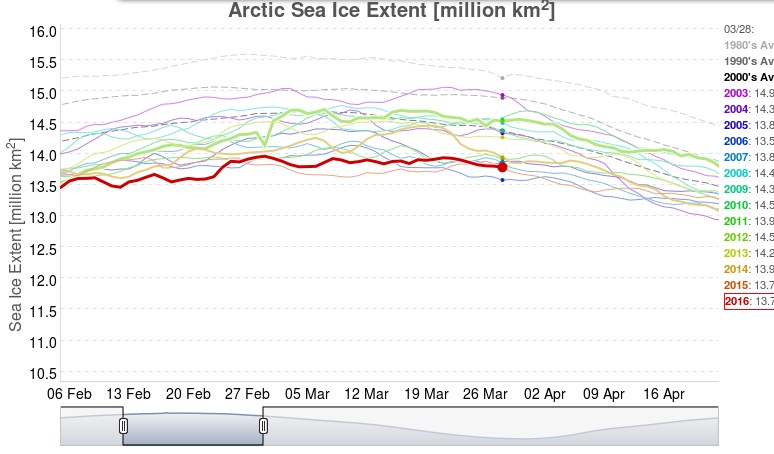
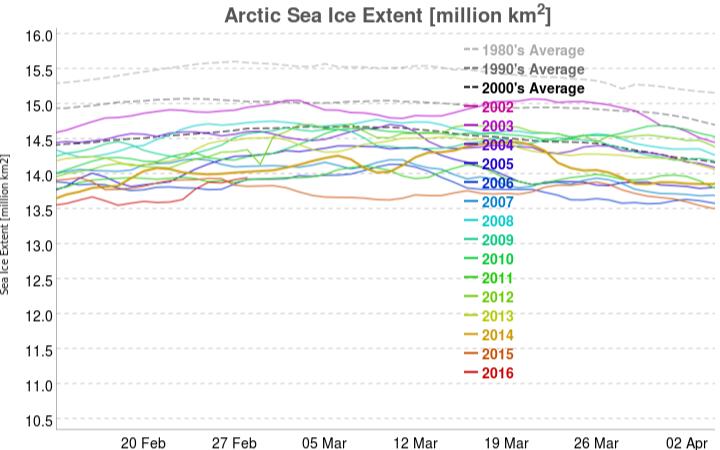
Neither NASA or the NSIDC comment on one of the striking things about this winter’s NSIDC extent chart, which has effectively “plateaued” during March 2016 following an initial peak of 14.48 million square kilometers on March 2nd, which was only recently exceeded. This is also illustrated by the JAXA Arctic sea ice extent metric, for which the 2016 maximum was 13.96 million square kilometers on February 29th:
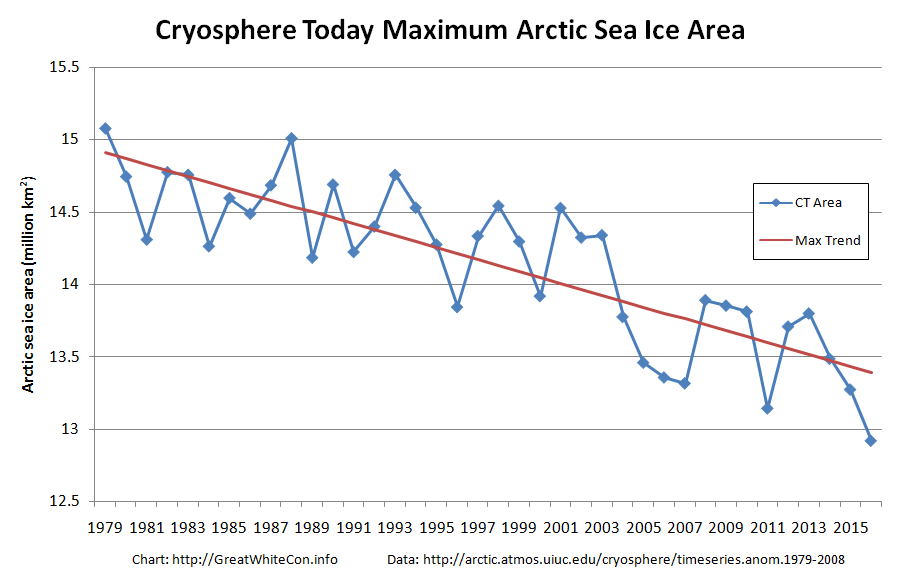
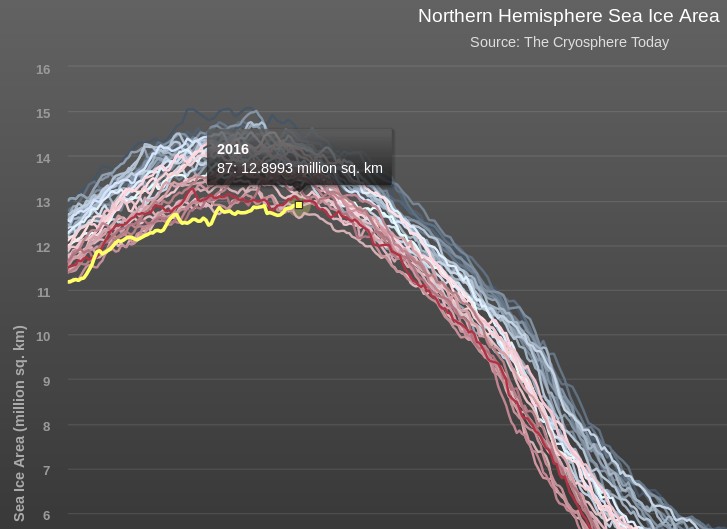
Now that the start of 2016 Arctic sea ice melting season has been called, albeit slightly hesitantly, by the experts at the NSIDC let’s also take a look at Cryosphere Today Arctic sea ice area:
The preliminary peak which we announced on March 16th has also recently been exceeded, but we now feel supremely confident in predicting that the 2016 CT area maximum will be less than 13 million square kilometers for the first time ever in the satellite record.
Thus begins what promises to be a very interesting 2016 Arctic sea ice melting season! As the NSIDC puts it:
There is little correlation between the maximum winter extent and the minimum summer extent—this low maximum does not ensure that this summer will see record low ice conditions. A key factor is the timing of widespread surface melting in the high Arctic. An earlier melt onset is important to the amount of energy absorbed by the ice cover during the summer. If surface melting starts earlier than average, the snow darkens and exposes the ice below earlier, which in turn increases the solar heat input, allowing more ice to melt. With the likelihood that much of the Arctic cover is somewhat thinner due to the warm winter, early surface melting would favor reduced summer ice cover.
Arctic sea ice extent has been anomalously low this winter. The greatest anomalies are in the European sector, specifically in the Barents Sea. To what extent are the anomalies associated with warm temperatures?
Which she answered as follows:
So, what might be causing this particular anomaly? Some possibilities are:
Gobal warming (January 2016 was warmest Jan on record, according to the surface temperature analyses
Multidecadal oscillations (e.g. stadium wave) predicts ice recovery to be occurring in the same region (European Arctic) where we see the sea ice decline).
Seasonal weather circulation patterns – this has been a year with with unusual weather patterns, with both low temperature and high temperature records being set.
As regular readers will already be aware we have been blogging about anomalously warm temperatures in the Arctic all year and so felt well qualified to contribute to the “debate”. What a job that turned out to be! Early on in the proceedings the anticipated pronouncement was made by one of Judith’s “denizens”. A link to a ludicrously inaccurate article on Watts Up With That accompanied by the following words of wisdom:
Other measures are high.
Which of course they aren’t! Instead of stating the bleedin’ obvious Professor Curry replied:
I spotted this, no idea what to make of it.
You would think she and her denizens would therefore have been pleased when I attempted to explain to her what to make of it, but you would have been mistaken. The icing on the ad hominem cake was the aforementioned Anthony Watts driving by to accuse me of all sorts of nefarious activities without providing a single shred of evidence and then running for the hills when invited to actually prove his ludicrous allegations.
Since the denizens of “Climate Etc.” aren’t particularly interested let’s take stock here instead shall we? After every Arctic area and extent metric under the sun sitting at “lowest *ever” levels for weeks a recent increase in coverage on the Pacific side of the Arctic has changed that. The most up to date example of that is the JAXA/ADS extent, which currently looks like this:
The latest reading is the merest whisker above 2015’s record low maximum. However in other respects things are most certainly not comparable with 2015. See for example this concentration comparison from Andrew Slater of the NSIDC:
Much more ice on the Pacific periphery where it will all have disappeared by September, as opposed to much less ice on the Atlantic side, even well to the north of 80 degrees latitude where the sun still does not shine. Here’s a video revealing how the sea ice North of the Pacific Ocean has been reacting to the sequence of hurricane force storms that have been passing through the area over the past couple of months:
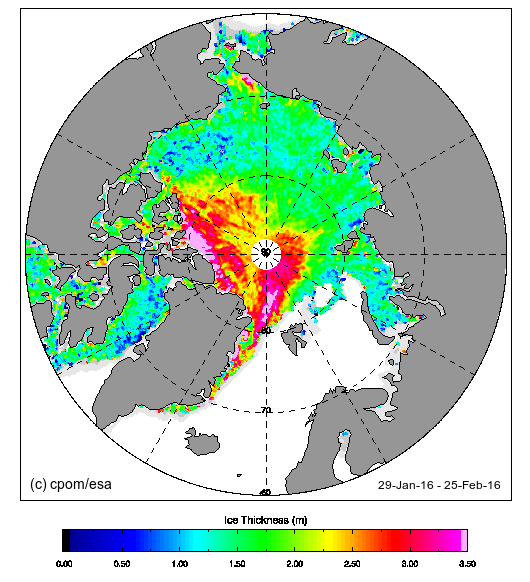
Now let’s take a look at “near real time” Arctic sea ice thickness as measured by the CryoSat 2 satellite:
Notice the absence of any thick ice in the Beaufort and Chukchi Seas, an obvious difference from last year? Notice too the large area of thick ice that looks as though it’s heading towards the Fram strait exit from the Central Arctic. Here’s another video, this time of sea ice movement over on the Atlantic side of the Arctic Ocean:
Those dark areas between Svalbard and the North Pole are suddenly starting to look as though they represent reality rather than a mere “artifact”, although perhaps they are merely transient evidence of yet another Arctic “heat wave”?
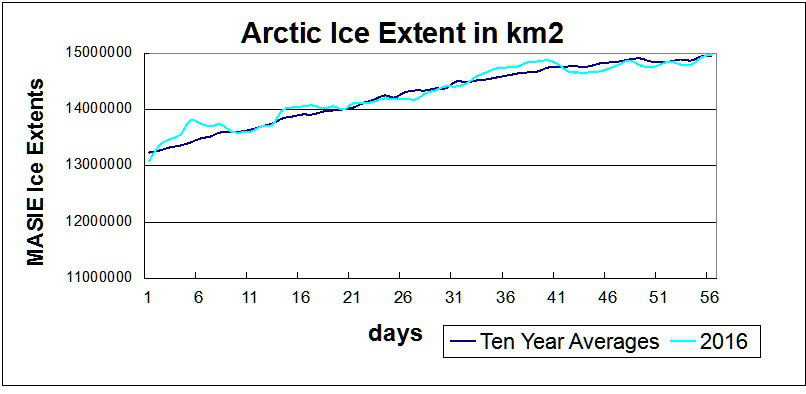
Our title for today is a reference back to a 2015 article by Paul Homewood on his “Not A Lot Of People Know That” blog, in which he told a load of old porky pies about the National Snow and Ice Data Center’s graphs of Arctic sea ice extent. Only last week Mr. Homewood cooked up another pile of porky pies concerning the Danish Meteorolical Institute’s Arctic sea ice extent metric. Now he has turned his pie baking skills to the Multisensor Analyzed Sea Ice Extent (MASIE for short), which is “a prototype collaborative product of the National Ice Center and NSIDC”.
Mr. Homewood obviously hadn’t done a whole lot of homework on MASIE before firing up his porky pie production line, since he used the self same recipe posted on the so called “Science Matters” blog of Ron Clutz shortly before. In fact he just reprinted the first part of Ron’s article and added a handy link to Ron’s even bigger pile of porky pies beneath it. Hence both Paul and Ron’s web sites currently proudly proclaim that:
Something strange is happening in the reporting of sea ice extents in the Arctic. I am not suggesting that “Something is rotten in the state of Denmark.” That issue about a Danish graph seems to be subsiding, though there are unresolved questions. What if the 30% DMI graph is overestimating and the 15% DMI graph is underestimating?
The MASIE record from NIC shows an average year in progress, with new highs occurring well above the 2015 maximum:
While I am compelled to agree with Ron and Paul that “something strange is happening in the reporting of sea ice extents in the Arctic” we disagree about everything else! One reason for that is because only a few days ago I interviewed NASA scientist Walt Meier following a suggestion by Ron Clutz that I do precisely that. Please read the edited highlights of that interview, and note in addition that Walt assured me that he had not previously been contacted by either of Messrs. Clutz and Homewood. Having never previously contacted Mr. Meier, here’s what Ron Clutz would have his loyal readership believe this weekend:
NOAA Is Losing Arctic Ice
Why the Discrepancy between SII and MASIE?
The issue also concerns Walter Meier who is in charge of SII, and as a true scientist, he is looking to get the best measurements possible. He and several colleagues compared SII and MASIE and published their findings last October. The purpose of the analysis was stated thus:
Our comparison is not meant to be an extensive validation of either product, but to illustrate as guidance for future use how the two products behave in different regimes.
Here is what Dr. Meier’s peer reviewed paper from October last year concluded on the matter:
Operational modelers require timely data that are as accurate as possible to initialize forecast models. In particular, an accurate ice edge is important because of the influence of the interaction of sea ice and water with the overlying atmosphere on the model fluxes. Consistency of data is also desirable for operational models, but is a secondary concern because the models are regularly reinitialized for their synoptic forecasts. Operational observations like MASIE make the most sense for these applications. However, the quality and amount of information used to produce the operational analyses vary.
Climate modelers desire consistent long-term data to minimize model biases and better understand and potentially improve model physics. The passive microwave record is useful, but has limitations. Regions of thin ice are underestimated and if the ice cover is diffuse with low concentration, ice-covered regions may be detected as open water. Even thin ice modifies heat and moisture transfer and thus may affect atmospheric and oceanic coupling. Surface melt results in an underestimation of concentration. This should be considered when evaluating model concentrations with passive microwave data.
and here once again is what he told me a few short days ago:
Since the quantity and quality of [MASIE] data varies the time series will not be consistent over time.
For some strange reasom Mr. Clutz’s article mentions none of this. Needless to say I have attempted to bring this unfortunate oversight to the attention of Ron & Paul:
Even more unfortunately it seems that their joint acute snow blindness has got even worse over the last few days, since they still haven’t noticed my link to Walt Meier’s words waiting patiently in their WordPress.com “moderation queues”.
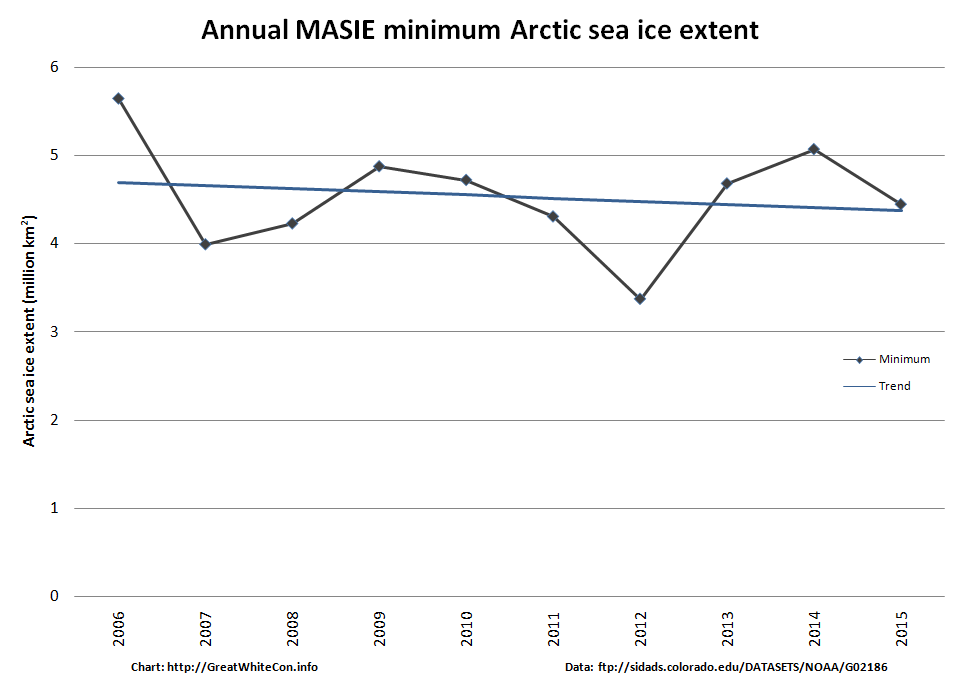
Whilst we wish them on their recovery from their painful ailment, here’s an alternative interpretation of the MASIE data:
Operational modellers for the use of! Here’s what the NSIDC’s Sea Ice Index currently reveals to climate scientists:
For some reason best known to himself Anthony Watts has jumped on the “DMIGate” bandwagon started by Paul Homewood over on this side of the Atlantic a few days ago. In his latest article Mr. Watts quotes with approval the “Not A Lot Of People Know That” article which we have already covered in some depth.
Here yet again is one of my comments that recently ended up on the NALOPKT cutting room floor:
You will note that I was suggesting that Ron Clutz’s extremely selectively interpretation of some of Walt Meier’s academic papers left a lot to be desired. Particularly given the additional fuel added to the “skulduggery” fire by the Watts Up With That article it seemed sensible to phone up NASA and ask Walt for his views on the second hottest Arctic sea ice topic on the planet at the moment, according to Messrs. Clutz and Homewood at least. That is the relative merits of Multisensor Analyzed Sea Ice Extent (MASIE for short) versus the National Snow and Ice Data Center’s Sea Ice Index (SII for short) for determining Arctic sea ice trends.
MASIE sea ice products are developed from National Ice Center (NIC for short) data with support from the U.S. Navy and from NOAA. MASIE is hosted by NOAA@NSIDC.
whereas:
The Sea Ice Index provides a quick look at Arctic- and Antarctic-wide changes in sea ice. It is a source for consistent, up-to-date sea ice extent and concentration images and data values from November 1978 to the present.
As luck would have I managed to get through to Walt on my second attempt, and he graciously agreed to be interviewed at extremely short notice. He told me that whilst he now worked at NASA he used to be at the NSIDC, and still collaborated with them. Here are the edited highlights of his thoughts on “MASIE v SII”:
MASIE repackages data from the NIC, and incorporates an ice edge hand drawn by analysts working with whatever satellite data they have available at the time. It is an “operational” product designed to produce a “best effort” ice edge each day, based on whatever data may be available at the time.
Visual data is obviously not available in winter, and the ice edge is often obscured by clouds in summer. Synthetic Aperture Radar can “see in the dark” and through clouds, but suffers from different limitations. The whole of the Arctic isn’t covered every day for example. In addition, and unlike the SII, data from different satellite sensors is incorporated which means there are inevitably inconsistencies from day to day and from year to year. There is also an element of “human subjectivity” because different analysts are working with different sources of data from one day to the next. Since the quantity and quality of data varies the time series will not be consistent over time.
On the other hand the SII was designed to use a consistent methodology over a long period of time using a single type of sensor. 100% automatically processed passive microwave data is the “gold standard” when it comes to determining sea ice trends. It is subject to some biases and thus is not necessarily as accurate on a given day as MASIE. However, the biases are consistent over time, so the time series will be consistent over time. This means that year-to-year comparisons and trend estimates will be more accurate in the passive microwave data than in MASIE.
So there you have it. If you’re on the bridge of a vessel sailing in Arctic waters then MASIE is the right tool for the job. If on the other hand you’re sat in front of a computer trying to get the best estimate of trends in Arctic sea ice extent then the Sea Ice Index is what you’ll grab from your toolkit.
Having had a chance to examine the “evidence” of DMI “skulduggery” presented by Messrs. Watts and Homewood, Walt sent me a follow up email. Here is what it says:
Regarding DMI, the issue seems quite simple. The 30% plot is an older version that they stopped supporting as they transitioned to the 15% plot. I don’t know specifically why the 30% plot went awry, but there is generally automatic quality control done to make sure the final results are accurate and consistent. If such QC is not done, a lot of incorrect values can occur. I suspect that since the older version was no longer supported, the QC wasn’t being watched and something went wrong that they didn’t bother to fix (or maybe didn’t even notice) because the new 15% version is the official DMI output.
Not a lot of people know that, because Watts, Homewood et al. have developed the nasty habit of “snipping” comments to that effect as and when the mood takes them, which based on my own experience seems to be remarkably often in this day and age.
This website uses cookies to improve your experience. We'll assume you're ok with this, but you can opt-out if you wish. Cookie settingsACCEPT
Privacy & Cookies Policy
Privacy Overview
This website uses cookies to improve your experience while you navigate through the website. Out of these, the cookies that are categorized as necessary are stored on your browser as they are essential for the working of basic functionalities of the website. We also use third-party cookies that help us analyze and understand how you use this website. These cookies will be stored in your browser only with your consent. You also have the option to opt-out of these cookies. But opting out of some of these cookies may affect your browsing experience.
Necessary cookies are absolutely essential for the website to function properly. This category only includes cookies that ensures basic functionalities and security features of the website. These cookies do not store any personal information.
Any cookies that may not be particularly necessary for the website to function and is used specifically to collect user personal data via analytics, ads, other embedded contents are termed as non-necessary cookies. It is mandatory to procure user consent prior to running these cookies on your website.