World renowned climate scientist Roger Pielke Jr. has just published an interesting paper in the highly respected academic journal the New York Post. It is entitled:
“Surprise! Ice is rebounding at BOTH poles — climate is more complex than we know“
According to Roger’s op-ed:
When it comes to climate change, to invoke one of Al Gore’s favorite sayings, the biggest challenge is not what we don’t know, but what we know for sure but just isn’t so.
Two new studies show that the Earth’s climate is far more complex than often acknowledged, reminding us of the importance of pragmatic energy and climate policies.
One of them, led by researchers at China’s Tongji University, finds that after years of ice sheet decline, Antarctica has seen a “surprising shift”: a record-breaking accumulation of ice…
Roger then heads for the far north, where he assures his learned readers that:
A second new paper, a preprint now going through peer review, finds a similar change at the opposite end of the planet.
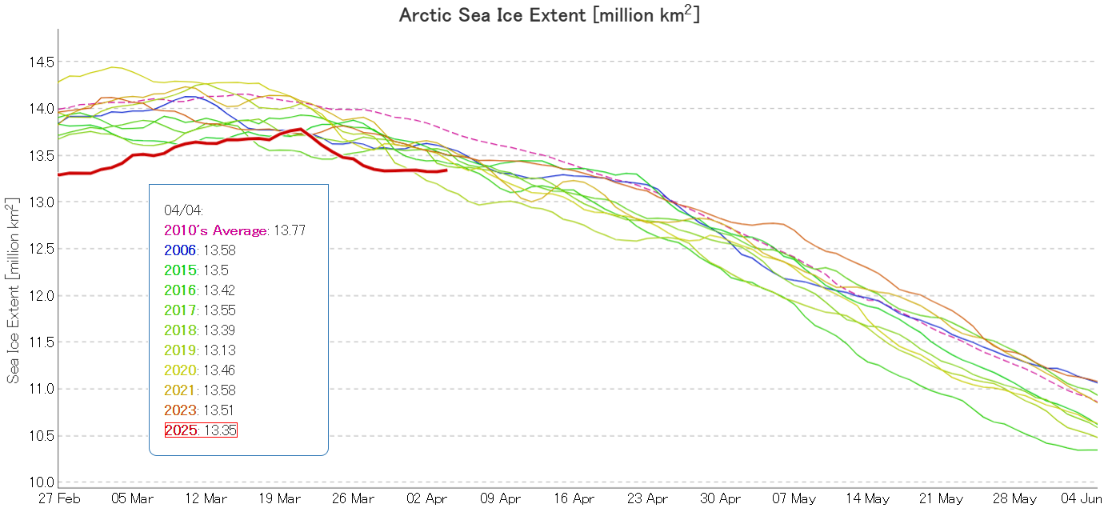
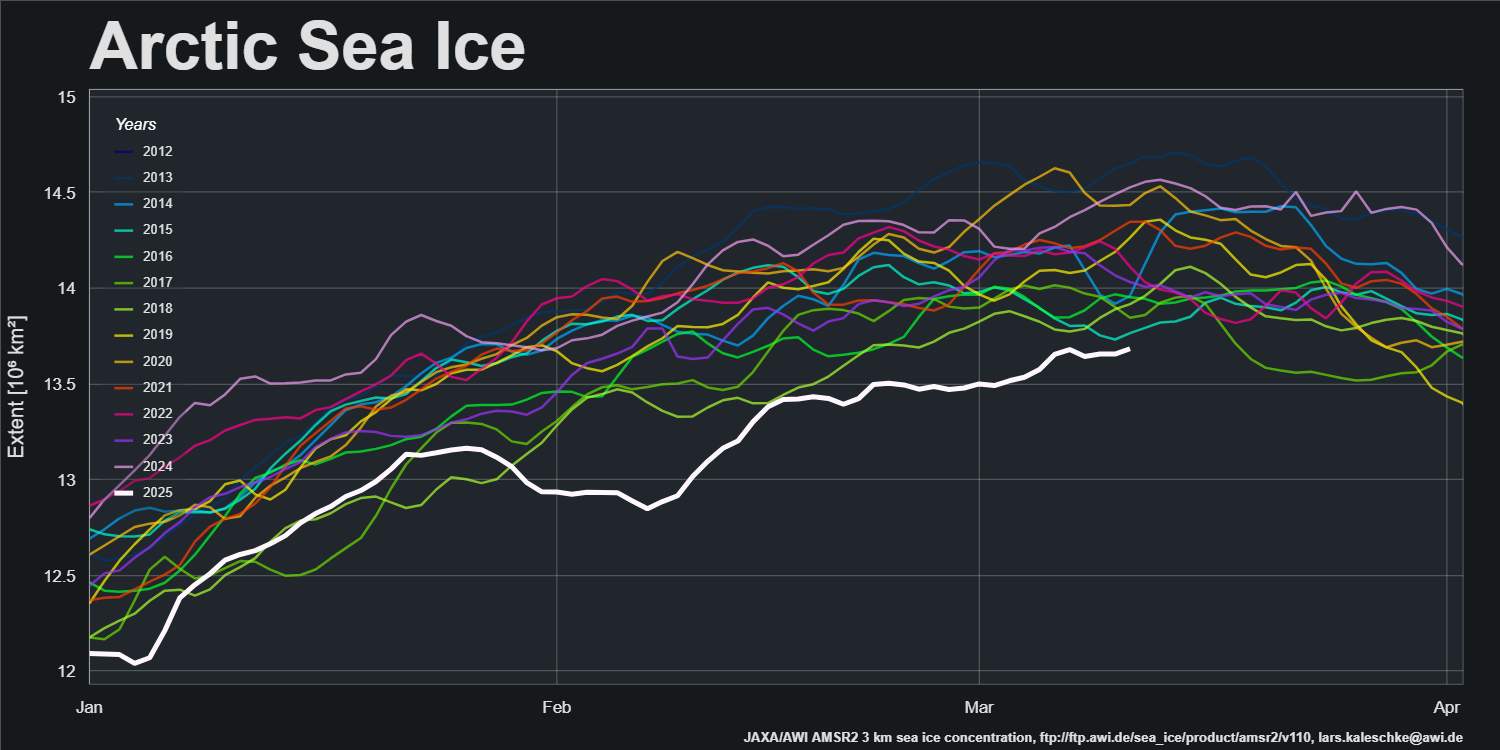
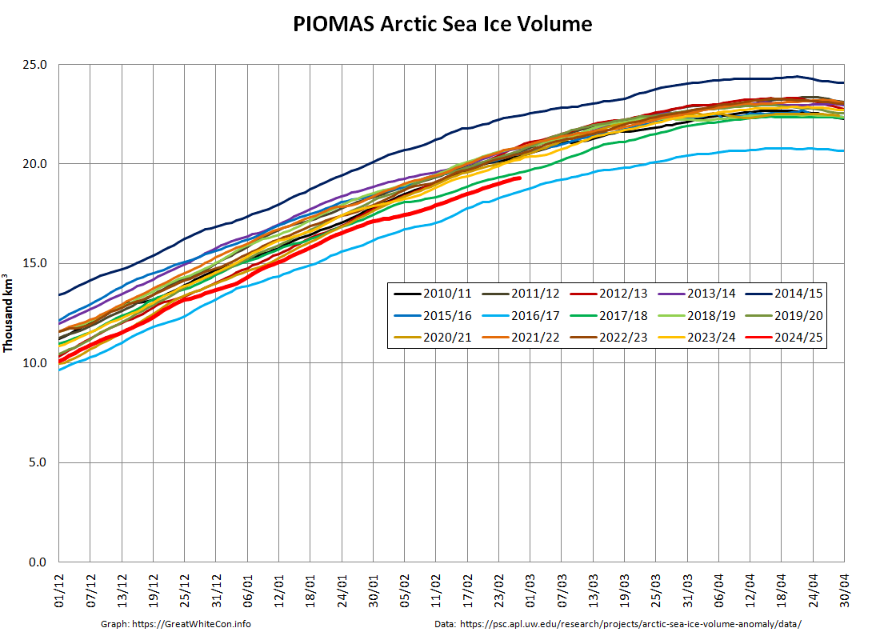
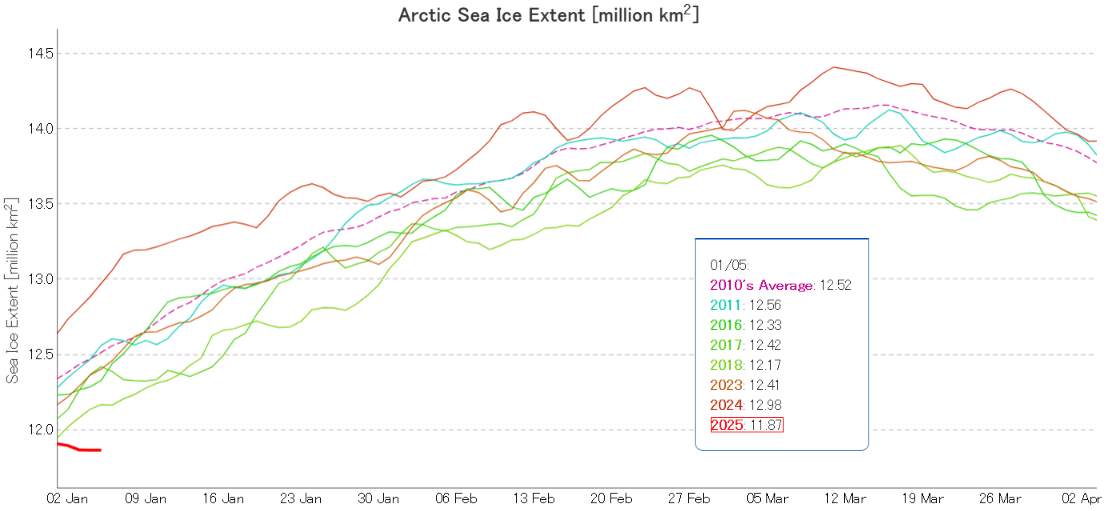
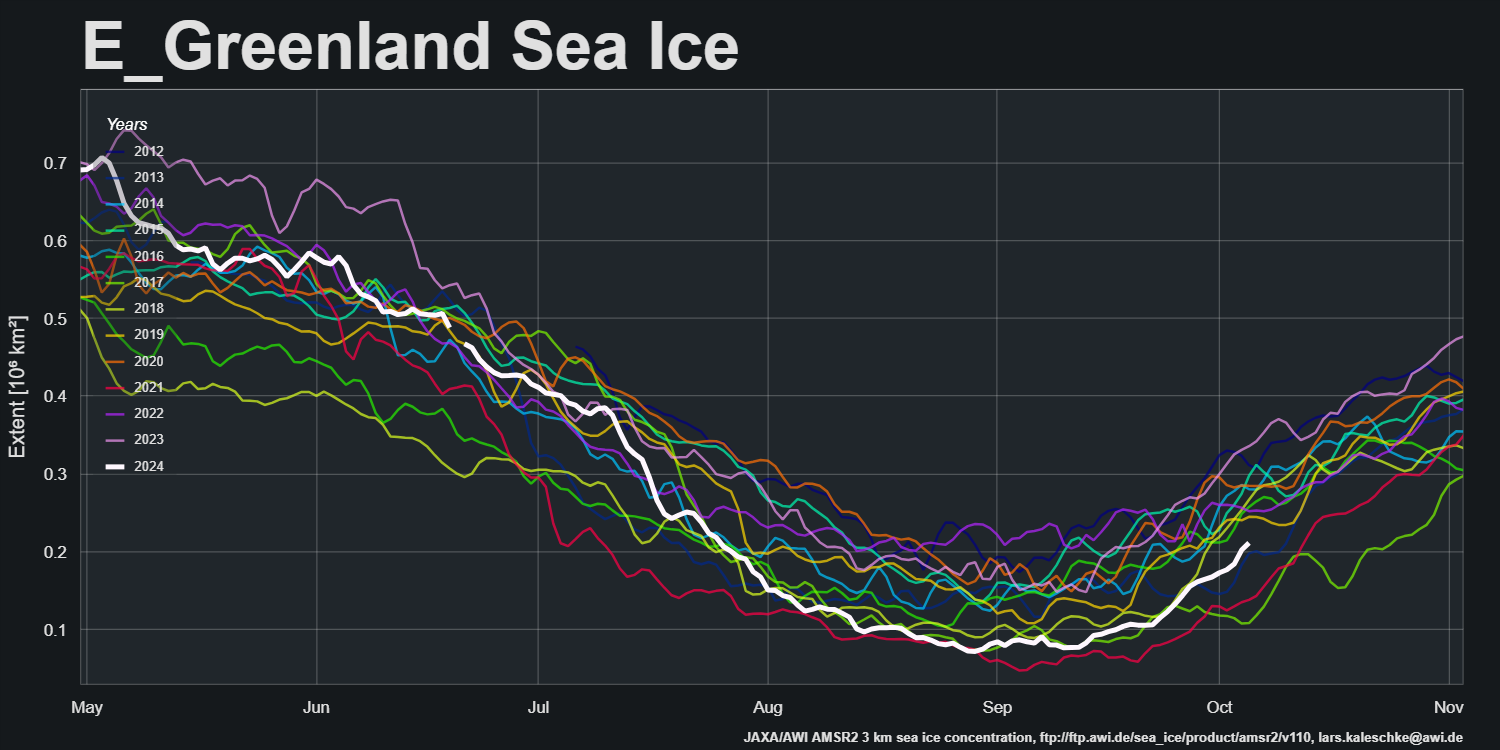
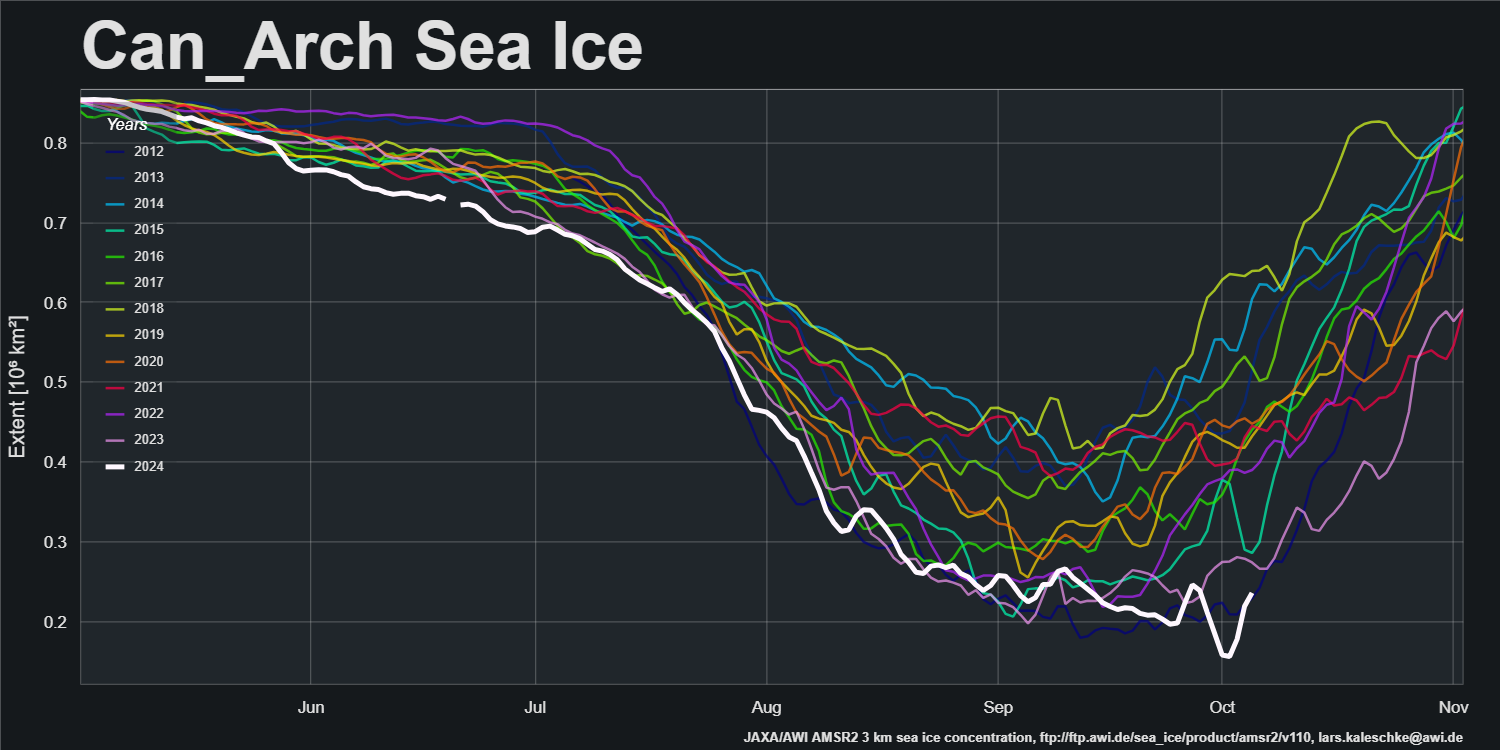
“The loss of Arctic sea ice cover has undergone a pronounced slowdown over the past two decades, across all months of the year,” the paper’s US and UK authors write.
They suggest that the “pause” in Arctic sea ice decline could persist for several more decades.
Together, the two studies remind us that the global climate system remains unpredictable, defying simplistic expectations that change moves only in one direction.
I feel compelled to point out to Roger that apart from the fact that they both include the word “ice”, Arctic sea ice and the Antarctic ice sheet are approximately as similar as chalk and cheese.
Roger neglects to provide NY Post readers with a reference or helpful link to the preprint he is referring to. However luckily for my own reader(s) I have already done so. Hence I am able to quote the authors’ own words, which read as follows:
According to these climate model simulations, this pause in the loss of Arctic sea ice could plausibly continue for the next 5-10 years.
I have already emailed the authors of the preprint asking them to justify their use of the term “pause”. I’ll let you know what they have to say on the matter in due course. In the meantime I suggest that Dr. Pielke consults an English dictionary. In pseudo code:"pause" != "rebound"
I also suggest that he directs Post readers to more recent activity of yours truly’s virtual pen:
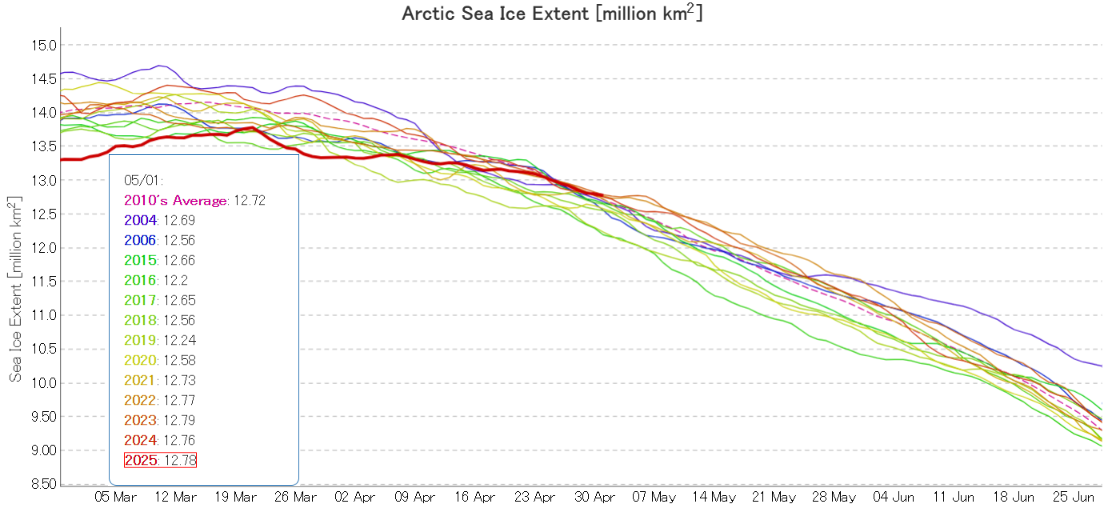
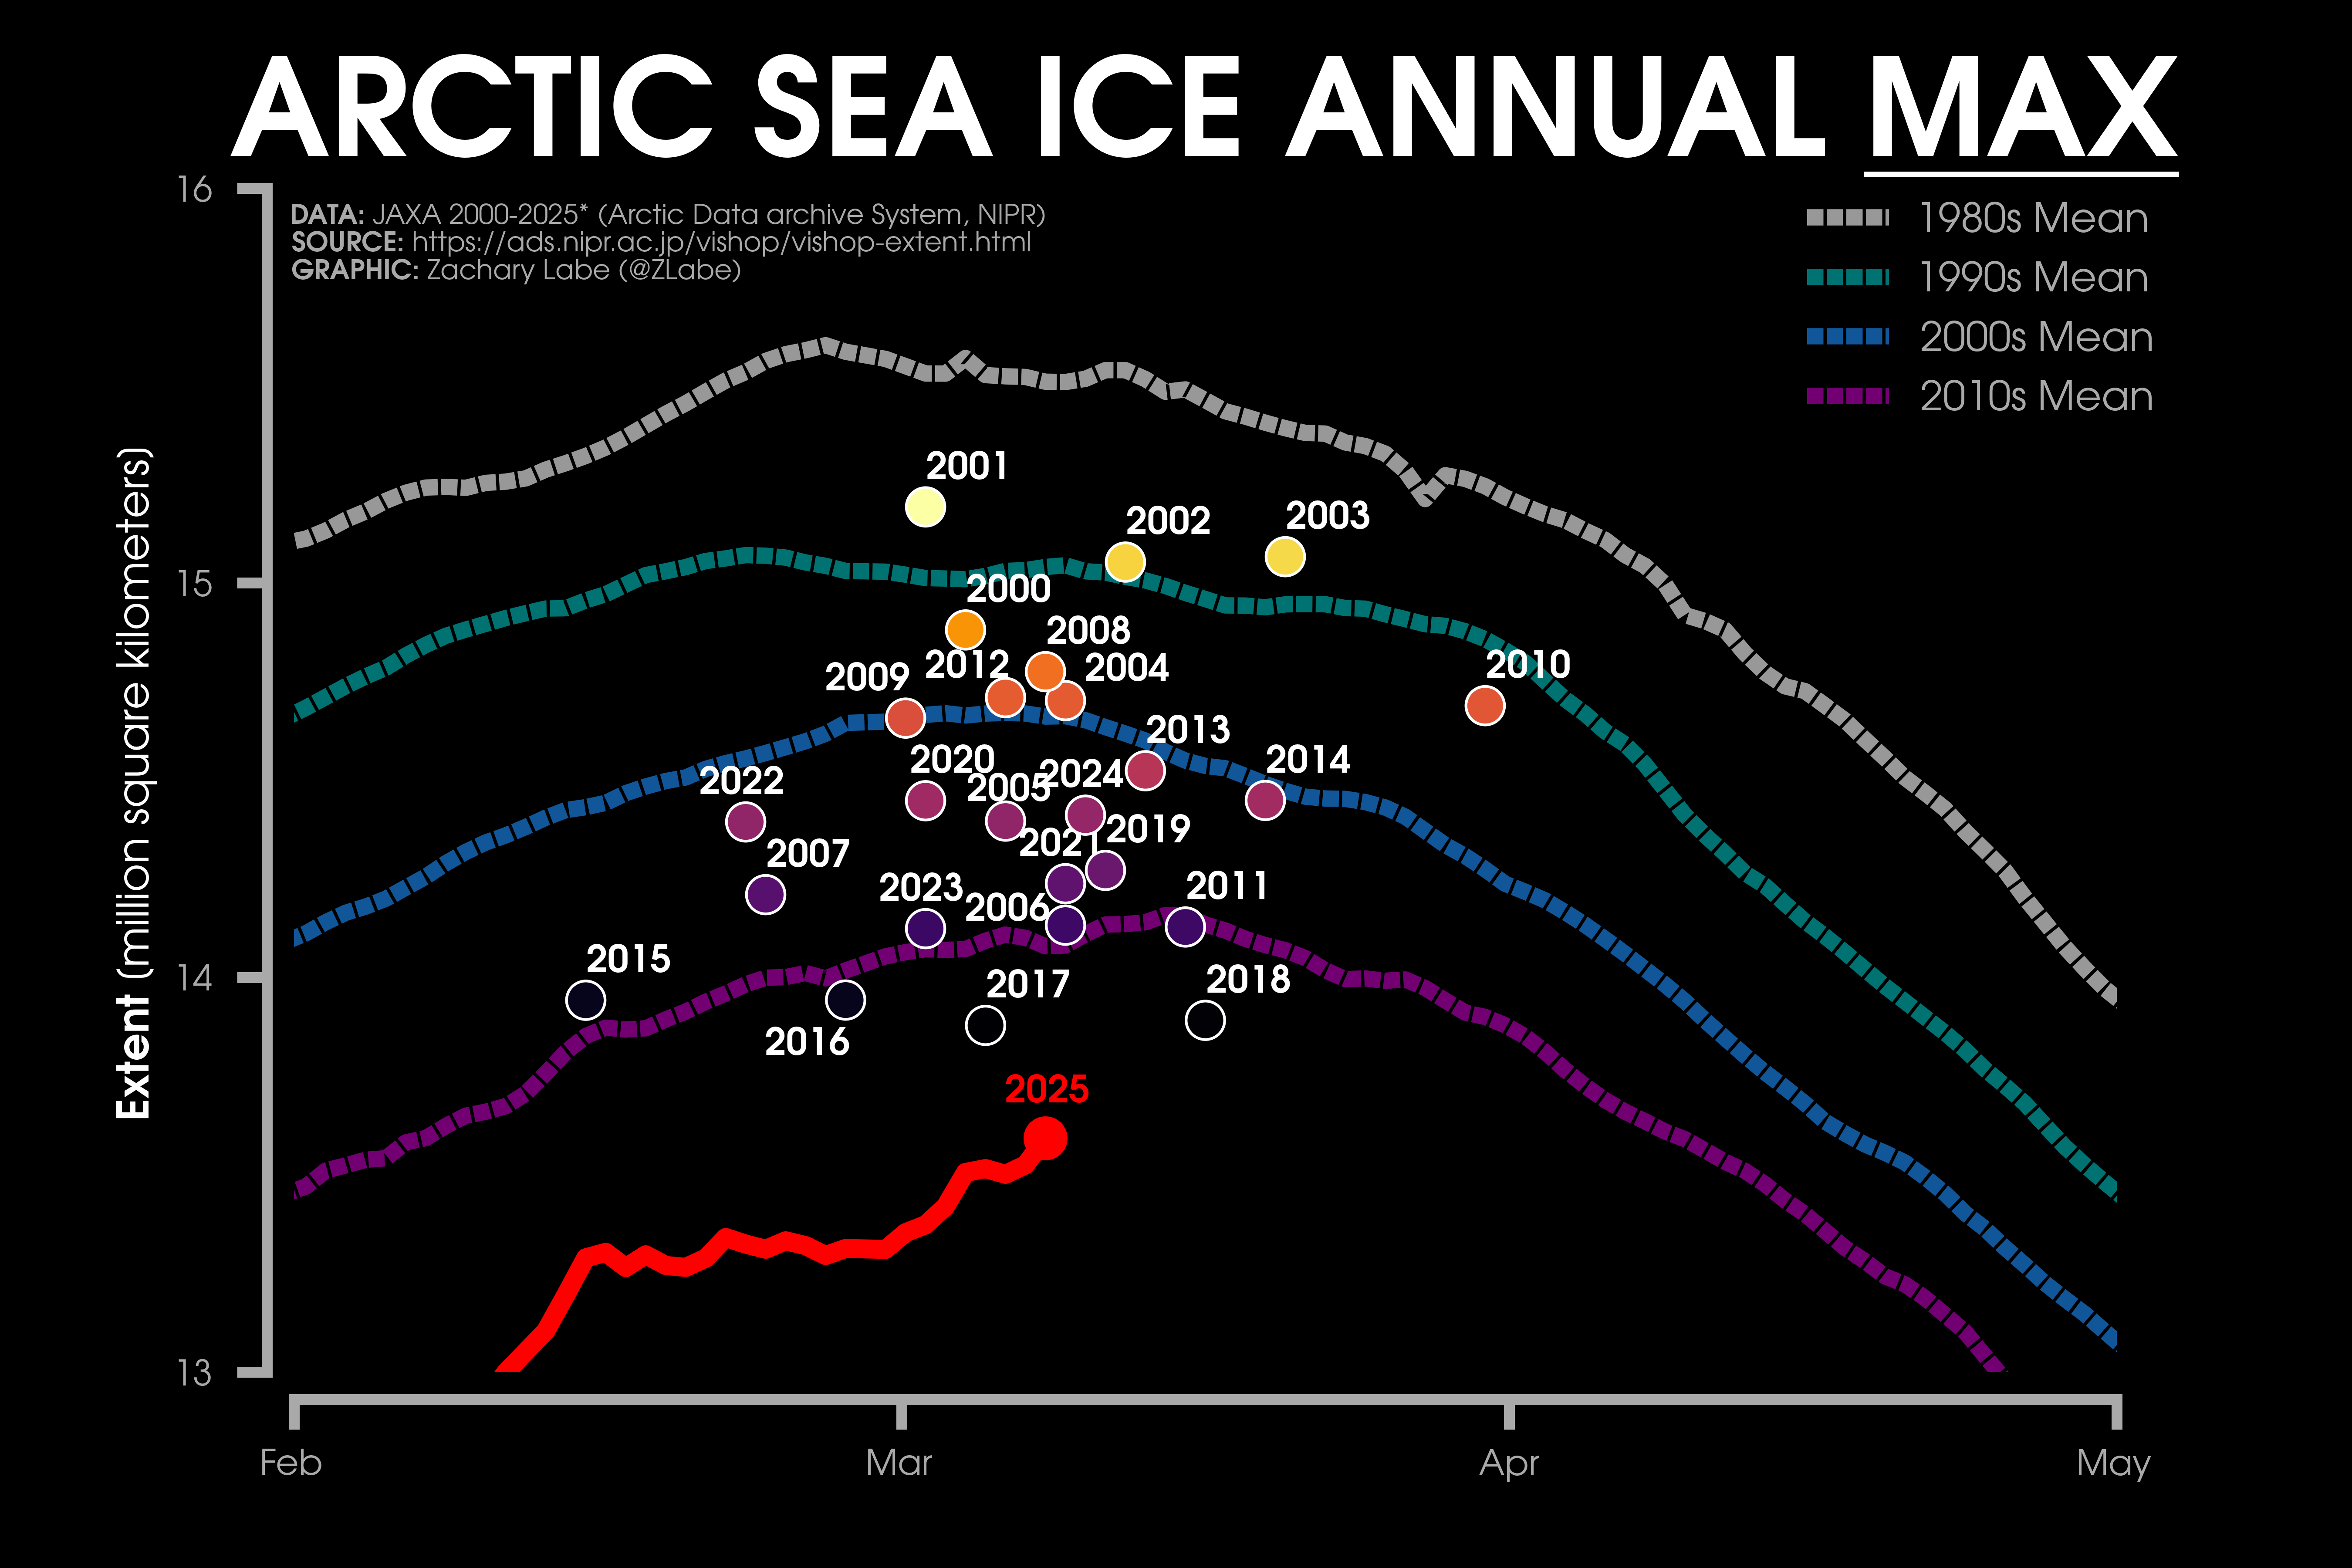
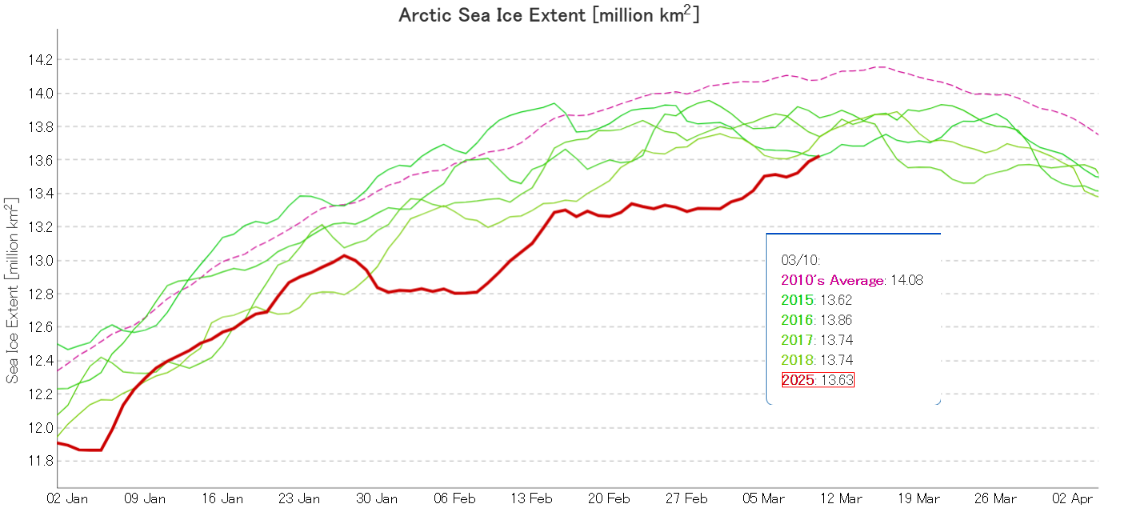
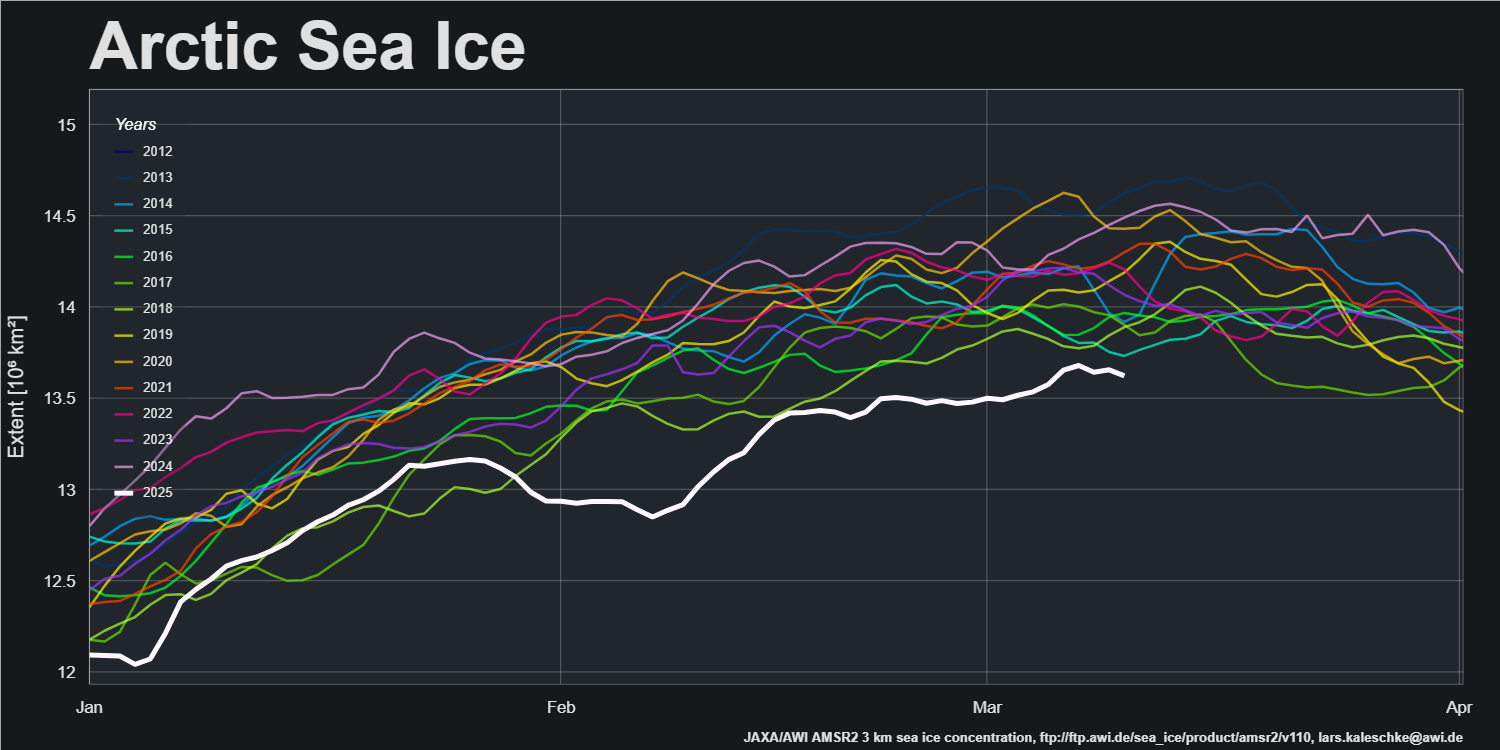
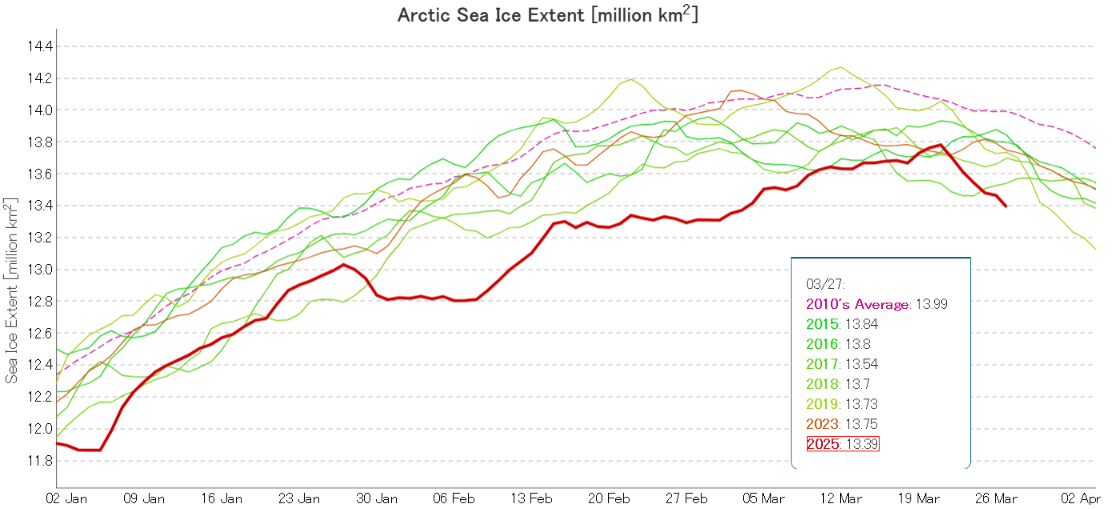
This year’s maximum extent is 1.31 million square kilometers below the 1981 to 2010 average maximum of 15.64 million square kilometers and 80,000 square kilometers below the previous lowest maximum that occurred on March 7, 2017:
Perhaps he also wouldn’t mind asking the Post’s online editor(s) to reveal this explanatory video to their viewers?
Q.E.D?