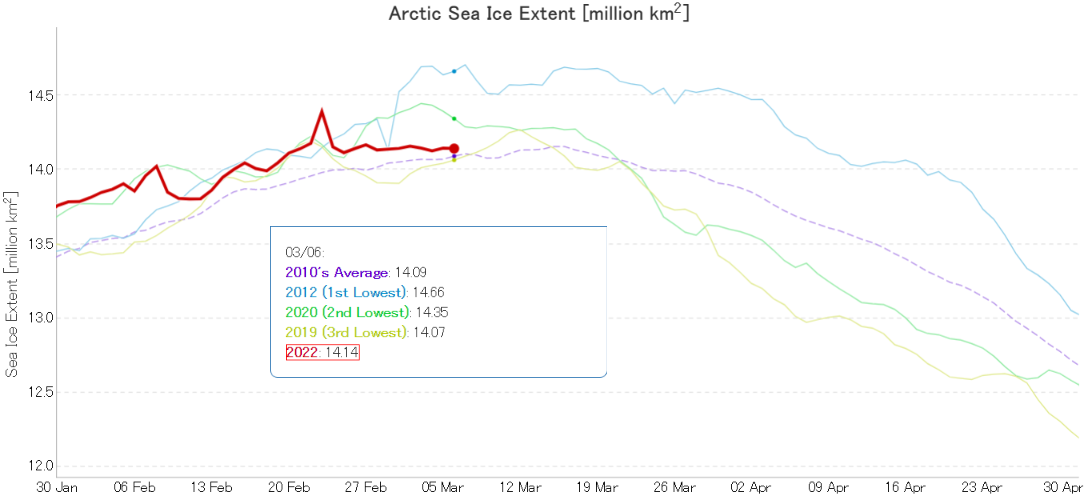
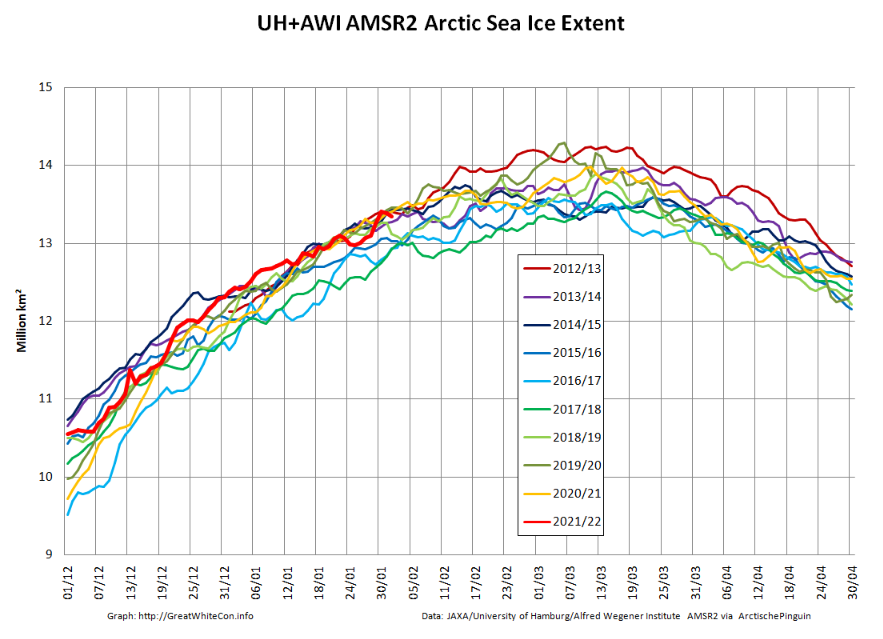
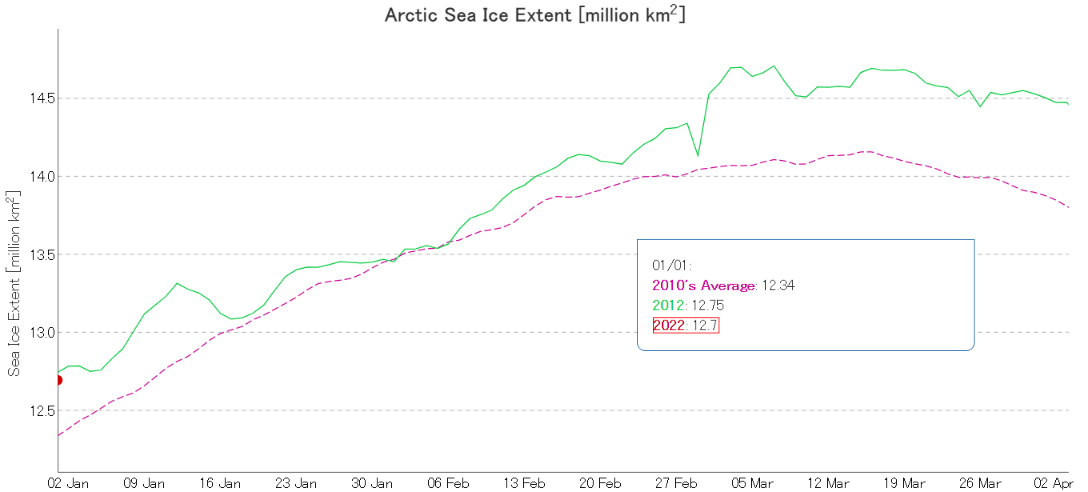
For detailed analysis of Arctic sea ice extent over the next few weeks please see the 2022 maximum extent thread. However to get the new open thread going here is the current JAXA/ViSHOP extent graph:
It’s looking more and more as though the real maximum for 2022 occurred close the false peak on February 23rd.
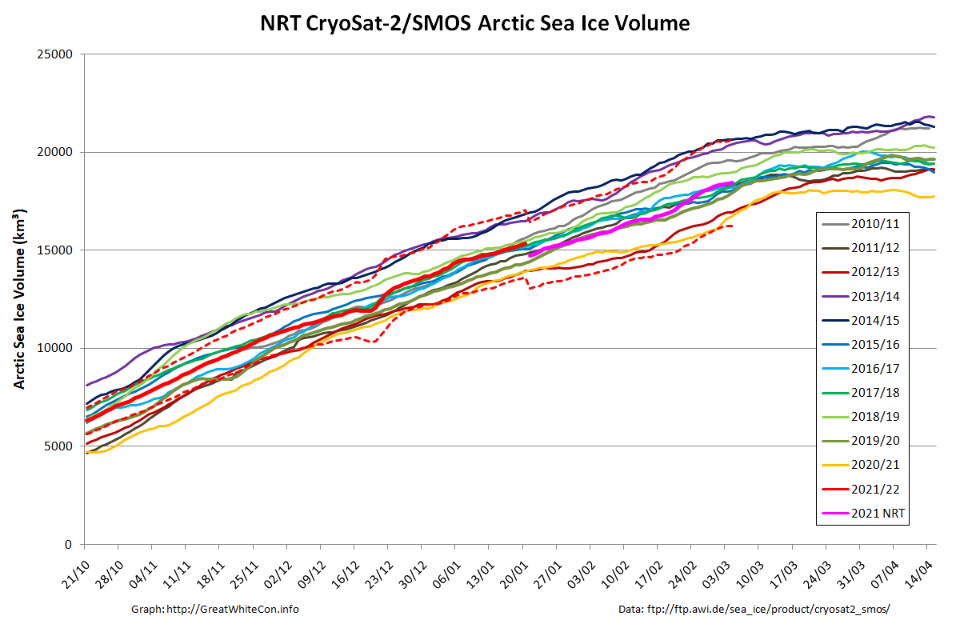
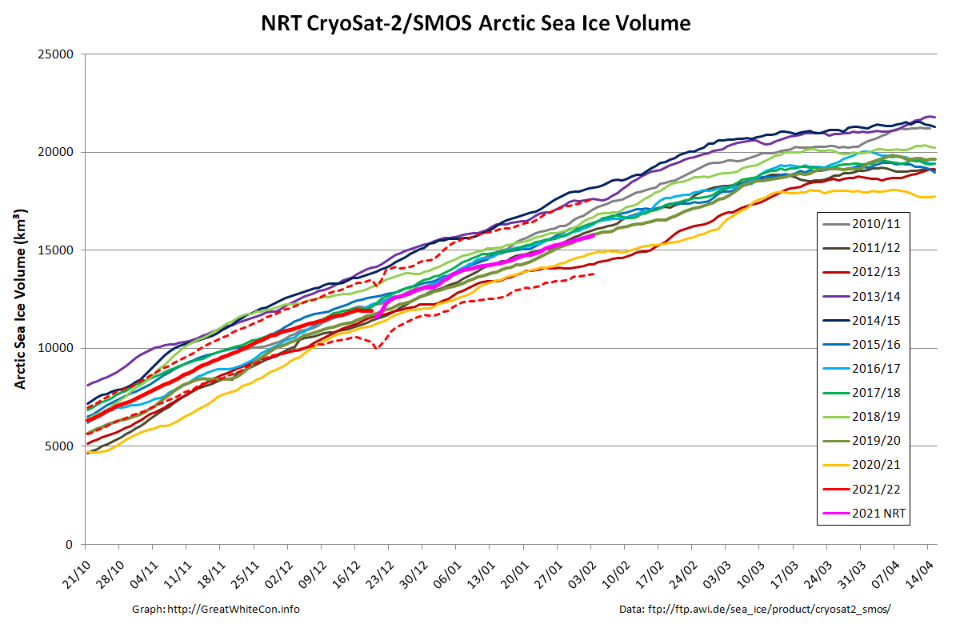
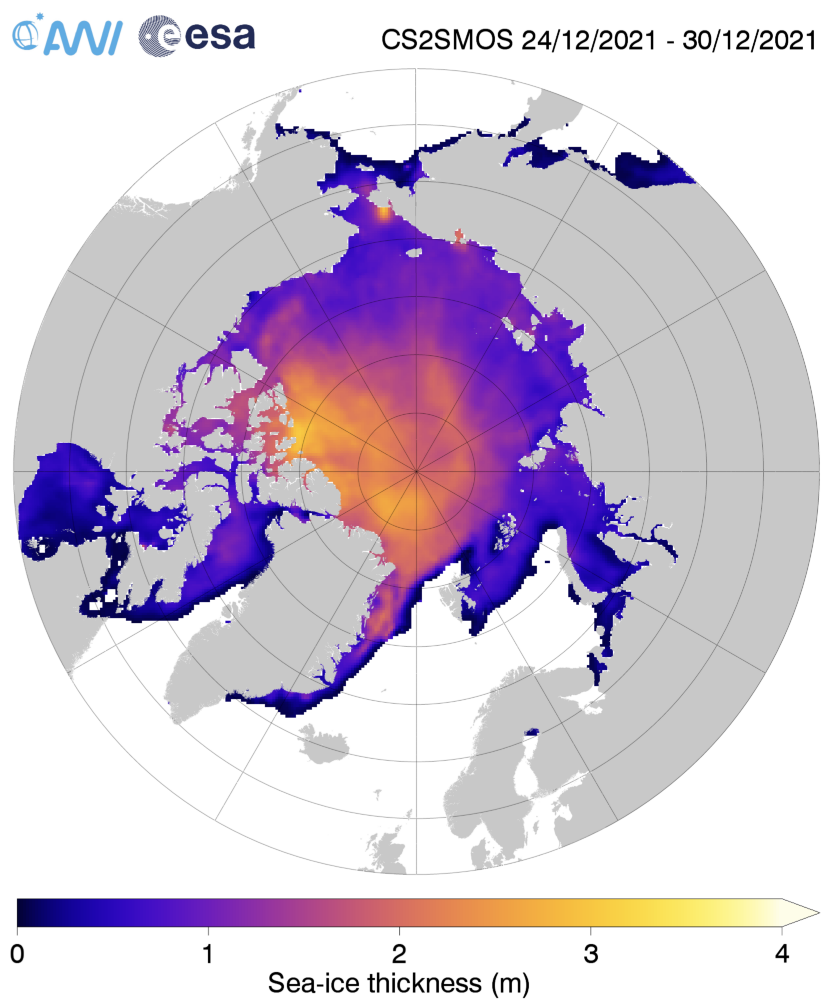
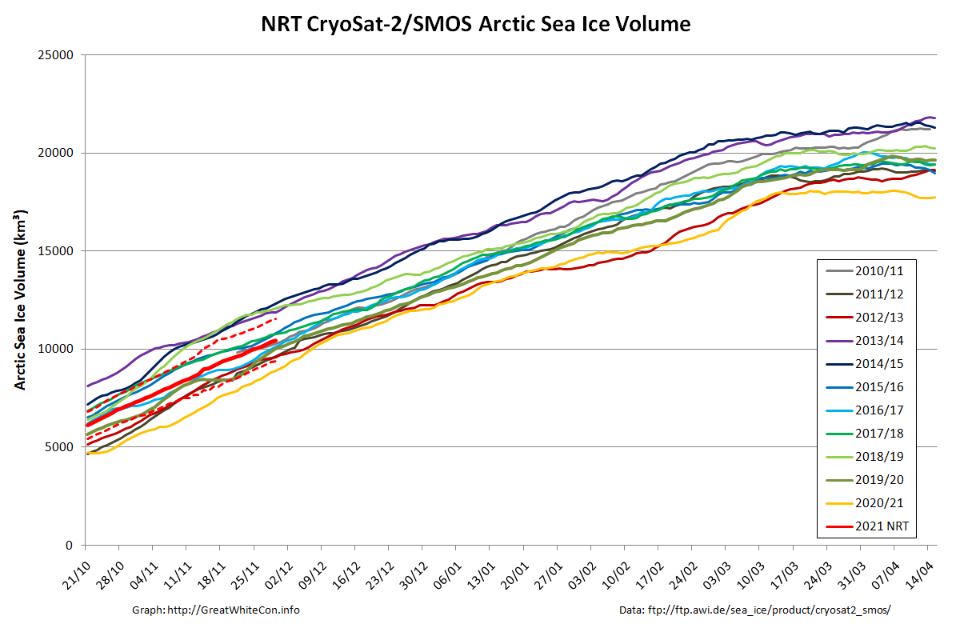
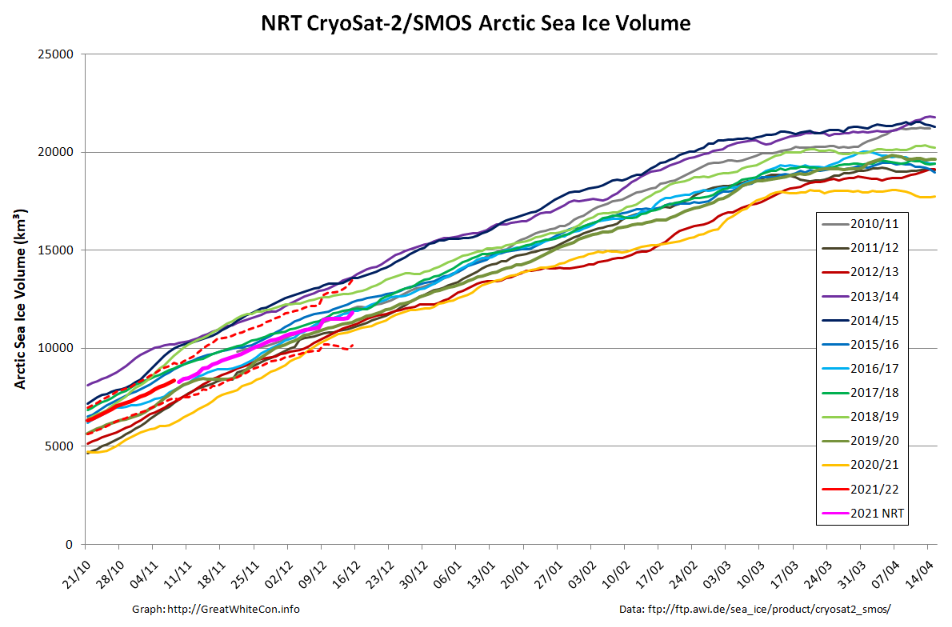
Arctic sea ice volume will keep increasing for a while longer. Here is the current AWI CryoSat-2/SMOS volume graph:
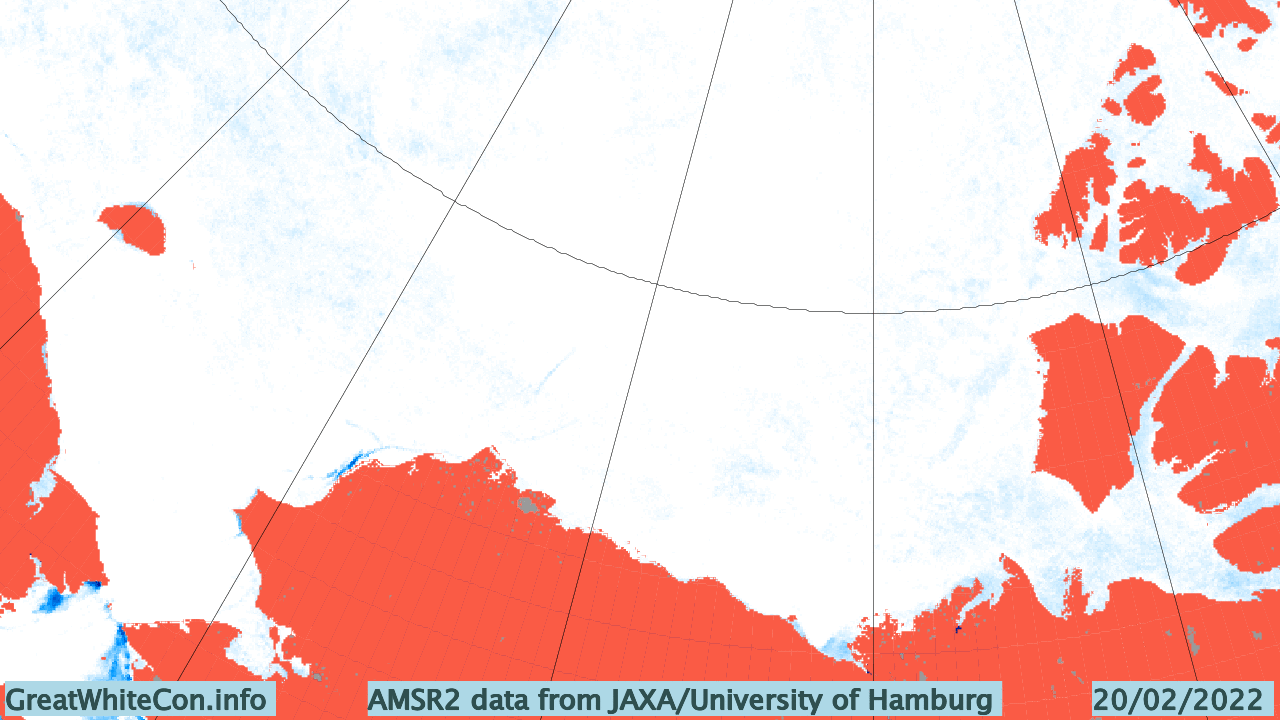
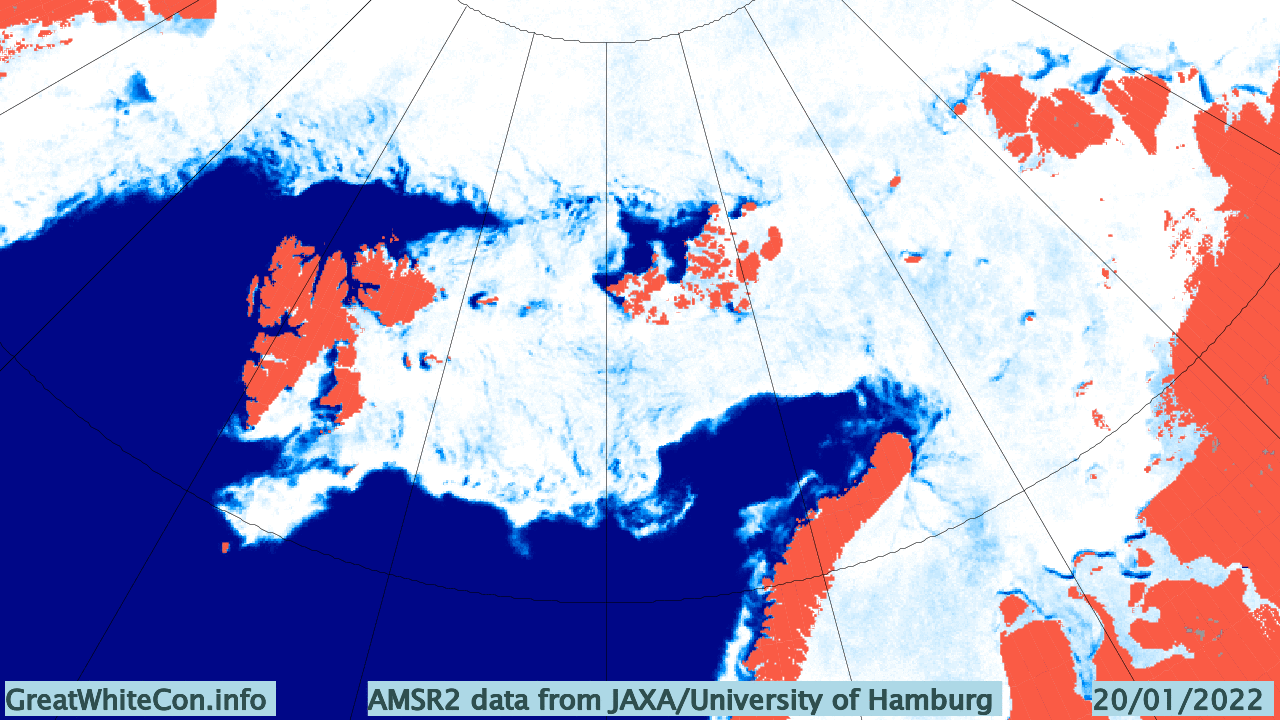
The recent “flat line” in extent is in part due to recent events on the Pacific periphery of the Arctic. Take a look at this animation of AMSR2 sea ice concentration:
The gap varies depending on how the wind blows, but there is still evidence of open water (or very thin ice) along the shore of the Beaufort and Chukchi Seas. Here’s the Mackenzie Delta and the adjacent Beaufort Sea on March 5th:
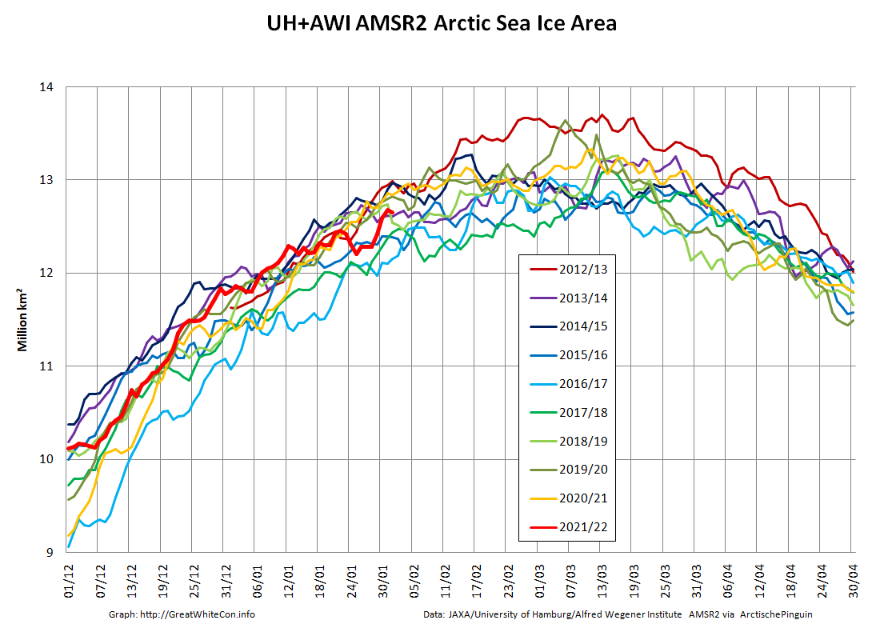
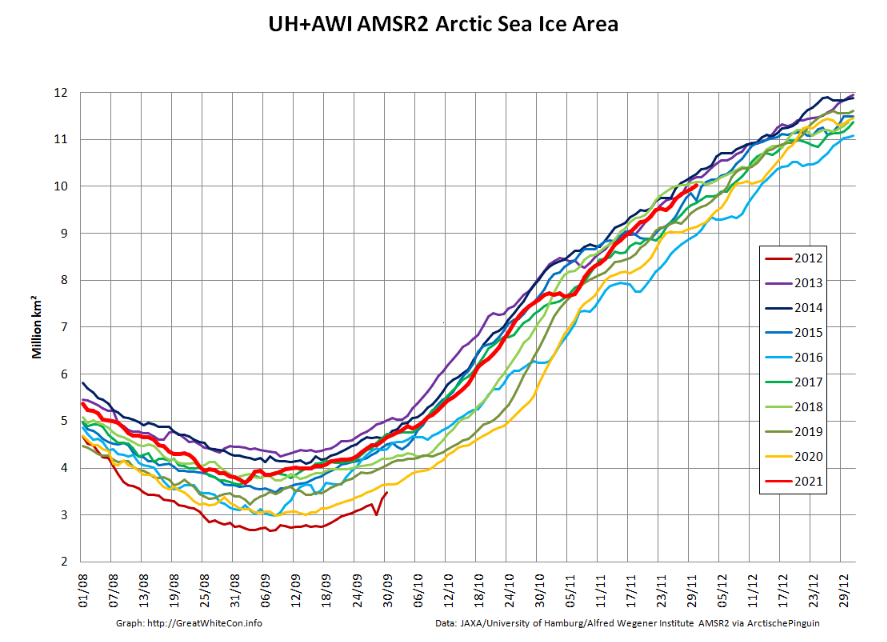
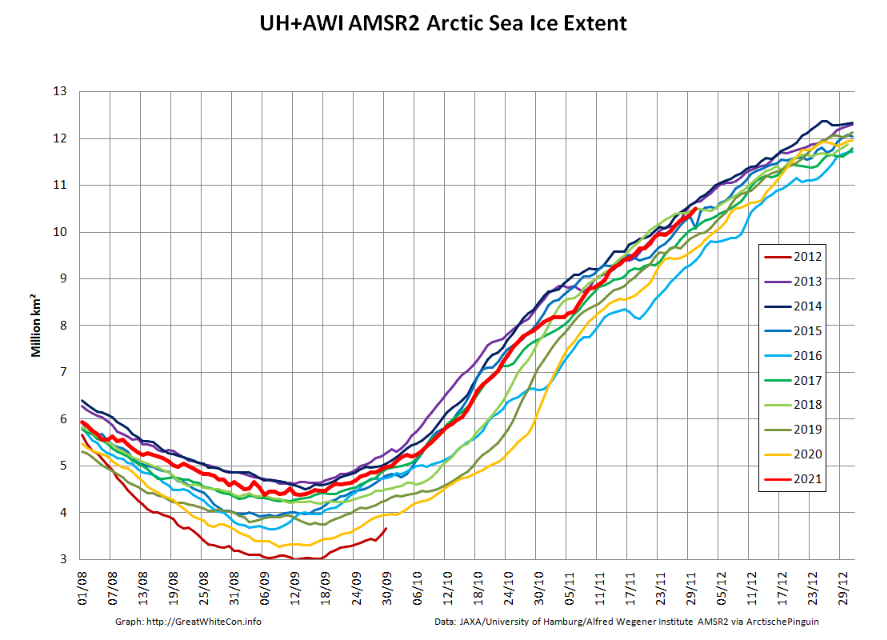
Following the “Great Arctic Winter Cyclone” towards the end of January, here are the latest high resolution AMSR2 area and extent graphs:
The sudden reduction in sea ice area due to the cyclone is very apparent, as is the subsequent refreeze of the affected area. Here’s an animation of AMSR2 concentration revealing more detail:
Here too is the latest AWI CryoSat-2/SMOS Arctic sea ice volume graph:
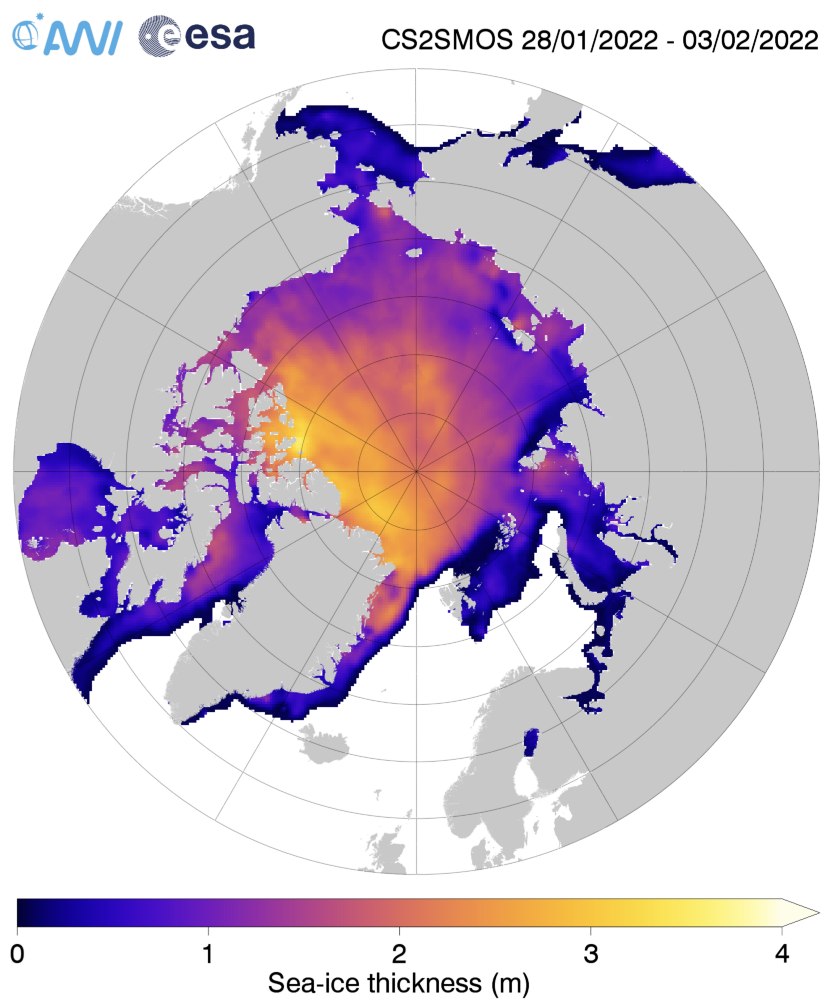
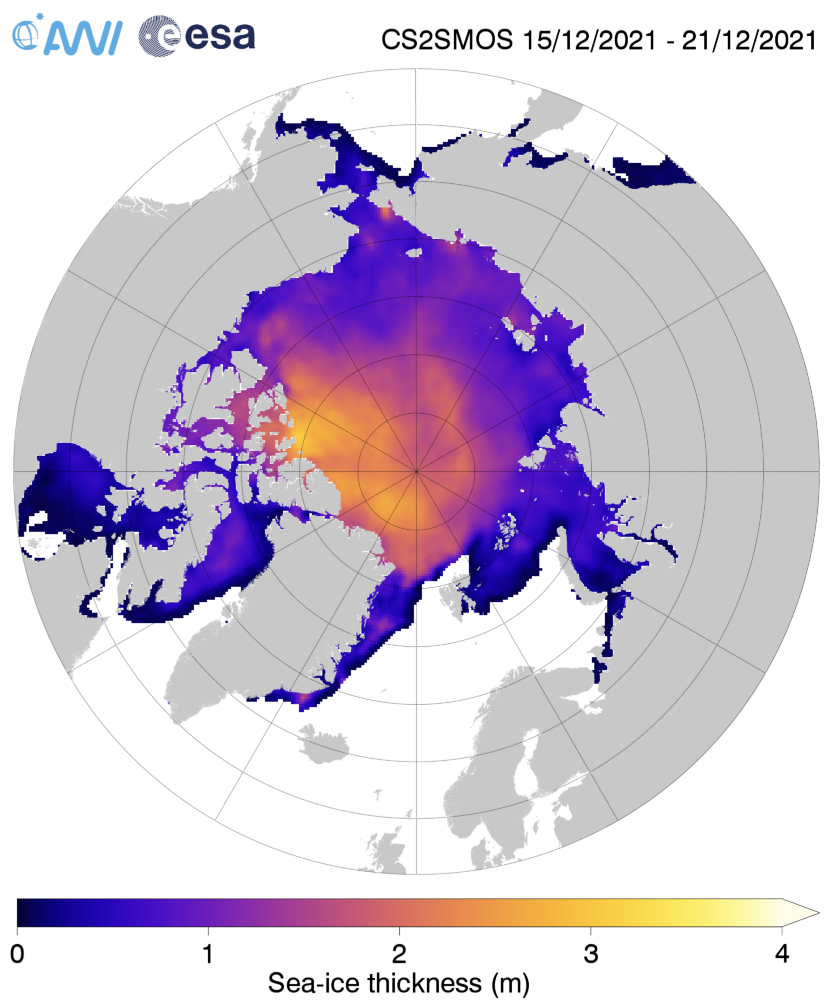
It doesn’t reveal a similar “blip” towards the end of January, suggesting that reduction in area was due to compaction rather than melt. The current AWI thickness map shows the freshly formed ice north east of Svalbard is still very thin:
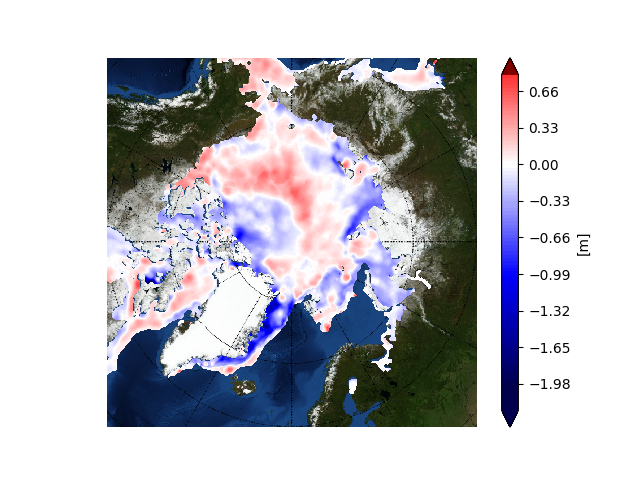
The latest thickness anomaly map from the Finnish Meteorological Institute shows that the ice which was exported from the Central Arctic via the Fram Strait is nevertheless still anomalously thin, although there is now an area of thicker ice north of Greenland:
2021 has been and gone, so first of all may I wish all our readers a very Happy New Year.
Sadly it’s not been a happy start to 2022 for the inhabitants of Boulder, Colorado, home of the National Snow and Ice Data Center. According to the Denver Post:
The Marshall fire destroyed an estimated 991 homes in Boulder County, damaged 127 more and may have killed three people, Sheriff Joe Pelle said Saturday afternoon.
Pelle added that the cause of the fire — the most damaging in Colorado history — remains under investigation, and confirmed that sheriff’s officials have served a search warrant on at least one property based on a tip.
Currently, two people are missing in Superior and another is missing in the Marshall area, Pelle said. All three are feared dead as each of their homes was lost to the fire, the sheriff said…
So far, officials say Thursday’s wildfire — exacerbated by 100-mph winds — burned more than 6,000 acres across Boulder County.
The fire destroyed 553 homes in Louisville, damaging 45, Pelle said Saturday. It also destroyed 332 homes in Superior, damaging 60 in that town, and destroyed 106 homes in unincorporated Boulder County, damaging 22…
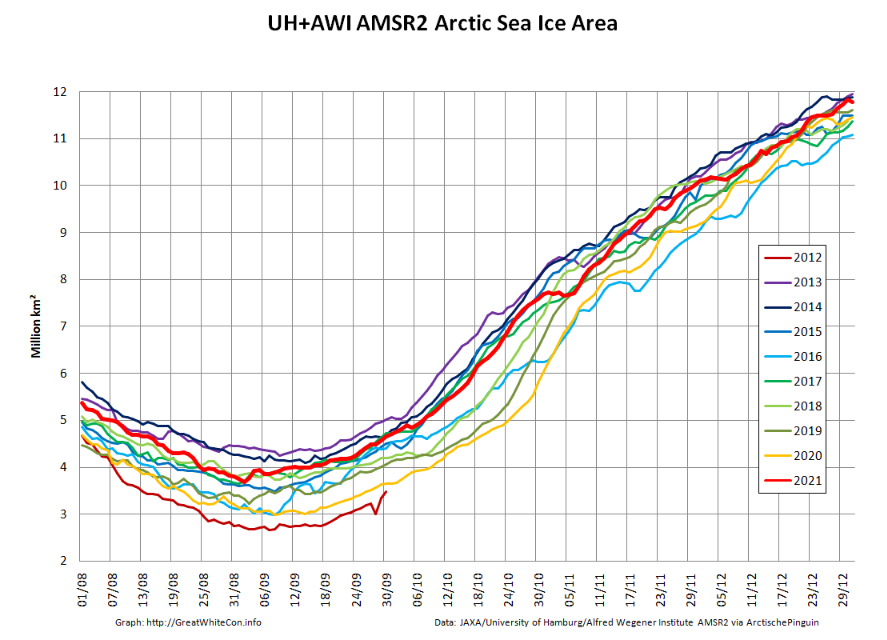
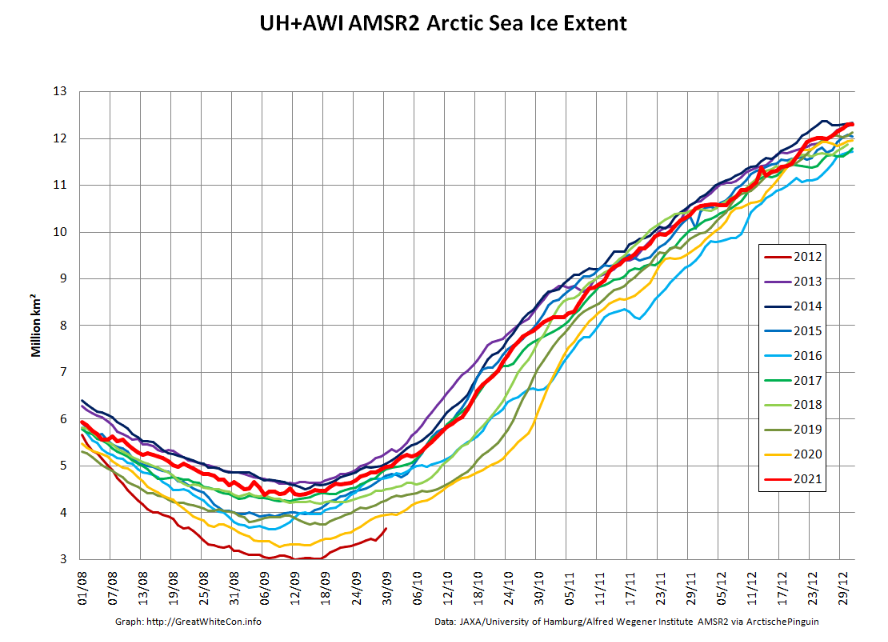
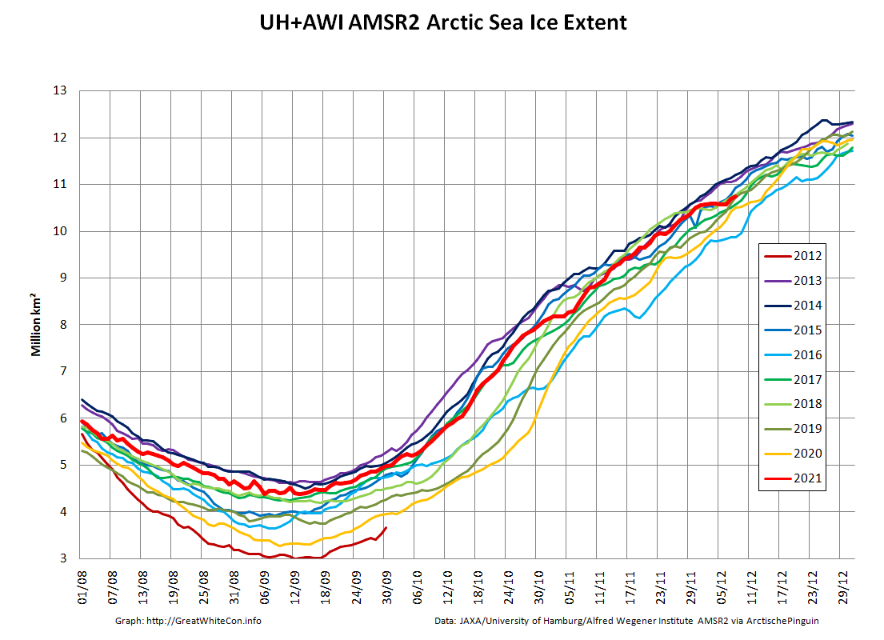
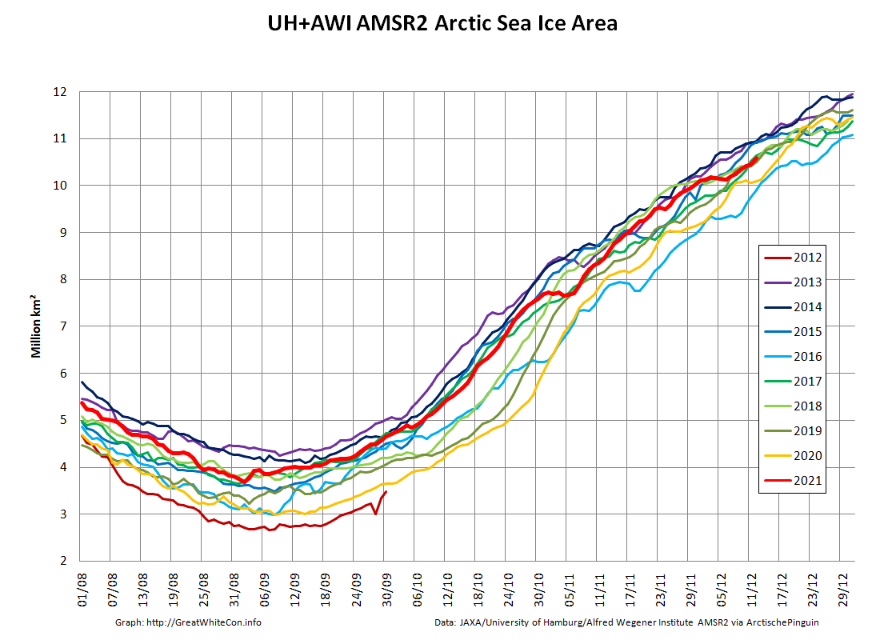
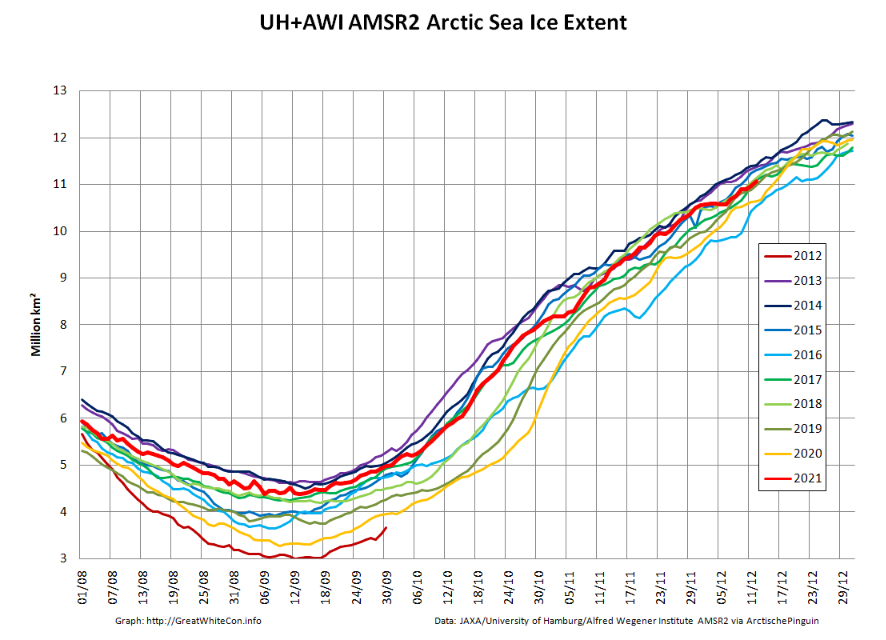
Moving north to examine snow and ice data from the Arctic, let’s start 2022 in traditional fashion with a look at high resolution AMSR2 area and extent:
Both metrics are now near the upper boundary of the last 10 years’ range. The AMSR2 instrument wasn’t launched into orbit until summer 2012, but according to both JAXA and NSIDC data extent on January 1st 2022 is almost identical to the same date in 2012. Regular readers will recall that year went on to produce the lowest annual minimum extent in the satellite era despite recording the highest annual maximum in the decade of the 2010s:
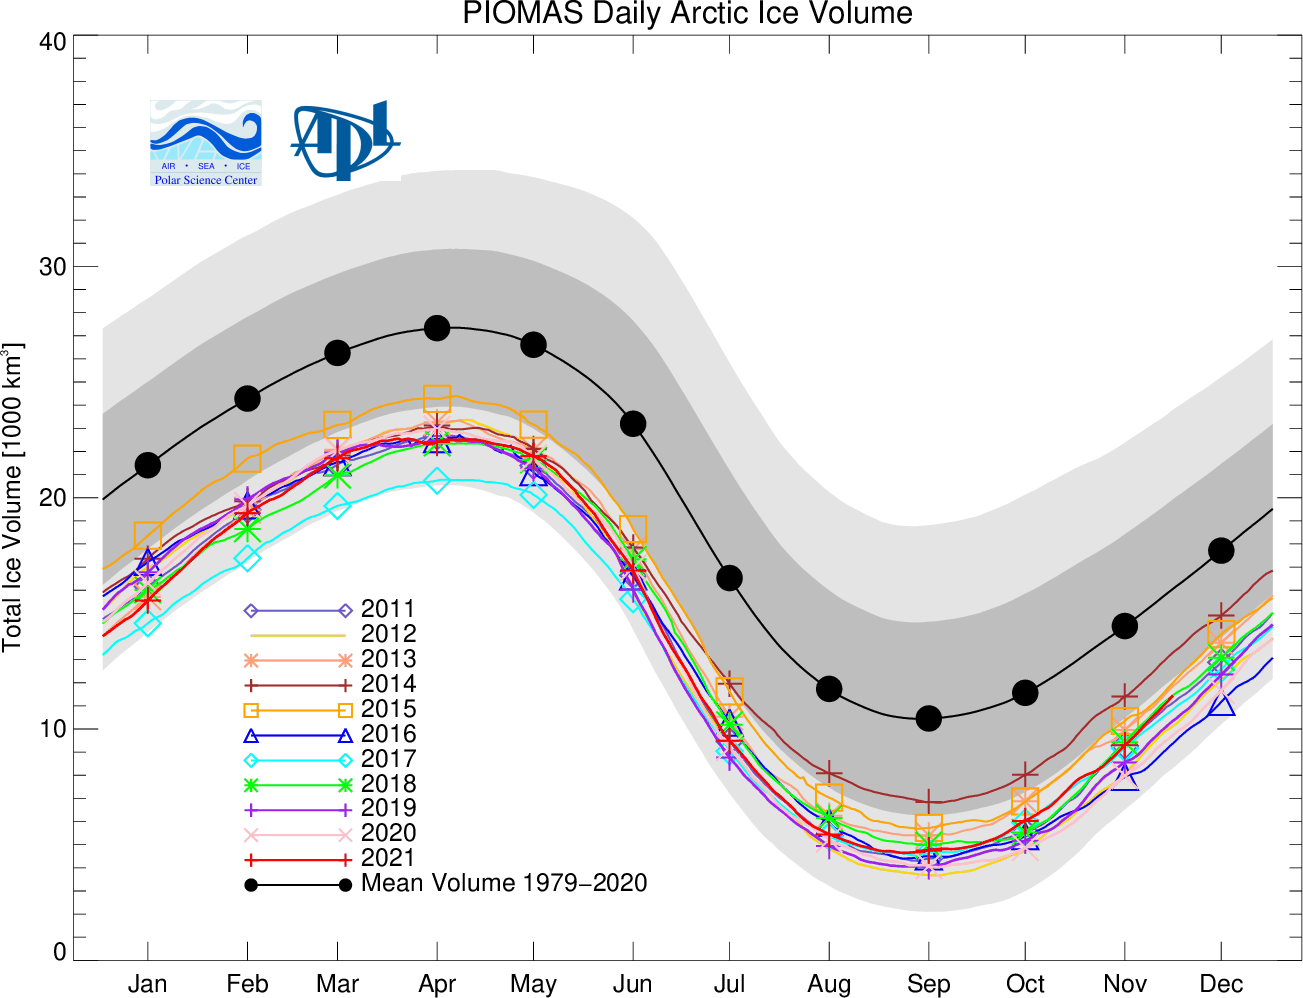
Note that sea ice volume tells a rather different story. Here’s the latest AWI CryoSat-2/SMOS volume graph:
The current near real time data is likely to be revised upwards slightly when the final reanalysis is complete, but even so volume seems likely to remain in the lower half of the recent range at the end of 2021.
Once again the ice in the so called “last ice area” north of Greenland and Ellesmere Island is thinner than usual, as is the ice in the Fram Strait and East Greenland Sea.
[Edit – January 11th]
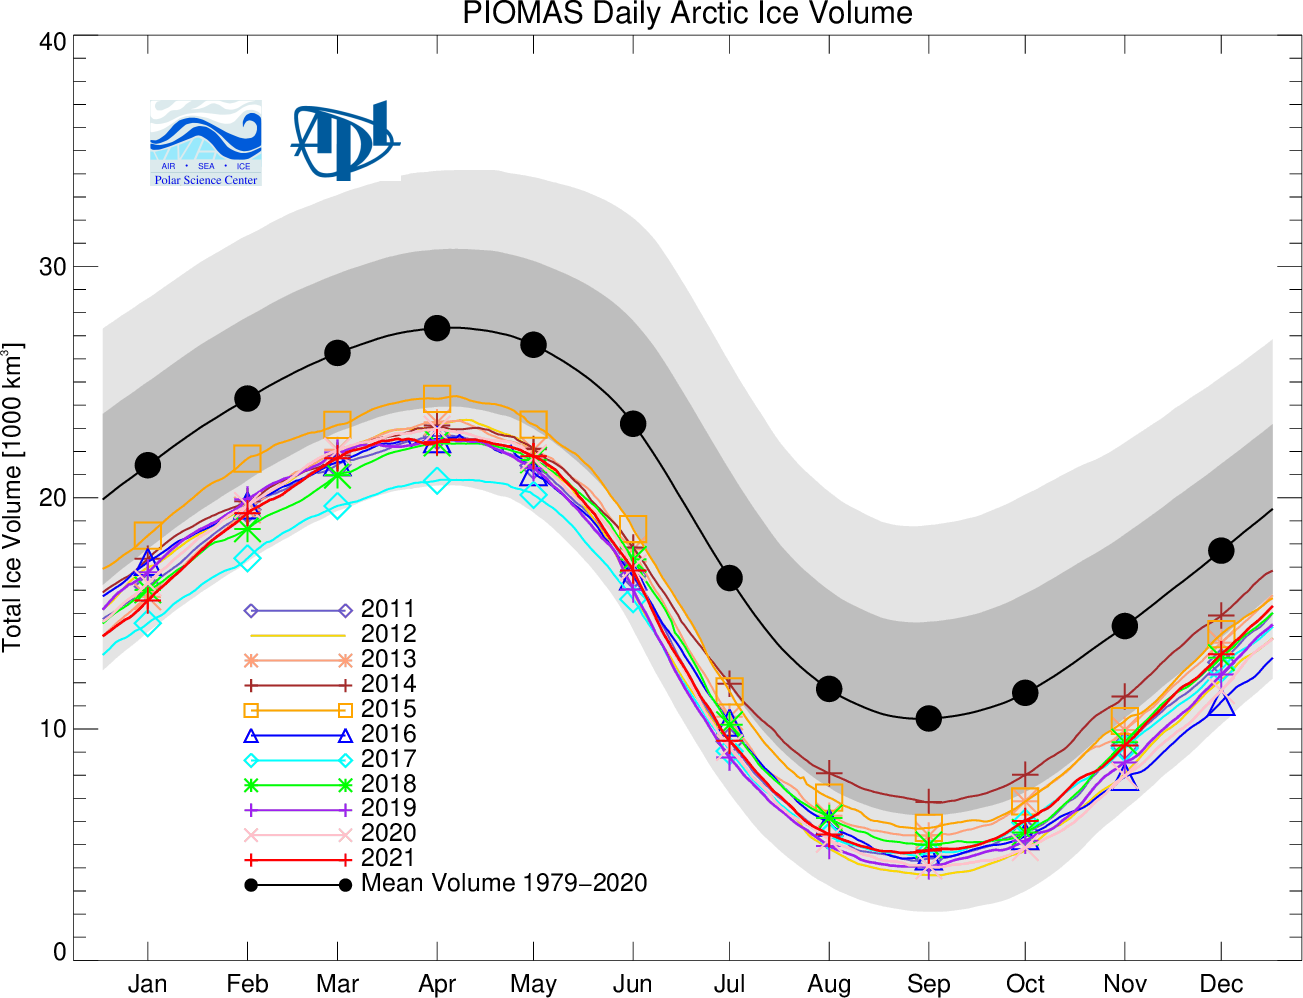
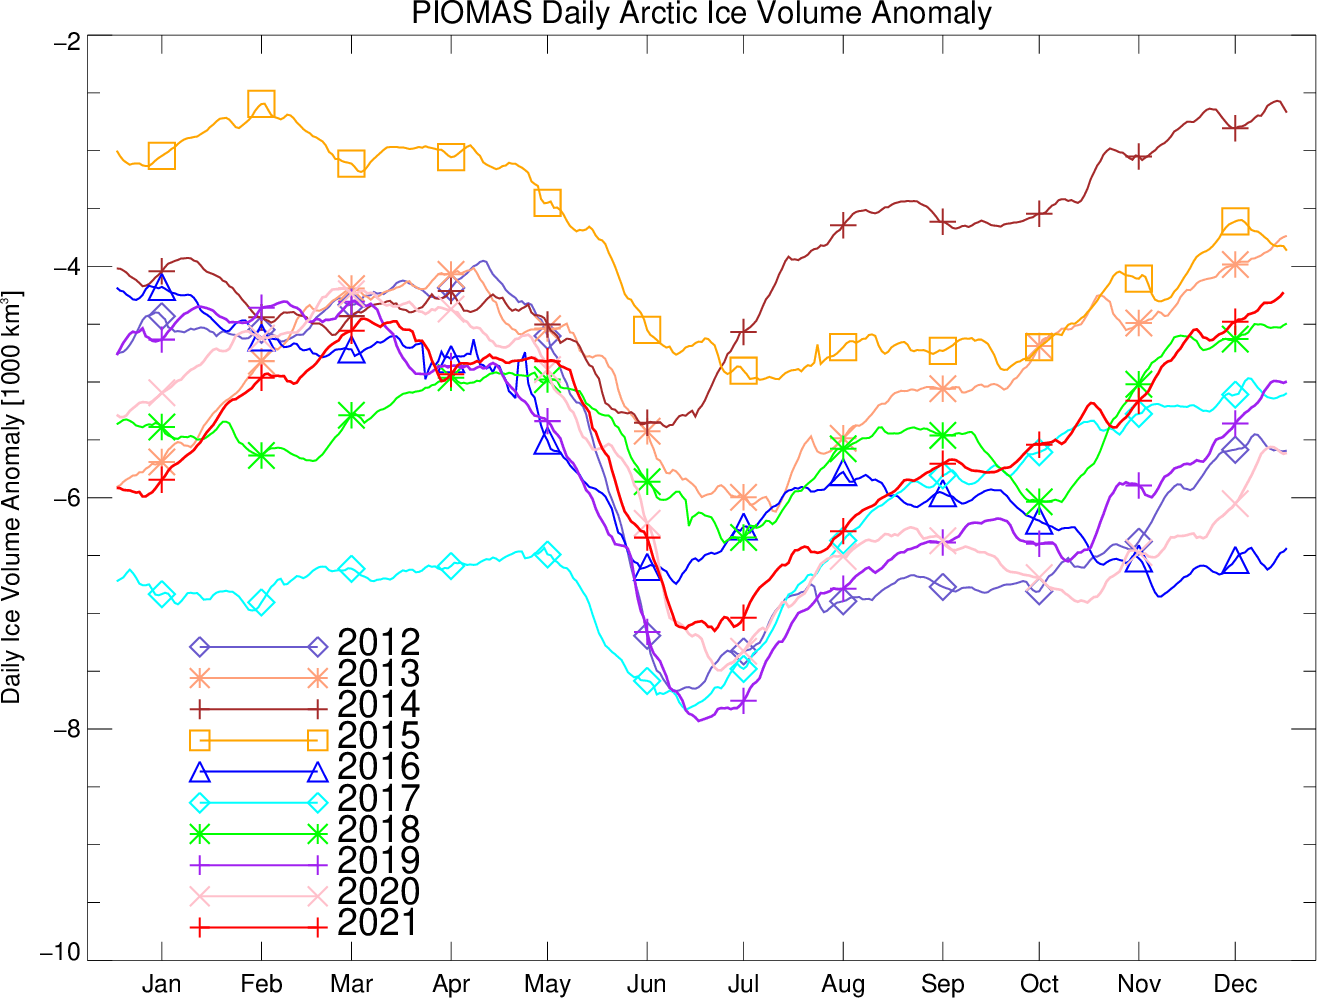
As has been pointed out below, the Polar Science Center has now released the PIOMAS volume data for December 2021:
Average Arctic sea ice volume in December 2021 was 13,300 km3. This value is the 9th lowest on record for December, about 2100 km3 above the record set in 2016. Monthly ice volume was 51% below the maximum in 1979 and 37% below the mean value for 1979-2020. Average December 2021 ice volume was 1.2 standard deviations above the 1979-2020 trend line.
November and December of 2021 saw relative rapid ice growth for recent years, bringing the mean ice thickness (above 15 cm thickness) towards the thicker end of the recent values.
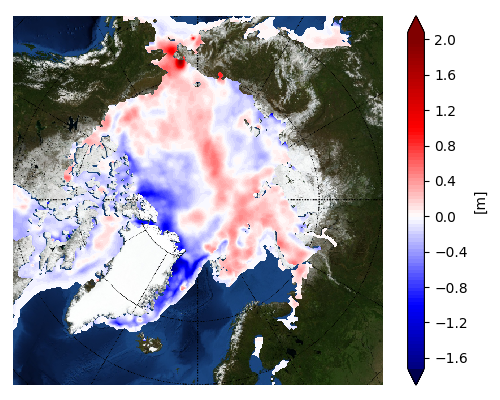
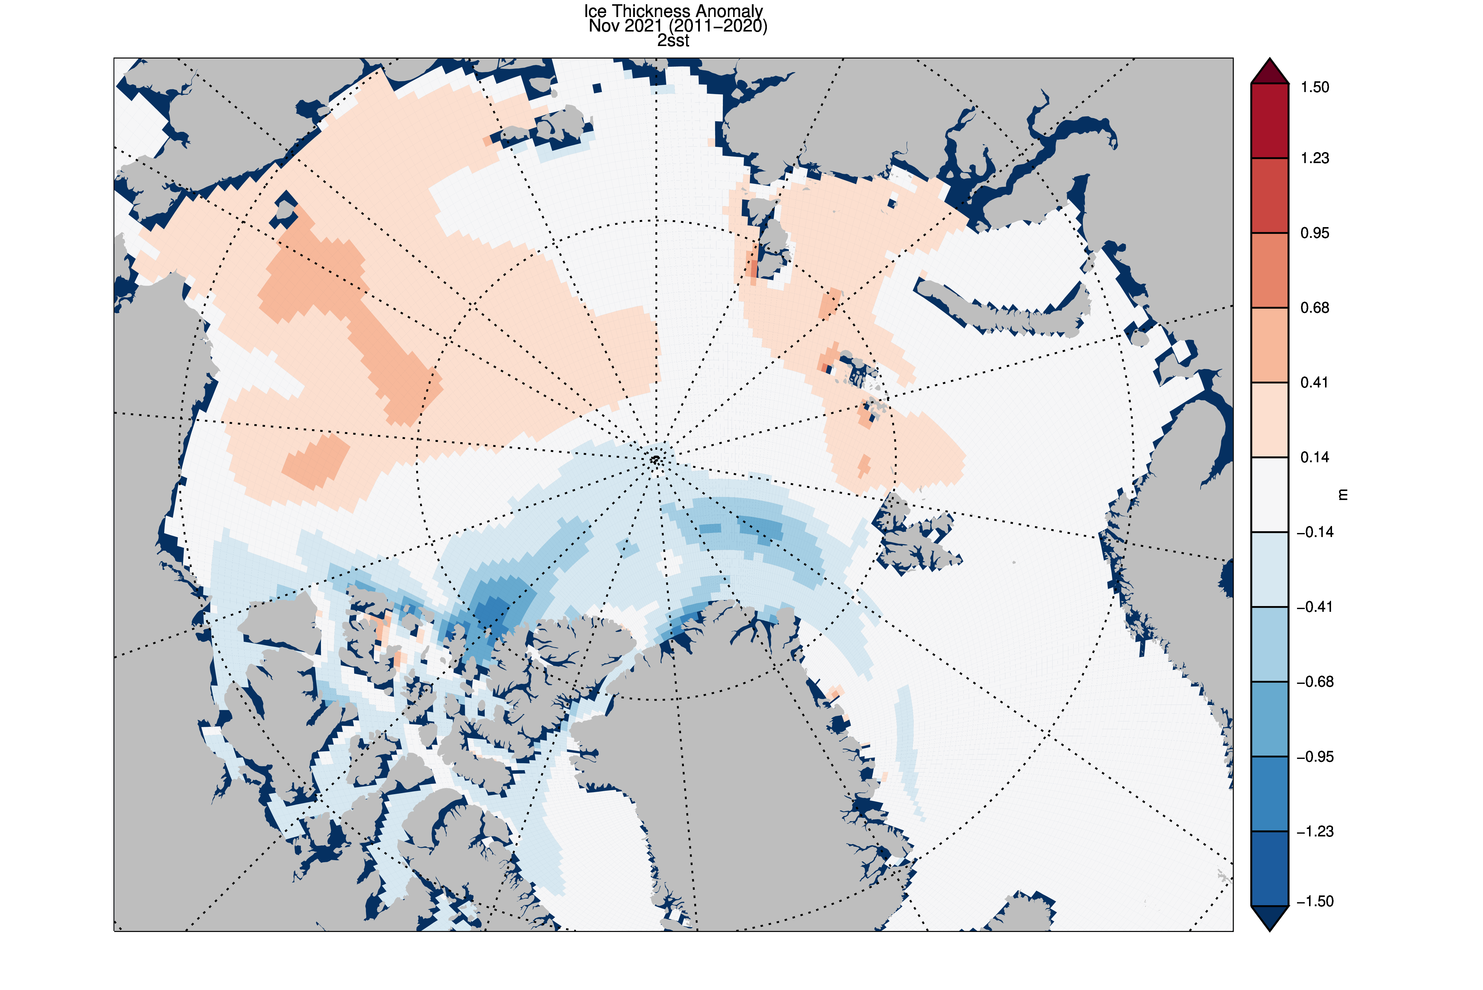
The ice thickness anomaly map for December 2021 relative to 2011-2020 continues to show anomalies divided into positive and a negative halves with areas of positive anomalies increasing since the two prior months and stretching from the Beaufort, over the pole and into the Barents. Negative anomalies stretching from Fram Strait, North of Greenland and along the Canadian Archipelago. Areas North of Greenland again feature low ice thickness as in prior years.
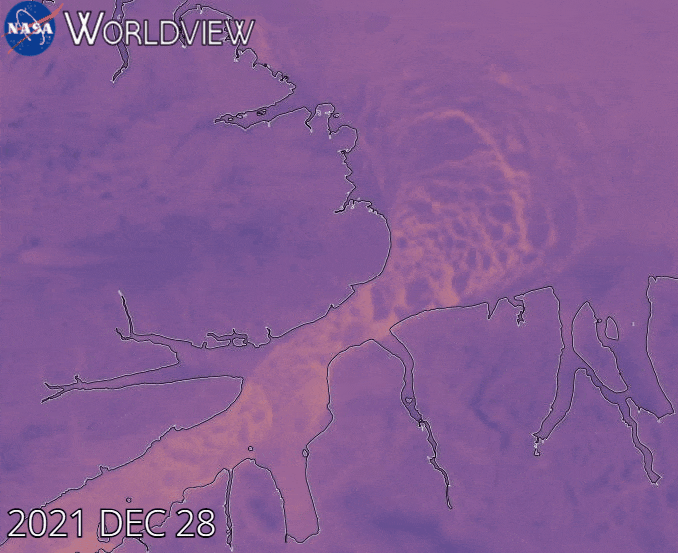
Note that as revealed by this animation from NASA Worldview the sea ice in the Lincoln Sea is currently still breaking up and being exported from the Central Arctic via the Nares Strait:
[Edit – January 25th]
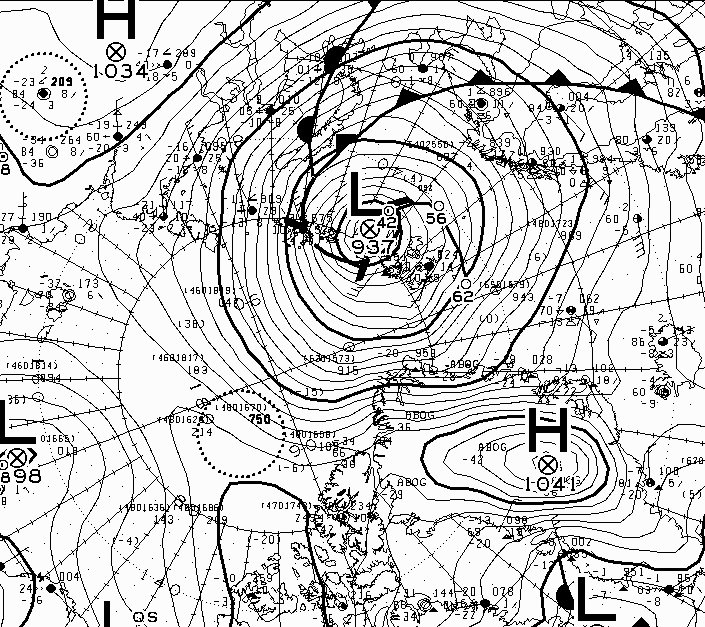
The Atlantic side of the Arctic Ocean has been taking a bit of a battering from what I shall henceforth refer to as the Great Arctic Winter Cyclone of 2022, or GAWC 2022 for short. Unless there’s an even deeper one later in the year of course!
According to the Canadian Meteorological Centre the storm achieved a minimum Mean Sea Level Pressure of 937 hPa at 12 noon UTC yesterday:
Here are the visible effects of the storm on the sea ice in the area so far, now updated to January 25th:
Christmas is coming. Santa’s secret summer swimming pool has frozen over. The time has come for a new monthly Arctic update.
The JAXA/ADS/ViSHOP web site is undergoing maintenance for a week, so let’s start the festive season with a look at high resolution AMSR2 area and extent:
After a brief hiatus in early November both metrics are once again tracking within, but near the upper bound of the last 10 years.
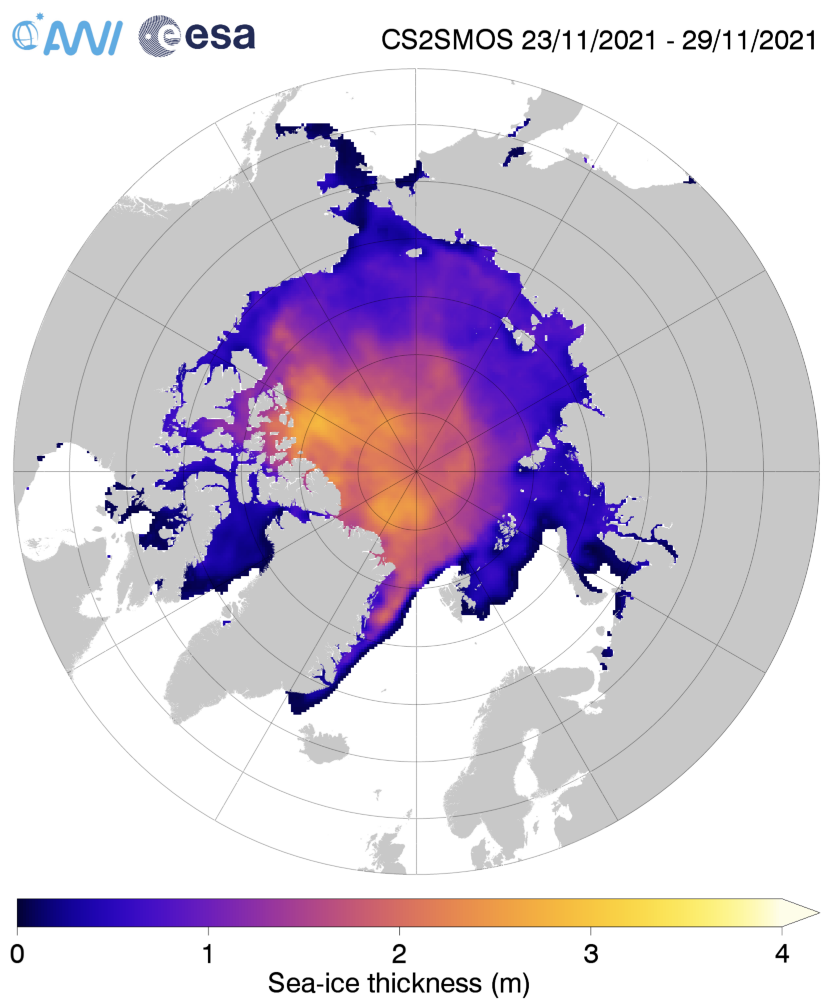
Next let’s take a look at the latest AWI CryoSat-2/SMOS thickness map:
together with the anomaly map from the Finnish Meteorological Institute:
Still thinner than usual in the so called “last ice area” north of Greenland and Ellesmere Island, and thicker than usual on the Siberian side of the Arctic, particularly in the Chukchi Sea.
Finally, for the moment at least, here’s the latest CryoSat-2/SMOS volume graph:
Unlike the previous metrics, this particular one is close to the middle of the pack.
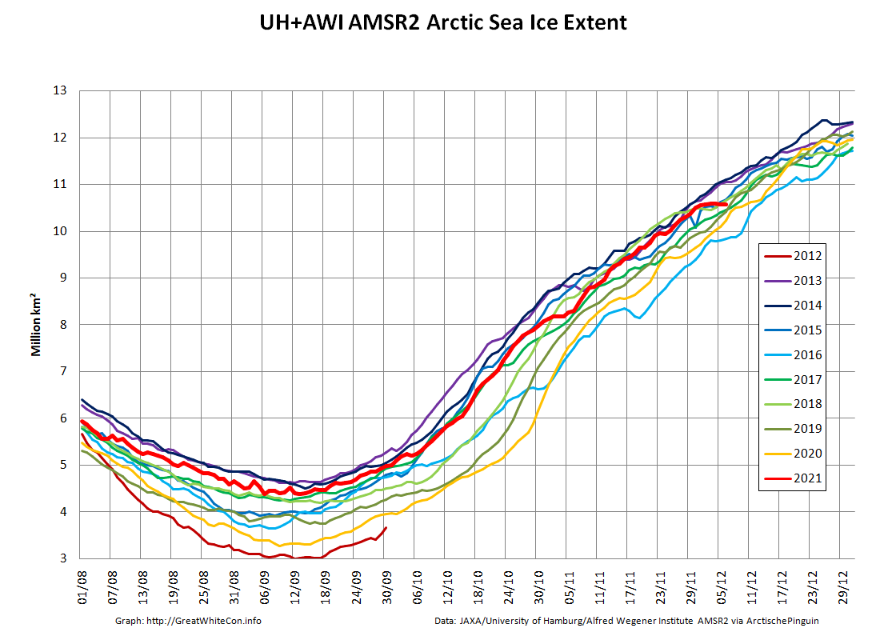
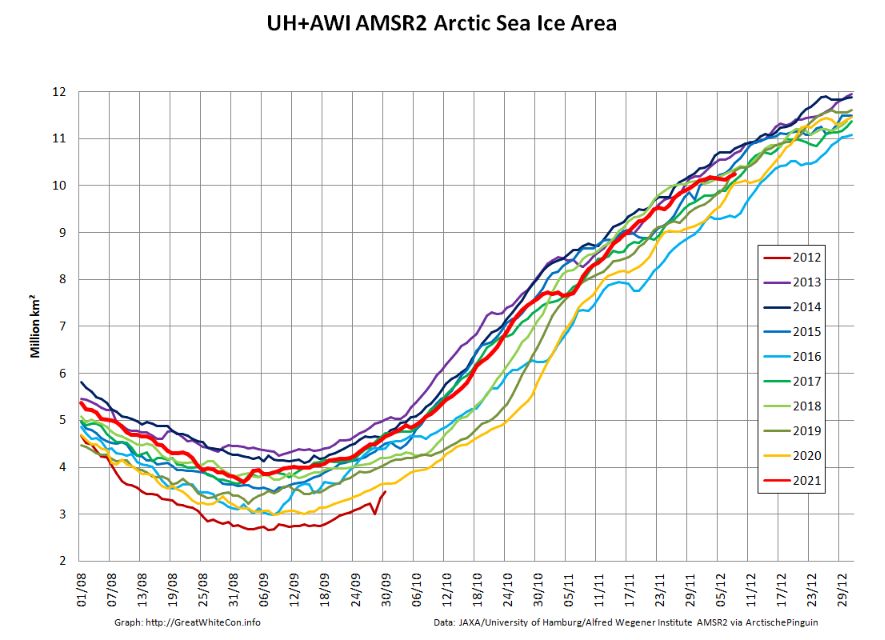
Sea ice extent increased at a faster than average pace through November and by the end of the month, extent was just within the interdecile range. Extent was above average in the Bering Sea, but Hudson Bay remained unusually ice free through the month.
The November 2021 monthly average extent was 9.77 million square kilometers (3.77 million square miles), which ranked tenth lowest in the satellite record. The 2021 extent was 930,000 million square kilometers (359,000 million square miles) below the 1981 to 2010 long-term average. Extent was higher than average in the Bering Sea, but is extremely low in Hudson Bay.
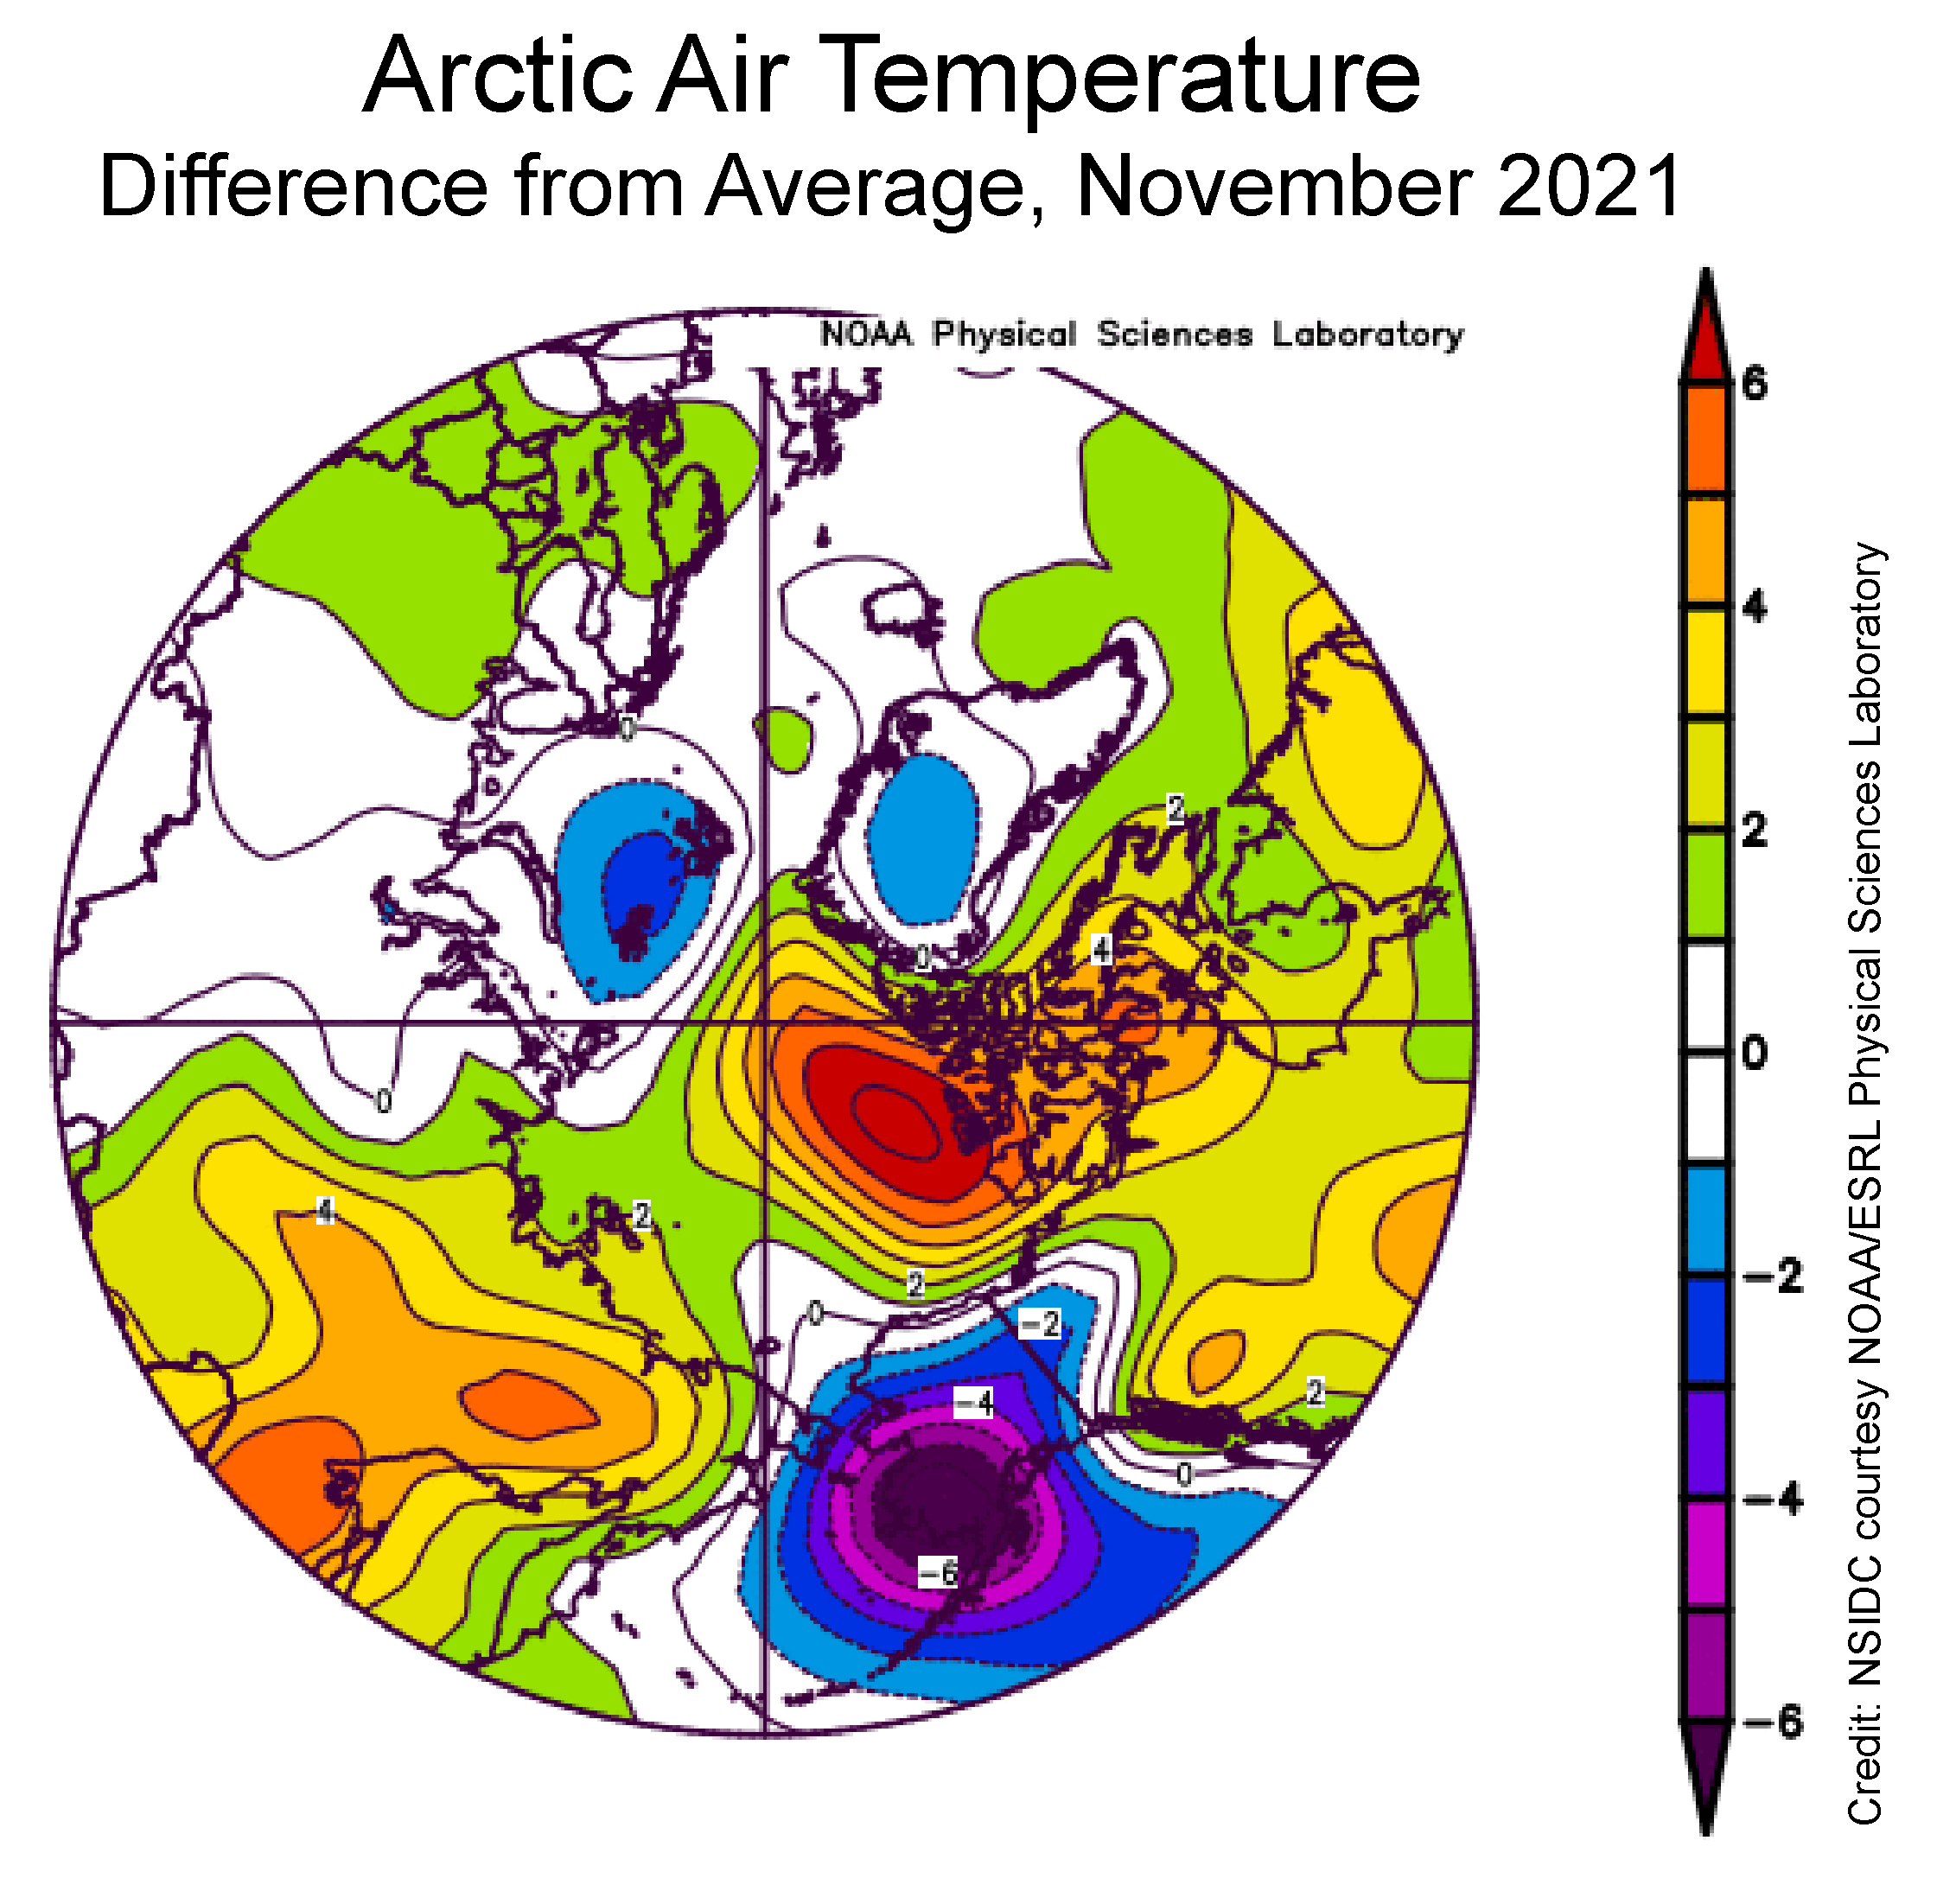
Air temperatures at the 925 millibar level (about 2,500 feet above the surface) were well above average north of the Canadian Archipelago, by as much as 6 degrees Celsius. Conversely, temperatures over southwest Alaska and the eastern sector of the Bering Sea were as much as 6 degrees Celsius below average:
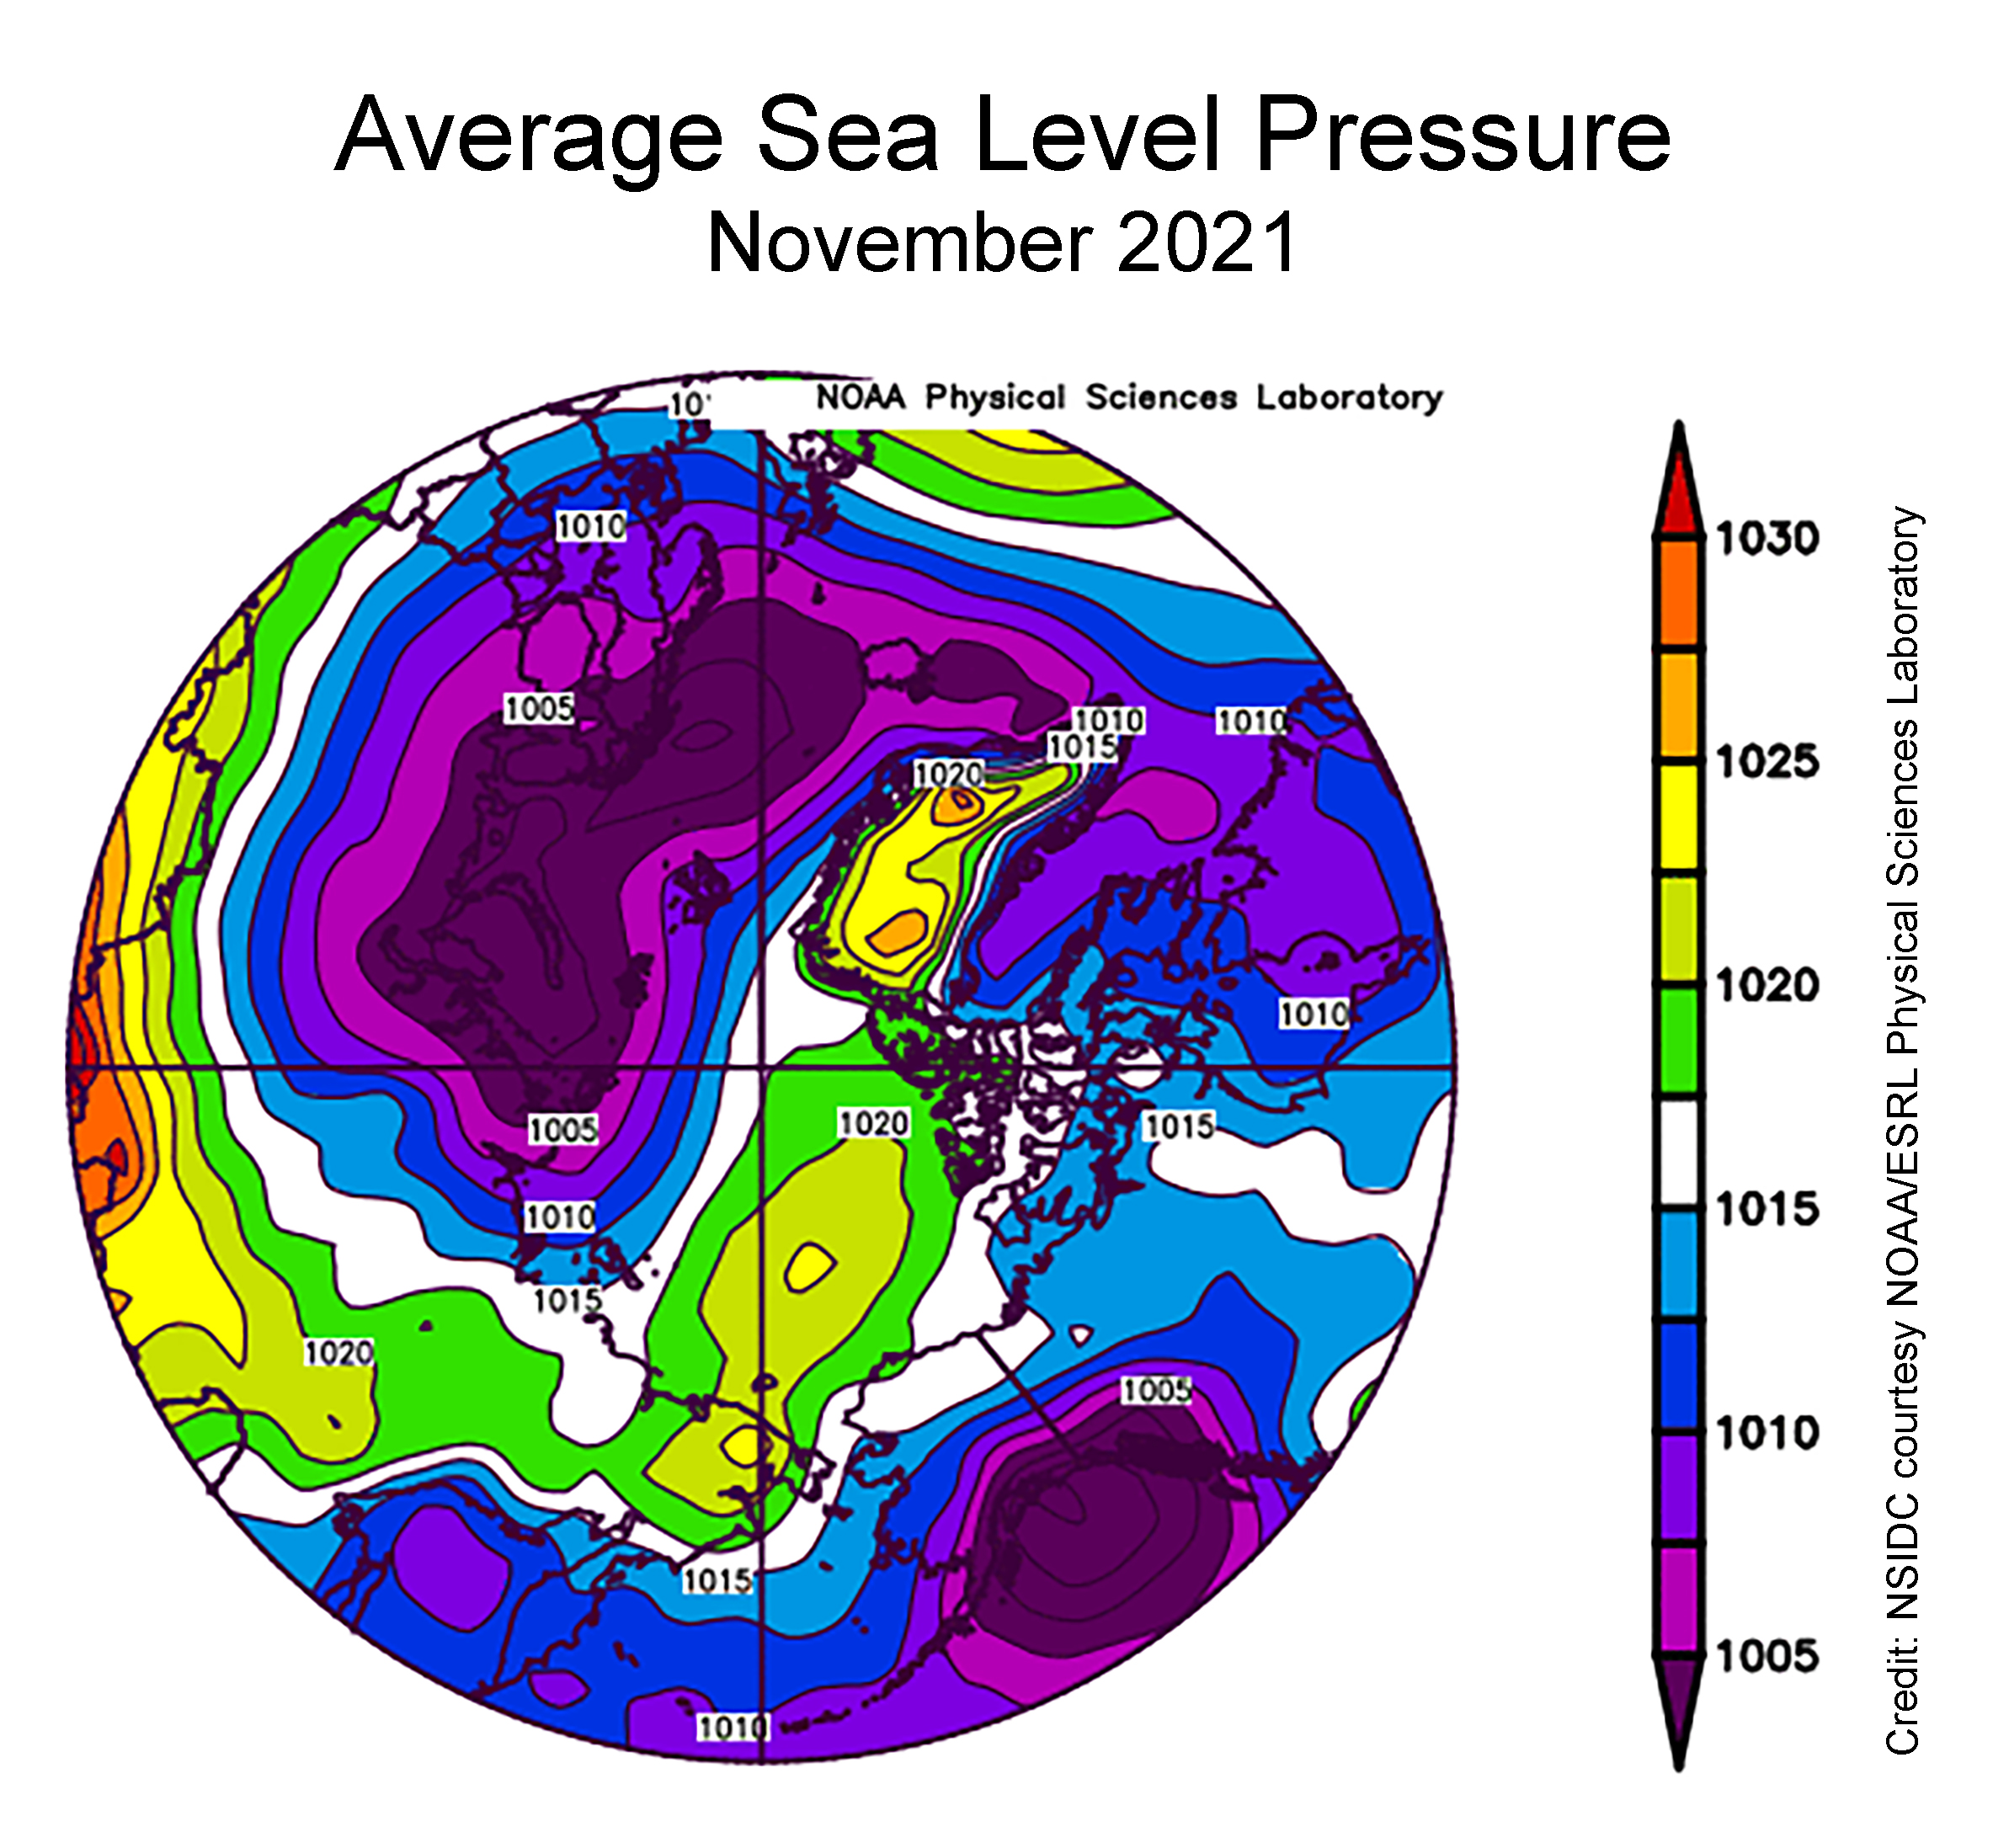
The sea level pressure pattern for November featured widespread low pressure over the Atlantic side of the Arctic and extending into the Barents and Kara Seas, paired with a moderately strong Beaufort Sea High. Strong low pressure over the Gulf of Alaska resulted in a circulation pattern in the eastern Bering Sea that brought cold air from the north. This pattern was favorable for sea ice growth, and can explain the above average ice extent in the region:
[Edit – December 7th]
Since the start of December high resolution AMSR2 extent has been flatlining:
Sea ice area has even declined slightly over the past few days:
Here too is an animation created by Uniquorn on the Arctic Sea Ice Forum using AWI ASMR2 data to reveal ice movement through the Nares Strait during December:
[Edit – December 9th]
The JAXA/ADS/ViSHOP web site is down again, so let’s take another look at high resolution AMSR2 area and extent:
It seems that the “brief hiatus” is over, and extent is now in a “statistical tie” with 2018/19 at 4th lowest for the date amongst recent year.
[Edit – December 13th]
The PIOMAS Arctic sea ice volume data for November 2021 has been released:
Average Arctic sea ice volume in November 2021 was 7,830 km3. This value is the 7th lowest on record for November, about 1600 km3 above the record set in 2016. Monthly ice volume was 61% below the maximum in 1979 and 45% below the mean value for 1979-2020. Average November 2021 ice volume was about one sigma above the 1979-2020 trend line. October saw relative rapid ice growth for recent years bringing the mean ice thickness (above 15 cm thickness) above the recent low values:
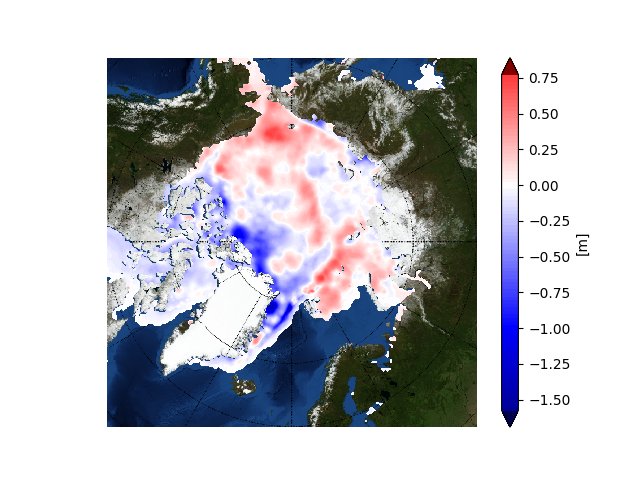
The ice thickness anomaly map for November 2021 relative to 2011-2020 continues to show anomalies divided into positive and a negative halves with areas of positive anomalies increasing since the two prior months. Negative anomalies stretching from North of Greenland and along the Canadian Archipelago across the Eastern Arctic into the Barents Sea. Areas North of Greenland again feature very low ice thickness as in prior years (see our recent paper). Positive anomalies are notable in the Beaufort and Chukchi seas due to advection of thicker older ice into the areas during the previous winter (See recent paper on this). The Alaskan summer has also been relatively cold contributing to unusually thick ice in this area:
CryoSat-2 ice thickness shows a similar picture sea ice thickness anomalies but with the maxima slightly displaced which maybe due to temporal sampling of the composite:
The JAXA web site is still down, so here’s another set of high resolution AMSR2 graphs:
[Edit – December 14th]
NOAA have just released their 2021 Arctic Report Card. Here’s the introductory video:
“Everybody knows [the Arctic] is a canary when it comes to climate change,” says Peter Jacobs, a climate scientist at NASA’s Goddard Space Flight Center, who presented the work on 13 December at a meeting of the American Geophysical Union. “Yet we’re misreporting it by a factor of two. Which is just bananas.”
Jacob’s co-authors include researchers who oversee several influential global temperature records, and they noted the faster Arctic warming as they prepared to release the global temperature average for 2020. NASA’s internal peer reviewer challenged the higher figure, suggesting the scientific literature didn’t support it. But the researchers have found the four times ratio holds in record sets from both NASA (3.9) and the United Kingdom’s Met Office (4.1), and they hope to soon include the Berkeley Earth record. (Their work also has company: In July, a team at the Finnish Meteorological Institute posted a preprint also arguing for the four times figure.)
The researchers found Arctic warming has been underestimated for a couple of reasons. One is climate scientists’ tendency to chop each hemisphere into thirds and label the area above 60°N as the “Arctic”—an area that would include, for example, most of Scandinavia. But the true definition of the Arctic is defined by Earth’s tilt. And, as has been known for centuries, the Arctic Circle is a line starting at 66.6°N. When researchers lump in the lower latitudes, “you’re diluting the amount of Arctic warming you’re getting,” Jacobs says. “That is not a trivial thing.”
The other difference is the choice of time periods over which the warming rate is calculated. Jacobs and his colleagues focused on the past 30 years, when a linear warming trend emerged for the Arctic. Analyses that look at longer term trends see less divergence between the Arctic and the world.
[Edit – December 23rd]
Here is the latest CryoSat-2/SMOS volume graph, now including some reanalysed data which seems to have come in slightly higher than the earlier “near real time” numbers:
Plus the AWI thickness map:
Further discussion of the divergence between volume and extent continues in the new New Year 2022 thread:
By way of a change we start this month’s look at all things Arctic with some sea ice statistical analysis. Anthony Watts’ Arctic porky pie production line has been speeding up recently, and I am not the only one who has noticed. As part of his takedown of the latest “skeptical” allegations against the United Kingdom Met Office Tamino has been looking at trends in Arctic sea ice extent over at his “Open Mind” blog:
First and foremost, the yearly minimum is only one day out of the year. We have sea ice extent data throughout the year, and what happens during the rest of the year counts. Instead of using the annual minimum, let’s use the annual average. To avoid losing the most recent data, I’ll compute the yearly average for October through the following September rather than the usual (but arbitrary) January through December. I’ll also omit October 1978 through September 1979 because that year is incomplete. I get this:
The annual averages show much less fluctuation than the annual minima, so we can estimate things like rates of change with greater precision. I find that there is statistical evidence that the rate changed over time. One model of such changes uses three straight-line segments with their changes chosen to best-fit the data, like this:
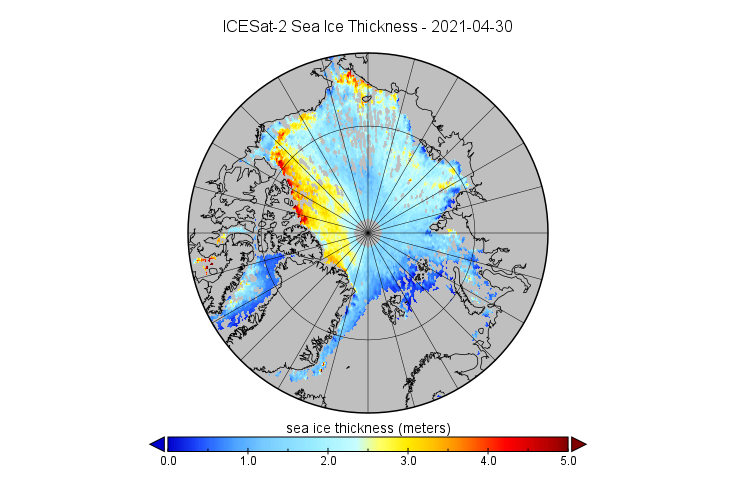
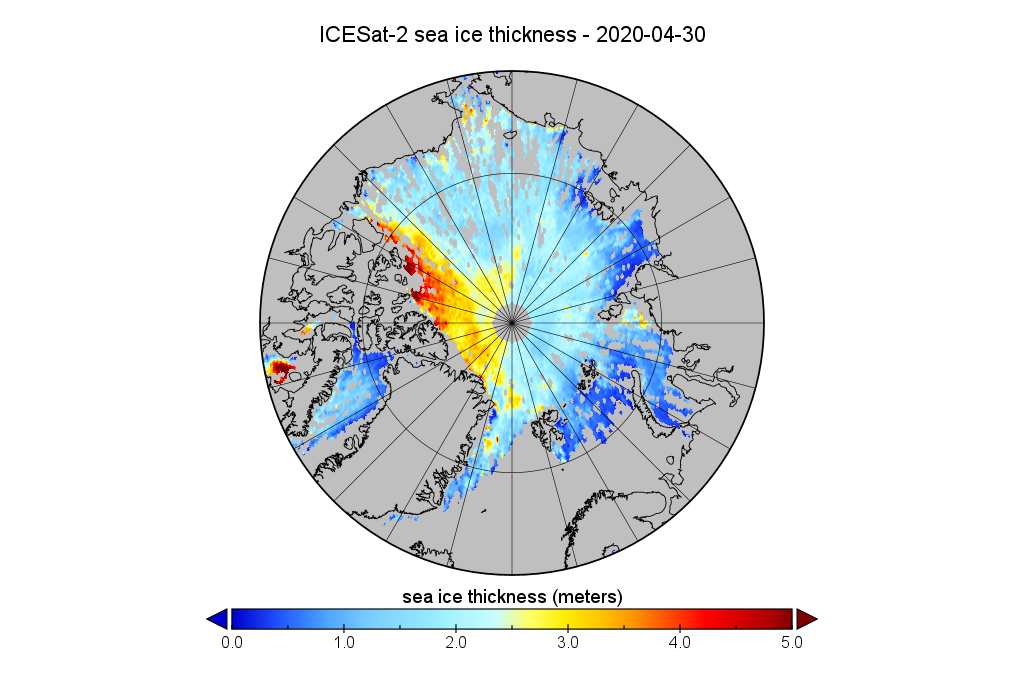
We reported on the first ICESat-2 sea ice thickness data to be released back in May. We are now very pleased to be able to reveal that the data up to April 2021 is now available for download from the NSIDC web site. Here’s a visualisation of April’s data:
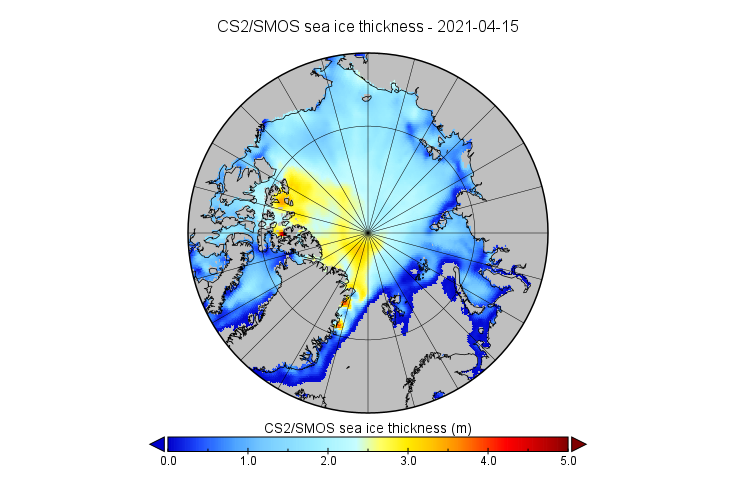
For comparison purposes here’s the CryoSat-2/SMOS equivalent:
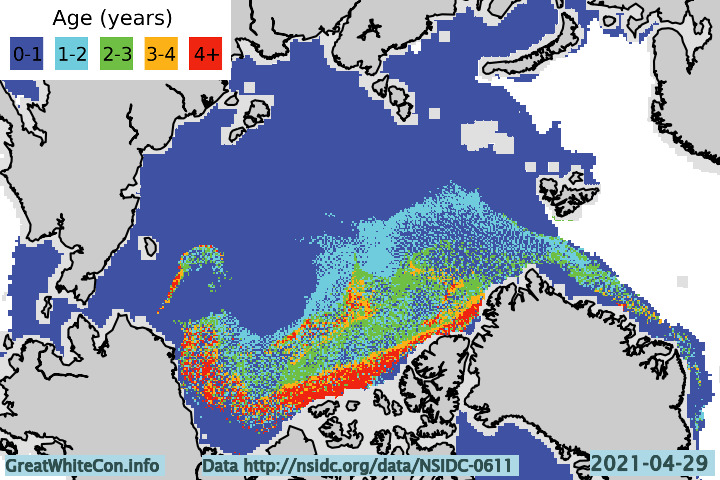
ICESat-2 looks to have captured the arm of thicker ice extending across the Beaufort Sea suggested by sea ice age data better than CryoSat-2:
However thickness data is totally absent where leads are absent, in land-fast ice for example. It seems that near real time ICESat-2 processing isn’t available as yet, but we await the release of the data for October with barely bated breath!
This month has begun with a couple of CryoSat-2 related papers. First we have one that I unexpectedly I found out about via Twitter:
I have a paper out today in which we recalculate sea-ice-thickness trends in the Arctic marginal seas using output of a new snow model rather than with the traditional climatology.
It's had some press coverage so I want to be clear about what it does(n't) say, uncertainties, etc https://t.co/KJQE9Uv1E5
Whilst we wait on those SnowModel-LG results does the CPOM’s new analysis offer any cause for comfort concerning sea ice thickness in 2021? I’m afraid not. Here’s an extract from the conclusions:
We found that interannual variability in average sea ice thickness of the marginal seas was increased by more than 50 % by accounting for variability in the snow cover. On a seasonal timescale we find that variability in the snow cover makes an increasing contribution to the total variability of inferred sea ice thickness, increasing from around 20 % in October to more than 70 % in April.
We also observed that the trends in SnowModel-LG data propagated through to the sea ice thickness time series, amplifying the decline in regions where it was already significant and introducing significant decline where it did not previously exist. This occurred in spite of the compensating effect of enhanced interannual variability.
Knowledge of sea-ice thickness and volume depends on freeboard observations from satellite altimeters and in turn on information of snow mass and sea-ice density required for the freeboard-to-thickness conversion. These parameters, especially sea-ice density, are usually based on climatologies constructed from in situ observations made in the 1980s and before while contemporary and representative measurements are lacking. Our aim with this paper is to derive updated sea-ice bulk density estimates suitable for the present Arctic sea-ice cover and a range of ice types to reduce uncertainties in sea-ice thickness remote sensing. Our sea-ice density measurements are based on over 3000 km of high-resolution collocated airborne sea-ice and snow thickness and freeboard measurements in 2017 and 2019.
Some slightly strange English in there, but interesting nonetheless and an complement to Robbie Mallett’s paper above.
In addition to the paper itself Stefan Hendricks has posted an explanatory thread on Twitter:
We therefore came up with a way to "measure" sea ice density with an aircraft: Observe #seaice thickness and snow depth as well as freeboard to see how far the ice surface is floating above sea-level. With that we can compute density of the ice layer. pic.twitter.com/7rkzn6UdXS
Main findings: The density values are higher than what we get with the climatology values, more so for multi-year sea ice than for first-year ice. Part of the explanation is that with the airborne data we also tried to get the bulk density of deformed ice that includes sea water.
We also found a robust relationship between ice freeboard and ice density. This will be useful for the freeboard to thickness conversion of satellite data.
If I’ve understood the 2 papers correctly Robbie’s change to estimated snow thickness implies less overall sea ice volume in CPOM’s future product, whereas Arttu’s change to estimated sea ice density implies increased sea ice volume in AWI’s version.
All in all I’m anticipating the summer 2021 high Arctic melting season with even greater trepidation than at the start of this month. Uncertainty is exceedingly unsettling!
AWI sea-ice physicists report on the first indications that the rising ocean heat is also slowing ice formation in the Laptev Sea, which also includes measurements of the ice floe from the one-year MOSAiC expedition in late summer 2020. In it, the researchers analyse the long-term data from their sea-ice thickness measuring programme in the Arctic, ‘IceBird’, and trace the origins of the unusually thin sea ice that they observed from the research aeroplane in the northern Fram Strait in summer 2016. At that time, the ice was just 100 centimetres thick, making it 30 percent thinner than in the previous year – a difference that the researchers were initially unable to explain. “To solve the puzzle, we first retraced the ice’s drift route with the help of satellite images. It originated in the Laptev Sea,” explains AWI sea-ice physicist Dr Jakob Belter. The experts then examined the weather along the route. However, the atmospheric data for the period 2014 to 2016 didn’t show any abnormalities.
That meant the answer had to lie in the ocean – and indeed: from January to May 2015, experts from the University of Alaska Fairbanks recorded unusually high temperatures in the waters north of the Laptev Sea. We now know that the heat rose from the depths with Atlantic water masses, and slowed the winter ice growth. “Using the satellite data, we were able to show that the thin ice that we sampled in Fram Strait in July 2016 had previously passed through this unusually warm area off the Russian continental shelf,” says Belter. Furthermore, the ocean heat wave must have been so extreme that its effects on the growth in sea-ice thickness couldn’t be compensated for during its drift across the Arctic Ocean.
The conclusions from the paper itself include:
Further investigations and measurements are required to monitor the development of Atlantification in the eastern marginal ice zones. But in order to strengthen our conclusion that Atlantification is able to precondition sea ice and that this preconditioning persists far beyond the eastern Arctic, additional uninterrupted SIT time series are vital along the pathways and at the exit gates of Arctic sea ice. The presented summer SIT time series at the end of the Transpolar Drift is an important effort to establish long-term and large-scale measurements of SIT, especially during the melt season. Airborne EM measurements of SIT during IceBird campaigns provide the necessary accuracy and areal coverage that is unmatched by any other non-satellite SIT measurement approach. Russian shipborne SIT measurements show significant differences to EM-based measurements, but their regularity and spatial consistency enable the depiction of regime shifts in SIT that are hardly resolved by the presented EM SIT time series. Obtaining SIT distributions over large areas and developing and continuing long-term SIT time series will provide unique input data for modelling efforts and ultimately will improve predictions of Arctic sea ice and its thickness in the future.
Getting back to the conclusion of the press release:
The two new studies highlight the importance of long-term datasets for sea-ice research in the Arctic. “If we are to understand the changes in the Arctic sea ice, long-term observations of ice thickness using satellites and aircraft are vital. Combined with modelling data they provide an overall picture that is sufficiently detailed to allow us to identify the key processes in the changing Arctic,” explains Jakob Belter.
It’s been a long wait since NASA launched the ICESat-2 satellite in September 2018:
However some good news has arrived at long last! ICESat-2 level 4 monthly gridded Arctic sea ice thickness data is now available for download via the NSIDC:
Now for the bad news. Currently it’s only available from 1 November 2018 to 30 April 2020 . There also seems to be an absence of data in summer, just like CryoSat-2.
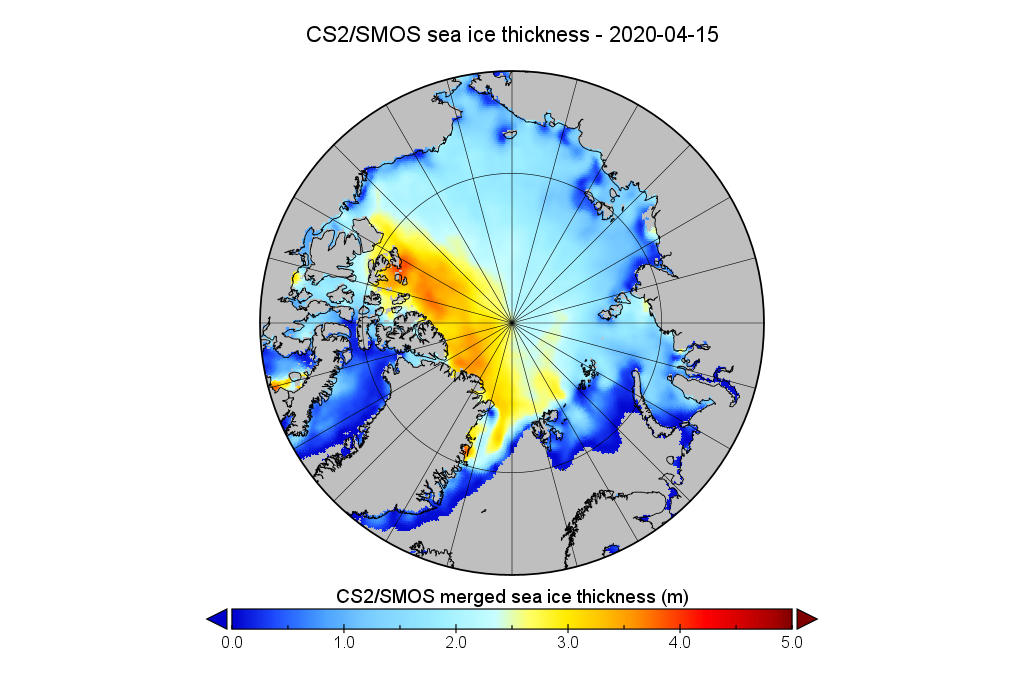
Here is my first visualisation of the most recent data, for April 2020:
Here is the equivalent from AWI’s CryoSat-2/SMOS gridded thickness product for comparison purposes:
Inspired by my recent visits to Judith Curry’s blog this post will bring you links to the latest learned journal articles about Arctic sea ice. Together with occasional excursions into older and wider Arctic papers.
Judith’s “Week in Review” articles seem to last for a month, so this one will probably last for at least a year!
First up is an article apparently written by a regular reader of this humble web site! A University of Alaska article at phys.org begins:
In August 2016 a massive storm on par with a Category 2 hurricane churned in the Arctic Ocean. The cyclone led to the third-lowest sea ice extent ever recorded. But what made the Great Arctic Cyclone of 2016 particularly appealing to scientists was the proximity of the Korean icebreaker Araon.
For the first time ever, scientists were able to see exactly what happens to the ocean and sea ice when a cyclone hits. University of Alaska Fairbanks researchers and their international colleagues recently published a new study showing that sea ice declined 5.7 times faster than normal during the storm. They were also able to prove that the rapid decline was driven by cyclone-triggered processes within the ocean.
Note that it didn’t take us 5 years to write about the cyclone in question. Our article catchily entitled “The Great Arctic Cyclone of 2016” was published on August 13th 2016:
A storm is brewing in the Arctic. A big one! The crew of the yacht Northabout are currently sailing along the western shore of the Laptev Sea and reported earlier today that “The sea is calm. Tomorrow a gale 8. But this moment is perfect”.
That perfect moment will not last long.
I interviewed polar explorer David Hempleman-Adams about the succeeding moments once Northabout had returned to the UK. It seems riding out the cyclone was the most frightening experience he had ever had.
The University of Alaska article references the following peer reviewed paper:
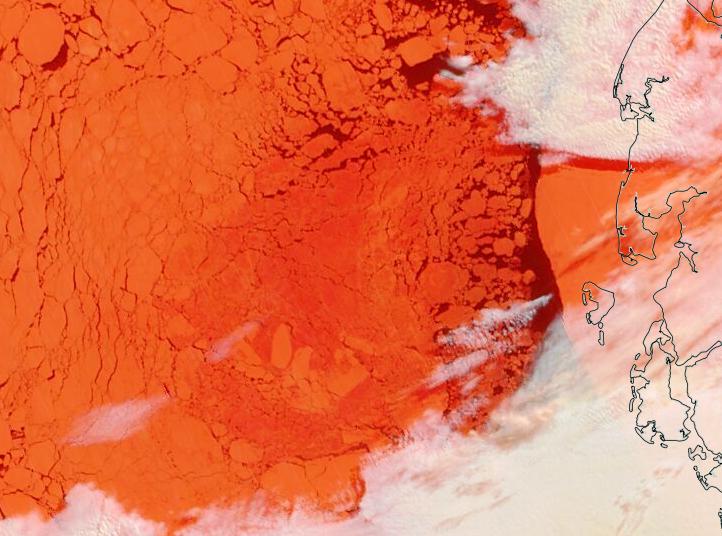
It’s May Day 2021, and just for a change we’re going to start the month off with a pretty picture!
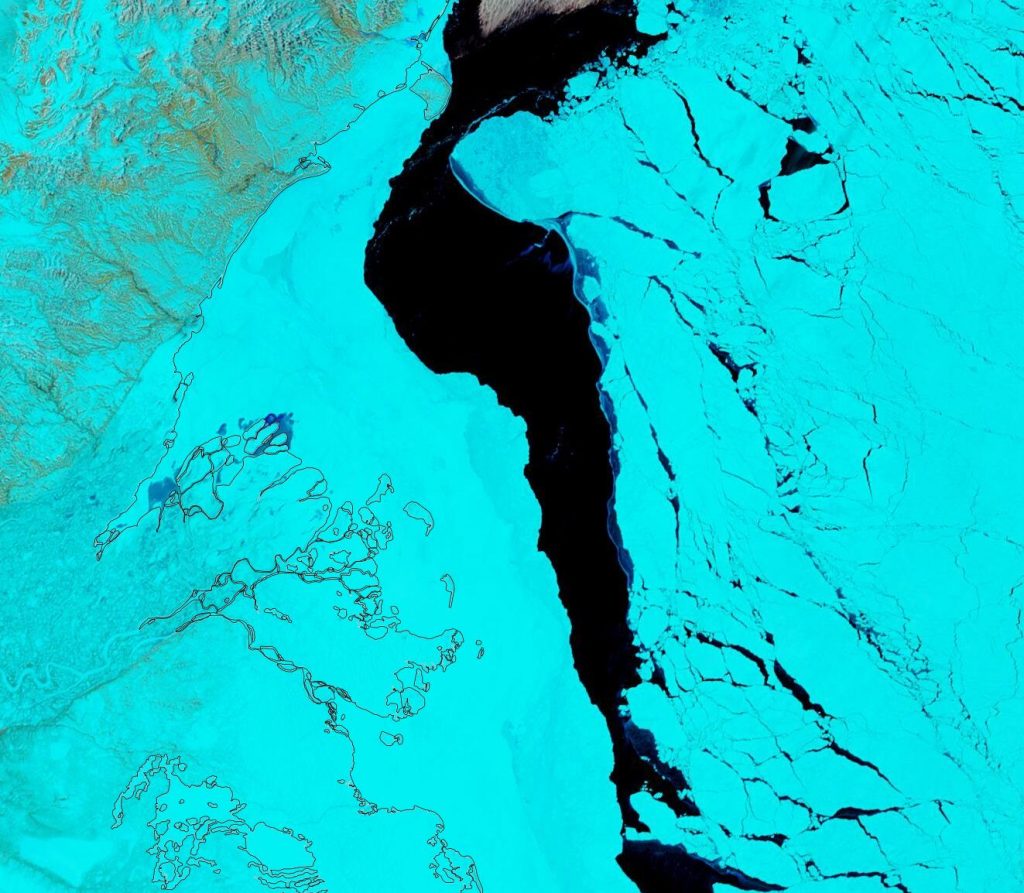
Parts of the Laptev Sea are starting to look distinctly “warm” in the infra-red. Here’s a “false colour” image taken by the Terra satellite during a gap in the clouds:
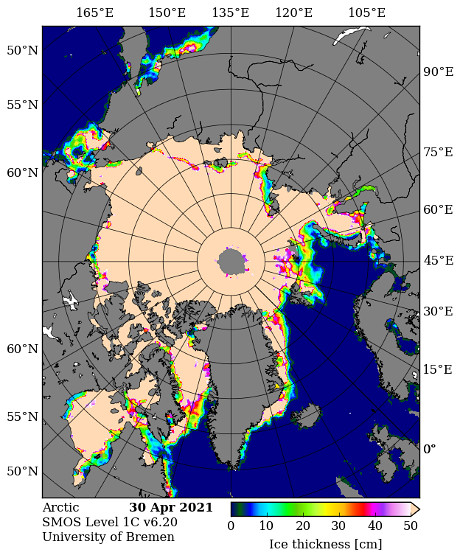
We have reached the time of year when the SMOS “thin ice thickness” readings start being affected by surface melt, but let’s take a look anyway:
That area of the Laptev certainly appears to be either thin or melting.
Meanwhile on the Canadian side of the Arctic the fast ice off the Mackenzie Delta is starting to get damp, even though the river itself still looks to be fairly well frozen:
It will also be interesting to follow the progress of this large floe as it heads towards oblivion through the Fram Strait:
This website uses cookies to improve your experience. We'll assume you're ok with this, but you can opt-out if you wish. Cookie settingsACCEPT
Privacy & Cookies Policy
Privacy Overview
This website uses cookies to improve your experience while you navigate through the website. Out of these, the cookies that are categorized as necessary are stored on your browser as they are essential for the working of basic functionalities of the website. We also use third-party cookies that help us analyze and understand how you use this website. These cookies will be stored in your browser only with your consent. You also have the option to opt-out of these cookies. But opting out of some of these cookies may affect your browsing experience.
Necessary cookies are absolutely essential for the website to function properly. This category only includes cookies that ensures basic functionalities and security features of the website. These cookies do not store any personal information.
Any cookies that may not be particularly necessary for the website to function and is used specifically to collect user personal data via analytics, ads, other embedded contents are termed as non-necessary cookies. It is mandatory to procure user consent prior to running these cookies on your website.