Tag Archives: CPOM

The Centre for Polar Observation and Modelling

Month in Review – Arctic Science Edition

This month has begun with a couple of CryoSat-2 related papers. First we have one that I unexpectedly I found out about via Twitter:

Regular readers will recall that the thickness in mid April by the AWI’s CryoSat-2/SMOS metric seemed remarkably low, so I had to ask this question:

Whilst we wait on those SnowModel-LG results does the CPOM’s new analysis offer any cause for comfort concerning sea ice thickness in 2021? I’m afraid not. Here’s an extract from the conclusions:

We found that interannual variability in average sea ice thickness of the marginal seas was increased by more than 50 % by accounting for variability in the snow cover. On a seasonal timescale we find that variability in the snow cover makes an increasing contribution to the total variability of inferred sea ice thickness, increasing from around 20 % in October to more than 70 % in April.

We also observed that the trends in SnowModel-LG data propagated through to the sea ice thickness time series, amplifying the decline in regions where it was already significant and introducing significant decline where it did not previously exist. This occurred in spite of the compensating effect of enhanced interannual variability.

Next there is a preprint from Arttu Jutila et al. at the Alfred Wegener Institute. According to “Retrieval and parametrisation of sea-ice bulk density from airborne multi-sensor measurements“:

Knowledge of sea-ice thickness and volume depends on freeboard observations from satellite altimeters and in turn on information of snow mass and sea-ice density required for the freeboard-to-thickness conversion. These parameters, especially sea-ice density, are usually based on climatologies constructed from in situ observations made in the 1980s and before while contemporary and representative measurements are lacking. Our aim with this paper is to derive updated sea-ice bulk density estimates suitable for the present Arctic sea-ice cover and a range of ice types to reduce uncertainties in sea-ice thickness remote sensing. Our sea-ice density measurements are based on over 3000 km of high-resolution collocated airborne sea-ice and snow thickness and freeboard measurements in 2017 and 2019.

Some slightly strange English in there, but interesting nonetheless and an complement to Robbie Mallett’s paper above.

In addition to the paper itself Stefan Hendricks has posted an explanatory thread on Twitter:

From Stefan’s Twitter thread:

Main findings: The density values are higher than what we get with the climatology values, more so for multi-year sea ice than for first-year ice. Part of the explanation is that with the airborne data we also tried to get the bulk density of deformed ice that includes sea water.

We also found a robust relationship between ice freeboard and ice density. This will be useful for the freeboard to thickness conversion of satellite data.

If I’ve understood the 2 papers correctly Robbie’s change to estimated snow thickness implies less overall sea ice volume in CPOM’s future product, whereas Arttu’s change to estimated sea ice density implies increased sea ice volume in AWI’s version.

All in all I’m anticipating the summer 2021 high Arctic melting season with even greater trepidation than at the start of this month. Uncertainty is exceedingly unsettling!

[Edit – June 17th]


News arrives via an AWI press release, which also refers to the Ricker et al. paper we mentioned last month, of a new paper. The lead author of “Interannual variability in Transpolar Drift summer sea ice thickness and potential impact of Atlantification” is Jakob Belter. Some more famous names in the “et al.” section include Igor Polyakov, Robert Ricker and Stefan Hendricks.

According to the press release:

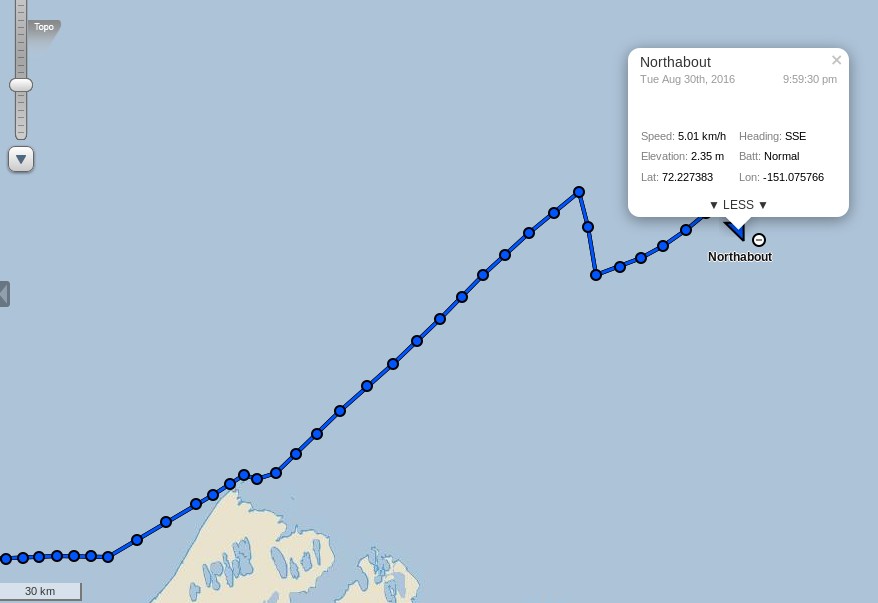
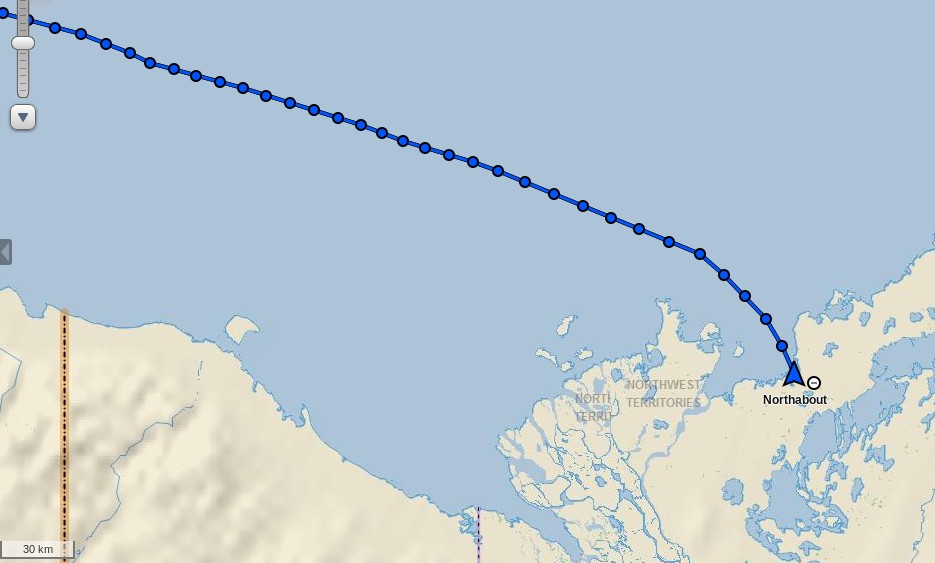
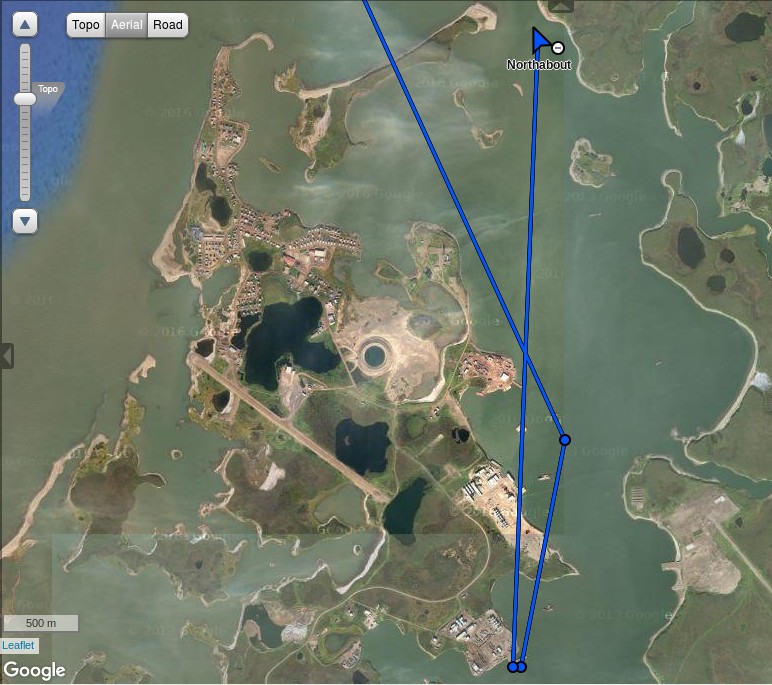
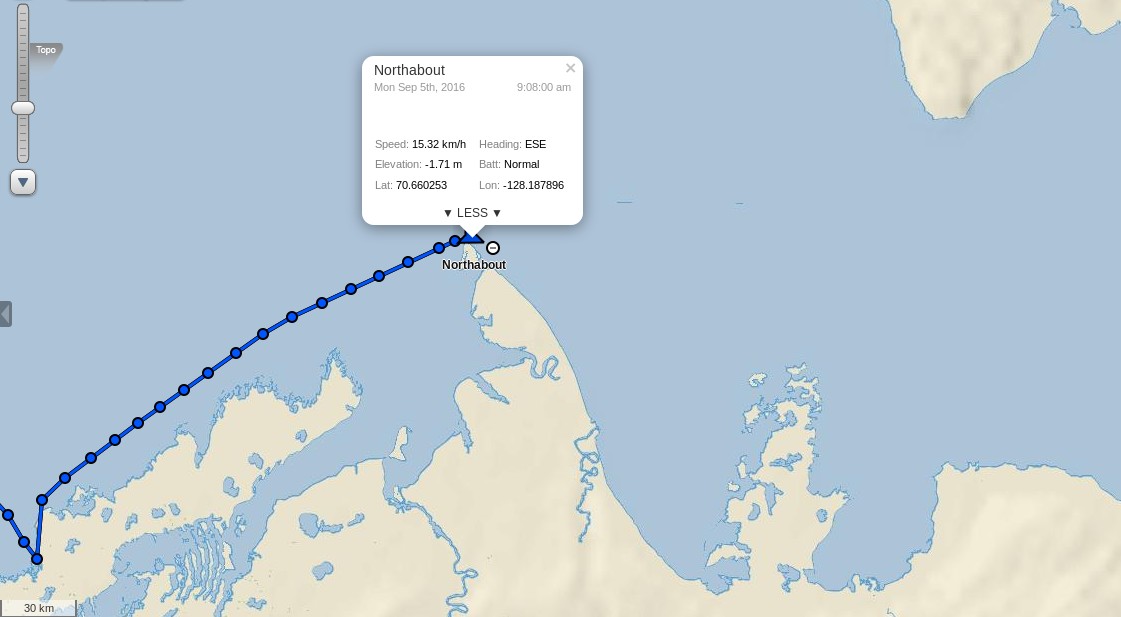
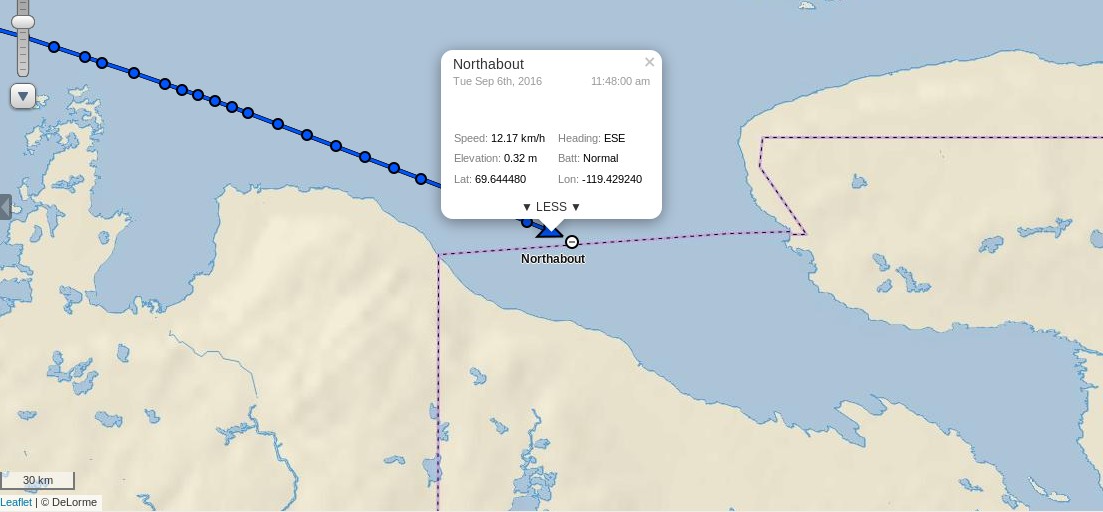
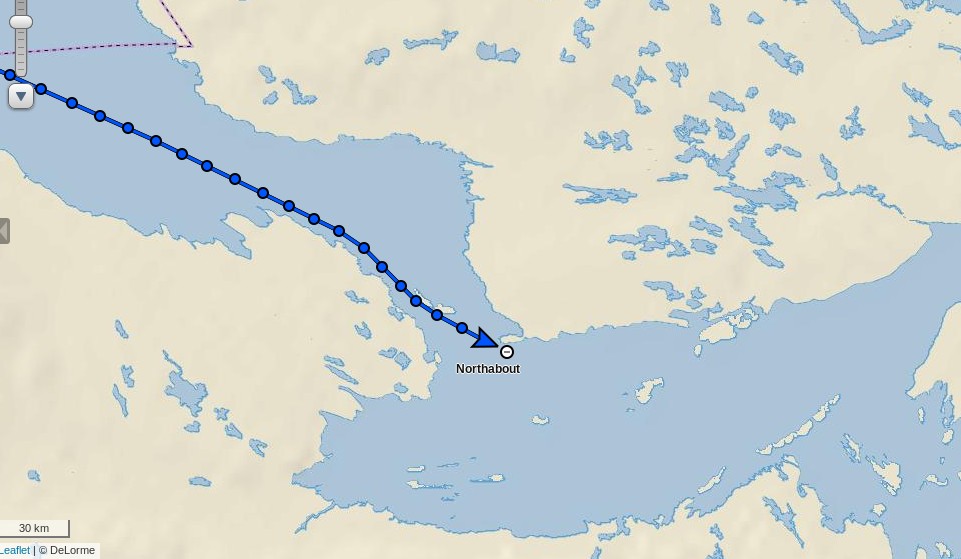
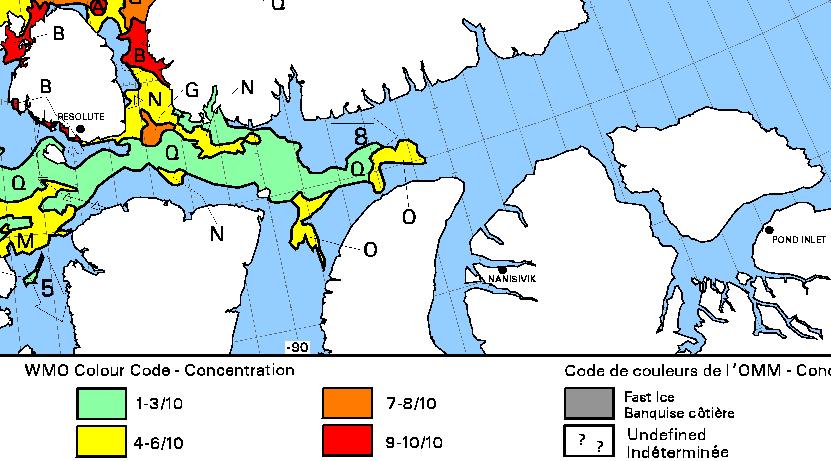
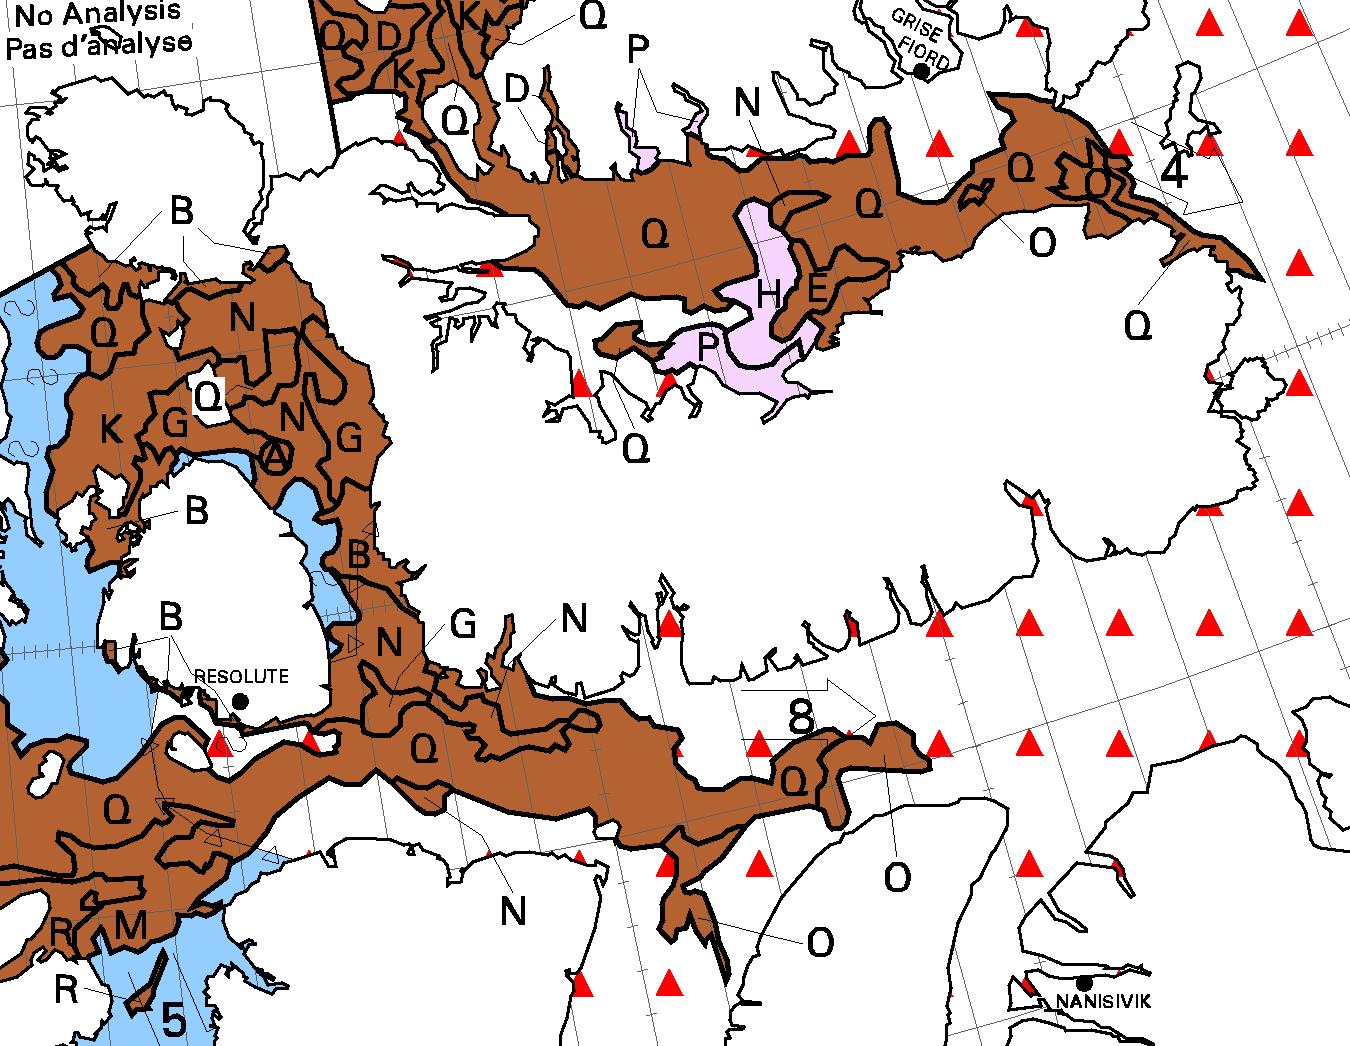
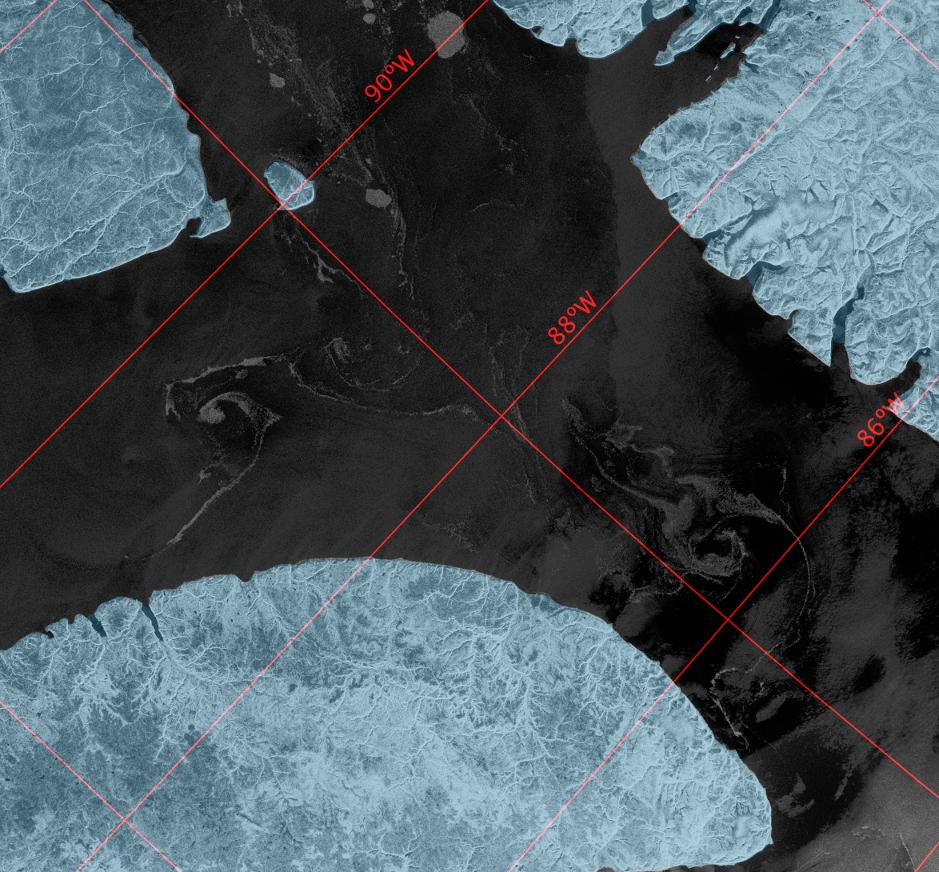
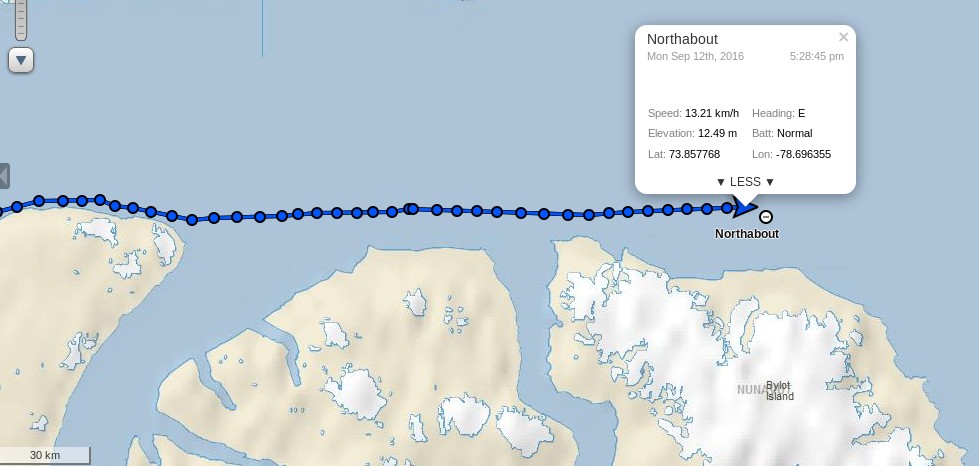
AWI sea-ice physicists report on the first indications that the rising ocean heat is also slowing ice formation in the Laptev Sea, which also includes measurements of the ice floe from the one-year MOSAiC expedition in late summer 2020. In it, the researchers analyse the long-term data from their sea-ice thickness measuring programme in the Arctic, ‘IceBird’, and trace the origins of the unusually thin sea ice that they observed from the research aeroplane in the northern Fram Strait in summer 2016. At that time, the ice was just 100 centimetres thick, making it 30 percent thinner than in the previous year – a difference that the researchers were initially unable to explain. “To solve the puzzle, we first retraced the ice’s drift route with the help of satellite images. It originated in the Laptev Sea,” explains AWI sea-ice physicist Dr Jakob Belter. The experts then examined the weather along the route. However, the atmospheric data for the period 2014 to 2016 didn’t show any abnormalities.

That meant the answer had to lie in the ocean – and indeed: from January to May 2015, experts from the University of Alaska Fairbanks recorded unusually high temperatures in the waters north of the Laptev Sea. We now know that the heat rose from the depths with Atlantic water masses, and slowed the winter ice growth. “Using the satellite data, we were able to show that the thin ice that we sampled in Fram Strait in July 2016 had previously passed through this unusually warm area off the Russian continental shelf,” says Belter. Furthermore, the ocean heat wave must have been so extreme that its effects on the growth in sea-ice thickness couldn’t be compensated for during its drift across the Arctic Ocean.

The conclusions from the paper itself include:

Further investigations and measurements are required to monitor the development of Atlantification in the eastern marginal ice zones. But in order to strengthen our conclusion that Atlantification is able to precondition sea ice and that this preconditioning persists far beyond the eastern Arctic, additional uninterrupted SIT time series are vital along the pathways and at the exit gates of Arctic sea ice. The presented summer SIT time series at the end of the Transpolar Drift is an important effort to establish long-term and large-scale measurements of SIT, especially during the melt season. Airborne EM measurements of SIT during IceBird campaigns provide the necessary accuracy and areal coverage that is unmatched by any other non-satellite SIT measurement approach. Russian shipborne SIT measurements show significant differences to EM-based measurements, but their regularity and spatial consistency enable the depiction of regime shifts in SIT that are hardly resolved by the presented EM SIT time series. Obtaining SIT distributions over large areas and developing and continuing long-term SIT time series will provide unique input data for modelling efforts and ultimately will improve predictions of Arctic sea ice and its thickness in the future.

Getting back to the conclusion of the press release:

The two new studies highlight the importance of long-term datasets for sea-ice research in the Arctic. “If we are to understand the changes in the Arctic sea ice, long-term observations of ice thickness using satellites and aircraft are vital. Combined with modelling data they provide an overall picture that is sufficiently detailed to allow us to identify the key processes in the changing Arctic,” explains Jakob Belter. 

Facts About the Arctic in October 2018

A somewhat belated start to our October 2018 coverage, but firstly please take a look at this graph:

VISHOP_Extent_20181020

Following a remarkably sluggish refreeze this year JAXA extent is currently the lowest for the date since their records began. Meanwhile Wipneus has just released his mid month PIOMAS volume update on the Arctic Sea Ice Forum:

piomas-trnd4-2018-10-20

That graph reveals that Arctic sea ice volume has been increasing much more slowly than usual during October. The fact that the DMI freezing degree days graph is currently below all previous years in their records no doubt has something to do with that:

DMI-FDD-2018-10-20

Wipneus has also updated the mid month PIOMAS gridded thickness map:

PIOMAS-20181015

That’s the output of a model of course, but here too is the CPOM version of CryoSat-2 “measured” thickness:

Both sources agree that there’s a remarkable lack of thick ice in the Wandel Sea off north east Greenland this Autumn.

For a handle on the areas of thinner ice where refreezing is taking place around the periphery of the pack, here’s the latest SMOS map:

Finally, for the moment at least, here’s our favourite high resolution AMSR2 area and extent metrics based on JAXA data processed by the University of Hamburg to produced gridded concentration which is then used to derive area and extent by the inimitable Wipneus once again:

UH-Arctic-Area-2018-10-20

UH-Arctic-Extent-2018-10-20


[Edit – October 28th]

Here’s the latest thickness maps from SMOS:

and CryoSat-2:

There’s been a recent rapid refreeze, leaving large areas of thin ice around the edges of the central pack:

Northabout Braves the Northwest Passage

After the briefest of stops in Elson Lagoon behind Point Barrow Northabout is on the move once again:

Northabout-20160829-2000

She’s currently heading out into the Beaufort Sea before following in the giant footsteps of the cruise liner Crystal Serenity in the direction of the Amundsen Gulf and the Canadian Arctic Archipelago. Here’s the United States National Weather Service’s current ice chart for Alaskan waters:

NWS-Alaska-20160828

There looks to be far less to worry about ice wise on the next leg of the Polar Ocean Challenge than on the previous one! The weather forecast isn’t too bad either, with high pressure over the Beaufort Sea and a fair bit of sunshine. Here’s the Weather Underground forecast for Ulukhaktok, Crystal Serenity’s first port of call in the CAA:

Wunderground-Ulukhaktok-20160829

There is currently a “small craft advisory” warning in effect for the Beaufort Sea coast:

CAPE HALKETT TO FLAXMAN ISLAND-
207 PM AKDT MON AUG 29 2016

…SMALL CRAFT ADVISORY IN EFFECT FROM TUESDAY MORNING THROUGH
TUESDAY AFTERNOON…

TONIGHT
E WINDS 20 KT. SEAS BUILDING TO 4 FT.

TUE
E WINDS 25 KT. SEAS 5 FT.

TUE NIGHT
E WINDS 20 KT. SEAS 6 FT.

WED
E WINDS 20 KT. SEAS 6 FT.

WED NIGHT
E WINDS 20 KT. SEAS 5 FT.

THU
NE WINDS 20 KT. SEAS 4 FT.

THU NIGHT
NE WINDS 15 KT. SEAS 4 FT.

FRI
N WINDS 10 KT. SEAS 2 FT.

SAT
N WINDS 15 KT. SEAS 3 FT.

All in all it looks like fairly plain sailing for the foreseeable future, with only occasional moderate headwinds to contend with.


[Edit – August 30th]

It seems my “fairly plain sailing” conclusion was overly hasty. According to the latest “Ship’s Log“:

The weather forecast is pants. A 30/35 knot headwind along the coast . No one has the appetite for it, so we are heading North, slacker winds, staysail out, still a choppy sea and uncomfortable, but not as bad as 30 knots. Hopefully no ice tonight on my watch.

This is the end result:

Northabout-20160830-2200

As Phil points out below:

Our next stop along the North West Passage is Tuktoyaktuk. That’s when we can use a pontoon, get rid of our rubbish, fill the tanks, do the laundry and have a shower. 500nm away.


[Edit – August 31st]

The Polar Ocean Challenge team report via Twitter:


[Edit – September 3rd]

Last night Northabout reached Tuktoyaktuk near the delta of the great Mackenzie River:

Northabout-20160903-1000

The Polar Ocean Challenge team have had some repairs to do after the stormy start to their trip from Barrow:

They have some more to carry out in Tuk too. Despite the great “groove” displayed above Ben Edwards reports that:

Joy of joys, the auto-helm’s stopped working. Dad (Steve Edwards, crew), thinks he knows why so we’ll hopefully be able to fix it in Tuk. In the meantime we’re back to helming by hand. This is a mixed blessing, on the one hand it’s really irritating to have to helm in large swells and with a strong headwind because any movement you make is at first ignored, and then exaggerated by, the wind. So it’s hard to keep a decent track and it makes it harder to look out for ice. On the other hand, moving and putting effort into the steering keeps you warm which is nice and it means you don’t have to put as many clothes on which is also nice because when you go down stairs and it’s twenty four degrees it can get quite uncomfortable.


[Edit – September 4th]

Northabout has just left Tuktoyaktuk:

Northabout-20160904-1445

Her crew have been refreshed and her auto-helm has been repaired with the assistance of numerous people from Tuk:

We all had our job lists, ice lights, bilge pumps, laundry, shopping but the man who gets the Vodka Salute is unquestionably Steve.

I dropped him off wth Willard. Two peas in a pod. They made a broken Pilot Spigot. That sounds quite easy but it took the whole day in a machine shop in a container, working to fine tolerances, and many modifications. Fitting it in the bowels of the Lazzerette in cold weather and driving rain. It worked first time. Brilliant effort.

Here’s the current weather forecast for the area:

Issued 07:00 AM MDT 04 September 2016
Today Tonight and Monday

Wind – Northwest 15 knots diminishing to light late this morning then becoming northwest 15 Monday morning.
Waves

Seas – 1 metre.

Weather & Visibility – Chance of showers changing to periods of rain near noon then to chance of showers tonight and Monday. Fog patches dissipating early this evening.

My famous last words? Plain sailing by the look of it!


[Edit – September 5th]

Northabout has just rounded Cape Bathurst, the northernmost point of mainland Northwest Territories:

Northabout-20160905-0930

I wonder if her crew will take a close look at the nearby Smoking Hills?


[Edit – September 6th]

Northabout gave the Smoking Hills a miss and headed strait for Cape Parry. She has already crossed the Amundsen Gulf and is heading into the Dolphin & Union Strait:

Northabout-20160906-1200

According to Ben Edwards’ latest blog post:

In light of the lack of ice and in the spirit of saving time we’ve decided not to stop in Cambridge Bay or Pond Inlet and go straight on to Upernavik in Greenland before doing our crew change. Looking at the ice maps at the moment it seems we’ll be able to get through with little or no trouble, though this is almost bound to change, if it stays that way we’ll reach Upernavik in about fourteen days. I’m looking forward to it!


[Edit – September 7th]

Northabout has reached Coronation Gulf this morning (UTC):

Northabout-20160907-0930

According to their recent reports the plan is to pass Pond Inlet without stopping. The weather up there is starting to look rather wintry:

PondInlet-20160907


[Edit – September 9th]

The Polar Ocean Challenge team report via Twitter that they have seen and chatted to David Scott Cowper:

as well as spotting some more ice:


[Edit – September 10th]

This morning Northabout is rapidly approaching the western entrance to Bellot Strait:

northabout-20160910-1300

Their stated intentions are to head past Pond Inlet and across Baffin Bay to Upernavik in Greenland. Assuming they initially follow the same route as Crystal Serenity they will soon to need to pick their way past some bergy bits in Prince Regent Inlet before negotiating some currently “wispy” areas of sea ice as they enter Lancaster Sound. Here is the current Canadian Ice Service chart for the area:

resolute-20160909-1800

plus a rather cloudy “visual” image:

lancaster-suomi-20160909

The current weather forecast for Pond Inlet doesn’t suggest the parts of the Northwest Passage still on Northabout’s route are going to start refreezing just yet:

pondinlet-20160910

Currently there is an obvious passage past the existing ice, but that may of course have changed by the time Northabout gets there.


[Edit – September 10th PM]

Northabout has just emerged safely from the eastern end of Bellot Strait:

northabout-20160910-1900

I wonder if her crew will stop to make a new entry in the visitors book at Fort Ross?


[Edit – September 11th]

Here’s the latest CIS ice chart:

resolute-20160910-1800

The gap between the coast and the yellow area of 4-6/10 concentration ice has closed considerably, and there’s now a broad expanse of 1-3/10 ice which Northabout may be forced to try and wend her way through. A change in wind direction would come in very handy, and that’s just what the ECMWF forecast at Windyty is suggesting for Sunday 11th:

ecmwf-20160911-1200

Just what the doctor ordered?


[Edit – September 11th PM]

Video shot from Northabout’s drone of her ice-free passage through Bellot Strait:

However the passage from Prince Regent Inlet into Lancaster Sound has not proved to be ice-free!


[Edit – September 11th 20:30 UTC]

Northabout is obviously endeavouring to skirt around the eastern edge of the 4-6/10 old ice in her path:

northabout-20160911-2130

Today’s CIS ice concentration chart suggests there isn’t much room to spare:

resolute-20160911-1800

The stage of development chart does reveal some new ice, but it’s well to the north of Northabout’s route through Lancaster Sound to Pond Inlet:

resolute-devel-20160911-1800

Somewhat belatedly, here’s a Sentinel 1A synthetic aperture radar image of the sea ice Northabout is squeezing past as we speak:

s1a_ew_grdm_1sdh_20160911t125111_c6c8


[Edit – September 12th]

Northabout has emerged safely into Lancaster Sound, and is bypassing Pond Inlet in order to head strait across Baffin Bay:

northabout-20160912-1800

Here are a couple of videos of some remnants of sea ice on her once again eastward travels:

There are several more on the Polar Ocean Challenge web site.

With all that ice now safely behind her Northabout has new dangers to face. Wind and waves! Let’s take a look at the WaveWatch III “surf forecast” for Baffin Bay over the next few days. A low pressure area is heading in Northabout’s direction from across the Canadian Arctic Archipelago. By Wednesday morning (UTC) the resultant wind field looks like this:

u-component_of_wind_surface-in-multi_2-glo_30m-20160912_00058

By Wednesday afternoon those winds of around 15 m/s will have produced waves in Baffin Bay that are forecast to have reached over 3 meters high:

significant_height_of_combined_w-in-multi_2-glo_30m-20160912_00063

and what’s more they won’t be just wind waves. A modest swell with a period of over 12 seconds is predicted too:

mean_period_of_swell_waves_order-in-multi_2-glo_30m-20160912_00063

I’m sure the Polar Ocean Challenge team will be doing their level best to be safely on the opposite side of Baffin Bay by the time the worst of the weather arrives!


Previous Polar Ocean Challenge articles:

Non Fiction:

Northabout Races for the Date Line

Northabout Meets Some Serious Sea Ice

Northabout Bides Her Time

Northabout’s Great Adventure

Satire:

Could Northabout Sail to the North Pole?

Fiction:

Is the Polar Ocean Challenge About to End in Disaster?

Inside the BBC’s Arctic Sea Ice Science

I’m sure we’ll get stuck into to some real science eventually, but for the moment we’re still taking a long, hard look at mainstream media coverage of the latest learned journal article on Arctic sea ice to be misinterpreted by the media. Compared to some others one might mention the report on the BBC web site about the new CPOM paper in Nature Geoscience entitled “Increased Arctic sea ice volume after anomalously low melting in 2013” was relatively accurate. Entitled “Arctic ice ‘grew by a third’ after cool summer in 2013“, it said that:

Researchers say the growth continued in 2014 and more than compensated for losses recorded in the three previous years.

The scientists involved believe changes in summer temperatures have greater impacts on ice than thought.

But they say 2013 was a one-off and that climate change will continue to shrink the ice in the decades ahead.

The Arctic region has warmed more than most other parts of the planet over the past 30 years.

Satellite observations have documented a decrease of around 40% in the extent of sea ice cover in the Arctic since 1980.

and

The researchers used 88 million measurements of sea ice thickness from Cryosat and found that between 2010 and 2012, the volume of sea ice went down by 14%.

They published their initial findings at the end of 2013 – but have now refined and updated them to include data from 2014 as well.

Relative to the average of the period between 2010 and 2012, the scientists found that there was a 33% increase in sea ice volume in 2013, while in 2014 there was still a quarter more sea ice than there was between 2010 and 2012.

At this juncture one is forced to ask oneself the question that if there was 33% more sea ice in 2013 than there was between 2010 and 2012, but only 25% more in 2014 how it was possible that “the growth continued in 2014”?

Desperately hoping that the BBC might be able to explain this conundrum to us we avidly listened to Adam Rutherford’s interview with Rachel Tilling, the lead author of the paper in question, on BBC Radio 4’s “Inside Science” programme last night. We were also hoping that at long last there might be some quantification of what’s happened to the VOLUME of “sea ice cover in the Arctic since 1980”. Sadly all our hopes were dashed, and Adam never posed the vital questions.

You can download a recording of the broadcast from the link above. Adam’s interview with Rachel starts at 7:00 minutes. He begins by talking about:

The publication in Nature Geoscience this week of a new paper that shows that in 2013, which was a slightly cooler summer than average, Arctic ice had grown, not just a tad, but by a WHOPPING 41% on the previous year!

Rachel Tilling then begins by saying:

The thickness and the volume are actually the most important measurements we can get, because the area’s been really, really useful in giving us an overview of how the Arctic is changing, but it only really gives us half the picture.

Here’s the full picture, taken from our Arctic Sea Ice Graphs page. Since CryoSat-2 measurements only go back as far as 2010, this graph shows Arctic sea ice volume calculated by the PIOMAS model developed by the Polar Science Center at the University of Washington:

piomas-trnd2-201506Is that WHOPPING increase in Arctic sea ice volume from 2012 to 2013 clear to you now? At 11:00 minutes into the programme Adam says:

You can see how this is going to be interpreted. You know, with 30 years of Arctic sea ice shrinking, and then suddenly it gets bigger, you’re still OK with climate change being a real thing, and global warming being a real thing?

I can see that very clearly Adam, thanks for asking, and YES is the answer to your final question. It still wasn’t clear to me whether that would be clear to Adam’s listeners however, so I posed a pertinent question on Twitter first of all:

That didn’t elicit any response, so then I tried following Adam’s instructions at the end of the interview to:

 Do let us know what you think – [email protected]

This is what I thought:

Hello Adam,

Further to your recent interview with Rachel Tilling, and your joint Twitter conversation with my alter ego “Snow White”, I’d like to reiterate how disappointed the two of us are that during your conversation with Rachel there was no mention of “41% of nothing”. Twitter speak for “Doesn’t anybody at the BBC have the faintest idea what Arctic sea ice volume was 30 years ago, in April and in October?”

By way of additional context see e.g.

https://greatWhiteCon.info/2015/07/an-inconvenient-truth-about-the-mails-climate-coverage/

http://www.carbonbrief.org/blog/2015/07/cool-arctic-summer-brought-brief-recovery-in-2013-sea-ice-loss/

https://greatWhiteCon.info/resources/

Yours in dismay,

Jim Hunt

and this is the response I got from BBC Inside Science:

Dear Sir or Madam

Thank you very much for your email. While all emails are read – and we appreciate input from listeners – we cannot reply to each one individually. There are simply too many!

For more information about Inside Science, please go to our webpage:

Inside Science, Radio 4
http://www.bbc.co.uk/programmes/b036f7w2

For individual programmes, click on ‘Episodes’.
http://www.bbc.co.uk/programmes/b036f7w2/episodes/guide

Once you have located a particular programme page, you will see a link to ‘Listen now’- on the picture of Dr. Adam Rutherford.
‘Related Links’ are found further down on the right hand side of the page.

Downloads/Podcasts of Inside Science are available at:
http://www.bbc.co.uk/podcasts/series/inscience

Thanks again and do keep sending your comments in – listener feedback helps us make better programmes for you.

Yours sincerely

Inside Science, Radio 4


Meanwhile, over on Twitter:

An Inconvenient Truth About The Mail’s Climate Coverage

A new paper has just been published by the CryoSat-2 team at University College London. The lead author is Rachel Tilling, a PhD student in the Centre for Polar Observation & Modelling at UCL. We’ll get on to the science in due course, but first let’s take a look at how Rachel’s paper has been reported in the Great British mainstream media. In a headline redolent of our old friends at the Mail on Sunday The [headline writer for the] Guardian’s Damian Carrington proclaims that:

Arctic sea ice volume showed strong recovery in 2013

Cooler temperatures revived sea ice levels suggesting a rapid recovery was possible if global warming was curbed, scientists say

Yesterday wasn’t a Sunday, so David Rose was writing in The Spectator instead of The Mail, asking rhetorically:

Was the global warming pause a myth?

Of course it was David! We explained that to you back in January!

The Daily Mail Group couldn’t let a juicy headline go begging just because it’s midweek, so an anonymous leader writer came up with this one:

Climate change and an inconvenient truth

The “Daily Mail Comment” continues:

In a major report last year, the Intergovernmental Panel on Climate Change gave a grave assessment of how man-made global warming was rapidly destroying the Arctic ice cap.

Steadily increasing temperatures had made the pack ice contract by up to 12 per cent between 1979 and 2012, leading to rising sea levels which threatened to swamp coastal regions – not to mention endangering stranded polar bears.

By the middle of the century ‘a nearly ice-free Arctic Ocean’ was likely for a large part of the year, the report predicted.

How interesting then, that the latest analysis of 88million measurements from the European Space Agency’s Cryosat satellite show the northern ice-cap INCREASED by a staggering 41 per cent in 2013 and, despite a modest shortage last year, is bigger than at any time for decades.

After that it prattles on about the “pause”, so for now let’s take a look at the paper that’s got the papers so excited. For some strange reason it’s title makes no mention of a “strong recovery in 2013”, instead describing:

Increased Arctic sea ice volume after anomalously low melting in 2013

Searching the paper for the word “recovery” returns zero results, so you may well be wondering what it actually does say? Here’s a pertinent, albeit brief, extract from the abstract:

Between autumn 2010 and 2012, there was a 14% reduction in Arctic sea ice volume, in keeping with the long-term decline in extent. However, we observe 33% and 25% more ice in autumn 2013 and 2014, respectively, relative to the 2010–2012 seasonal mean, which offset earlier losses. This increase was caused by the retention of thick sea ice northwest of Greenland during 2013 which, in turn, was associated with a 5% drop in the number of days on which melting occurred—conditions more typical of the late 1990s. In contrast, springtime Arctic sea ice volume has remained stable.

Let’s compare that with the Mail’s version shall we? Whilst searching the paper for the word “ice” returns lots of results a search for the word “cap” returns zero results, just like “recovery”. Any investigative journalist (or leader writer) who had investigated Wikipedia would have discovered this:

An ice cap is an ice mass that covers less than 50,000 km² of land area (usually covering a highland area). Masses of ice covering more than 50,000 km² are termed an ice sheet.

Thus the Arctic Ocean is not covered by an “ice-cap [that] INCREASED by a staggering 41 per cent in 2013” because, as it’s name suggests, it’s an ocean and not a land area. Assuming for the moment that the Mail leader writer is in actual fact referring to sea ice cover in the Arctic, then according to Rachel Tilling’s paper CryoSat-2 “observed 33% more ice in autumn 2013”. Where did the Mail’s “41%” come from then? Their patent pending hot air generator in reverse gear?

Moving on, the Mail must also have a top secret time machine hidden in the basement of Northcliffe House that will enable their leader writer to travel back and change history, because here once again is Andy Lee Robinson’s graphic visualisation of what’s really been happening to the volume of sea ice in the Arctic over the past few decades, albeit using PIOMAS sized ice cubes rather than the CryoSat-2 flavour:

Needless to say I have already lodged an official complaint about the antics of The Daily Mail’s imaginary time machine. If you would like to do as well then here is the appropriate form to fill in:

http://dailymail.co.uk/readerseditor

For any IPSO case officers (or Guardian writers) that might be watching please feel free to read all about 41% of nothing, and if you prefer graphs to moving pictures here’s one that shows Arctic sea ice volume in Spring from our PIOMAS regional volume page:


Meanwhile, over on Twitter: