Category Archives: Extent

The 2024 Arctic Sea Ice Minimum Extent

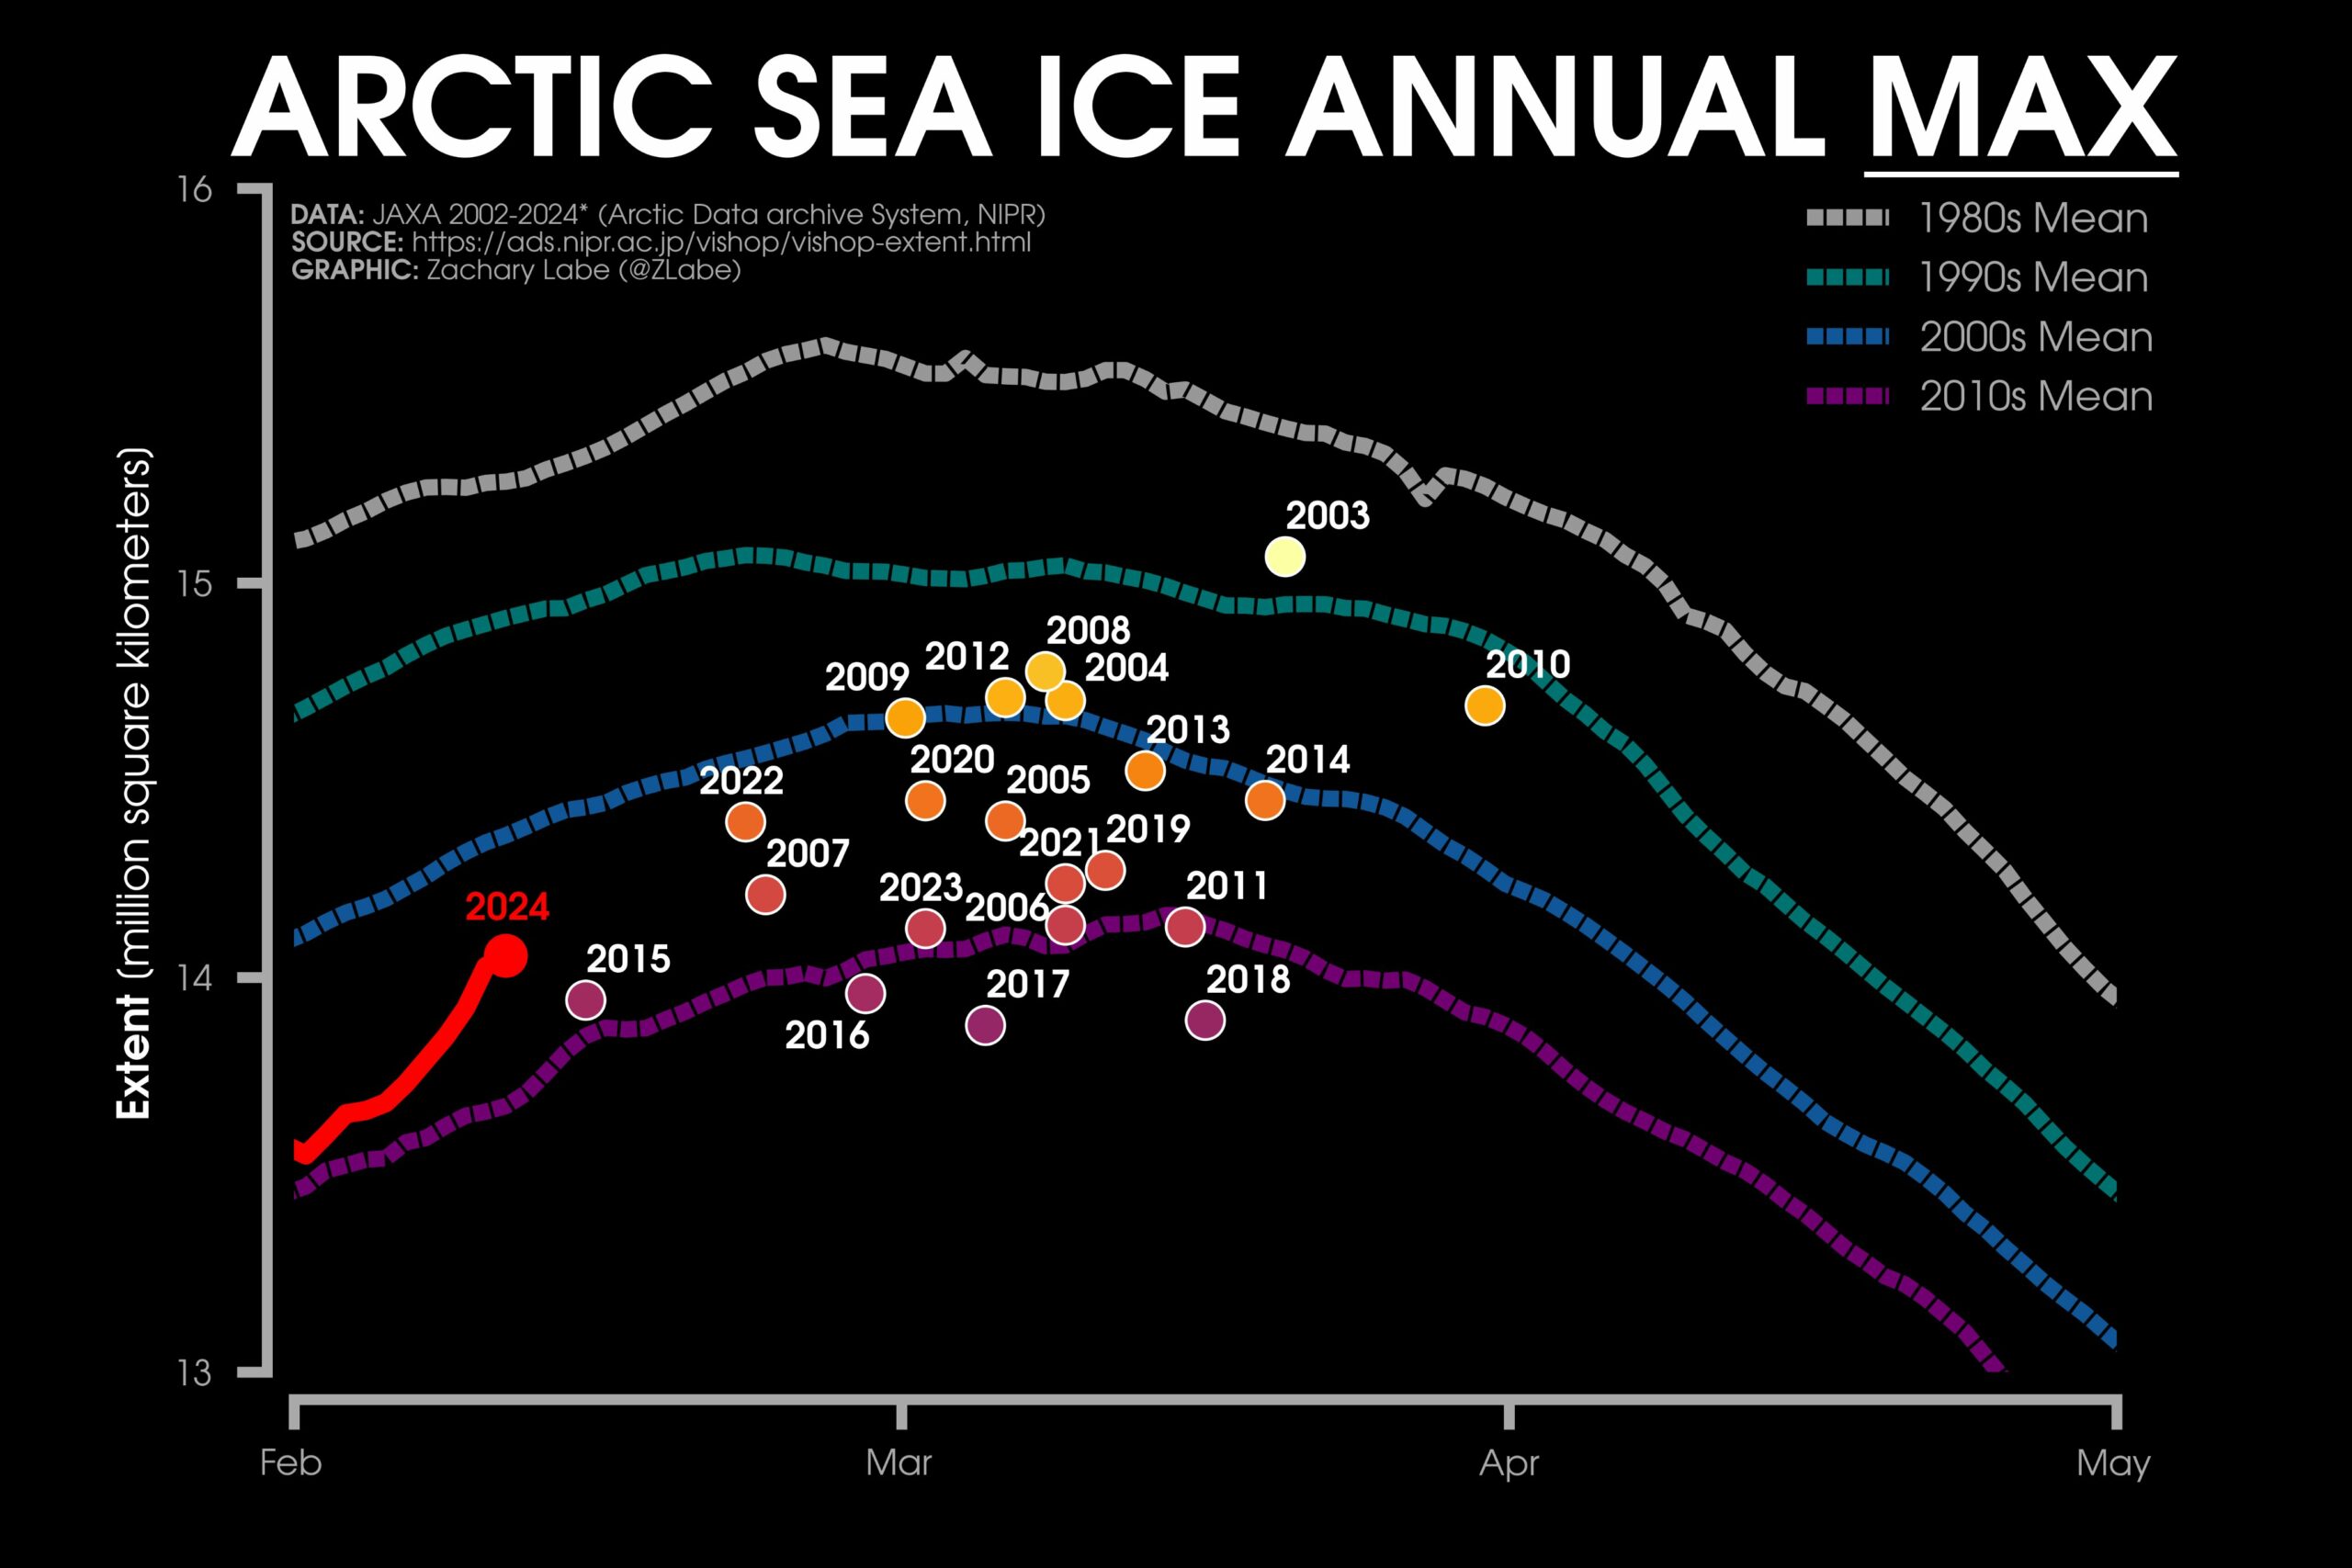
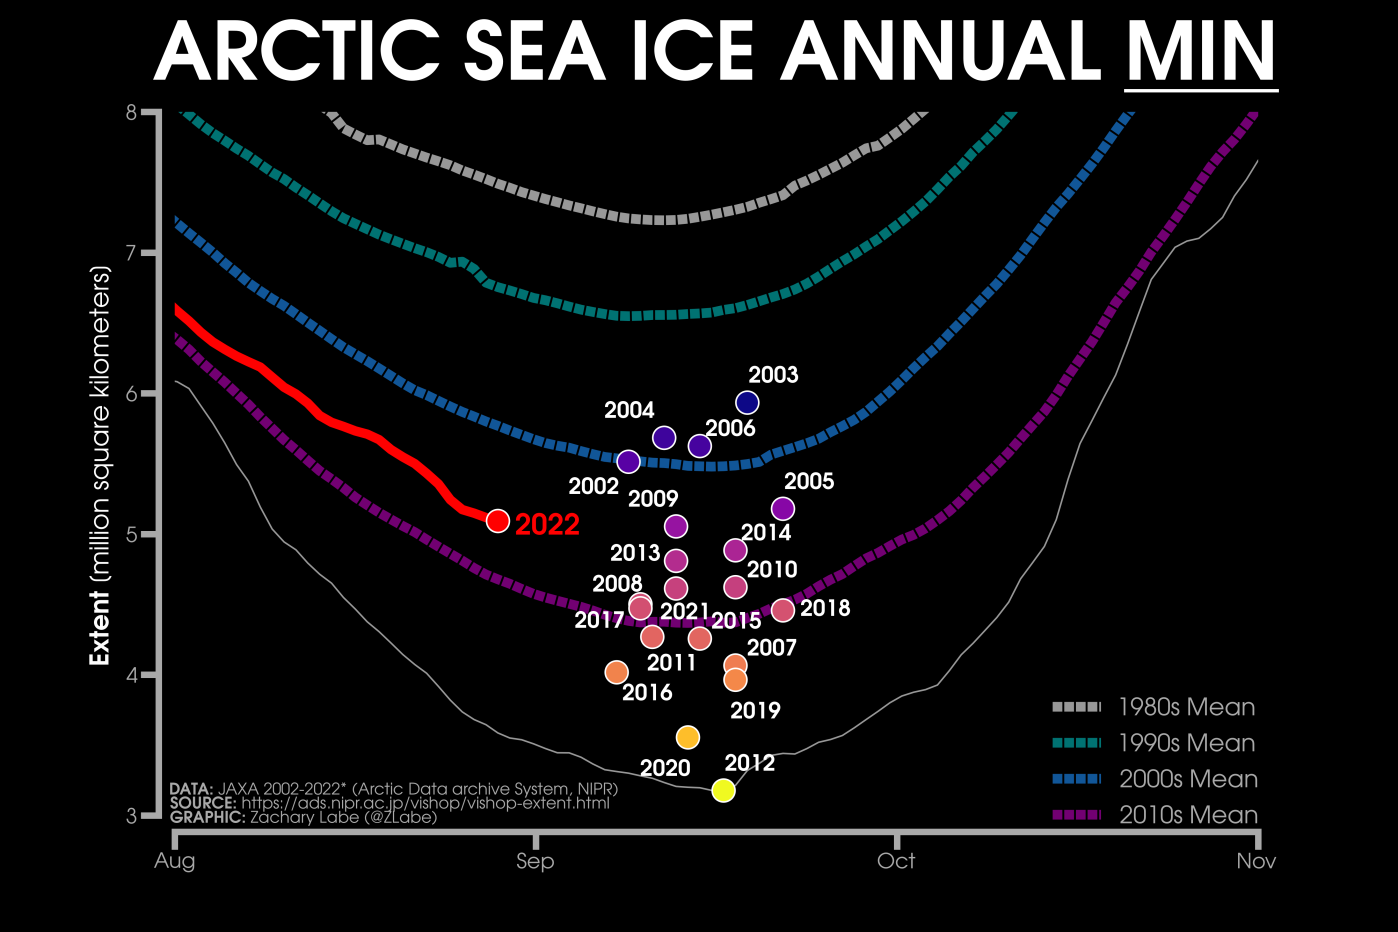
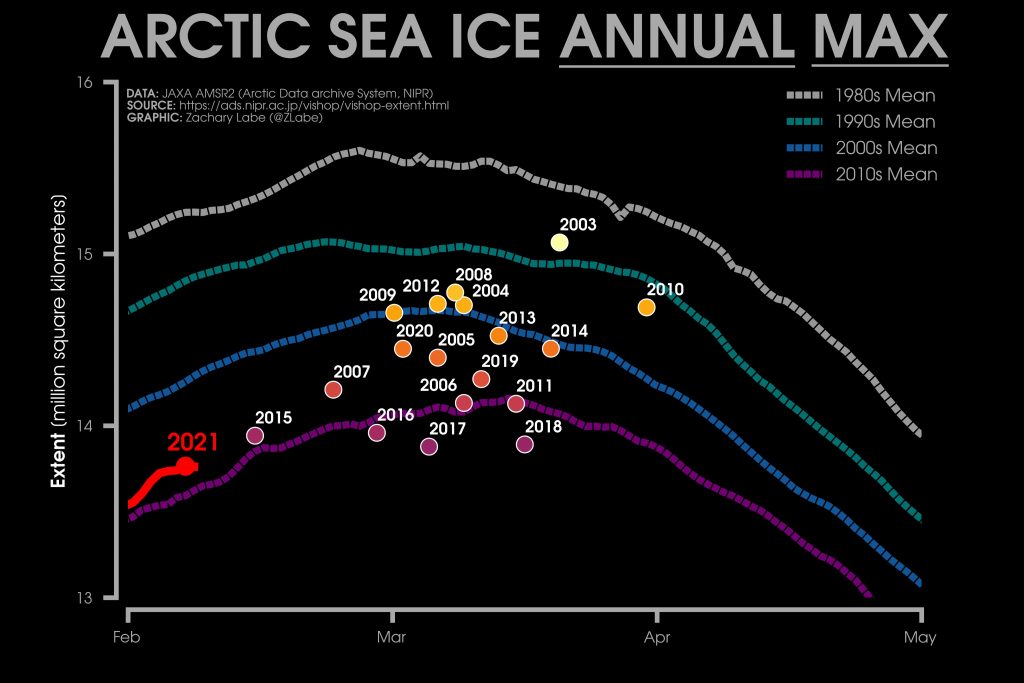
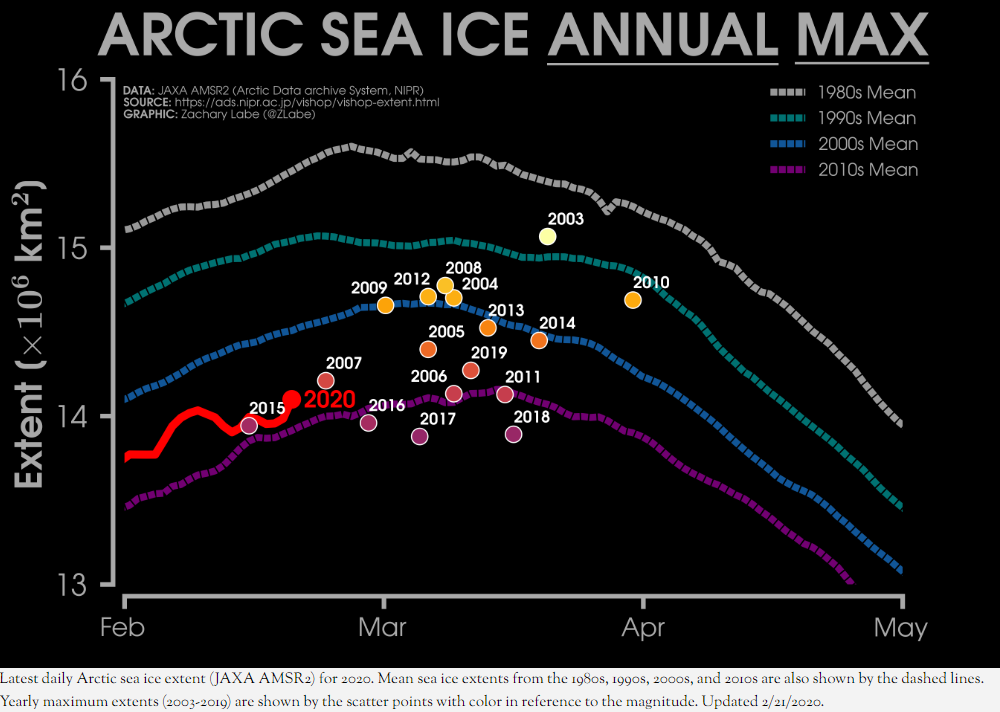
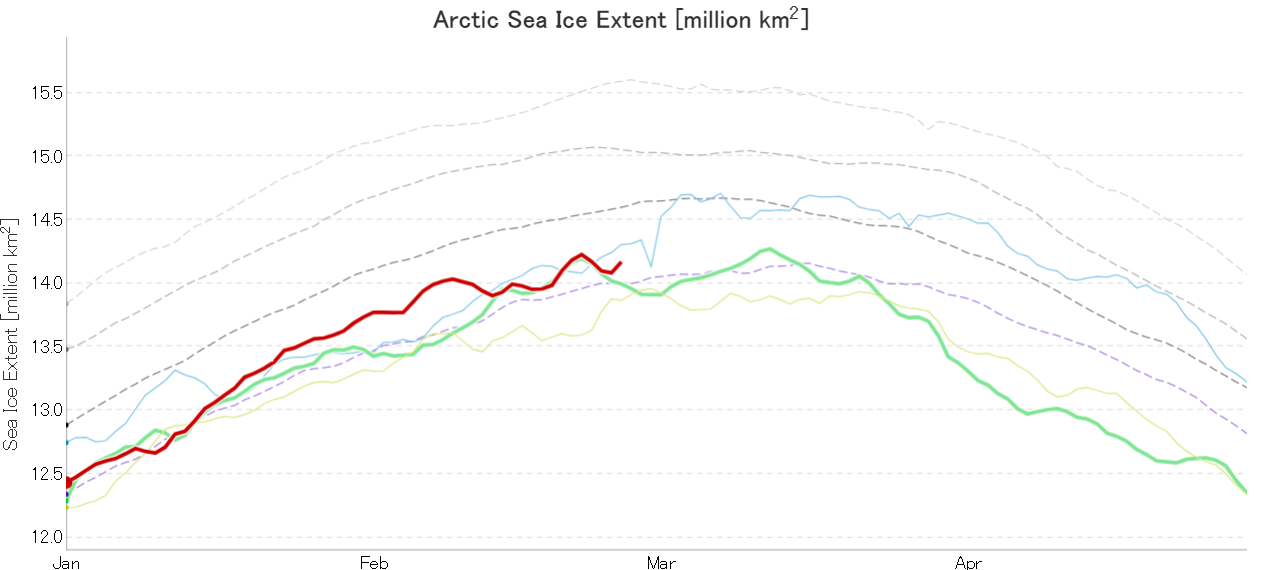
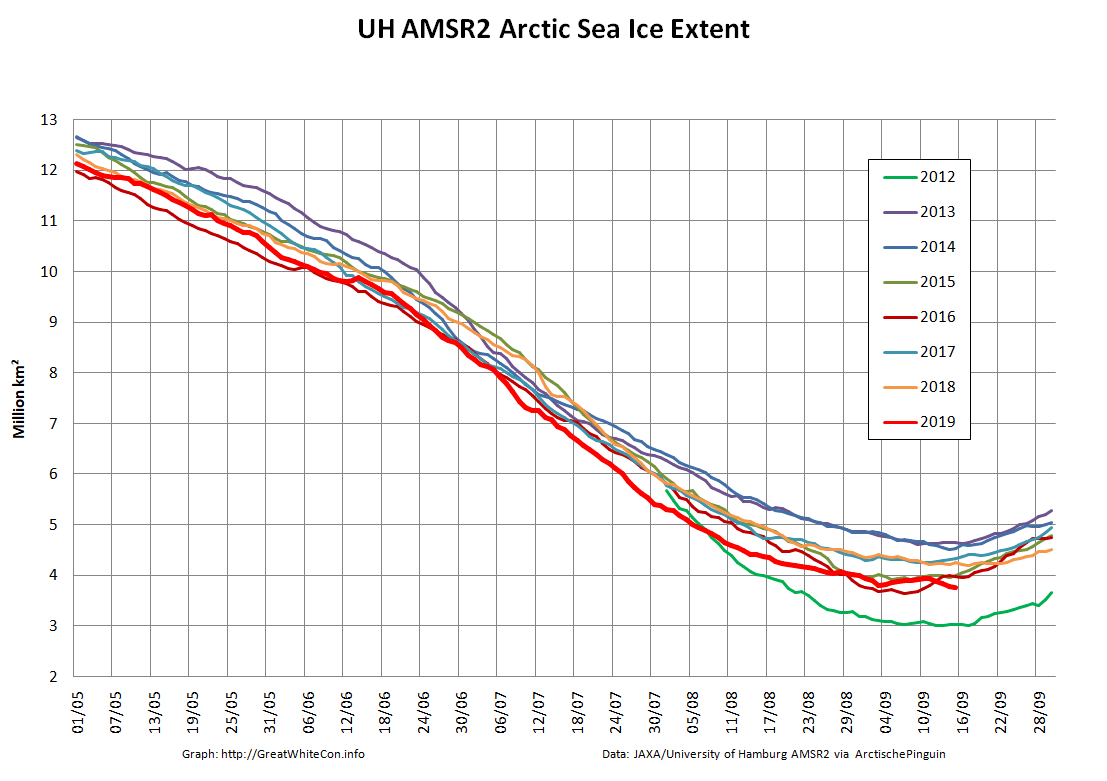
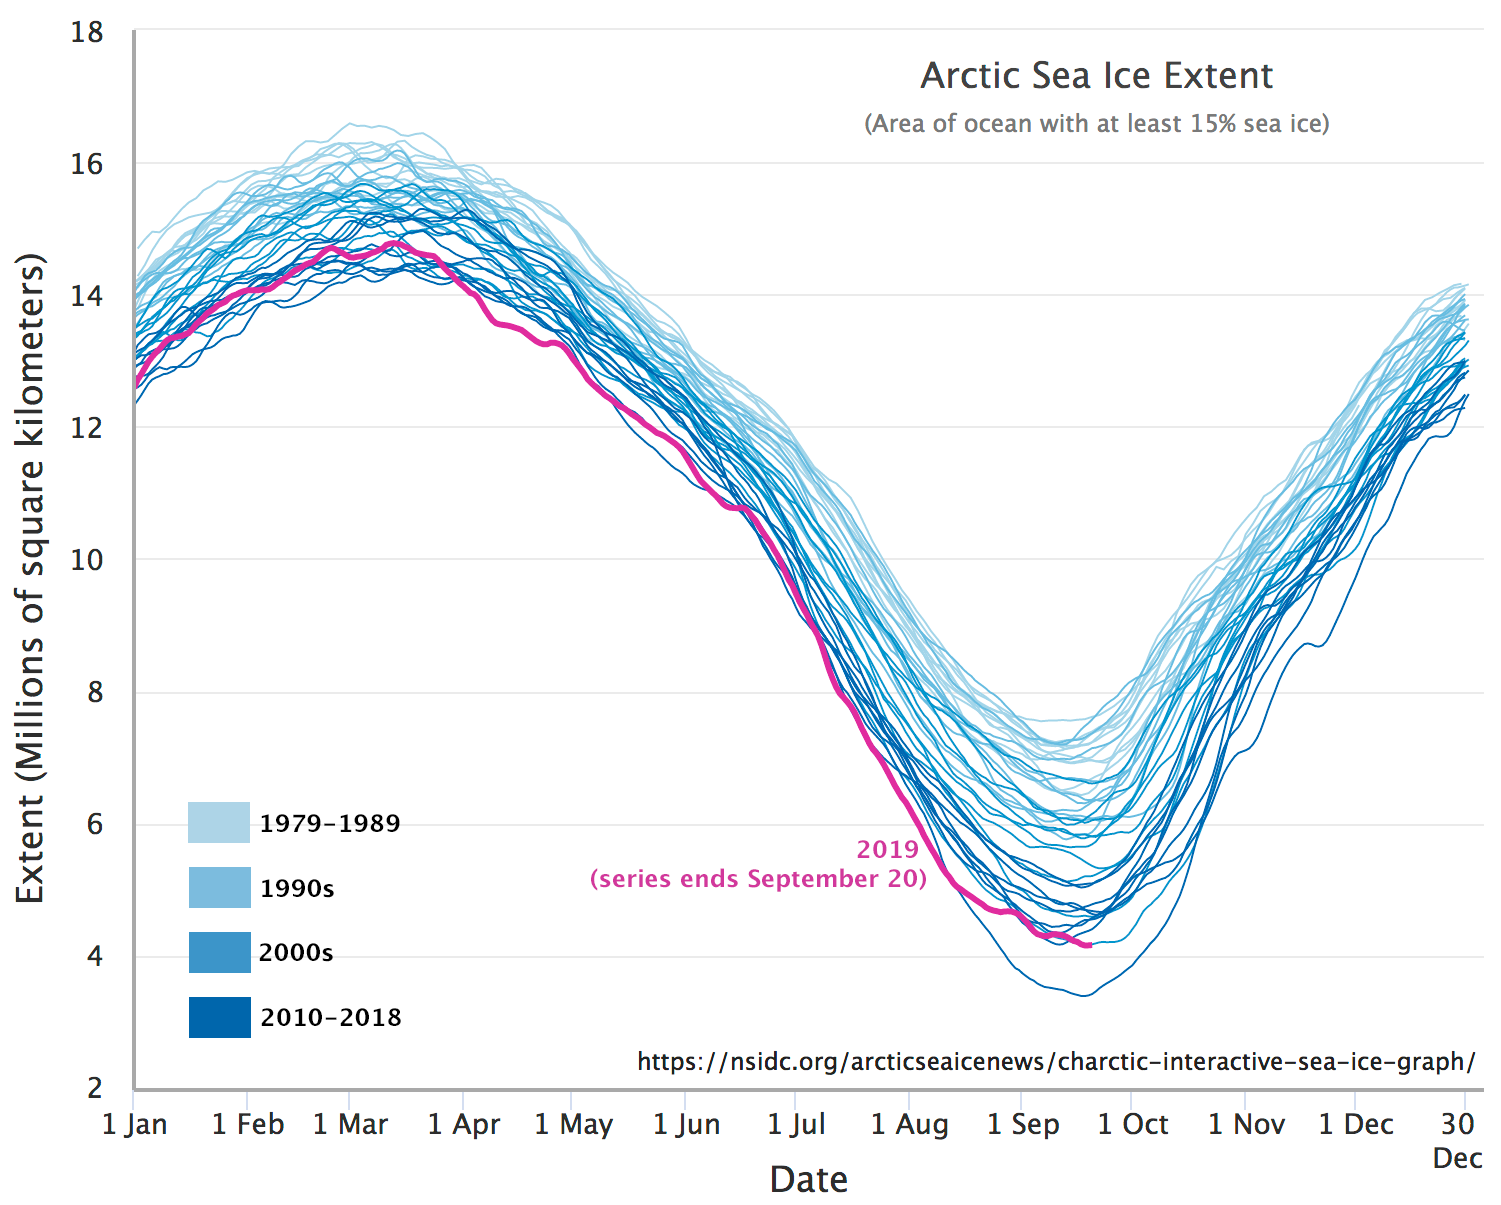
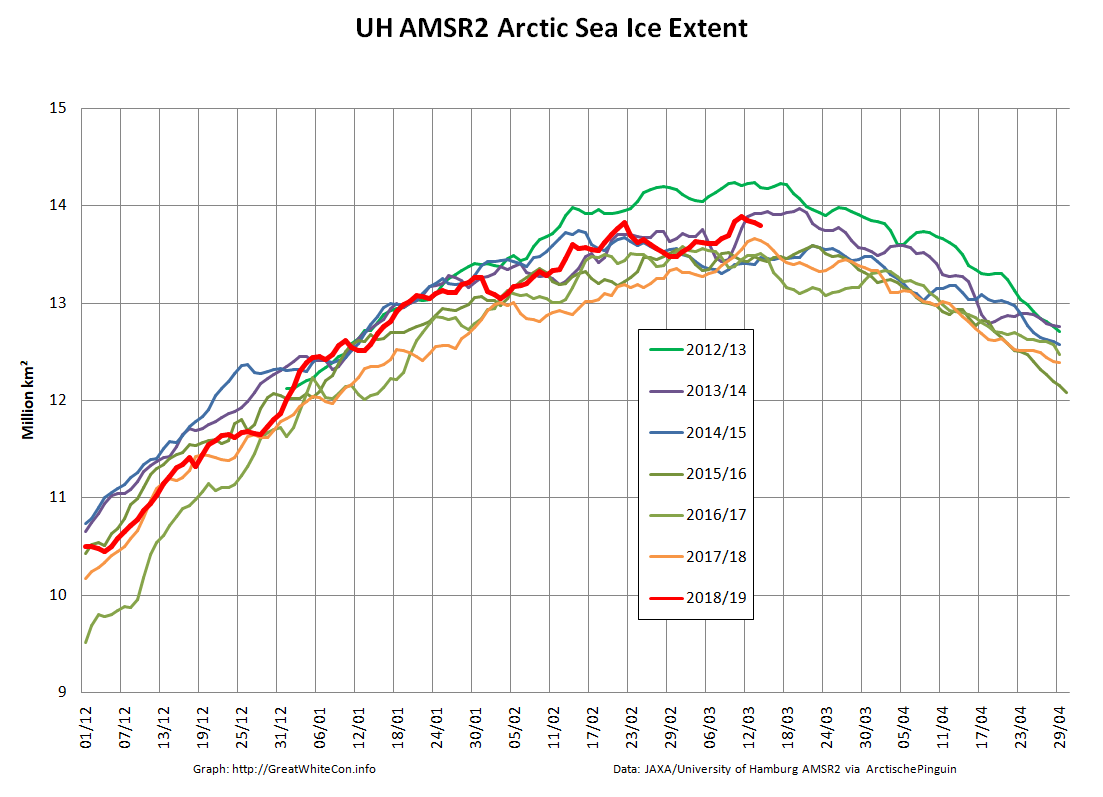
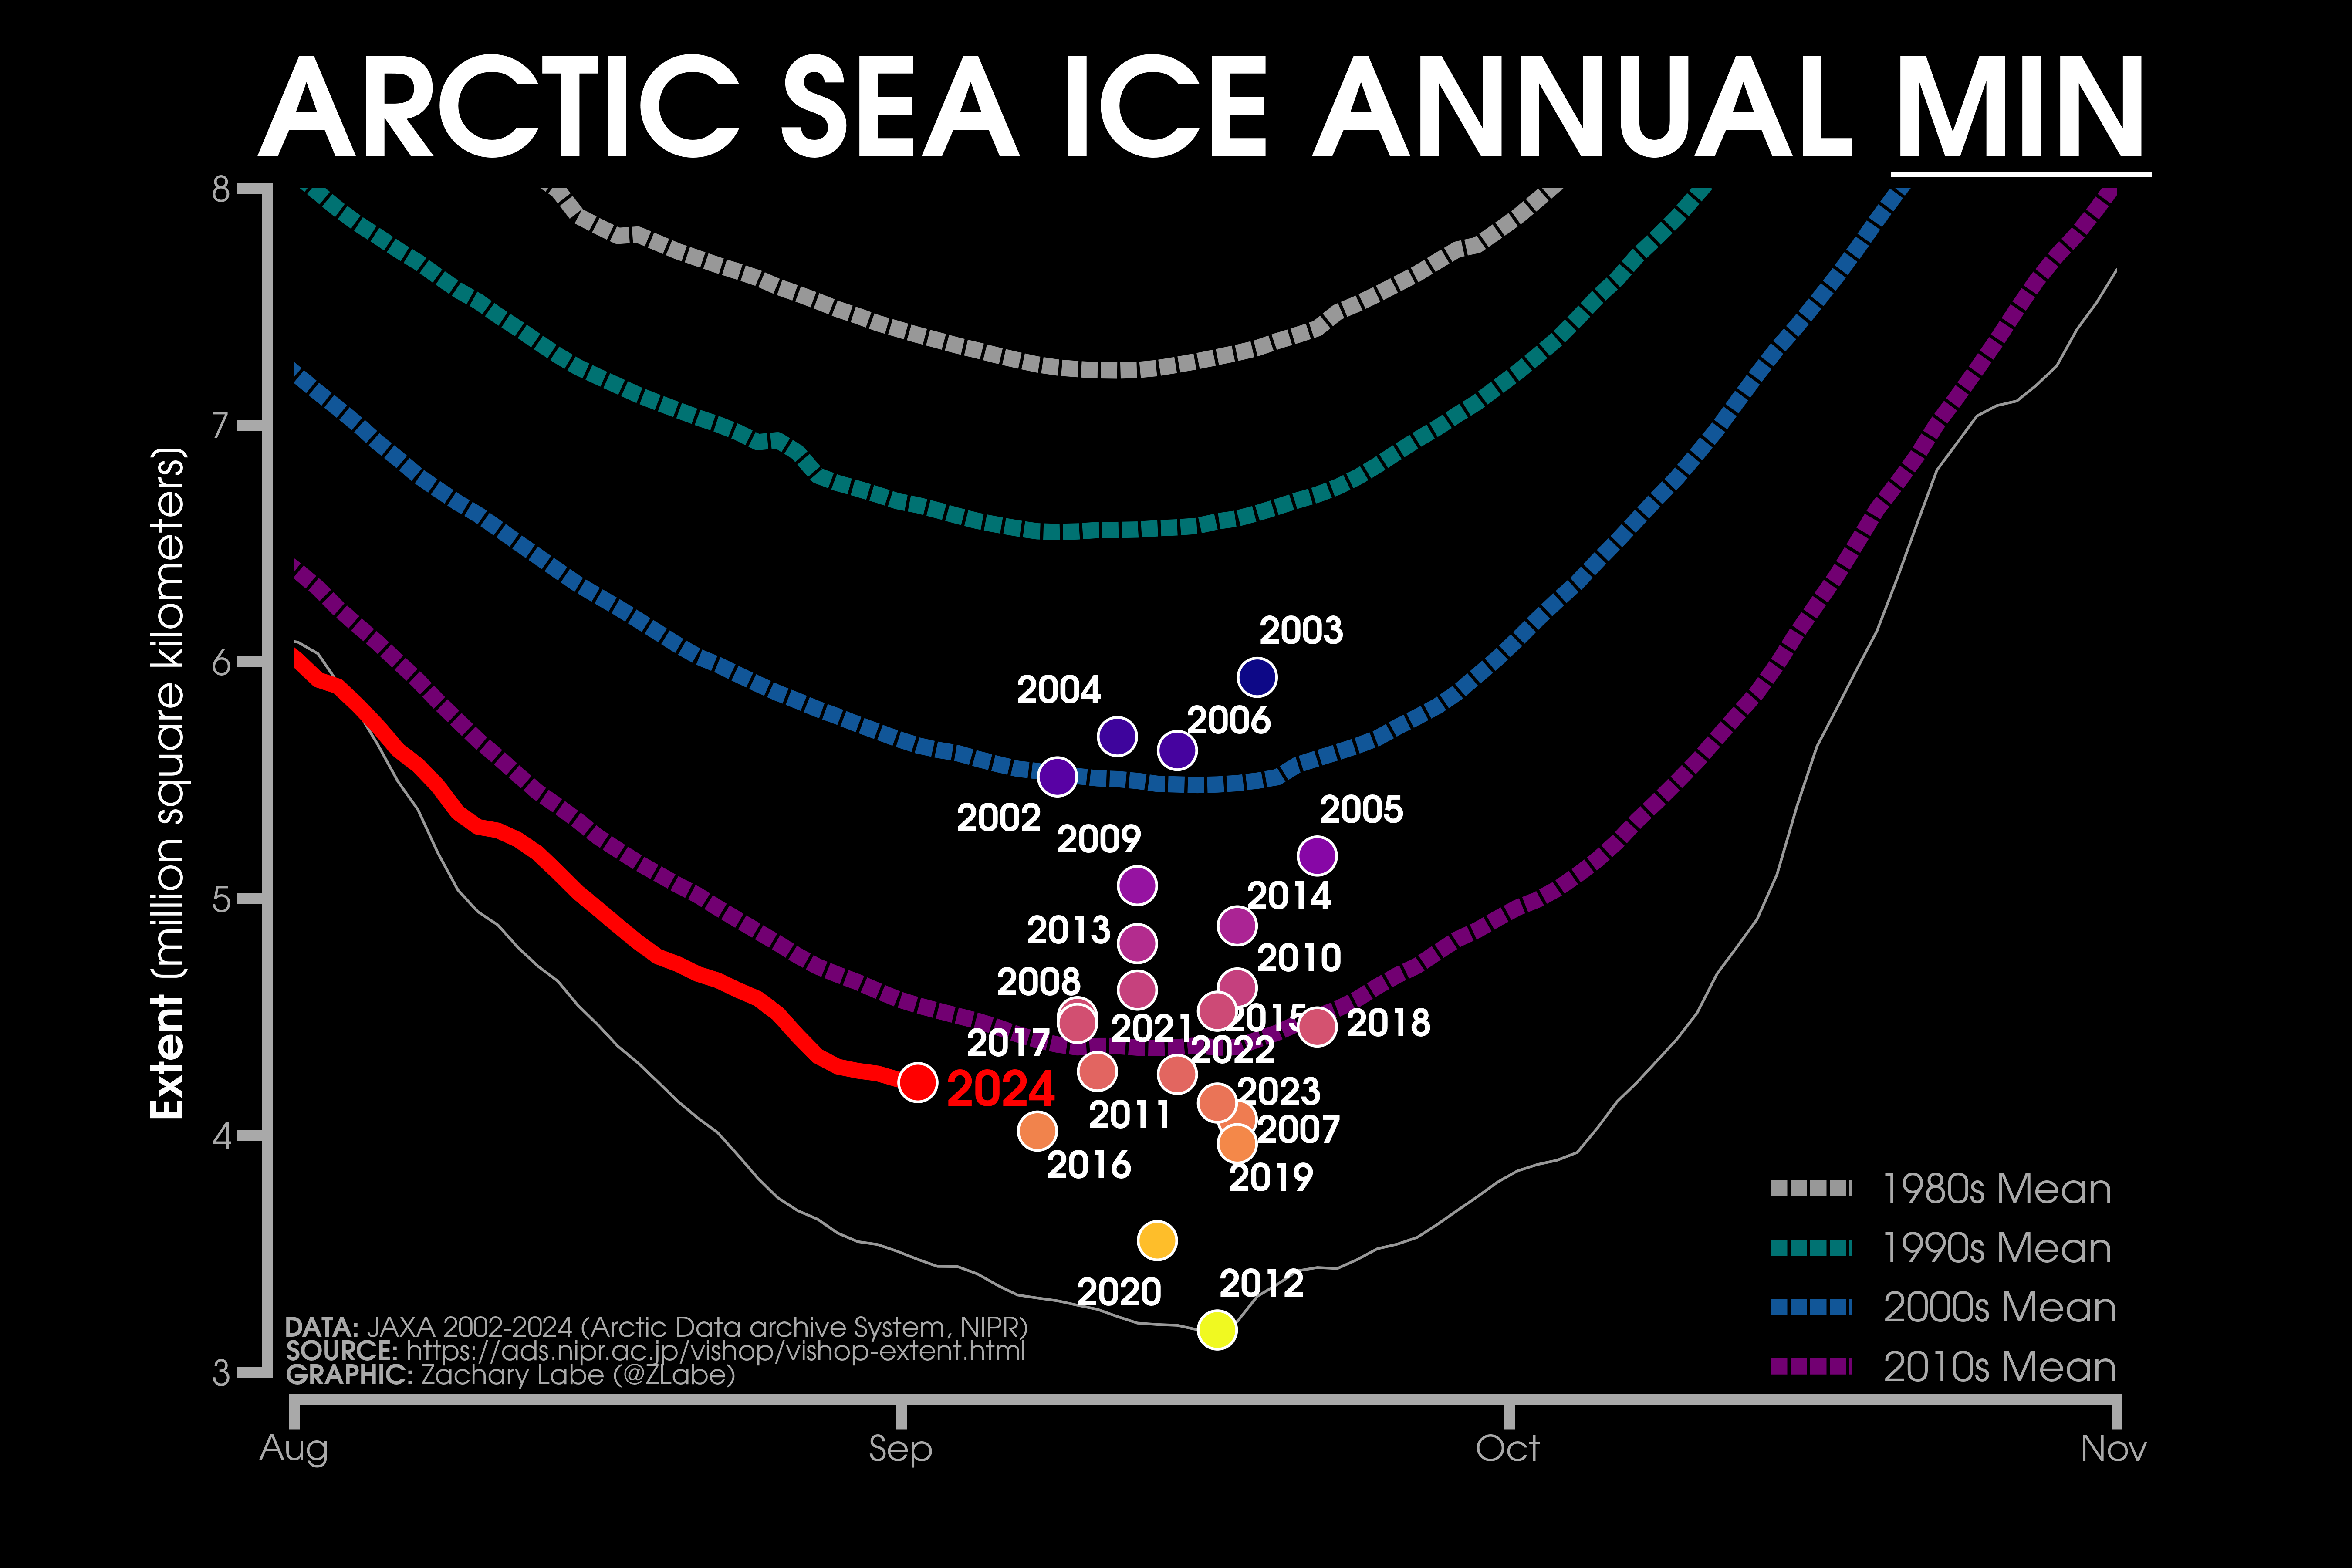
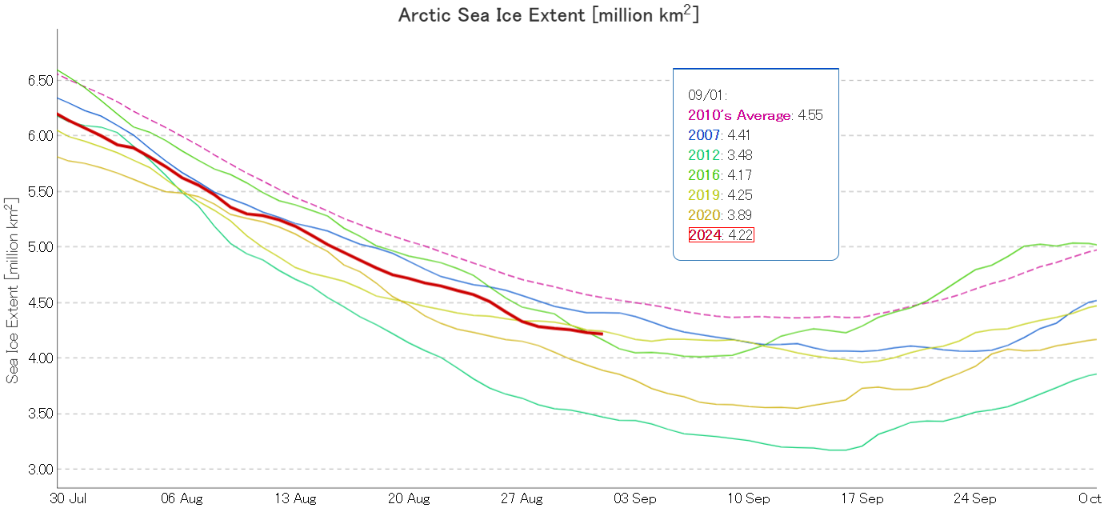
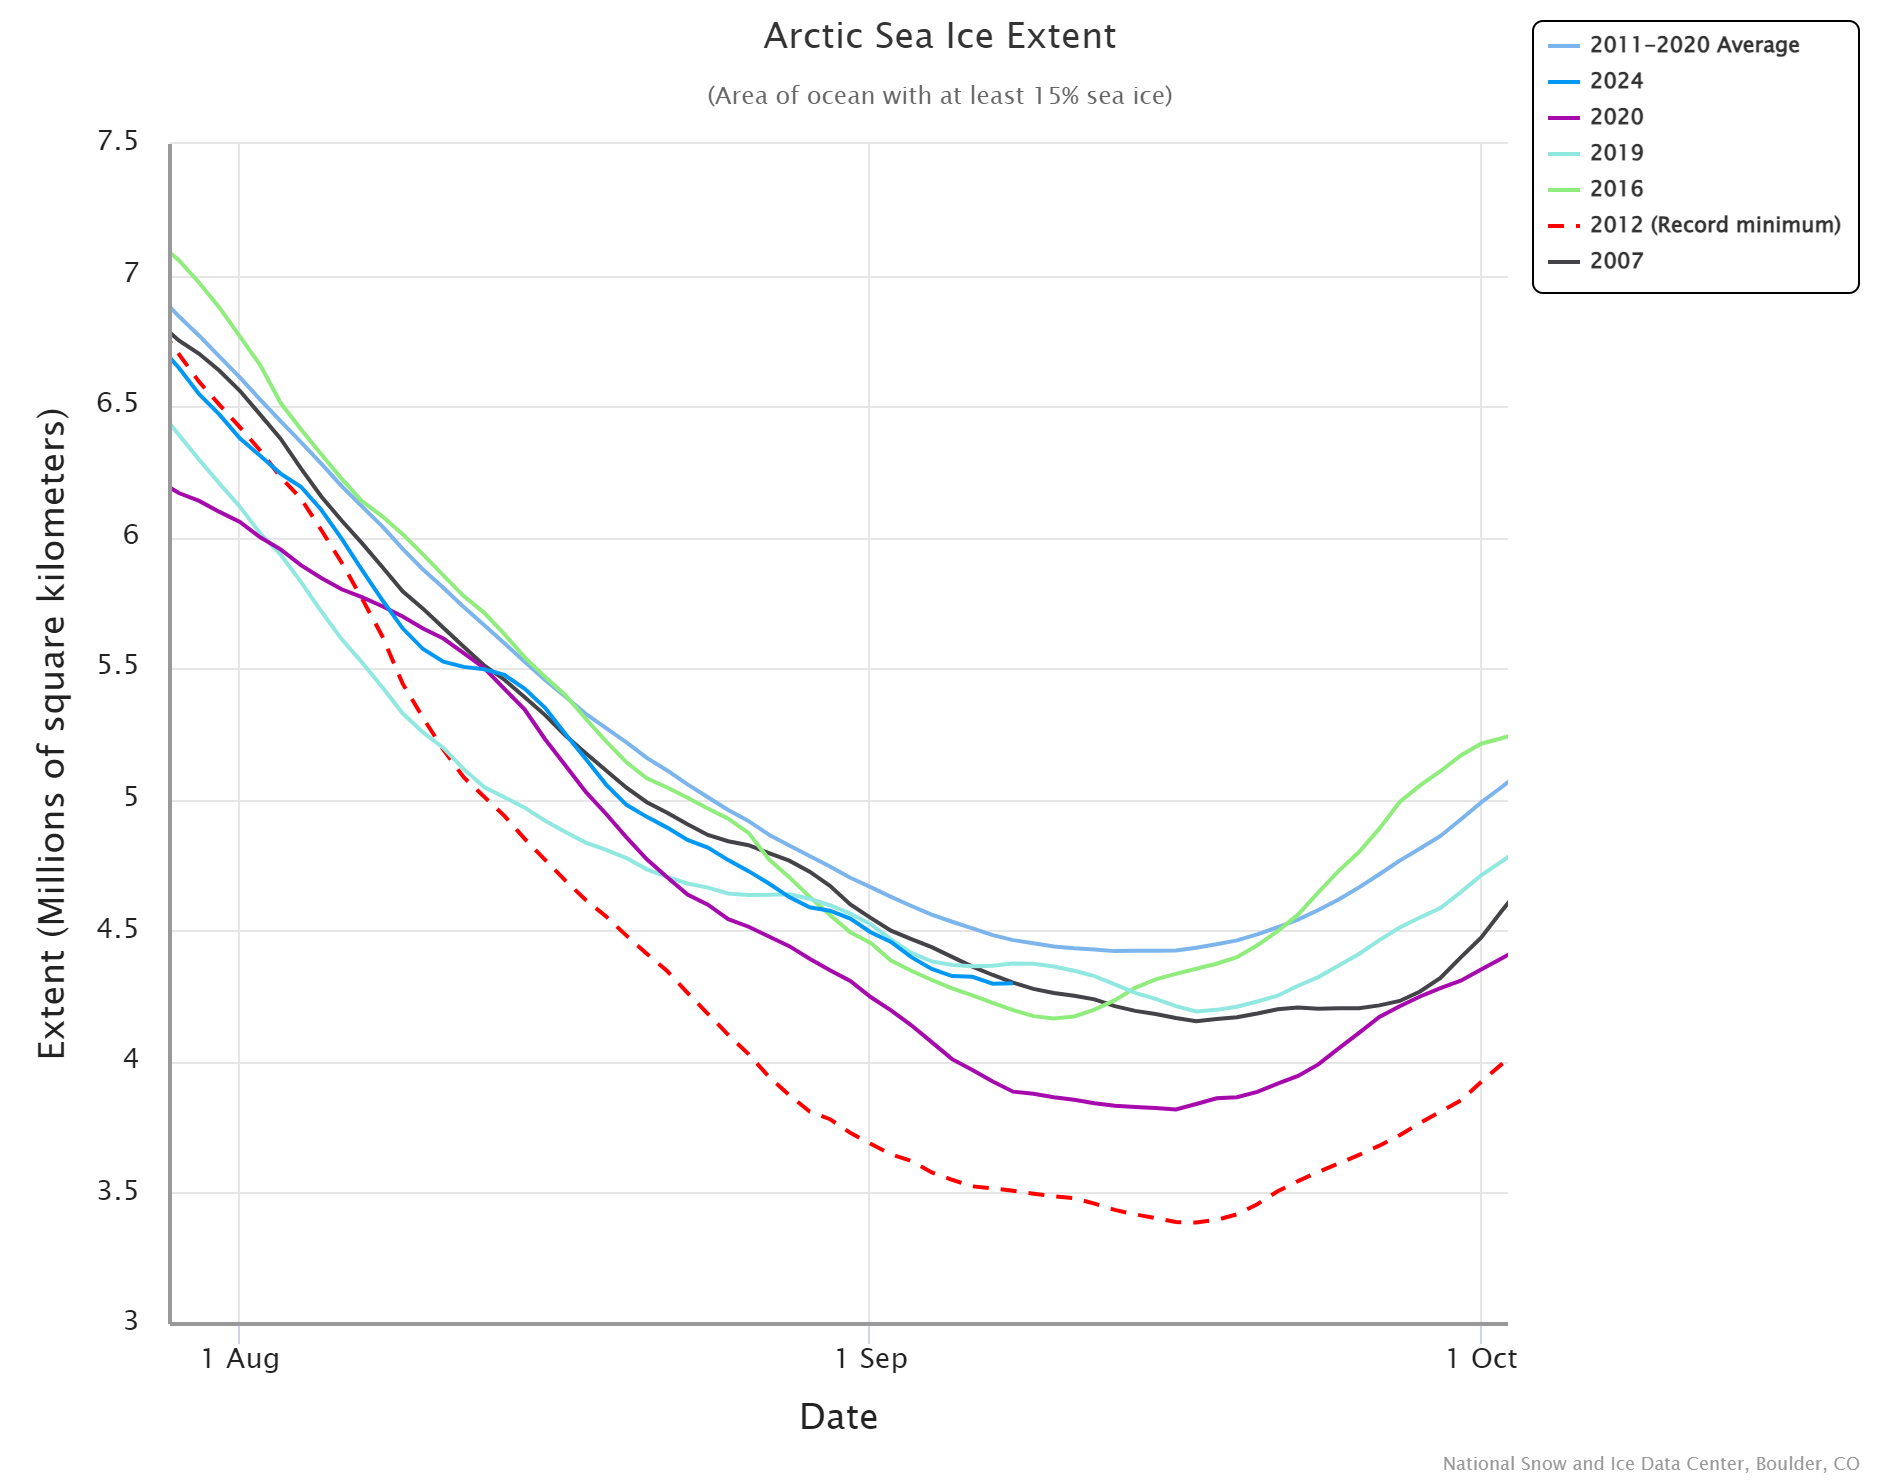
The 2024 Arctic sea ice minimum extent will almost certainly occur at some point over the next month. The exact date and level will vary from one extent metric to the next. Here’s a comparison of the current JAXA extent with previous minima, courtesy of Zack Labe:

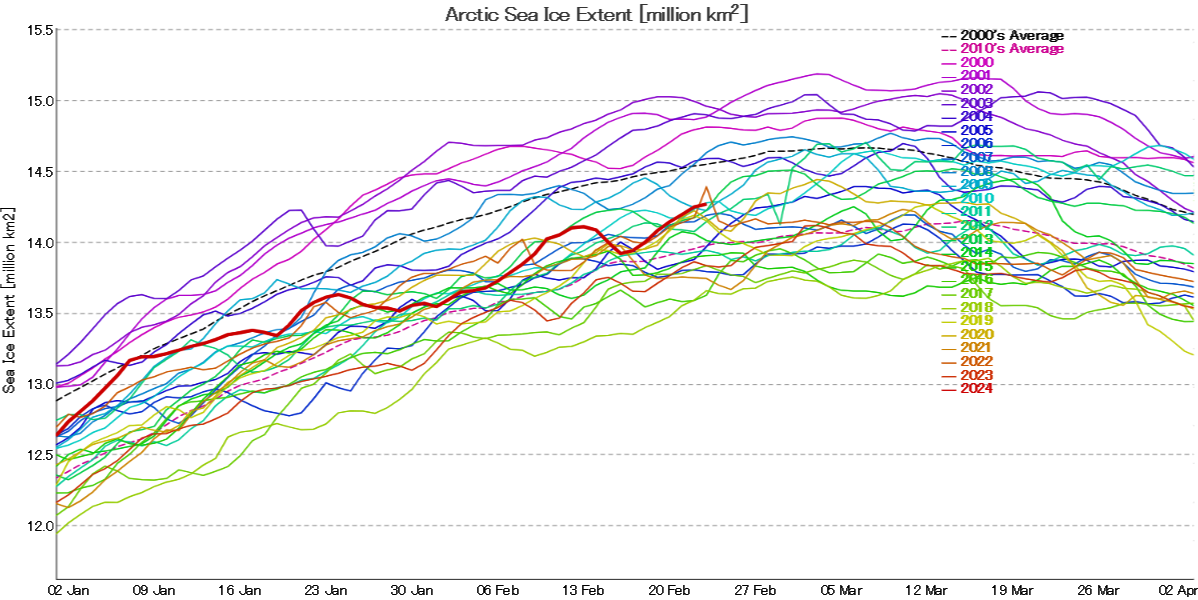
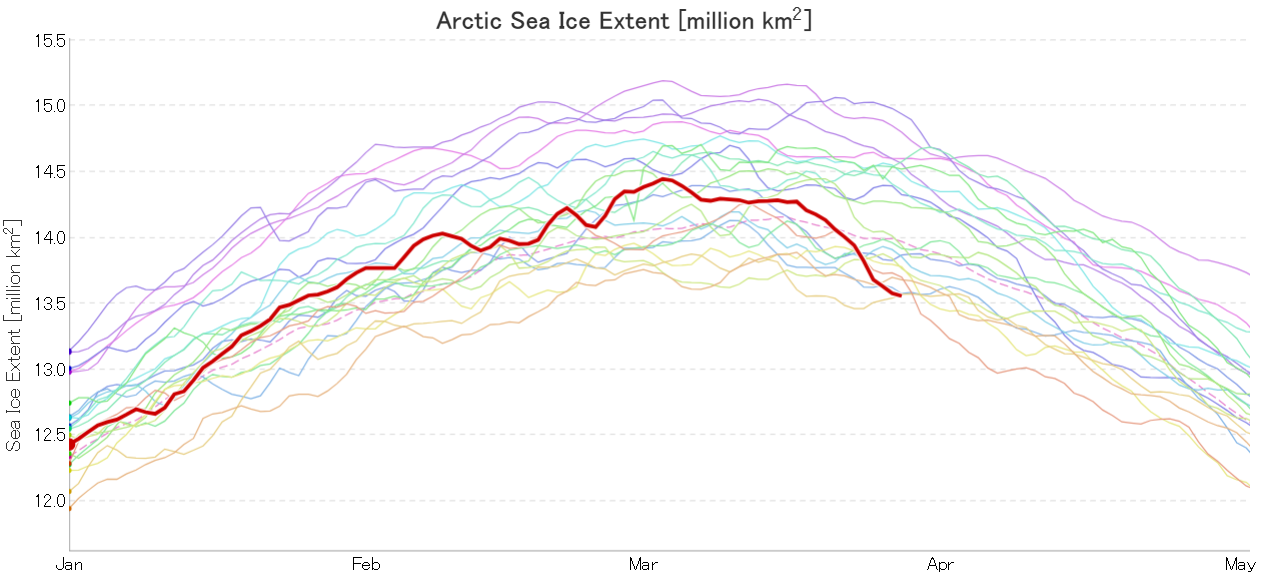
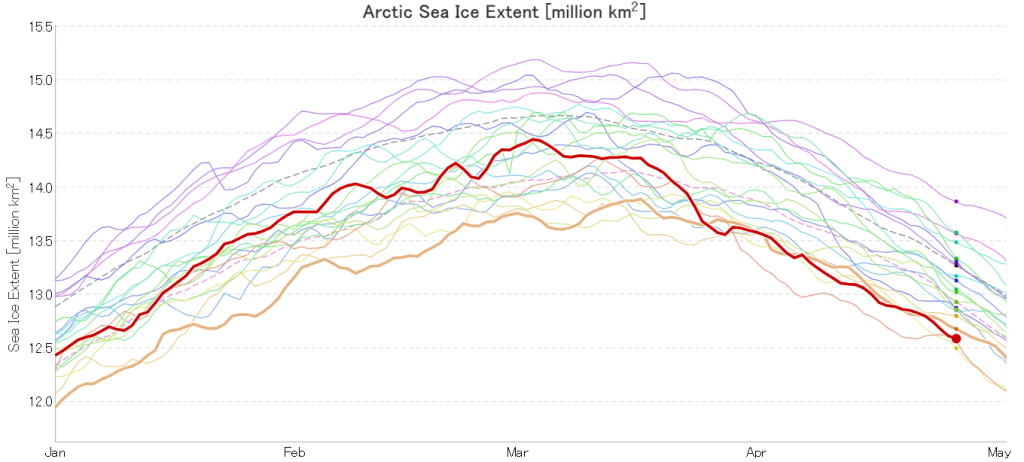
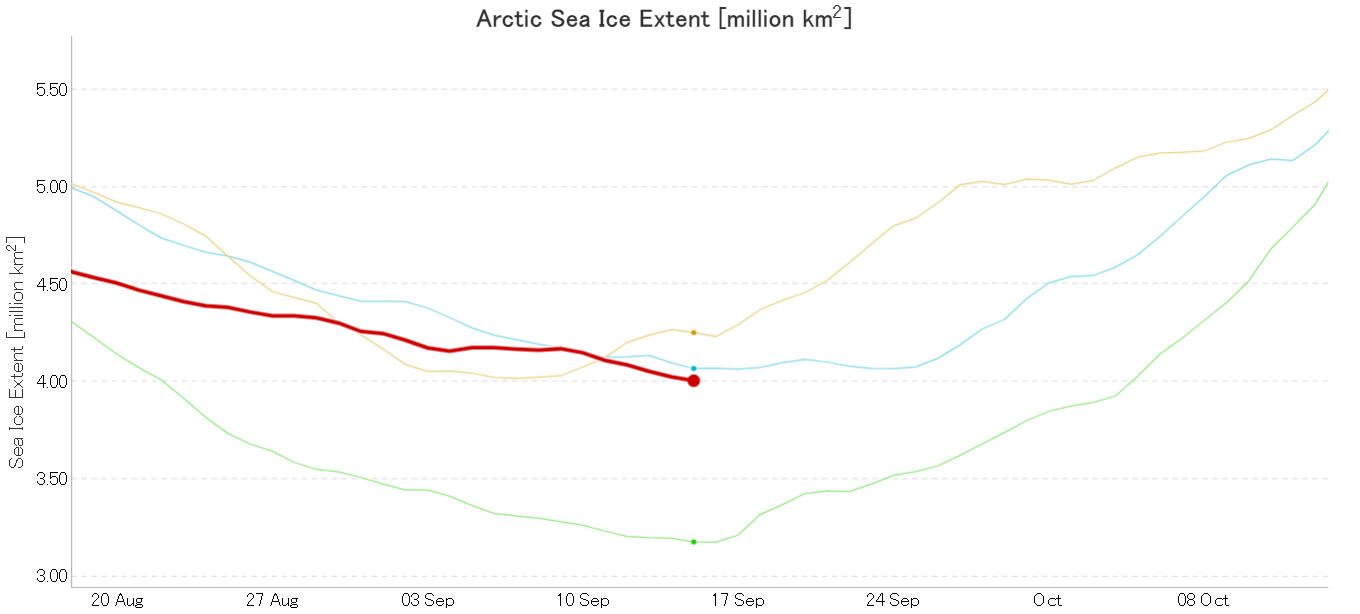
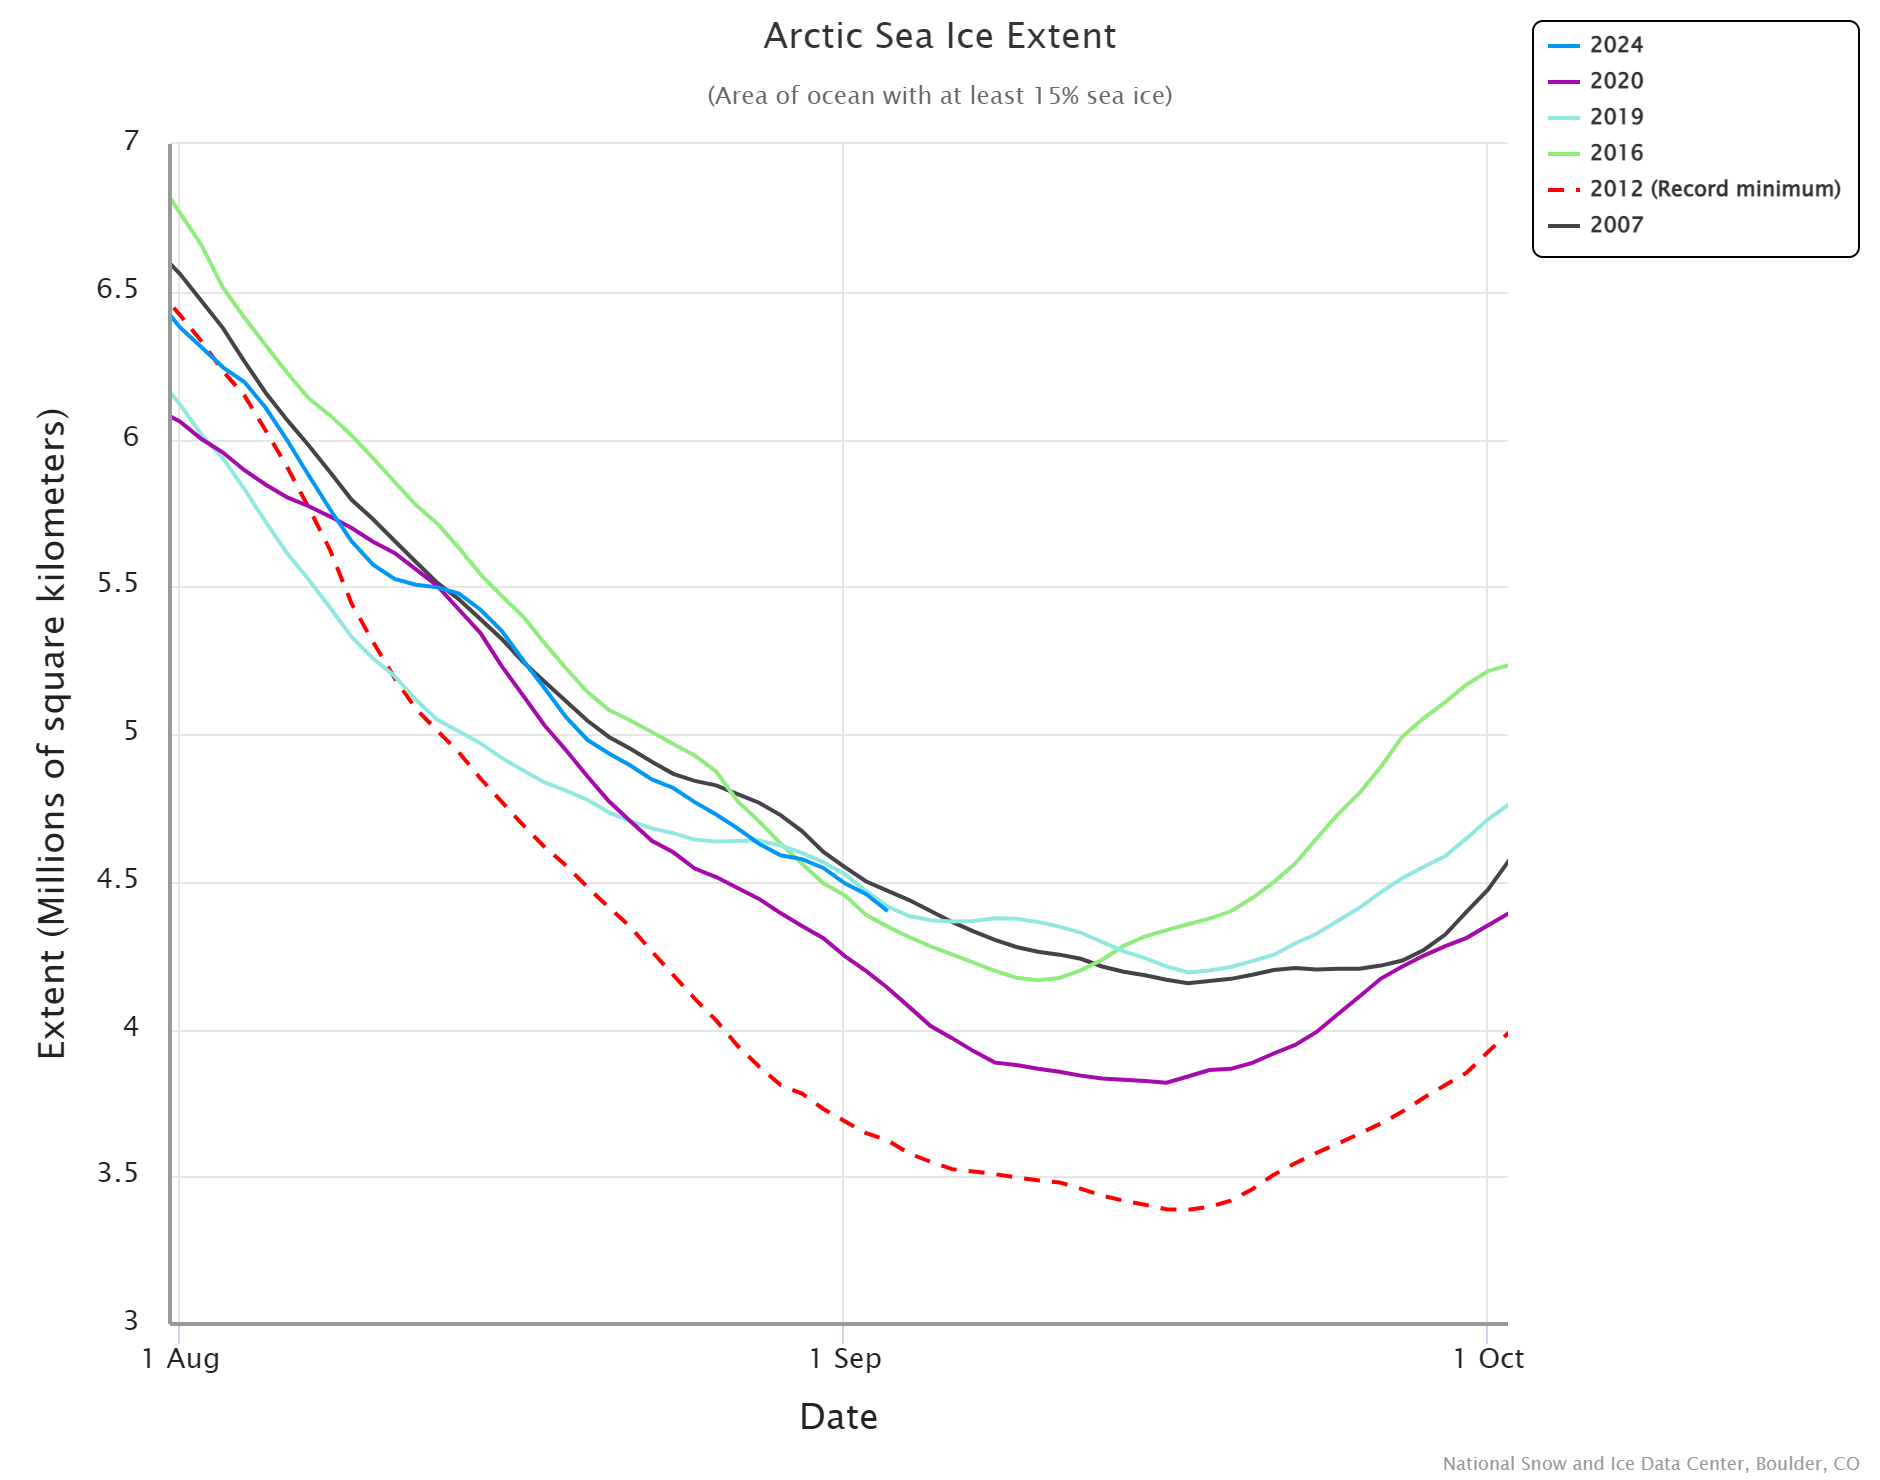
Here too is a more detailed look at 2024 extent compared with the 5 lowest annual minima in the JAXA record:

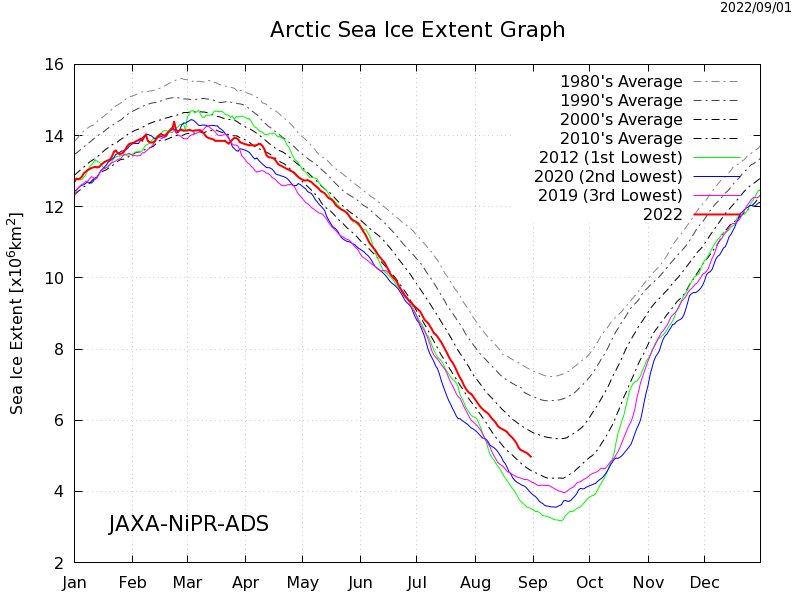
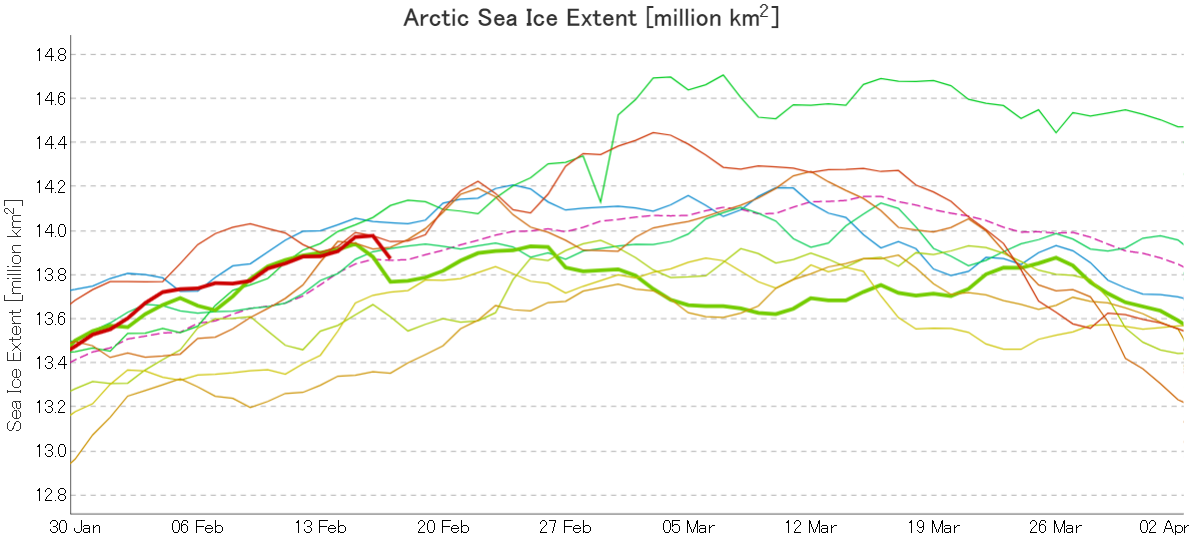
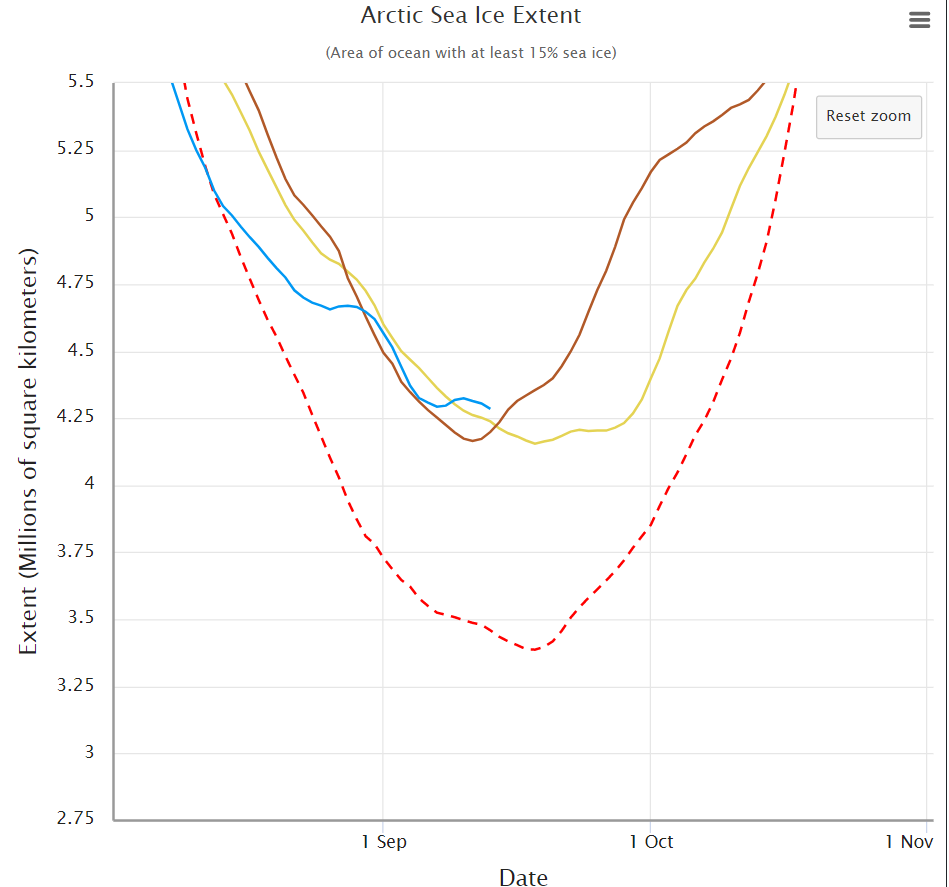
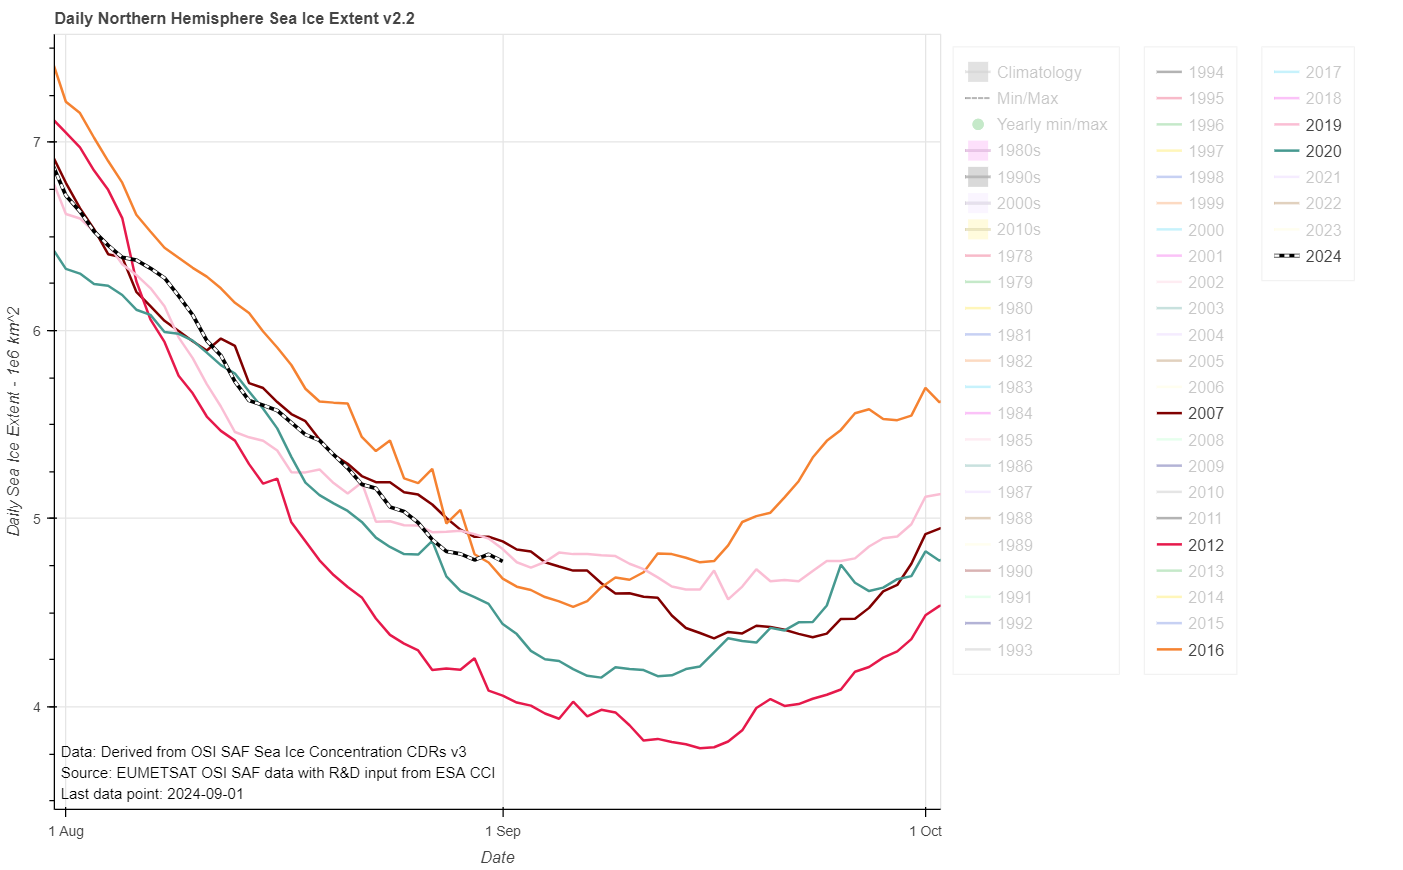
By way of comparison, here is the equivalent graph for the OSI SAF extent metric, which experienced an up tick yesterday but has now reached a new low for the year:

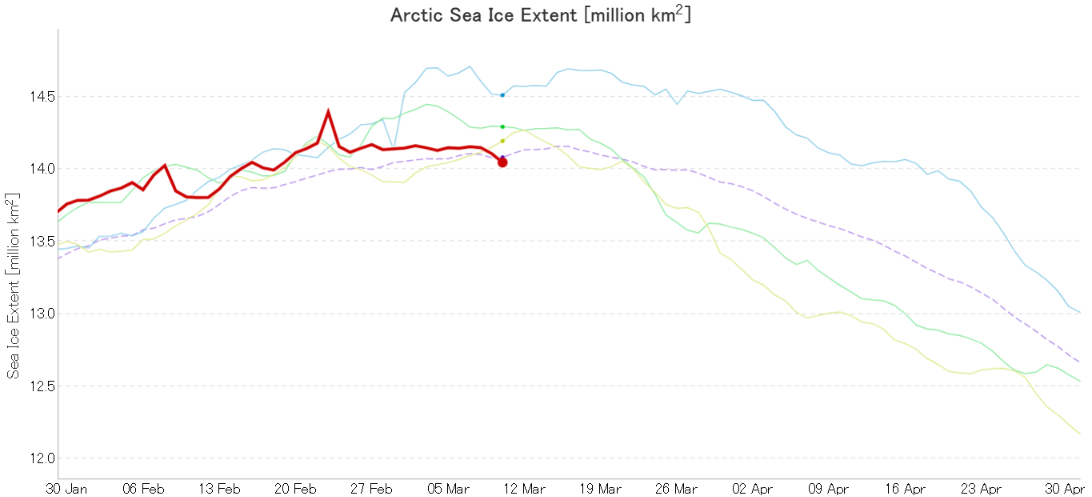
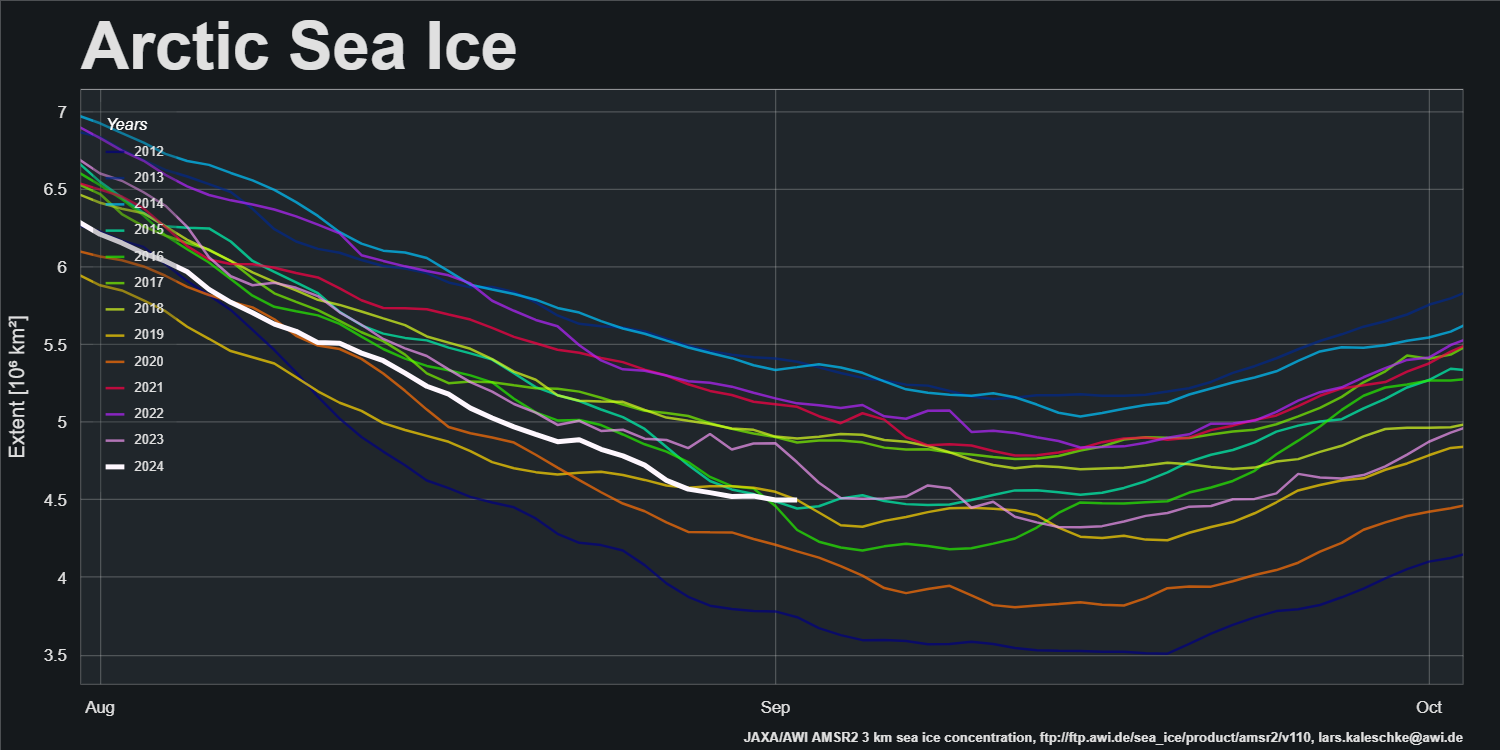
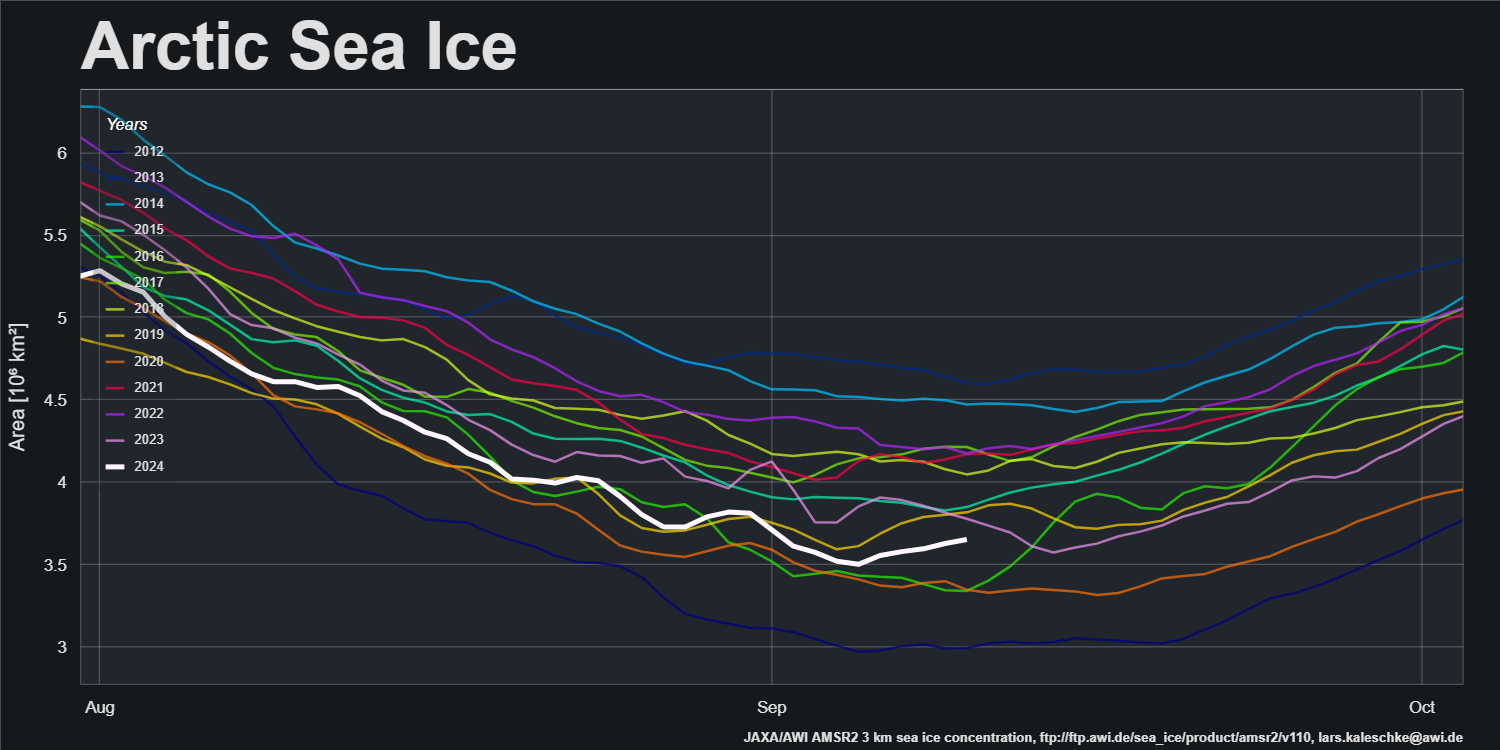
The Alfred Wegener Institute’s extent metric has flatlined over the last two days:

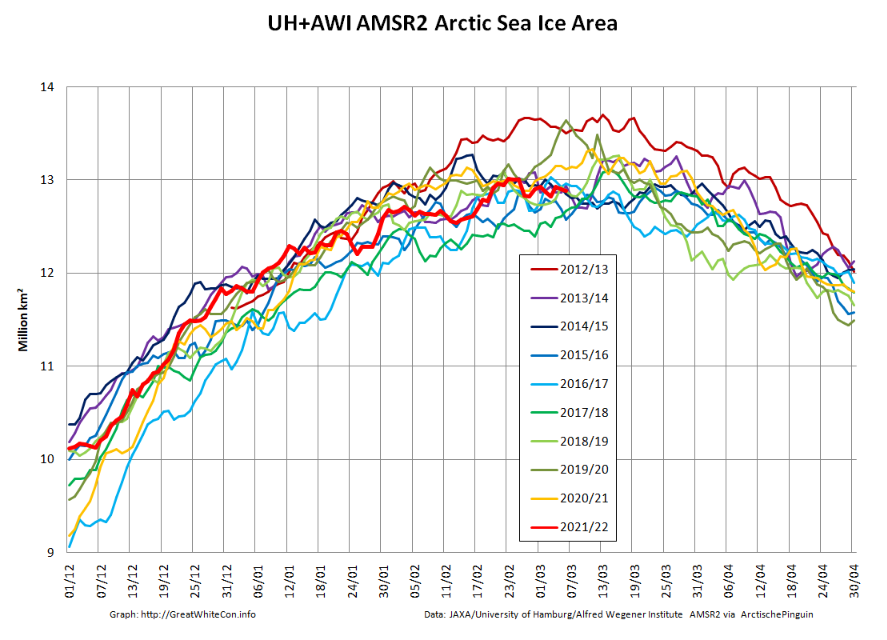
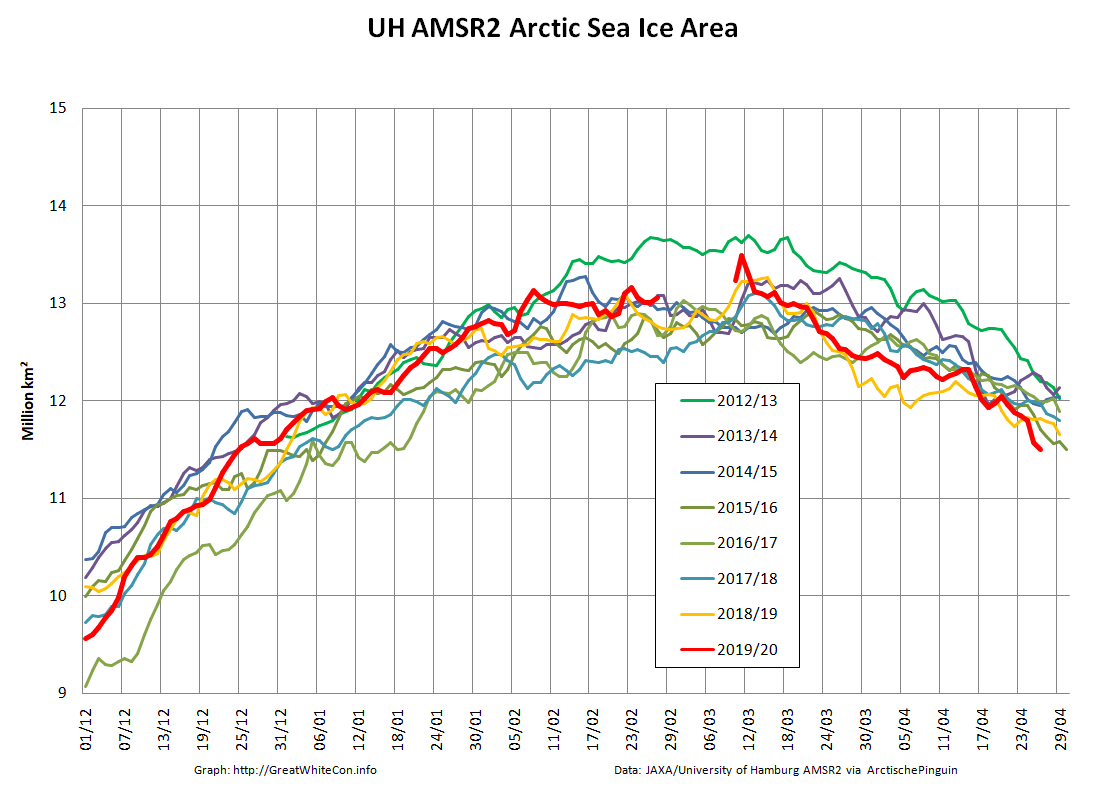
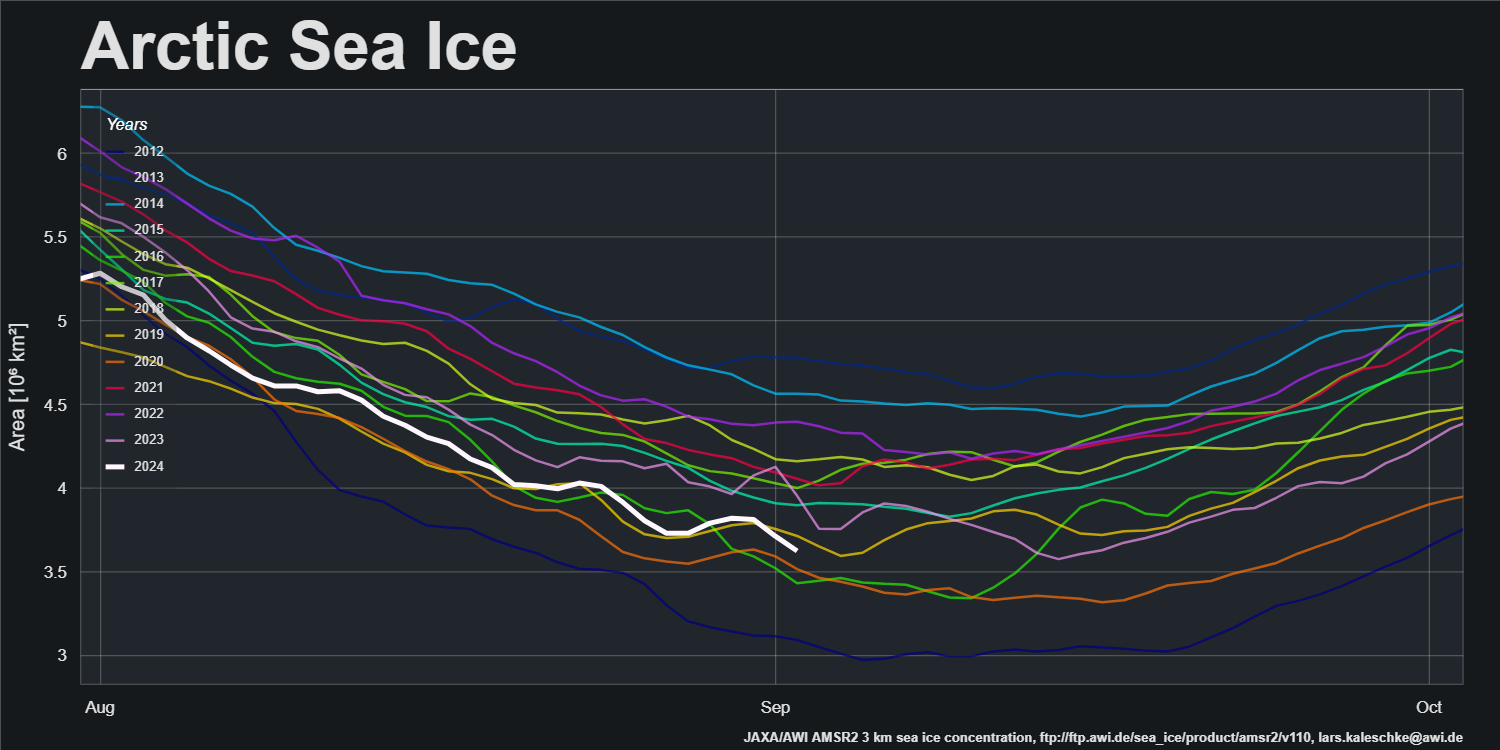
However AWI Arctic sea ice area is currently falling, which may well presage further significant falls in extent:

The NSIDC web site is currently “experiencing technical difficulties”, but hopefully we’ll be able to take a look at their extent graph in the very near future.
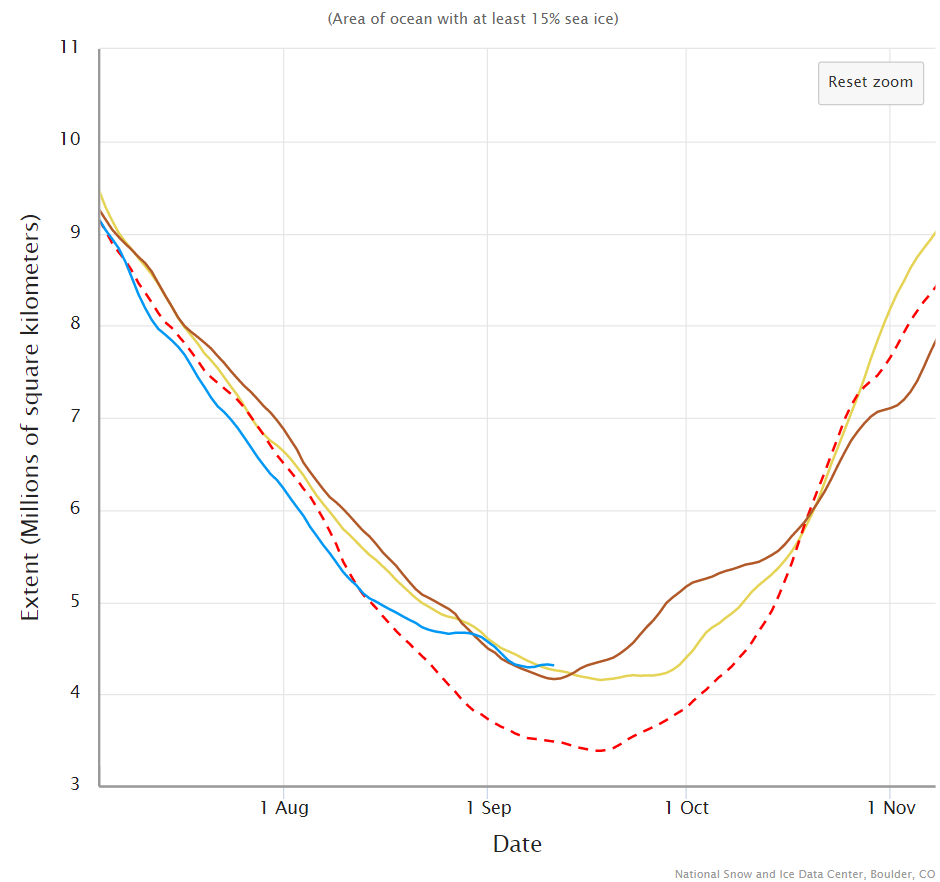
[Update – September 4th]

The NSIDC web site is back in action, and their 5 day averaged extent metric is currently still falling quickly:

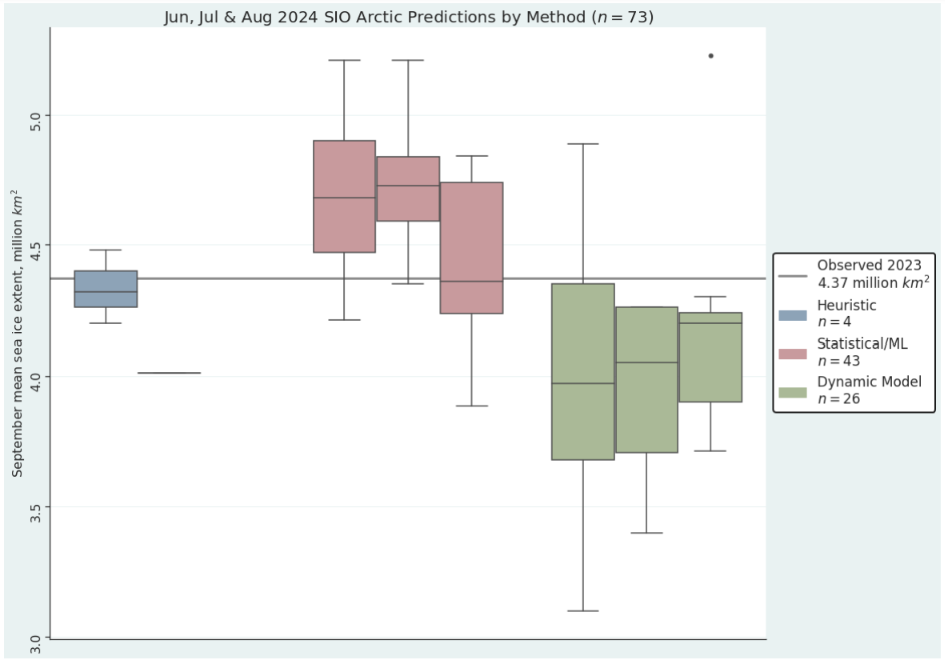
The ARCUS Sea Ice Prediction Network August report has been published. Note that the predicted numbers are for the September monthly average extent rather than the daily minimum:

For the August Outlook, we received 24 contributions of September pan-Arctic sea-ice extent forecasts…

The August 2024 median forecasted value for pan-Arctic September sea-ice extent is 4.27 million square kilometers with an interquartile range of 4.11 to 4.54 million square kilometers. This is about 200,000 square kilometers lower than the June median and about 250,000 square kilometers lower than the July median, which reflects the faster than average ice loss during July.

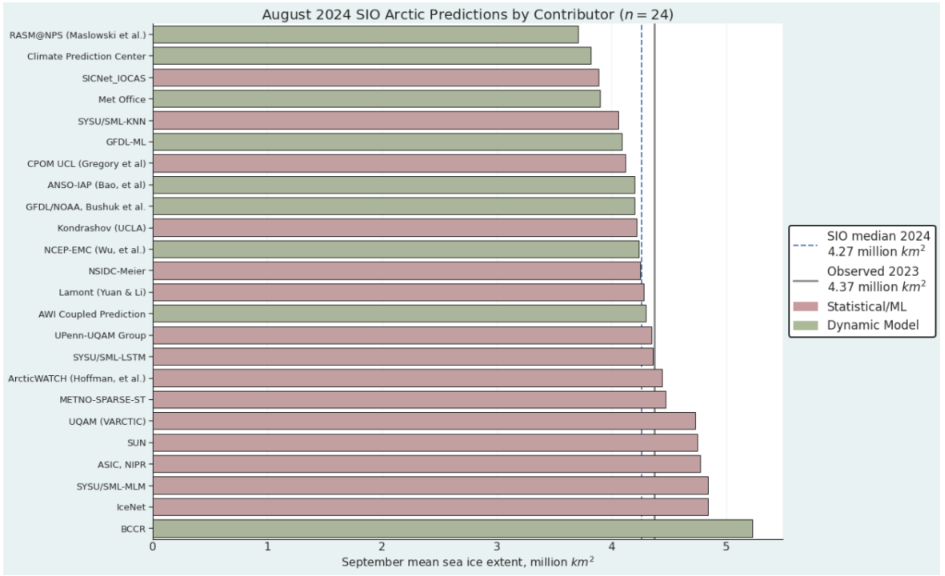
The lowest sea-ice extent forecast is 3.71 million square kilometers and the highest sea-ice extent forecast is 5.23 million square kilometers. These extremes are actually higher, particularly on the low end, than the estimates from July.

[Update – September 9th]

There’s been the tiniest of upticks in the NSIDC 5 day extent metric. 1 thousand km² to be precise. However, the others are still slowly declining:

[Update – September 10th]

NSIDC extent has posted a new low for the year, and JAXA extent is still declining. However there has been a slightly more substantial uptick in the OSI SAF metric:

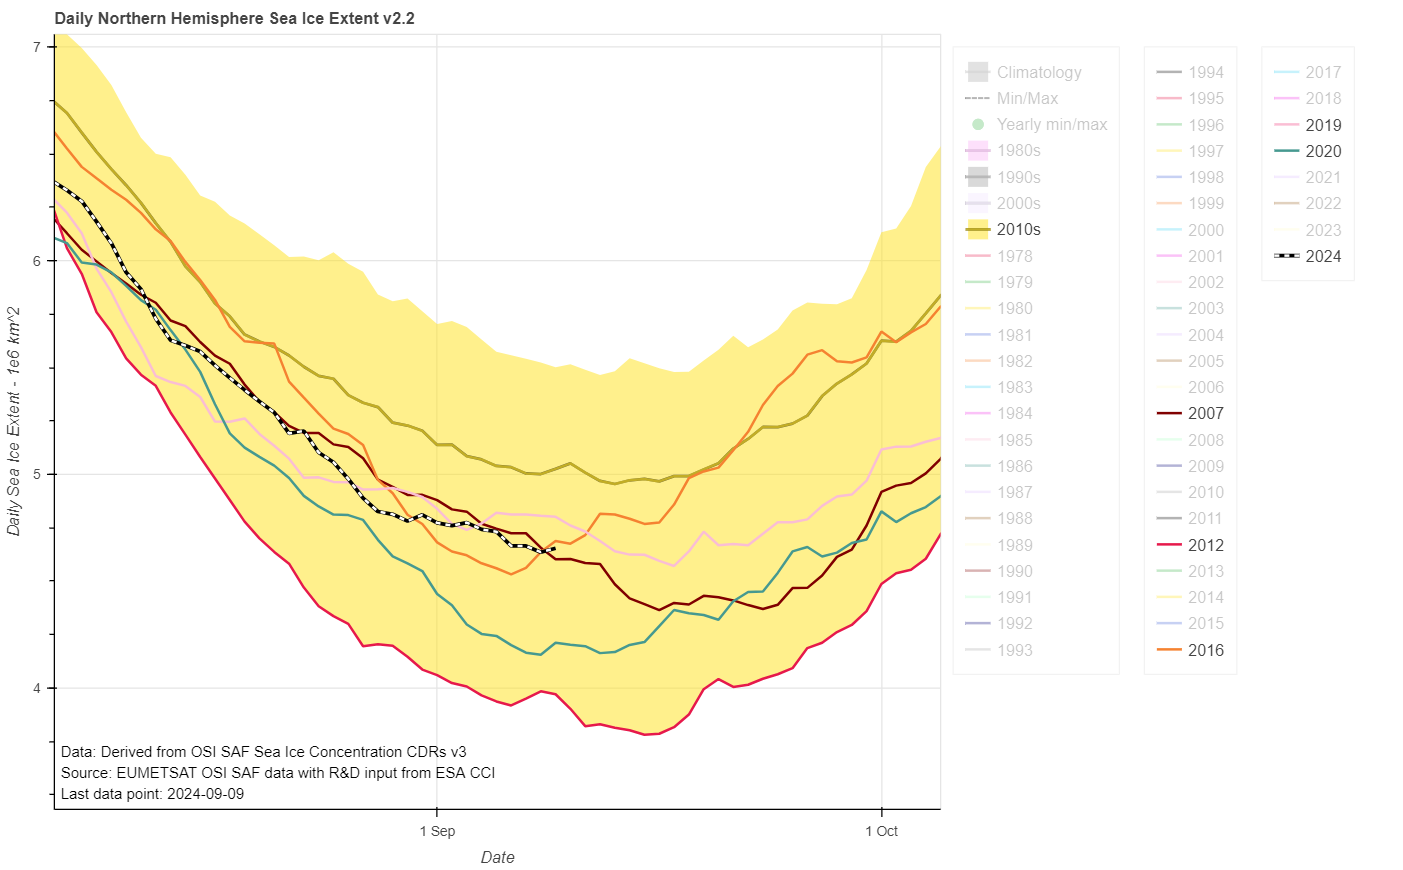
The current minimum is 4.64 million km² on September 8th.

AWI sea ice area has posted a convincing looking minimum on September 4th, which suggests that the central refreeze is already well under way:

[Update – September 17th]

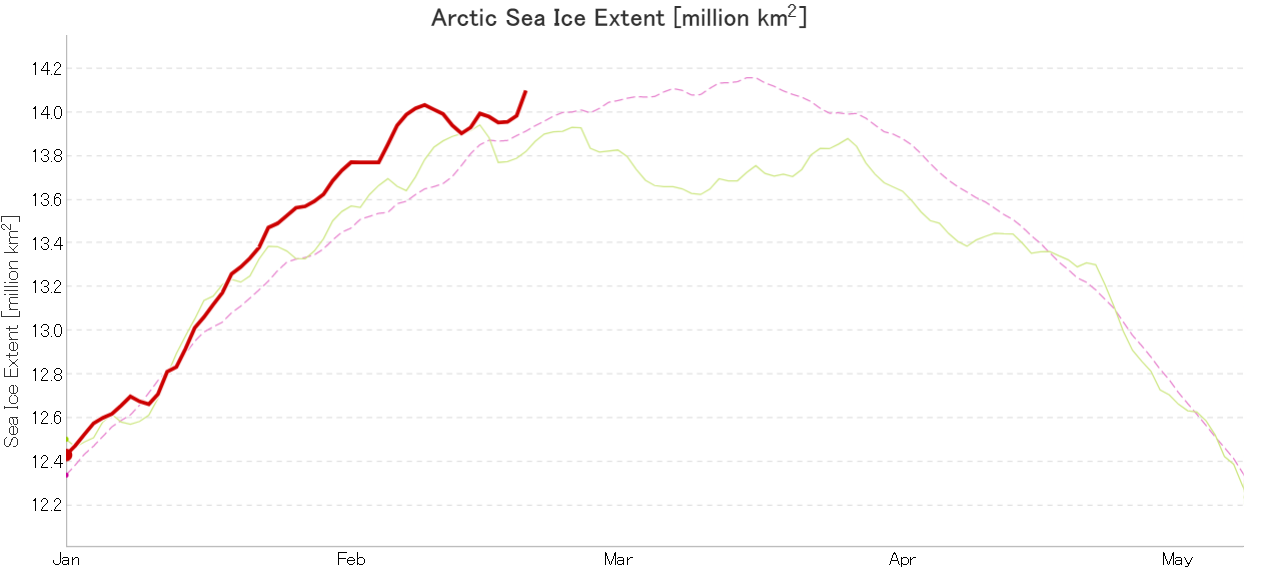
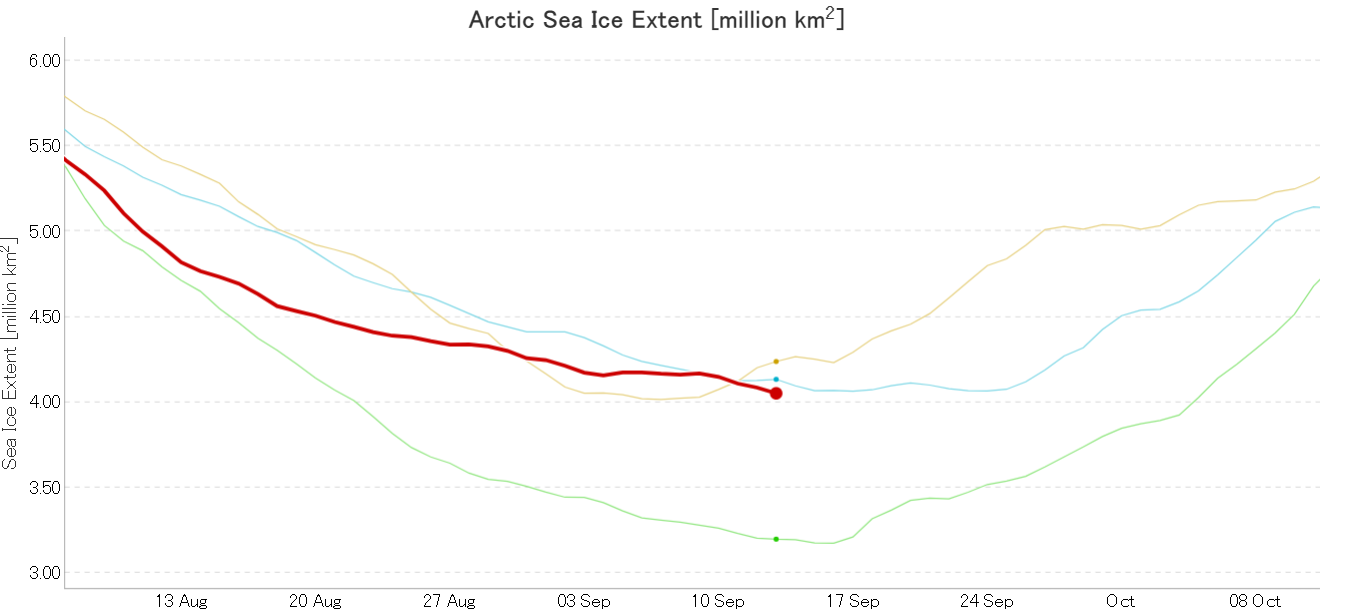
JAXA/ViSHOP/ADS extent has risen significantly over the last two days:

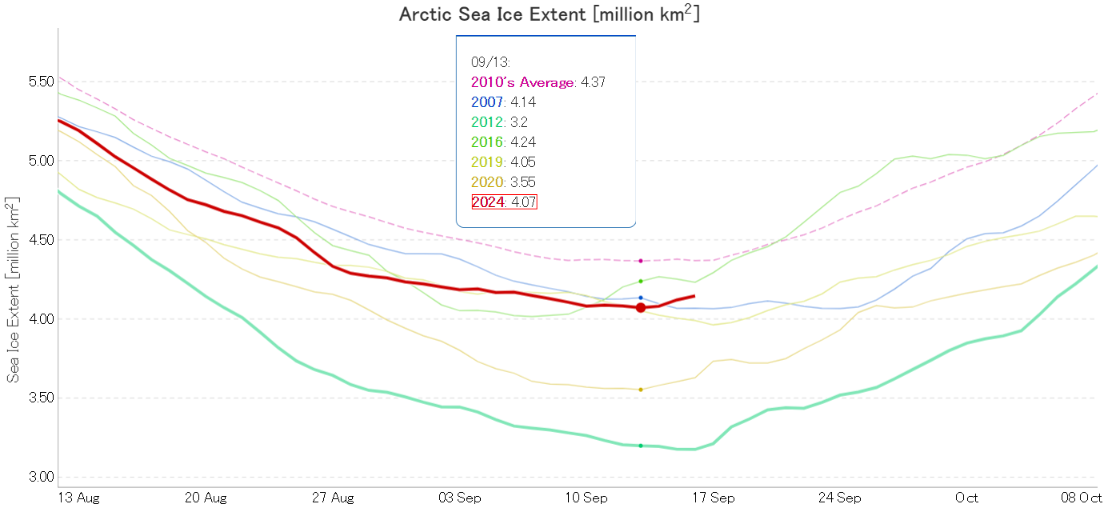
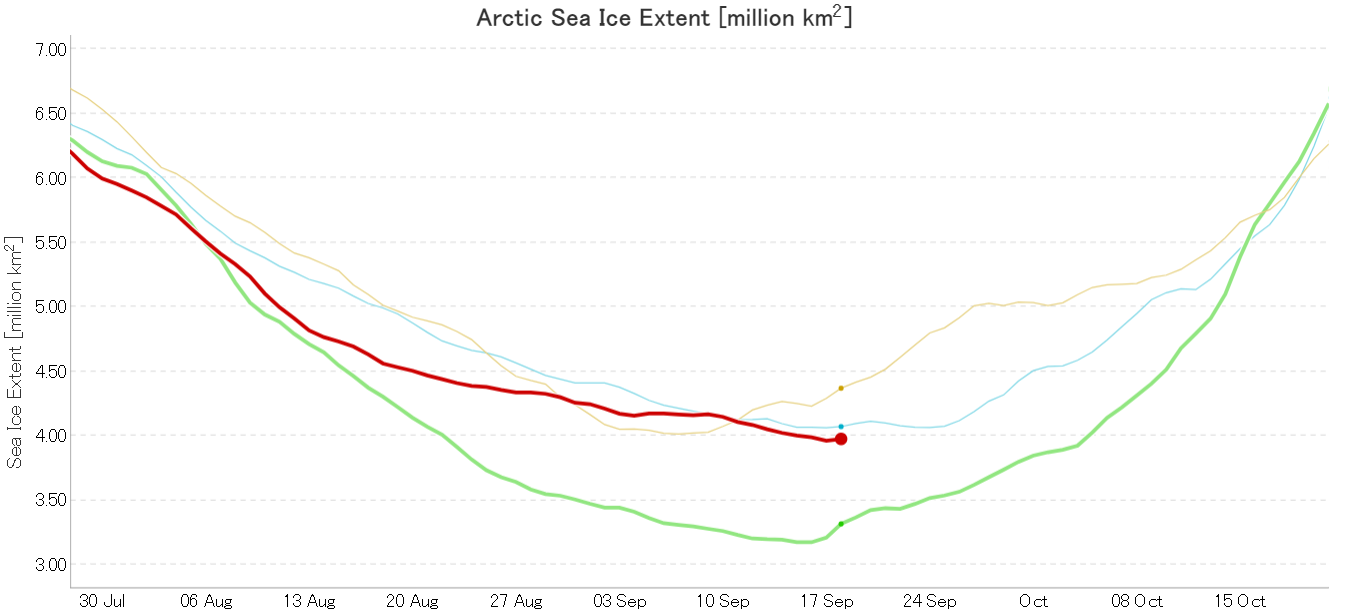
It now looks highly likely that the 2024 minimum will prove to be 4.07 million km² on September 13th. That is 4th lowest for the date, but equal 5th lowest minimum in the JAXA record.

A closer look at some of the other extent metrics will have to wait until this problem is solved:

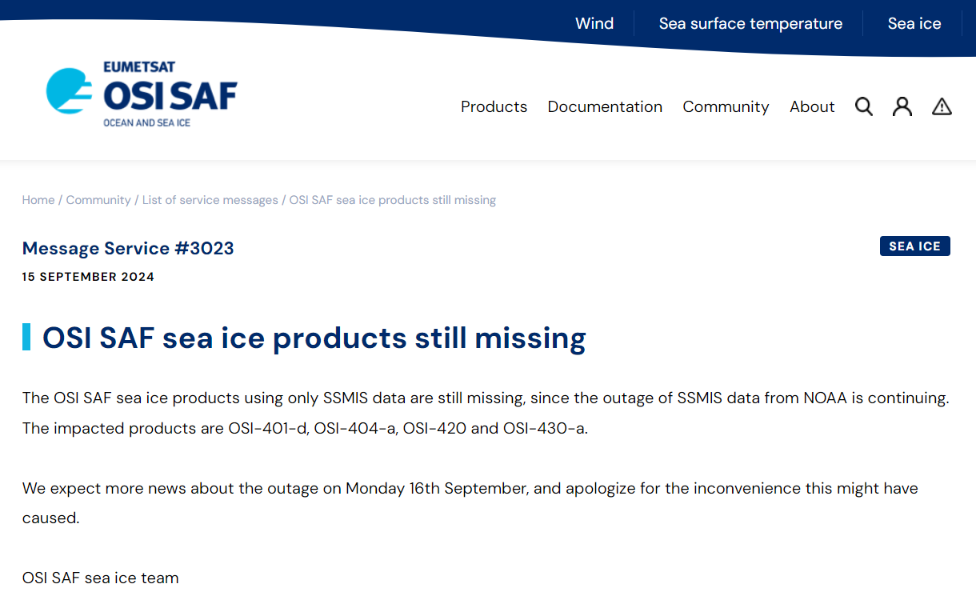
Not good timing for a data outage!

[Update – September 22nd]

SSMIS data has been flowing again for a couple of days:

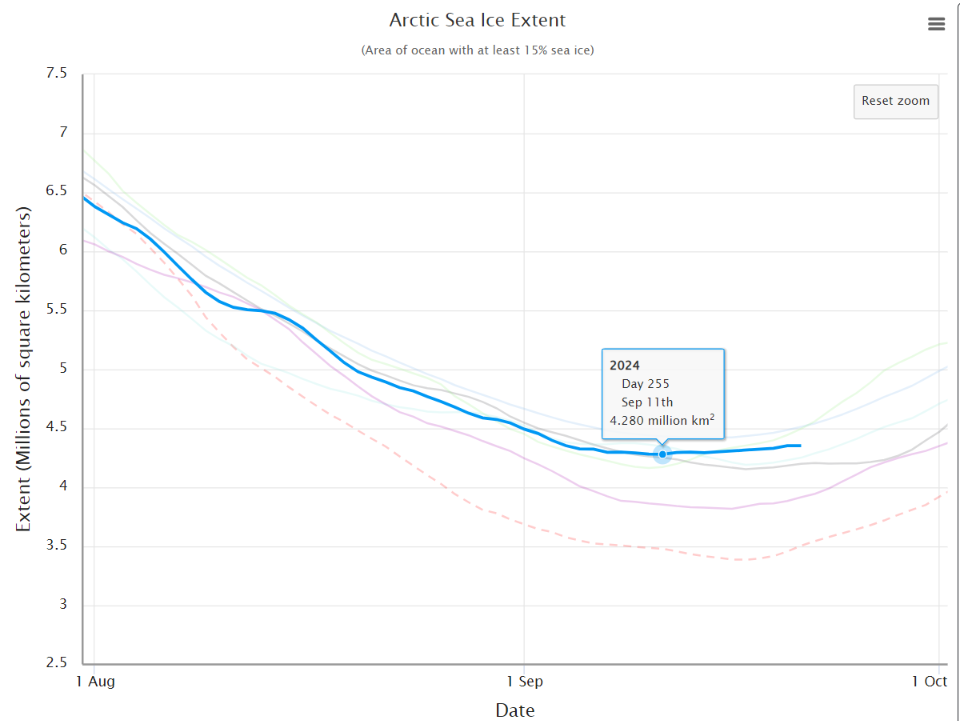
This graph may be subject to revision if and when the missing data is recovered, but currently it looks as though the 2024 minimum of the NSIDC 5 day averaged extent metric is 4.28 million km² on September 11th.

[Update – September 24th]

The National Snow and Ice Data Center formally announced today that:

On September 11, Arctic sea ice likely reached its annual minimum extent of 4.28 million square kilometers. The 2024 minimum is the seventh lowest in the nearly 46-year satellite record. The last 18 years, from 2007 to 2024, are the lowest 18 sea ice extents in the satellite record…

Note that this is a preliminary announcement. Changing winds or late-season melt could still reduce the Arctic ice extent, as happened in 2005 and 2010. NSIDC scientists will release a full analysis of the Arctic melt season, and discuss the Antarctic winter sea ice growth, in early October.

The NSIDC also addressed the recent missing SSMIS data issue mentioned above as follows:

Note that a gap exists in the input source data between September 12 and September 18. This gap somewhat lowers our confidence in the minimum extent estimate. However, it appears that September 11 is the mostly likely date of the minimum based on data trends in daily extent values leading up to the 5-day average on September 11 and the extent values after data restarted on September 18. If extent did drop further between September 11 and September 18, it would have been marginal. If the input source data becomes available to fill that gap, our team will update the minimum estimate if necessary.

Watch this space!

The 2024 Maximum Arctic Sea Ice Extent

“The time has come”, the Walrus said, “to talk of many things… Of why the sea is boiling hot, and whether pigs have wings“.

And also about the assorted different Arctic sea ice extent metrics, and in particular their respective maxima for 2024.

Here is Zack Labe’s overview of previous years’ maxima from a few days ago:

Zack’s graph displays the JAXA/ViSHOP version of Arctic extent, so here too is JAXA’s own graph of the current sea ice extent:

JAXA extent is based on data from the AMSR2 instrument on the GCOM-W satellite, and shows no evidence yet of a local maximum, let alone an annual one for 2024.

However see also AWI’s “high resolution” AMSR2 area metric:

Continue reading The 2024 Maximum Arctic Sea Ice Extent

The 2022 Arctic Sea Ice Minimum Extent

September has arrived and it’s time to start speculating about when and at what level this summer’s minimum Arctic sea ice extent will occur. Here’s a helpful summary of previous years’ JAXA AMSR2/AMSR-E extent minima courtesy of Zack Labe:

Here too is JAXA’s current graph of extent, including a selection of previous years:

JAXA extent on August 31st was 4.96 million km2, marginally below last year’s value of 4.99 million km2 on the same date.

Continue reading The 2022 Arctic Sea Ice Minimum Extent

The 2022 Maximum Arctic Sea Ice Extent

Here’s the latest graph of Arctic sea ice extent from JAXA/ViSHOP, which looks a bit unusual to say the least:


It certainly caught my eye! Could that sudden peak on February 23rd be the maximum extent for the year? To be frank it looks more like an artifact in the underlying gridded AMSR2 concentration data, but it’s not wholly beyond the bounds of possibility. The Pacific side of the Arctic is anomalously warm at the moment:

and parts of the Bering Sea are above freezing point:

For the moment then the (extremely!) provisional JAXA Arctic sea ice maximum extent for 2022 is 14.39 million km².

By way of an AMSR2 second opinion let’s also take a look at our favourite “high resolution” AMSR2 metrics, which combine recent data from the Alfred Wegener Institute with historical data from the University of Hamburg:

The extent peak on the 23rd is of much smaller magnitude, and it’s almost non existent on the area graph.

Curiouser and curiouser.

[Edit – March 1st]

The JAXA maximum on February 23rd is definitely an artifact of dodgy AMSR2 data. Take a look at the Denmark Strait between Greenland and Iceland in particular:

The University of Hamburg version also shows an anomaly in the Barents Sea:

However the 5 day averaged NSIDC extent graph now shows a significant peak on February 25th:

Is anybody willing to put money on 14.875 million km² just yet?

[Edit – March 7th]

Here are the latest “high resolution” AMSR2 graphs:

The February 23rd maximum holds, for the moment at least.

[Edit – March 11th]

Here’s the latest JAXA Arctic sea ice extent graph:

A late surge is now looking exceedingly unlikely. However given that the maximum seems to have occurred during the brief period of dodgy data around February 23rd, what magnitude and date should be assigned to the 2022 maximum?

Whilst I ponder that thorny problem…

[Edit – March 12th]

Now I’ve really gone and done it! Started the “2022 melting season” thread on the Arctic Sea Ice Forum that is:

https://forum.arctic-sea-ice.net/index.php/topic,3749

Lots of heat heading in the direction of the North Pole sealed the deal:

[Edit – March 24th]

According to the latest edition of the NSIDC’s Arctic Sea Ice News:

Arctic sea ice has likely reached its maximum extent for the year, at 14.88 million square kilometers (5.75 million square miles) on February 25. The 2022 maximum is the tenth lowest in the 44-year satellite record. On the same day, on the other pole, Antarctic sea ice reached a record minimum extent, at 1.92 million square kilometers (741,000 square miles).

The date of the maximum this year, February 25, was fifteen days earlier than the 1981 to 2010 average date of March 12. Only two years had an earlier maximum, 1987 and 1996, both on February 24. This year is the second earliest date on the satellite record, tying with 2015, which also reached its maximum extent on February 25.

Watch this space!

The 2021 Arctic Sea Ice Minimum Extent

The results of the ARCUS Sea Ice Prediction Network August call have been released, and here is the outlook for the 2021 minimum September mean Arctic sea ice extent:

The median prediction for the mean sea ice extent during the month of September 2021 is 4.39 million km2. According to ARCUS:

As of 22 August 2021, the Arctic sea-ice extent was 5.58 (compared with 25 August 2020 value of 4.43) million square kilometers. Arctic sea-ice extent in 2021 remains well below the climatological median and has closely followed the 2012 values for much of the summer but has diverged to higher sea-ice extent starting in early August. The forecasts continue to support September 2021 mean sea-ice extent being well above the September 2020 value. July sea-ice retreat has been greatest in the Eurasian seas, particularly in the East Siberian Sea, making the 2021 ice edge well north of the long-term median edge in Eurasia. Sea ice retreated since the end of July along the northern coast of Alaska, although the ice edge is near its climatological position, which makes the Beaufort and Chukchi sea ice extent the largest at this time of year since 2006. A tongue of sea ice that has been present all summer continues to extend close to land in the Kara Sea, making the northeast passage likely to remain blocked for the first time in several years. Half the models which provide spatial data to the SIO predict that the tongue is likely to survive.

Now let’s take a look at a range of assorted extent measurements. Here’s the NSIDC’s 5 day average extent:

Continue reading The 2021 Arctic Sea Ice Minimum Extent

The 2021 Maximum Arctic Sea Ice Extent

Here’s the latest graph of Arctic sea ice extent from JAXA/ViSHOP, with 2021 and 2015 highlighted:

Extent fell by over 100,000 square kilometres between February 16th and 17th! Can that steep fall continue, as it did for one more day in 2015?

Here too is Zack Labe’s 2021 overview of JAXA maximum extent over the previous couple of decades:

2015’s maximum was very early, on February 15th. Hence the current extremely tentative 2021 maximum is already both higher and later than that. The decadal average extent graphs show the date of the maximum getting later and later, and the 2010’s peaks in the middle of March.

It therefore seems likely that there is more freezing still to come this year. However lets take a look at the high resolution AMSR2 sea ice area graph for the Sea Of Okhotsk:

The recent fall in Arctic wide extent has evidently been driven by the recent rapid decline in this peripheral sea, where SMOS reveals more thin ice ripe for further melting:

In conclusion, the high res AMSR2 extent metric shows the tentative 2021 peak below that of 2015!

Continue reading The 2021 Maximum Arctic Sea Ice Extent

Facts About the Arctic in April 2020

This comes to you a couple of days early, but the clocks have just changed to British Summer Time in the once United Kingdom and there is news to impart.

JAXA Arctic sea ice extent has fallen to the lowest level for the date in their satellite era records going back to 1979. This graph shows every year since 2000:

The high resolution AMSR2 regional graphs make clear that the precipitous drop on the Pacific periphery has continued:

The current combined SMOS/SMAP Arctic sea ice “thinness” map makes clear that there is plenty more thin ice ready for melting in the Sea of Okhotsk and Baffin Bay:

There is also a large area of thin ice in the Laptev Sea, which will be interesting to watch once the 2020 melting season gets underway in earnest.

[Edit – April 1st]

Today is All Fools’ Day, but this is no joke. Thanks to the consistent polar vortex over the Northern Hemisphere winter there is currently an anomalous “ozone hole” over the North Pole. As recently described in Nature:

A vast ozone hole — probably the biggest on record in the north — has opened in the skies above the Arctic. It rivals the better-known Antarctic ozone hole that forms in the southern hemisphere each year.

Record-low ozone levels currently stretch across much of the central Arctic, covering an area about three times the size of Greenland. The hole doesn’t threaten people’s health, and will probably break apart in the coming weeks. But it is an extraordinary atmospheric phenomenon that will go down in the record books.

“From my point of view, this is the first time you can speak about a real ozone hole in the Arctic,” says Martin Dameris, an atmospheric scientist at the German Aerospace Center in Oberpfaffenhofen.

Here are the latest graphics from the “Arctic Ozone Watch” section of the NASA web site:

Observations made during the still ongoing MOSAiC expedition, have confirmed the satellite derived measurements:

This year, powerful westerly winds flowed around the North Pole and trapped cold air within a ‘polar vortex’. There was more cold air above the Arctic than in any winter recorded since 1979, says Markus Rex, an atmospheric scientist at the Alfred Wegener Institute in Potsdam, Germany. In the chilly temperatures, the high-altitude clouds formed, and the ozone-destroying reactions began.

Researchers measure ozone levels by releasing weather balloons from observing stations around the Arctic (including the Polarstern icebreaker, which is frozen in sea ice for a year-long expedition). By late March, these balloons measured a 90% drop in ozone at an altitude of 18 kilometres, which is right in the heart of the ozone layer. Where the balloons would normally measure around 3.5 parts per million of ozone, they recorded only around 0.3 parts per million, says Rex. “That beats any ozone loss we have seen in the past,” he notes.

I’ve previously conjectured about the potential effect of the strong polar vortex on Northern Hemisphere snow cover this Spring, and here’s NOAA’s current snow extent graph:

JAXA extent’s precipitous recent decline has abated, and it’s now 5th lowest for the date in the satellite era:

[Edit – April 4th]

Here’s the March 31st PIOMAS Arctic sea ice gridded thickness map:

together with the traditional volume graph:

Wipneus comments on the Arctic Sea Ice Forum that:

Ice is thickening impressively against the Canadian Archipelago and North Greenland.

That is indeed the case with the PIOMAS “modelled” numbers, but is much less obvious in the latest CryoSat-2/SMOS “measured” thickness map where ice over 4 metres thick is still conspicuous by its absence North of Greenland:

Plus a bonus graph for “Turbulent Eddie”, who suggests that:

[There’s] not much thick ice on the East Coast of Greenland, indicating the increase was from reduced loss through the Fram Strait?

together with the latest AARI ice age map:

[Edit – April 6th]

Here’s the latest update of our novel NRT volume metric:

I’ve applied a crude correction to the still problematic NRT data so that it at least coincides with the reanalysed data on March 14th. Whilst we await the reanalysed numbers for the rest of March and early April it looks as though Arctic sea ice volume reached at least a temporary peak on March 20th 2020.

[Edit – April 19th]

Here’s another update of our novel NRT volume metric, still incorporating my “fudge factor”:

Note also this handy hint from Stefan Hendricks on Twitter:

[Edit – April 21st]

Wipneus has crunched the mid month PIOMAS gridded thickness numbers. Here’s the result:

The discrepancy between the PIOMAS model and the CryoSat-2 “reality” is still very evident.

[Edit – April 25th]

With another week’s worth of reanalysed data now processed, it now seems certain that the CS2/SMOS Arctic sea ice volume maximum was 18469 km³ on April 6th:

[Edit – April 28th]

The high resolution AMSR2 area and extent metrics are now both “lowest for the date” in the AMSR2 record:

JAXA/ViSHOP AMSR2 extent isn’t quite there yet:

The 2020 Maximum Arctic Sea Ice Extent

As Zack Labe has recently pointed out, in 2015 the Arctic sea ice maximum extent based on the JAXA numbers had already occurred on February 15th:

Perhaps it’s time we started paying attention this year! However the National Snow and Ice Data Center reported a significantly later date in 2015:

On February 25, 2015, Arctic sea ice extent appeared to have reached its annual maximum extent, marking the beginning of the sea ice melt season. This year’s maximum extent not only occurred early; it is also the lowest in the satellite record. However, a late season surge in ice growth is still possible.

Each year we keep track of the assorted Arctic sea ice metrics over the next month or so, and they rarely agree on the date of maximum extent, and never agree on the sea ice extent on that date! The reason for that is explained in a 2017 paper entitled “Variability and trends in the Arctic Sea ice cover: Results from different techniques“:

Reports on the sea ice cover have been provided by different institutions using basically the same set of satellite data but different techniques for estimating key parameters such as ice concentration, ice extent, and ice area. In this study, a comparison of results from four different techniques that are frequently used shows significant disagreements in the characterization of the distribution of the sea ice cover primarily in areas that have a large fraction of new ice cover or significant amount of surface melt.

In due course we’ll look at the metrics from a variety of different institutions, but let’s start with JAXA, comparing 2020 with 2015 and the 2010s average:

Extent is clearly increasing just at the moment! Will the next peak prove to be the maximum for the year or will we have to wait another month or more to find out that value, as suggested by the average?

Compare and contrast JAXA extent with Wipneus’ high resolution AMSR2 extent and area:

Perhaps the 2020 maximum area has already been reached?

[Edit – February 25th]

Or perhaps not! We’re playing mix and match this morning, since Wipneus’s new numbers haven’t been released yet. Here UH AMSR2 high resolution Arctic sea ice area from February 23rd:

Plus JAXA extent for the 24th:

[Edit – February 27th]

Tony Heller’s latest sea ice themed article claims “Normal Sea Ice Extent At Both Poles”. Hence today’s JAXA extent graph includes the averages for previous decades:

Extent is evidently increasing once again, and is even more evidently well below what passed for “normal” in the twentieth century!

Let’s also compare the Pacific periphery:

with the Atlantic side of the Arctic Ocean:

The Bering and Okhotsk Seas will be sea ice free by the time September 2020 arrives. How about the Kara, Barents and particularly Greenland Seas though?

[Edit – February 29th]

Arctic sea ice maximum volume usually occurs in April, but nonetheless let’s keep an eye on the metric that most nearly measure the “amount” of sea ice left in the Arctic in 2020. Here’s our “measured” CryoSat-2/SMOS volume metric, using reanalysed data up to February 12th:

PIOMAS “modelled” volume for February should be released soon, but getting back to extent the JAXA flavour has been setting new highs over recent days:

whereas the NSIDC’s Charctic 5 day averaged extent has not!

[Edit – March 6th]

Here’s the February PIOMAS gridded Arctic sea ice thickness map, courtesy of Wipneus on the Arctic Sea Ice Forum:

plus the traditional modelled volume graph:

As angech has pointed out elsewhere, according to the PIOMAS team:

CryoSat-2 data show total volume for February 2020 substantially lower than PIOMAS with 2020 Febuary near record low levels over the 2011-2020 period

[Edit – March 19th]

The March mid month PIOMAS numbers have been crunched by Wipneus. Here’s how things look at the moment:

For comparison purposes here’s the current CryoSat-2/SMOS Arctic sea ice thickness map:

[Edit – March 20th]

After flatlining for a long time JAXA extent has posted significant declines for two days running. There’s been no official announcement from the NSIDC as yet, but it now seems safe to conclude that there won’t be a late surge in extent similar to 2010. Here’s the current JAXA graph:

plus NSIDC’s 5 day averaged extent:

Hence the (still provisional!) maximum numbers for 2020 are:

JAXA/VISHOP AMSR2 – 14.45 million square kilometres on March 3rd
NSIDC 5 day SSMIS – 15.05 million square kilometres on March 5th

The University of Hamburg’s JAXA AMSR2 concentration data seems to have suffered an outage over the crucial period. Hopefully the gaps will be filled in due course. However more recent regional graphs  reveal the following:

The recent declines in overall extent are evidently driven by declines on the Pacific periphery.

The 2019 Arctic Sea Ice Metric Minima

September is here once again, so the assorted minima of a variety of Arctic sea ice metrics will be reached soon, if they haven’t happened already!

In the latter category let’s first take a look at the NSIDC’s 5 day averaged SSMIS based Arctic sea ice extent:

It looks entirely feasible that the current minimum of  4.29 million square kilometres on September 7th will hold for the rest of the calendar year. The daily NSIDC number is currently 4.24 million km² on September 4th.

By way of contrast the JAXA/ViSHOP AMSR2 based extent hit a new low of  4.11 million  km² yesterday:

And what of our much beloved high resolution AMSR2 metrics derived by “Wipneus” from the University of Hamburg’s AMSR2 concentration data? Area certainly looks to be past the minimum for this year, whereas extent is still conceivably capable of another push lower:

The provisional minimum extent for 2019 is 3.80 million km² on September 3rd.

The minimum Arctic sea ice volume generally occurs slightly later than area or extent. The data certainly arrives later! Here’s the PIOMAS graph up to August 31st:

and here’s the associated thickness map:

Note that Arctic wide modelled volume is only slightly higher than in 2012 at the same time of year, but there is a noticeably greater percentage gap in extent. That implies that average ice thickness across the Arctic is lower in 2019 than in 2012.

Note also that the thickest ice is no longer located along the north coasts of Greenland and the Canadian Arctic Archipelago. Here are the equivalent maps for previous years for comparison purposes:

Perhaps JAXA extent will head still lower over the next few days? Perhaps PIOMAS volume will sneak below 2012 before the peripheral refreeze begins?

[Edit – September 13th]

JAXA Arctic sea ice extent has reached a new minimum of 4.09 million km².

NSIDC daily extent is currently 4.28 million km², still just above the September 4th minimum.

[Edit – September 14th]

JAXA Arctic sea ice extent has reached a new minimum of 4.05 million km², which now puts it below the 2007 minimum that occurred somewhat later in September:

[Edit – September 14th PM]

NSIDC 5 day averaged extent has also (by a whisker!) reached a new minimum for the year of 4.285 million km²:

The daily number fell to 4.21 million km².

[Edit – September 15th]

I have somewhat belatedly discovered that in the build up to the forthcoming MOSAiC Expedition the Alfred Wegener Institute recently announced  that:

The sea-ice extent in the Arctic is nearing its annual minimum at the end of the melt season in September. Only circa 3.9 million square kilometres of the Arctic Ocean are covered by sea ice any more, according to researchers from the Alfred Wegener Institute and the University of Bremen. This is only the second time that the annual minimum has dropped below four million square kilometres since satellite measurements began in 1979.

[Edit – September 16th]

JAXA/ViSHOP extent has dropped below the 2016 minimum, and now measures 4.01 million km²:

Only 2012 left to beat!

Wipneus’ high resolution AMSR2 extent has also posted a new low for the year, but still has a little way to go before passing 2016:

Area is also currently declining, but is still well away from a new minimum for 2019:

[Edit – September 19th]

After some more modest declines JAXA/ViSHOP extent has just increased marginally from the previous day, and now measures 3.98 million km²:

That puts the (very!) tentative minimum for 2019 at 3.96 million km² on September 17th.

[Edit – September 20th]

The mid month PIOMAS gridded thickness and volume numbers have been released:

As anticipated given recent extent values, the volume difference from 2012 has increased somewhat over the last two weeks.

[Edit – September 23rd]

The National Snow and Ice Data Center have called the 2019 minimum in their latest edition of Arctic Sea Ice News:

On September 18, 2019, sea ice extent dropped to 4.15 million square kilometers (1.60 million square miles), effectively tied for the second lowest minimum in the satellite record along with 2007 and 2016. This appears to be the lowest extent of the year. In response to the setting sun and falling temperatures, ice extent will begin increasing through autumn and winter. However, a shift in wind patterns or a period of late season melt could still push the ice extent lower.

[Edit – September 24th]

To summarise the assorted minimum extent metrics for 2019:

University of Bremen – 3.77 million km² on September 18th, 2nd lowest behind 2012.
JAXA/ViSHOP – 3.96 million km² on September 17th, “Statistical tie” with 2016 for 2nd lowest.
NSIDC 1 day – 4.10 million km² on September 17th, “Statistical tie” with 2016 for 2nd lowest.
NSIDC 5 day – 4.15 million km² on September 18th, 2nd lowest behind 2012.

[Edit – October 1st]

Two sides of the same coin? Sea ice area on the Pacific side of the Arctic has been at historic lows for most of the melting season:

whereas on the Atlantic side:

[Edit – October 7th]
The September monthly numbers have arrived from the NSIDC, together with some intriguing annotations by Walt Meier:

Watch this space. Just in case!

The 2019 Maximum Arctic Sea Ice Extent

March 2019 has arrived, which in recent years has proved to be by far the likeliest month to contain the maximum extent of Arctic sea ice for the year. To begin with, here’s our favourite high resolution extent graph calculated by “Wipneus” from University of Hamburg/JAXA AMSR2 data:

Hopefully you can plainly see the pronounced sharp peak towards the end of February 2019? The current maximum Arctic sea ice extent for 2019 is 13.83 million square kilometers on February 22nd. Here’s Arctic sea ice area for good measure:

The current maximum area for 2019 is 13.10 million square kilometers, also on February 22nd. Here too is the NSIDC’s 5 day averaged extent:

charctic-20170221

This reveals a current maximum extent for 2019 of 14.705 million square kilometers on February 24th.

At this juncture you may well be wondering what the cause of that sudden sharp peak might be? Here’s your starter for ten:

Whilst overall Arctic sea ice area is unremarkable for the current decade, sea ice area in the Bering Sea is remarkable low for the time of year! What’s more much like last year the Chukchi Sea is not currently full to overflowing with sea ice, and is also lowest for the date in the AMSR2 satellite records:

I’ve also been experimenting with the new gridded CryoSat-2/SMOS thickness data from the Finnish Meteorological Institute, which reveals this:

That’s a weekly overview dated February 24th, but it does perhaps explain how such a large area of sea ice could melt so swiftly?

As luck would have it the skies are reasonably clear over the Bering Strait this morning (UTC). Here’s Terra’s view from on high of the current situation:

Terra's view of the Bering Strait on March 1st 2019
Terra’s view of the Bering Strait on March 1st 2019

 
[Edit – March 1st PM]

The “low resolution” version of JAXA extent has fallen once again today:

Do you suppose that the current maximum of 14.19 million square kilometers on February 22nd will hold until All Fools’ Day and beyond?

 
[Edit – March 2nd]

An animation of recent movements of sea ice in the Bering and Chukchi Seas:


Note the recent spread of open water across the southern Chukchi Sea.

 
[Edit – March 3rd]

Another angle on the Chukchi Sea, plus significant areas of open water now becoming evident in the Beaufort Sea:


[Edit – March 5th]

Some alternative views on Arctic sea ice thickness:

PIOMAS via Wipneus:

Blended CryoSat-2/SMOS:

plus close ups of the Bering/Chukchi area:

and the Atlantic periphery:

Please note the change of scale.


[Edit – March 6th]

Arctic sea ice extent is currently rebounding:

although not in all the peripheral seas:


[Edit – March 7th]

High resolution AMSR2 area and extent both declined today:

Long distance swells are already reaching the Bering Sea, with much more to come:


[Edit – March 9th]

Wipneus’ trusty Raspberry Pi hasn’t crunched the high res AMSR2 numbers yet, so let’s take a look at some other extent metrics.

Here’s JAXA’s “low res” AMSR2 numbers:

Here too is the NSIDC’s 5 day average:

By special request from Michael Ohere for the first time is the DMI’s take on Arctic sea ice extent:

In addition, here is the underlying sea ice concentration data from the OSI-SAF:

Since Michael is also asserting that there currently exists “the greatest February Arctic sea ice extent (according to DMI) in your blog’s history”, here’s Arctic sea ice area excluding the extremely peripheral Okhotsk and St. Lawrence regions:

P.S. Wipneus’ Pi has processed the AMSR2 data now, and area shows another, more modest, decline today:

In addition, here is the underlying sea ice concentration data from the University of Hamburg:


[Edit – March 10th]

Both area and extent increased today:

including increases on both the Atlantic:

and Pacific sides of the Arctic:


[Edit – March 11th]

Both area and extent are still moving inexorably upwards:

The late February maximum still holds, on the high resolution numbers at least. The JAXA/VISHOP web site is down at the moment, so we’ll have to wait for an update to that particular metric, as well as a post weekend update to the NSIDC’s Charctic chart.

P.S. Jaxa is still down this afternoon, but here’s the latest from the NSIDC:


[Edit – March 13th]

Arctic wide area and extent have blasted past their respective late February maxima:

However Arctic sea ice area excluding the Okhotsk and St. Lawrence peripheral regions has still not exceeded the maximum formed on January 25th:


[Edit – March 14th]

This morning’s data reveal the first decline in extent for several days:

The (extremely!) tentative new maximum Arctic sea ice extent for 2019 is 13.89 million square kilometers on March 12th.


[Edit – March 15th]

JAXA is back!

UH AMSR2 confirms that extent is still declining:


[Edit – March 16th]

Arctic sea ice extent continues to decline, whilst area is still flatlining:

Meanwhile a look at freezing degree days based on the DMI’s dubiously weighted data for north of 80 degrees reveals the story of the freezing season. A historically warm start, but now back in amongst the pack of the 2010s:


[Edit – March 17th]

It looks as though there’ll be no going back from this. Arctic sea ice area is finally following extent’s decline in no uncertain terms:

Barring exceedingly unforeseen circumstances after this year’s “double top” that leaves the 2019 Arctic sea ice maximum extent numbers as follows:

UH/Wipneus AMSR2 – 13.89 million square kilometers on March 12th
JAXA/VISHOP AMSR2 – 14.27 million square kilometers on March 12th
NSIDC 5 day SSMIS – 14.78 million square kilometers on March 13th


[Edit – March 19th]

Arctic sea ice area has fallen off the proverbial cliff over the last few days. There can now be no doubt that the 2019 maximum extent has been reached:

That being the case, all other Arctic sea ice discussion for the month of March can now take place over at:

Facts About the Arctic in March 2019


[Edit – March 21st]

The NSIDC have provisionally confirmed this year’s maximum extent:

On March 13, 2019, Arctic sea ice likely reached its maximum extent for the year, at 14.78 million square kilometers (5.71 million square miles), the seventh lowest in the 40-year satellite record, tying with 2007. This year’s maximum extent is 860,000 square kilometers (332,000 square miles) below the 1981 to 2010 average maximum of 15.64 million square kilometers (6.04 million square miles) and 370,000 square kilometers (143,000 square miles) above the lowest maximum of 14.41 million square kilometers (5.56 million square miles) set on March 7, 2017. Prior to 2019, the four lowest maximum extents occurred from 2015 to 2018.

The date of the maximum this year, March 13, was very close to the 1981 to 2010 median date of March 12.

Please note this is a preliminary announcement of the sea ice maximum. At the beginning of April, NSIDC scientists will release a full analysis of winter conditions in the Arctic, along with monthly data for March.