As the New Year rapidly approaches Tony Heller is up to his old Arctic tricks yet again. No doubt we’ll get on to many of his hoary old chestnuts in due course, but although I may easily have blinked and missed it he appears to have a new trick up his voluminous sleeve. Providing empirical evidence that the Intergovernmental Panel on Climate Change’s global warming “predictions” are correct!
Here is a recent extract from “Snow White’s” XTwitter feed:
Here's @TonyClimate demonstrating yet again that either:
1) He has no understanding of all things #Arctic, or
2) He understands well enough, but he pulls the wool over the eyes of his flock of faithful followers:https://t.co/U3tbp2qrOU
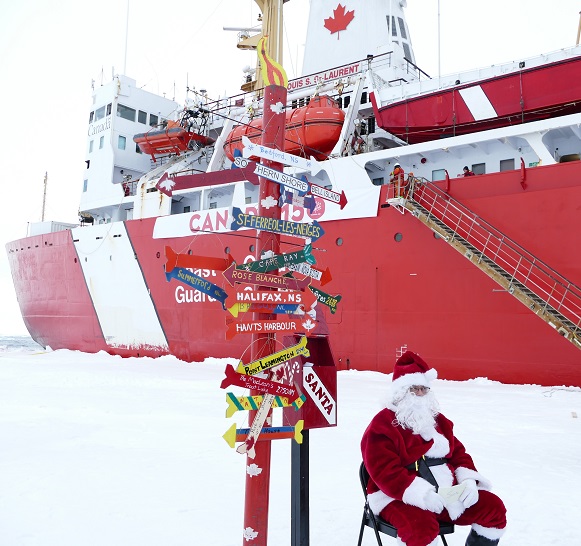
Christmas is rapidly approaching, and Santa and Snow White send festive greetings to one and all from the North Pole:
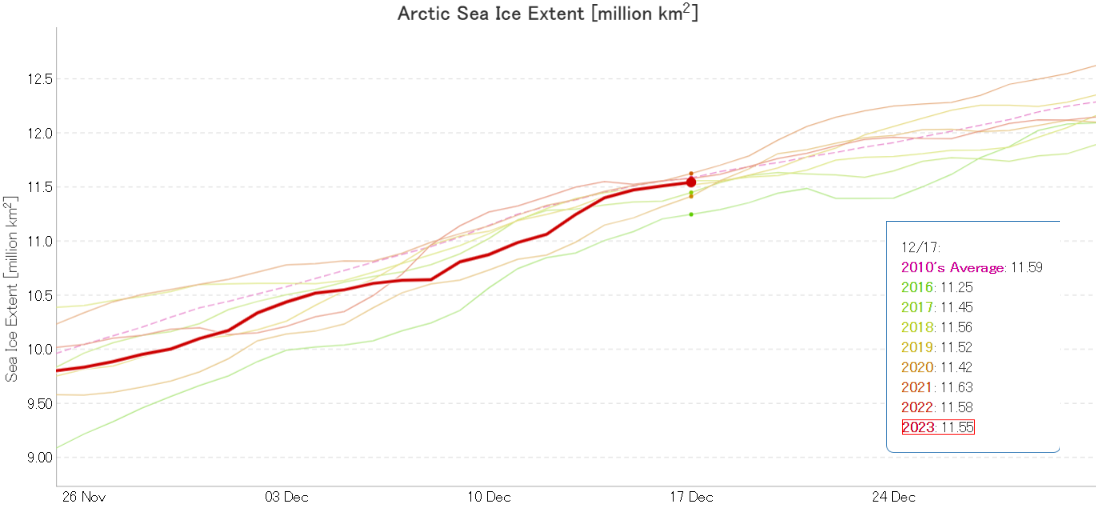
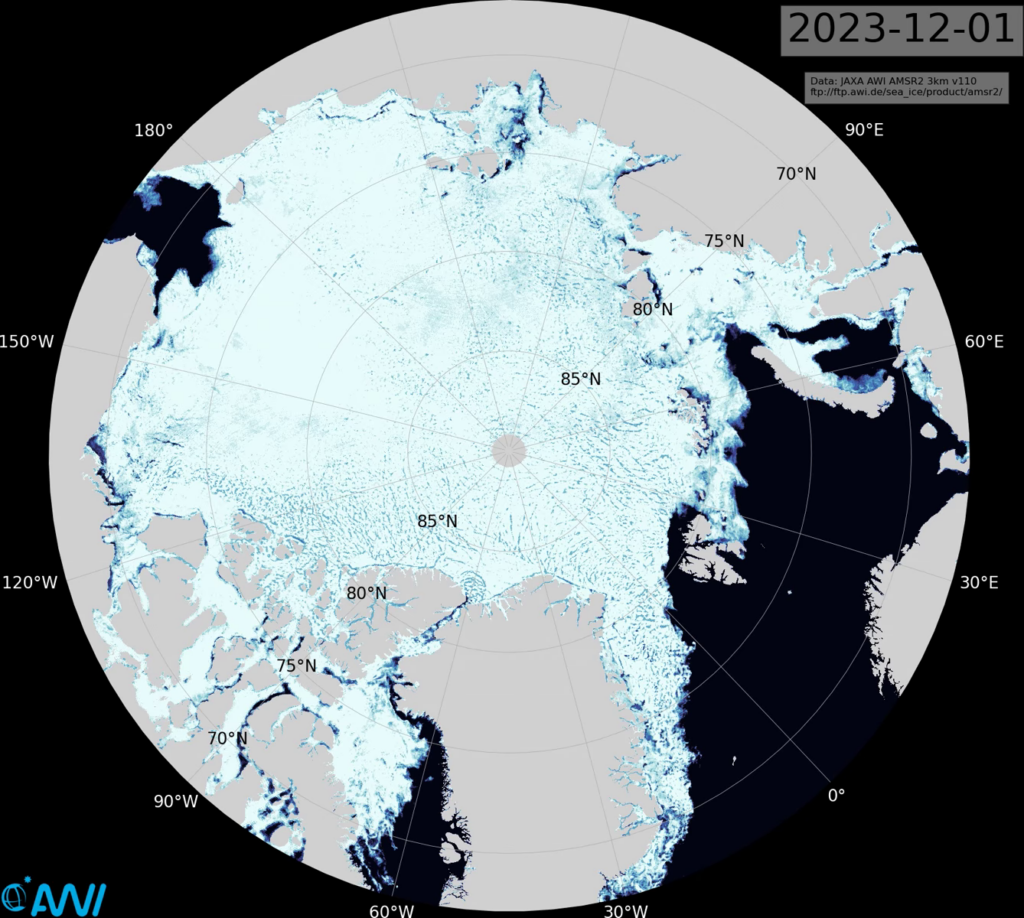
JAXA extent currently seems to be stuck on December 17th, but here’s how it looked a couple of days ago:
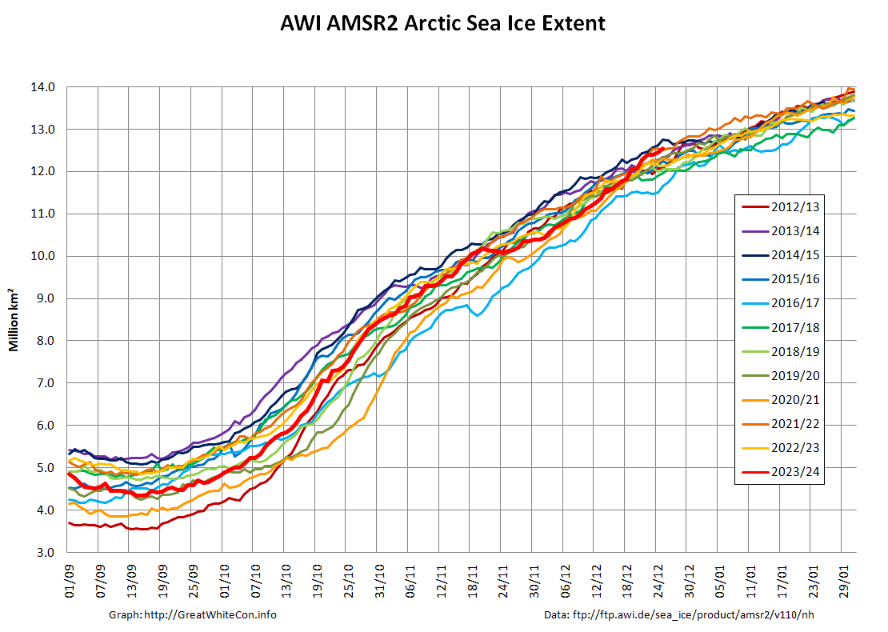
Having been comfortably in 3rd lowest position in the satellite era a few days ago, AMSR2 extent is now 5th lowest and very close to the 2010s average for the date.
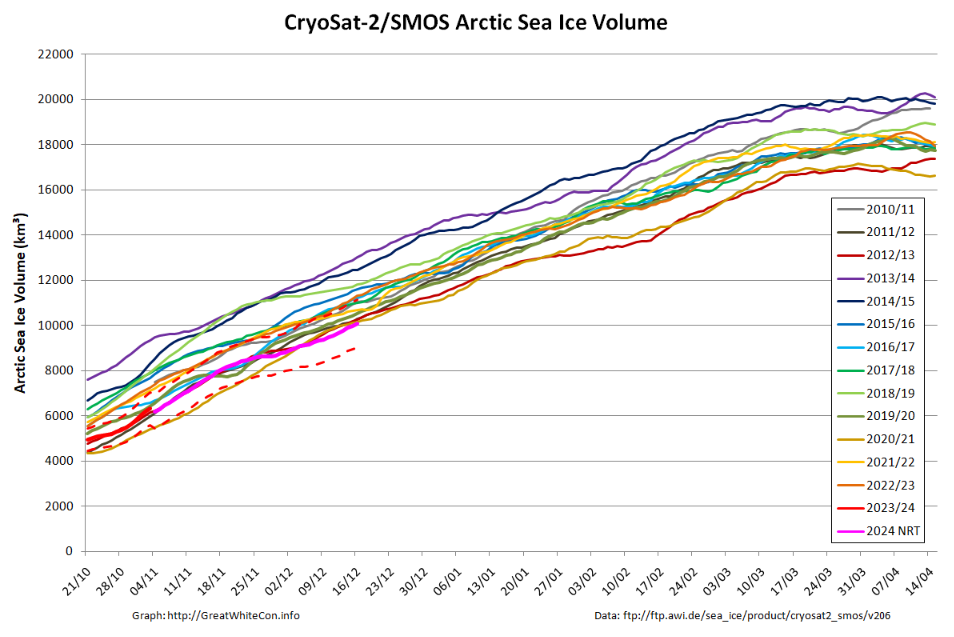
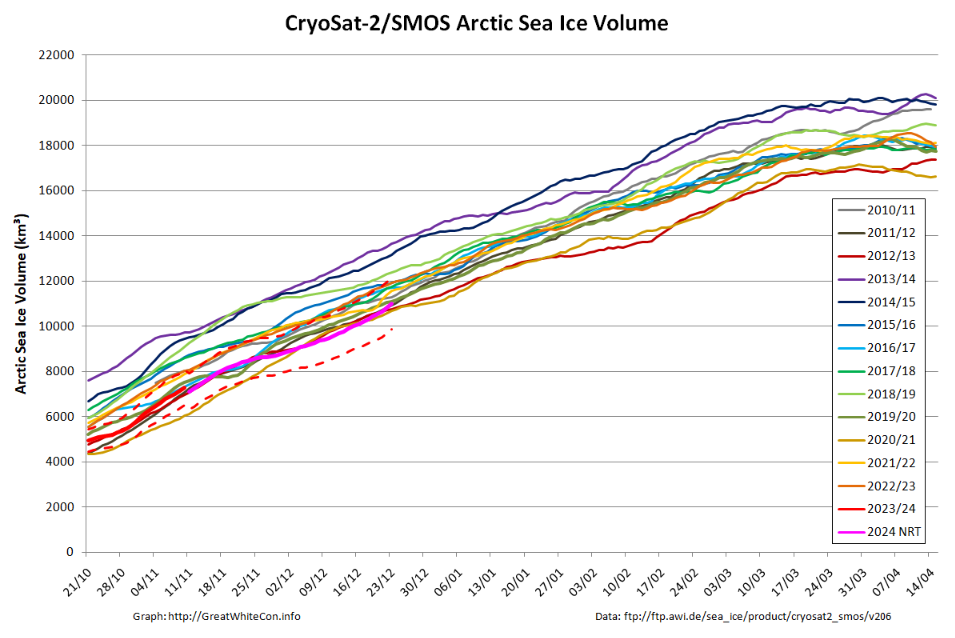
The Alfred Wegener Institute have been releasing reanalysed CryoSat-2/SMOS merged thickness data for a few days, and here is the resulting Arctic sea ice volume chart:
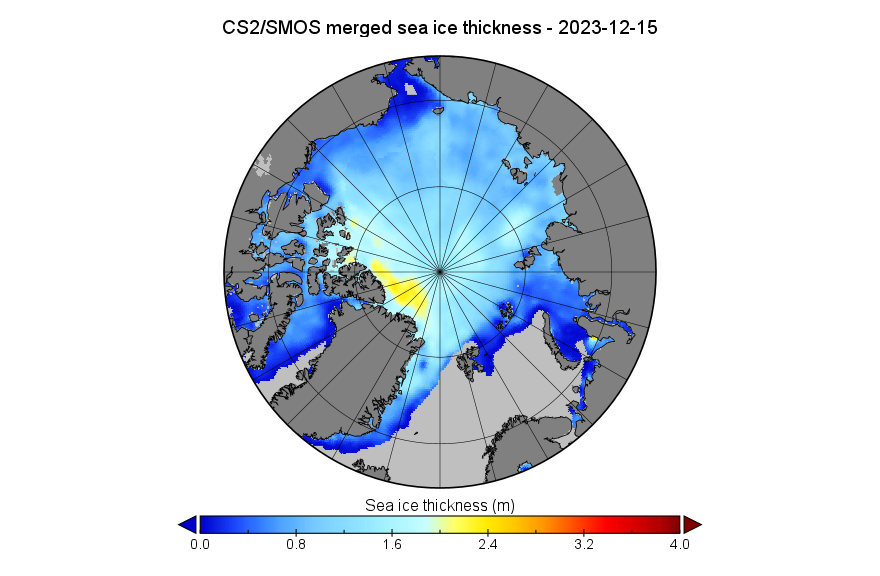
Near real time volume is currently lowest for the date in the CS2 record, but is likely to be revised upwards when the reanalysed data is eventually released. The associated NRT thickness map looks like this for December 15th:
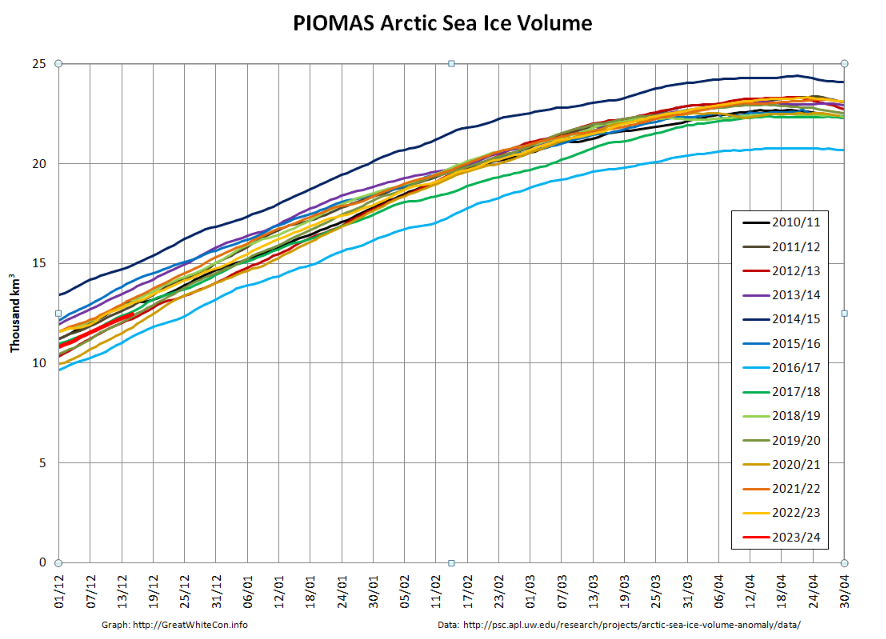
The mid-month PIOMAS modelled gridded thickness data has also been released. The calculated volume is 5th lowest in the satellite era:
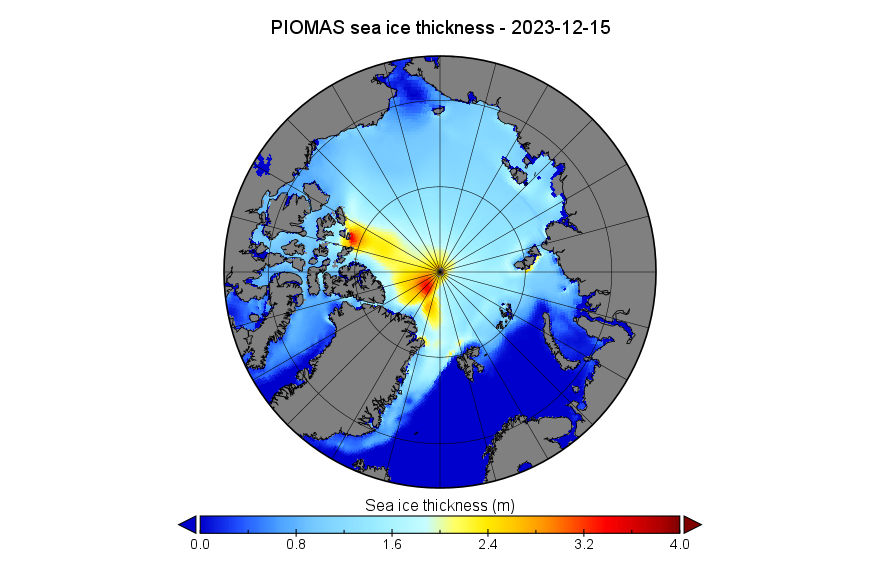
Here too is the PIOMAS thickness map for December 15th:
[Update – December 24th]
Merry Xmas everyone, especially Matt! Here’s a couple of images from the National Snow and Ice Data Center’s latest edition of Arctic Sea Ice News. In the short term sea ice is always melting somewhere:
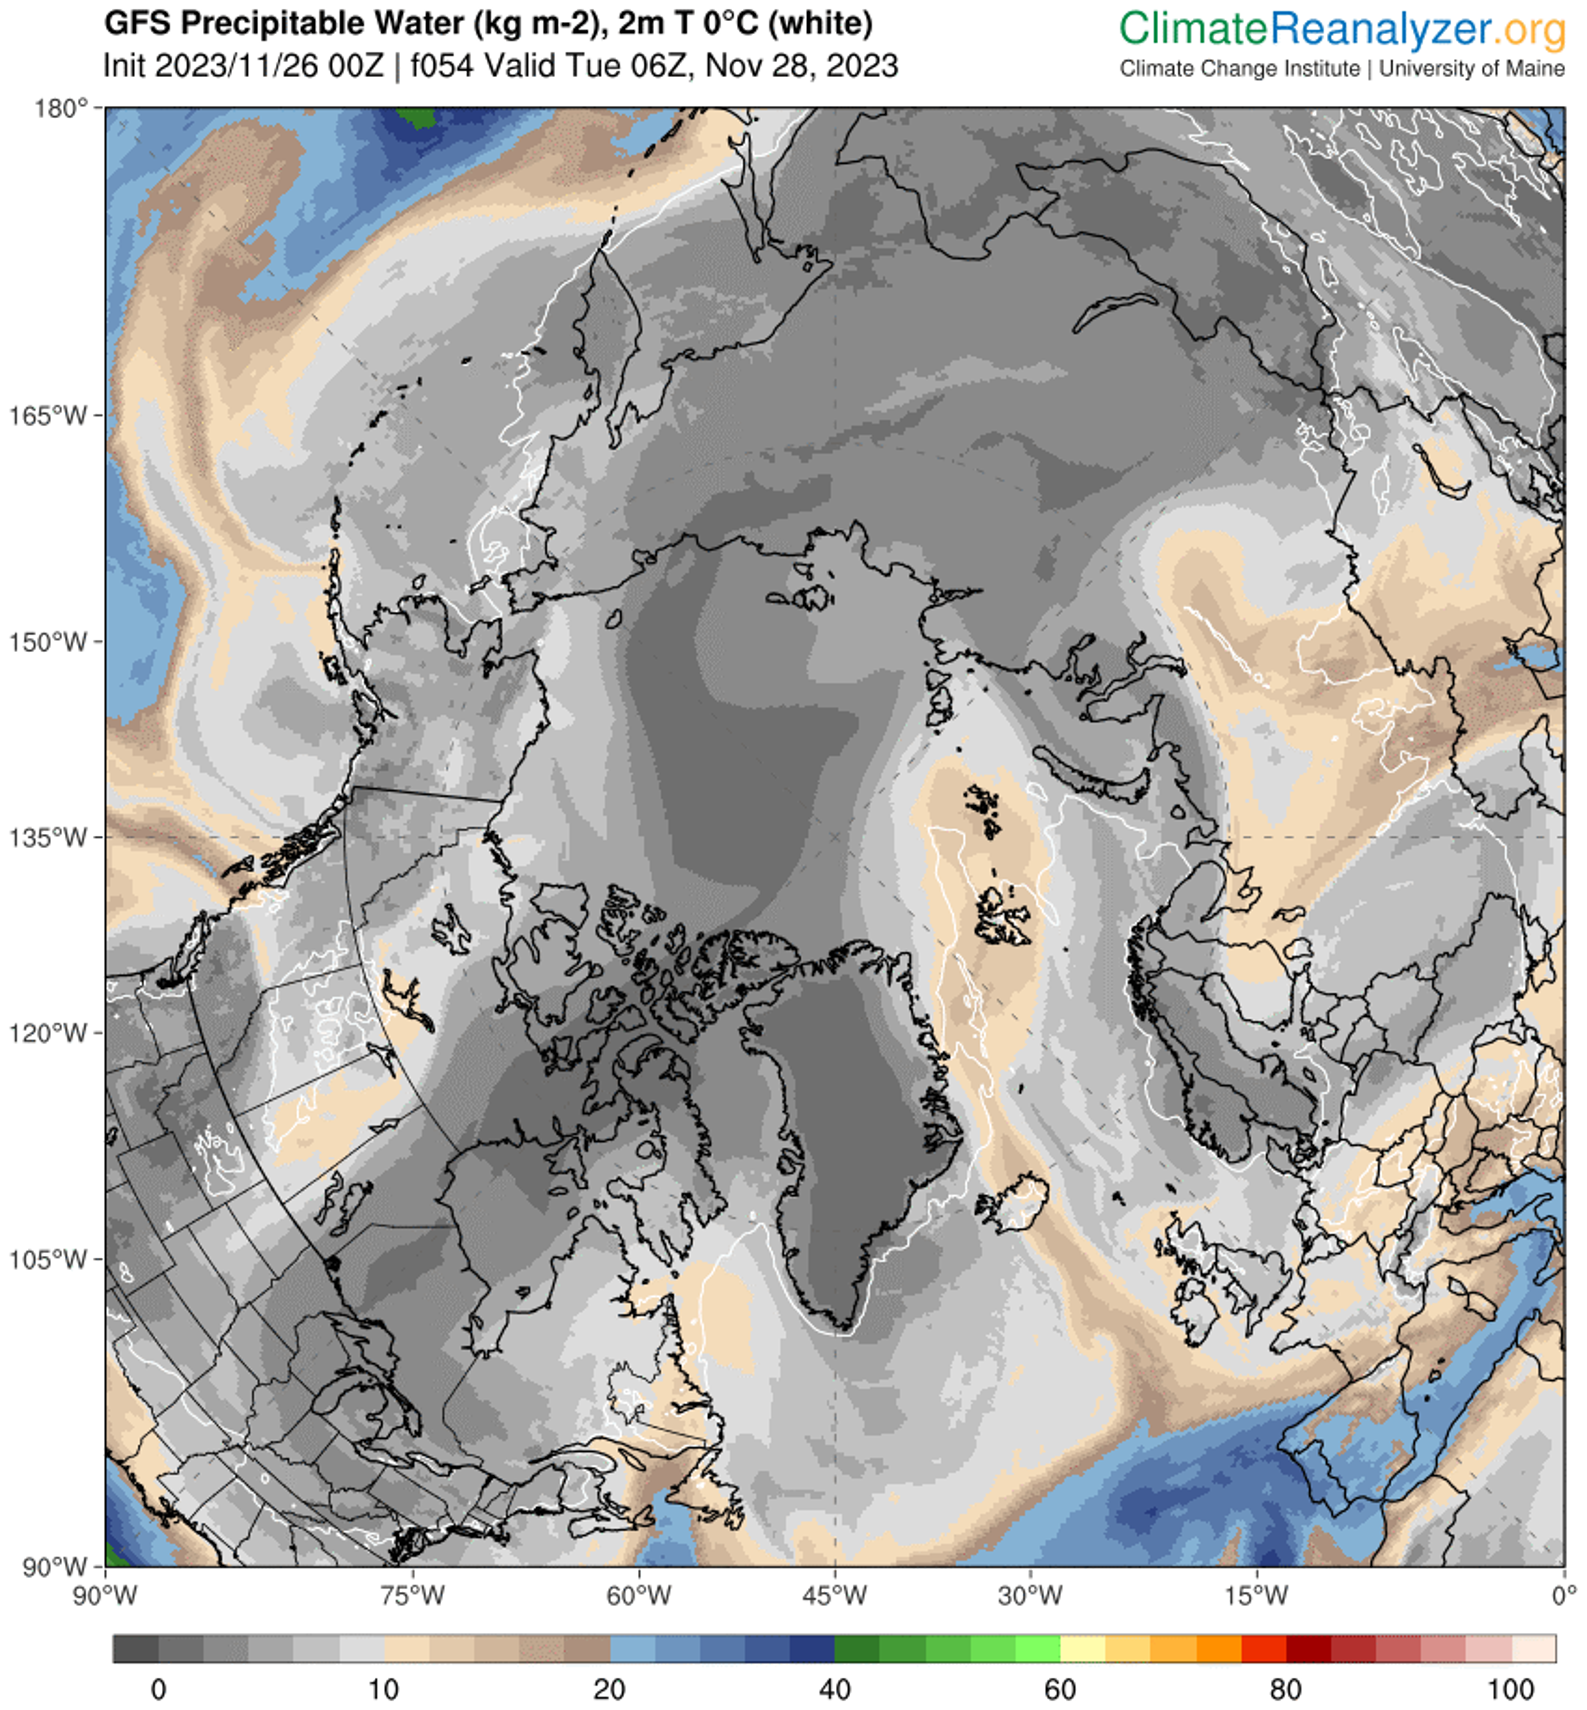
From November 21 to 28, a series of three extratropical cyclones followed a common track from the northeast coast of Greenland eastward along the northern edge of the Barents, Kara, and Laptev Seas. As each storm moved into the Arctic Ocean, it merged with its predecessors, creating a persistent cyclonic (counter clockwise) wind regime. The first and third of these storms originated in the Icelandic Low region before migrating up the east side of Greenland. The second storm originated just north of Greenland. Simultaneously, a center of high pressure developed over the ice-free part of the Barents Sea, becoming especially strong on November 26 to 28.
This combination of persistent low pressure to the north and west of Svalbard and a high-pressure center to the southeast created a strong, persistent flow from the south of relatively warm and moist air from the North Atlantic Ocean toward Svalbard, which then turned eastward along the marginal ice zone. This is seen as an extension of an atmospheric river into the Arctic. Atmospheric rivers are long narrow corridors that carry a large amount of water vapor. A recent study suggests that atmospheric rivers lead to ice loss by transporting warm, moist air into the Arctic that can limit sea ice growth. This is consistent with the observed pause in seasonal ice growth in late November.
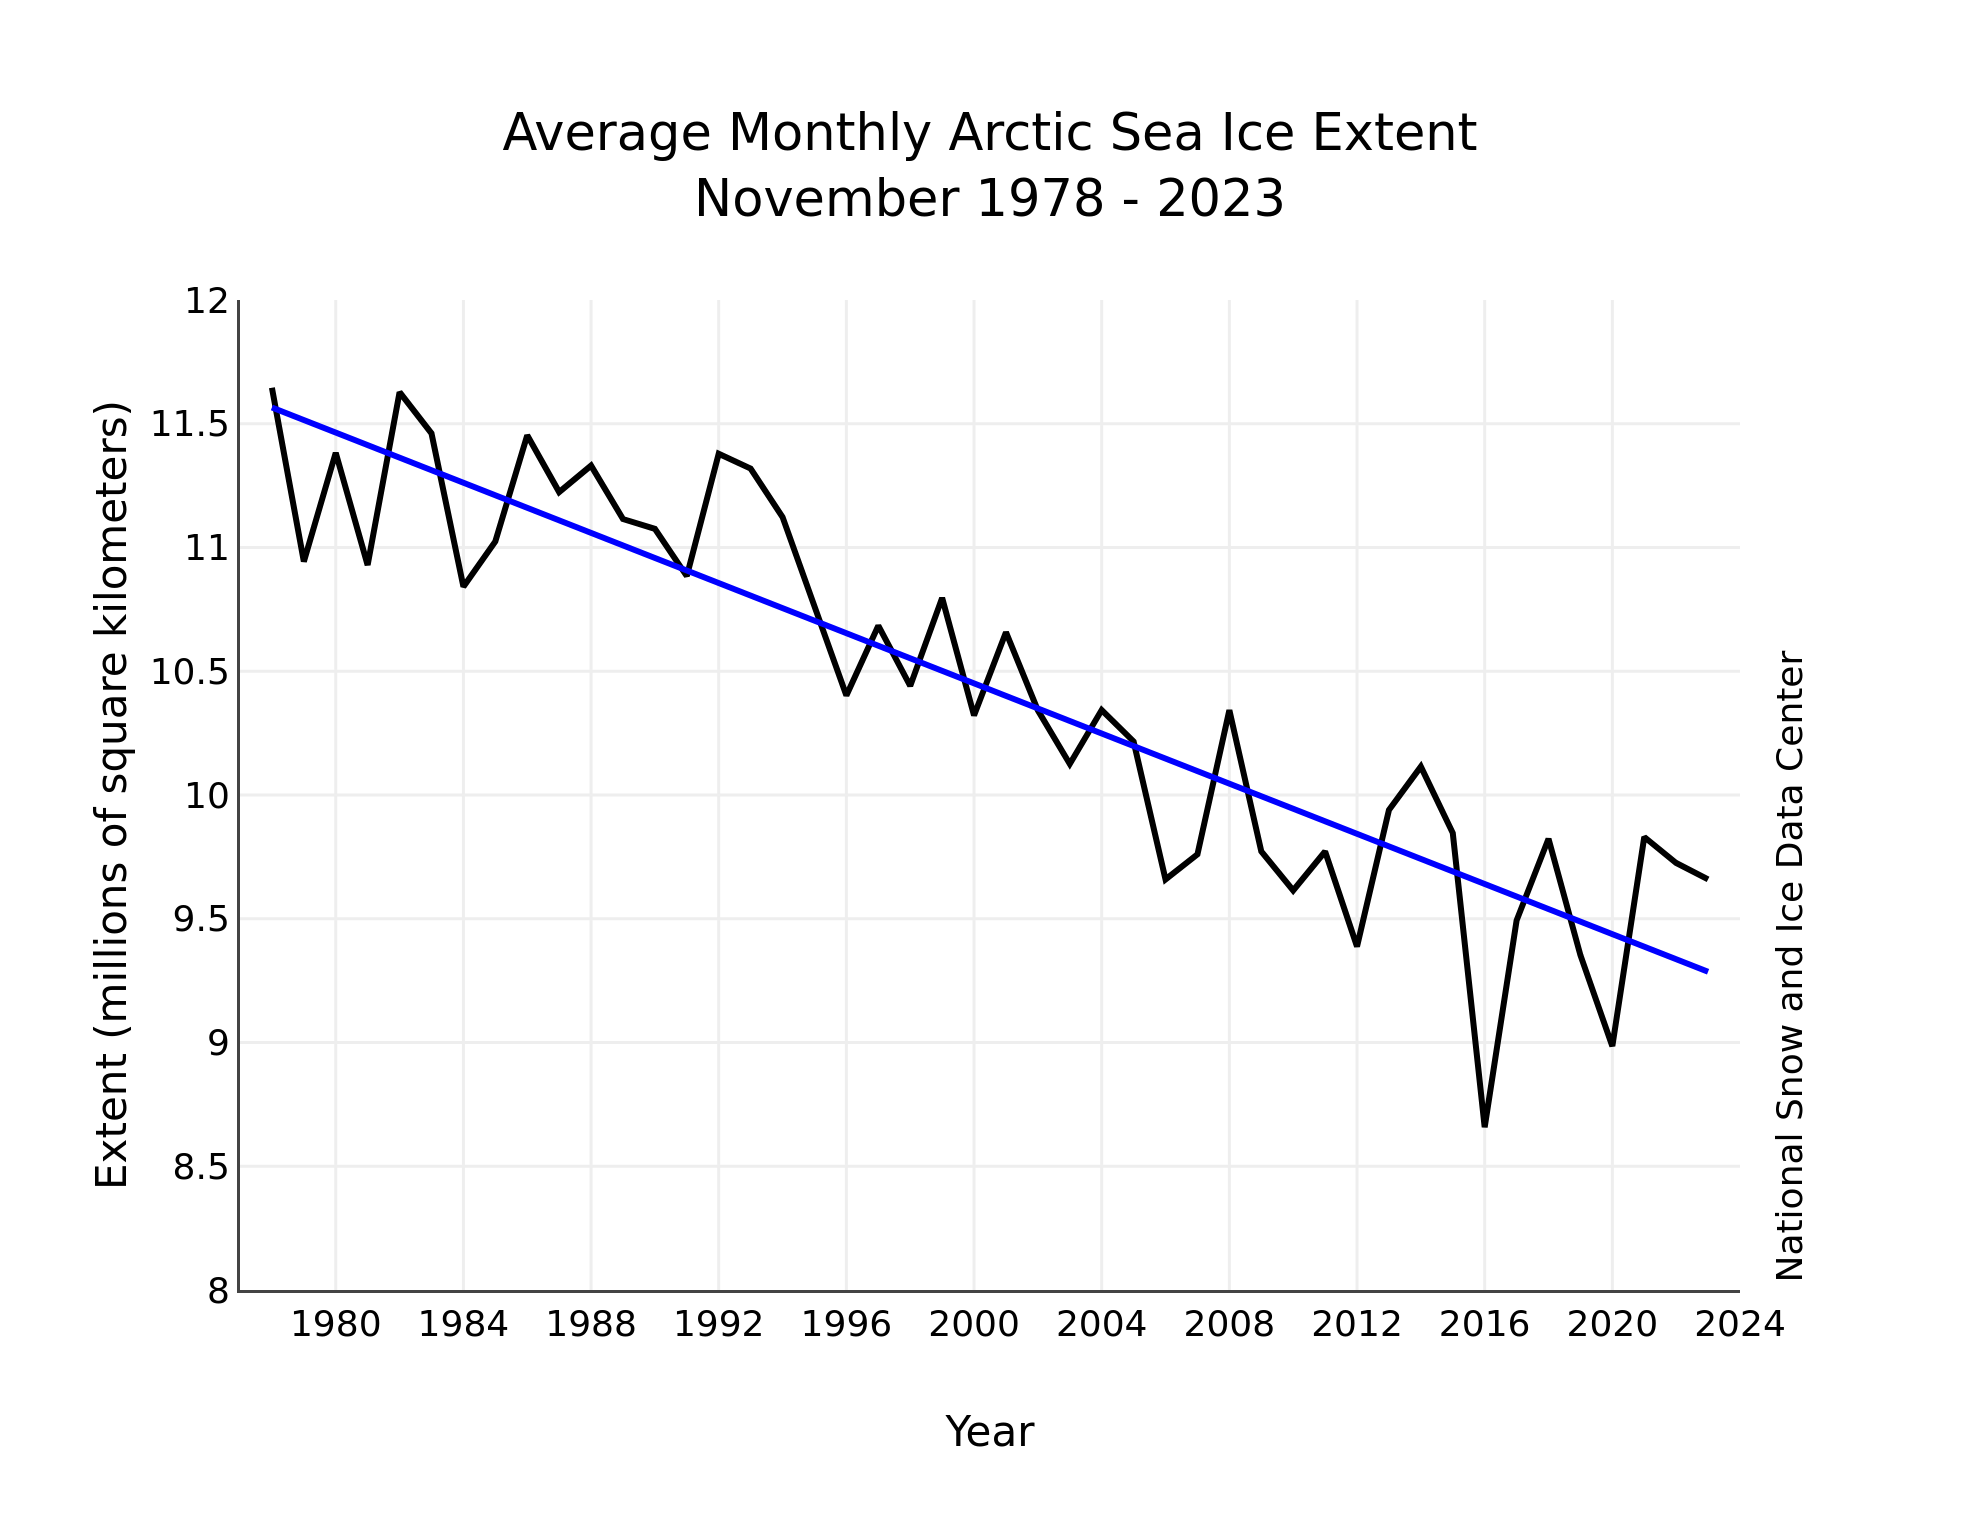
And over the longer term:
[Update – December 26th]
From being near the bottom of the recent pack at the end of November, Arctic sea ice extent is now edging towards the top of the 2010s range. Here’s the AWI high resolution AMSR2 metric:
However sea ice volume has not followed suit, and remains near the bottom of the range:
Here’s an animation of sea ice motion over the last month, revealing amongst other things the recent rapid refreeze of the Chukchi Sea (click to animate):
[Update – December 29th]
Matt is getting very excited about the allegedly “high Arctic sea ice extent” over on XTwitter. So is Tony Heller, although he has also helpfully provided convincing empirical evidence that the IPCC’s global warming “predictions” are correct!
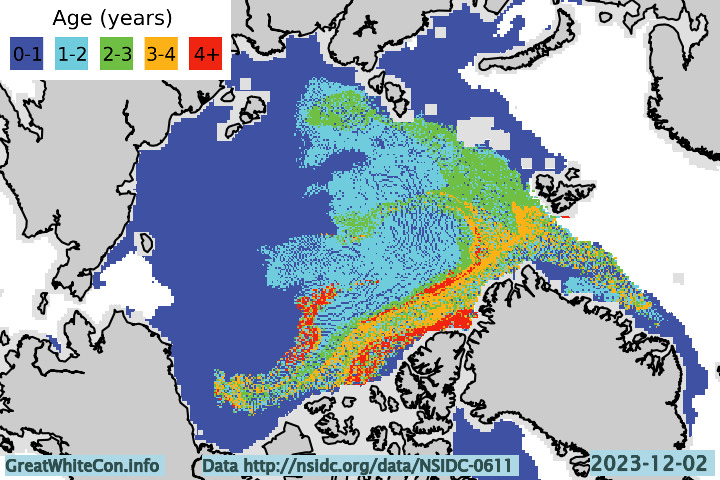
However neither of them seem to be at all interested in the age of Arctic sea ice. Here’s the early December update:
Drifting off topic only slightly, whilst perusing social media I also found this animation from Kev Pluck highly amusing:
There’s lots of coverage specifically about assorted Arctic sea ice extent metrics over on the “2023 Minimum Extent” thread. However we’ll start the September open thread ball rolling with a couple of cross posted images.
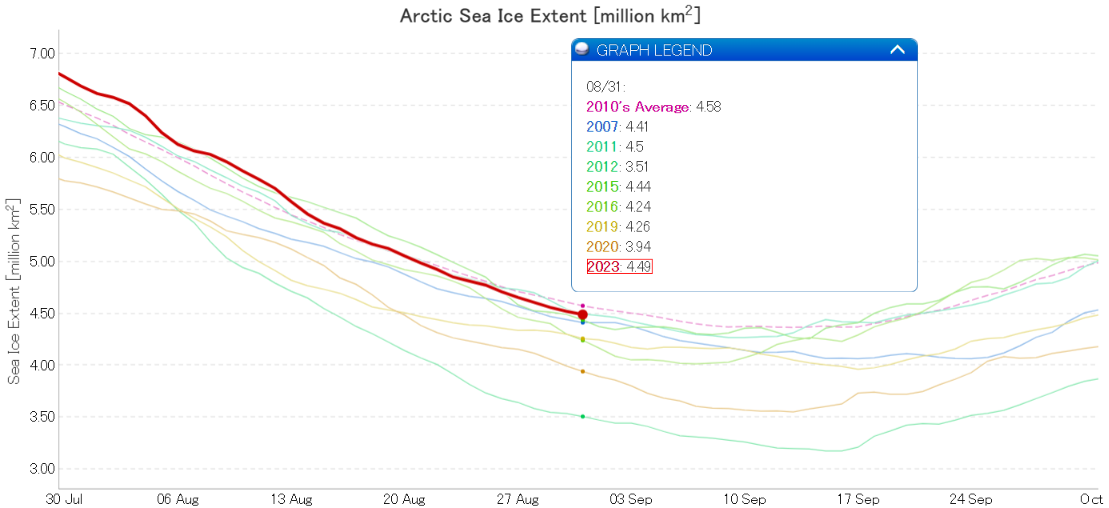
At the end of August JAXA daily extent was 7th lowest for the date, at 4.49 million km² :
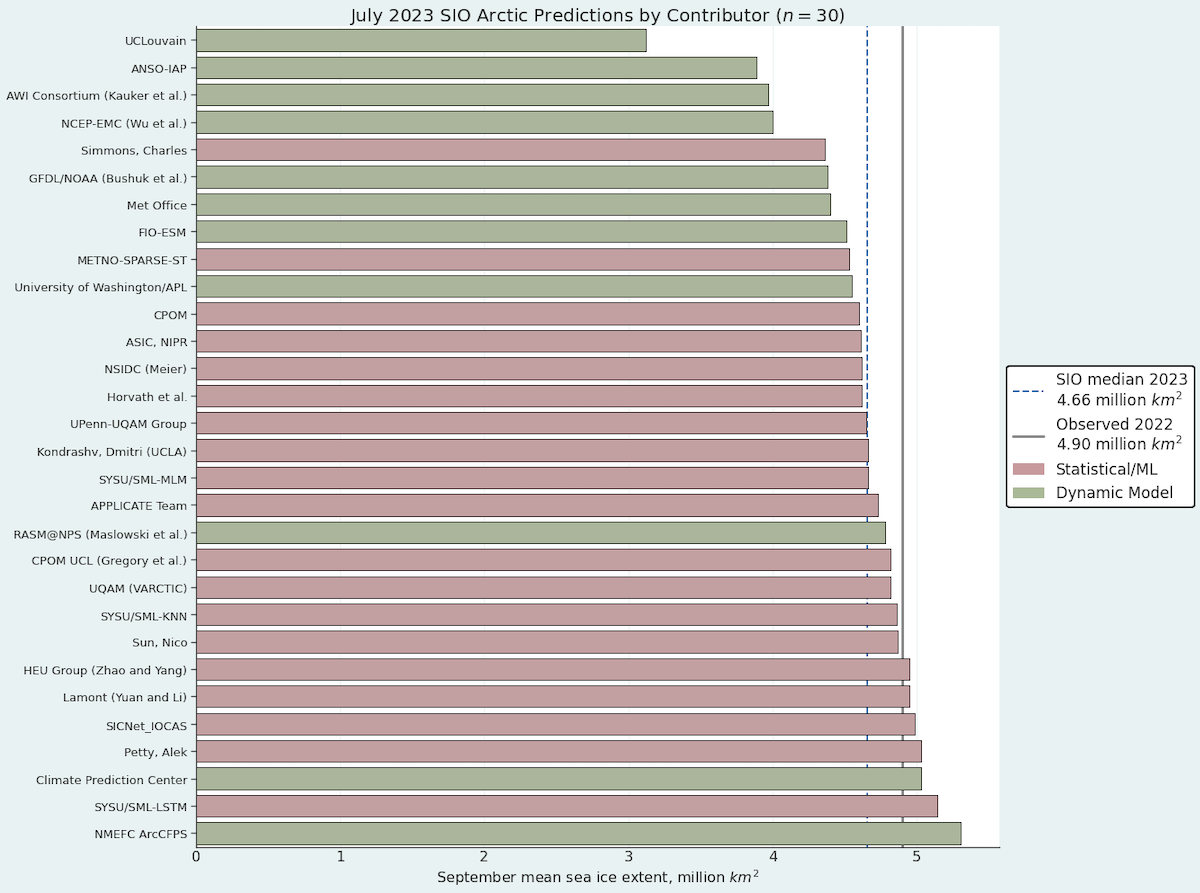
The median prediction of the contributors to the August call by the Sea Ice Prediction Network for the September monthly average extent is 4.6 million km² :
It’s that time of year again! Tony Heller has been asserting that “summer is over at the North Pole” for several weeks now, and the 2023 Arctic sea ice minimum extent will occur at some point over the next four or five weeks. The exact date and level will almost certainly vary from one extent metric to the next.
To get the minimum extent ball rolling, here’s Signe Aaboe’s graph of previous summer minima based on OSI SAF data:
Here too is Zack Labe’s equivalent, based on JAXA data:
We have grandchildren visiting this week, so it seems prudent to get the new open thread started a day early, and before they wake up!
The ARCUS Sea Ice Prediction Network July report has recently been published. Here’s the graphic overview of the 30 predictions for September sea ice monthly average extent:
The July median forecasted value for pan-Arctic September sea-ice extent is 4.66 million square kilometers with interquartile values of 4.51 and 4.87 million square kilometers, while individual forecasts range from 3.12 and 5.30 million square kilometers. We note the lowest forecast is an outlier, and the only forecast that predicts a new record September sea-ice extent value (current record is September 2012, with a sea-ice extent of 3.57 million square kilometers).
My Arctic alter ego was checking out the new “X” rated edition of Twitter when “she” couldn’t help but notice that Elon Musk had allowed Tony Heller back into the climate “debate” thereon, albeit with a new handle.
“Snow White” also noticed that for some strange reason Tony was telling lots of porky pies about Arctic sea ice again! Hence:
Here's @TonyClimate demonstrating yet again that either:
1) He has no understanding of all things #Arctic, or
2) He understands well enough, but he pulls the wool over the eyes of his faithful flock of followers.https://t.co/yYNhpSncLE
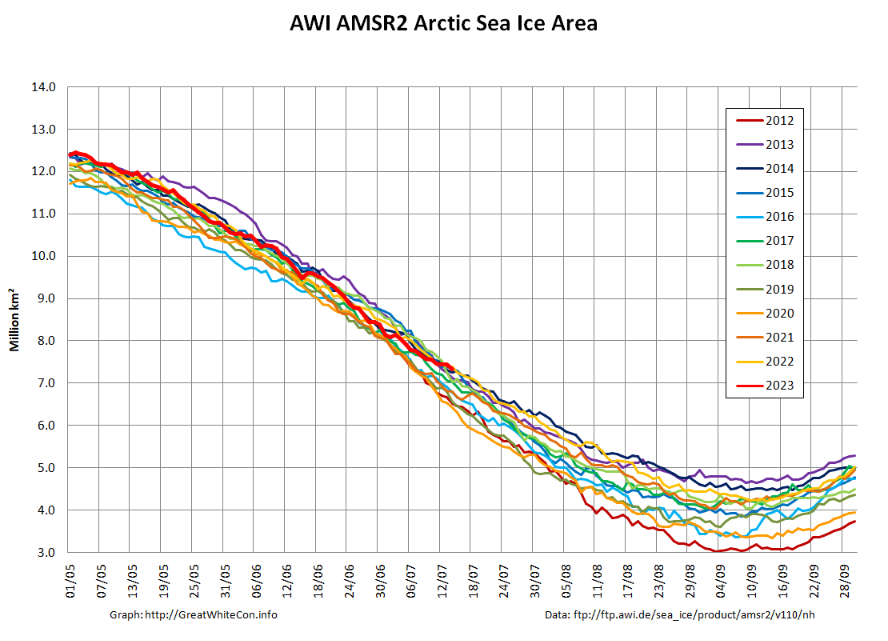
After briefly being near the bottom of the historical range at the beginning of the month, AWI’s high resolution AMSR2 area metric is now back near the top of that range:
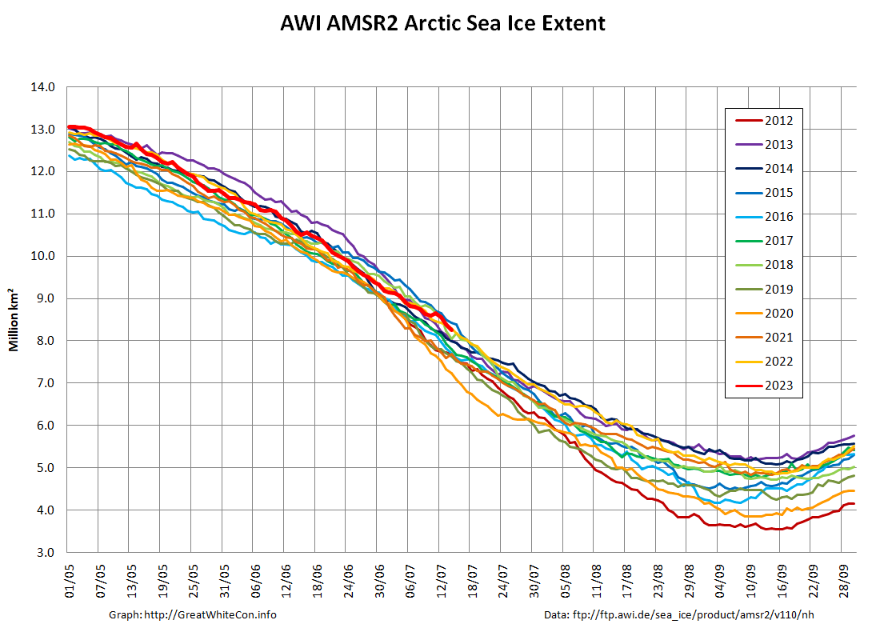
However, although it’s not visible on the area graph extent has recently taken a bit of a tumble:
Here’s an animation showing the motion of sea ice in the Arctic over the last month:
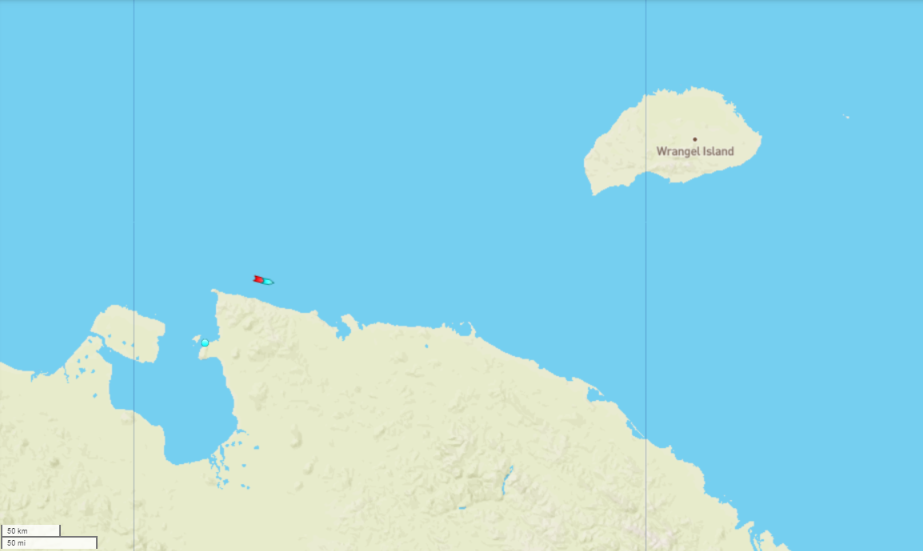
Data from the Northern Sea Route General Administration web site about the current positions of ships voyaging along the Northern Sea Route reveal that the liquified natural gas carrier Fedor Litke is currently following the icebreaker Sibir through the East Siberian Sea, heading for the Bering Strait:
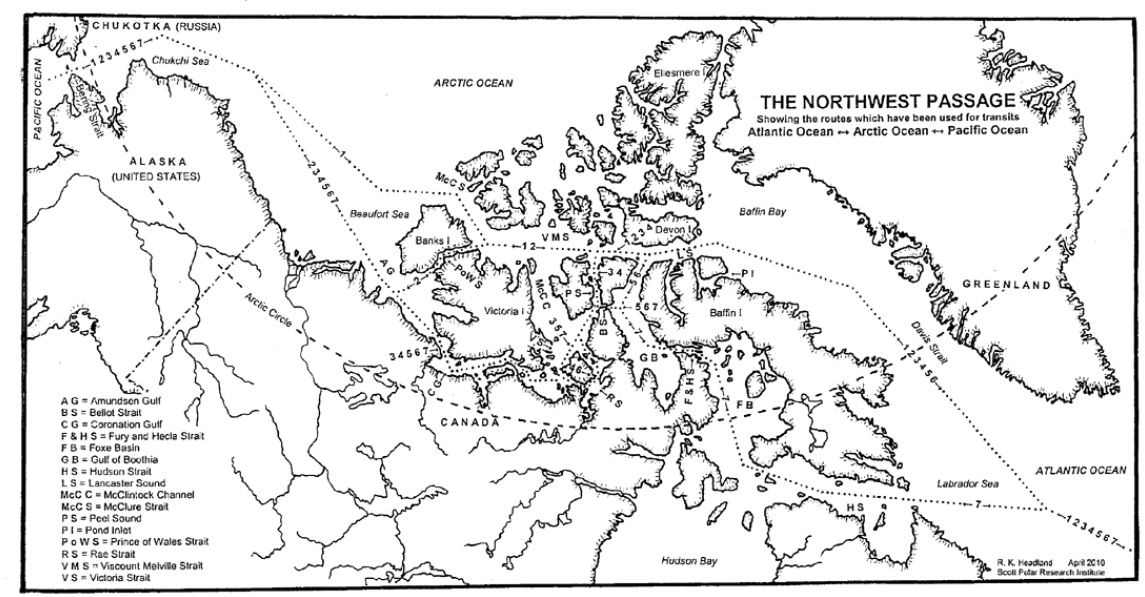
Prompted by a comment by Tom in the June open thread, the time has evidently come to open the 2023 Northwest Passage passage thread. First of all let’s get our bearings with the help of this map of the area:
and another map detailing the routes through Canadian Arctic Archipelago that have previously been successfully traversed:
As our starter for ten for 2023, there is already plenty of open water in the Amundsen Gulf, together with plenty of melt ponding on the remaining fast ice in Franklin and Darnley Bays:
This website uses cookies to improve your experience. We'll assume you're ok with this, but you can opt-out if you wish. Cookie settingsACCEPT
Privacy & Cookies Policy
Privacy Overview
This website uses cookies to improve your experience while you navigate through the website. Out of these, the cookies that are categorized as necessary are stored on your browser as they are essential for the working of basic functionalities of the website. We also use third-party cookies that help us analyze and understand how you use this website. These cookies will be stored in your browser only with your consent. You also have the option to opt-out of these cookies. But opting out of some of these cookies may affect your browsing experience.
Necessary cookies are absolutely essential for the website to function properly. This category only includes cookies that ensures basic functionalities and security features of the website. These cookies do not store any personal information.
Any cookies that may not be particularly necessary for the website to function and is used specifically to collect user personal data via analytics, ads, other embedded contents are termed as non-necessary cookies. It is mandatory to procure user consent prior to running these cookies on your website.