Our regular reader(s) may recall our extended coverage on the plucky little yacht Northabout‘s ultimately successful attempt to circumnavigate the Arctic Ocean in the summer of 2016?
Many were the skeptics who said she stood no chance of finding a way through some “thick sea ice” apparently blocking her path across the Laptev Sea, but they were proved wrong:
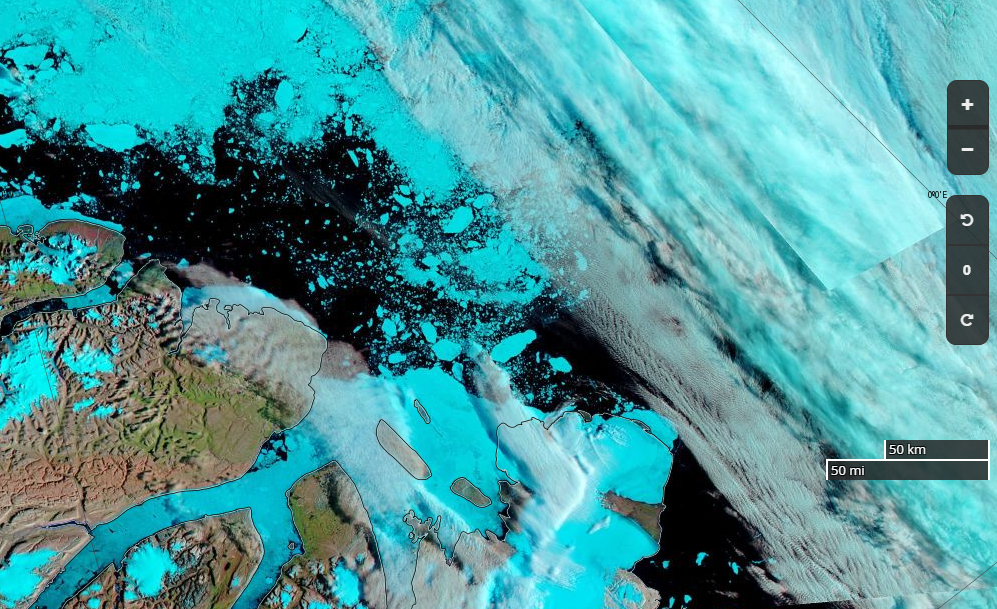
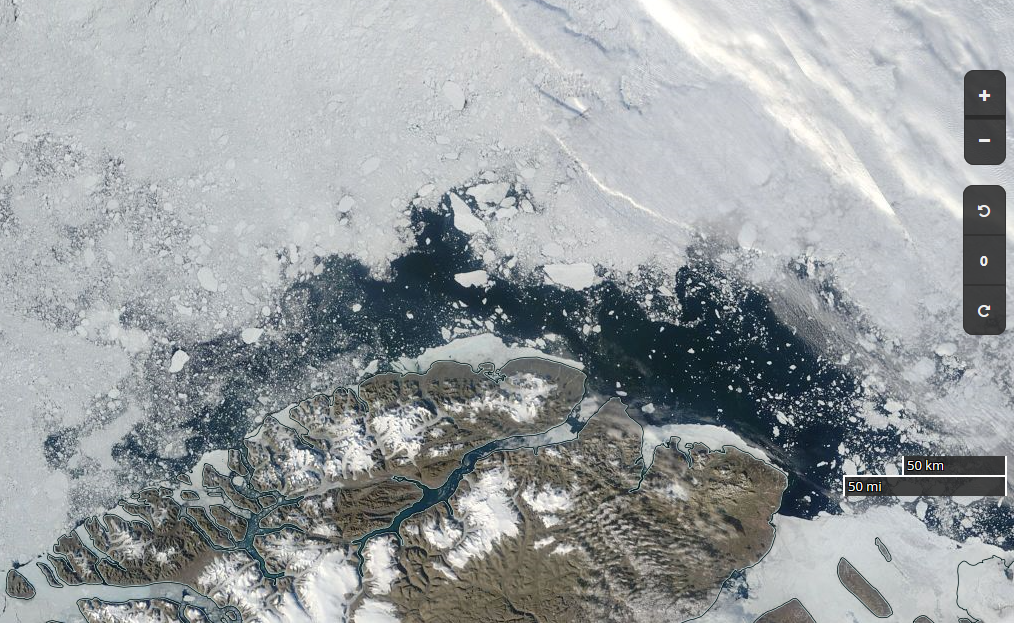
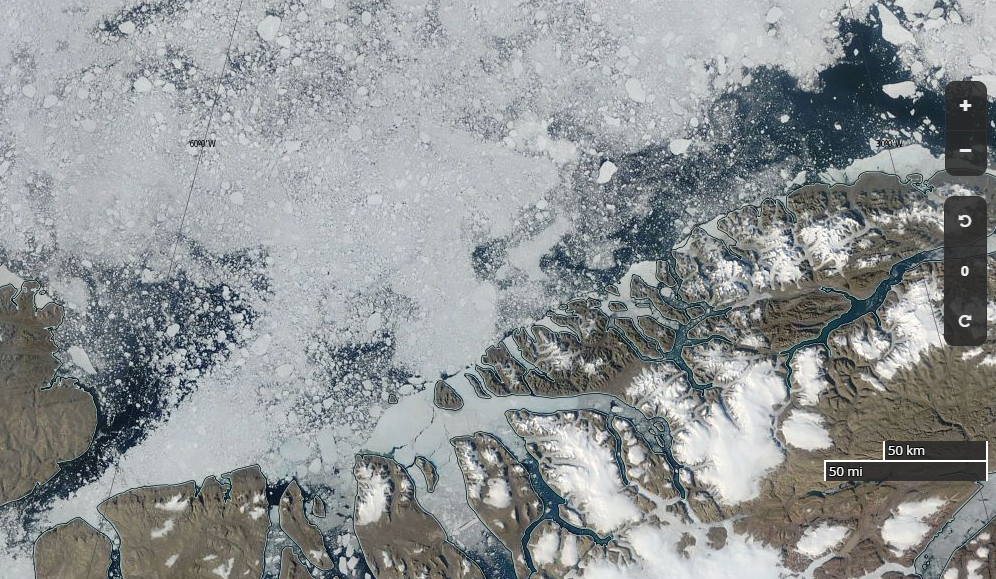
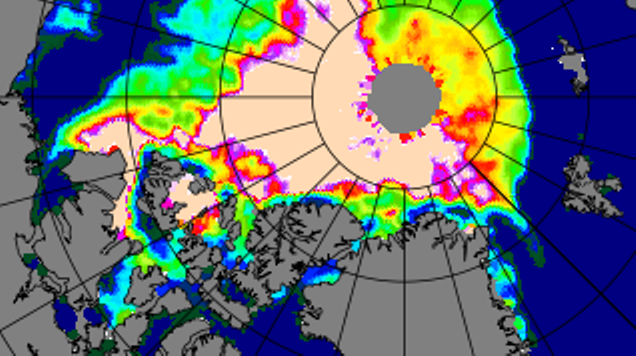
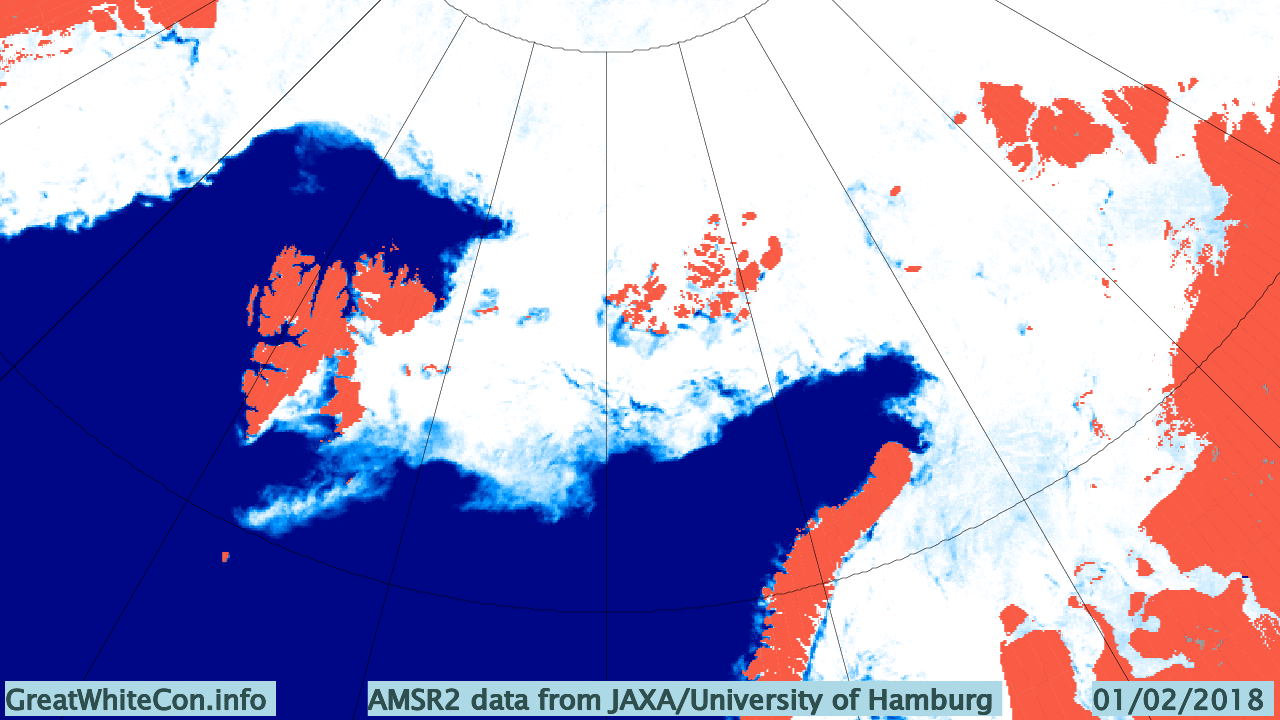
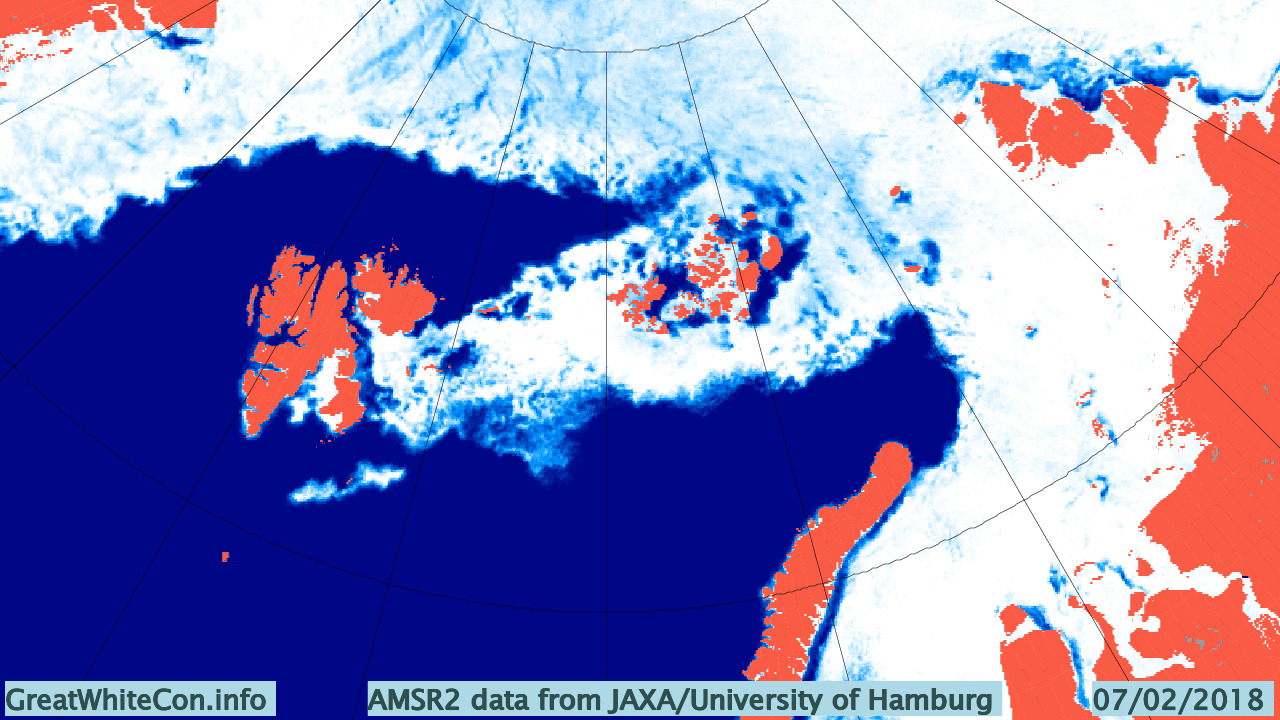
As a thought experiment in the summer of 2018 we’re now thinking the unthinkable. If she put her mind to it could Northabout circumnavigate Greenland in 2018? Let’s take a look at the evidence shall we? The allegedly “oldest, thickest Arctic sea ice” north of Greenland isn’t there any more this summer:
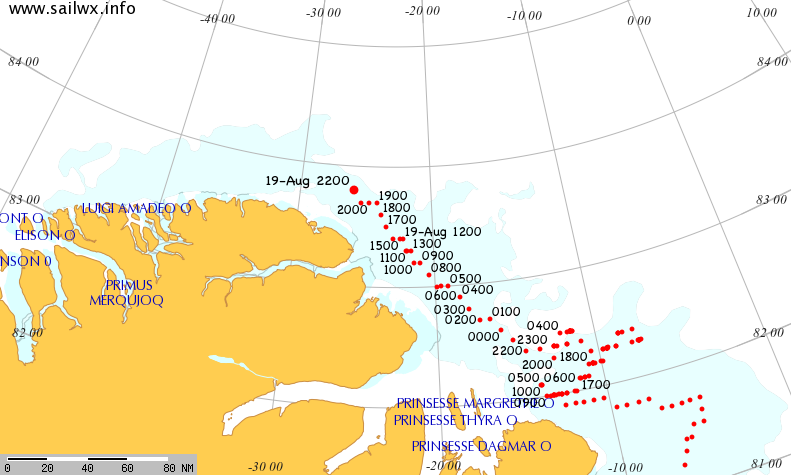
The research icebreaker Polarstern has already inspected the open waters off Kap Morris Jesup, the most northerly tip of Greenland:
What’s more the waters of the Lincoln Sea currently look no more tricky to traverse than the Laptev Sea in August 2016:
In conclusion, for the moment at least, what’s the theoretical solution to our 2018 thought experiment?
Here’s another thought to ponder as well. I don’t suppose it’s in the Alfred Wegener Institute’s PS115 mission plan, but do you suppose Polarstern could circumnavigate Greenland at the moment?
[Edit – August 23rd]
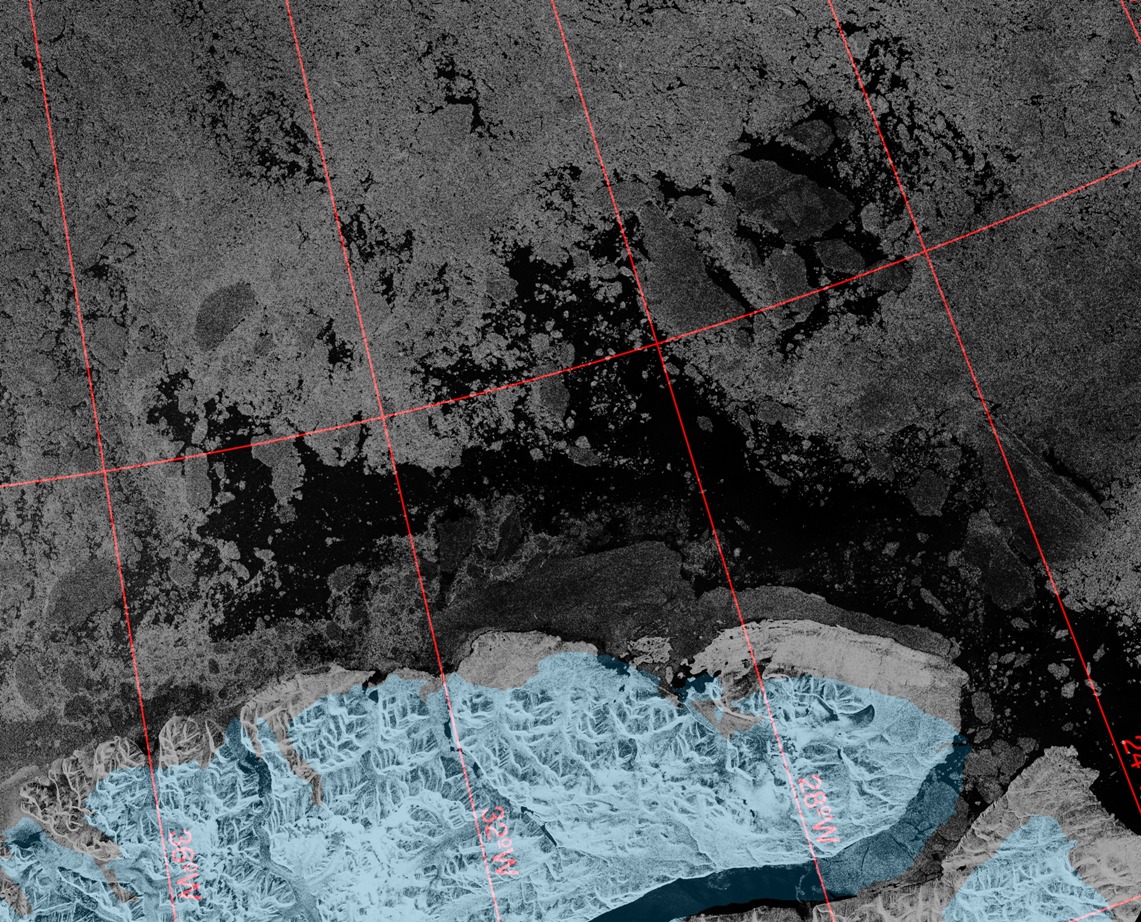
The University of Bremen used not to publish their Arctic sea ice “thinness” maps in summer. However now they do, so here’s a close up of Northern Greenland for August 22nd:
[Edit – August 26th]
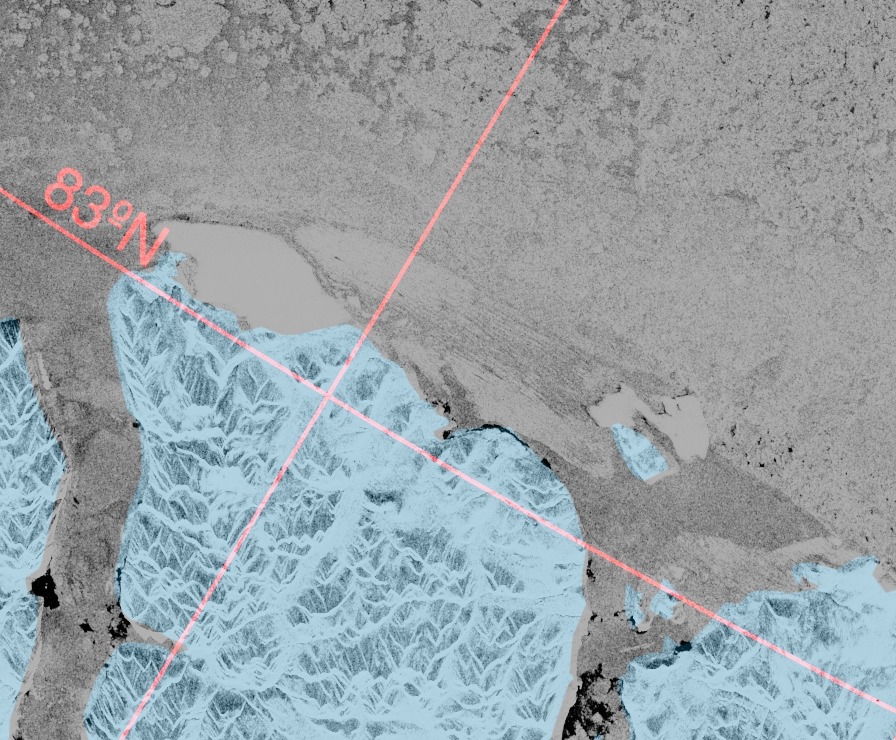
First of all here’s one of our occasional sea ice motion videos:
This one reveals the open water north of Greenland in February as well as the much longer event in August. Next here’s a Sentinel 1B synthetic aperture radar image of the Kap Morris Jesup area from yesterday:
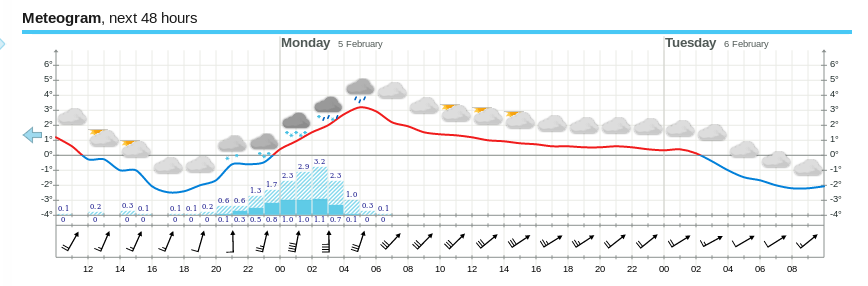
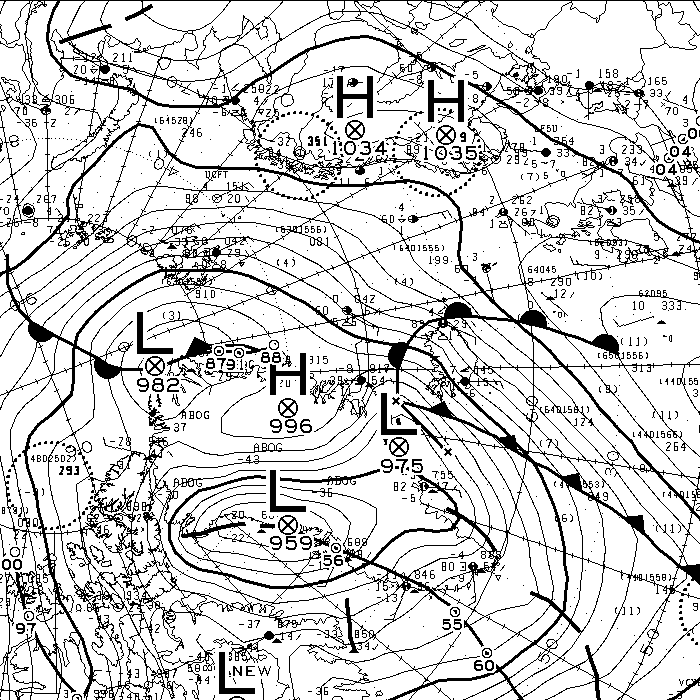
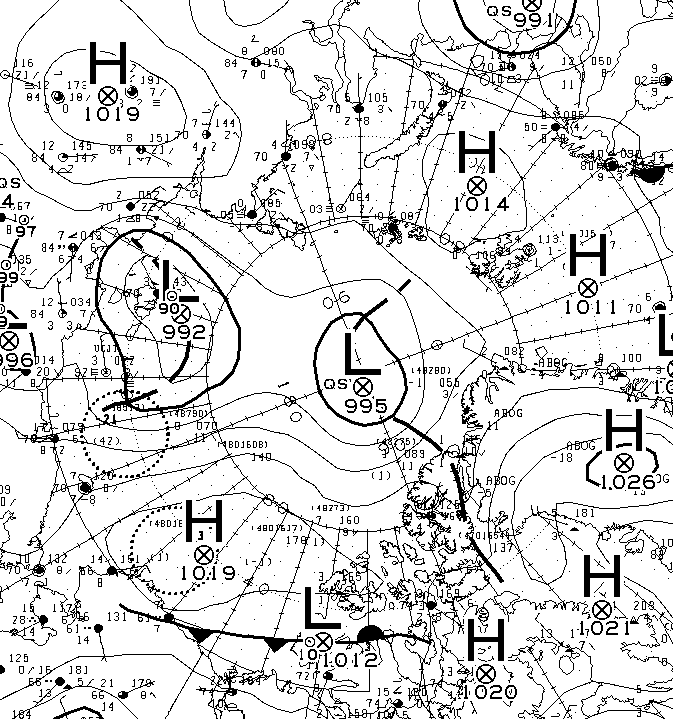
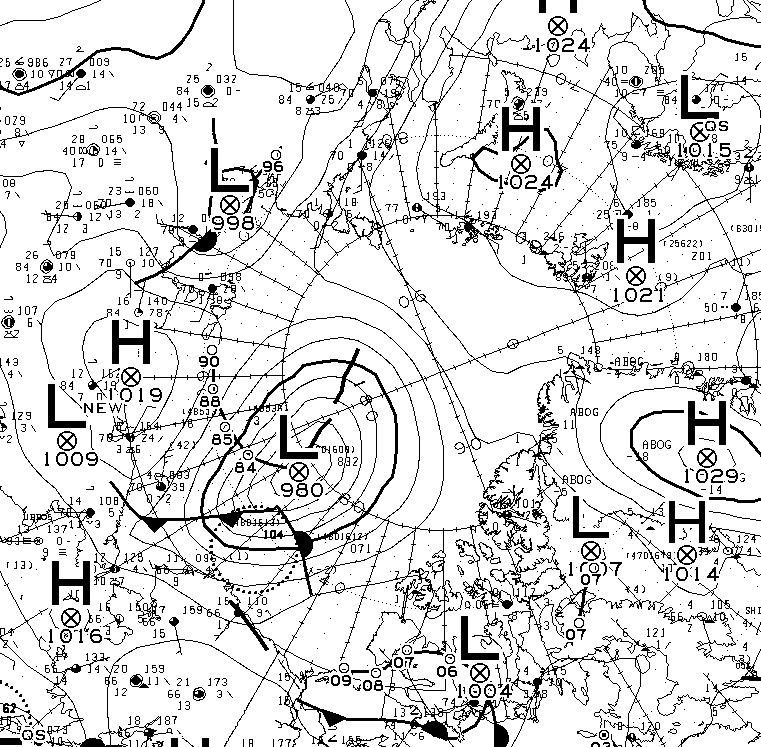
Much like last month, temperatures are above zero and rain is forecast. That’s because once again the current synoptic chart from Environment Canada shows a warm wet flow from way down south over Svalbard and on into the Central Arctic:
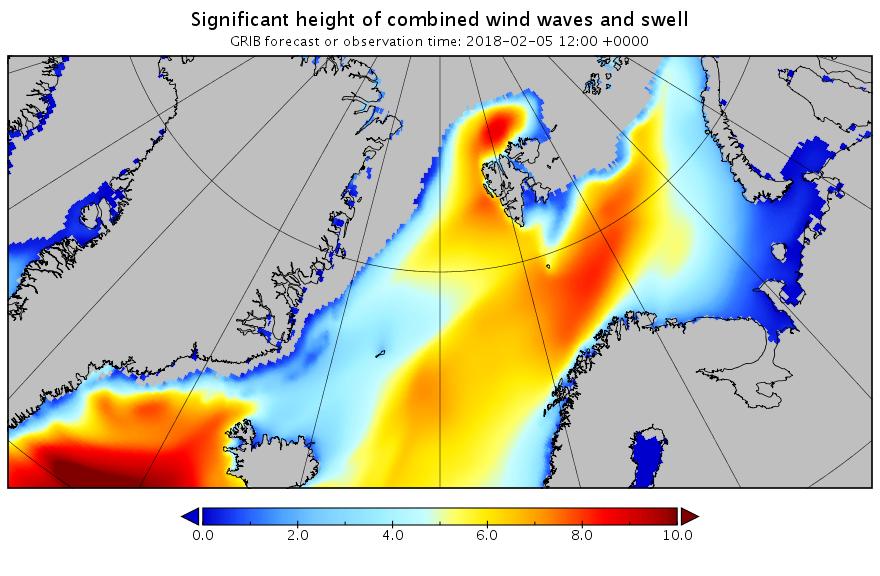
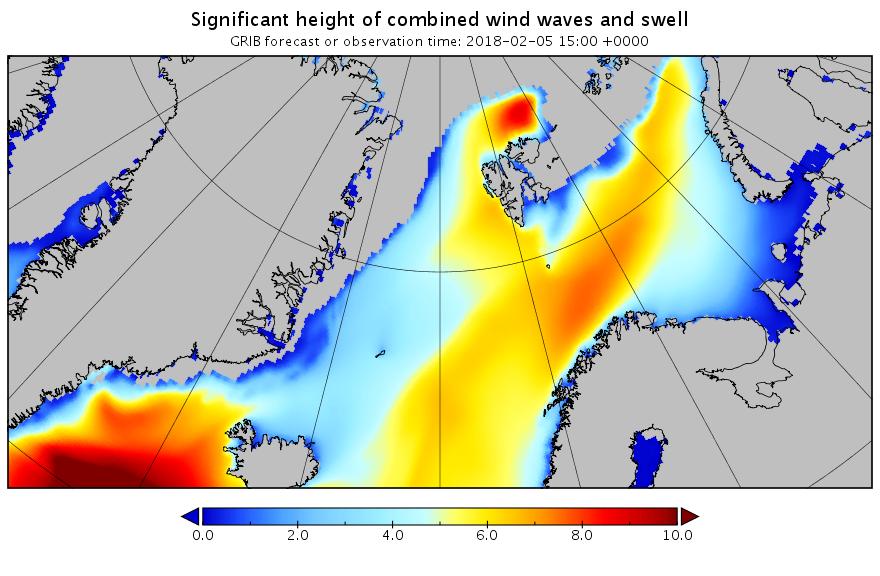
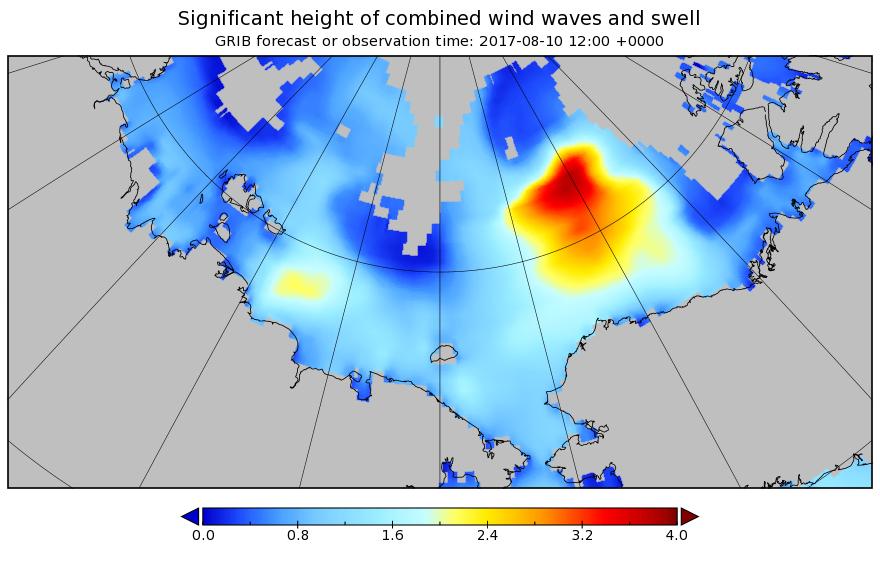
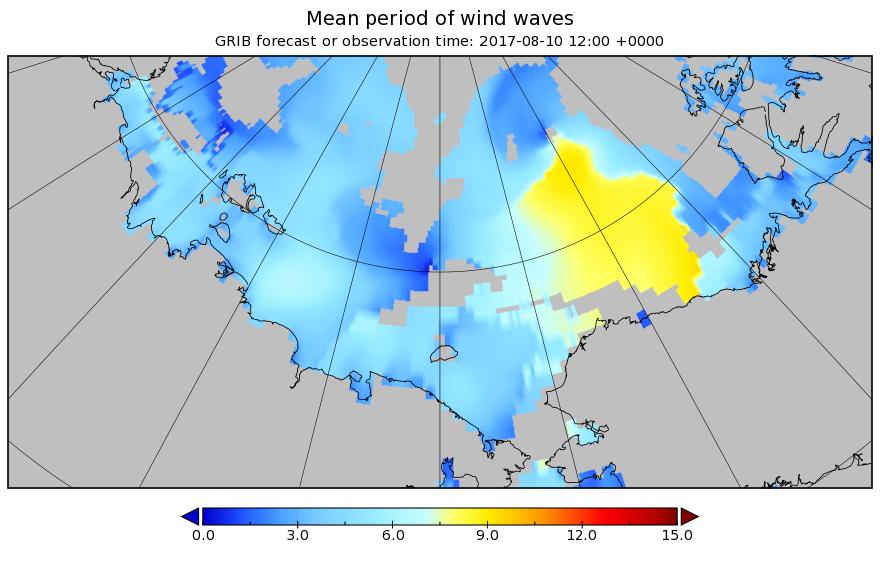
Next here’s the current combined wave and swell height forecast for the Svalbard area:
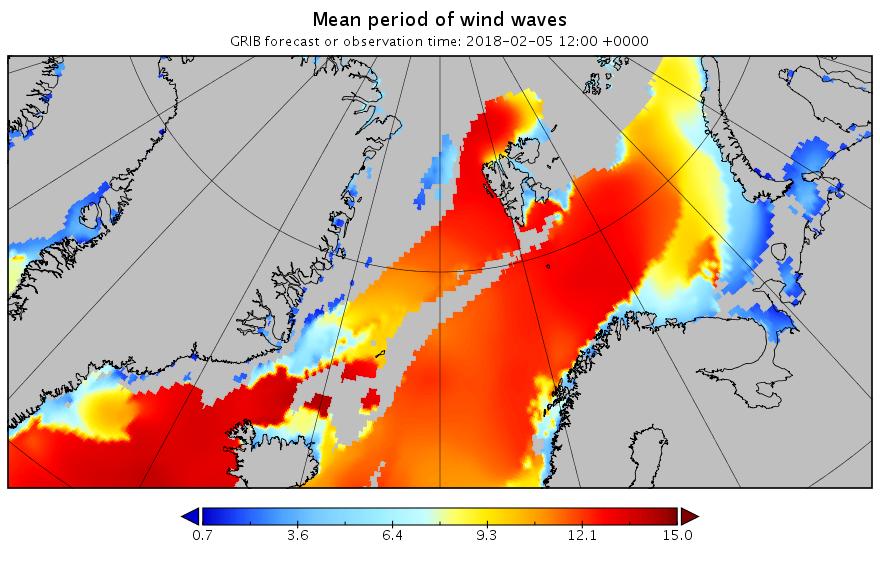
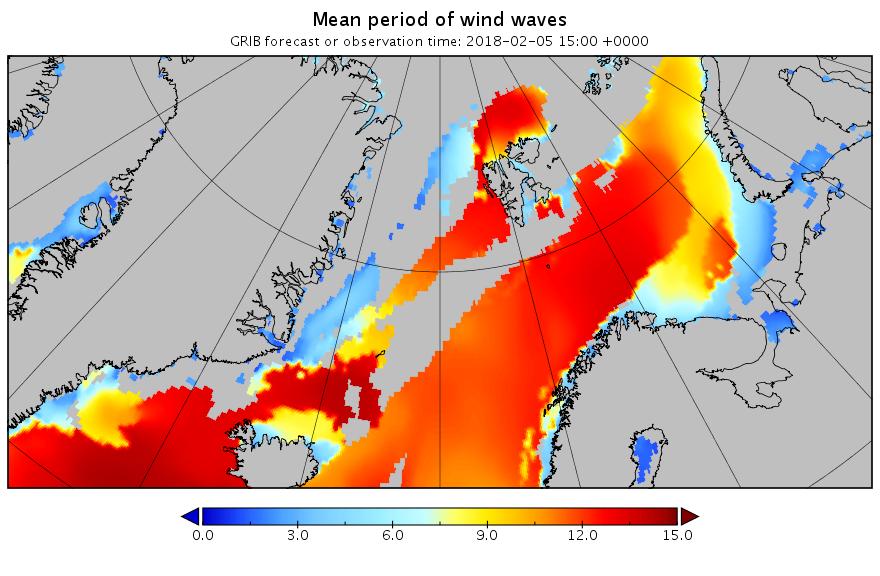
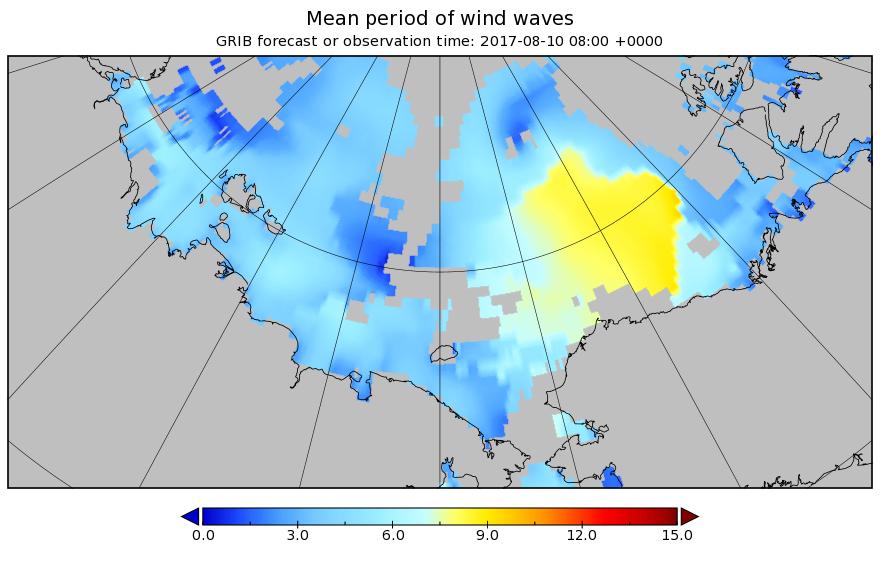
and here’s the associated wave period forecast:
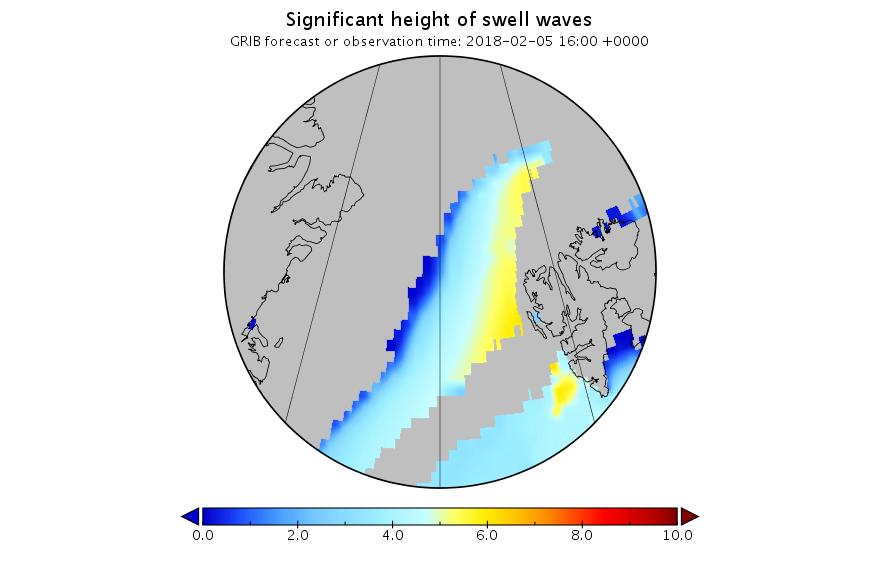
It’s still showing 10 meter waves with a 15 second period north of Svalbard tomorrow lunchtime. Somewhat unusually for the Arctic these aren’t merely giant wind waves. Zooming in on the Fram Strait and breaking out the underlying primary swell reveals:
A long distance swell of that magnitude is going to cause some damage.
[Edit – February 5th]
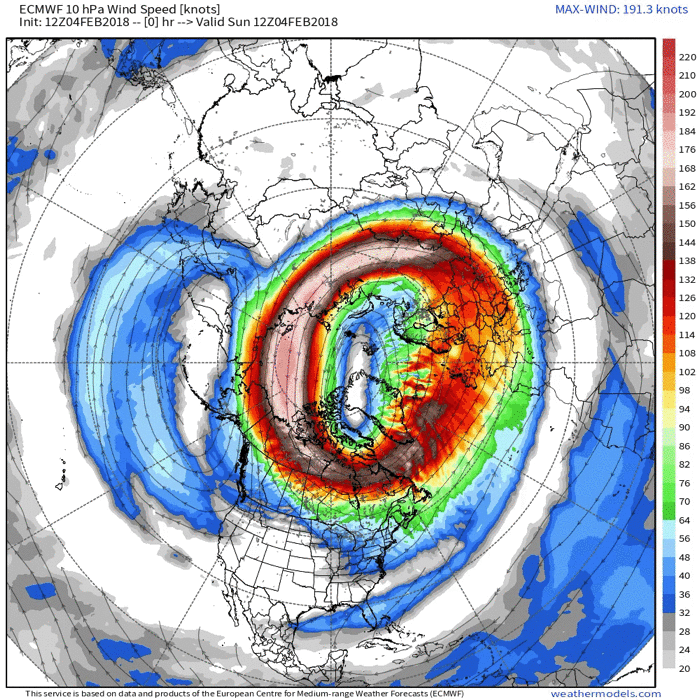
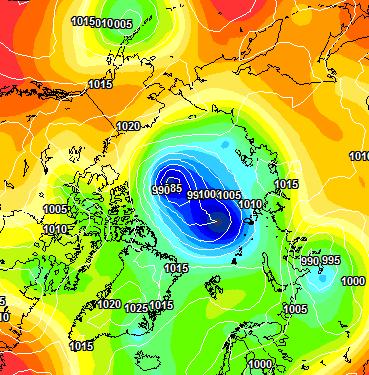
The current ECMWF forecast for a split polar vortex, courtesy of Ice Shieldz on the Arctic Sea Ice Forum:
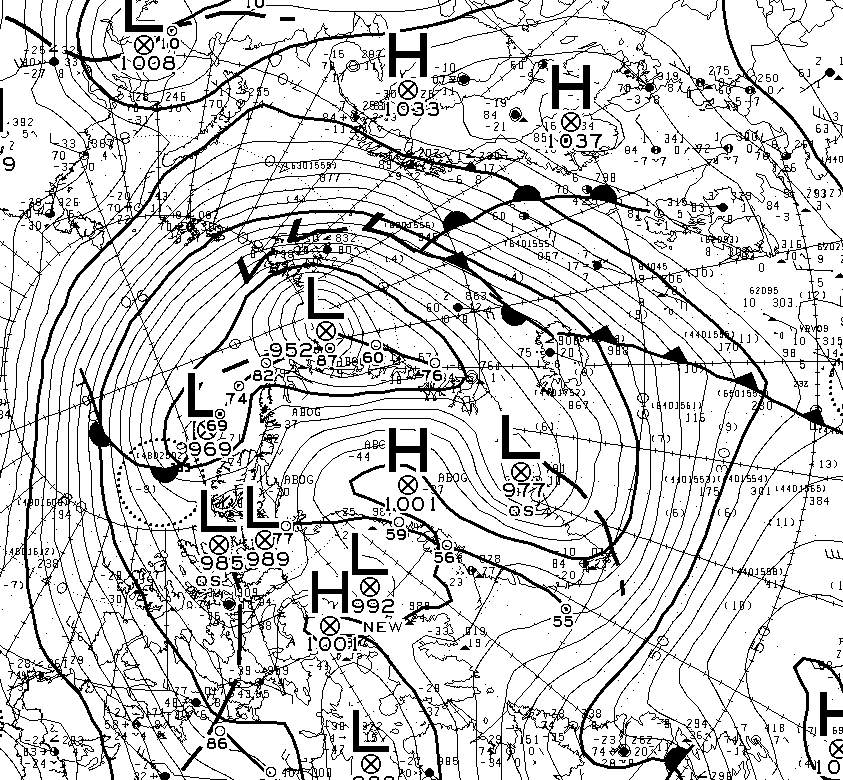
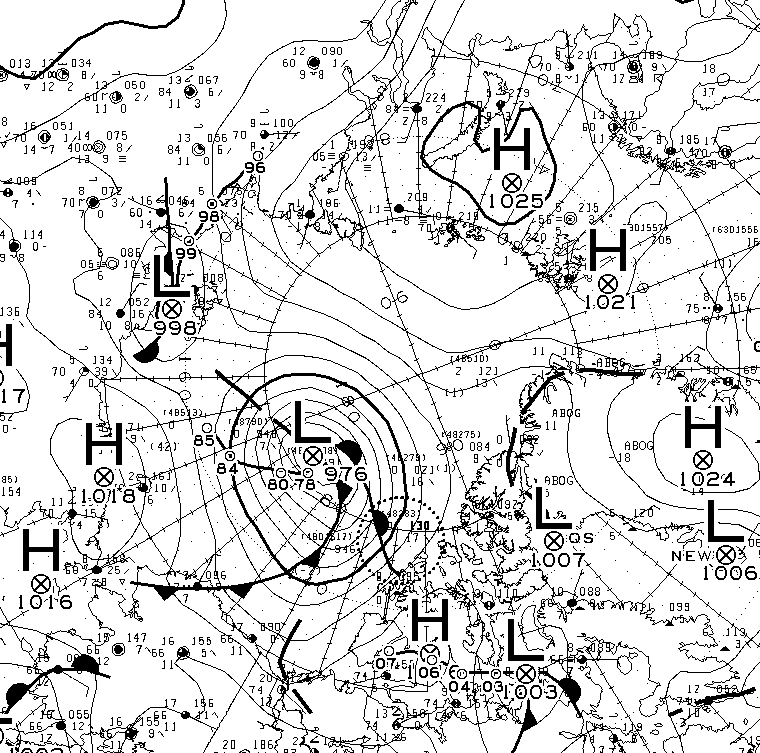
This is suggestive of more cyclones to come, but sticking with the current one for now, here is the MSLP chart at 00:00 UTC this morning showing the cyclone’s central pressure has dropped to 952 hPa:
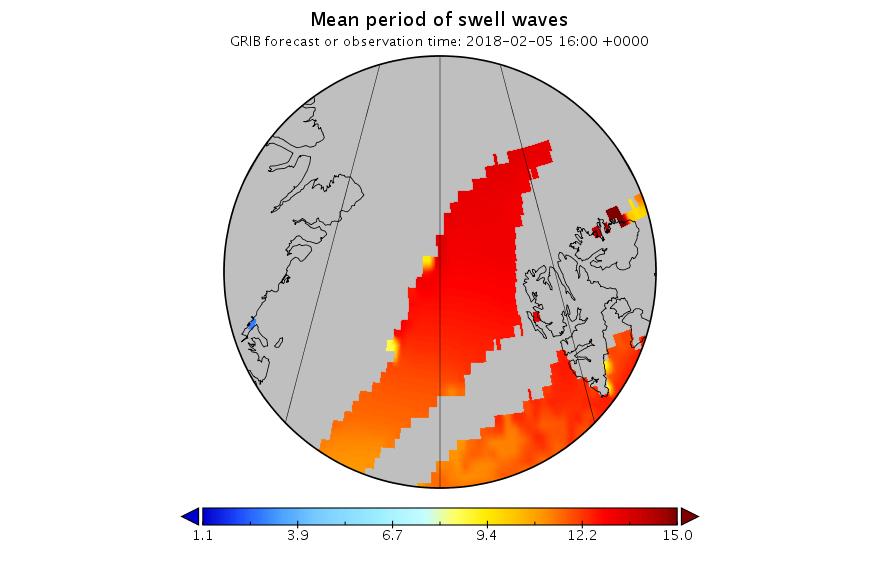
Here too is the current WaveWatch III forecast for 15:00 UTC today:
The peak of the swell north of Svalbard is now slightly later than originally forecast, but it’s still enormous!
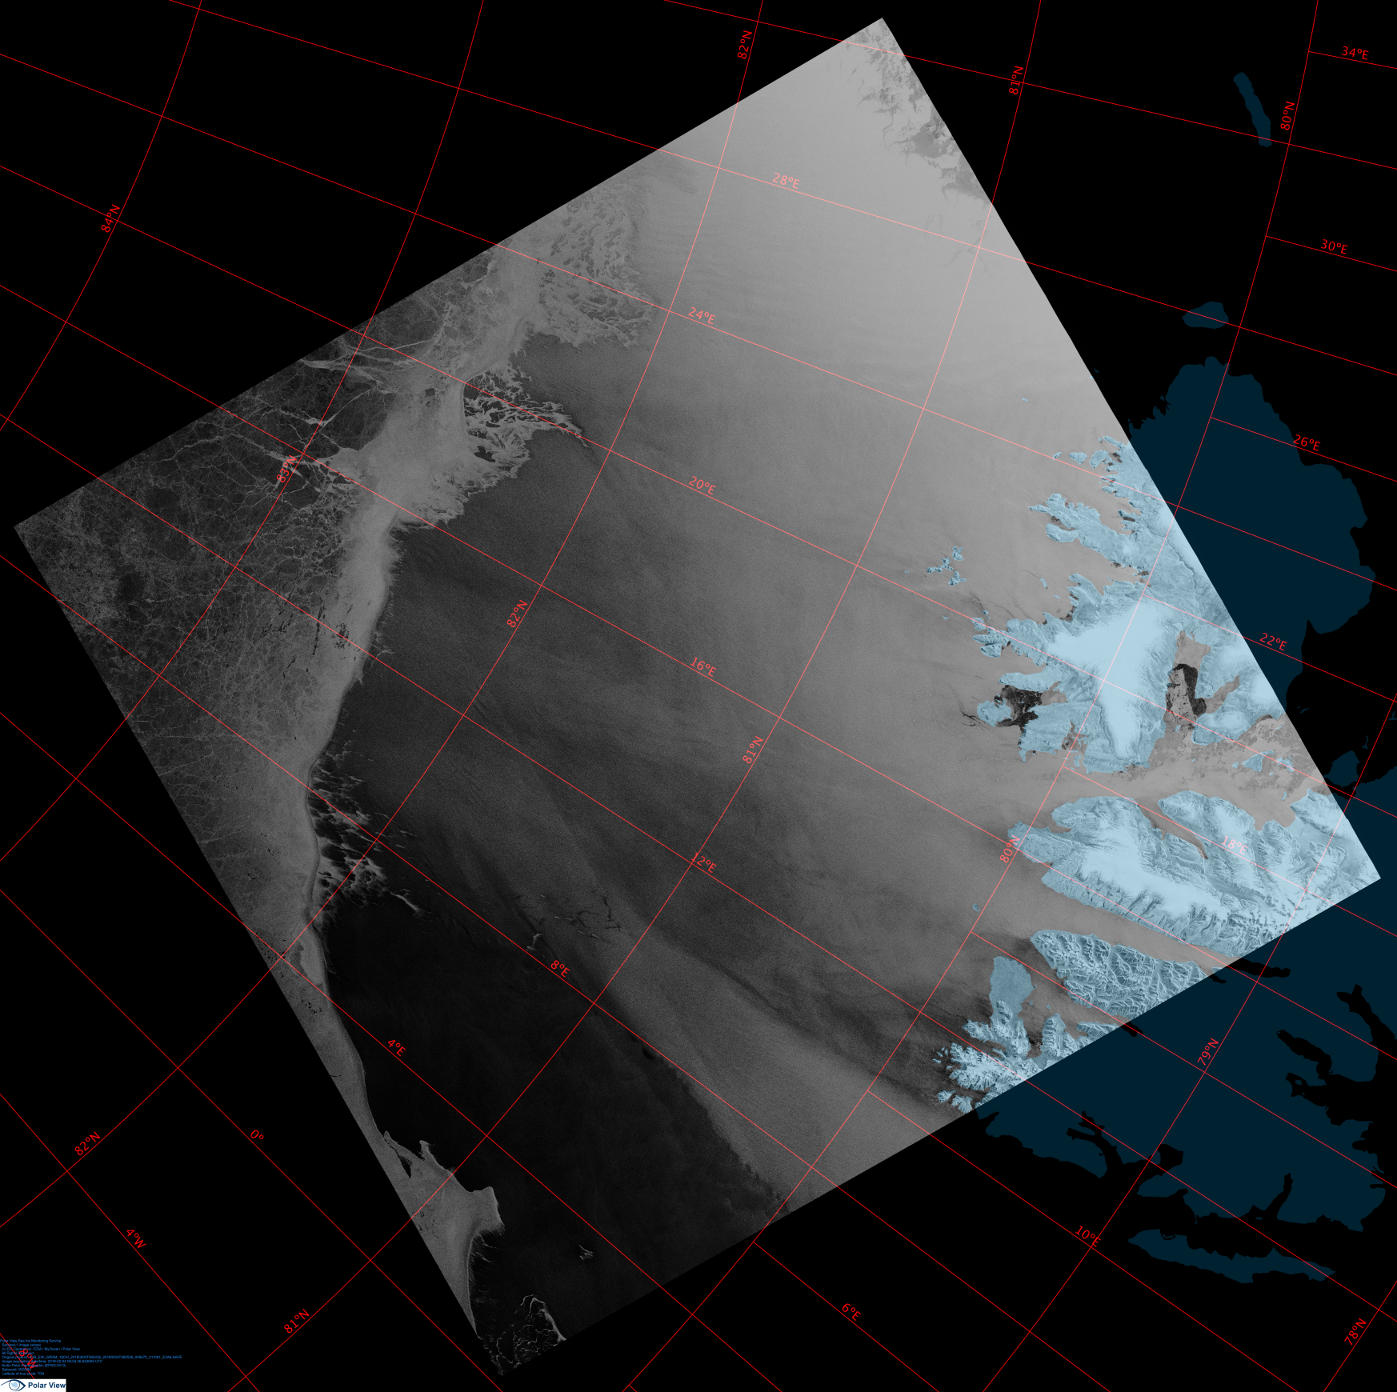
Here’s a single Sentinel 1B synthetic aperture radar image that captures the position of the ice edge north of Svalbard yesterday quite nicely:
[Edit – February 7th]
A brief overview of the effect of the recent cyclone on the sea ice in the Arctic via AMSR2:
Click the image to animate it.
[Edit – February 8th]
An Arctic wide take via Thomas Lavergne on Twitter:
Your daily update on the "big low entering #SeaIce". The "spin" in motion moves East towards Severnaya Zemlya. Some opening from land there, increased flushing through Fram Strait. pic.twitter.com/q4m1CRhmtS
An interesting insight into CryoSat-2 sea ice thickness measurements from Stefan Hendricks on Twitter:
Radar altimetry tells you how far the surface waves penetrate into the #seaice cover. Unfortunetaly via a bias in #Cryosat freeboard information. 😉 pic.twitter.com/OxUTcFH94h
GFS wants to keep major #PolarVortex (PV) center over Western Canada after the split and is consistent with predicted westward shift of troughing and #cold across North America but this is not typical following significant PV disruptions. pic.twitter.com/zX7n3rnMpo
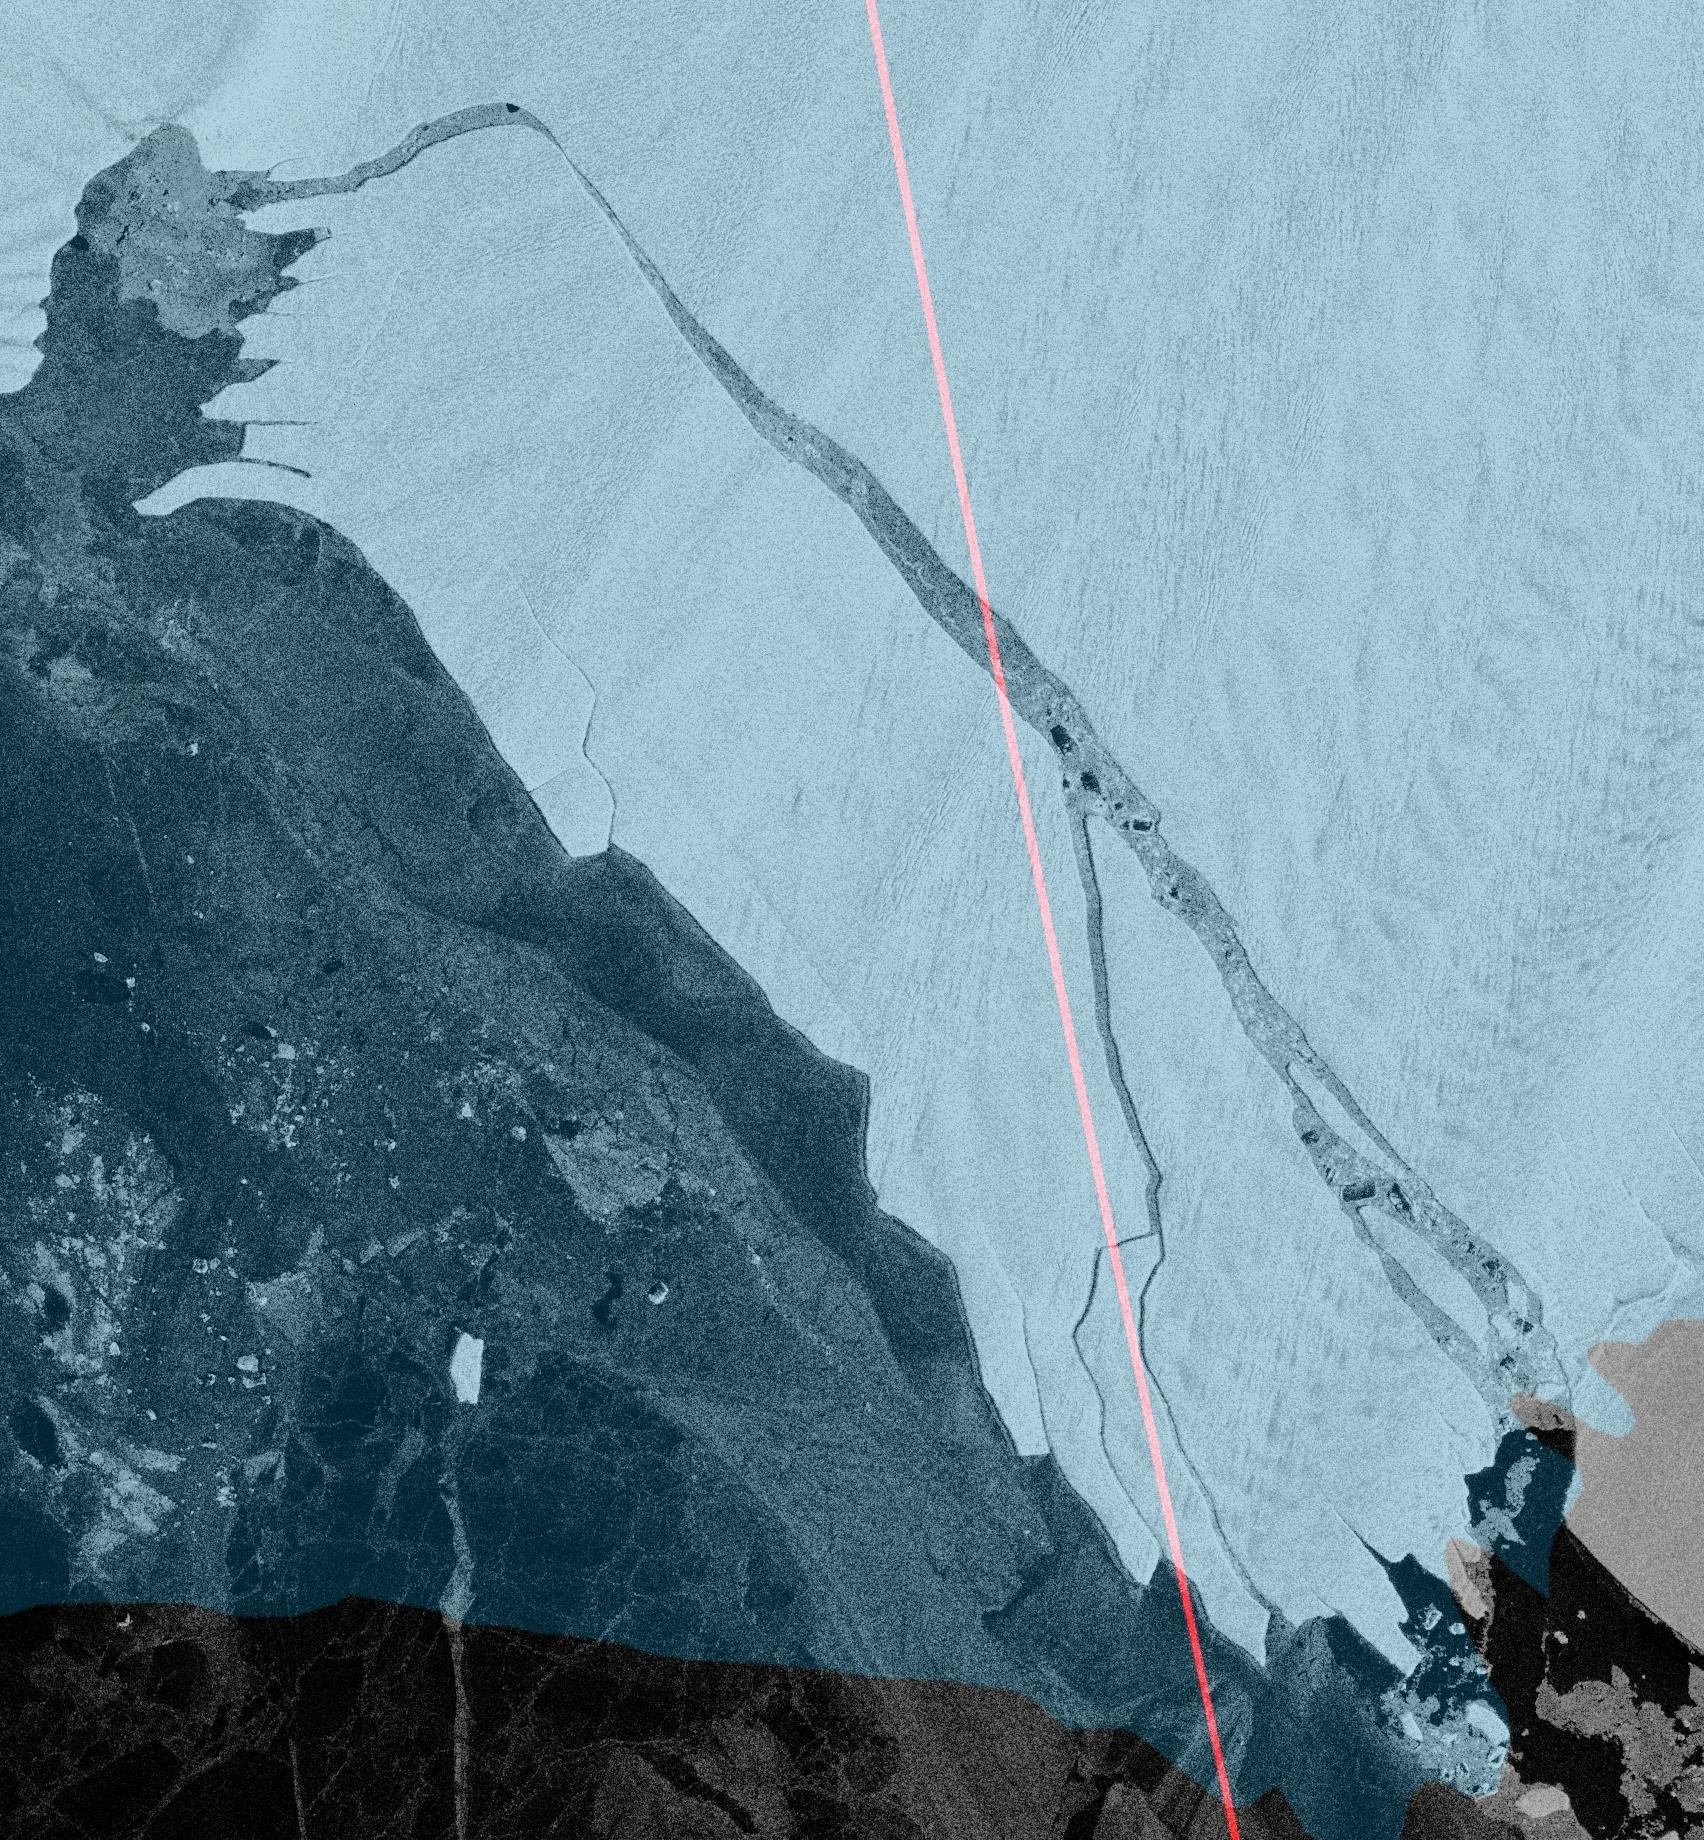
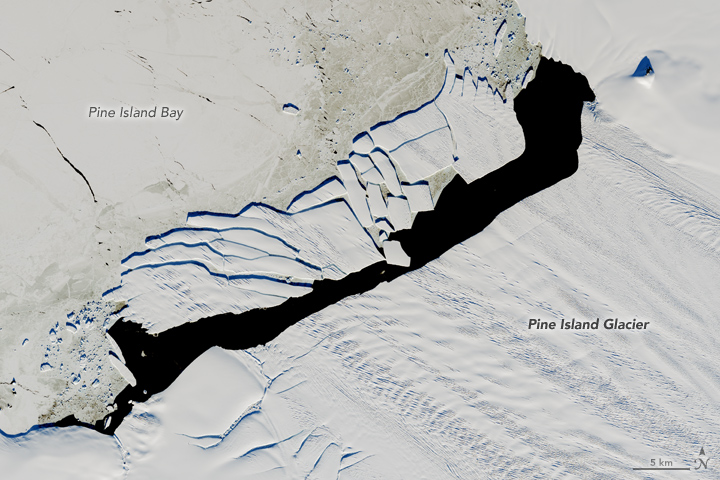
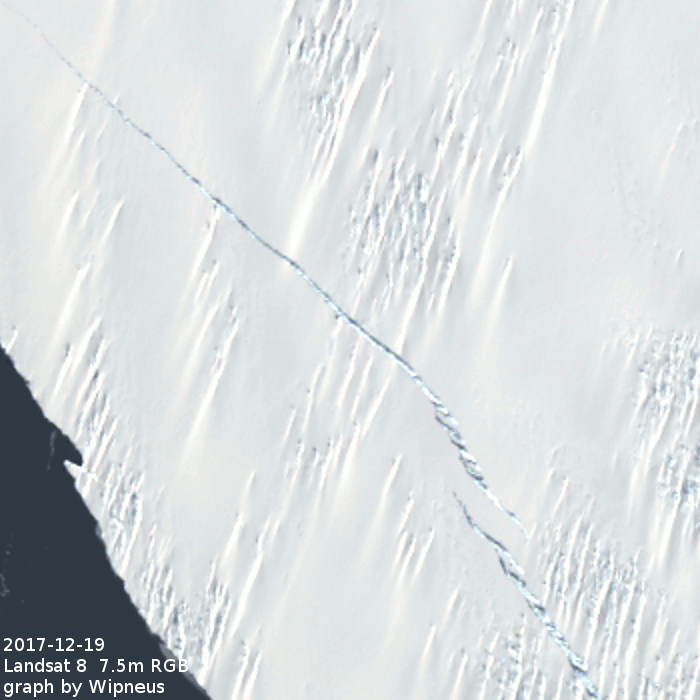
An image captured earlier this morning by the Sentinel 1A satellite’s synthetic aperture radar reveals that another huge chunk of the Pine Island Glacier in Antarctica has broken loose:
.@NASAEarth 's MODIS satellite gives an overview of #PIG's glacier front location since 2009 + corresponding 3 major calving locations 7/n pic.twitter.com/miP1RAUCBF
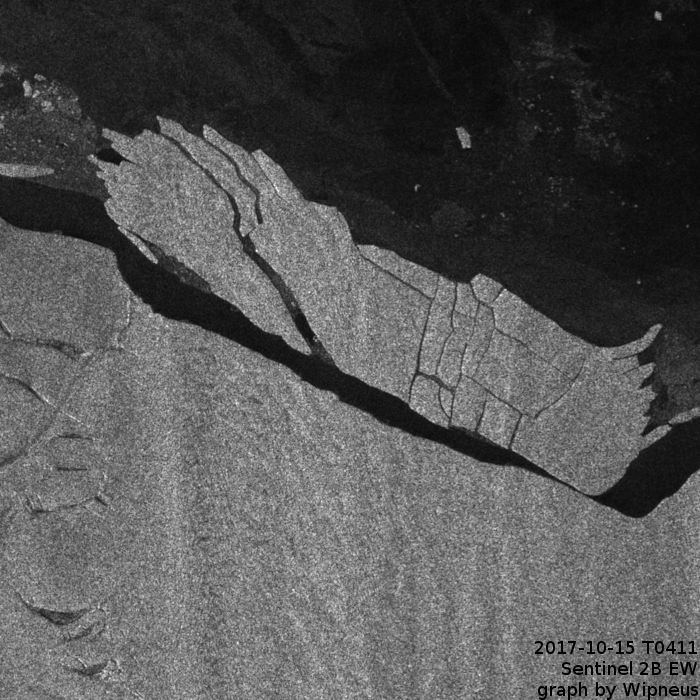
In September 2017, a new iceberg calved from Pine Island Glacier—one of the main outlets where the West Antarctic Ice Sheet flows into the ocean. Just weeks later, the berg named B-44 shattered into more than 20 fragments.
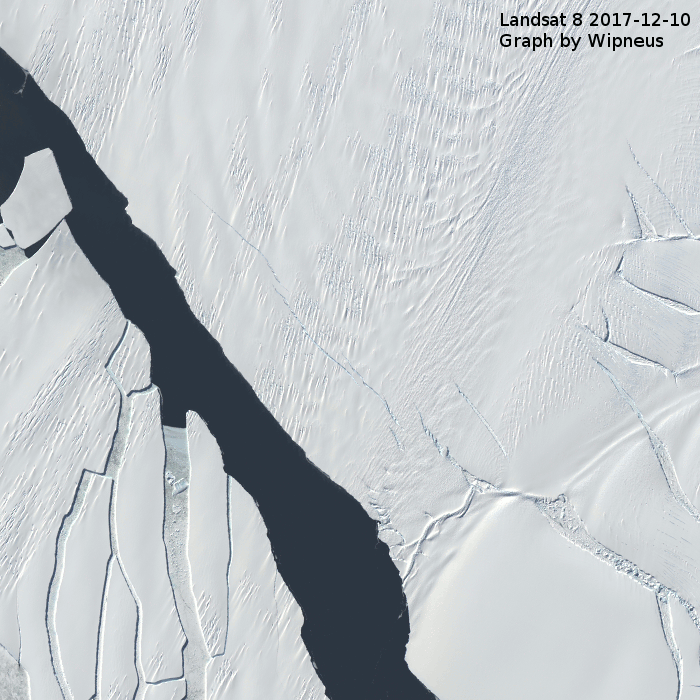
On December 15, 2017, the Operational Land Imager (OLI) on Landsat 8 acquired this natural-color image of the broken berg. An area of relatively warm water, known as a polyna, has kept the water ice free between the iceberg chunks and the glacier front. NASA glaciologist Chris Shuman thinks the polynya’s warm water could have caused the rapid breakup of B-44.
The image was acquired near midnight local time. Based on parameters including the azimuth of the Sun and its elevation above the horizon, as well as the length of the shadows, Shuman has estimated that the iceberg rises about 49 meters above the water line. That would put the total thickness of the berg—above and below the water surface—at about 315 meters.
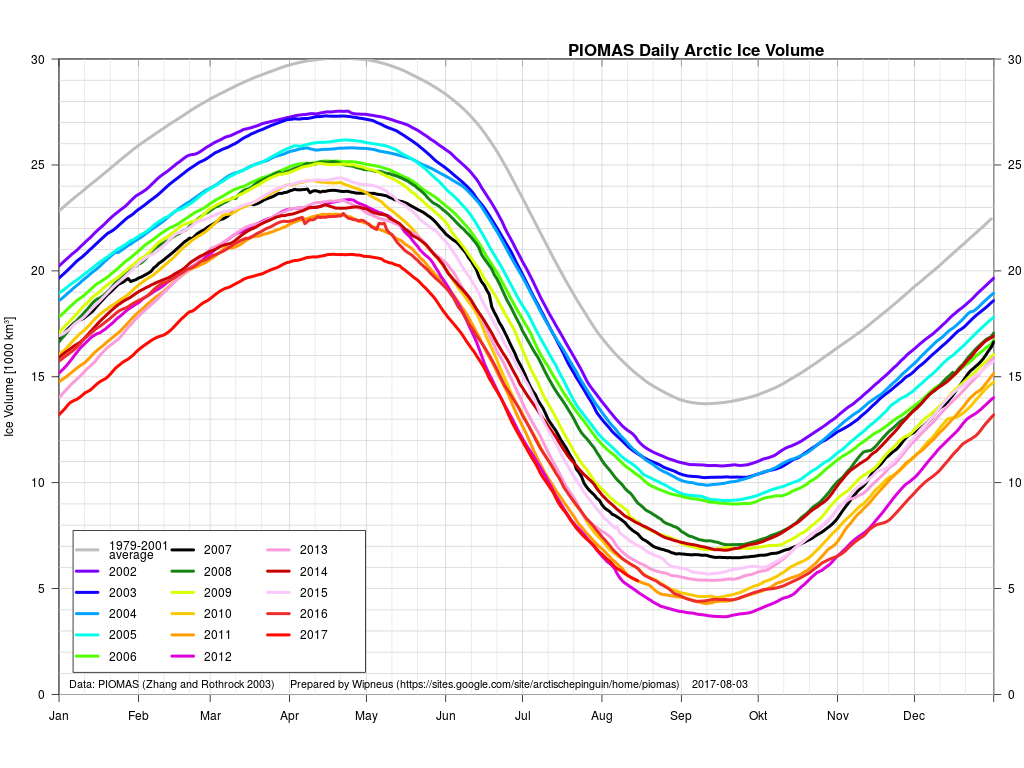
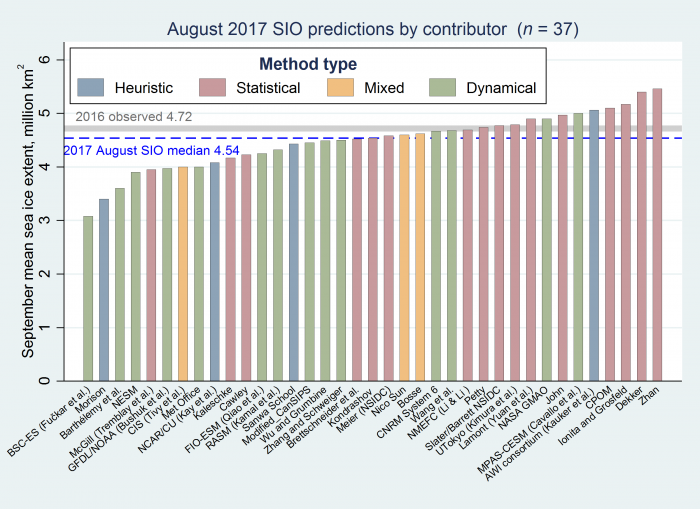
What seems likely to be the most interesting period of the 2017 Arctic sea ice melting season is upon us! The PIOMAS gridded data hasn’t been released yet, but the overall volume numbers reveal that 2017 has now relinquished its “lowest ever” position to 2012. Here’s Wipneus’ graph of the volume data:
plus his anomaly plot:
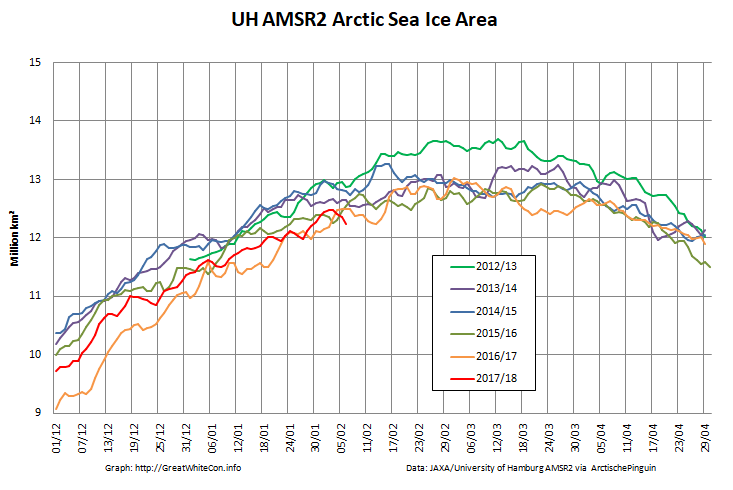
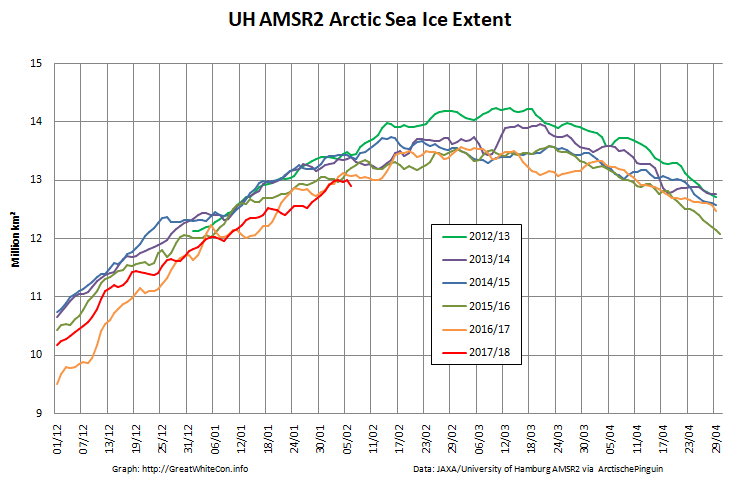
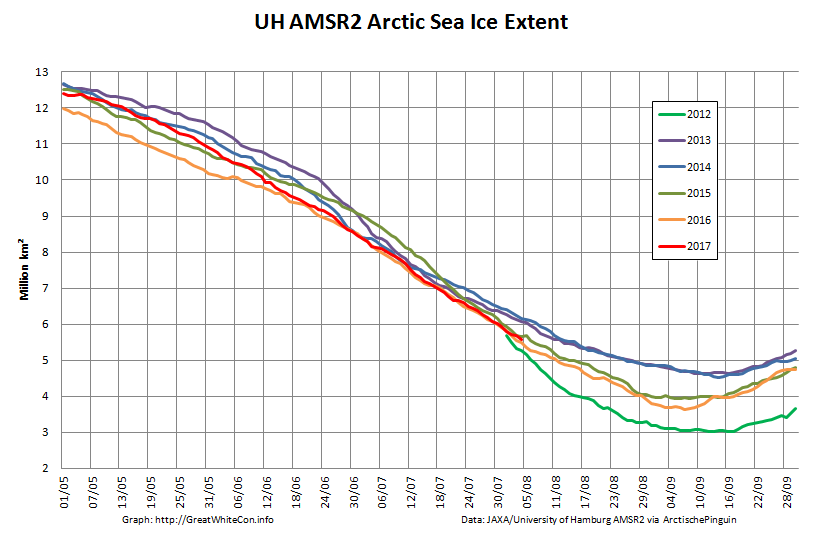
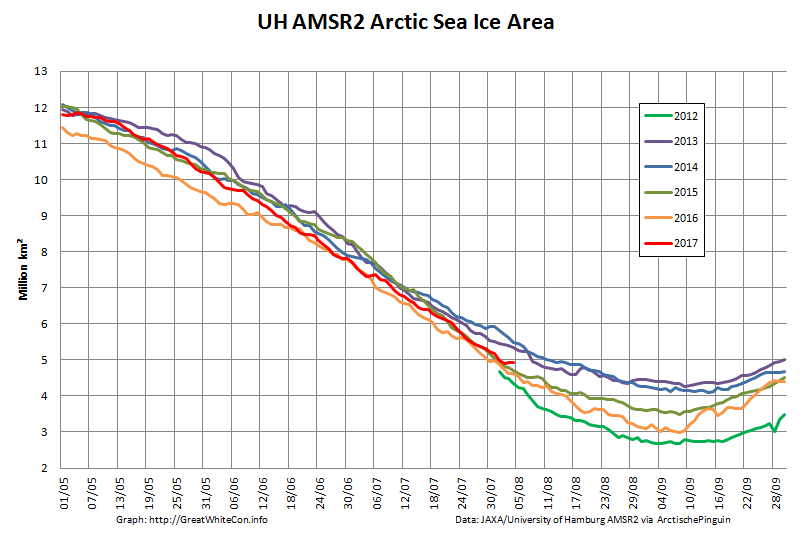
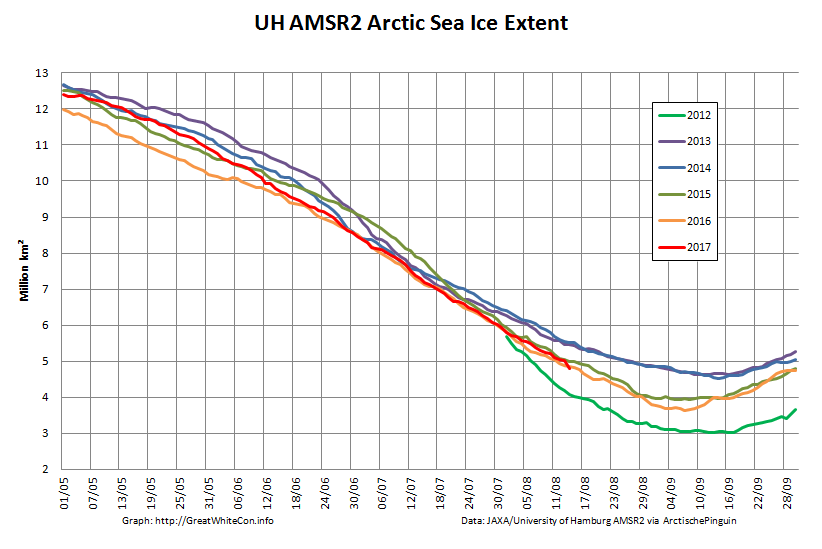
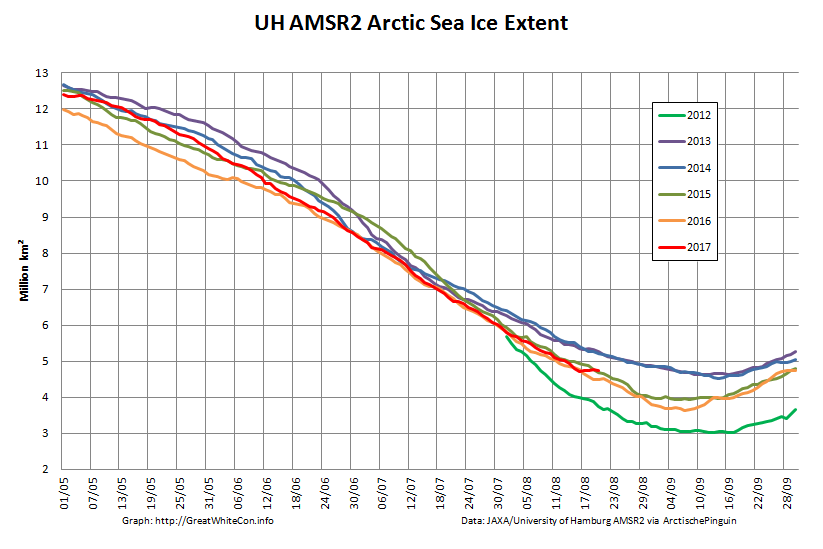
Our favourite high resolution AMSR2 area and extent graphs now also allow comparison with 2012. Here’s how they look at the moment:
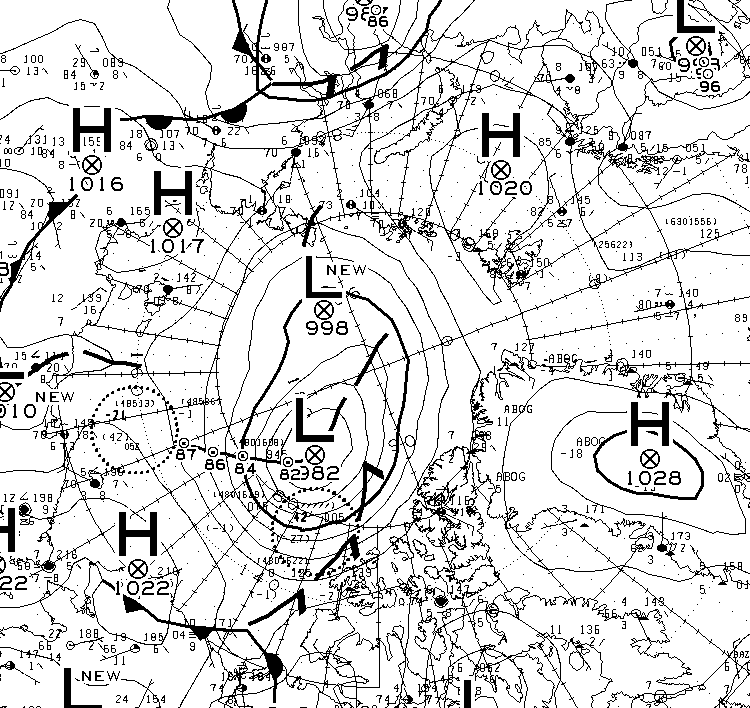
As you can see, round about now is when 2012 Arctic sea ice extent started to noticeably race ahead of the rest of the pack. Will 2017 follow suit? Are there any Arctic cyclones on the horizon for example? Well, the one forecast for August 4th hasn’t materialised. Here’s this morning’s Environment Canada synopsis:
However both ECMWF and GFS agree that a sub 985 hPa storm should have arrived by Sunday morning. Here’s the ECMWF version from MeteoCiel:
There’s stronger storms in the forecast further out, but once again we’ll believe them if and when we see them!
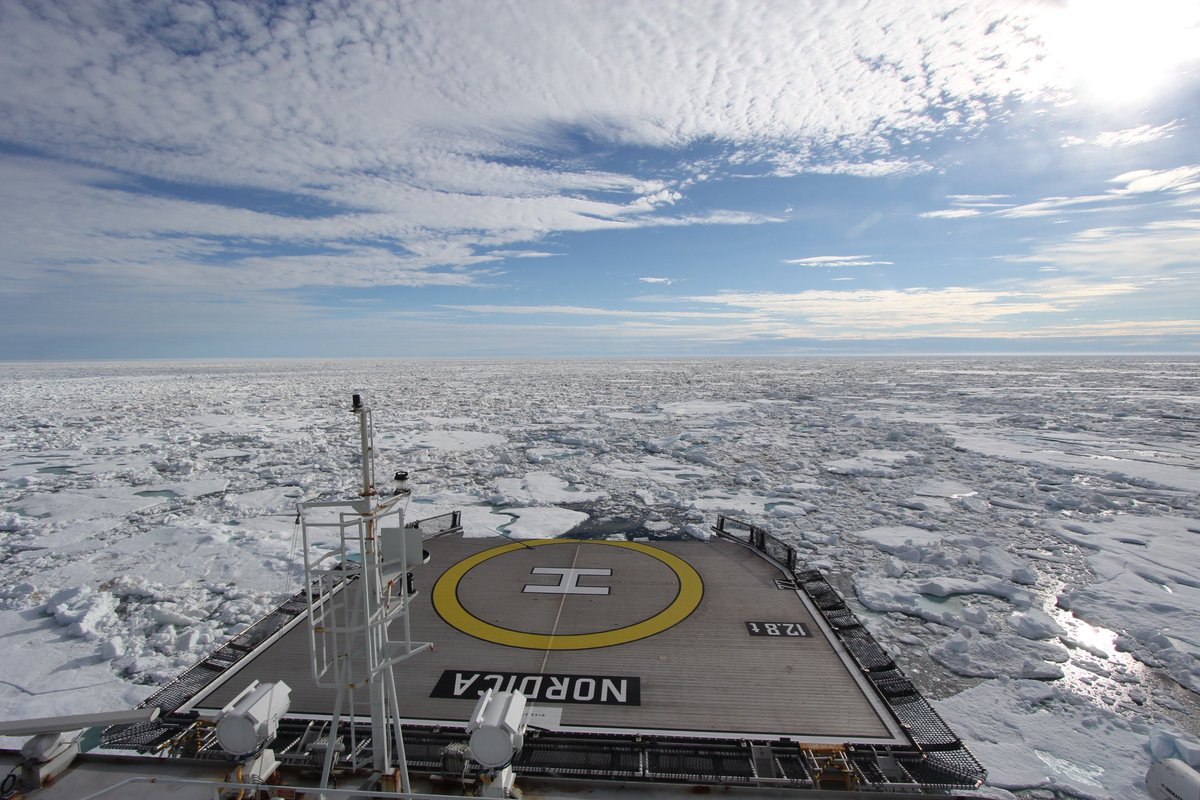
We’re keeping a close eye on the Northwest Passage once again this year. Most of the southern route is open already, but as we predicted the old ice in Larsen Sound has a lot of melting still to do. Here’s how it looked from the icebreaker Nordica a few days ago:
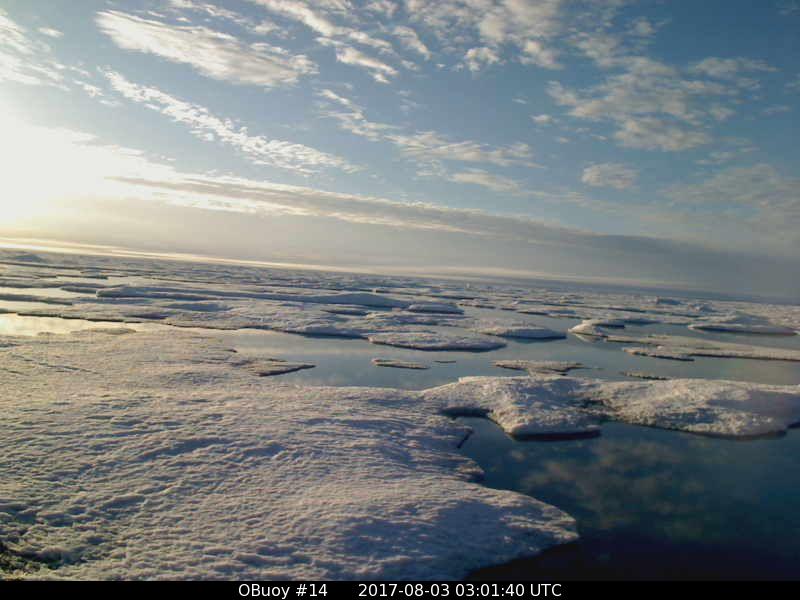
On top of that the old ice around O-Buoy 14 is currently rushing south down the McClintock Channel to replenish it. Here’s how that looks at the moment:
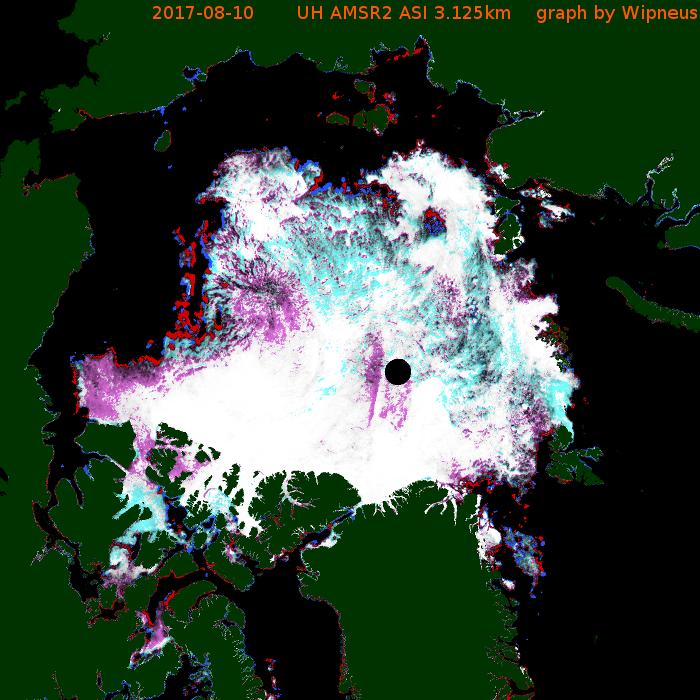
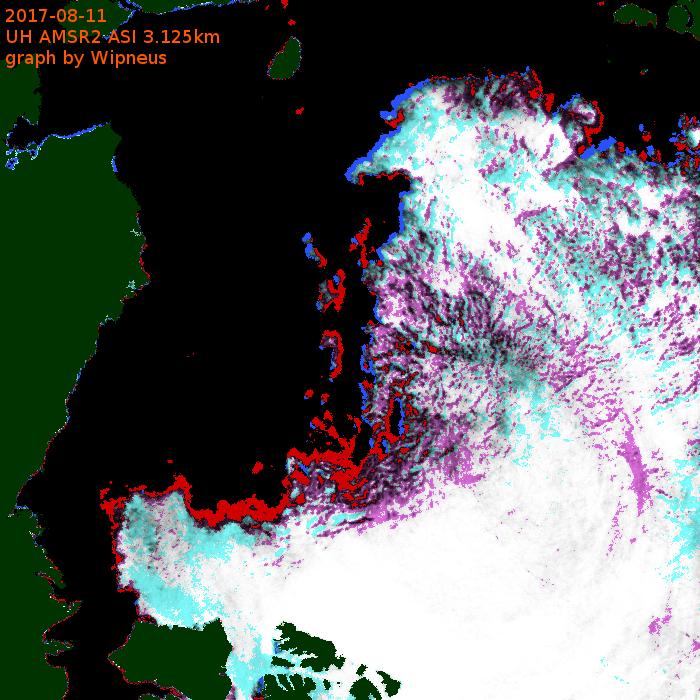
Meanwhile the melt along the Northern Sea Route is well ahead of last year. Here’s the University of Hamburg AMSR2 concentration map of the area:
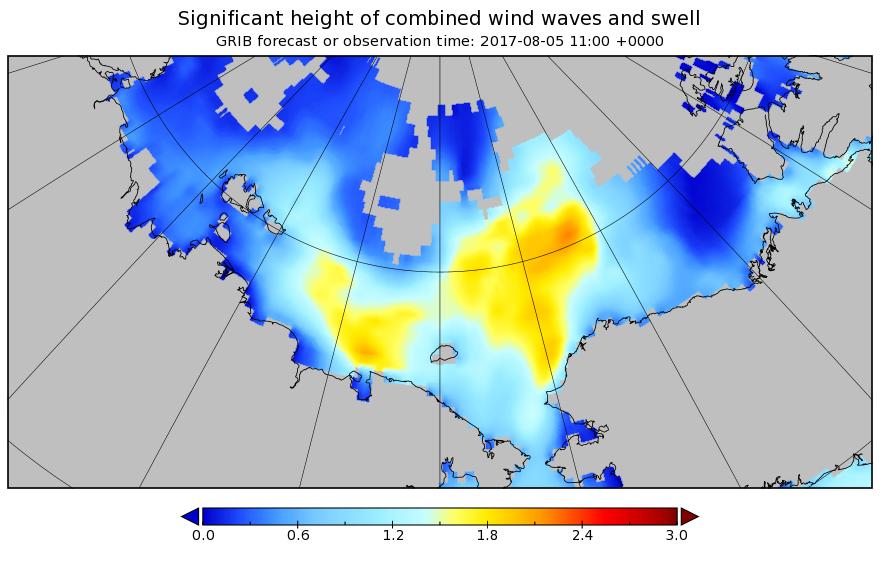
There’s also now a lot of open water on the Pacific side of the Arctic, and Sunday’s cyclone is forecast to create a large area of 2 meter plus waves heading in the direction of the ice edge:
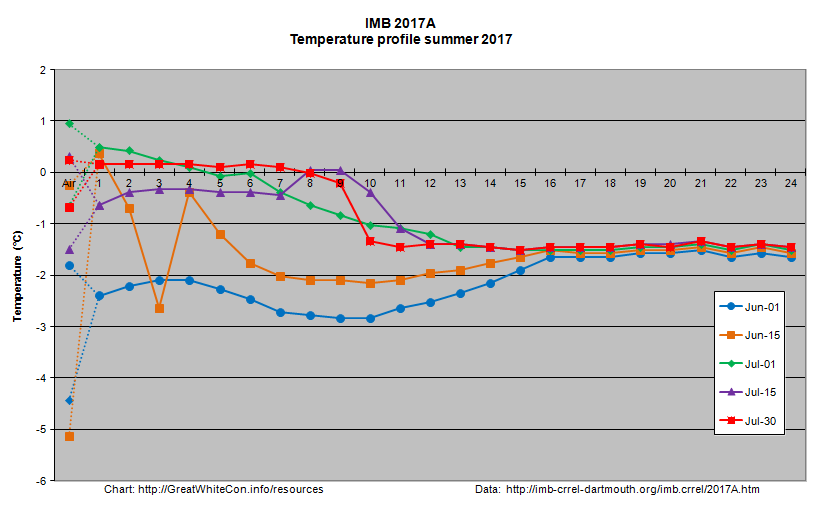
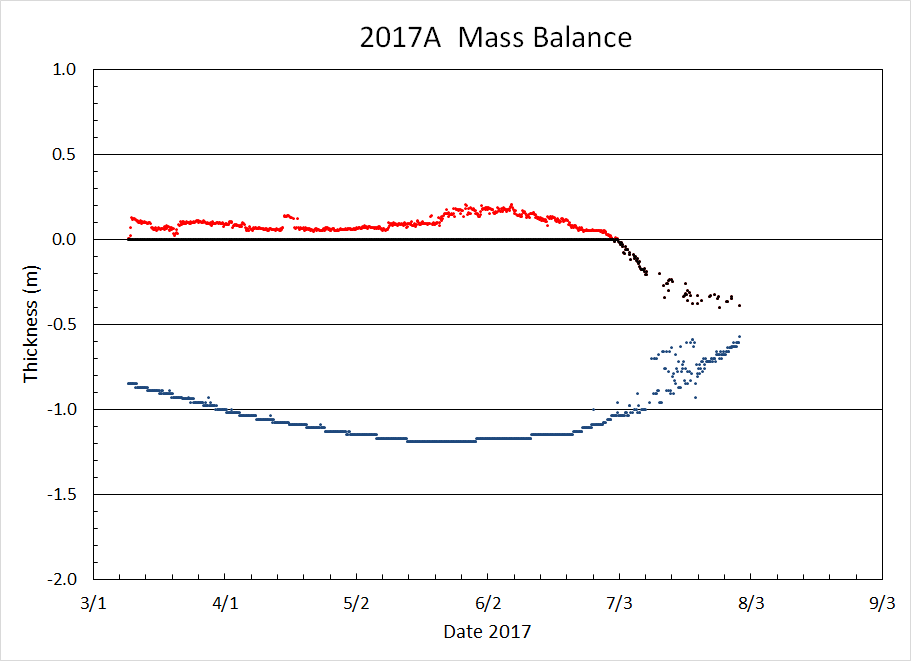
I expect that to have a noticeable effect on the already fragile sea ice by early next week, assuming the storm arrives as forecast! There is an ice mass balance buoy handily placed out on the ice in the path of the storm. Buoy 2017A is currently located near 77 N, 147 W, and its assorted sensors suggest the ice underneath it is now less than 20 cm thick:
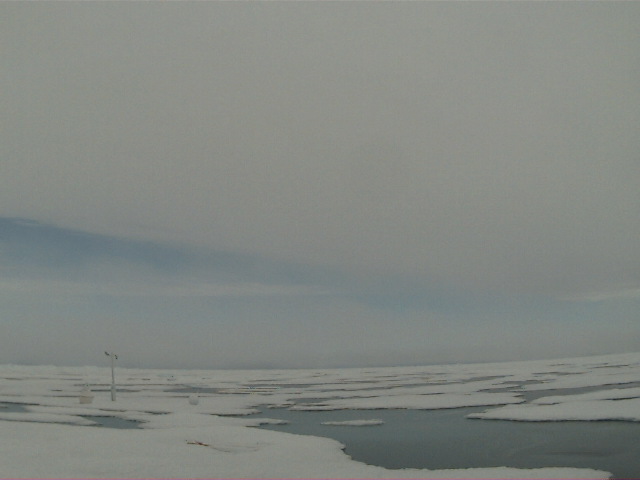
Here’s how the area around the buoy looked a couple of weeks ago:
Image of 2017A from WARM 6 on July 18th 2017. NSF project: NSF OPP #1603548
The $64,000 question now is will the 2017 Arctic sea ice metrics stay in amongst the recent pack, or race after 2012 instead?
[Edit – August 6th]
This morning’s synopsis from Environment Canada suggests the cyclone has bottomed out at a MSLP of 982 hPa:
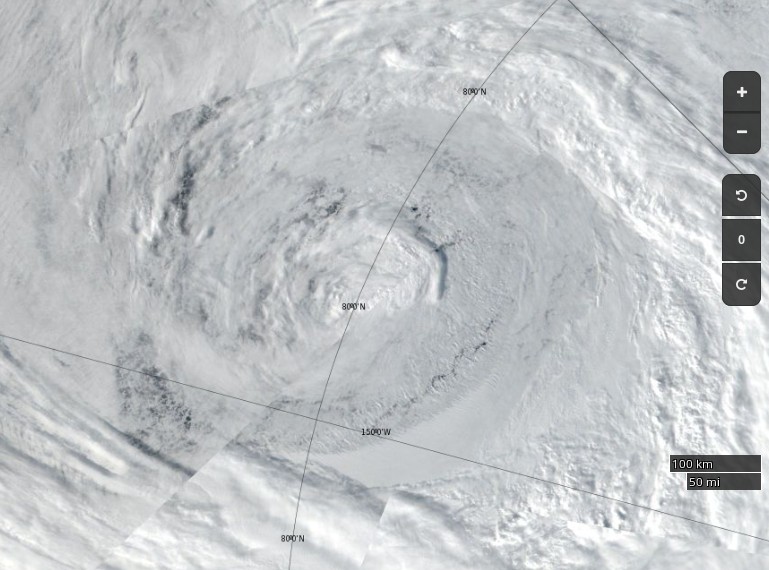
Here’s how the cyclone looked from space yesterday:
NASA Worldview “true-color” image of the sea ice north of the Beaufort Sea on August 5th 2017, derived from the VIIRS sensor on the Suomi satellite
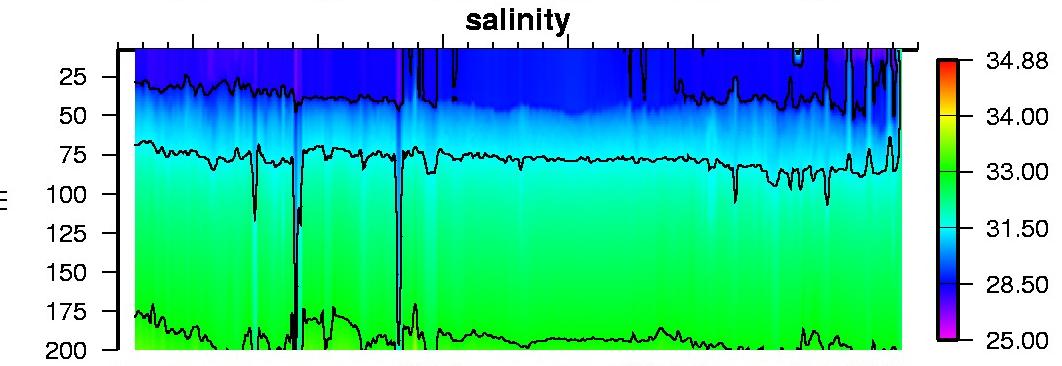
I think that I can convince myself that the salinity profile from ice tethered profiler 97, currently located at 73° N, 134° W, reveals mixing from depth in the wake of the storm:
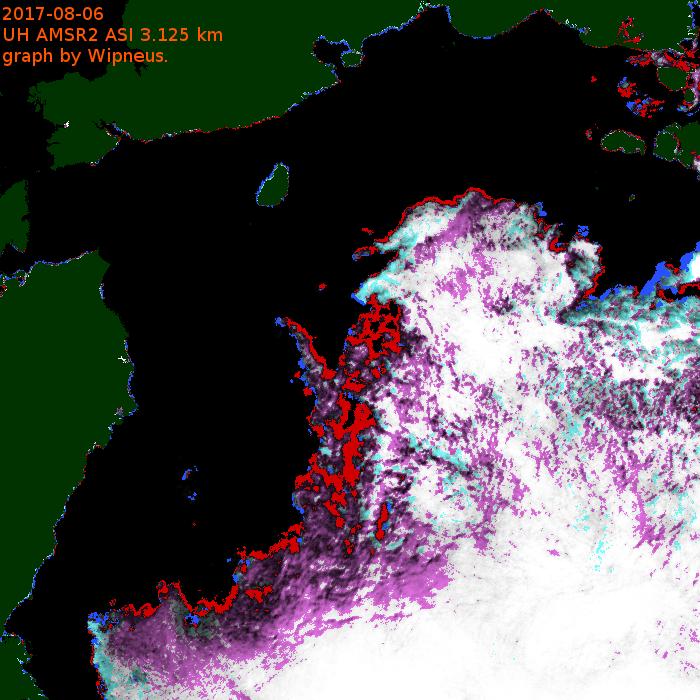
The synthetic aperture radar on the Sentinel 1B satellite can certainly see through the clouds, and reveals open water in the Central Arctic north of the Beaufort Sea yesterday evening (UTC):
Sentinel 1B image of Arctic sea ice at 79° N, 160° W on August 5th 2017
The effects of this weekend’s storm are readily apparent! Just in case you’re wondering Wipneus reports:
Area: -172.0 (+324k vs 2016, +138k vs 2015, -669k vs 2014, -523k vs 2013, +493k vs 2012)
[Edit – August 8th]
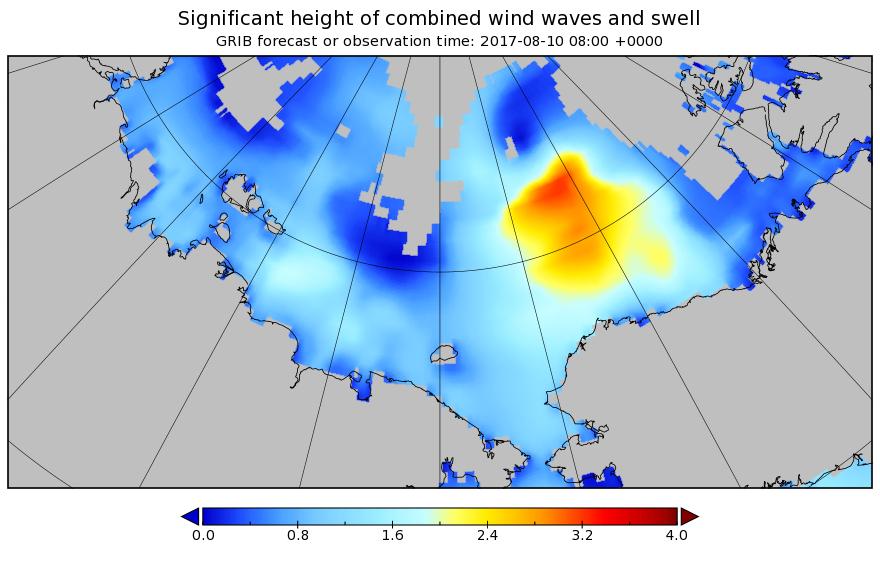
The next pulse of swell is currently forecast to be somewhat higher and longer period than the last one. This one is also taking aim at the Beaufort Sea MIZ:
[Edit – August 9th]
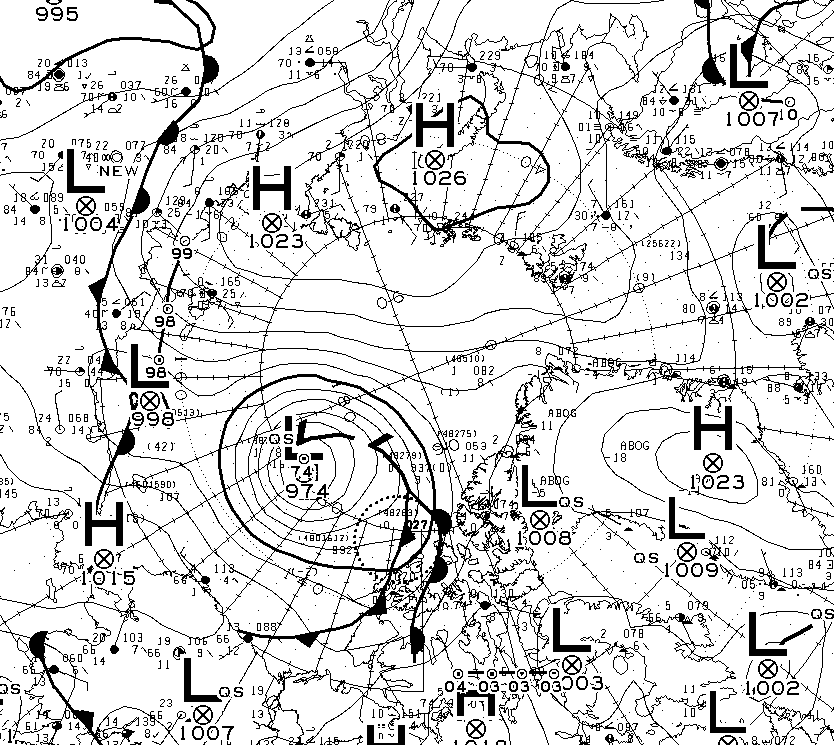
According to Environment Canada the latest cyclone is already down to 980 hPa MSLP:
[Edit – August 9th PM]
The MSLP of the current cyclone is now down to 976 hPA:
The latest WaveWatch III forecast has increased the predicted peak height and period of the resulting waves once again:
[Edit – August 10th]
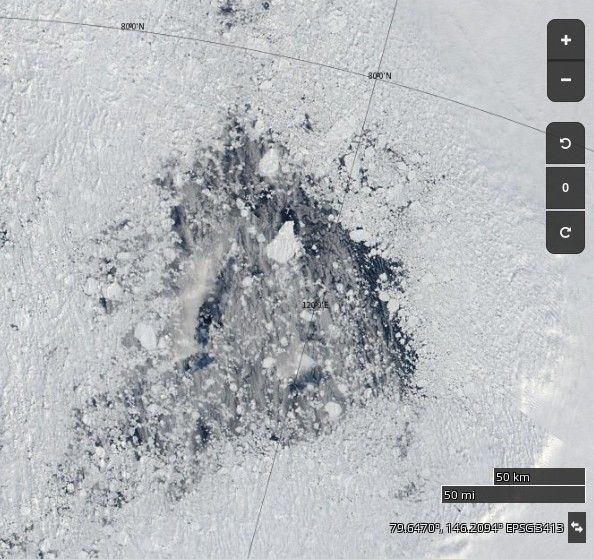
Large holes are appearing in the sea ice on the other side of the Arctic too. Take a look north of the Laptev Sea for example:
NASA Worldview “true-color” image of the “Laptev Bite” polynya on August 10th 2017
Meanwhile the current cyclone on the Pacific side of the North Pole appears to have bottomed out at 974 hPa:
[Edit – August 11th]
Here’s the latest sea ice concentration one day delta map from Wipneus:
Despite the expected divergence caused by a low pressure area crossing the ice, both are and extent of sea ice on the Pacific side of the Arctic are still falling.
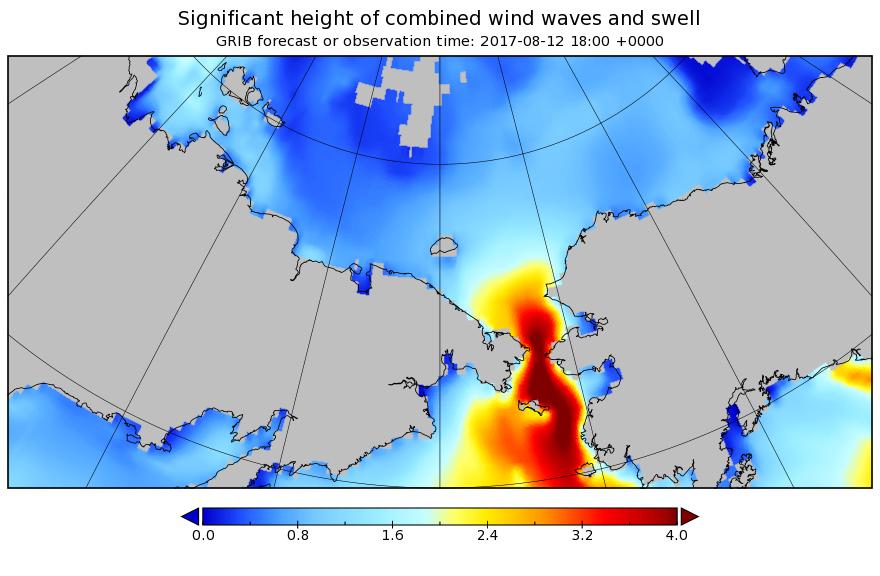
[Edit – August 12th]
The waves are considerably smaller in the Beaufort Sea today, but not in the Bering Strait!
Here’s the latest one day delta map:
and here’s video showing the motion of sea ice in the Beaufort & Chukchi Seas so far this summer:
[Edit – August 13th]
Here’s an animation from Wipneus revealing the effect of the two recent cyclones on the Pacific side, plus everything else that’s been going on in the Arctic:
Click the image to see a much larger (3.3 Mb) version.
[Edit – August 16th]
AMSR2 Arctic sea ice extent has taken another tumble, and has dropped below 2016:
Only 2012 left to beat!
[Edit – August 18th]
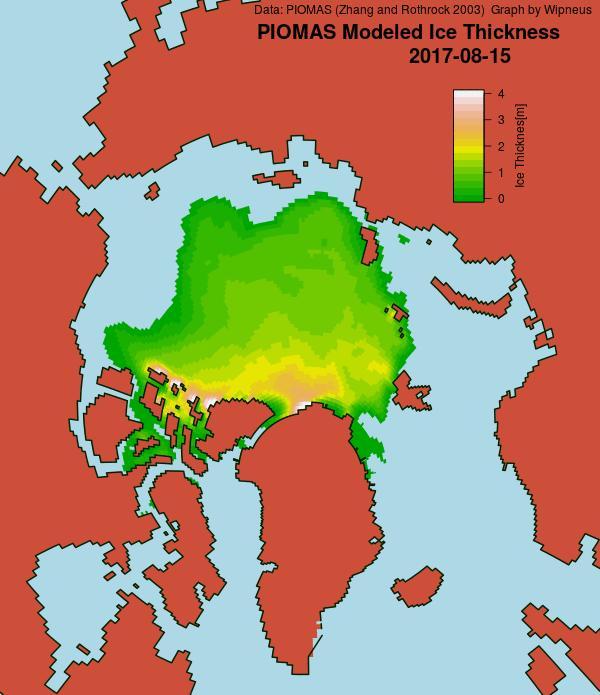
A PIOMAS mid month update has been released, including gridded thickness data. 2017 modelled volume has failed to follow 2012’s trajectory towards the September minimum, and is now on a par with 2011:
[Edit – August 21st]
After a “brief hiatus” in the wake of the recent cyclones Arctic sea ice area has posted a new low for the year:
Extent has yet to follow suit:
The main loss of area has been in the “Beaufort Bite” once again:
Jakobshavn Isbræ is a glacier in Western Greenland made (more?) famous by James Balog in his “Chasing Ice” movie. Here’s the “official video”:
which claims that it:
Captures [the] largest glacier calving ever filmed. On May 28, 2008, Adam LeWinter and Director Jeff Orlowski filmed a historic breakup at the Ilulissat Glacier in Western Greenland.
Depending on which languages you prefer to mix and match “Ilulissat Glacier” is another name for the self same glacier. So is “Sermeq Kujalleq”. Now comes news that something similar has just happened, albeit captured only by satellites in the twilight of the Arctic “spring”. Over on the Arctic Sea Ice Forum Espen Olsen posted late last night (UTC):
Believe it or not! Massive calving seen at the southern branch of Jakobshavn Isbræ
together with this animation created using images from the Landsat 8 Operational Land Imager:
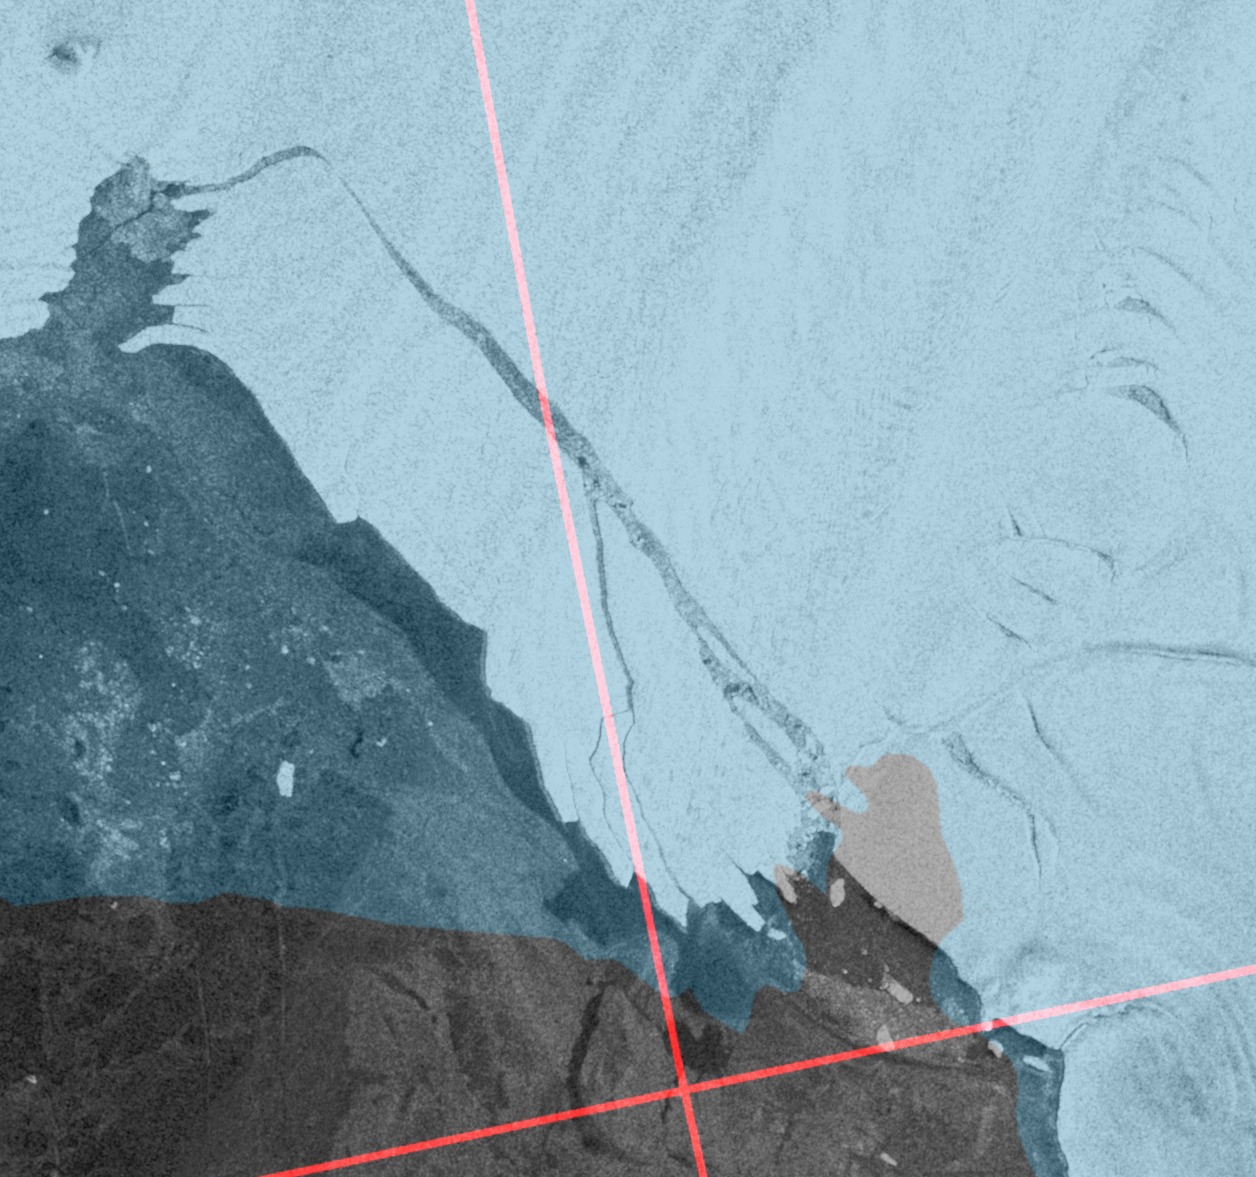
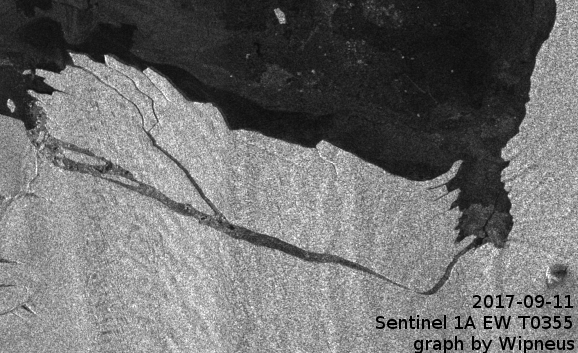
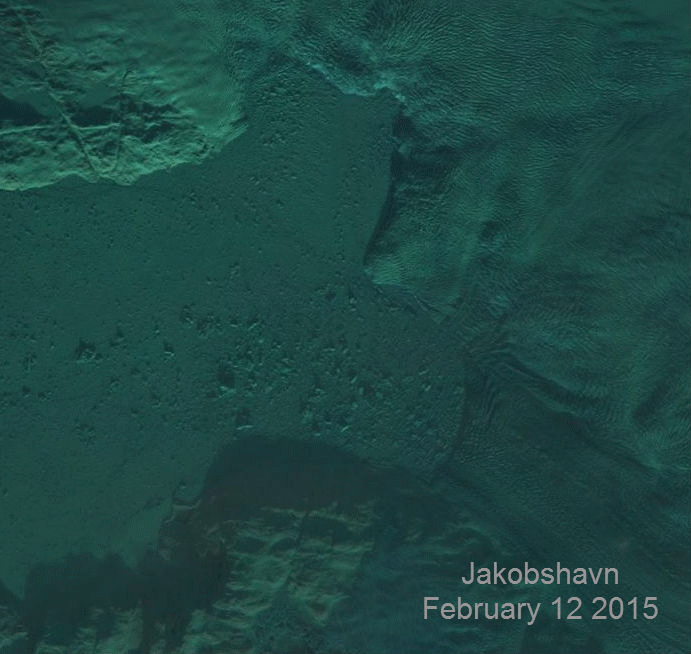
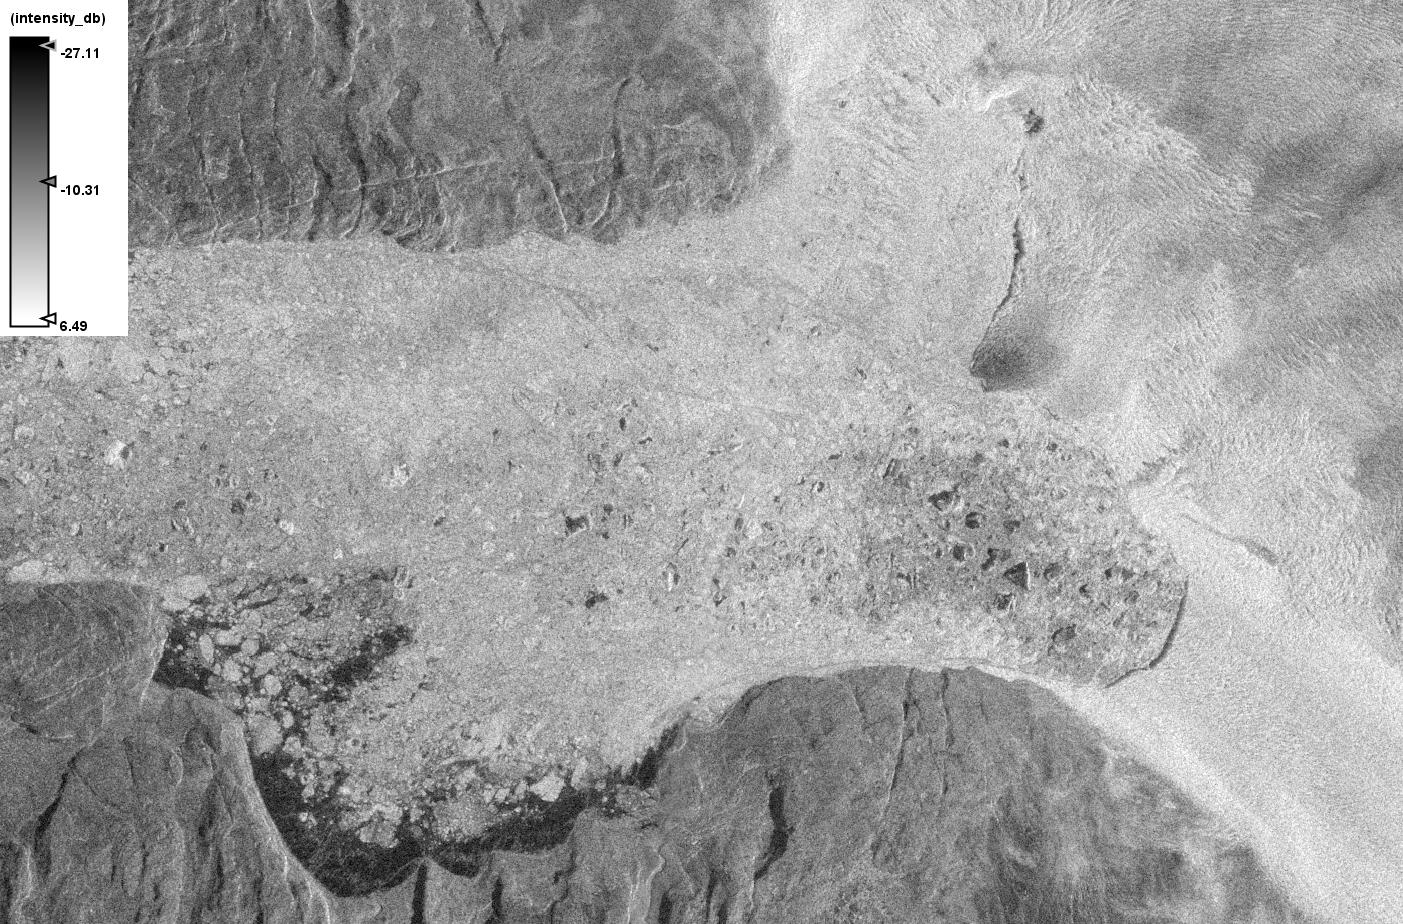
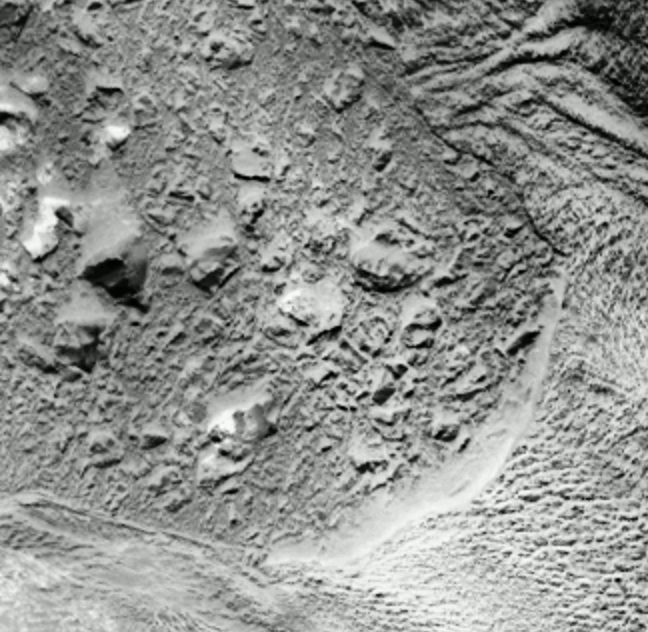
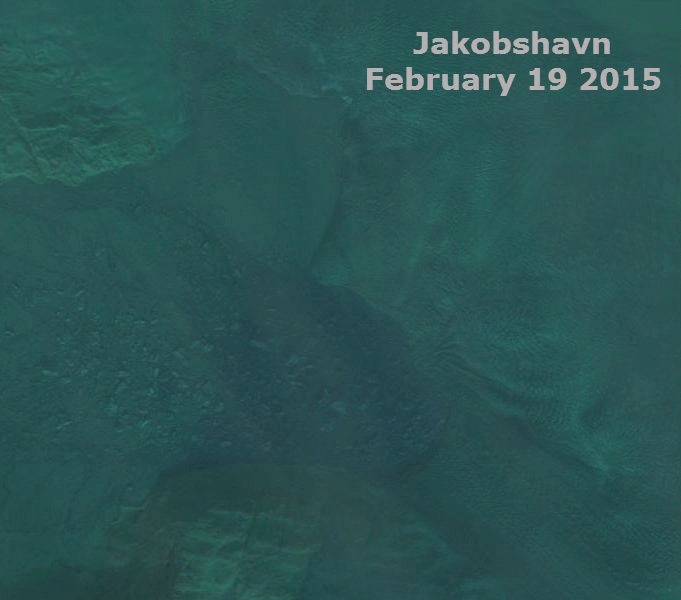
We’ve just grabbed this Sentinel-1A synthetic aperture radar image from February 15th 2015 via Polarview, which appears to suggest that the calving took place before 20:38 UTC on that date:
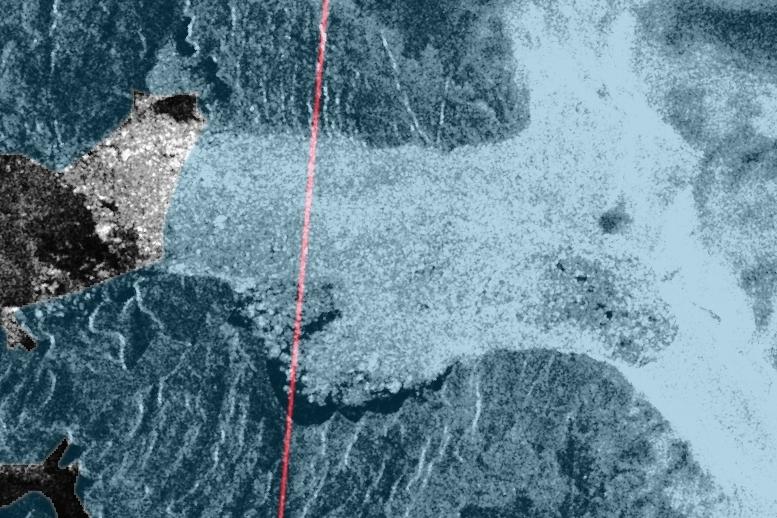
Here’s a Sentinel-1A image via “nukefix” at the Arctic Sea Ice Forum, which confirms that the calving took place on or before February 16th:
This is a before/after animation from “A-Team” on the Arctic Sea Ice Forum, using 15m resolution Landsat images:
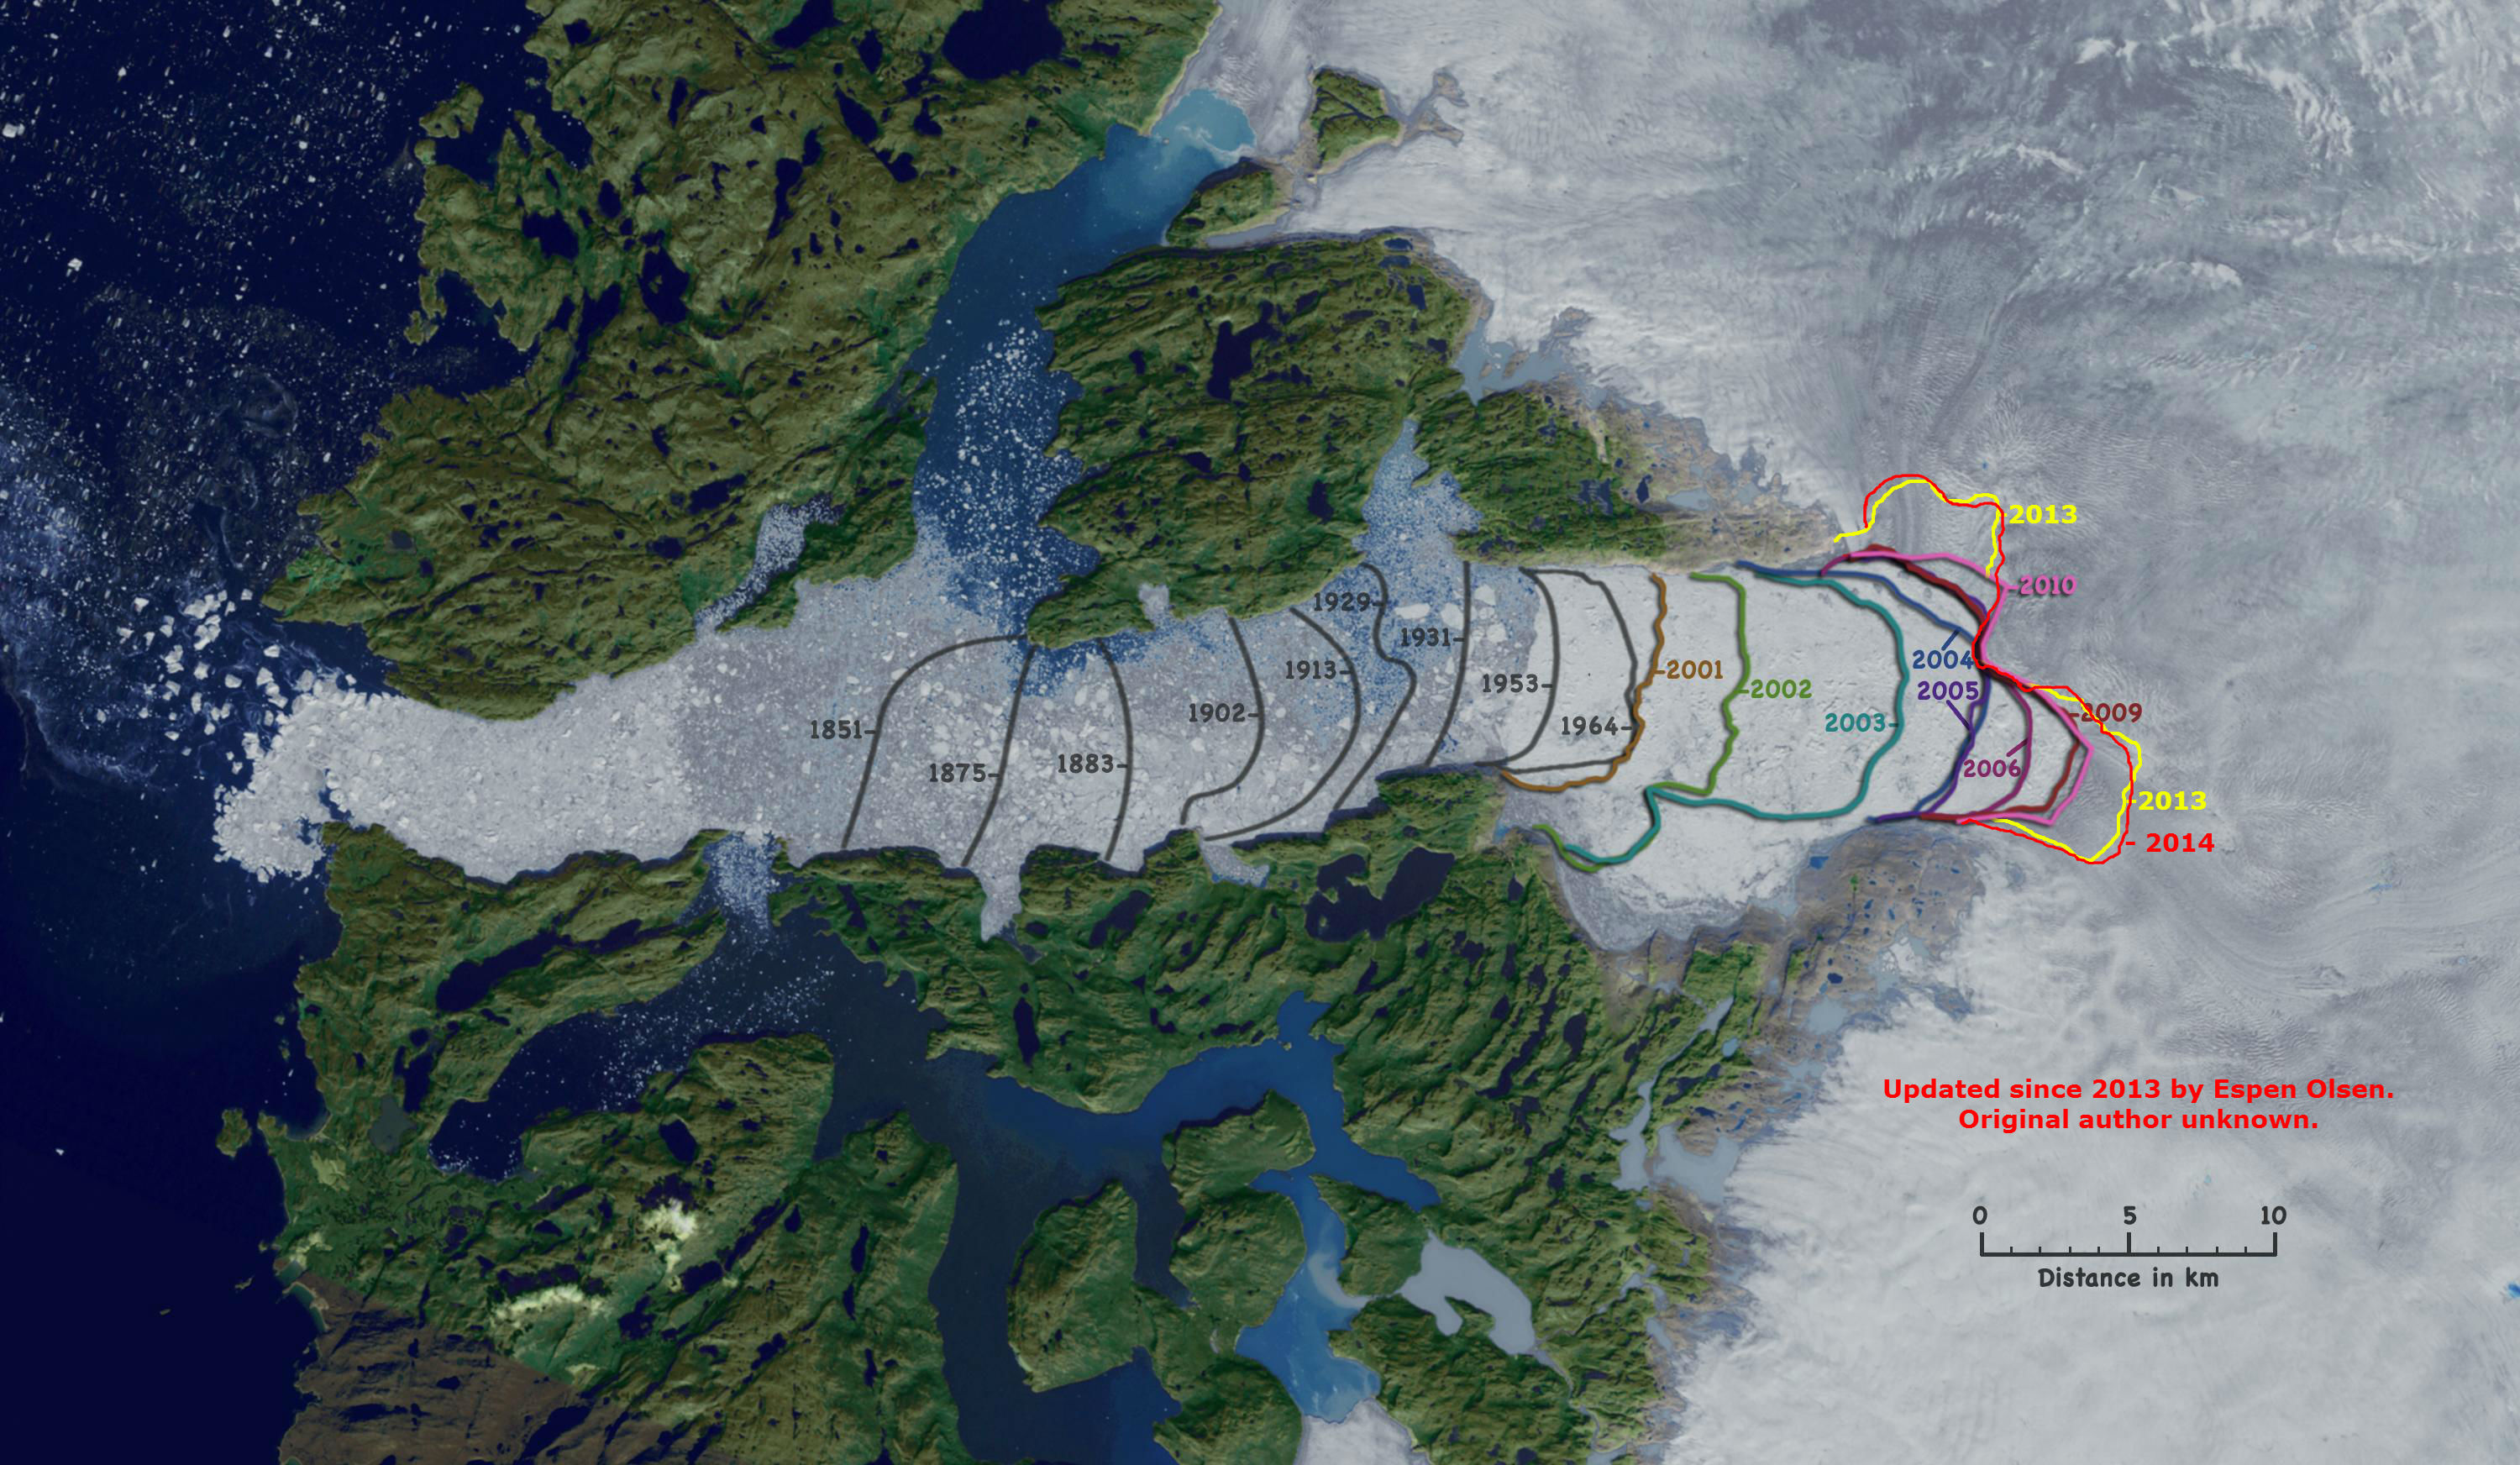
Finally, for the moment at least, Espen Olsen provides an illustration of the retreat of the calving face of Jakobshavn Isbræ since 1851:
This most recent event does not bring the calving face further east than the position in summer 2014. However the sun’s rays are only just returning to that part of the planet, and the next one may well do so.
[Edit – 24/02/2015]
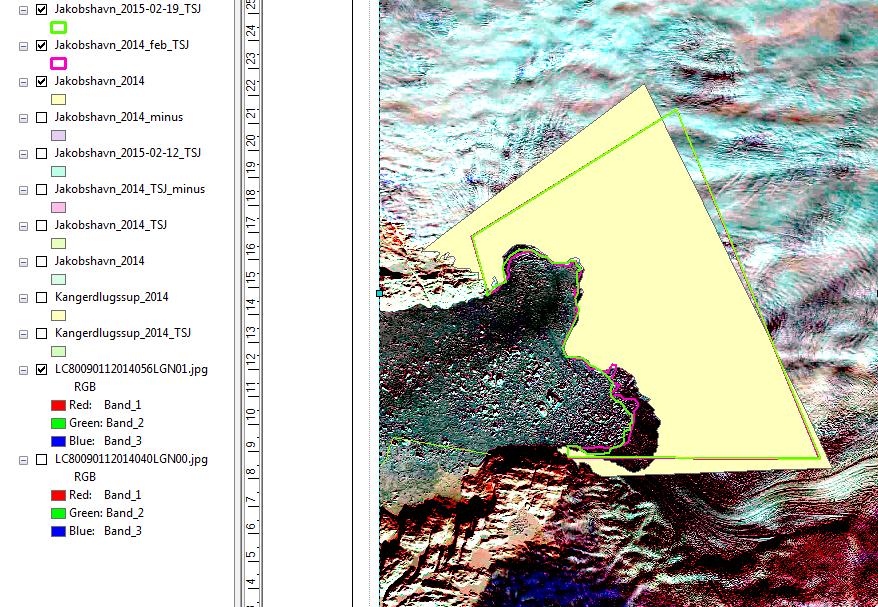
We’ve phoned DMI and NSIDC as well, but Jason Box who is a Professor at the Geological Survey of Denmark and Greenland has been the first to respond with an opinion about how unusual this event is:
It’s an interesting finding. In the attached prepared by Karina Hansen you will see a light yellow polygon illustrating the end of melt season 2014 ice. Jakobshavn front position retreated from the Feb 2014 (pink line) and Feb 2015 (green line) positions. The Feb 2014 and Feb 2015 positions are roughly the same with 2014 Feb being further retreated than Feb 2015:
A cautious response: even if this calving were abnormal, we will likely see an advance in the next weeks that will fill the void. Why?
A) This glacier flows fast, and
B) Now with less flow resistance there will likely be an acceleration making the void filling happen even faster.
Here are annual end of melt season area changes measured by PROMICE.org. These are being updated. I will ask Karina Hansen today to update for 2014 and 2015. We could have that result in a few hours.
1999/00
-2.750
2000/01
-2.473
2001/02
-16.357
2002/03
-45.617
2003/04
-21.235
2004/05
-10.015
2005/06
-4.151
2006/07
-3.830
2007/08
-3.202
2008/09
-2.174
2009/10
-8.725
2010/11
-6.693
2011/12
-13.743
2012/13
-2.826
In context of the ongoing retreat, I would speculate that this retreat could make further retreat more likely because the acceleration from B) would cause ‘dynamic thinning’ that through a positive feedback would reduce glacier bed friction facilitating further thinning and acceleration. This feedback is an amplifier and not runaway but being activated would precondition Jakobshavn glacier for further retreat.
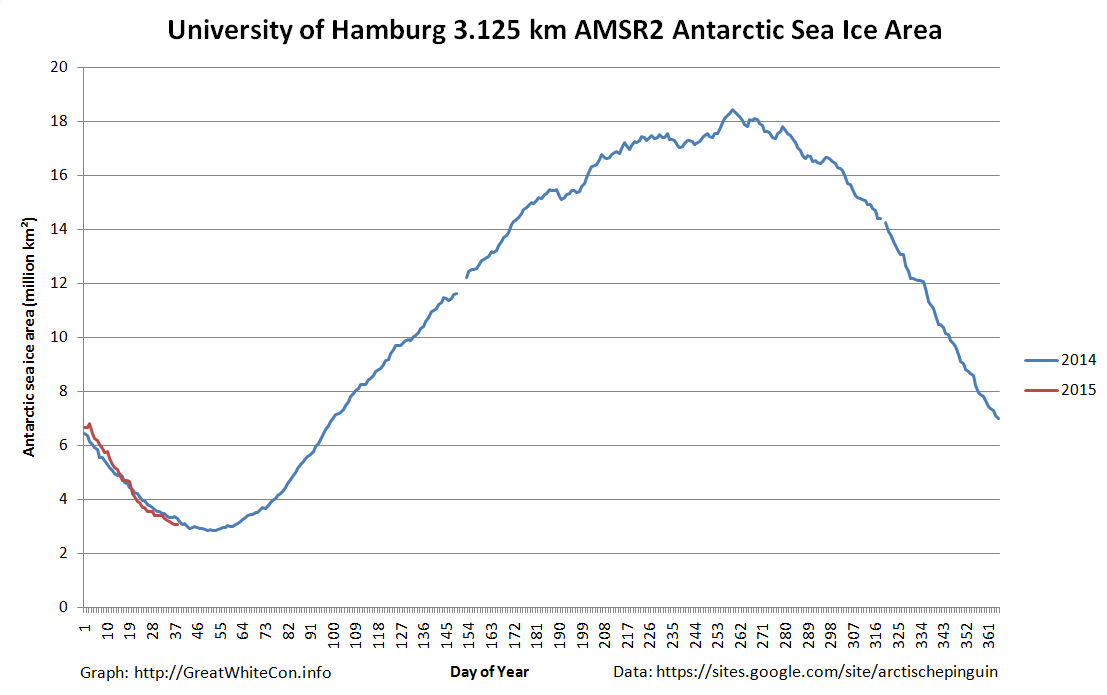
In the Arctic the refreeze is slowing down as the March maximum extent approaches. Meanwhile in the southern hemisphere Antarctic sea ice extent has taken a tumble as the annual minimum extent approaches.
Over the long cold Arctic winter “Wipneus” of ArctischePinguin fame has been porting his northern hemisphere regional sea ice area/extent methodology to cover the South Pole as well. We are pleased to be able to reveal the fruits of his labours on our new regional Antarctic Sea Ice Graphs page. The ultimate source of the information is the University of Hamburg’s sea ice concentration data based on a 3.125 km grid that uses data from the from the AMSR2 instrument on board the Japan Aerospace Exploration Agency’s SHIZUKU satellite. Here’s an overview of Antarctic sea ice area:
and here’s a close up on the sea ice extent in the Bellingshausen and Amundsen Seas region, where what sea ice there is helps buttress the West Antarctic Ice Sheet:
In future we will also be bringing you satellite images from Antarctica. By way of example, here’s the latest “Shock News!!!” from the Antarctic, courtesy of LandSat 8:
NASA report that:
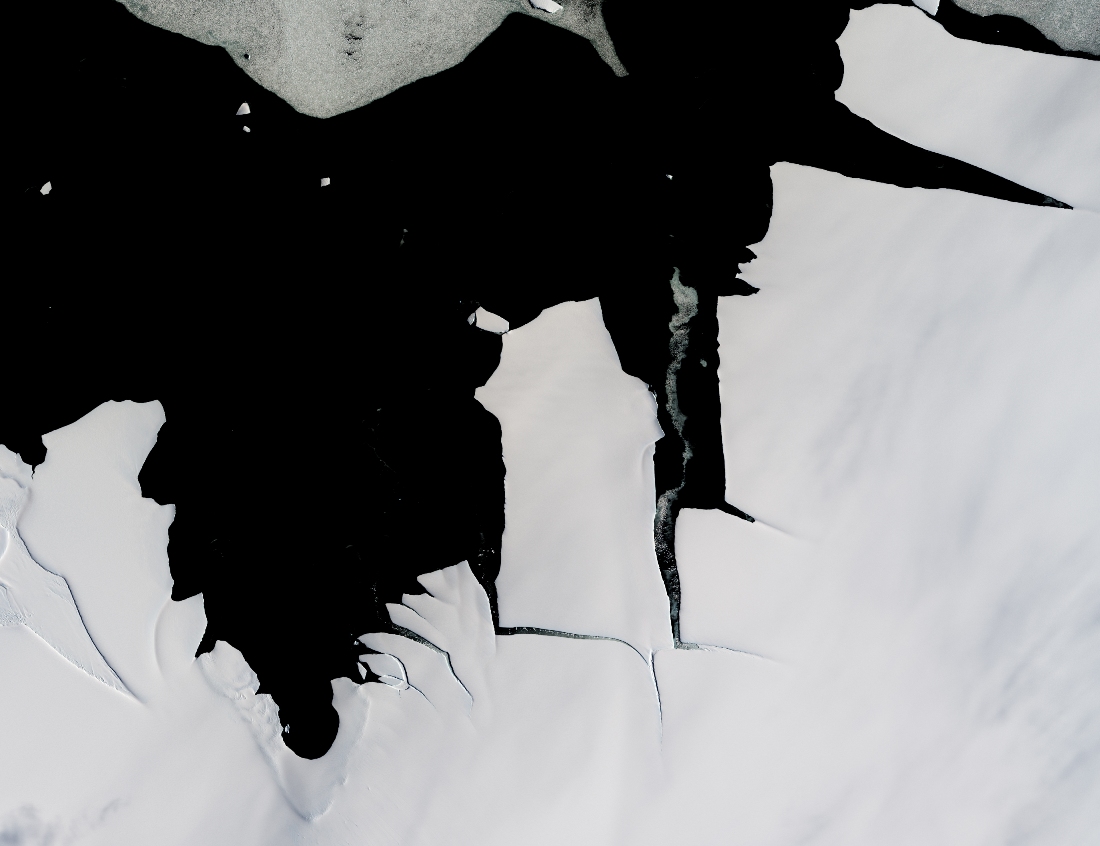
While large icebergs calve regularly from fast-flowing ice shelves in West Antarctica, the coast of cooler, drier East Antarctica tends to be less active. That made it a mild surprise when a 70-square-kilometer chunk of ice broke off from the King Baudouin Ice Shelf in January 2015. The last time that part of King Baudouin calved such a large iceberg was in the 1960s.
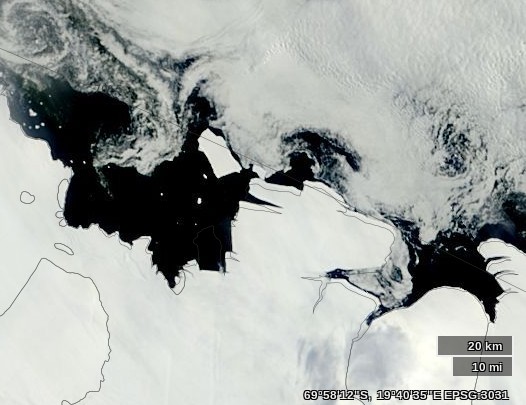
and you can track the current position of the latest large chunk of ex ice shelf on their WorldView web site:
The recently calved King Baudouin Ice Shelf on February 3rd 2015
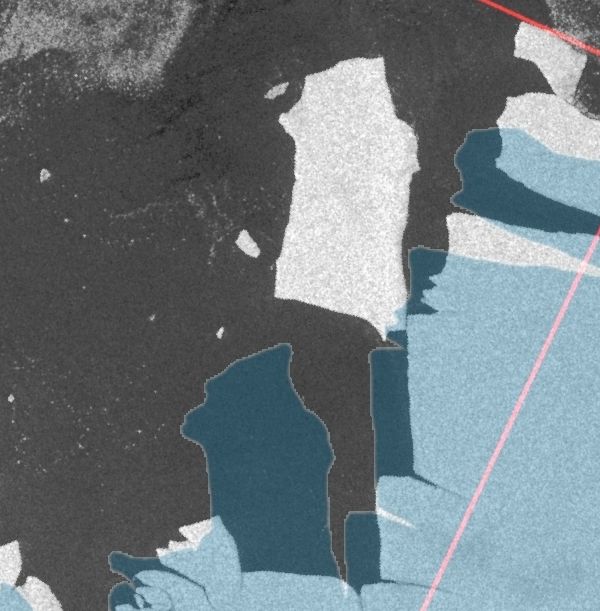
Thanks also to “Arcticio” from the Arctic Sea Ice Blog who pointed me in the direction of PolarView, where it was remarkably easy to locate this Sentinel-1A synthetic aperture radar image of the large iceberg in question on January 30th 2015:
This website uses cookies to improve your experience. We'll assume you're ok with this, but you can opt-out if you wish. Cookie settingsACCEPT
Privacy & Cookies Policy
Privacy Overview
This website uses cookies to improve your experience while you navigate through the website. Out of these, the cookies that are categorized as necessary are stored on your browser as they are essential for the working of basic functionalities of the website. We also use third-party cookies that help us analyze and understand how you use this website. These cookies will be stored in your browser only with your consent. You also have the option to opt-out of these cookies. But opting out of some of these cookies may affect your browsing experience.
Necessary cookies are absolutely essential for the website to function properly. This category only includes cookies that ensures basic functionalities and security features of the website. These cookies do not store any personal information.
Any cookies that may not be particularly necessary for the website to function and is used specifically to collect user personal data via analytics, ads, other embedded contents are termed as non-necessary cookies. It is mandatory to procure user consent prior to running these cookies on your website.