It seems Tony didn't bother to read the references in the @IPCC_CH's #FAR that he quoted earlier.
Had he done so he would have discovered that when USS Nautilus sailed under the #NorthPole in 1958 it found the mean ice draft to be 5.32 meters.#TruthDecay#ClimateBall™
"I'm pretty sure that ice doesn't grow during record heat"
Tony seems unaware that the #Arctic isn't the entire planet, that #SeaIce melts in summer, and that summer surface temperatures in the high Arctic are held close to the melting point.#TruthDecay#ClimateBall™
Needless to say Tony has yet to answer my final question.
[Edit – October 16th]
Needless to say Tony Heller has yet to answer any of my recent questions. What’s more despite the exhortations of one of his band of merry (mostly) men he has declined to engage in a public debate with me:
With my alter ego blocked I’ve been debating with some of Tony’s band of merry (mostly) men whilst wearing my normal attire. One of them requested the opinion of Judah Cohen and Big Joe on Tony’s cherry pick du jour:
The Polar Amplification Model Intercomparison Project (PAMIP for short) is one of several Community Earth System Model (CESM for short) based climate modelling projects.
Polar amplification, the phenomenon that external radiative forcing produces a larger change in surface temperature at high latitudes than the global average, is a key aspect of anthropogenic climate change but its causes and consequences are not fully understood.
PAMIP, co-led by Dr. Doug Smith, Dr. James Screen, and Dr. Clara Deser seeks to improve our understanding of this phenomenon through a coordinated set of numerical model experiments. As one of the Coupled Model Intercomparison Project Phase 6 (CMIP6) endorsed MIPs, PAMIP will address the following primary questions:
1. What are the relative roles of local sea ice and remote sea surface temperature changes in driving polar amplification?
2. How does the global climate system respond to changes in Arctic and Antarctic sea ice?
The PAMIP project is thus part of the global climate modelling effort leading up to the long anticipated publication of the Intergovernmental Panel on Climate Change’s next series of assessment reports, conveniently abbreviated as simply “AR6”. The project has been in the news recently. According to an article in Science magazine:
Every time severe winter weather strikes the United States or Europe, reporters are fond of saying that global warming may be to blame. The paradox goes like this: As Arctic sea ice melts and the polar atmosphere warms, the swirling winds that confine cold Arctic air weaken, letting it spill farther south. But this idea, popularized a decade ago, has long faced skepticism from many atmospheric scientists, who found the proposed linkage unconvincing and saw little evidence of it in simulations of the climate.
Now, the most comprehensive modeling investigation into this link has delivered the heaviest blow yet: Even after the massive sea ice loss expected by midcentury, the polar jet stream will only weaken by tiny amounts—at most only 10% of its natural swings. And in today’s world, the influence of ice loss on winter weather is negligible, says James Screen, a climate scientist at the University of Exeter and co-leader of the investigation, which presented its results last month at the annual meeting of the European Geosciences Union (EGU for short). “To say the loss of sea ice has an effect over a particular extreme event, or even over the last 20 years, is a stretch.”
The idea that Arctic sea ice loss could influence midlatitude winter weather first gained traction in 2012, in a paper by two climate scientists, Jennifer Francis, now at the Woodwell Climate Research Center, and Stephen Vavrus at the University of Wisconsin, Madison. It started with a simple observation: The Arctic is warming nearly three times faster than the rest of the world. At the time, sea ice loss was thought to be the primary accelerant for this amplification: As bright, reflective ice is replaced by dark, sunlight-absorbing water, the Arctic heats up, causing more ice loss, and more warming in turn.
The warming, Francis and Vavrus proposed, would inflate the height of the polar troposphere—the lowest layer of the atmosphere and home to its weather. That would decrease the pressure differences between polar and midlatitude air that drive the polar jet stream, which separates the air masses and keeps cold air collared around the pole. The jet would grow weaker and wavier, allowing cold air to intrude farther south. In their paper, Francis and Vavrus argued such a trend was visible in weather records and worsening with Arctic warming and ice loss.
The results of the project presented at the EGU haven’t been published in an academic journal yet, but according to Science once again:
In the years long PAMIP investigation researchers ran more than a dozen climate models 100 times each. One set of model runs simulated the Arctic atmosphere without pronounced sea ice loss, using ocean temperatures and sea ice extent from 2000. The other kept the ocean temperatures the same, but reduced the ice coverage to the extent expected decades from now, after 2°C of global warming, when the Arctic could be ice free in the summer. Keeping the oceans the same should highlight the influence—if any—of sea ice loss.
In addition to finding only a tiny effect of sea ice loss on the polar jet stream, the models also found no coherent sign of a second proposed effect of reduced sea ice: more frequent disruptions of the stratospheric polar vortex—a second set of swirling winds, much higher up. Such disruptions, which occur every 2 years on average, ultimately allow cold air lower in the atmosphere to spill southward, causing extreme winter storms, including the cold that gripped Texas this past winter.
However not everyone is convinced by the modelling results:
Judah Cohen, director of seasonal forecasting at Atmospheric and Environmental Research, has long argued that increased snow cover and diminished sea ice in Siberia favor weather patterns that propagate energy into the stratosphere, making the high-altitude disruptions more frequent. He notes that the models also forecast unrealistically warm winter weather in the midlatitudes, making other predictions suspect. “There’s clearly something missing.” And Francis says the PAMIP experiment may be too simplistic, now that “we know there’s a lot more to Arctic amplification than sea ice loss.”
Whilst we wait to discover precisely what was revealed to the EGU audience, here is a list of current PAMIP publications:
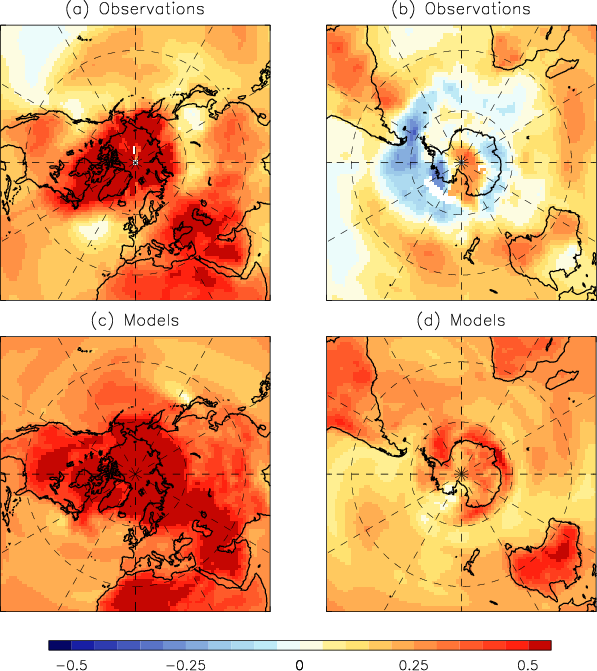
In conclusion, for the moment at least, here’s an illustration of one of the issues PAMIP is endeavouring to address. The difference between the outputs of previous generation of CMIP5 global climate models and observations taken from Smith et al. (2019):
Recent Arctic and Antarctic temperature trends (∘C decade−1) in (a, b) observations and (c, d) model simulations. Linear trends are shown for the 30-year period (1988 to 2017). Observations are taken as the average of HadCRUT4 (Morice et al., 2012), NASA-GISS (Hansen et al., 2010) and NCDC (Karl et al., 2015). Model trends are computed as the average from 25 CMIP5 model simulations driven by historical and RCP4.5 radiative forcings.
It will be extremely interesting to discover what the working group 1 section of the IPCC’s 6th Assessment Report ultimately has to say on the topic of Arctic amplification. The current AR6 timeline states that:
The Working Group I contribution is expected to be considered at the 54th Session of the IPCC which is scheduled to take place in the 14 days from 26 July 2021. The report will be released, subject to approval and acceptance by the Panel, on or around 9 August.
In the absence of the usual mid month PIOMAS Arctic sea ice volume update I’m being moaned at by “angech” over on Judith Curry’s “Climate Etc.” blog:
Any ideas on why PIOMAS mid month update not out, other than not wanting to show a big recovery?
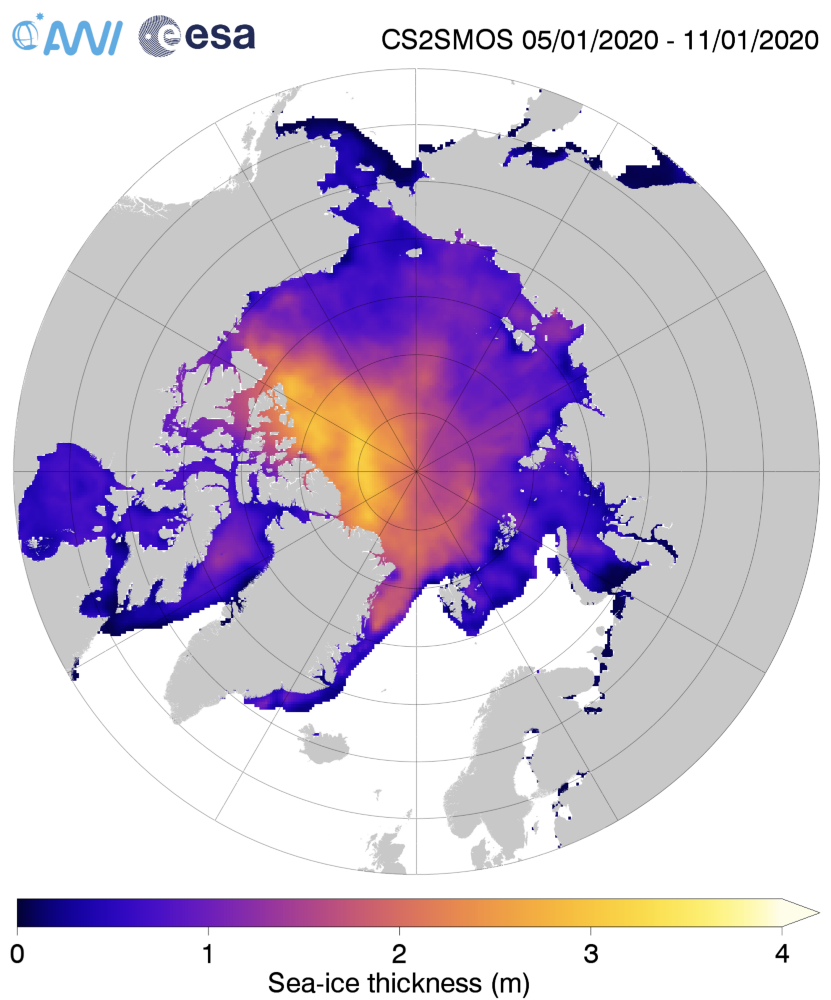
Unlike any of Judy’s denizens I checked out the comparatively new merged CryoSat-2 plus SMOS thickness maps from the Alfred Wegener Institute. “Measured” rather than “modelled” data must be a good thing surely?
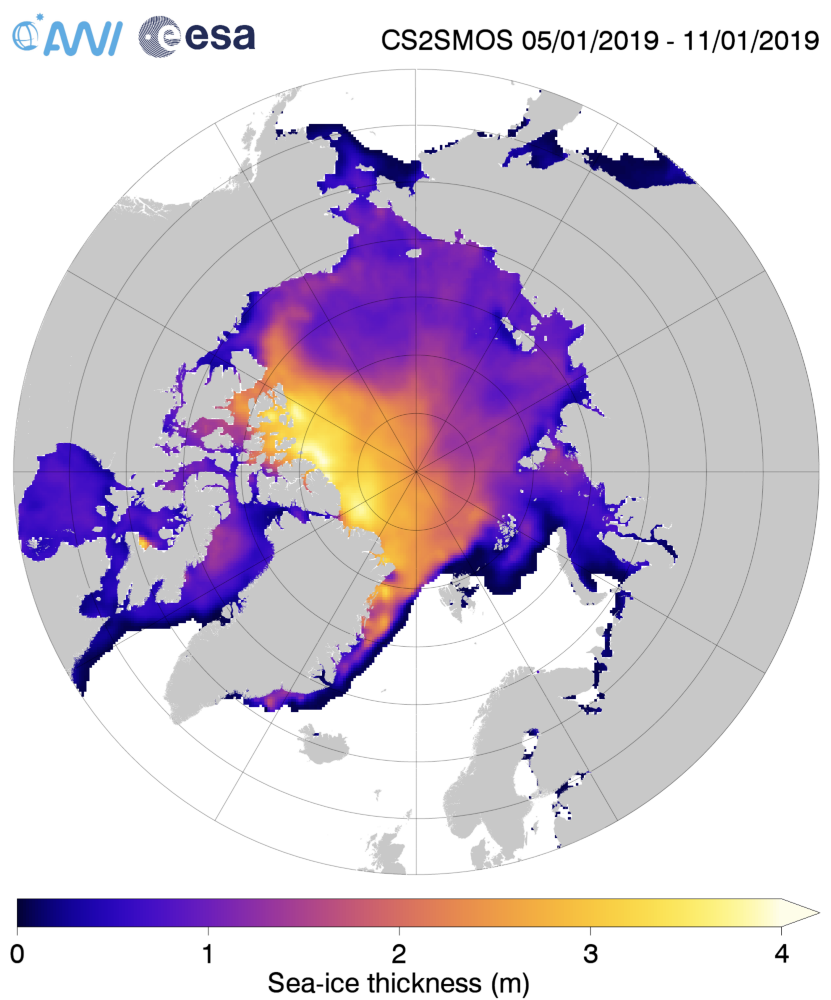
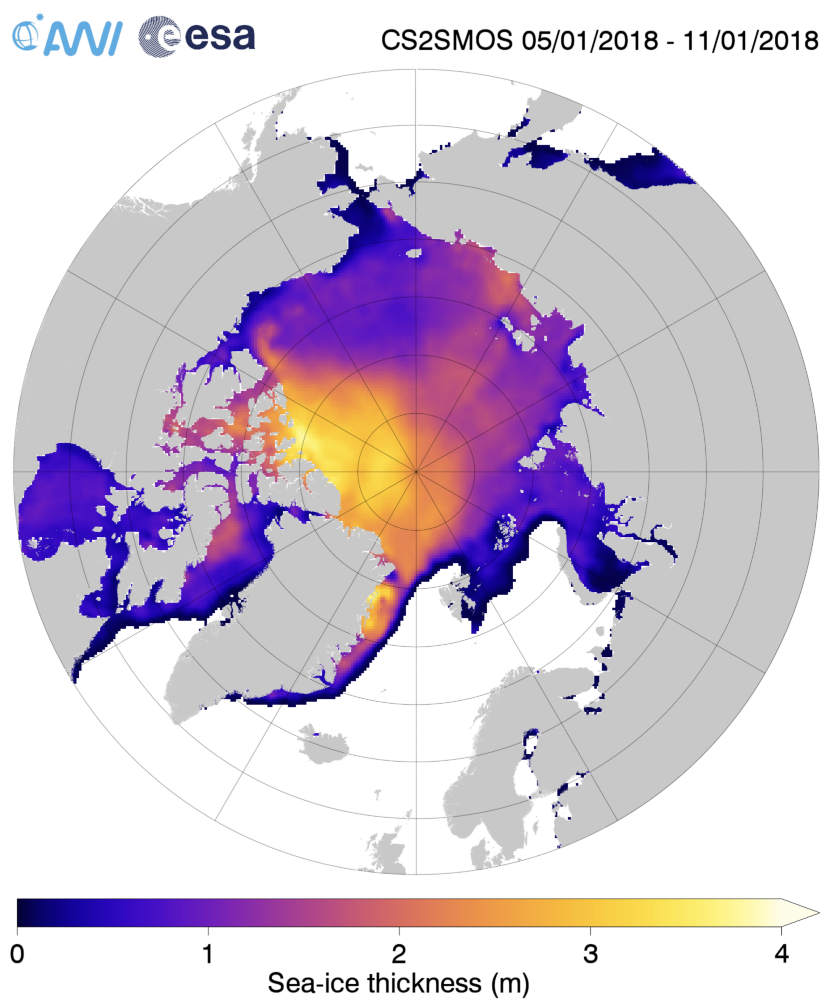
Just in case there’s some significant difference between the “reanalysis” and “operational” versions of that product, here is the AWI’s most recent reanalysed Arctic sea ice thickness map, for the week ending January 11th:
together with the same date from the previous two years:
Make sure to take a close look at the white areas north of Greenland and the Canadian Arctic Archipelago showing sea ice over 4 metres thick.
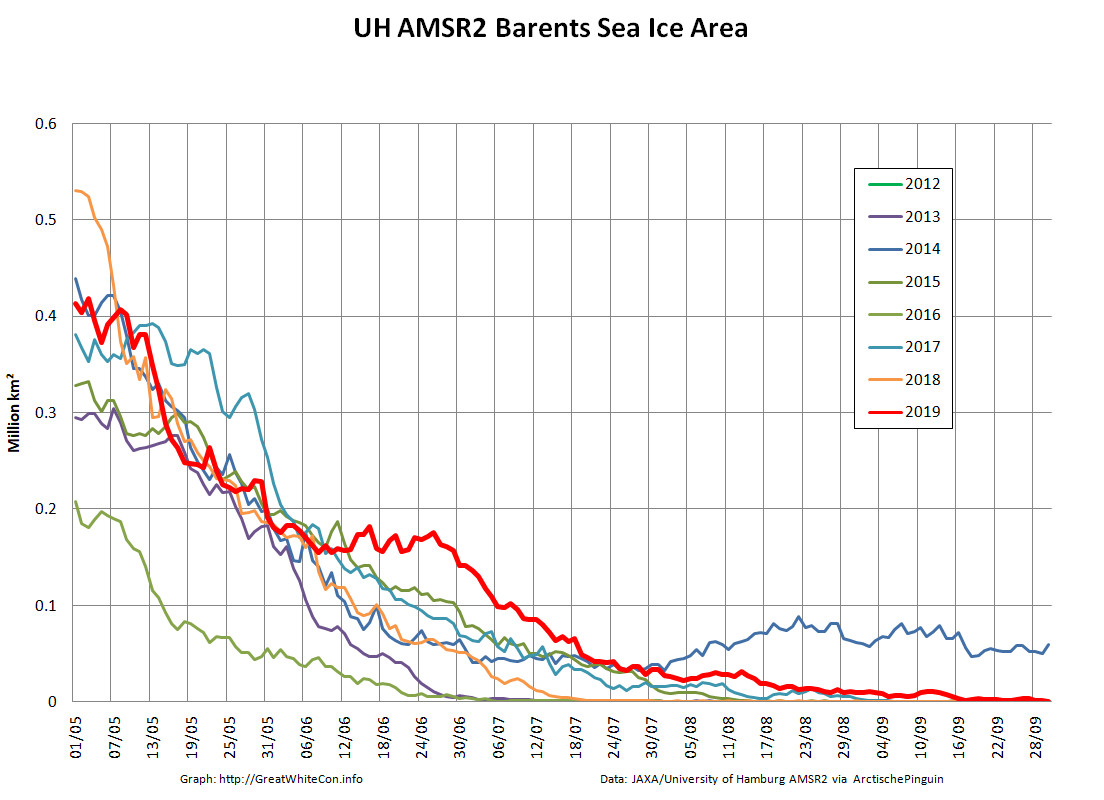
Over the winter of 2018/19 ASCAT revealed that there was a relentless movement of multi-year ice towards both the North Atlantic and the Beaufort Sea.
Not unexpectedly that meant that ice in the northern Barents Sea was slow to melt out in the summer of 2019:
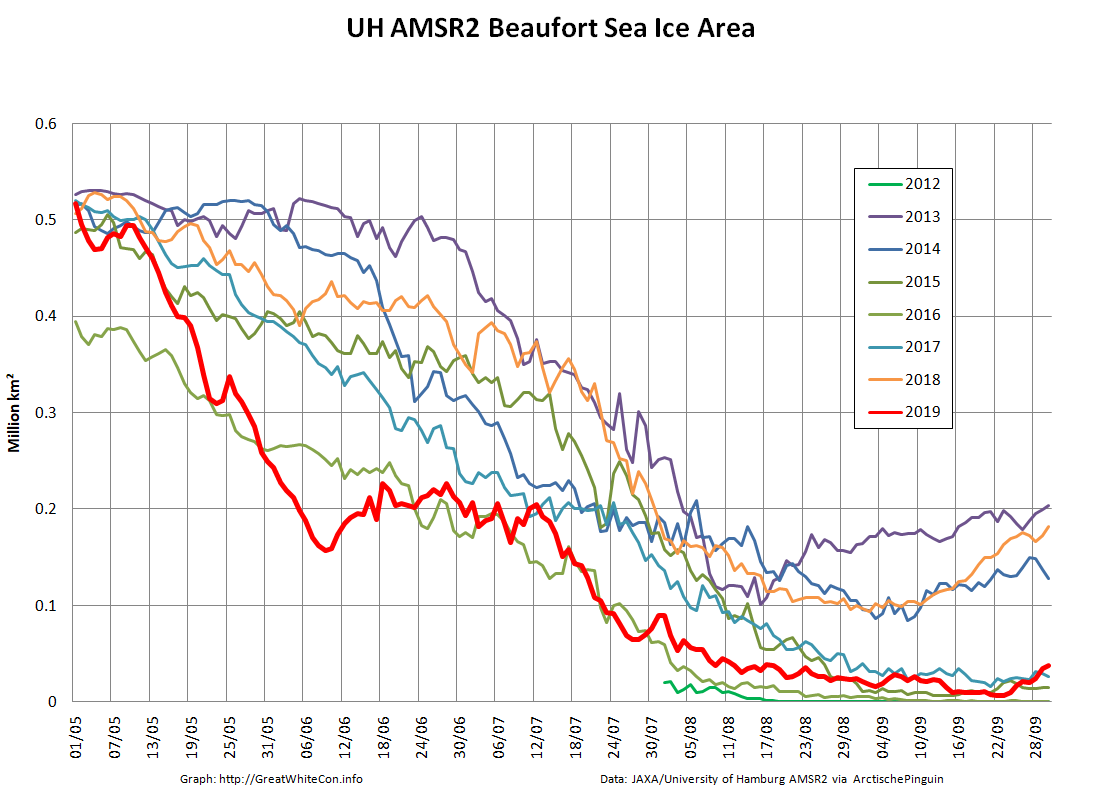
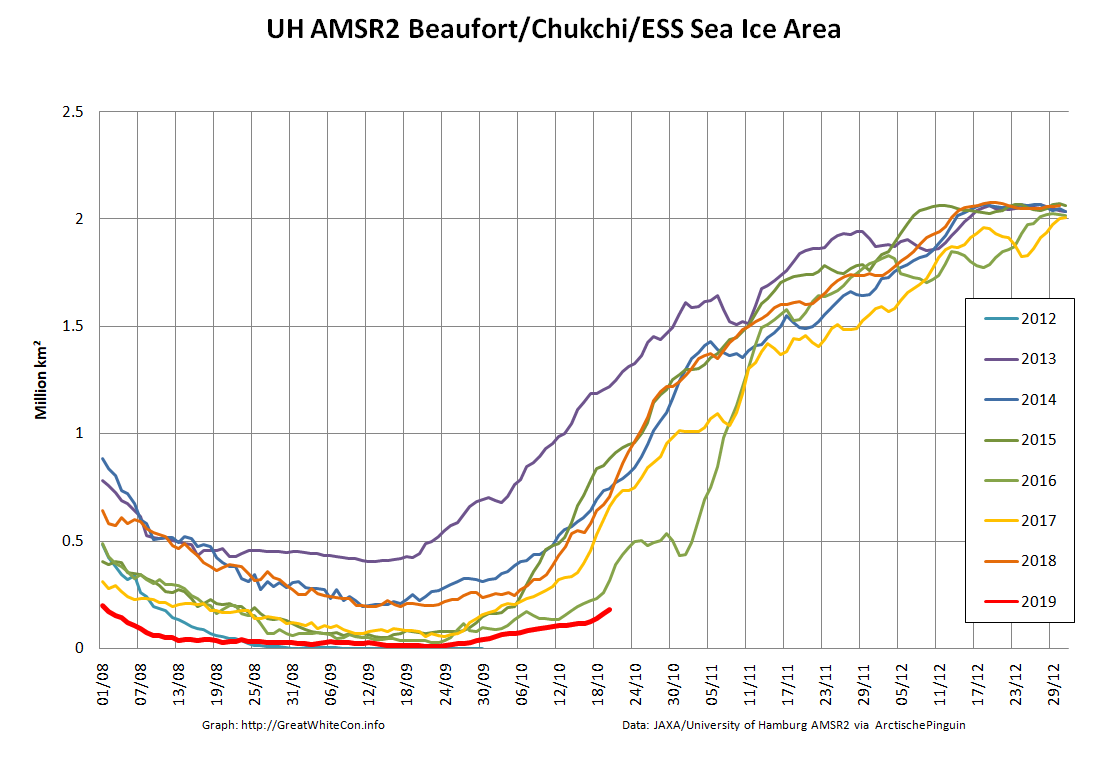
whilst after a fast start the melt in the Beaufort Sea also suffered a “brief hiatus” in June before ultimately melting out almost completely as well:
Perhaps a significant amount of the multi-year ice that survived the winter of 2018/19 has now simply melted away in warm water, to be replaced by much less robust first year ice in the area between the North Pole and the Siberian coast? It will be very interesting to see what the next PIOMAS update in early February reveals.
[Edit – February 4th]
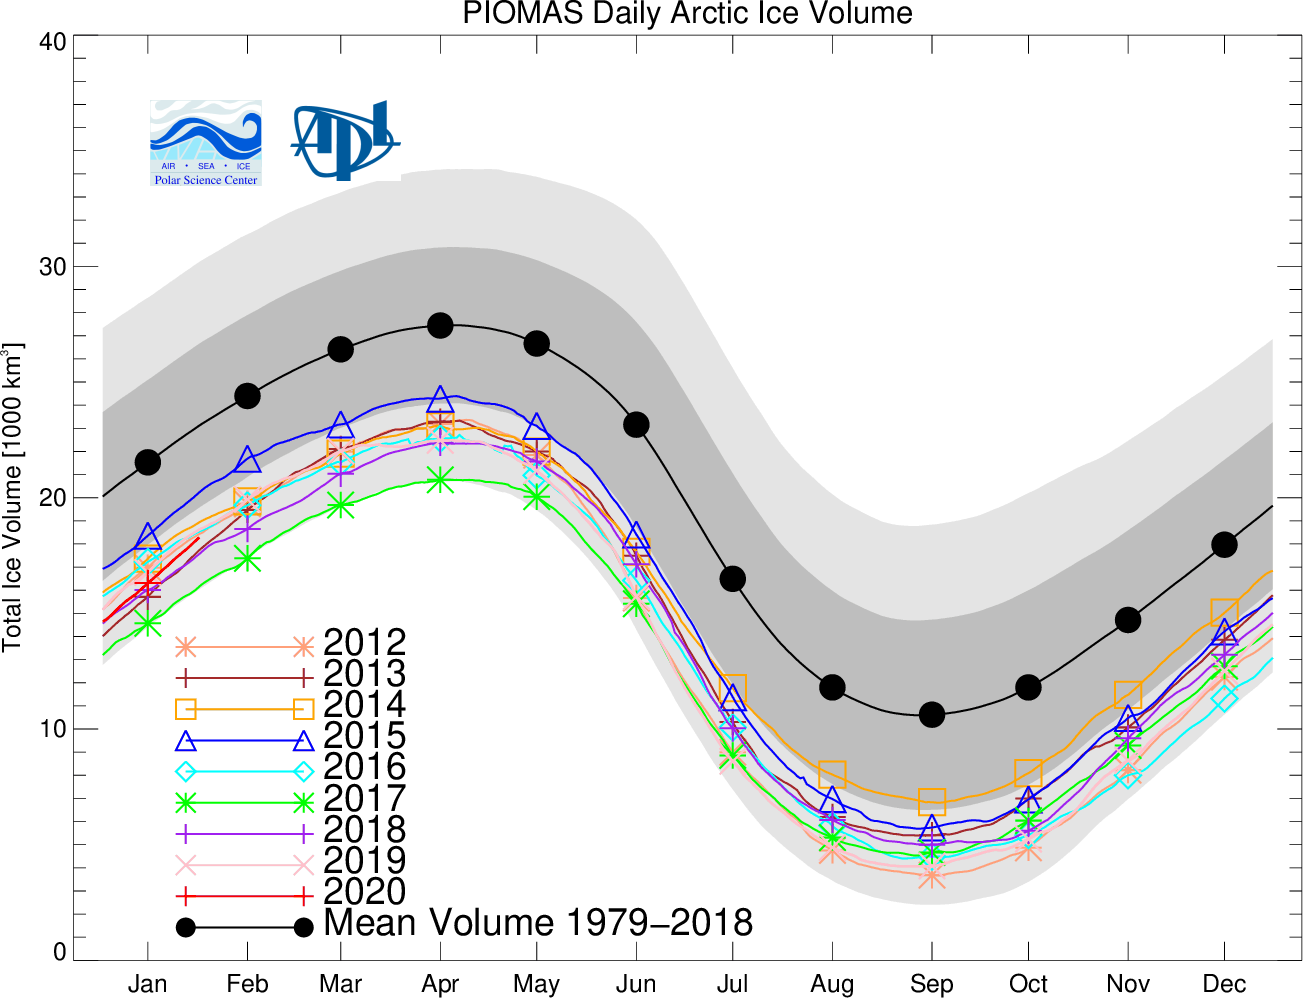
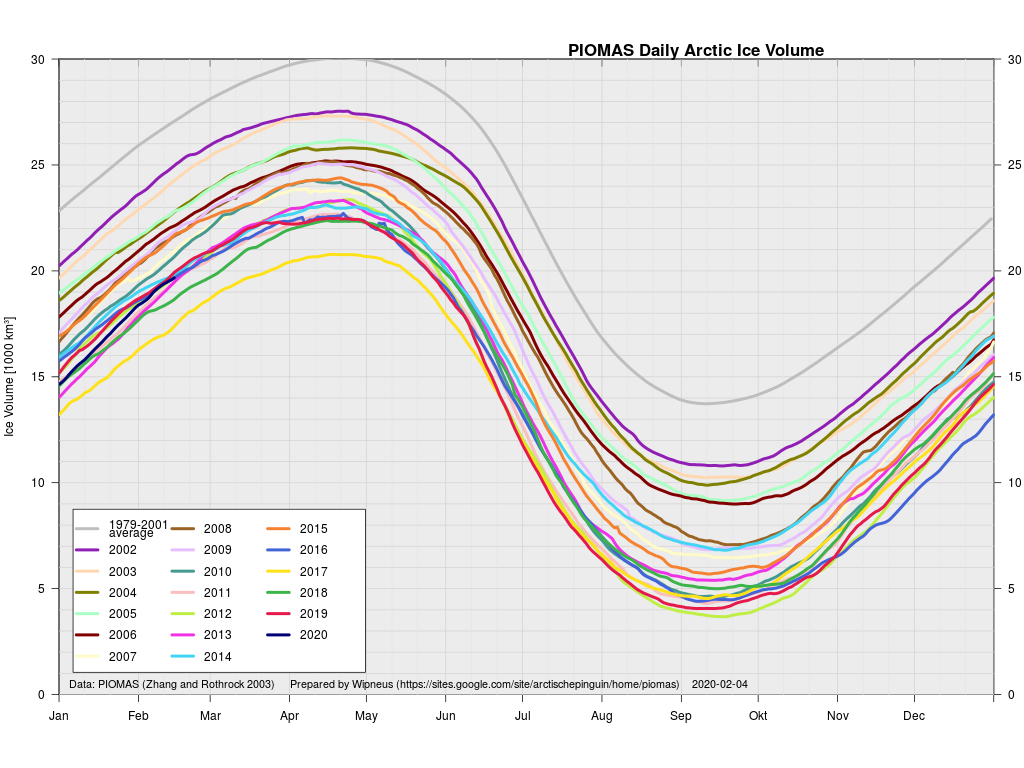
The next PIOMAS update referred to above has now arrived. Here’s the Polar Science Center’s graph:
Over on Climate Etc. angech is already exclaiming:
Strange it did go up a fair bit the old PIOMAS.
No publicity at the usual going down sites.
Actually it’s not at all strange, because thus far this winter the polar vortex has been remarkably well behaved. By and large cold air air has stayed in the Arctic. There hasn’t been much in the way of cold air intrusions into mid latitudes or warm air intrusions into the Arctic.
Hence it’s not at all surprising that the thickness of sea ice in the Arctic has been increasing slightly more quickly this winter than in other recent years. By way of some longer term context, here are the official Polar Science Center min/max trends:
[Edit – February 4th PM]
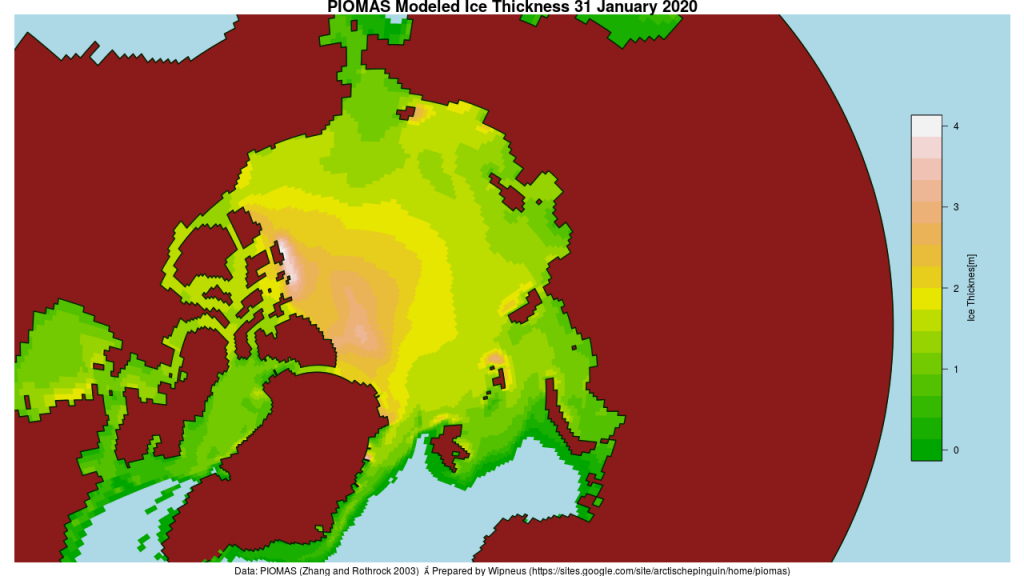
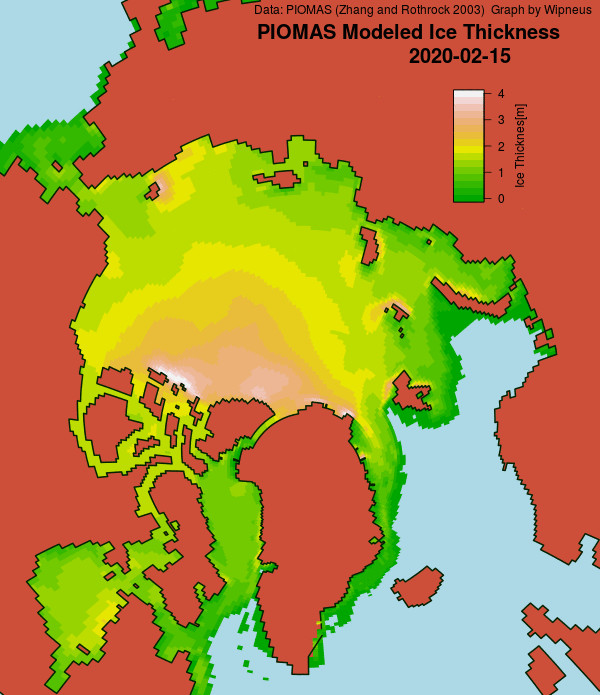
Wipneus has just released the January PIOMAS gridded thickness map. Here it is:
[Edit – February 5th]
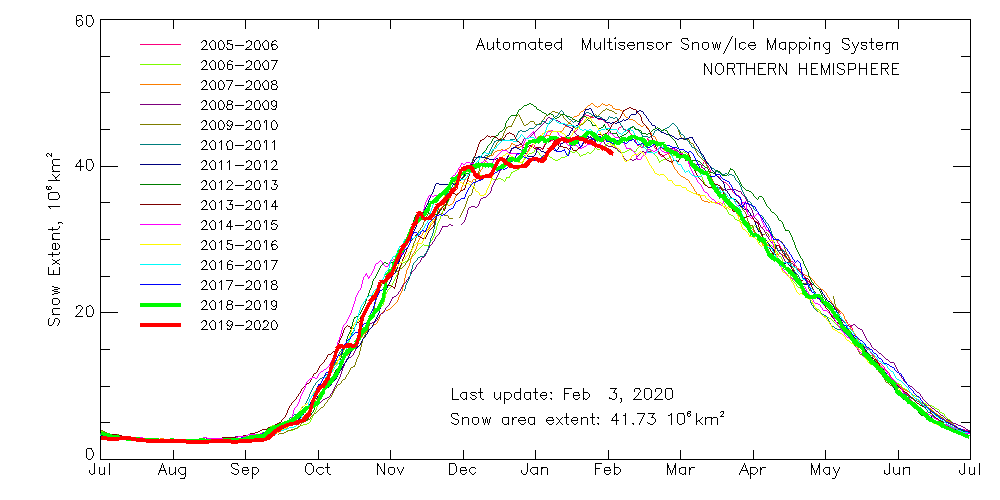
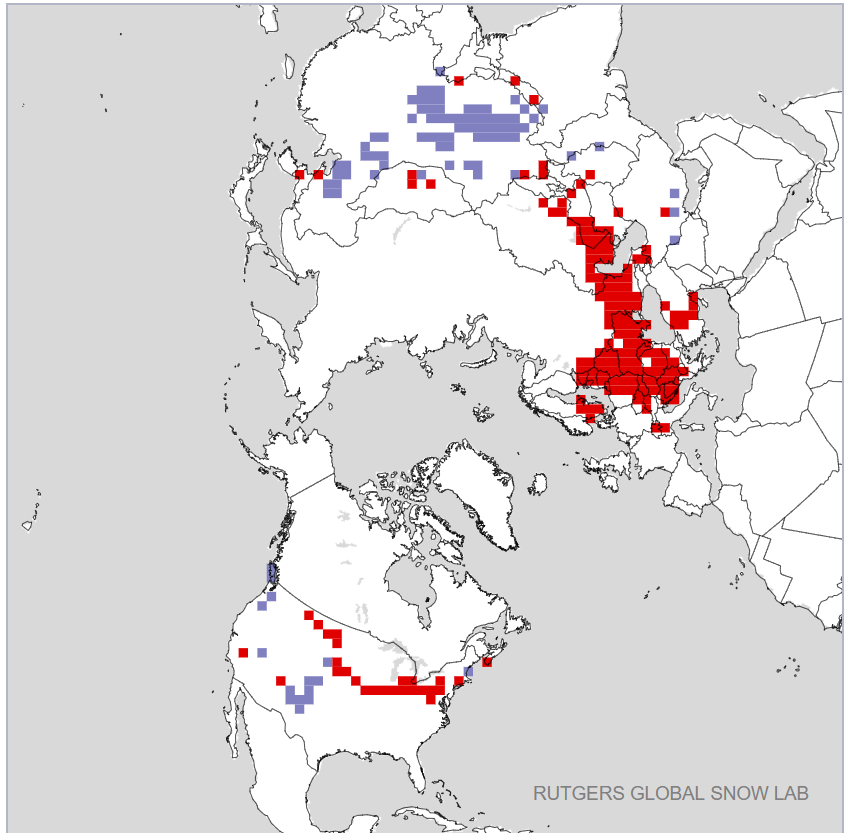
As is all too frequently the case, AdR and other commenters below get very excited about trivial increases in sea ice extent without considering snow extent. One side effect of the lack of cold air outbreaks into mid latitudes so far this winter currently looks like this:
[Edit – February 6th]
The AWI and PIOMAS sea ice thickness maps above look somewhat different at first glance. That being the case, I’ve written a program to crunch the AWI numbers. Here’s the result:
The source code plus raw and processed data can be accessed via the Arctic Sea Ice Forum:
Further support for my “polar vortex” theory, from Judah Cohen no less!
I think this plot best sums up the #winter for the Northern Hemisphere –#PolarVortex strength bouncing around from near (daily) record strong to normal all winter long. One more near record strong (PV) for latter half of February. Pretty much the nail in the coffin on this winter pic.twitter.com/OiSZw07VOF
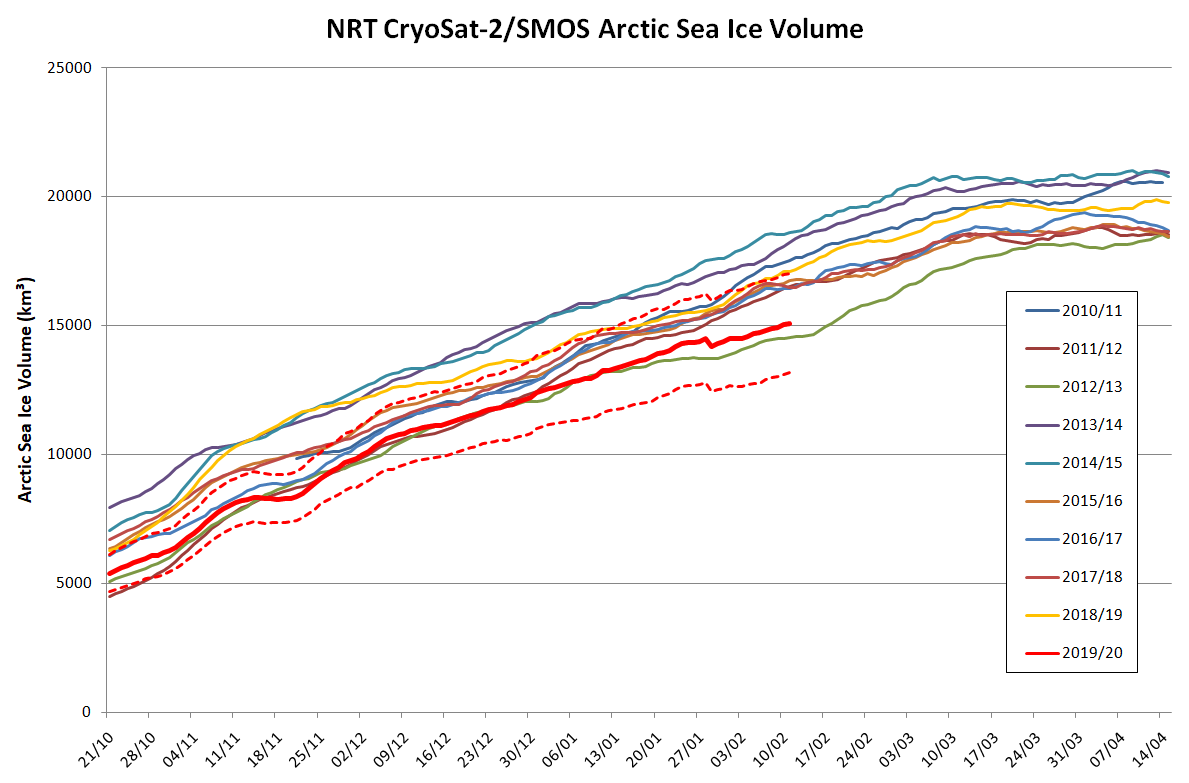
I am forced to ponder once again why the CryoSat-2/SMOS thickness “measured” numbers just above seem to be more at variance with PIOMAS in 2020 than in previous years:
[Edit – February 22nd]
Here’s another weekly NRT volume update:
This time I’ve left off the NRT data from February 6th onwards, since the “issue” referred to above obviously hasn’t been solved yet. As an added bonus here’s a graph showing the trends (or lack thereof) on 3 dates during the October to April freezing season:
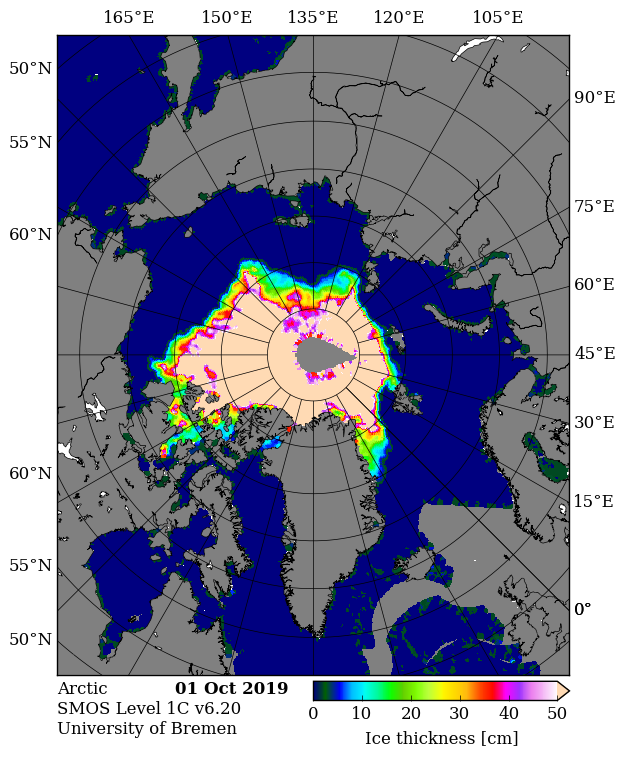
Whilst we await the PIOMAS volume numbers which generally arrive around the 5th of each month, and before we look at graphs of extent, with the refreeze well under way some “measured” thickness maps are coming back! Here’s the first SMOS map this autumn:
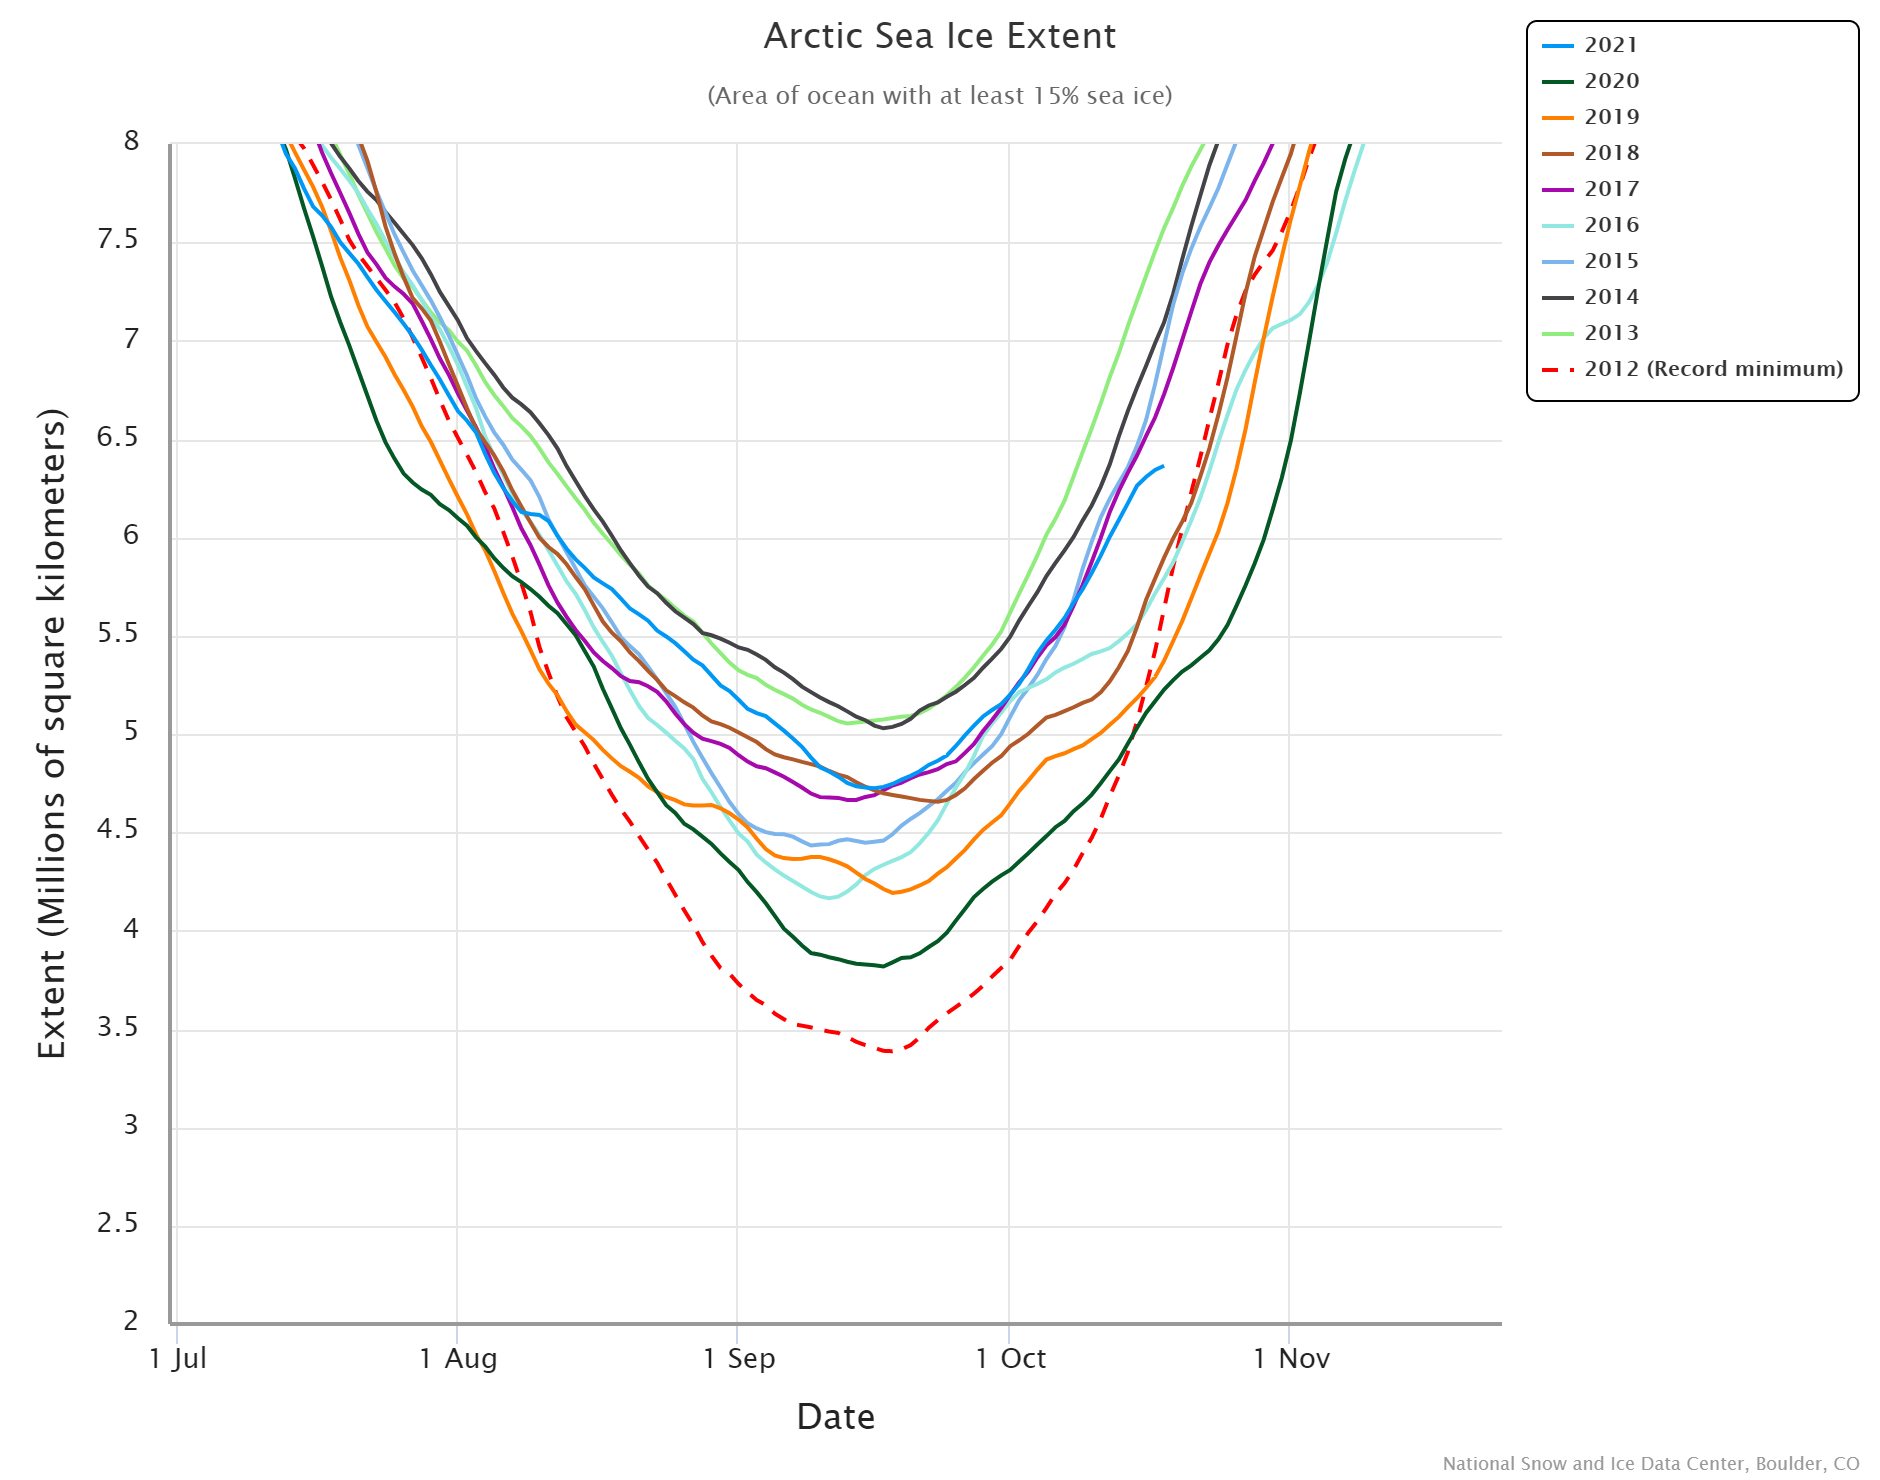
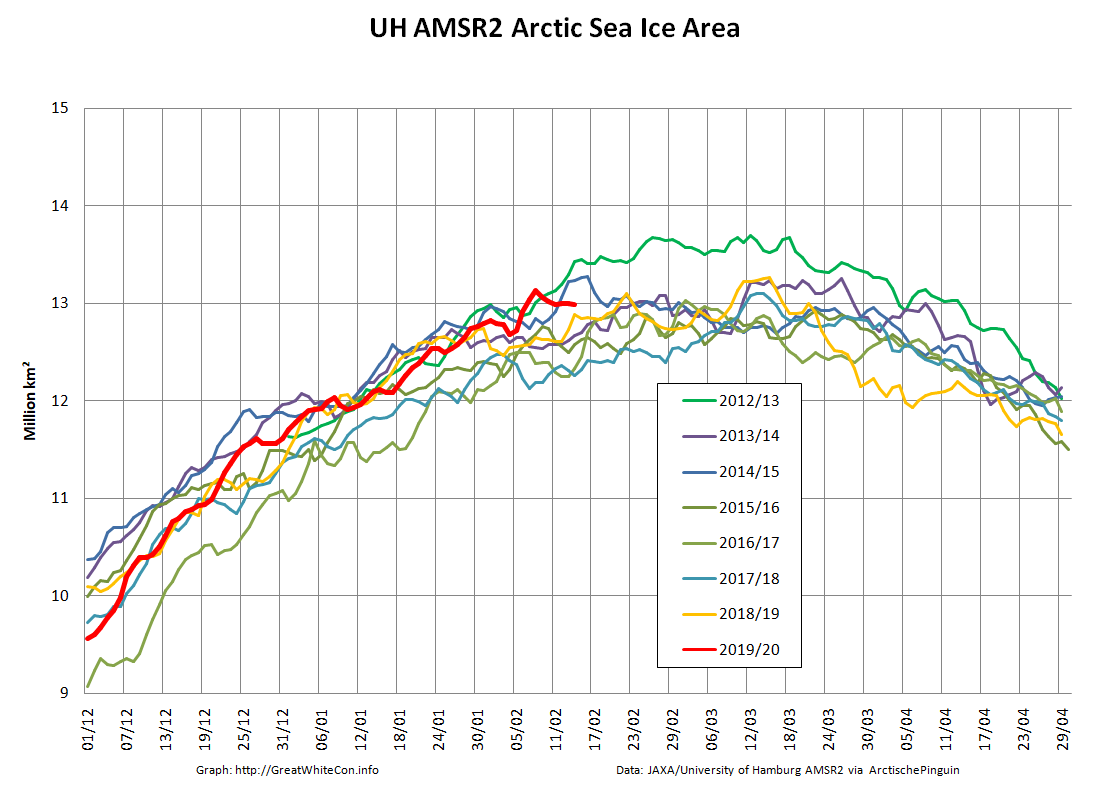
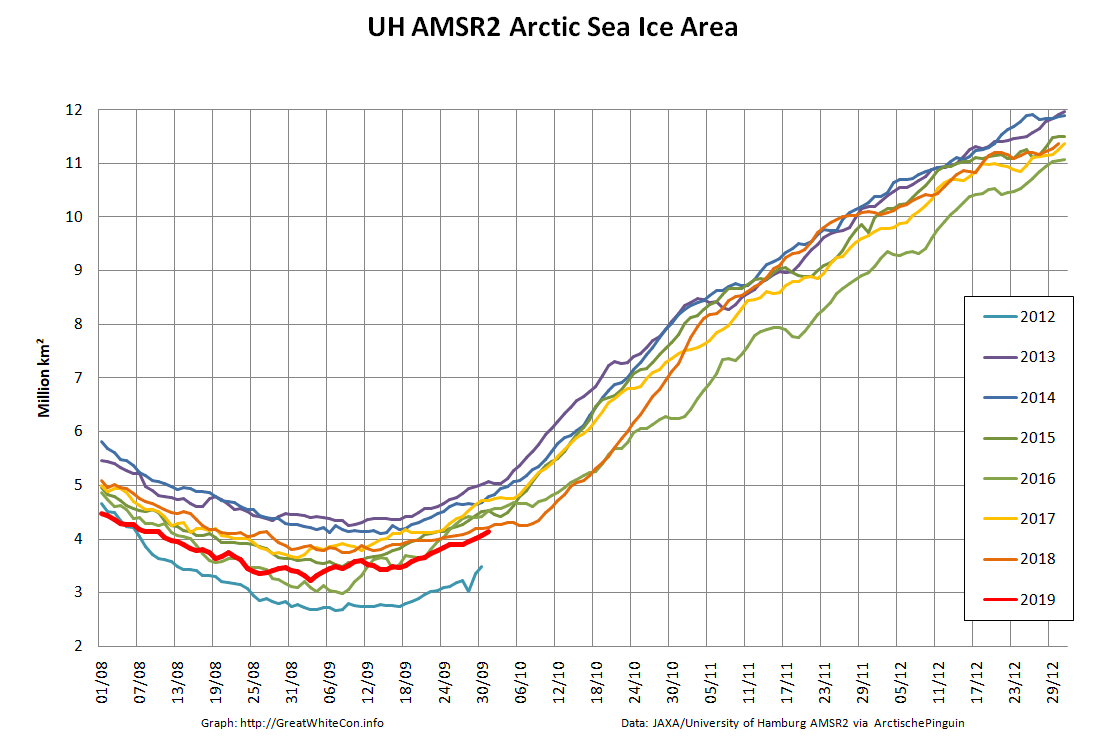
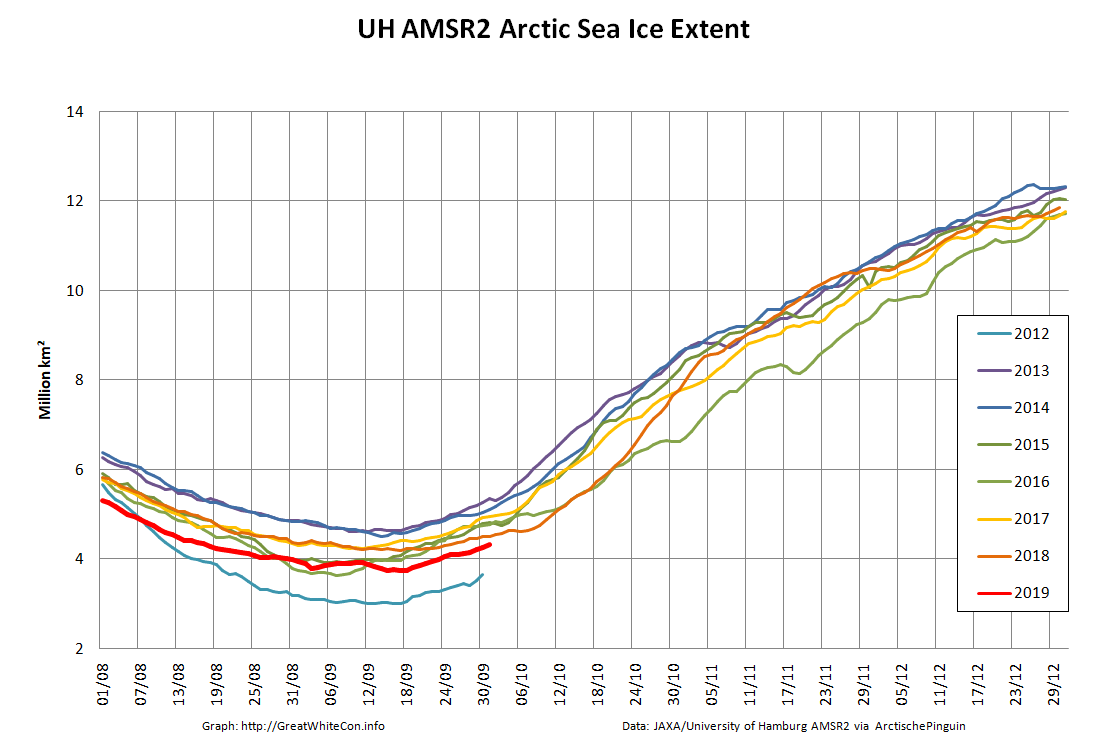
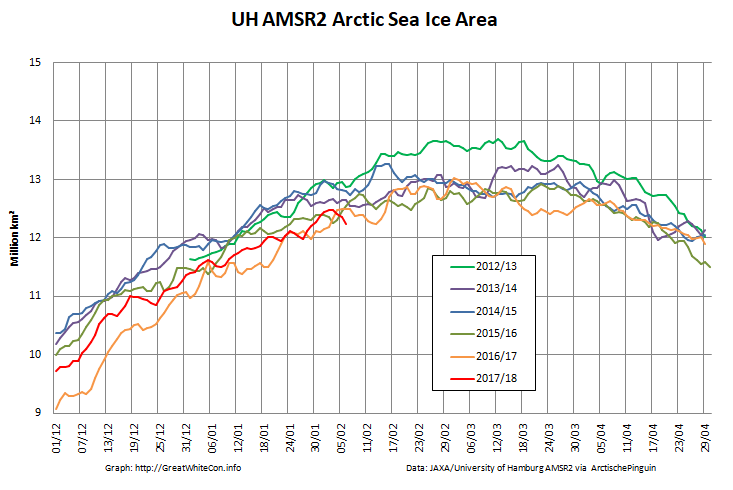
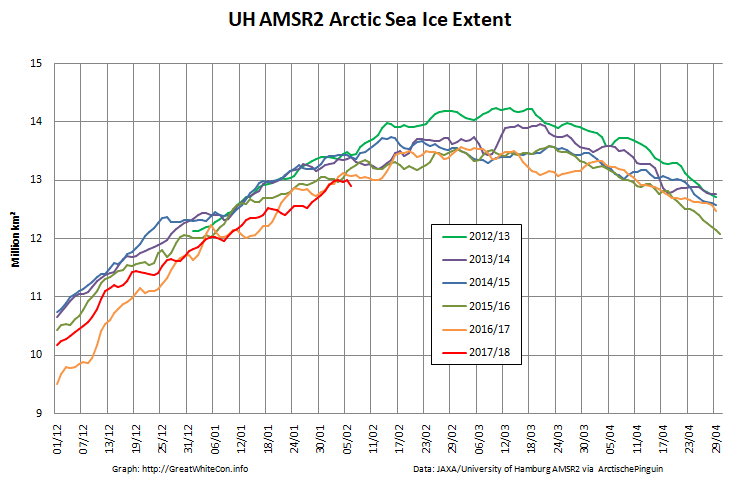
Then of course there’s our usual Arctic wide high resolution AMSR2 area and extent graphs:
They reveal both metrics currently still second lowest (in the brief AMSR2 record) after 2012. It looks as though that may well change soon, particularly area.
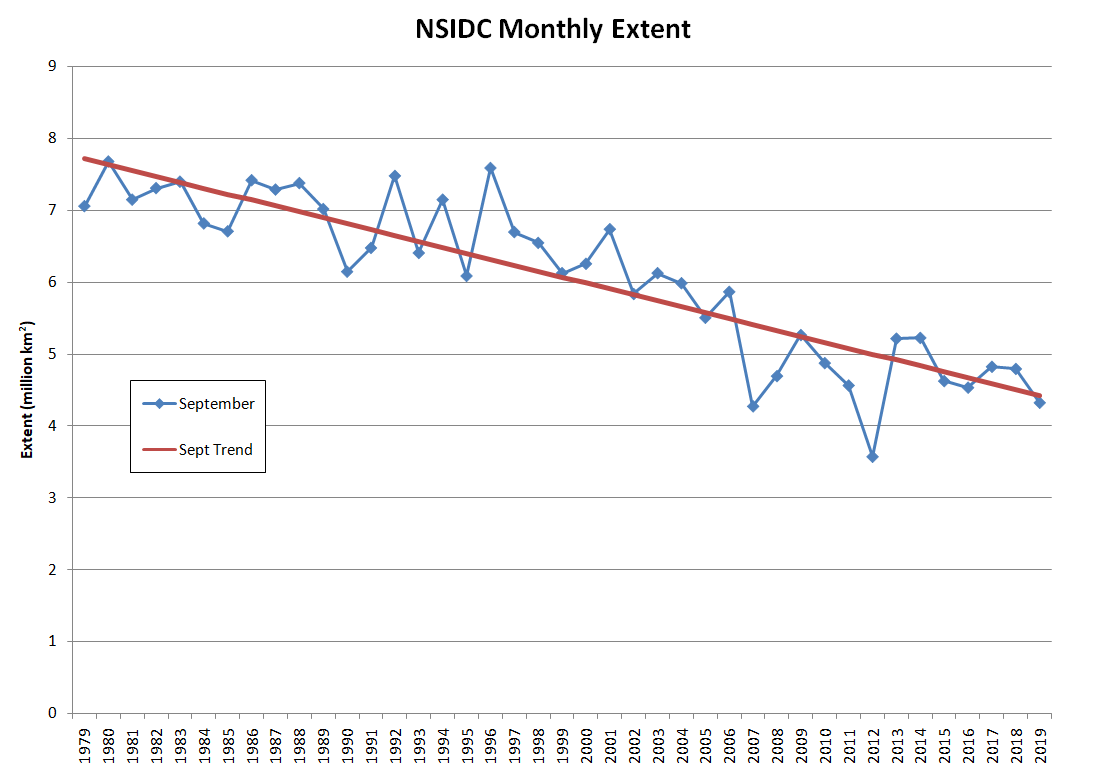
The near real time NSIDC monthly extent for September is 4.32 million km². Here’s the graph:
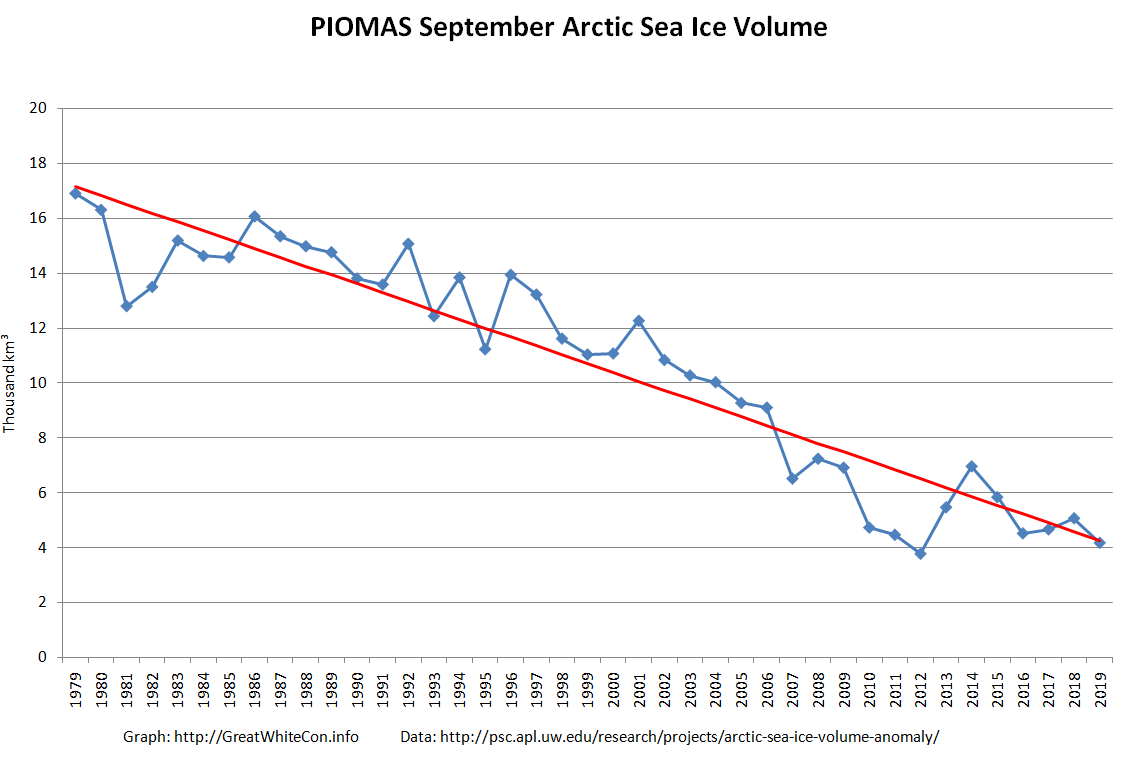
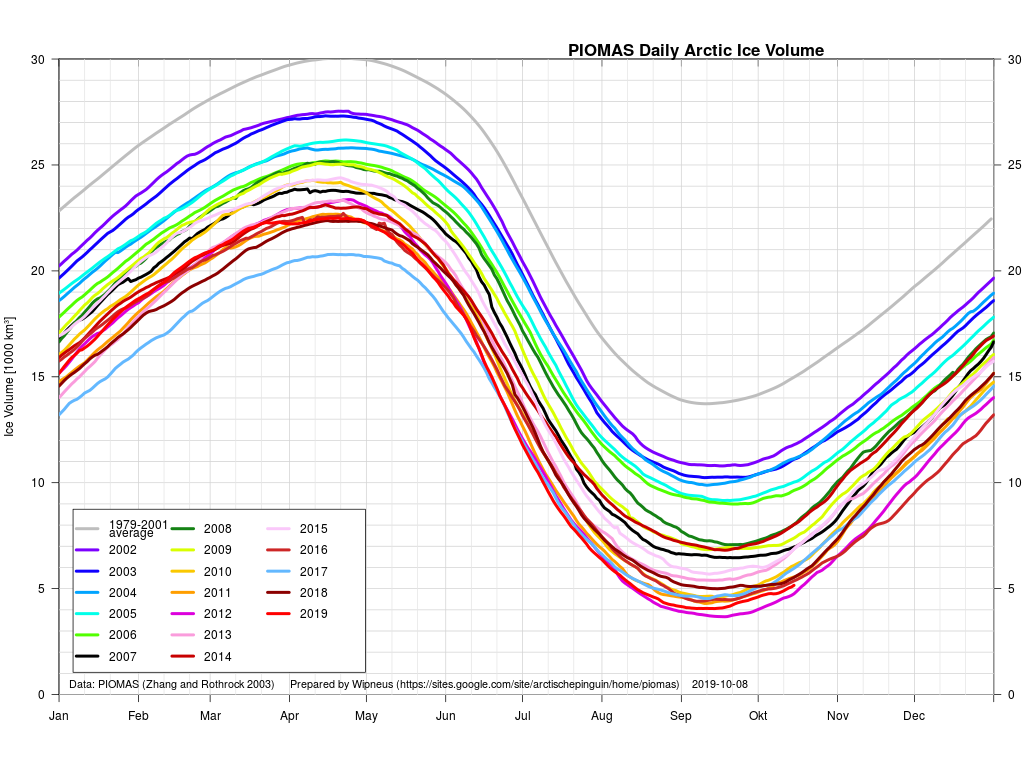
We’re eagerly awaiting the first ice mass balance buoy “near real time” data, but for now the 2019 PIOMAS minimum volume is expected to be revealed real soon now, so:
[Edit – October 5th]
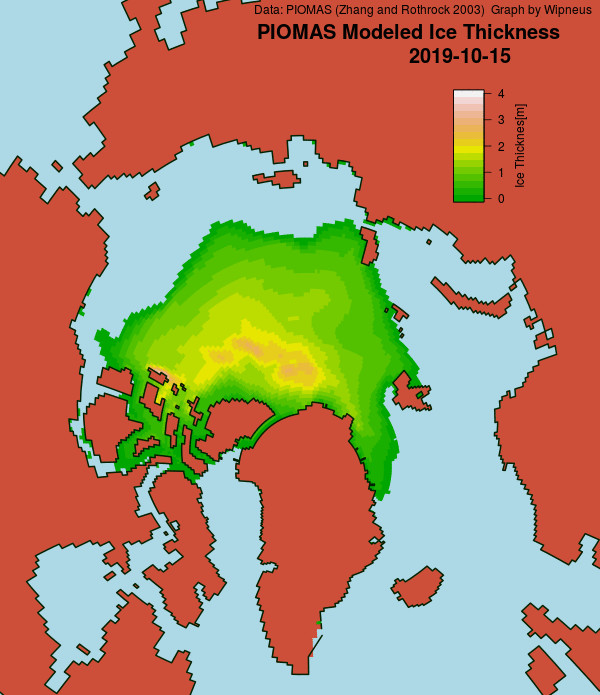
As previously perfectly predicted, the PIOMAS numbers have arrived over at the ASIF. Here’s the thickness map for the end of September:
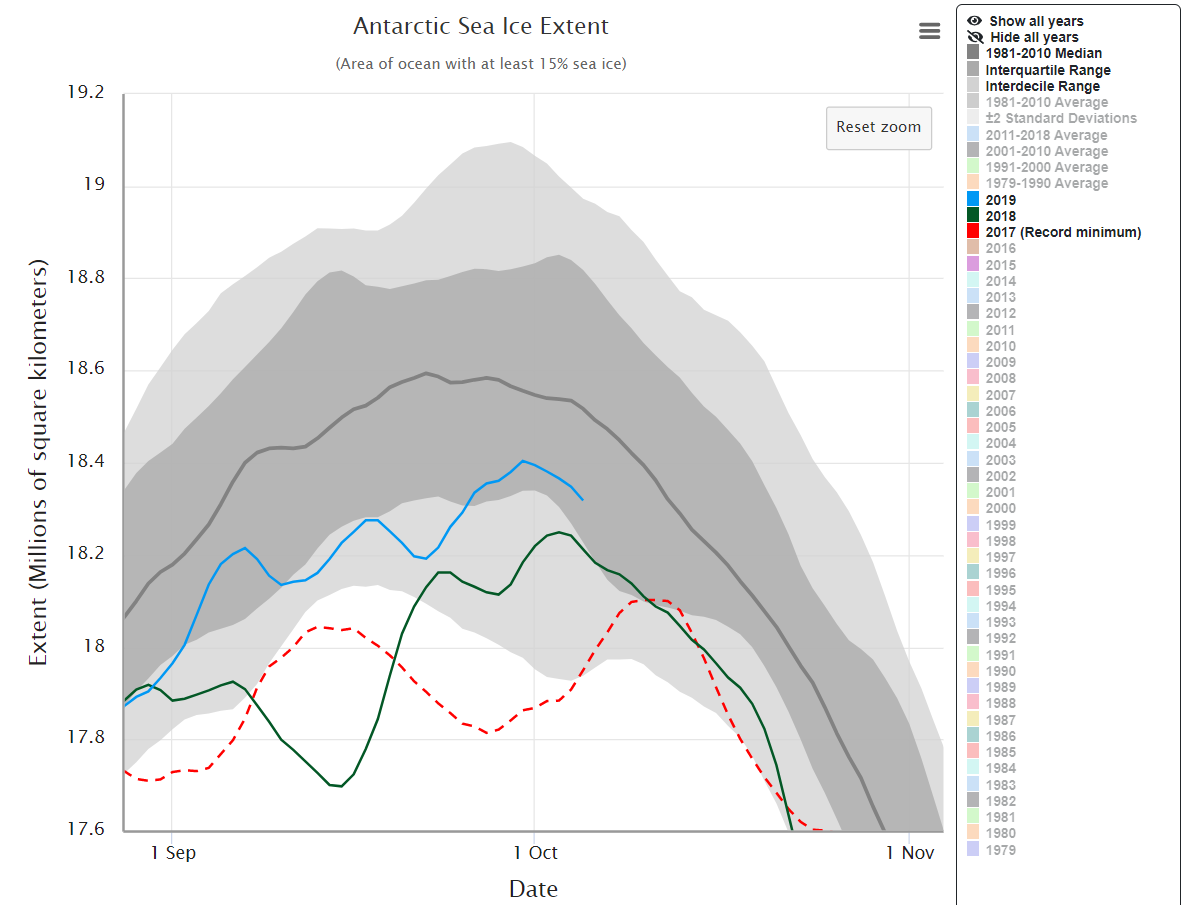
A marginally off topic excursion down under. The NSIDC 5 day average Antarctic sea extent looks to have peaked at 18.40 million km² on September 30th:
[Edit – October 7th]
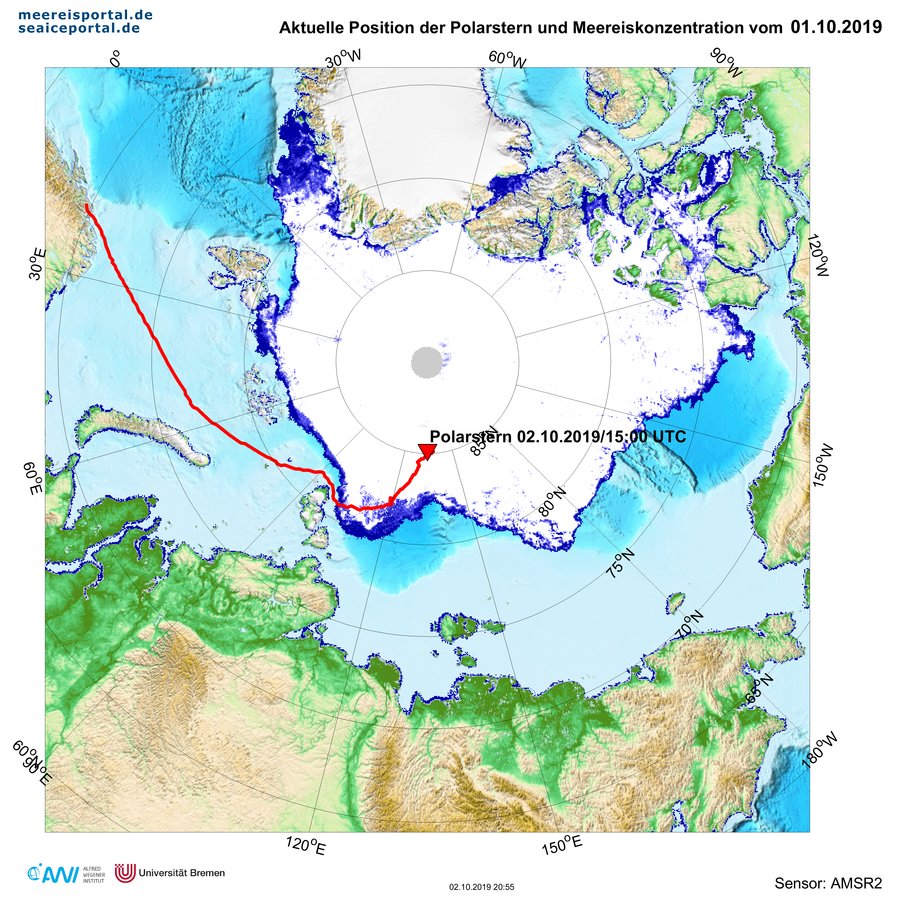
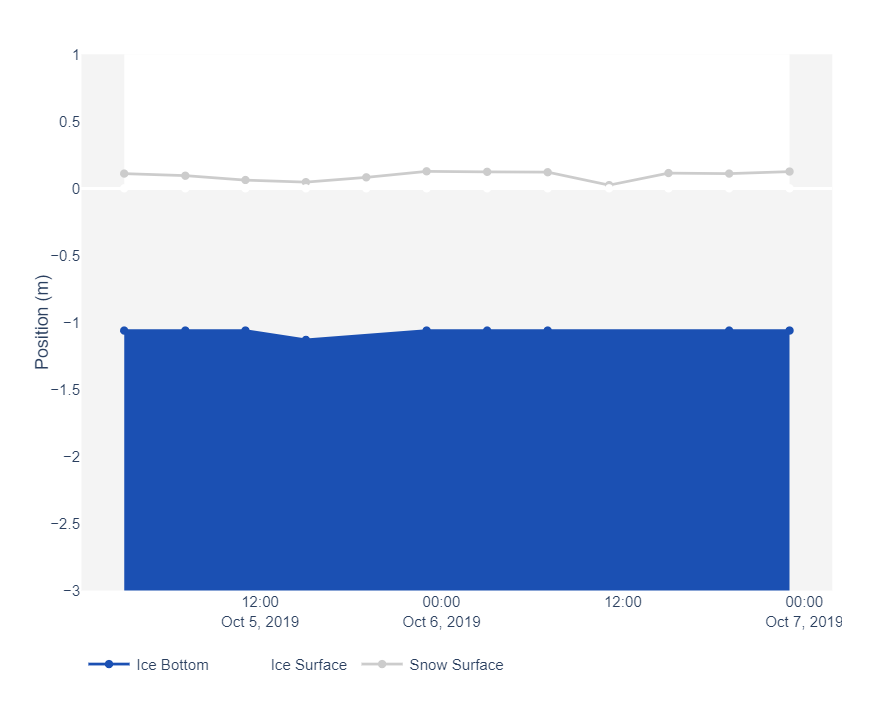
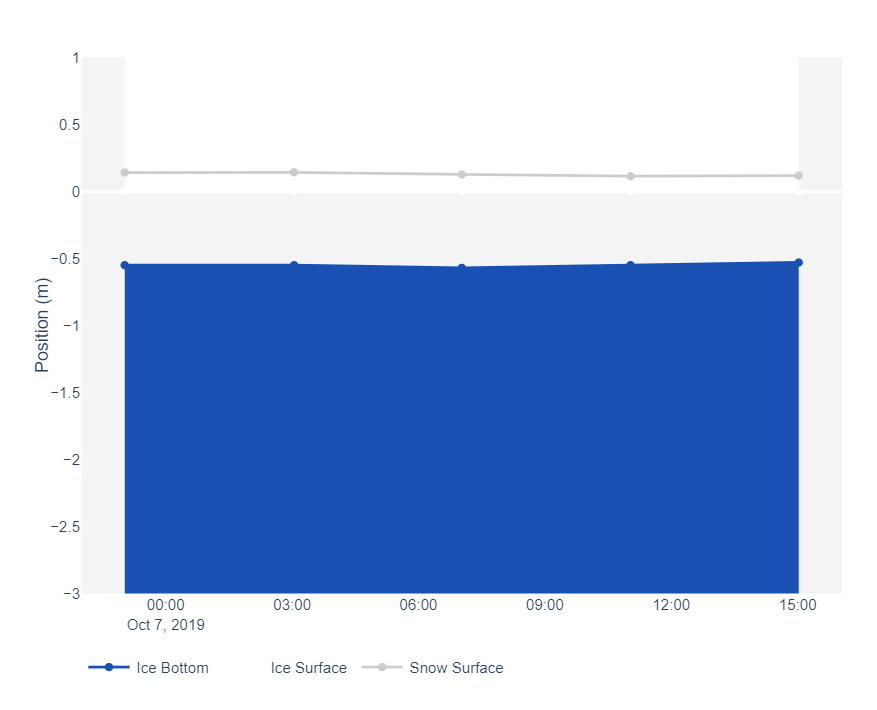
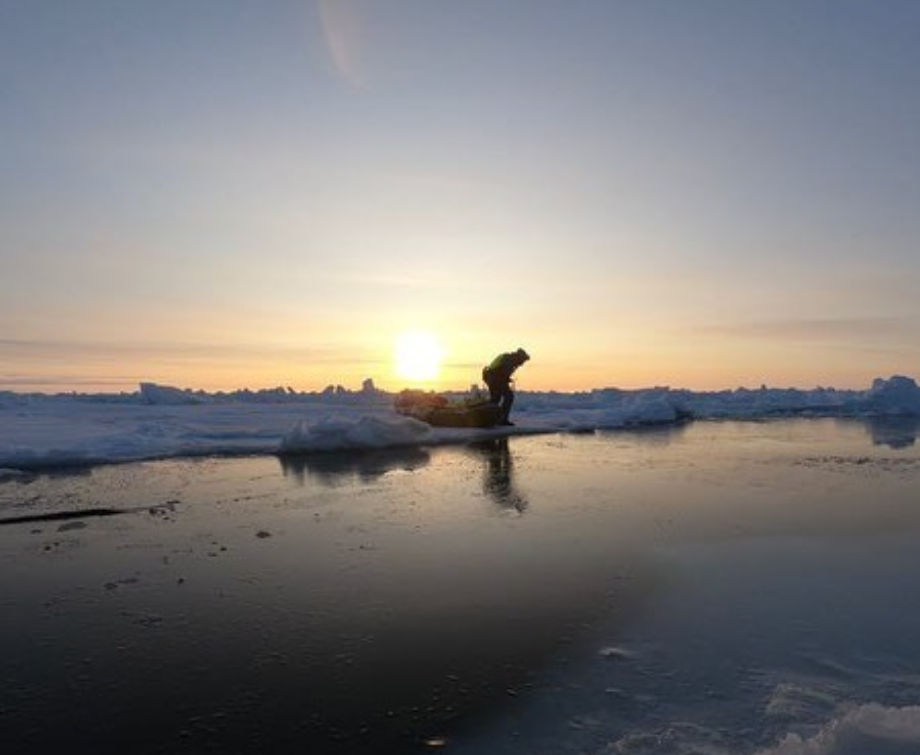
The first of the MOSAiC Expedition’s Ice Mass Balance buoys has been installed, presumably on the ice floe Polarstern is moored to. It reveals sea ice that is currently just over 1 meter thick with a sprinkling of snow on top:
P.S MOSAiC IMB buoy #3 has gone live today too:
There’s currently only 0.5 meters of ice under this one.
[Edit – October 9th]
Here’s the latest annual PIOMAS “ice cube” animation from Andy Lee Robinson:
[Edit – October 10th]
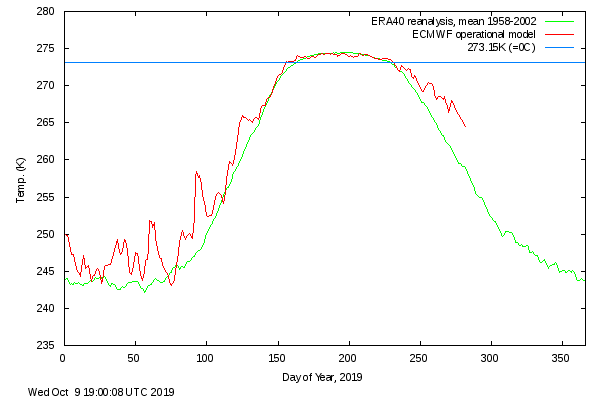
Here’s the latest DMI “high Arctic” temperature graph:
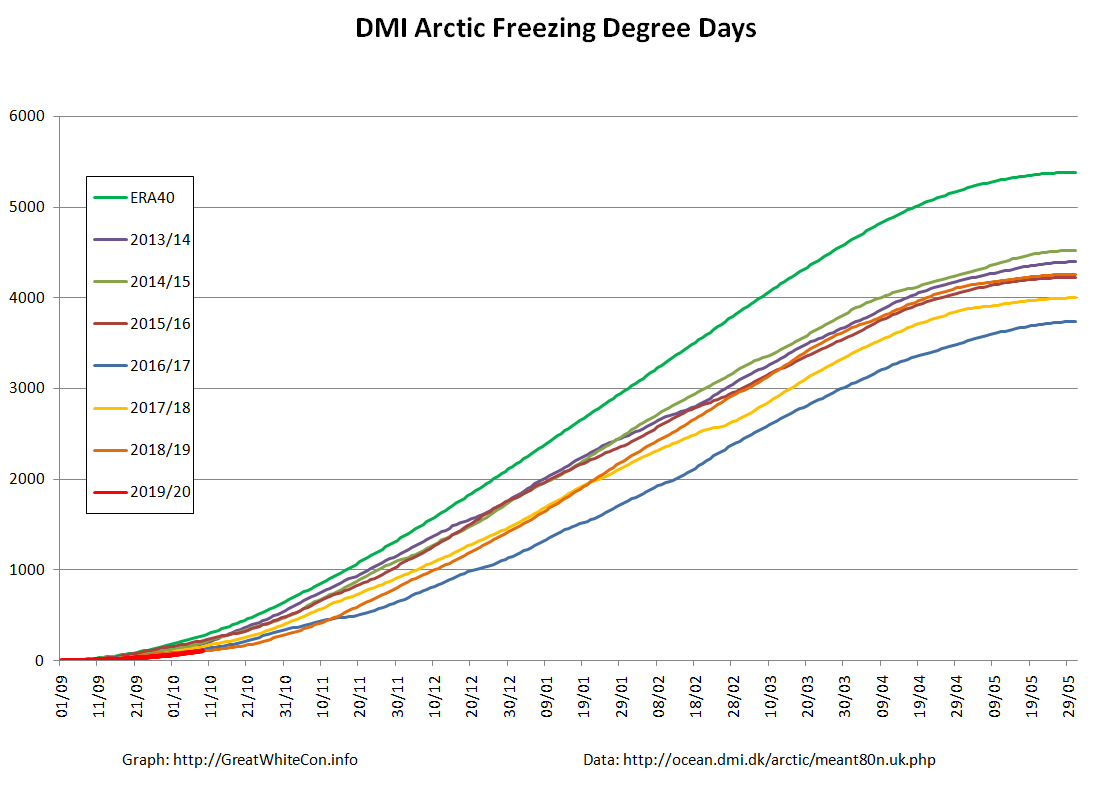
Needless to say that means the DMI Freezing Degrees Days graph is tracking the lowest readings in the DMI’s records:
[Edit – October 11th]
MOSAiC IMB buoy #2 has now been installed and is beaming back data:
The sea ice at this location is decidedly on the thin side at present. A mere 20 cm or thereabouts!
[Edit – October 12th]
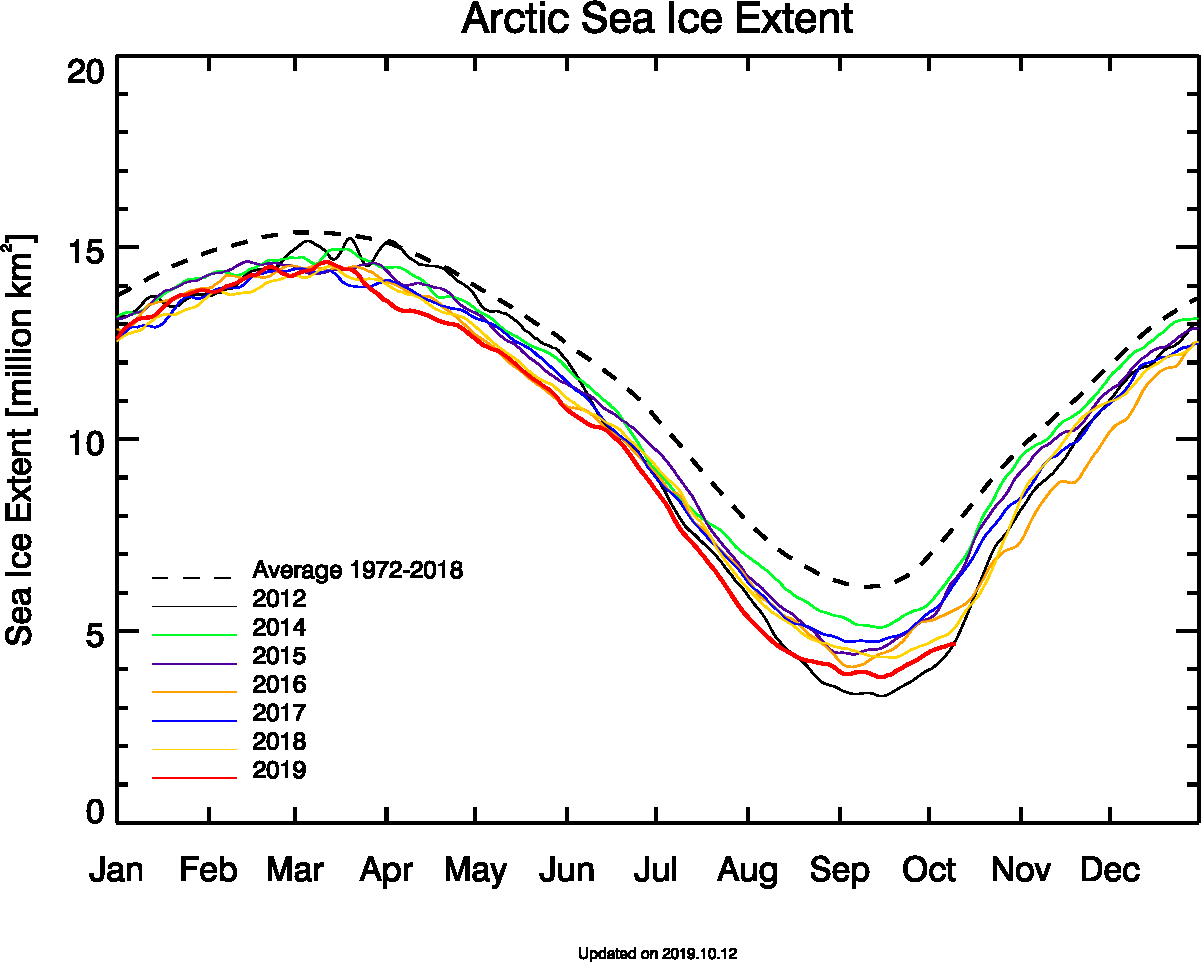
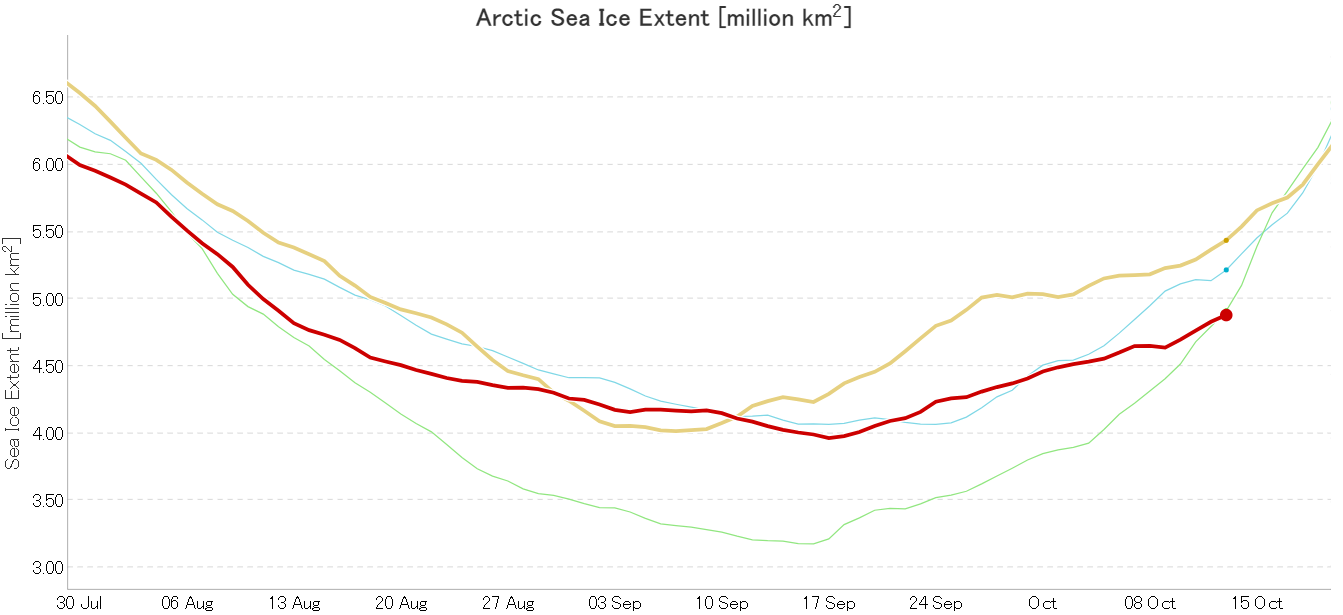
The JAXA ViSHOP web site is down at the moment, so by way of a change here is the University of Bremen’s AMSR2 based extent graph instead:
2019 Arctic sea ice is extent is now once again “lowest for the date” (since AMSRx satellite records began).
[Edit – October 14th]
The JAXA/ADS/ViSHOP web site is back online after being down over the weekend, presumably due to the effects of Typhoon Hagibis:
Sure enough the Japanese flavour of AMSR2 based extent is also now “lowest for the date”.
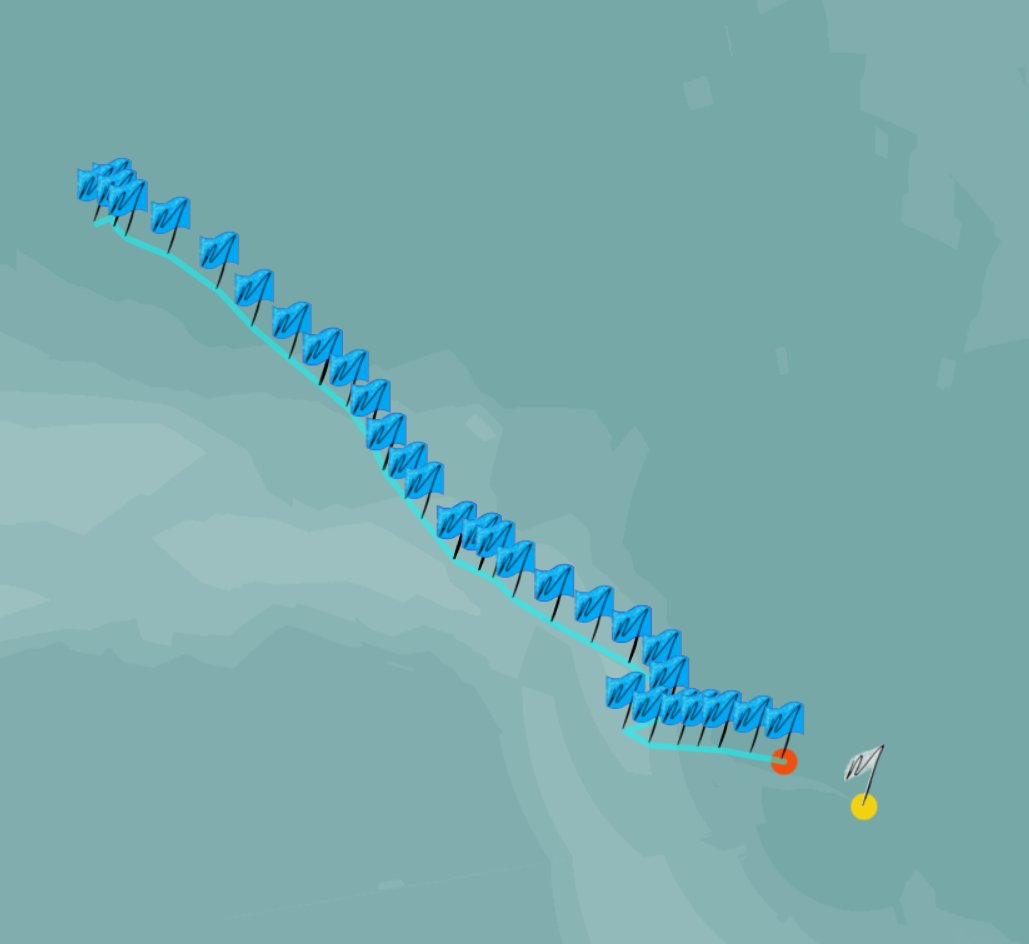
Mike and Borge’s current position was reported yesterday as: 89°35′51″N 140°30′32″E
[Edit – October 15th]
The latest SMOS Arctic sea ice “thinness” map shows sea ice starting to form on the shores of the Laptev Sea:
[Edit – October 16th]
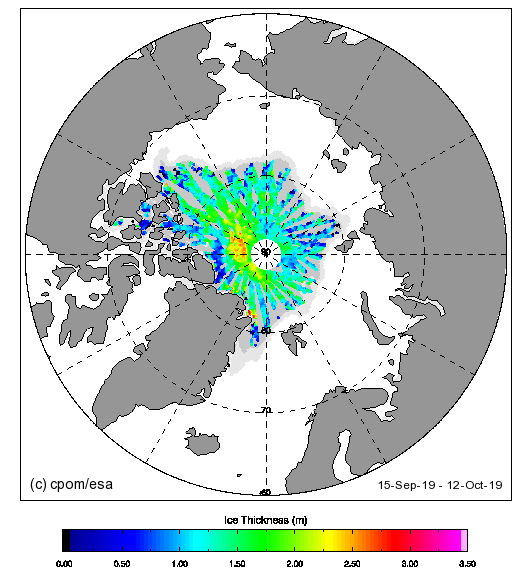
The Centre for Polar Observation and Monitoring (CPOM) have just published the first CryoSat-2 Arctic sea ice thickness map of the 2019/20 freezing season:
Note in particular the dark blue area north of the Canadian Arctic Archipelago.
[Edit – October 20th]
Wipneus has just crunched the October mid month PIOMAS numbers. Here are the results. Not only the modelled Arctic sea ice thickness map:
but also the Arctic sea ice volume graph:
[Edit – October 21st]
Over on Twitter Judah Cohen suggests that:
Maybe I will discuss more in the next blog but the #Arctic sea ice growth season on the North Pacific side of the Arctic is just nuts, like it is drunk! Looks unprecedented to me. This needs to be watched through the #winter. Already had 2 unprecedented winters in the Bering sea pic.twitter.com/sAVoZXgNAX
I have been trying to bring the implications of this to the attention of the denizens of Judith Curry’s “Climate Etc.” blog, thus far with remarkably little success! This is the gist of my argument:
“Summer solar heat absorption by the surface waters has increased fivefold over the same time period, chiefly because of reduced sea ice coverage.”
“The effects of an efficient local ice-albedo feedback are thus not confined to the surface ocean/sea ice heat budget but, in addition, lead to increased heat accumulation in the ocean interior that has consequences far beyond the summer season.”
“In the coming years, however, excess Beaufort Gyre halocline heat will give rise to enhanced upward heat fluxes year-round, creating compound effects on the system by slowing winter sea ice growth.”
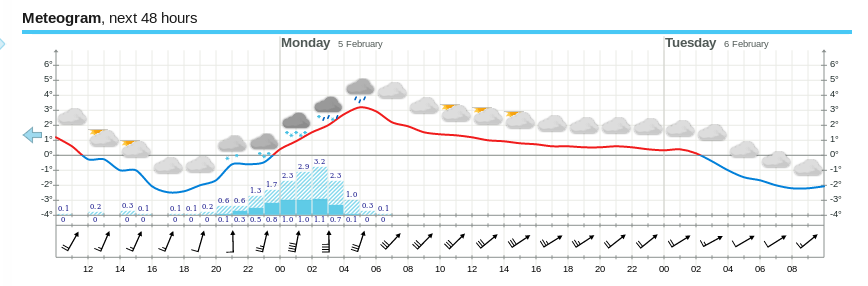
Much like last month, temperatures are above zero and rain is forecast. That’s because once again the current synoptic chart from Environment Canada shows a warm wet flow from way down south over Svalbard and on into the Central Arctic:
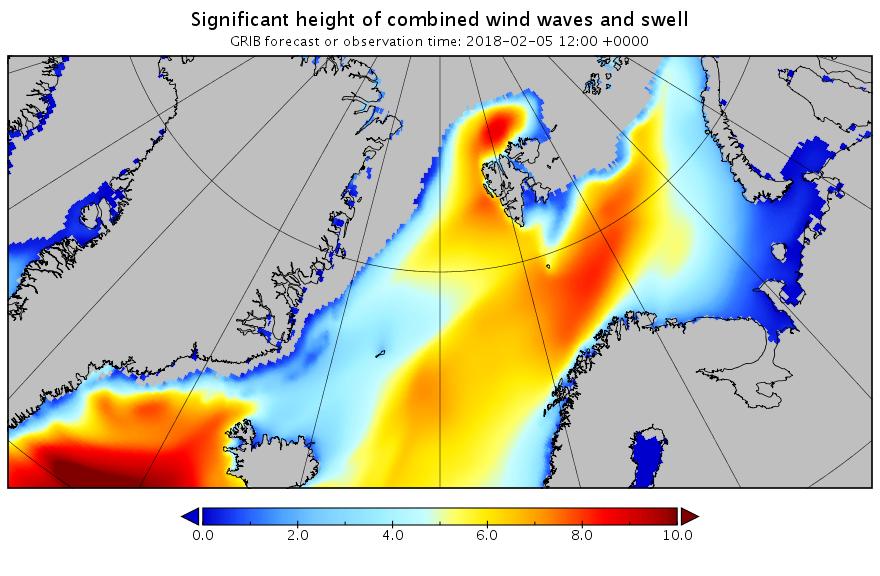
Next here’s the current combined wave and swell height forecast for the Svalbard area:
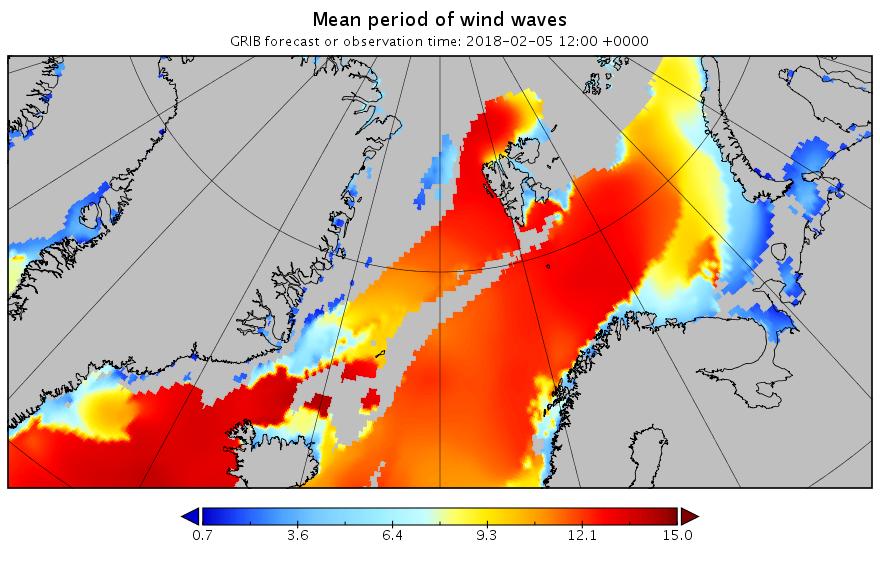
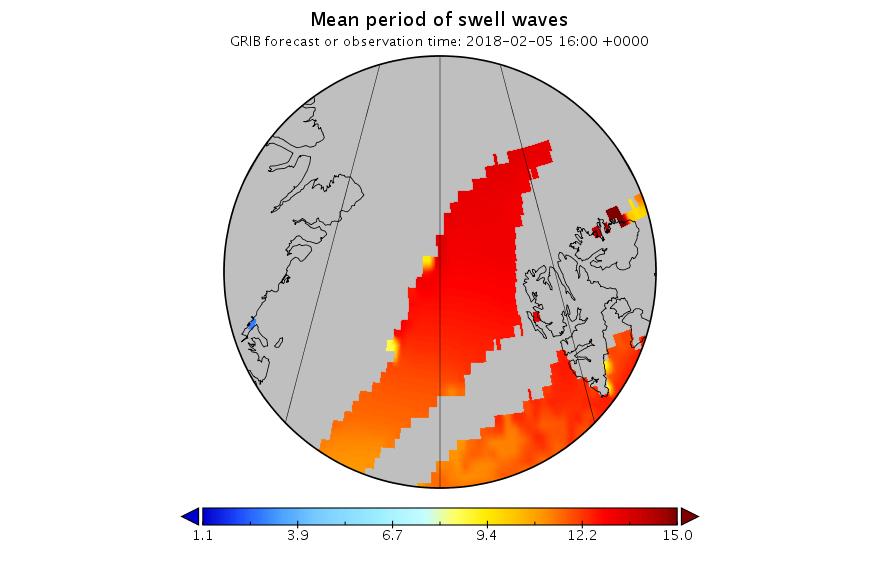
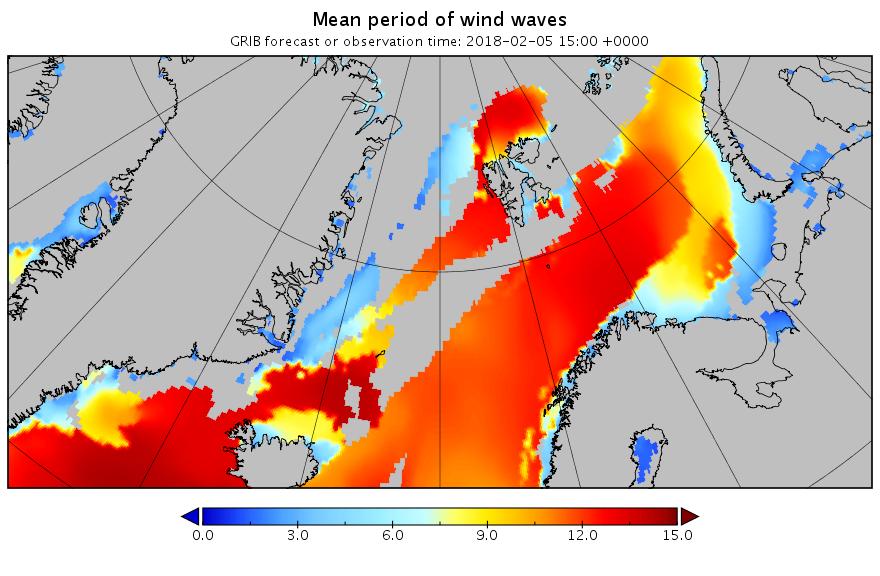
and here’s the associated wave period forecast:
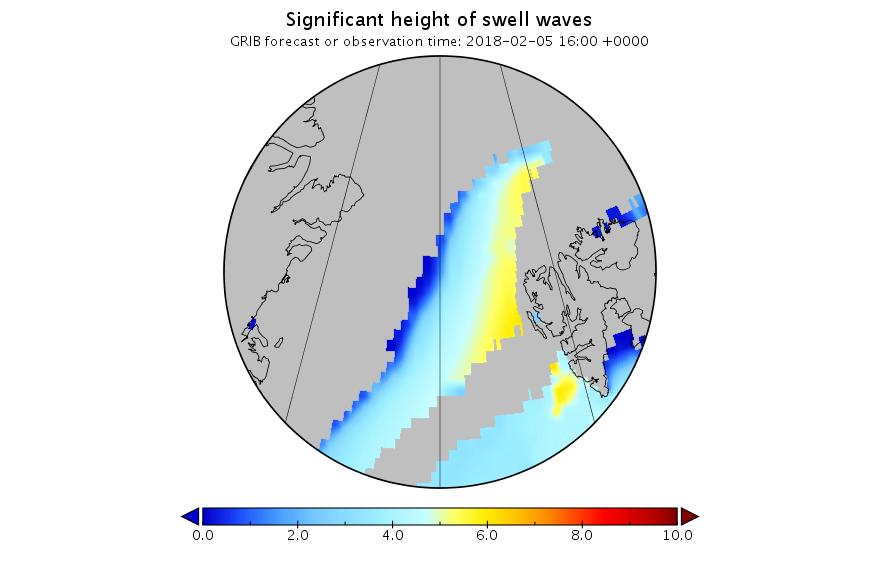
It’s still showing 10 meter waves with a 15 second period north of Svalbard tomorrow lunchtime. Somewhat unusually for the Arctic these aren’t merely giant wind waves. Zooming in on the Fram Strait and breaking out the underlying primary swell reveals:
A long distance swell of that magnitude is going to cause some damage.
[Edit – February 5th]
The current ECMWF forecast for a split polar vortex, courtesy of Ice Shieldz on the Arctic Sea Ice Forum:
This is suggestive of more cyclones to come, but sticking with the current one for now, here is the MSLP chart at 00:00 UTC this morning showing the cyclone’s central pressure has dropped to 952 hPa:
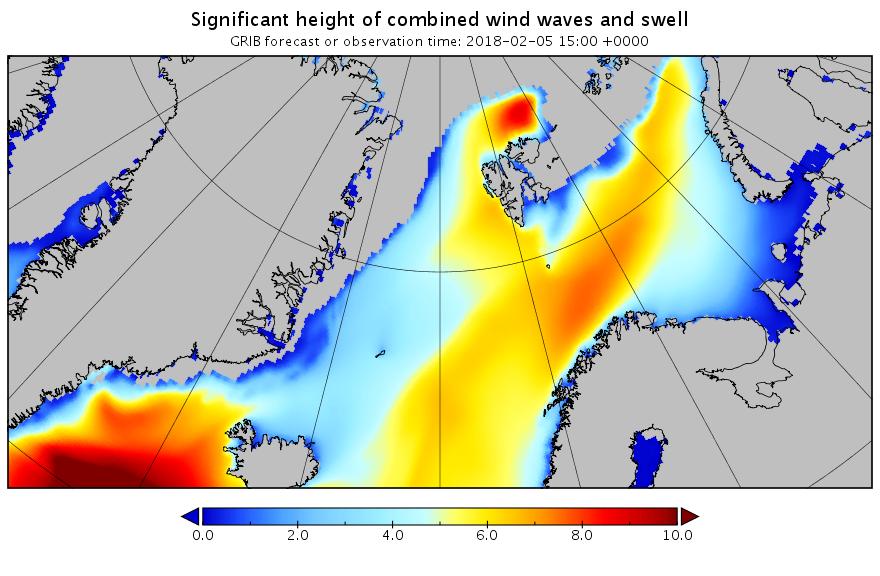
Here too is the current WaveWatch III forecast for 15:00 UTC today:
The peak of the swell north of Svalbard is now slightly later than originally forecast, but it’s still enormous!
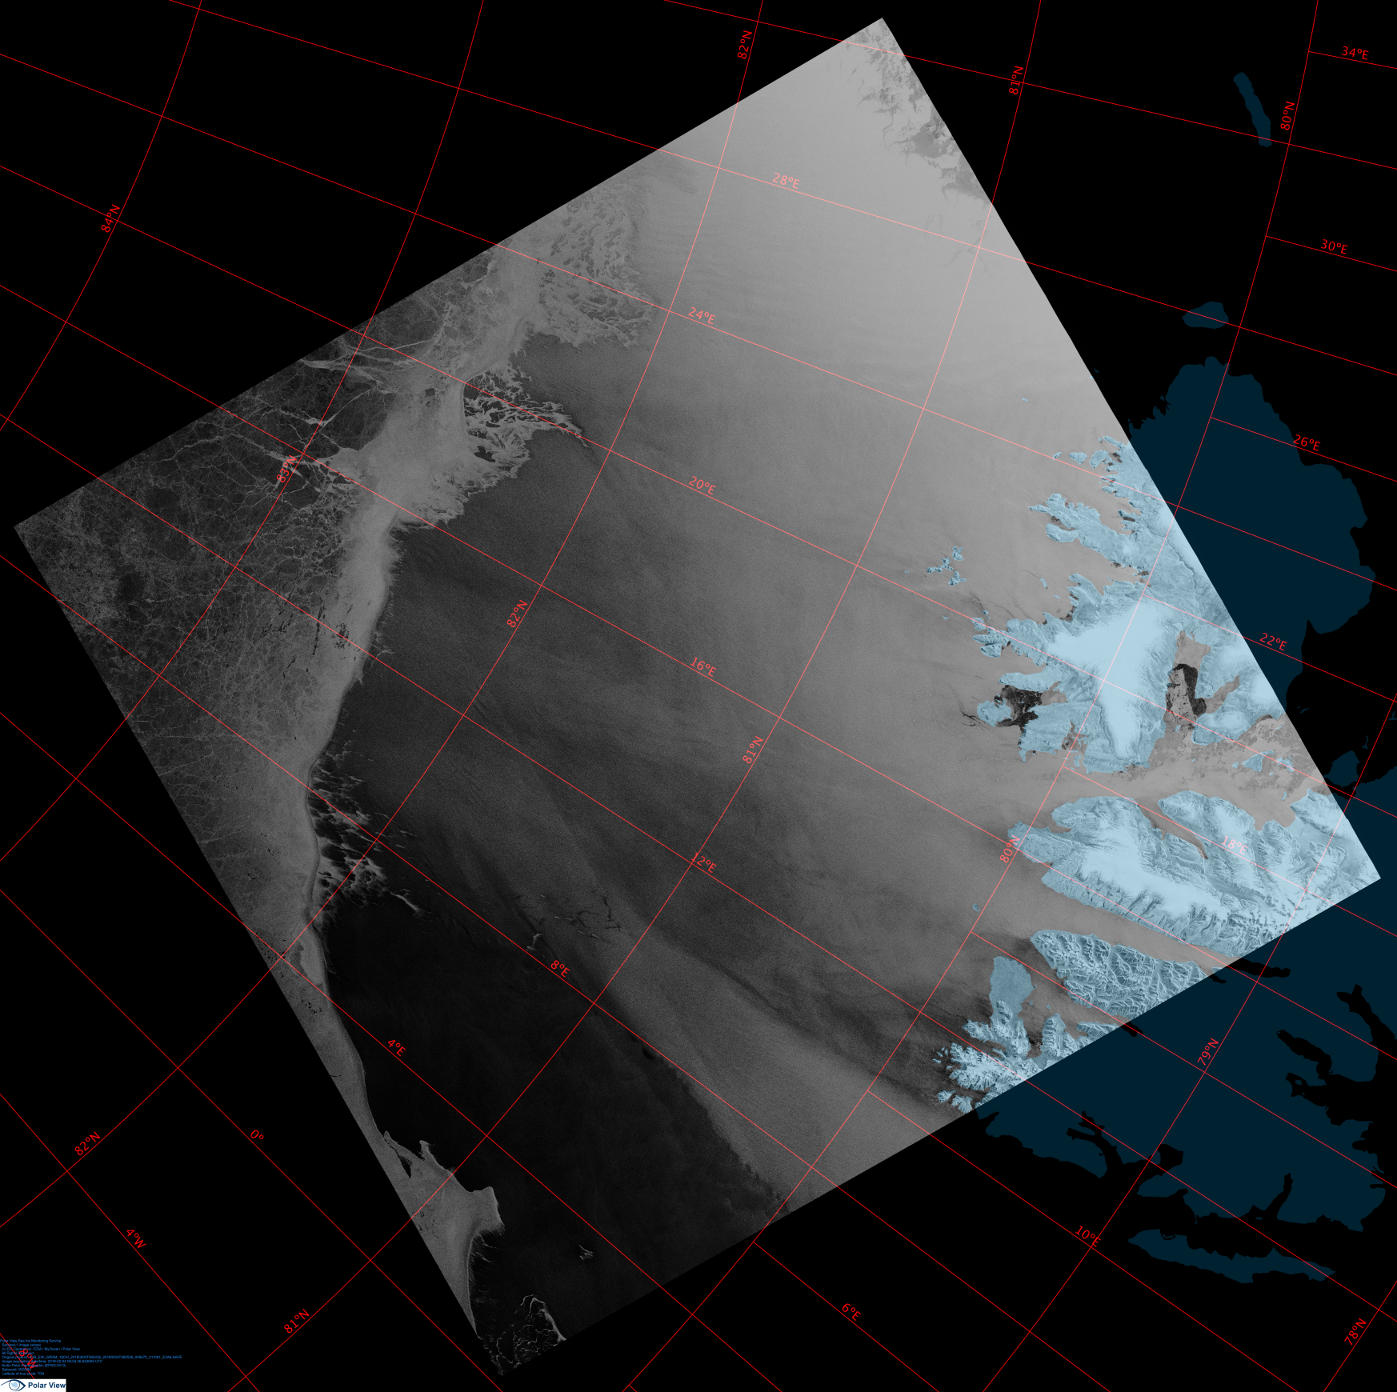
Here’s a single Sentinel 1B synthetic aperture radar image that captures the position of the ice edge north of Svalbard yesterday quite nicely:
[Edit – February 7th]
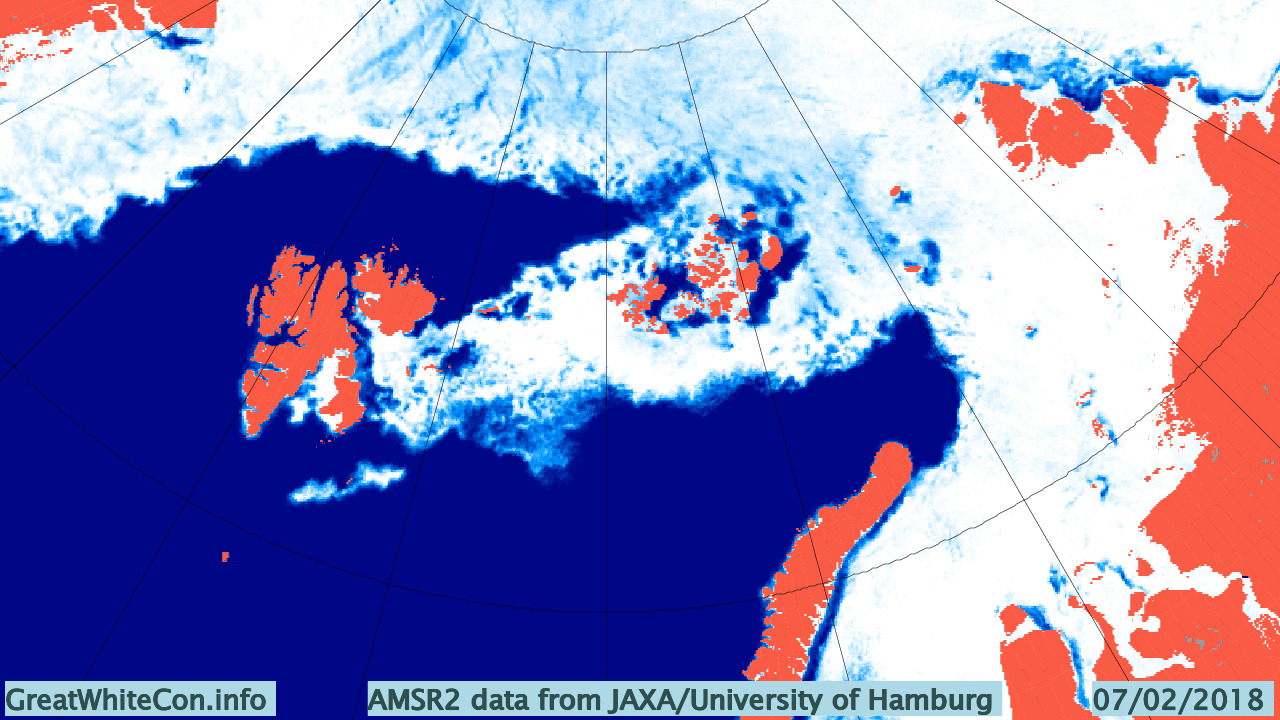
A brief overview of the effect of the recent cyclone on the sea ice in the Arctic via AMSR2:
Click the image to animate it.
[Edit – February 8th]
An Arctic wide take via Thomas Lavergne on Twitter:
Your daily update on the "big low entering #SeaIce". The "spin" in motion moves East towards Severnaya Zemlya. Some opening from land there, increased flushing through Fram Strait. pic.twitter.com/q4m1CRhmtS
An interesting insight into CryoSat-2 sea ice thickness measurements from Stefan Hendricks on Twitter:
Radar altimetry tells you how far the surface waves penetrate into the #seaice cover. Unfortunetaly via a bias in #Cryosat freeboard information. 😉 pic.twitter.com/OxUTcFH94h
GFS wants to keep major #PolarVortex (PV) center over Western Canada after the split and is consistent with predicted westward shift of troughing and #cold across North America but this is not typical following significant PV disruptions. pic.twitter.com/zX7n3rnMpo
This website uses cookies to improve your experience. We'll assume you're ok with this, but you can opt-out if you wish. Cookie settingsACCEPT
Privacy & Cookies Policy
Privacy Overview
This website uses cookies to improve your experience while you navigate through the website. Out of these, the cookies that are categorized as necessary are stored on your browser as they are essential for the working of basic functionalities of the website. We also use third-party cookies that help us analyze and understand how you use this website. These cookies will be stored in your browser only with your consent. You also have the option to opt-out of these cookies. But opting out of some of these cookies may affect your browsing experience.
Necessary cookies are absolutely essential for the website to function properly. This category only includes cookies that ensures basic functionalities and security features of the website. These cookies do not store any personal information.
Any cookies that may not be particularly necessary for the website to function and is used specifically to collect user personal data via analytics, ads, other embedded contents are termed as non-necessary cookies. It is mandatory to procure user consent prior to running these cookies on your website.


