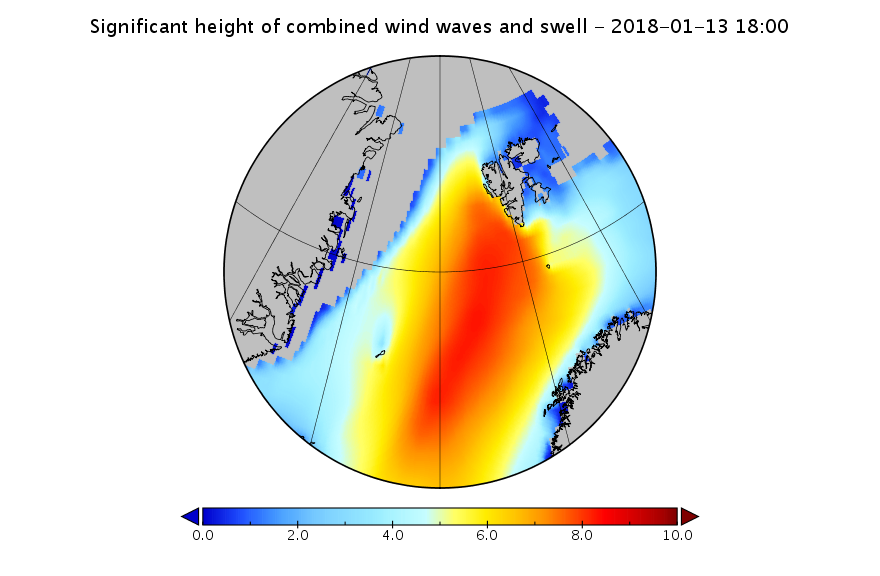
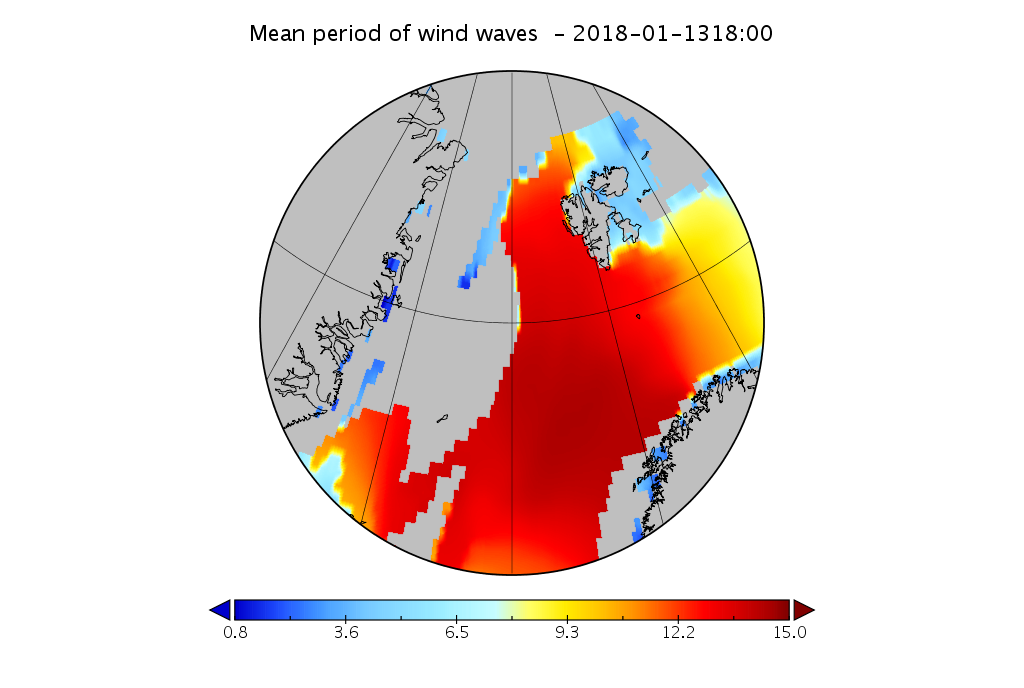
Here’s the 6 hour wave forecast for the Fram Strait from 12:00 UTC this afternoon:
Look at the scales carefully then compare the wave height and period with previous similar events. Here’s the cause of those giant waves, two powerful cyclones off Greenland pumping heat and moisture northwards from a long way south:
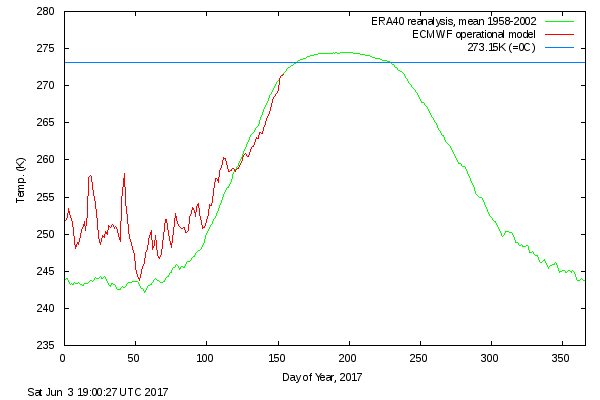
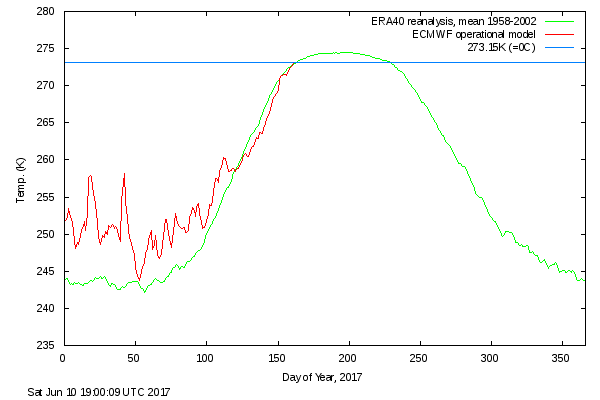
After a comparatively cool May, surface air temperatures in the high Arctic are back up to “normal”:
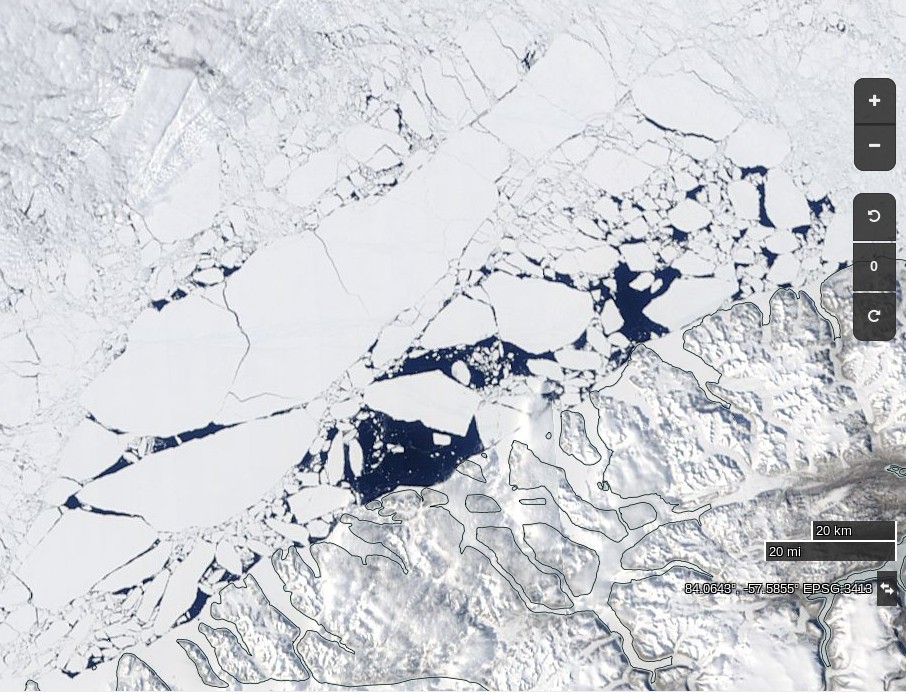
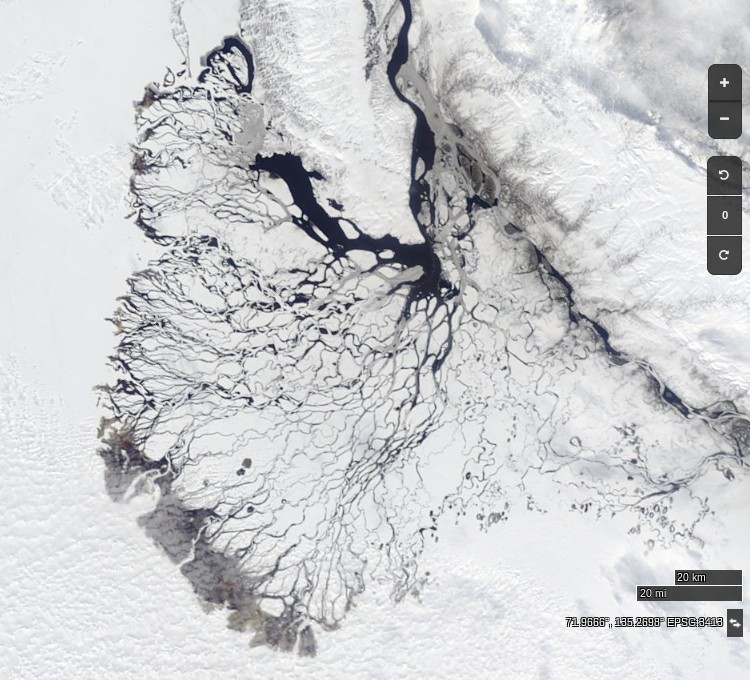
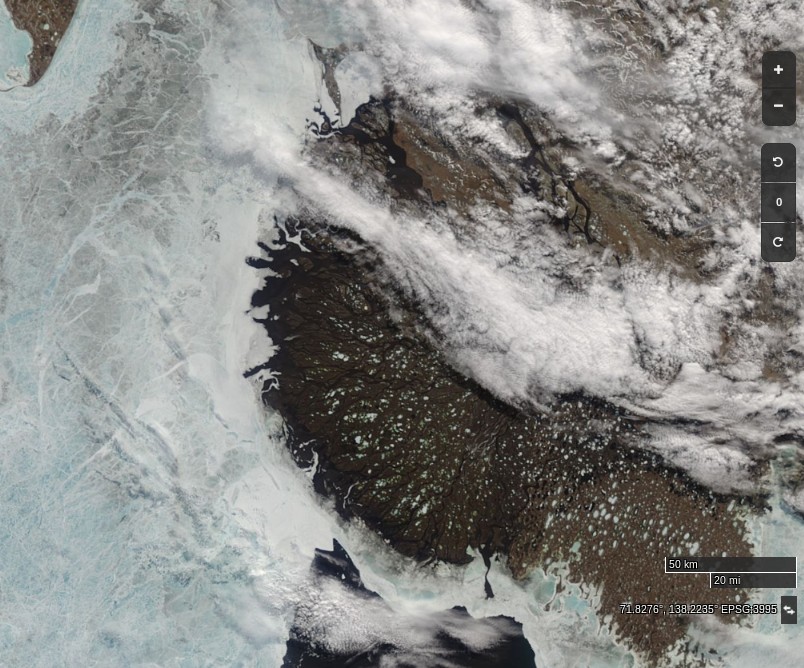
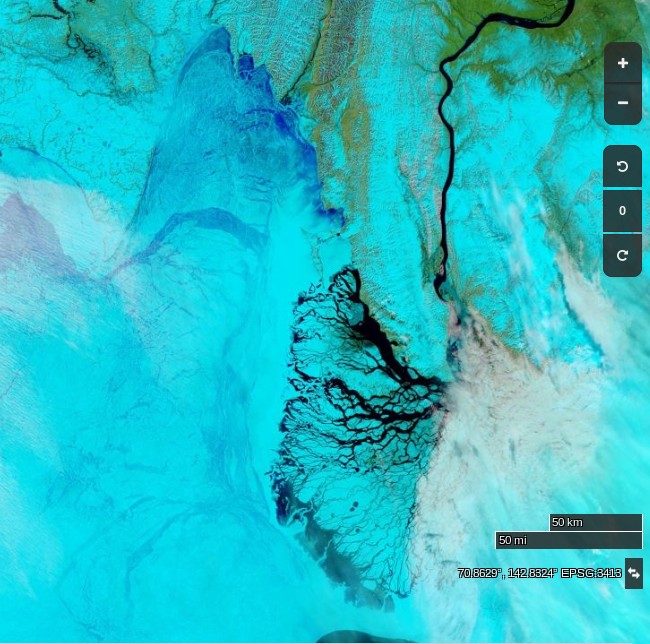
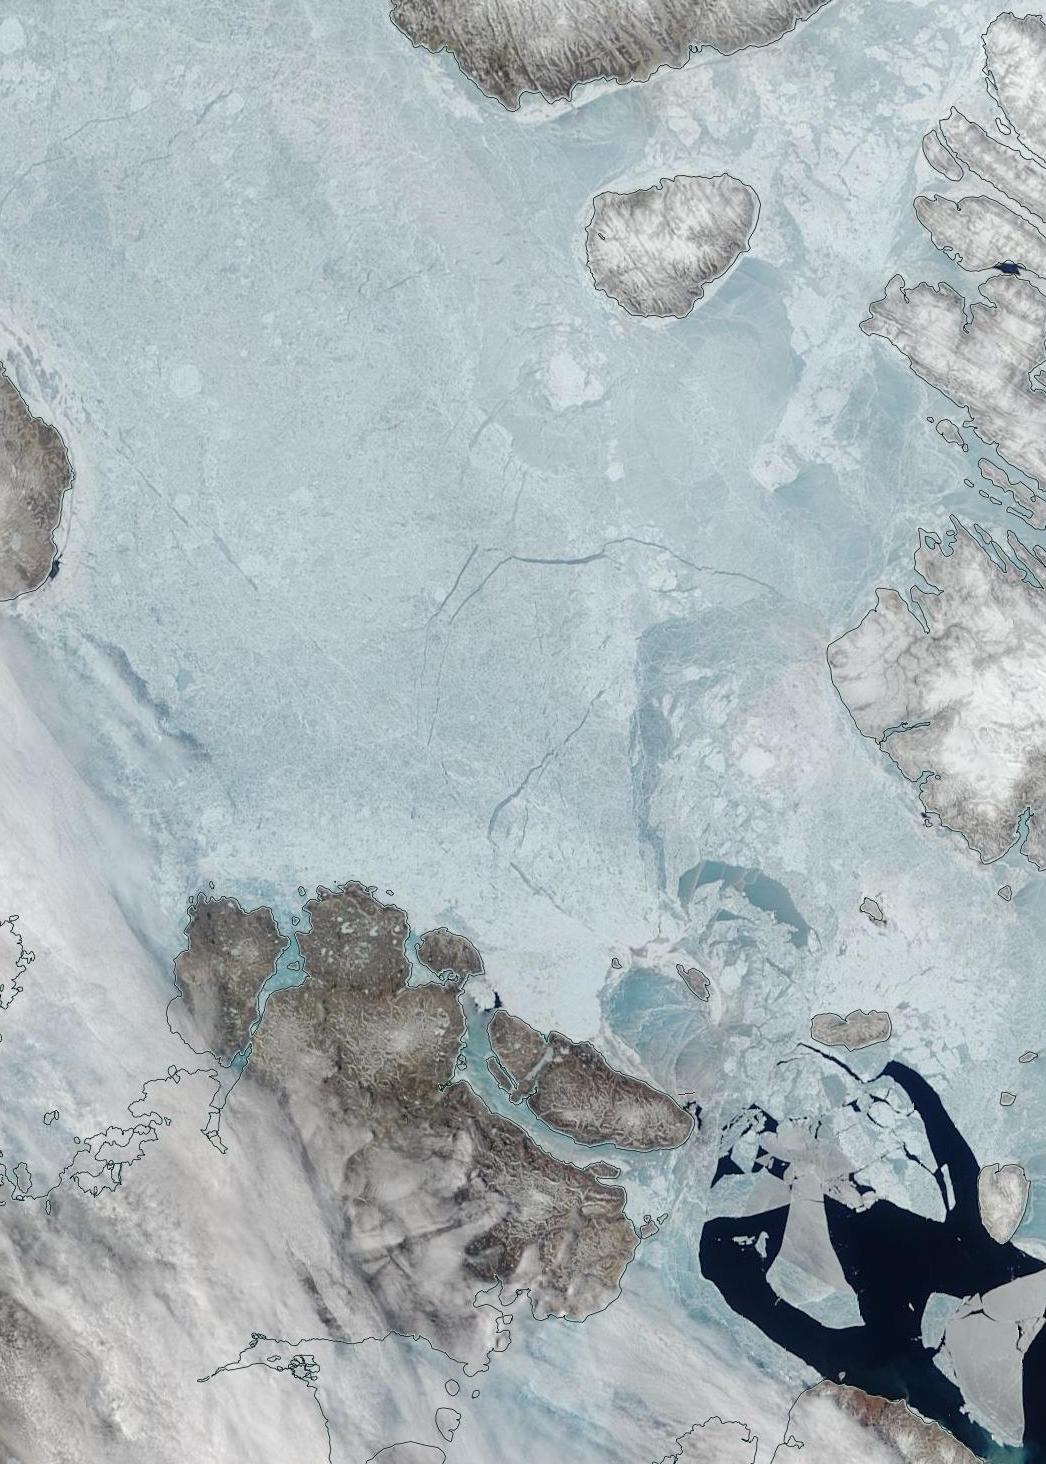
The condition of the sea ice north of 80 degrees is far from normal however. Here’s what’s been happening to the (normally) land fast ice north west of Greenland:
NASA Worldview “true-color” image of the sea ice north west of Greenland breaking up on June 2nd 2017
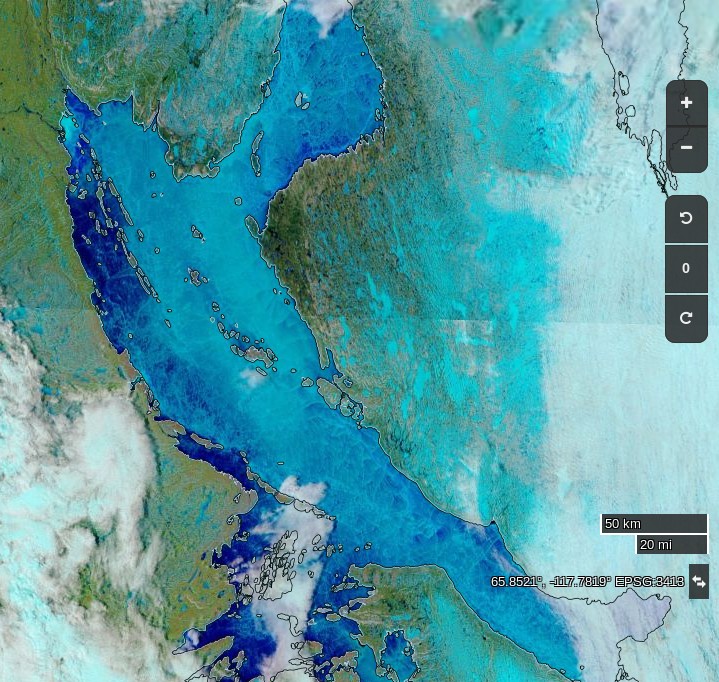
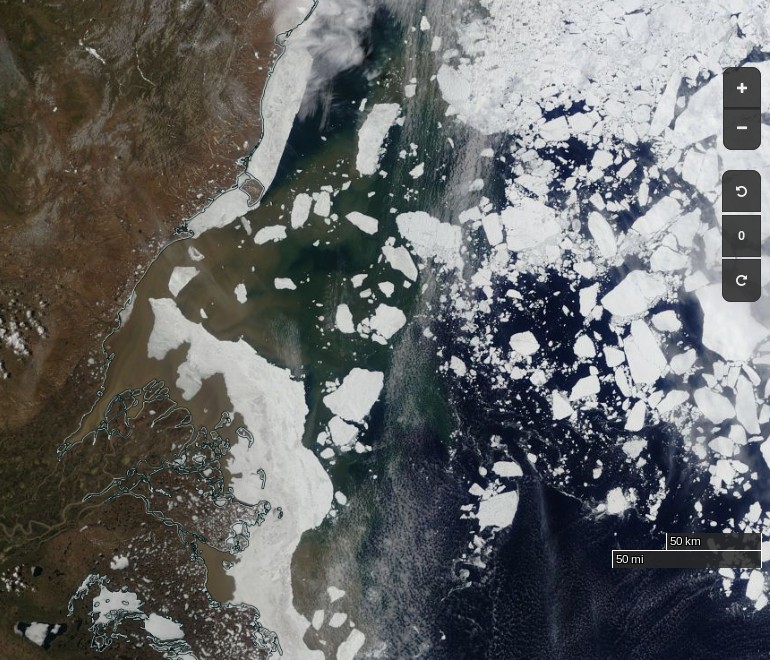
Further south surface melt has set in across the southern route through the Northwest Passage:
NASA Worldview “false-color” image of the Coronation Gulf on June 1st 2017, derived from the MODIS sensor on the Terra satellite
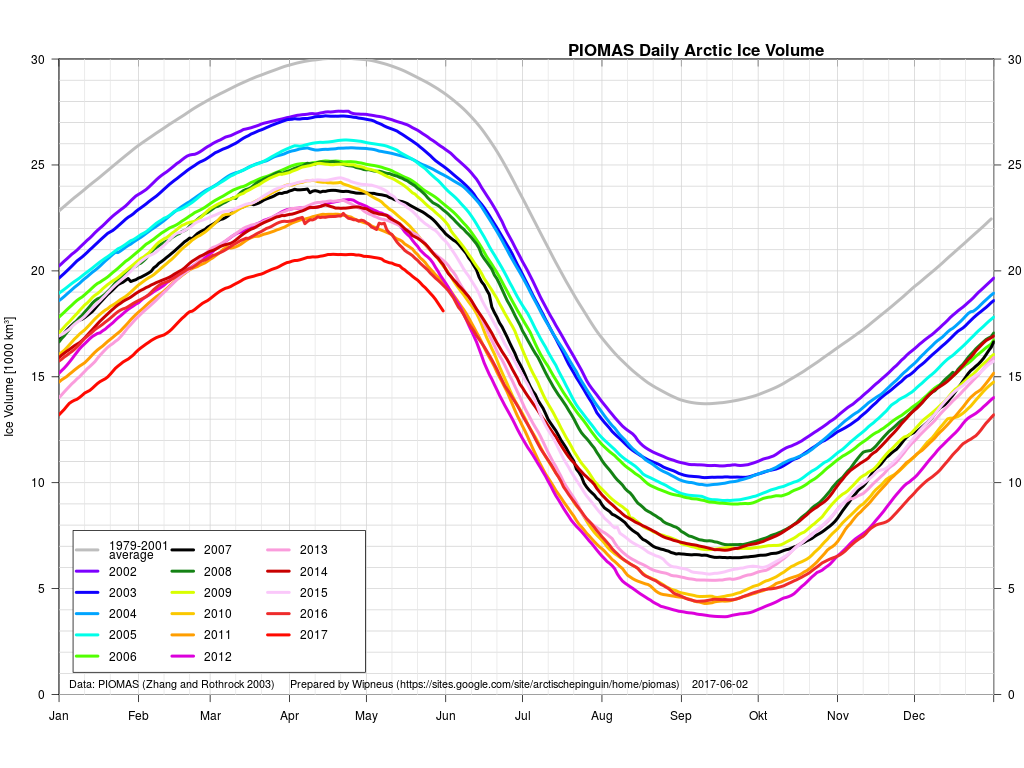
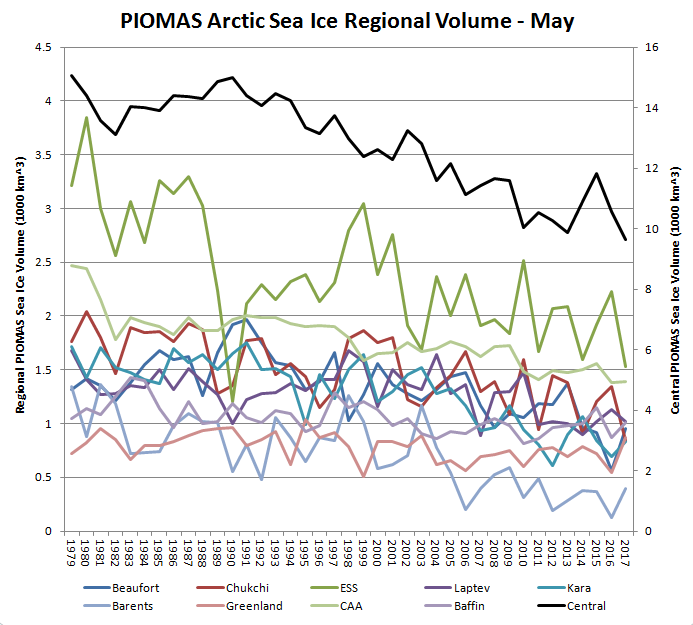
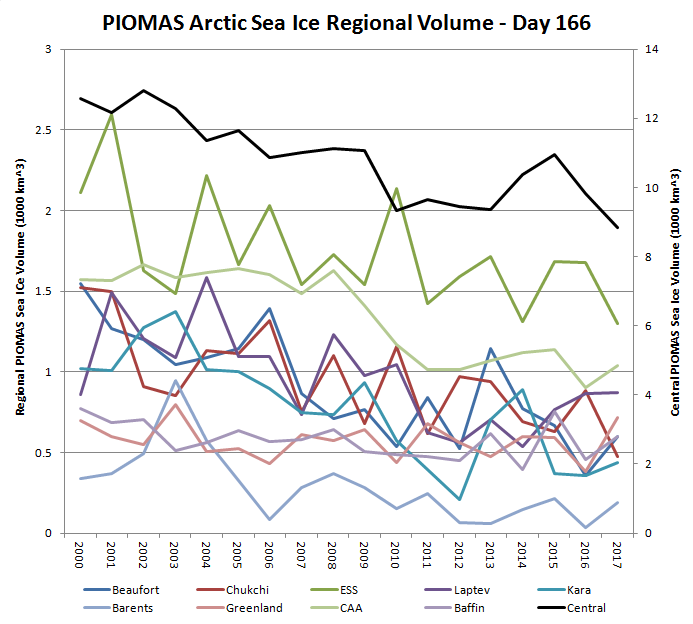
Whilst the gap with previous years has narrowed during May, PIOMAS Arctic sea ice volume is still well below all previous years in their records:
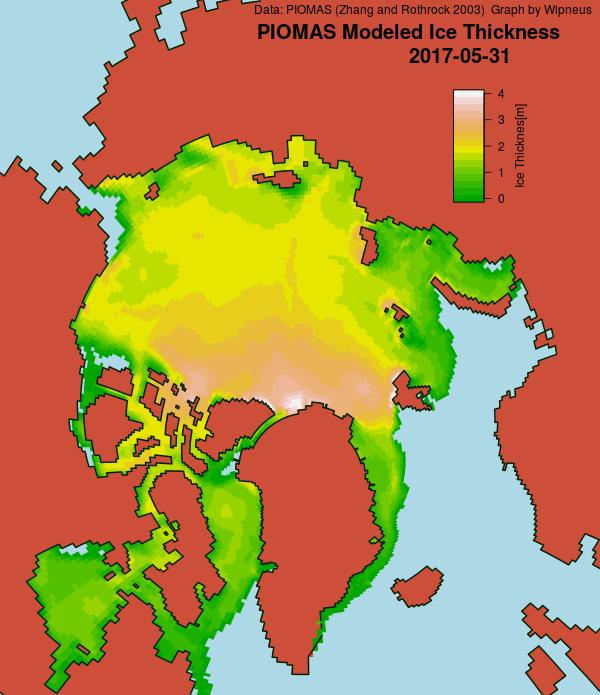
The PIOMAS gridded thickness graph suggests that a large area of thick ice is currently sailing through the Fram Strait to ultimate oblivion:
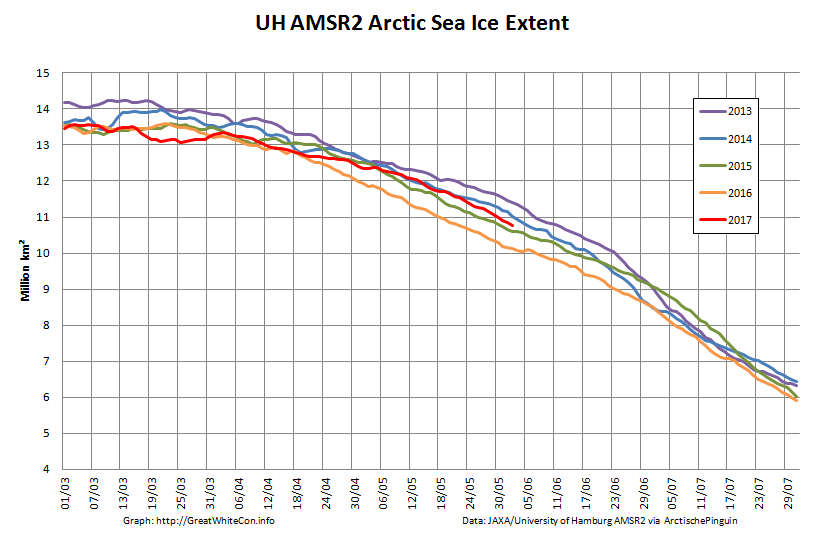
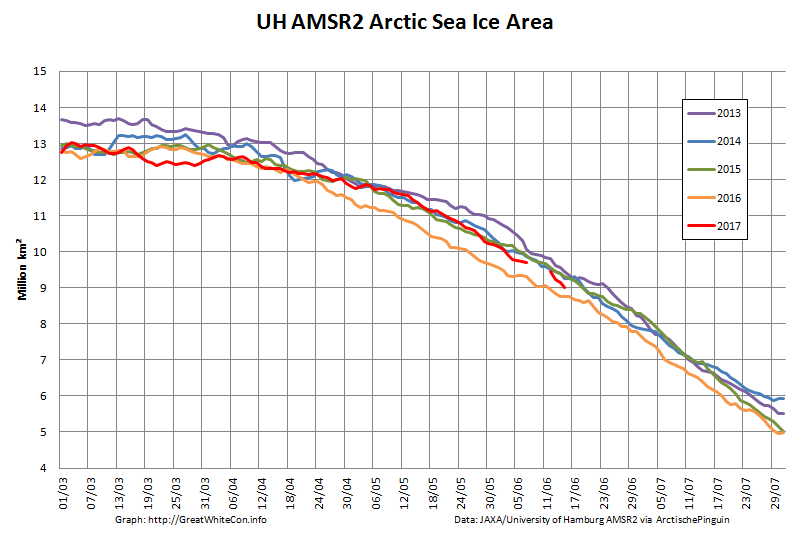
and just in case melt ponds are now affecting those numbers here is extent as well:
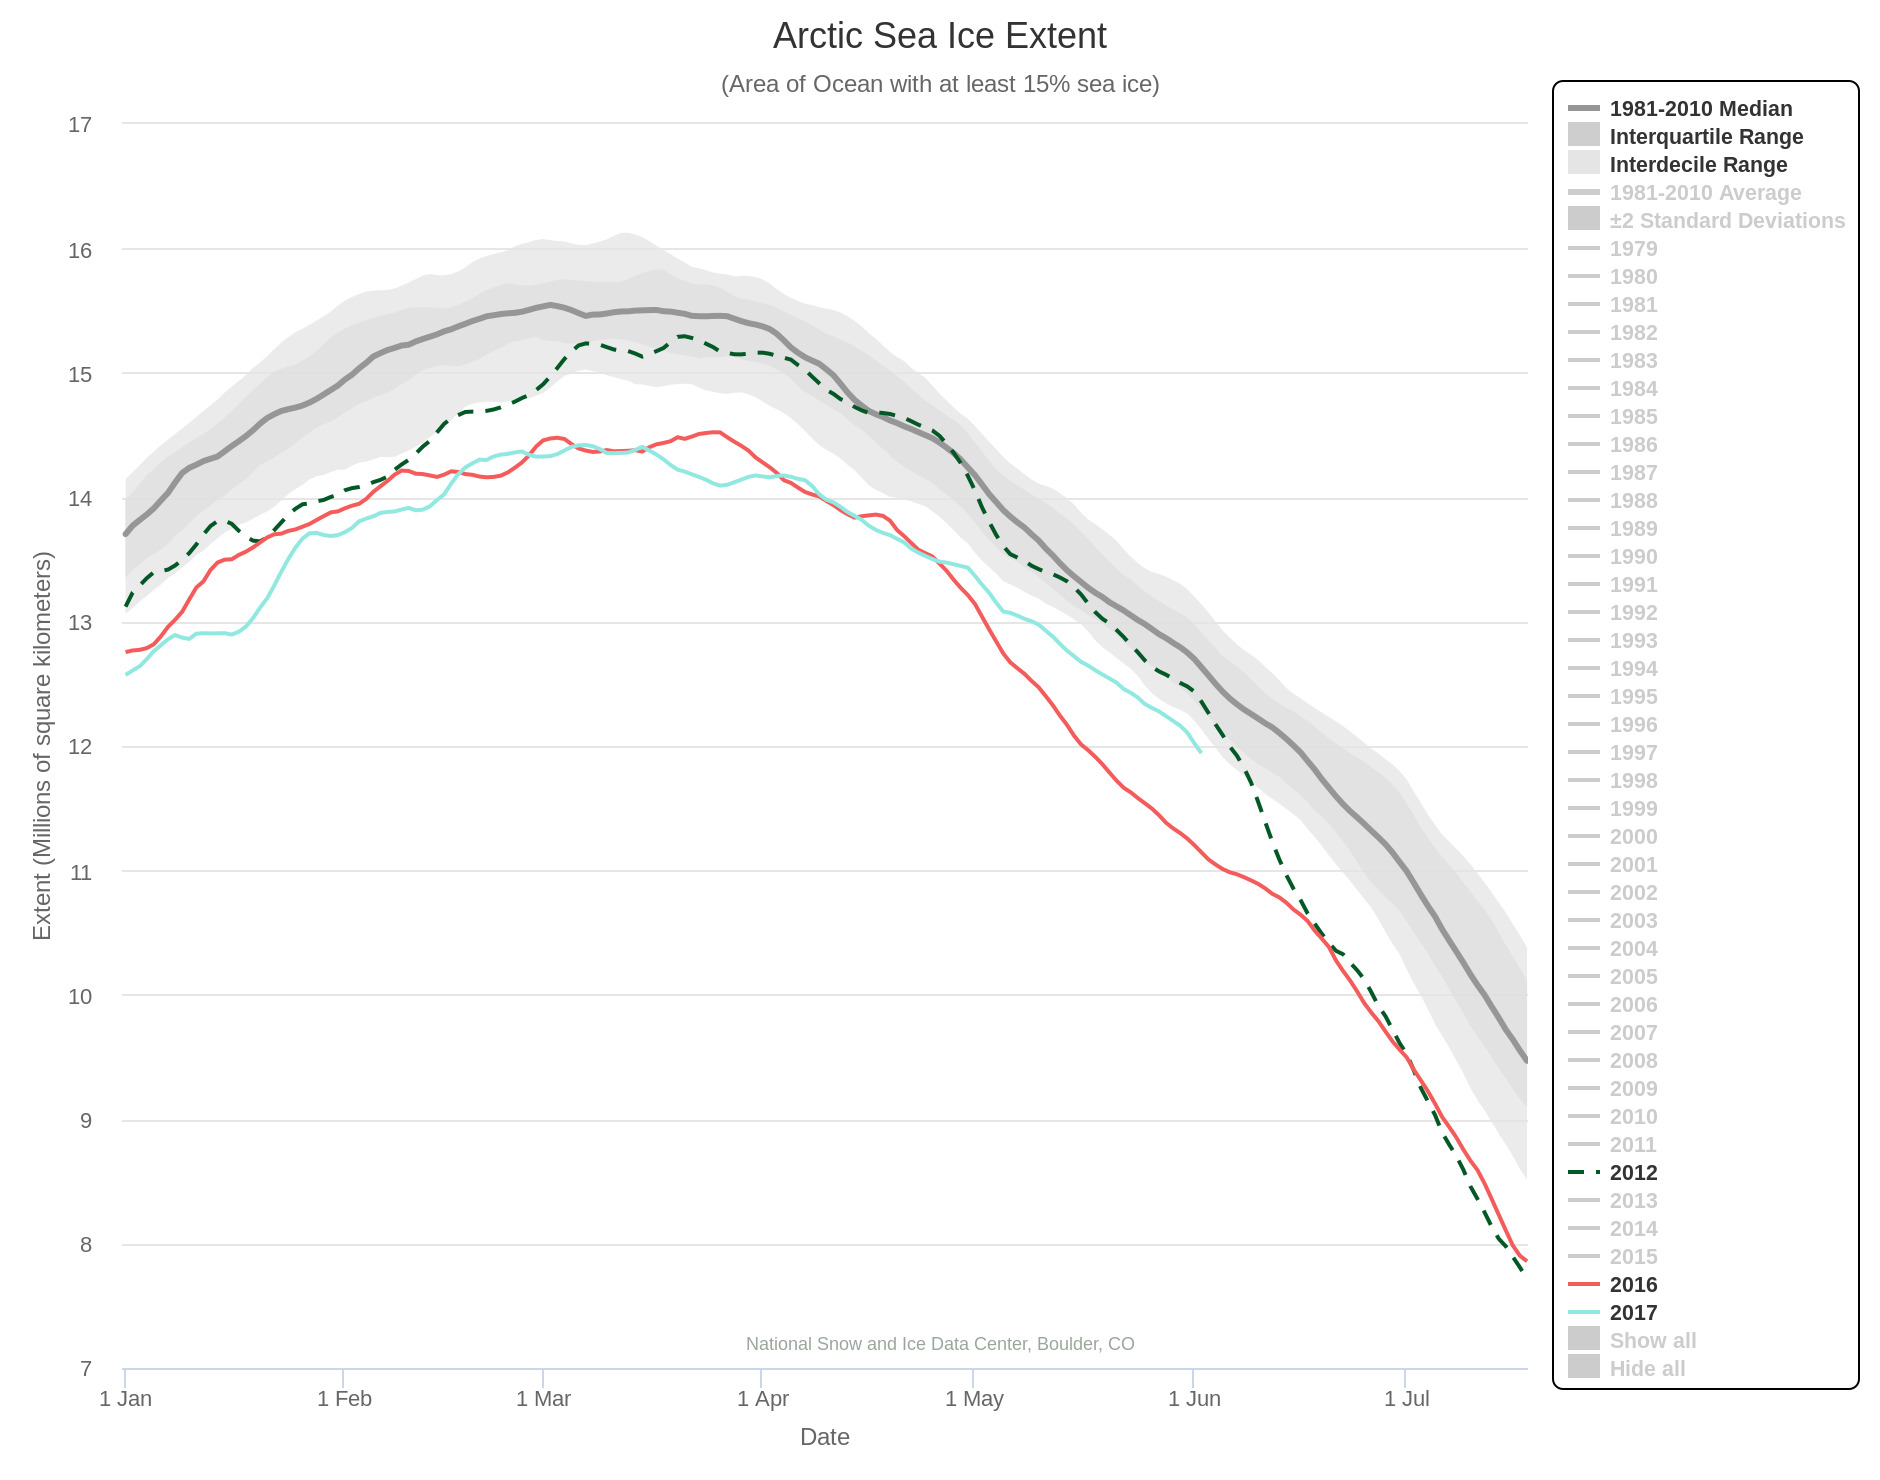
The rate of decrease is inexorably increasing! 2012 extent is currently still well above that of 2017, but those positions may well be reversed by the end of June? Here’s NSIDC’s view on the matter:
[Edit – June 8th]
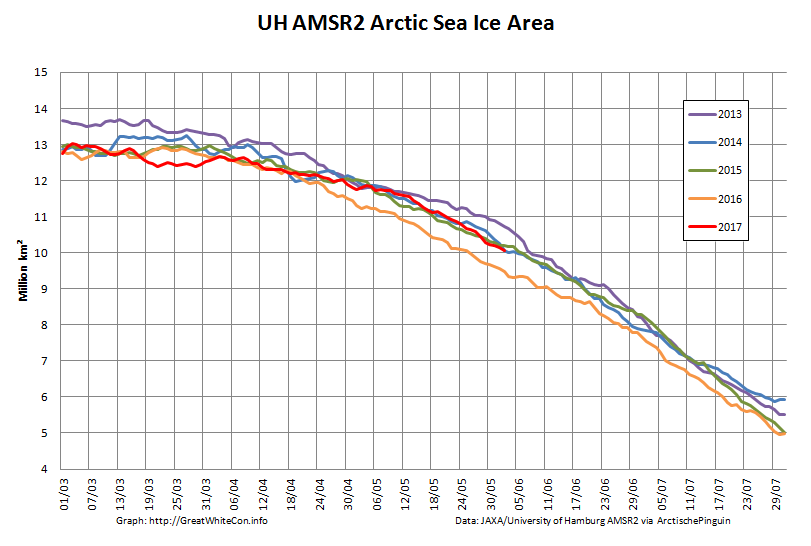
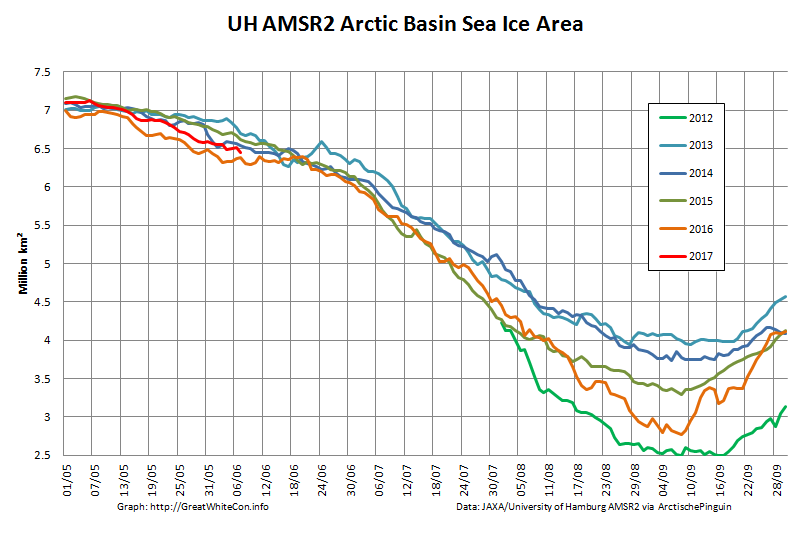
As requested by Tommy, here’s the current Arctic Basin sea ice area:
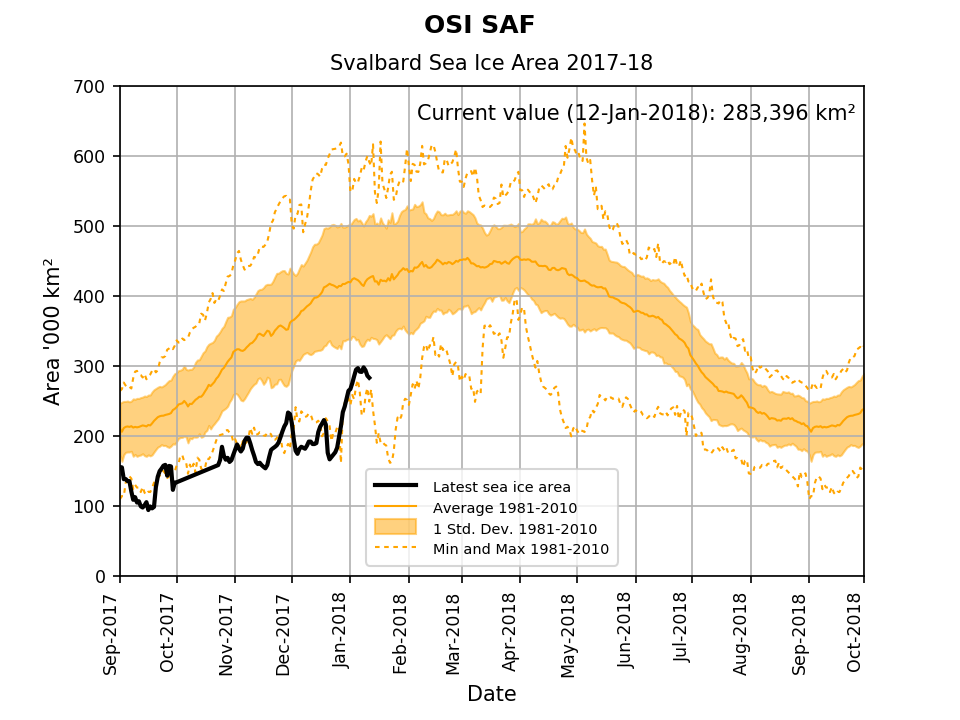
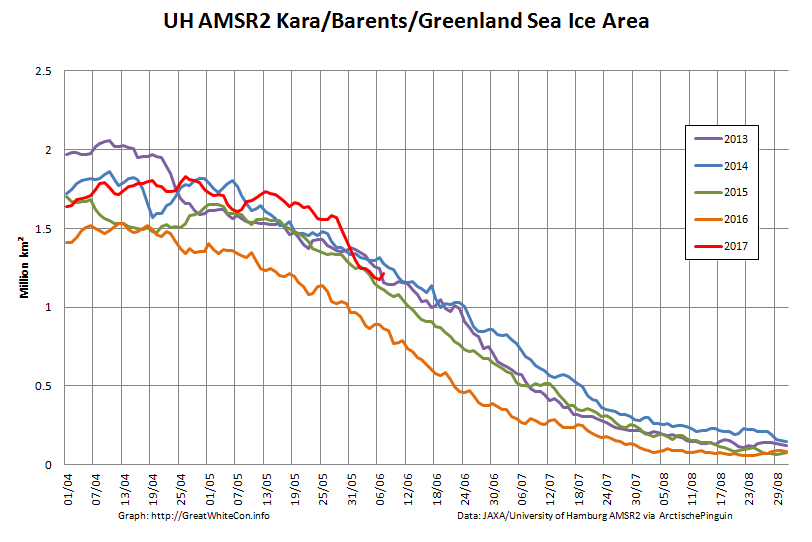
This includes the Beaufort, Chukchi, East Siberian and Laptev Seas along with the Central Arctic. It excludes the Atlantic periphery, which currently looks like this:
[Edit – June 10th]
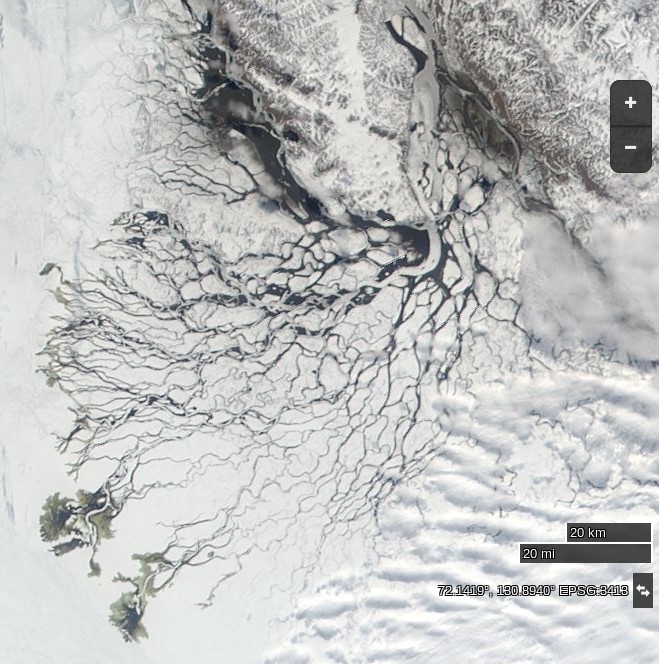
At long last a clear(ish) image of water from the Lena Delta spreading out across the fast ice in the Laptev Sea:
NASA Worldview “true-color” image of the Lena Delta on June 10th 2017, derived from the MODIS sensor on the Terra satellite
NASA Worldview “true-color” image of the Lena Delta on June 10th 2012, derived from the MODIS sensor on the Terra satellite
[Edit – June 11th]
DMI’s daily mean temperature for the Arctic area north of the 80th northern parallel has reached zero degrees Celsius almost exactly on the climatological schedule:
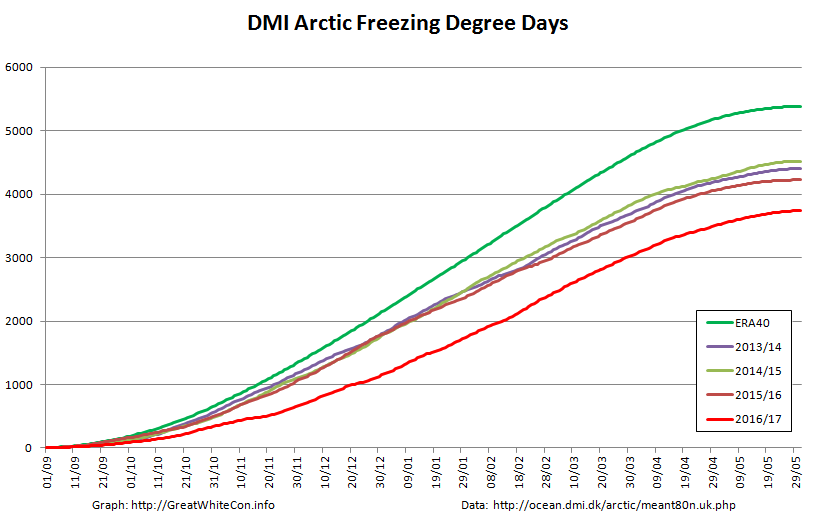
We calculate our freezing degree days on the basis of the freezing point of Arctic sea water at -1.8 degrees Celsius. On that basis this winter’s grand total of 3740 was reached on June 1st:
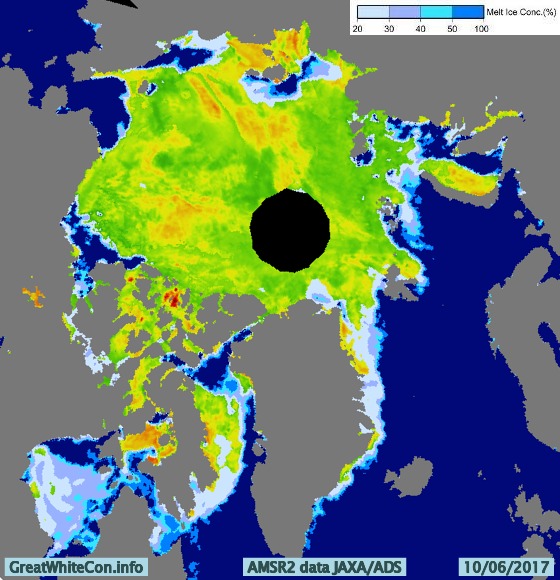
Despite the “coolish” recent weather total FDDs are way below the climatology and other recent years. Consequently there’s a lot less sea ice in the Arctic left to melt at the start of this Central Arctic melting season than in any previous year in the satellite record. However whilst there are some melt ponds visible in the Arctic Basin on MODIS, in that respect 2017 is lagging behind both last year and 2012.
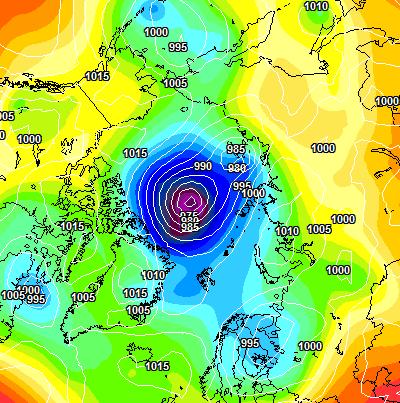
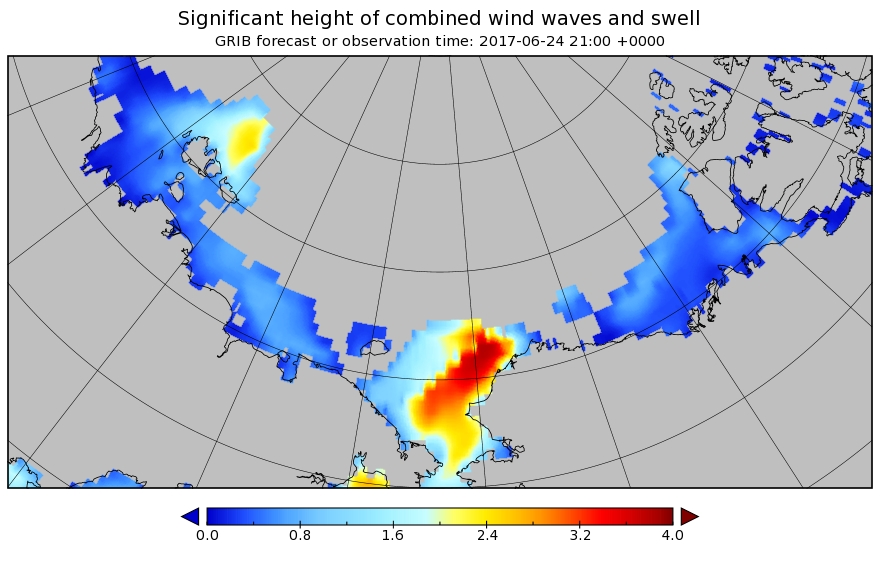
A sub 970 hPa cyclone is starting to enter the realms of realistic possibility, and also forecast are some significant waves in the Chukchi Sea and the expanding 2017 “Laptev Bite”:
[Edit – June 27th]
The forecast cyclone was nowhere near as deep as predicted. According to the analysis by Environment Canada it bottomed out at 980 hPa yesterday:
[Edit – June 29th]
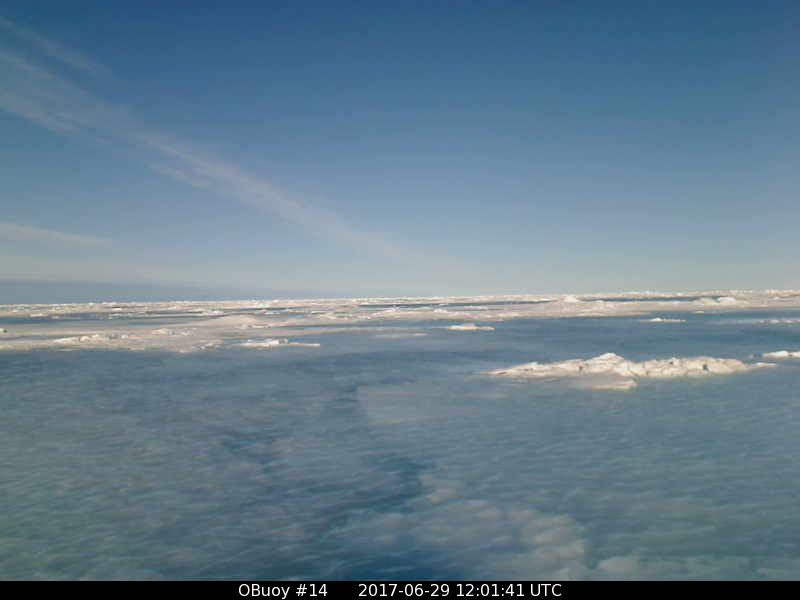
O-Buoy 14 is currently firmly embedded in the fast ice of Viscount Melville Sound, deep in the heart of the Northwest Passage. Here’s the view from the buoy’s camera:
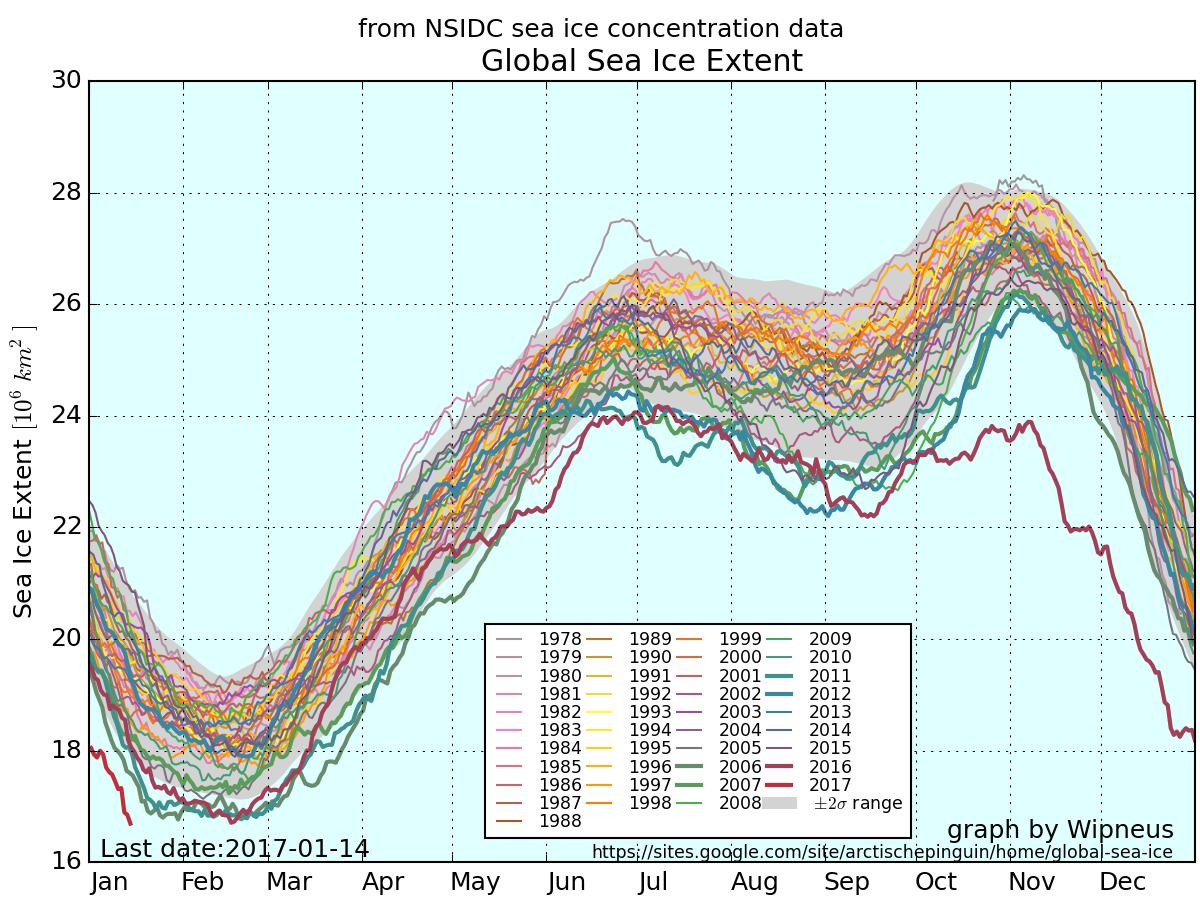
Here once again is the up to date version of Wipneus’ graphic graphic, this time of global sea ice extent:
As you can see, global sea ice extent has just reached the lowest ever level in the National Snow and Ice Data Center’s satellite records going back to 1979. It was over a month later when the previous record was broken in February 2016, so there is plenty of time for the metric to fall further.
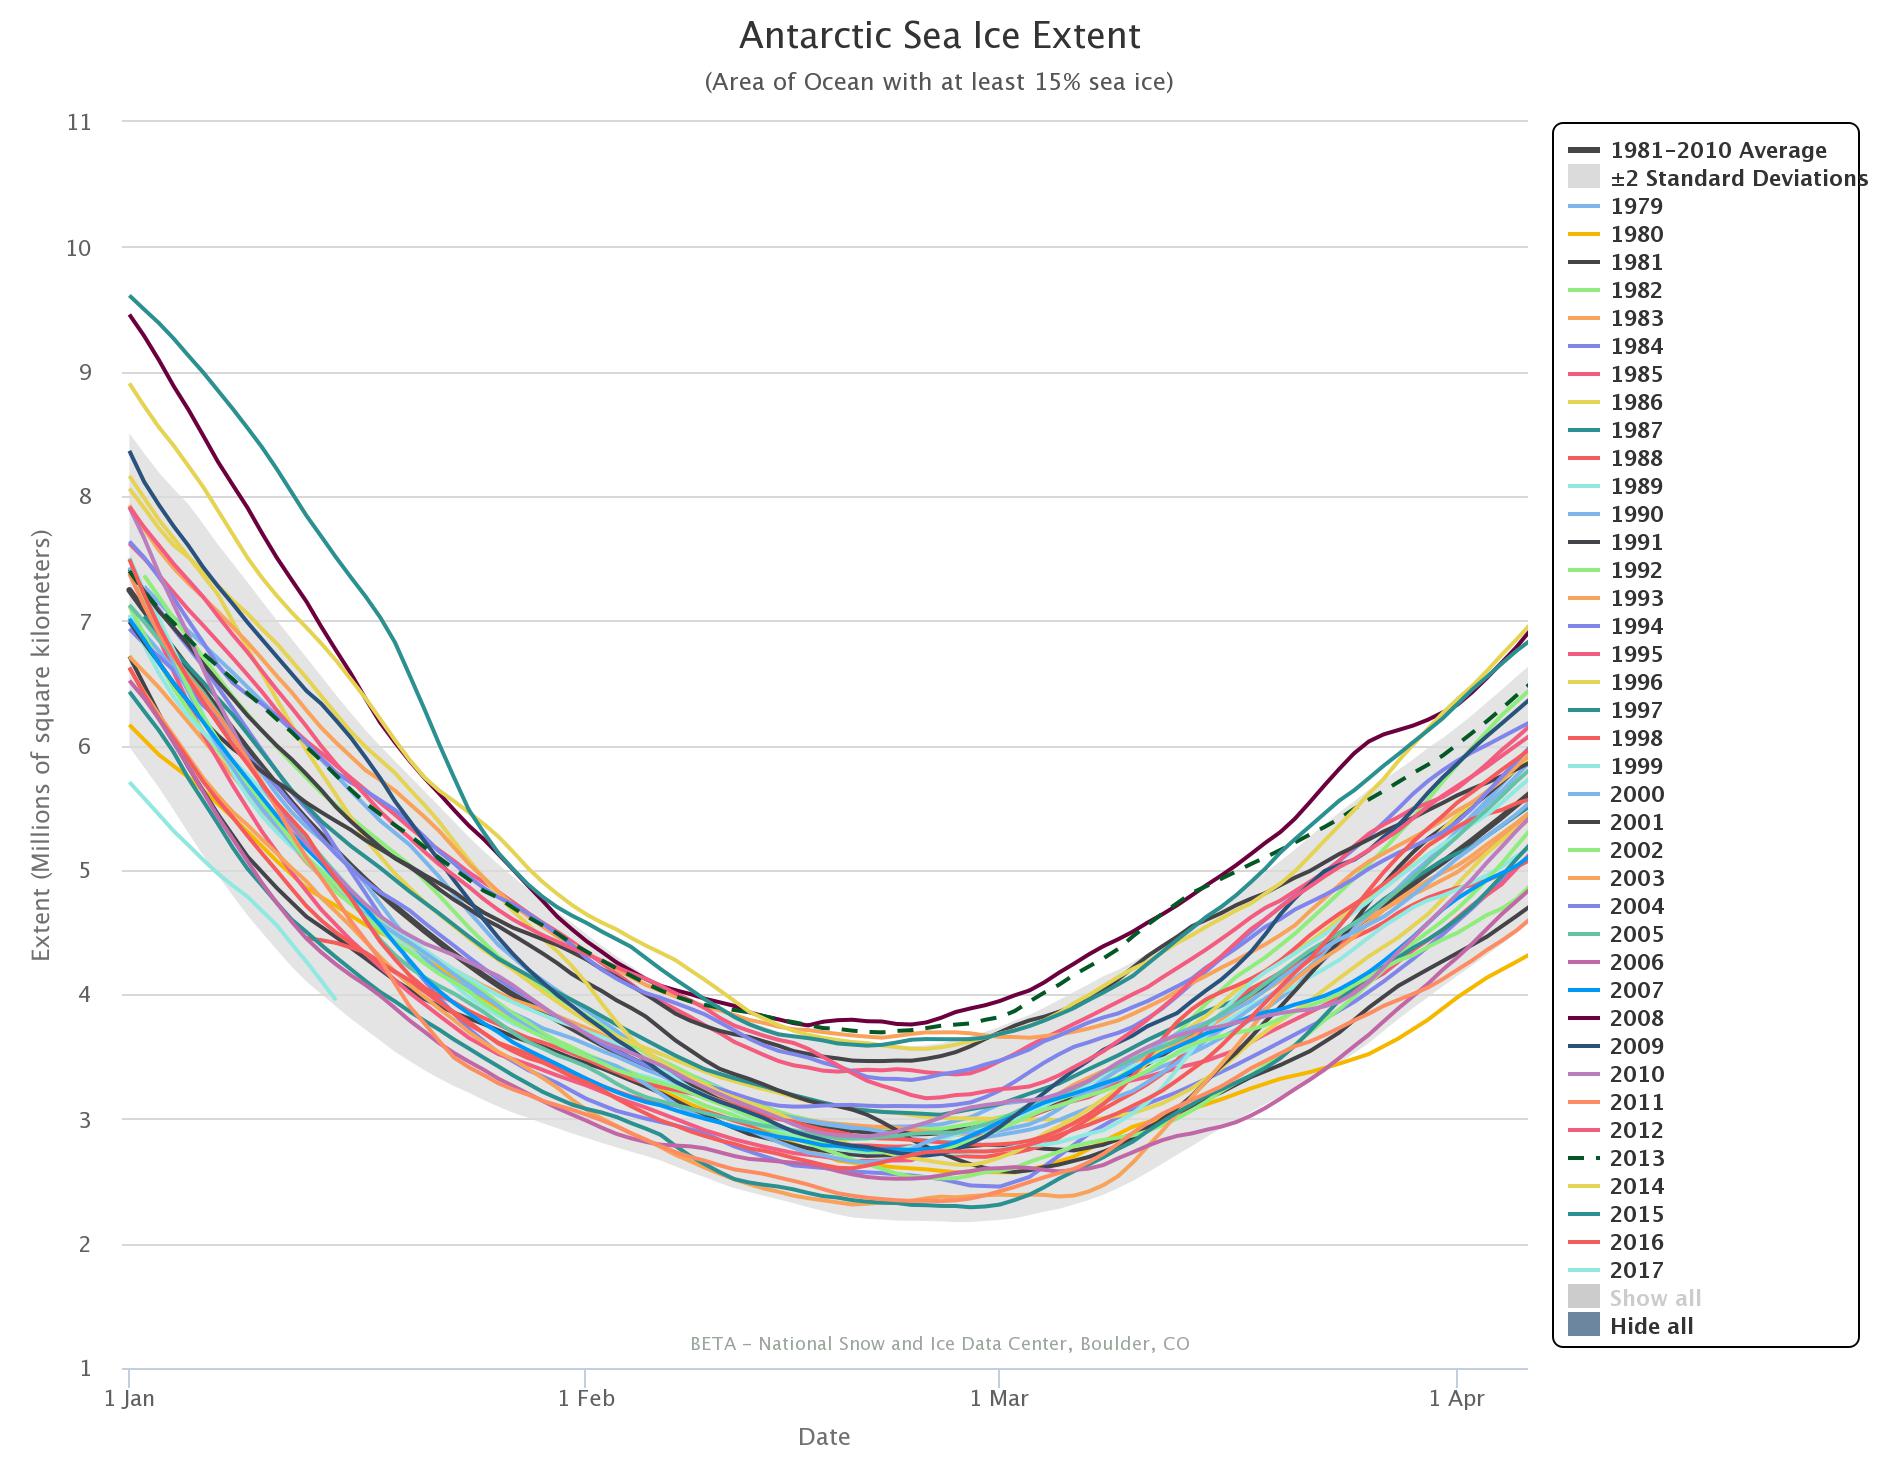
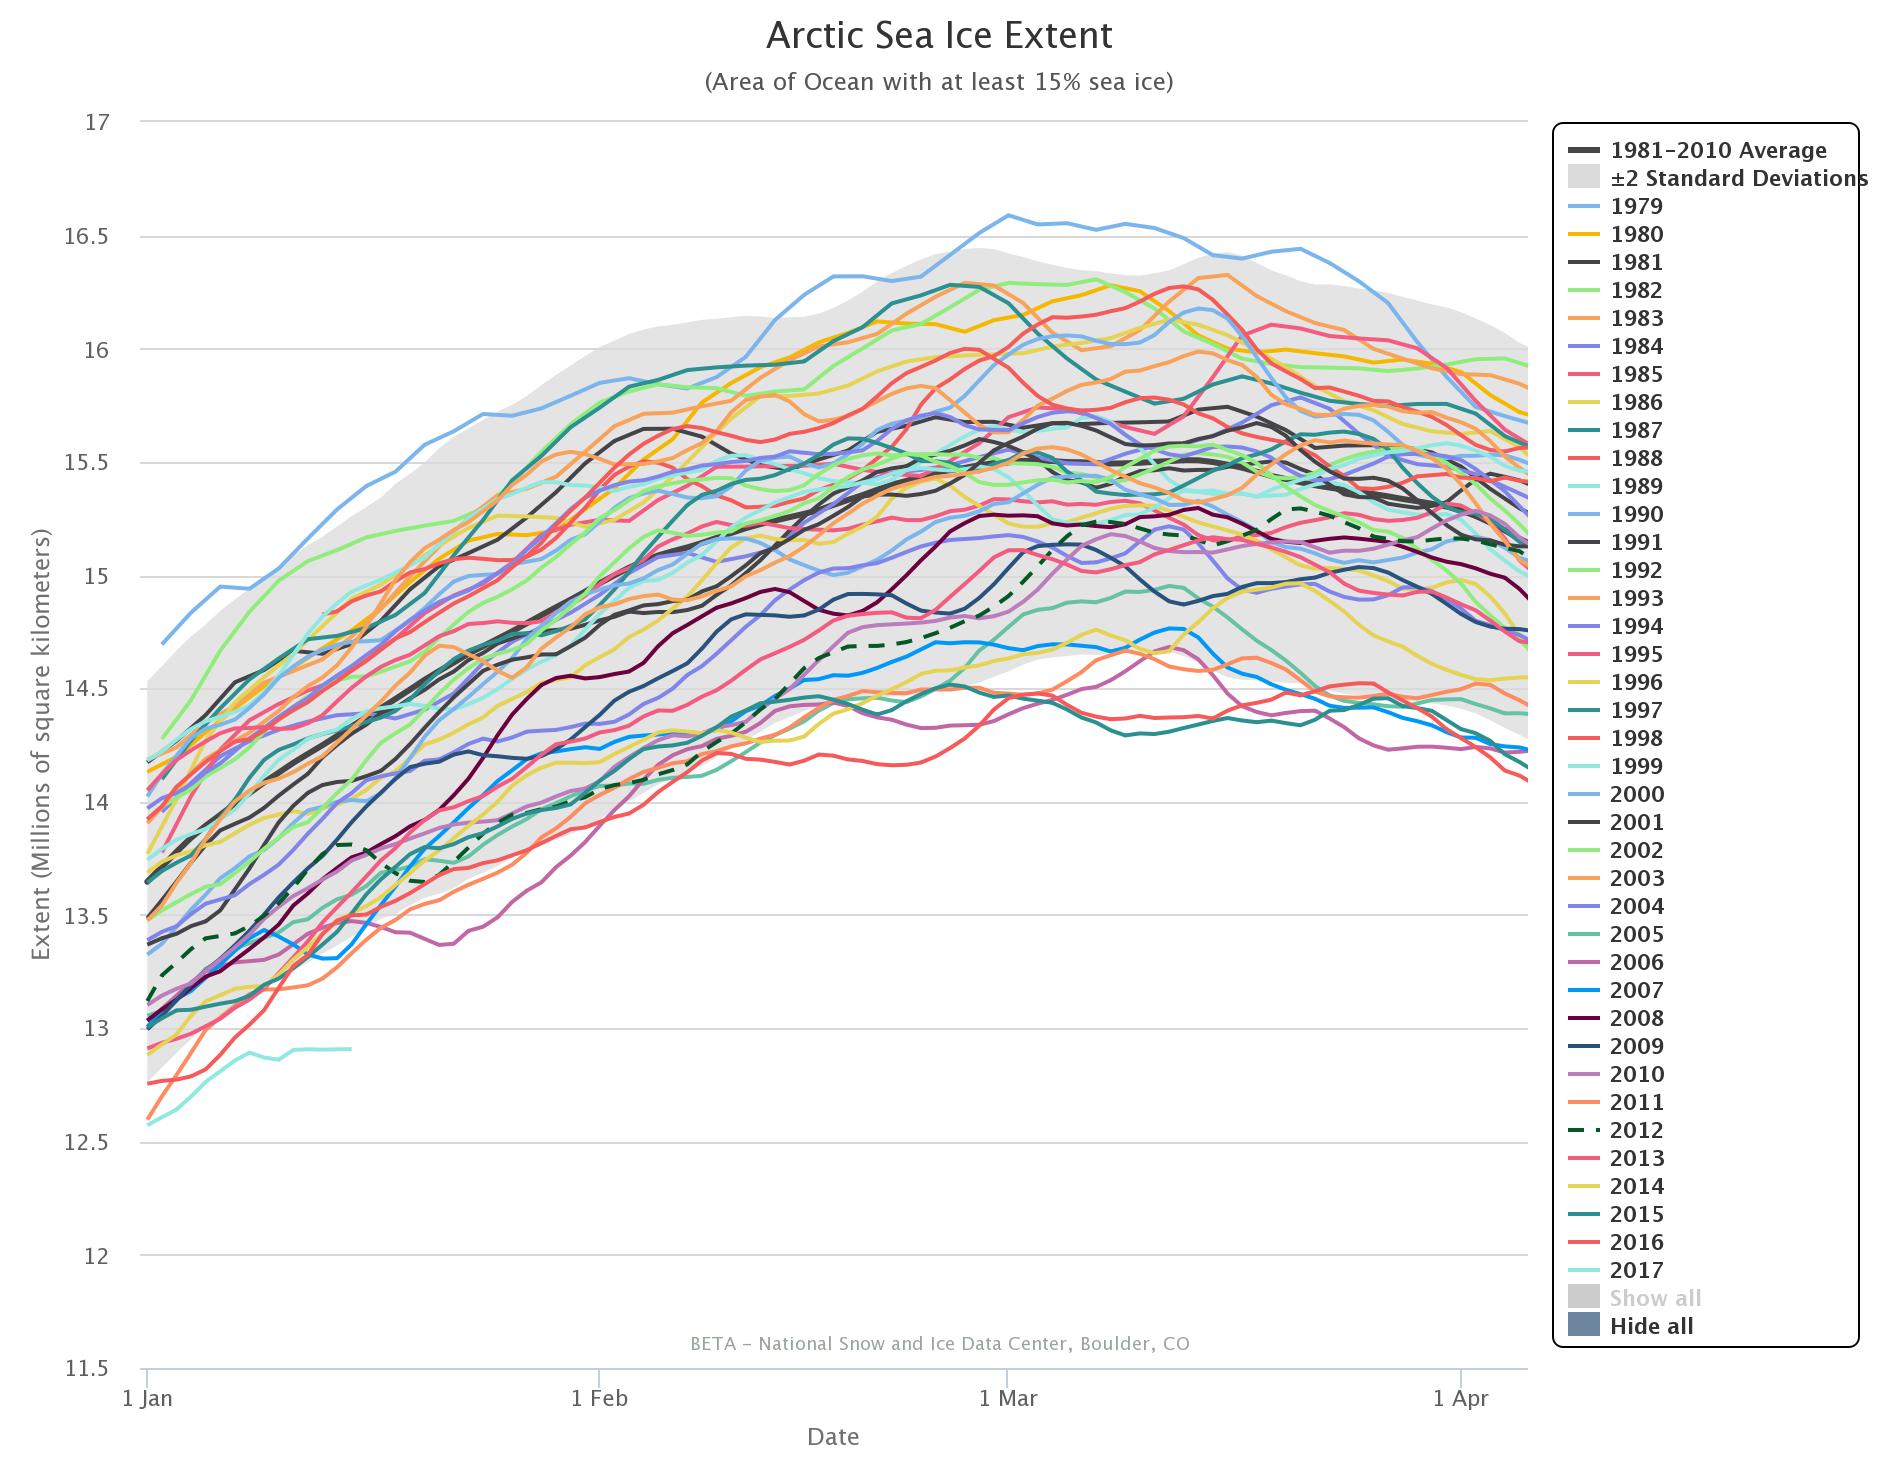
The 2017 curves in the NSIDC’s own extent graphs are coloured in a pale shade of blue. Even so they’re easy to pick out since both Antarctic and Arctic extent are at the lowest level for the date in NSIDC’s records by a considerable margin:
Antarctic sea ice extent is still falling, and the Arctic has been flatlining for several days now and more trouble is heading its way. Another Fram Strait cyclone is brewing, and this time around the storm’s minimum central pressure is already down to 957 hPa according to Environment Canada:
According to the current forecasts it will continue to spin over the central Arctic for several more days, driving export of sea ice via the Fram Strait:
Arctic sea ice extent has been anomalously low this winter. The greatest anomalies are in the European sector, specifically in the Barents Sea. To what extent are the anomalies associated with warm temperatures?
Which she answered as follows:
So, what might be causing this particular anomaly? Some possibilities are:
Gobal warming (January 2016 was warmest Jan on record, according to the surface temperature analyses
Multidecadal oscillations (e.g. stadium wave) predicts ice recovery to be occurring in the same region (European Arctic) where we see the sea ice decline).
Seasonal weather circulation patterns – this has been a year with with unusual weather patterns, with both low temperature and high temperature records being set.
As regular readers will already be aware we have been blogging about anomalously warm temperatures in the Arctic all year and so felt well qualified to contribute to the “debate”. What a job that turned out to be! Early on in the proceedings the anticipated pronouncement was made by one of Judith’s “denizens”. A link to a ludicrously inaccurate article on Watts Up With That accompanied by the following words of wisdom:
Other measures are high.
Which of course they aren’t! Instead of stating the bleedin’ obvious Professor Curry replied:
I spotted this, no idea what to make of it.
You would think she and her denizens would therefore have been pleased when I attempted to explain to her what to make of it, but you would have been mistaken. The icing on the ad hominem cake was the aforementioned Anthony Watts driving by to accuse me of all sorts of nefarious activities without providing a single shred of evidence and then running for the hills when invited to actually prove his ludicrous allegations.
Since the denizens of “Climate Etc.” aren’t particularly interested let’s take stock here instead shall we? After every Arctic area and extent metric under the sun sitting at “lowest *ever” levels for weeks a recent increase in coverage on the Pacific side of the Arctic has changed that. The most up to date example of that is the JAXA/ADS extent, which currently looks like this:
The latest reading is the merest whisker above 2015’s record low maximum. However in other respects things are most certainly not comparable with 2015. See for example this concentration comparison from Andrew Slater of the NSIDC:
Much more ice on the Pacific periphery where it will all have disappeared by September, as opposed to much less ice on the Atlantic side, even well to the north of 80 degrees latitude where the sun still does not shine. Here’s a video revealing how the sea ice North of the Pacific Ocean has been reacting to the sequence of hurricane force storms that have been passing through the area over the past couple of months:
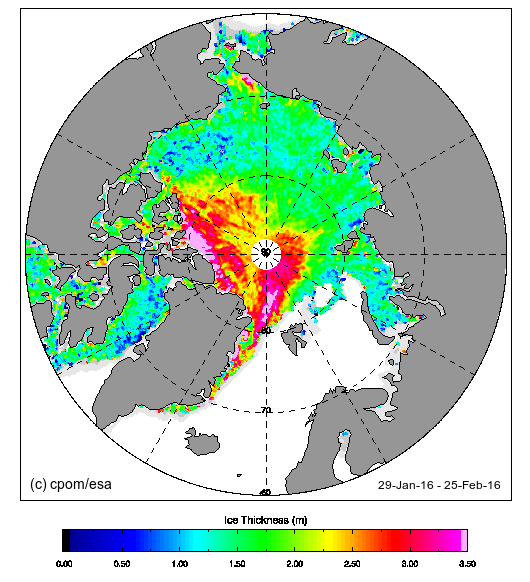
Now let’s take a look at “near real time” Arctic sea ice thickness as measured by the CryoSat 2 satellite:
Notice the absence of any thick ice in the Beaufort and Chukchi Seas, an obvious difference from last year? Notice too the large area of thick ice that looks as though it’s heading towards the Fram strait exit from the Central Arctic. Here’s another video, this time of sea ice movement over on the Atlantic side of the Arctic Ocean:
Those dark areas between Svalbard and the North Pole are suddenly starting to look as though they represent reality rather than a mere “artifact”, although perhaps they are merely transient evidence of yet another Arctic “heat wave”?
We speculated a few days ago about whether the “Son of Storm Frank” might have battered Britain by now, and be sending a 10 meter swell past Svalbard towards the Arctic sea ice edge. That’s not quite how things have worked out in practice however! We haven’t had another named storm affecting the United Kingdom directly, but we have received a series of long distance swells from a sequence of hurricane force storms further out in the North Atlantic. I even managed to test my Arctic surfing equipment by personally partaking in the swell generated by Hurricane Alex!
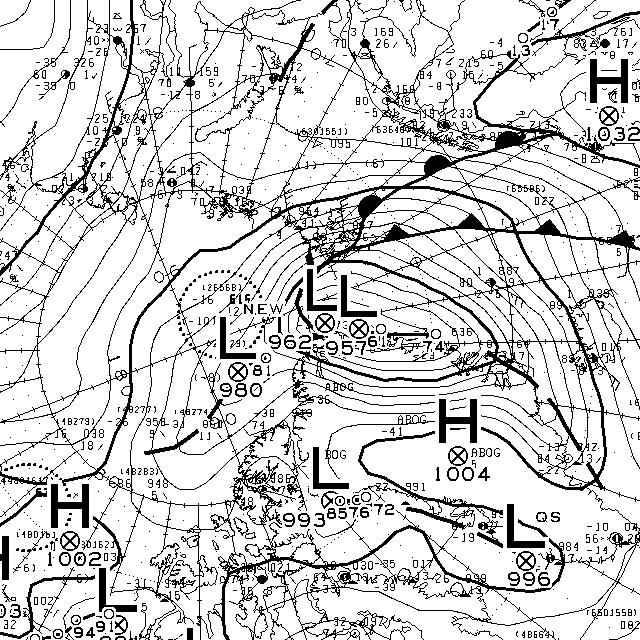
Moving from the water into the air, here’s the Danish Meteorological Institute’s forecast for Greenland tomorrow:
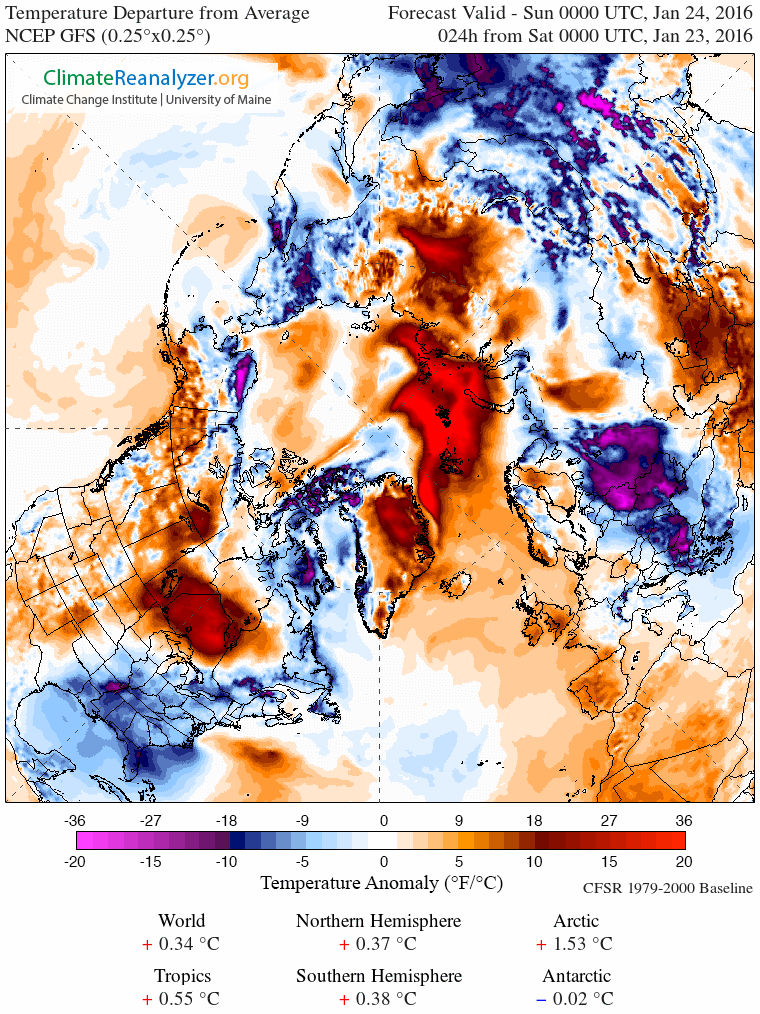
If you’re at all familiar with isobars you’ll note yet another storm off Southern Greenland and that comparatively warm, moist air will be heading up the east coast of Greenland towards the Fram Strait, albeit not at the speeds generated by Storm Frank! As a consequence here is Climate Reanalyzer’s surface temperature anomaly map for first thing tomorrow:
and here is how it looks by Wednesday lunchtime:
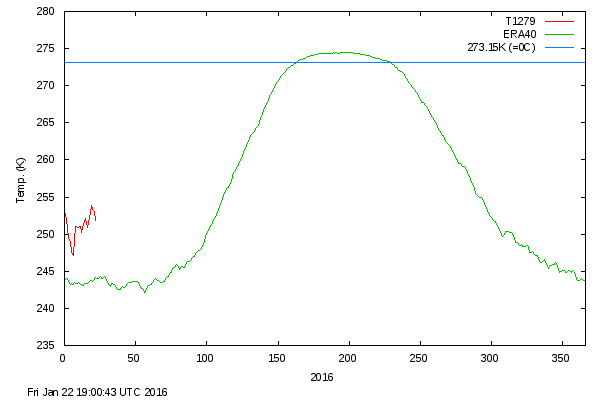
As you can see, the ultimate effect of the recent hurricane force storms in both the Atlantic and the Pacific is to attack the Arctic with warm, moist air from both sides. Whilst we wait to see exactly how this much shorter term forecast pans out, particularly at the North Pole itself, the DMI’s graph of temperatures in the central Arctic has burst back into life after a “brief hiatus” in the New Year. Here’s how it looks at the moment:
This website uses cookies to improve your experience. We'll assume you're ok with this, but you can opt-out if you wish. Cookie settingsACCEPT
Privacy & Cookies Policy
Privacy Overview
This website uses cookies to improve your experience while you navigate through the website. Out of these, the cookies that are categorized as necessary are stored on your browser as they are essential for the working of basic functionalities of the website. We also use third-party cookies that help us analyze and understand how you use this website. These cookies will be stored in your browser only with your consent. You also have the option to opt-out of these cookies. But opting out of some of these cookies may affect your browsing experience.
Necessary cookies are absolutely essential for the website to function properly. This category only includes cookies that ensures basic functionalities and security features of the website. These cookies do not store any personal information.
Any cookies that may not be particularly necessary for the website to function and is used specifically to collect user personal data via analytics, ads, other embedded contents are termed as non-necessary cookies. It is mandatory to procure user consent prior to running these cookies on your website.