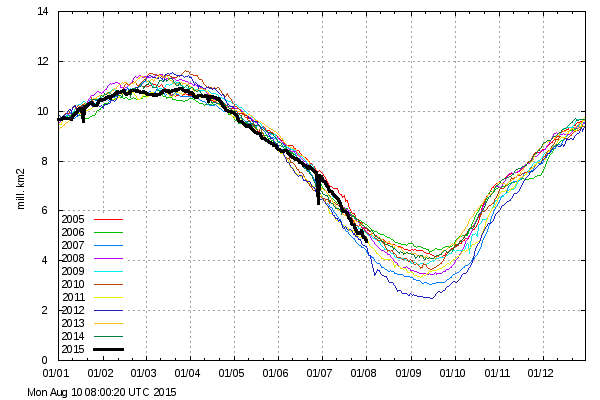
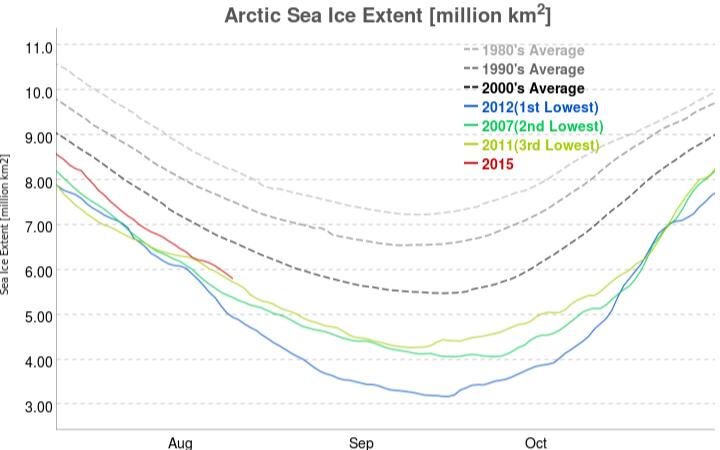
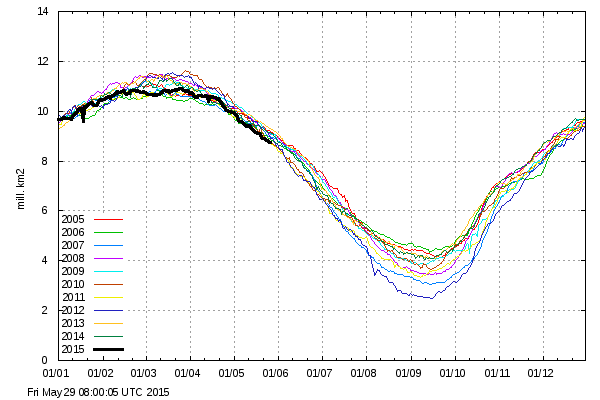
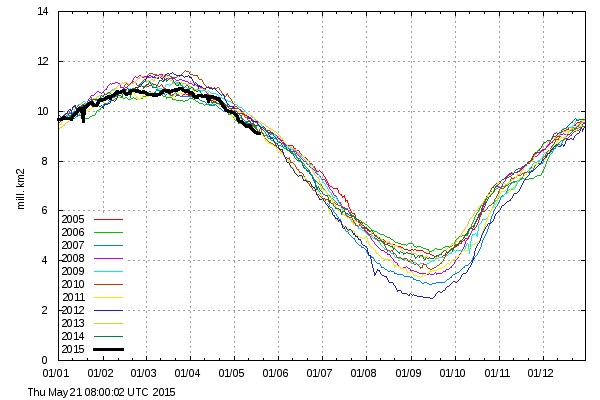
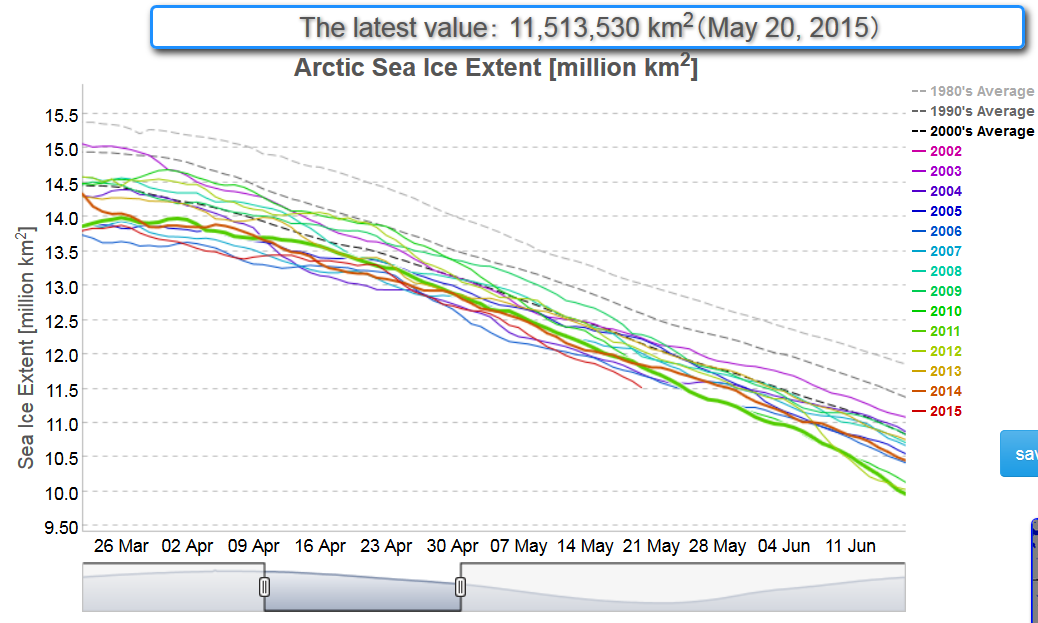
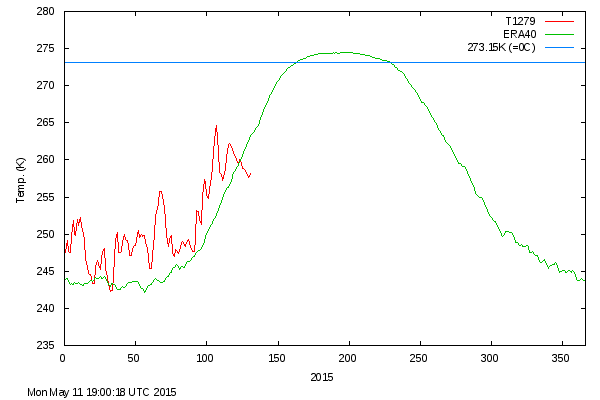
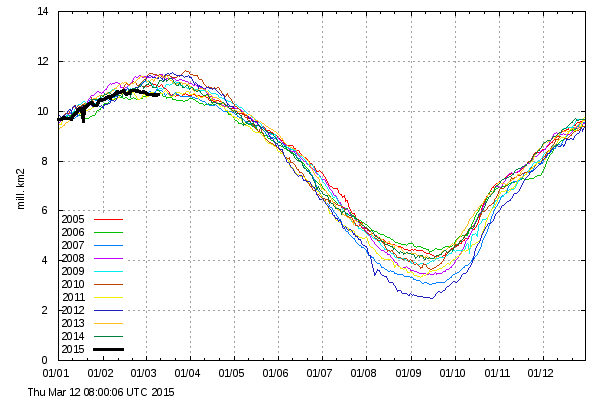
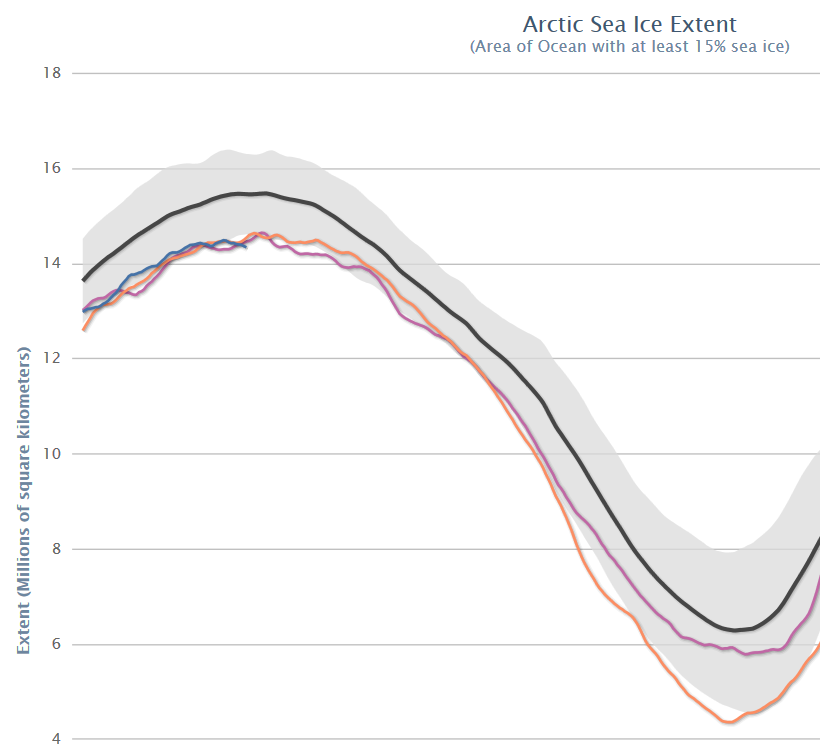
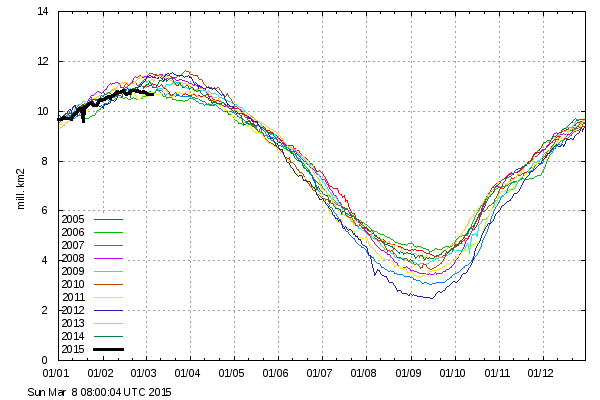
We’ve now entered the month of September, the month in which Arctic sea ice extent and area reach their annual minimum levels, historically at least. To set the scene, here’s the extent graph from the Japan Aerospace Exploration Agency (JAXA) for September 1st, based on data from the AMSR2 sensor on board their SHIZUKU satellite.:
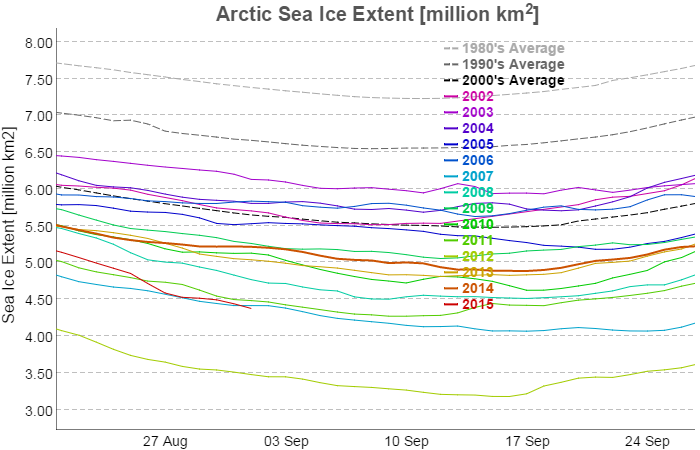
As you can see, the 2015 curve has just dropped below 2007 and is now at the second lowest level for the date in JAXA’s records. As the month progresses we’ll be taking a look at a variety of other metrics as they start to report their numbers for September.
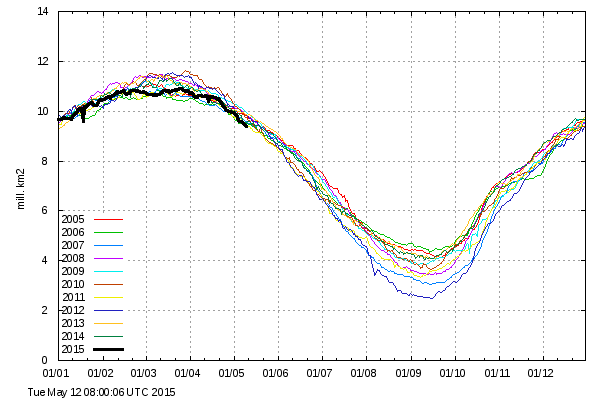
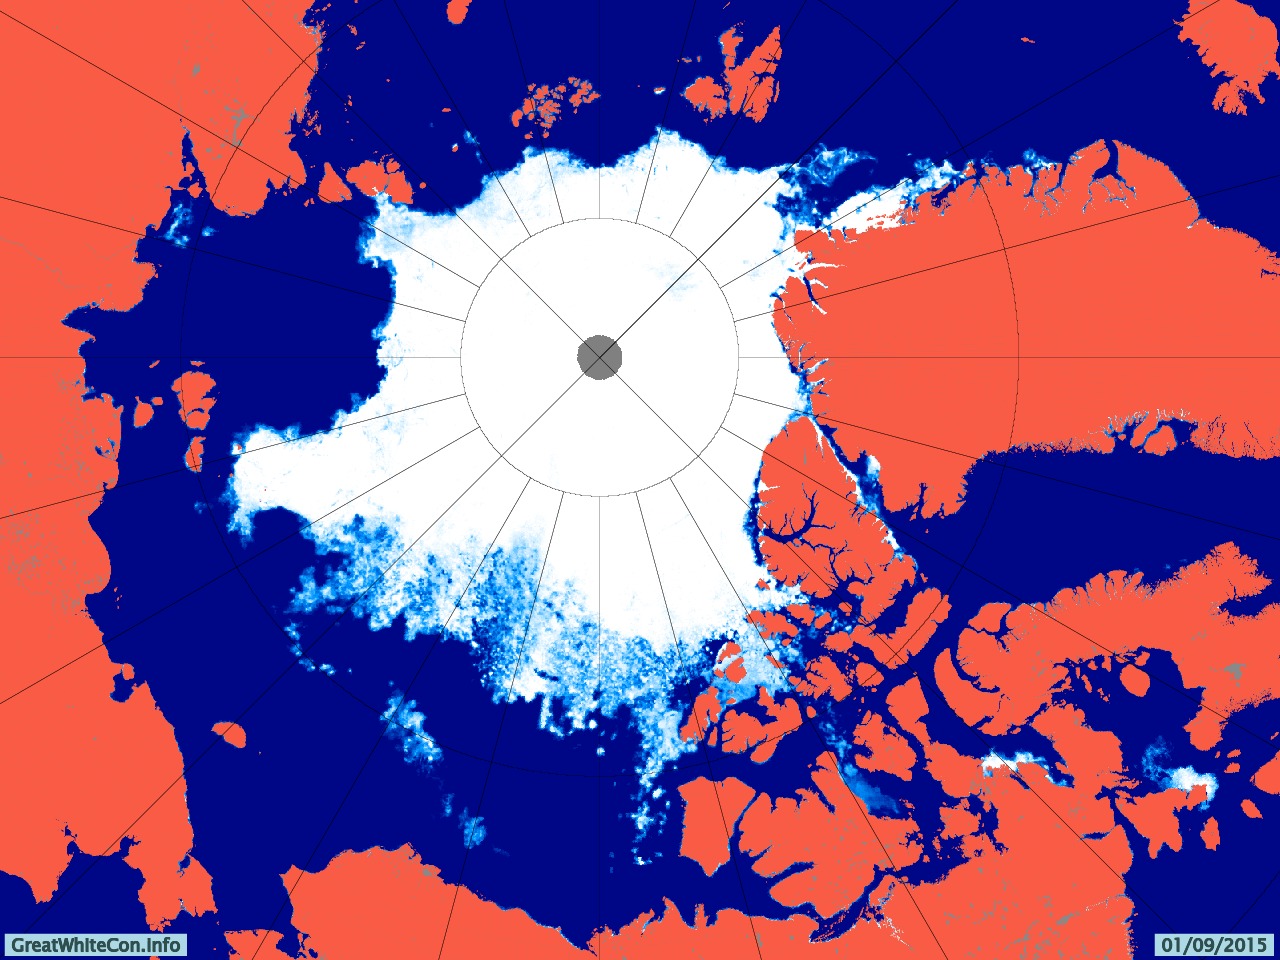
To set the scene, here’s the University of Hamburg’s map of Arctic sea ice concentration for September 1st, again based on AMSR2 data:
Here’s a video showing how that map has changed over the last two months:
Notice in particular the effect of the recent Arctic cyclone on the sea ice in the lower left quadrant. Note also our comment that:
[There is] a large potential fetch across the East Siberian, Chukchi and Beaufort Seas should any further cyclones occur in the area over the next few weeks. The conditions now exist for an even more damaging swell to be generated before the 2015 minimum Arctic sea ice extent is reached.
By now you may be wondering if we have a prediction to make? Well, we predict it still all depends on the weather! However here’s how the “probabilistic” 50 day ahead prediction from Andrew Slater of the NSIDC looks at the moment: 
If I were a betting man I’d say that the red line will ultimately put in a lower low than the dark blue one.
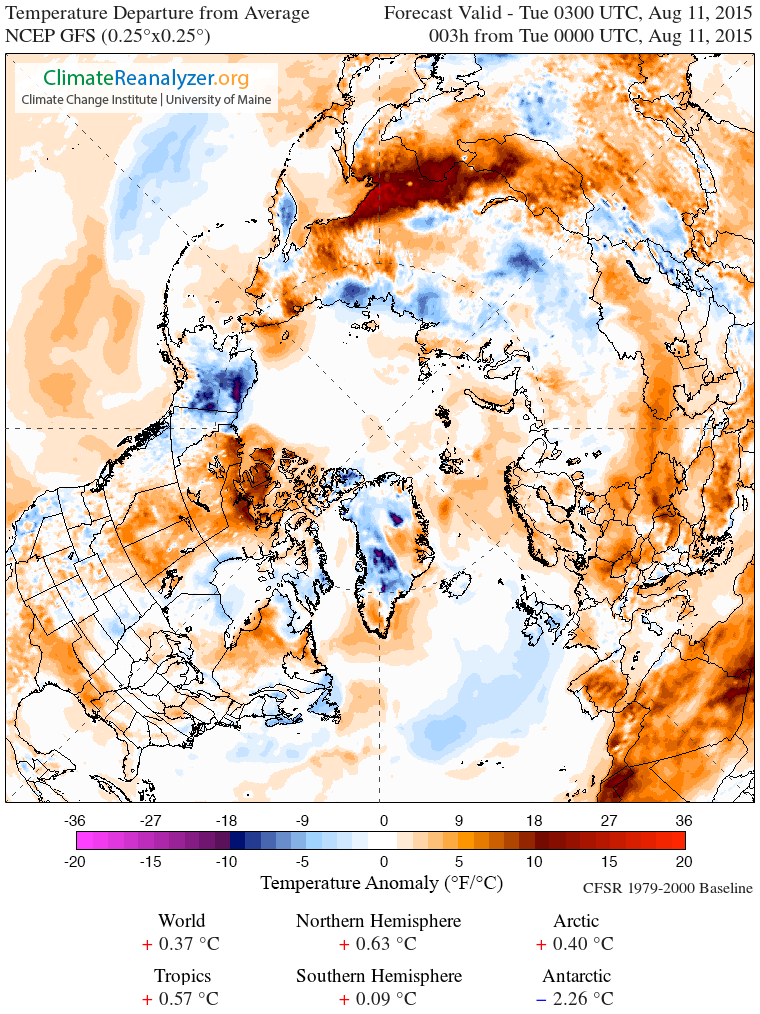
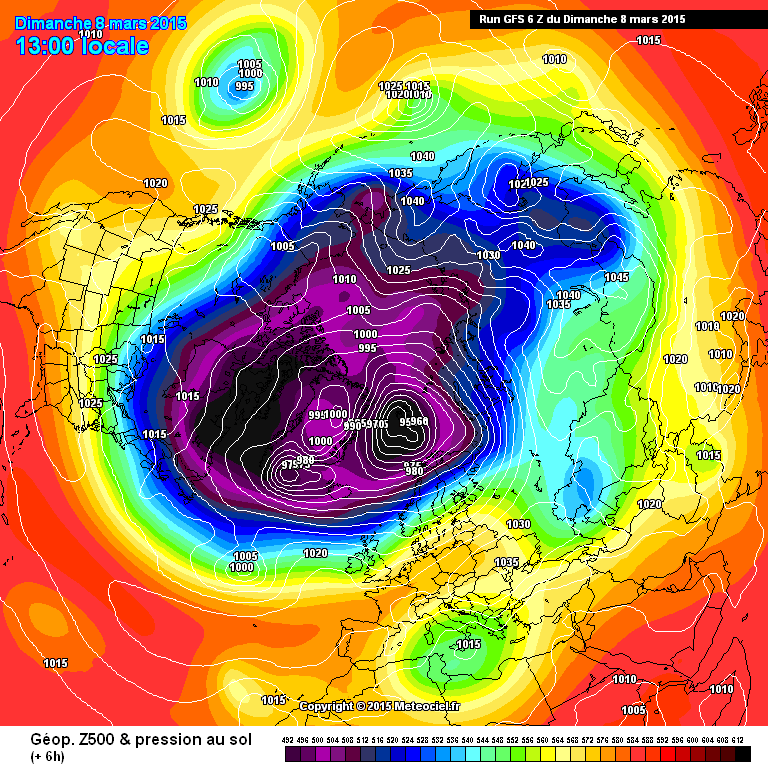
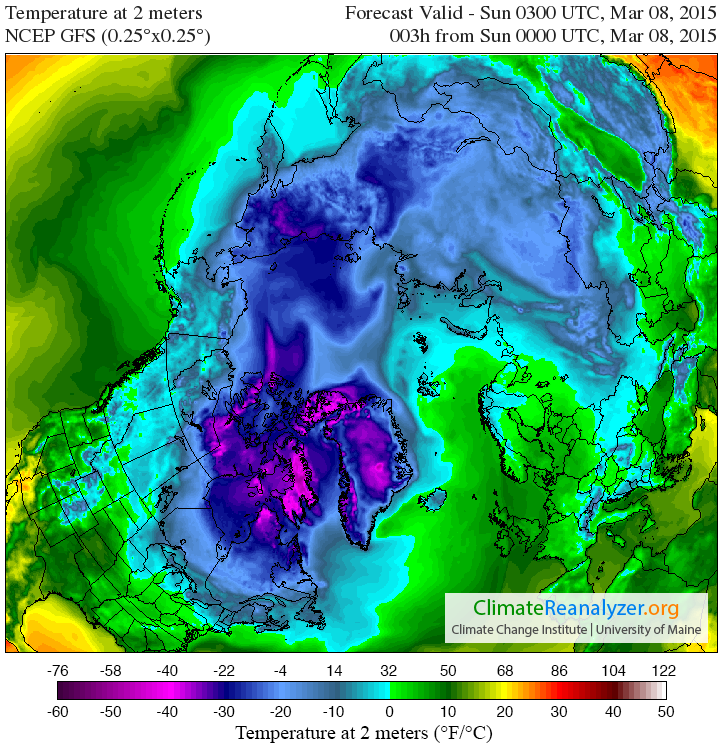
Finally, for the moment at least, take a look at the GFS surface level pressure forecast for later today, courtesy of MeteoCiel:

Can you see the 1000 hPa central pressure low spinning over the Laptev Sea? It’s currently not very deep, and it’s not over the East Siberian Sea either, but watch that space along with us as we wait to discover where and when the assorted Arctic sea ice metrics reach their minima for 2015.
[Edit – September 3rd 2015]
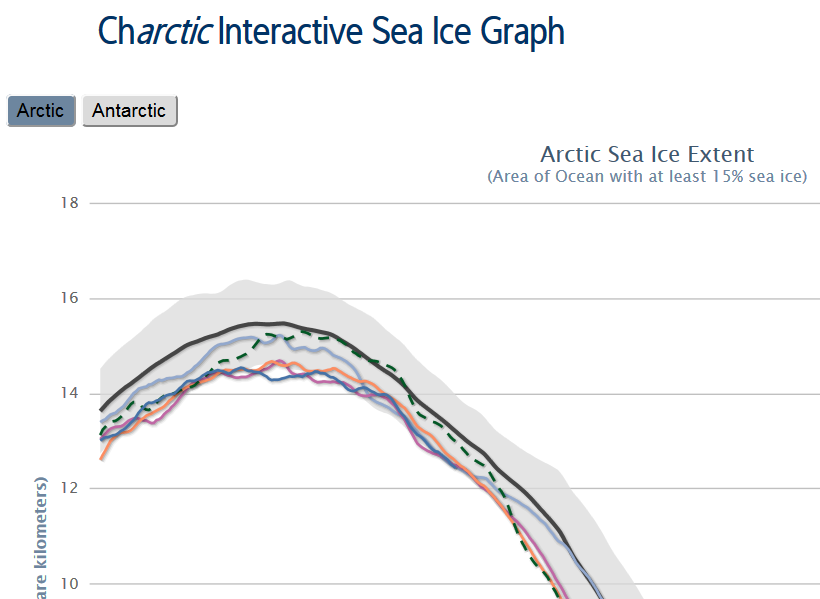
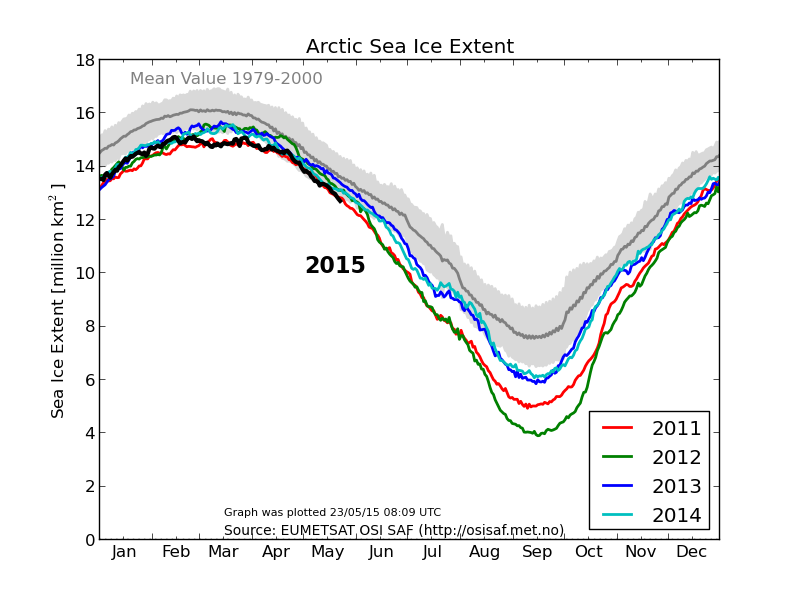
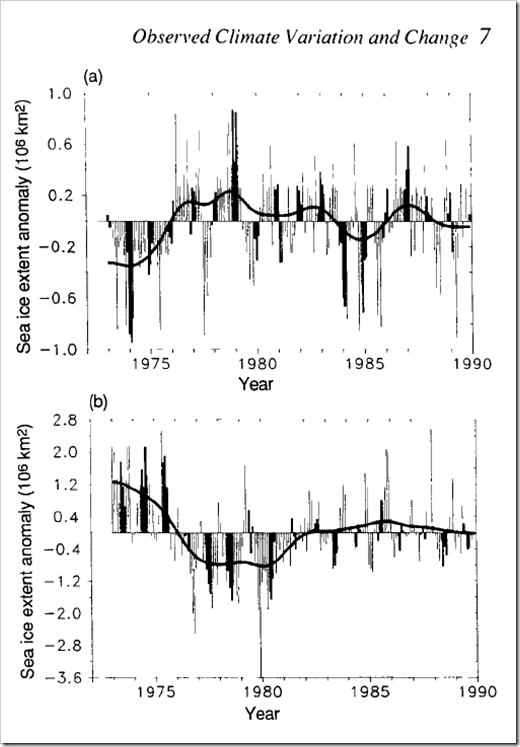
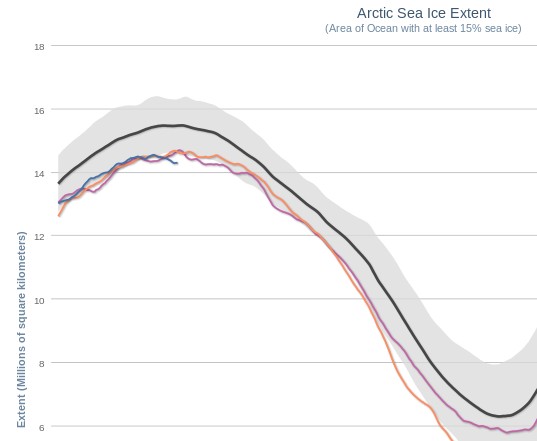
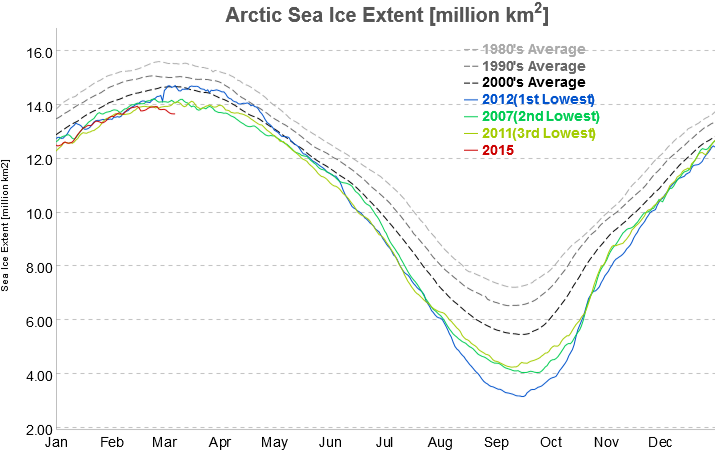
The latest edition of the US National Snow and Ice Data Center’s Arctic Sea Ice News has just been published. In the section on the imminent minimum they show this graph:

and say that:
Starting with the ice extent observed on August 31 and then applying 2006 loss rates, the slowest rate in recent years, results in the highest extrapolated minimum for 2015 of 4.50 million square kilometers (1.74 million square miles), and a September monthly average extent of 4.59 million square kilometers (1.77 million square miles). The lowest daily minimum comes from using the 2010 pace, yielding an estimated 4.12 million square kilometers (1.67 million square miles) for the daily minimum, and a September monthly average extent of 4.33 million square kilometers (1.67 million square miles).
Using an average rate of ice loss from the most recent ten years gives a one-day minimum extent of 4.38 ± 0.11 million square kilometers (1.79 million square miles), and a September monthly average of 4.49 ± 0.09. As of August 31, the 5-day running daily average extent is 4.72 million square kilometers. If no further retreat occurred, 2015 would already be the sixth lowest daily ice extent in the satellite record.
The forecast places the upcoming daily sea ice minimum between third and fourth lowest, with fourth more likely. There is still a possibility that 2015 extent will be lower than 4.3 million square kilometers, the third lowest sea ice extent, surpassing the 2011 sea ice extent minimum, and a small chance of surpassing 2007, resulting in the second-lowest daily minimum. This assumes that we continue to have sea ice loss rates at least as fast as those of 2010. This was indeed the case for the final ten days of August 2015.
Somewhere between 2nd and 6th then! We felt compelled to enquire on Twitter:
What's the #probability of a 2nd place finish for @NSIDC_ArcticIce daily #SeaIce extent? http://t.co/z9jA7ydg07 pic.twitter.com/KqccwUNjQg
— Snow White (@GreatWhiteCon) September 3, 2015