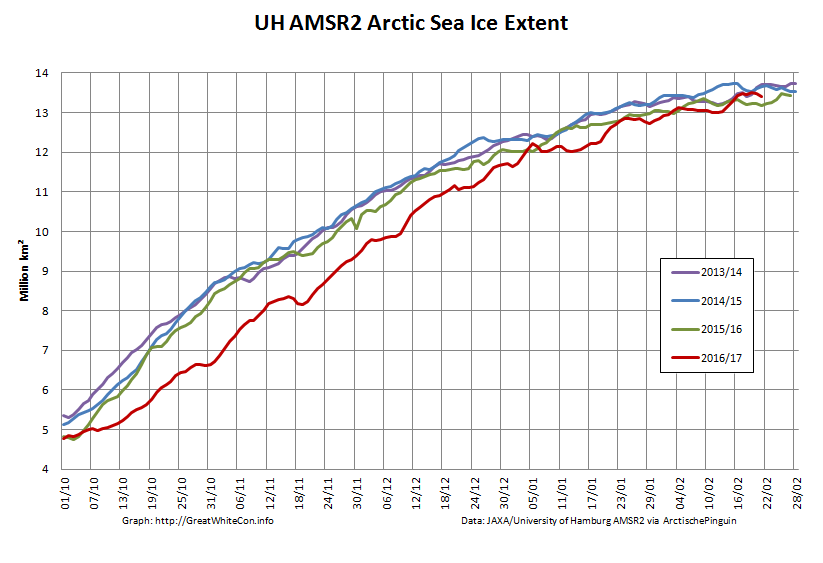
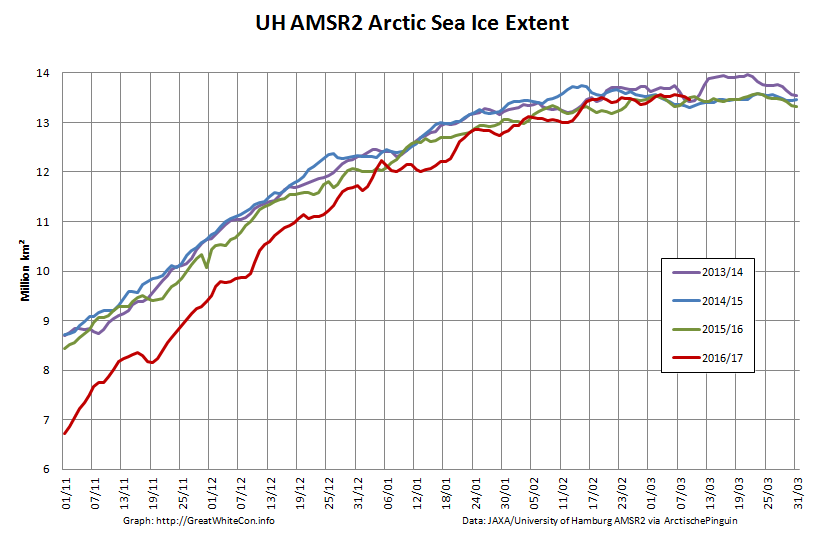
It’s far too early to be sure about this yet, but it’s not beyond the bounds of possibility that the 2017 maximum is already in place. Here’s our favourite high resolution extent graph calculated by “Wipneus” from University of Hamburg/JAXA AMSR2 data:
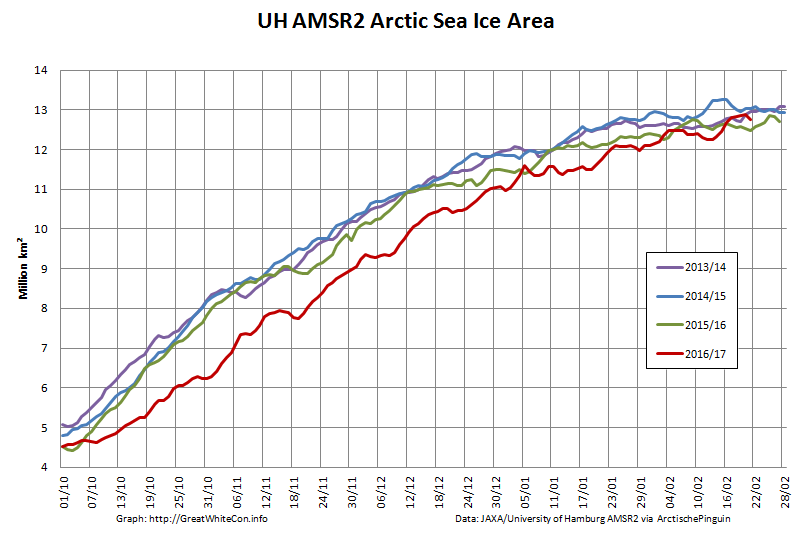
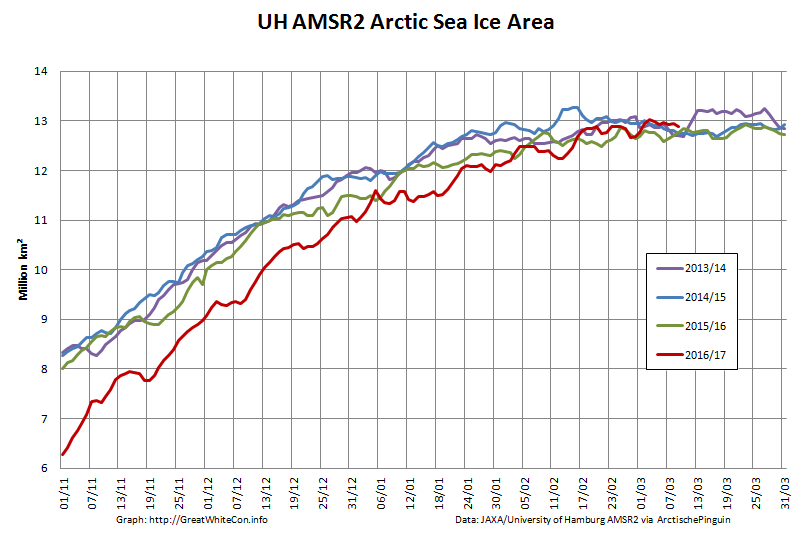
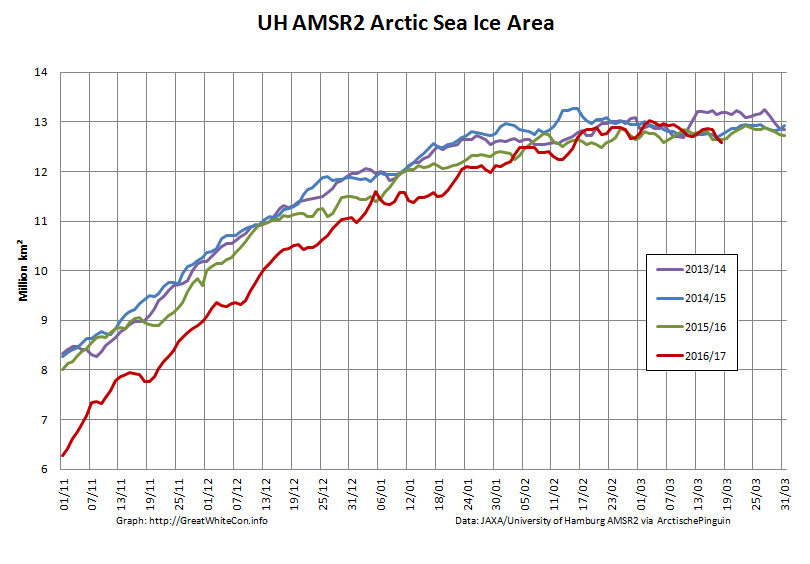
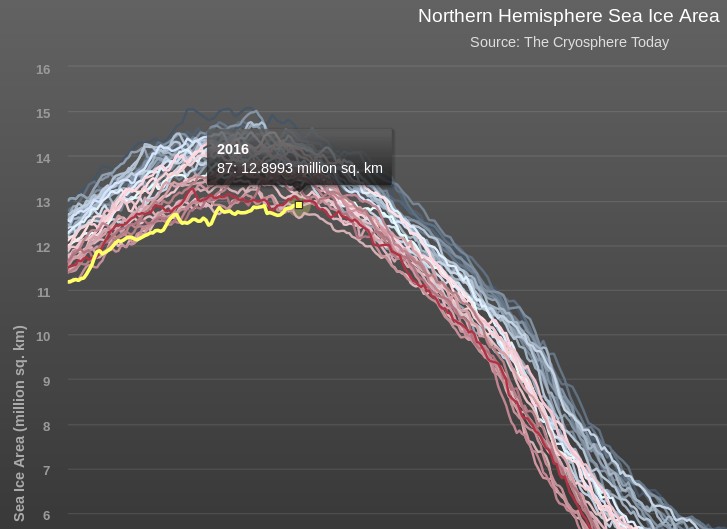
The current maximum Arctic sea ice extent for 2017 is 13.49 million square kilometers on February 19th. Here’s Arctic sea ice area for good measure:
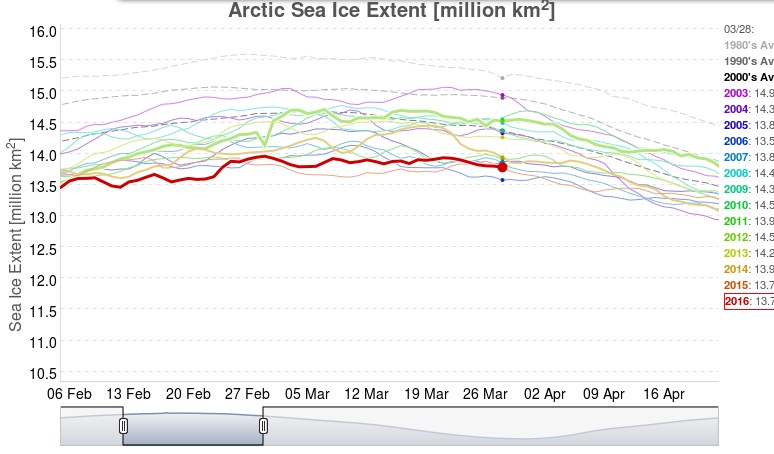
The current maximum area for 2017 is 12.88 million square kilometers on February 20th. Here also is the NSIDC’s 5 day averaged extent:
This reveals a current maximum extent for 2017 of 14.302 million square kilometers on February 20th.
[Edit – March 1st]
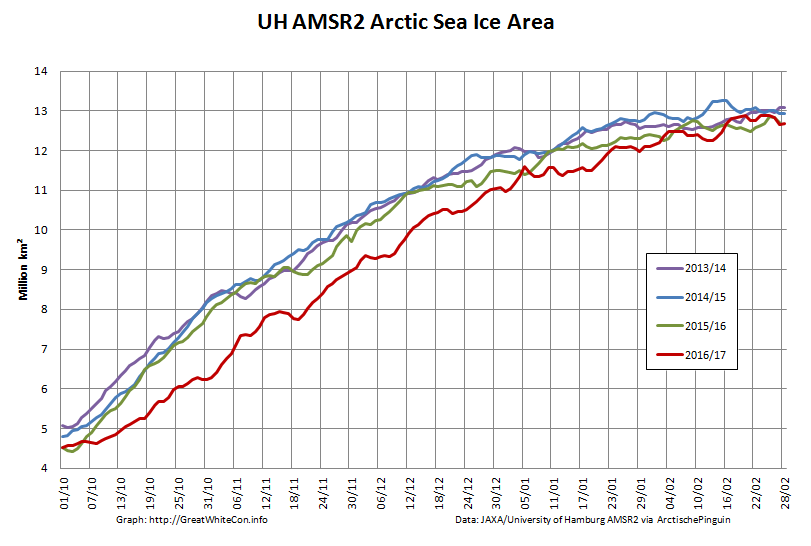
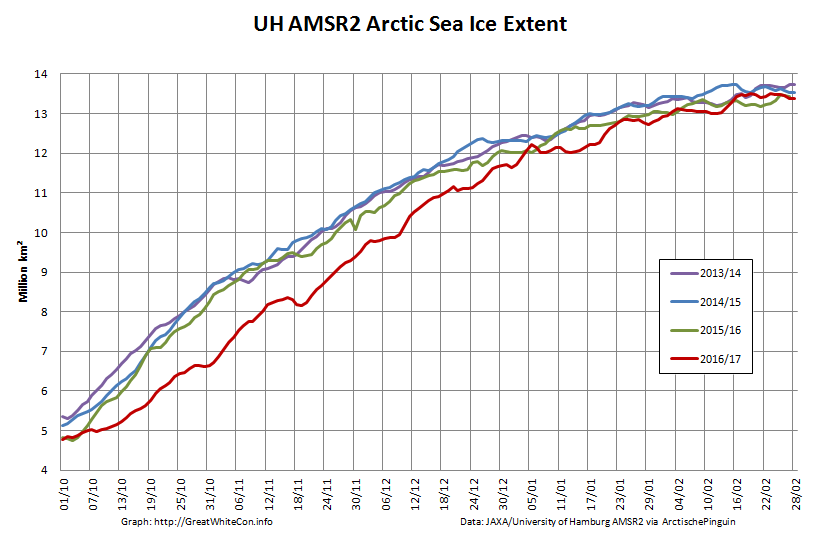
Here are the high resolution AMSR2 area and extent graphs for the end of February:
With each day that passes the highs of February 19th/20th look more likely to have been this years maximum. Nonetheless past experience suggests it’s still far to soon to be sure about that.
[Edit – March 10th]
Arctic sea ice area and extent are declining again, having reached new heights for the year on March 3rd:
However the 2013/14 winter showed a late surge is still possible.
[Edit – March 18th]
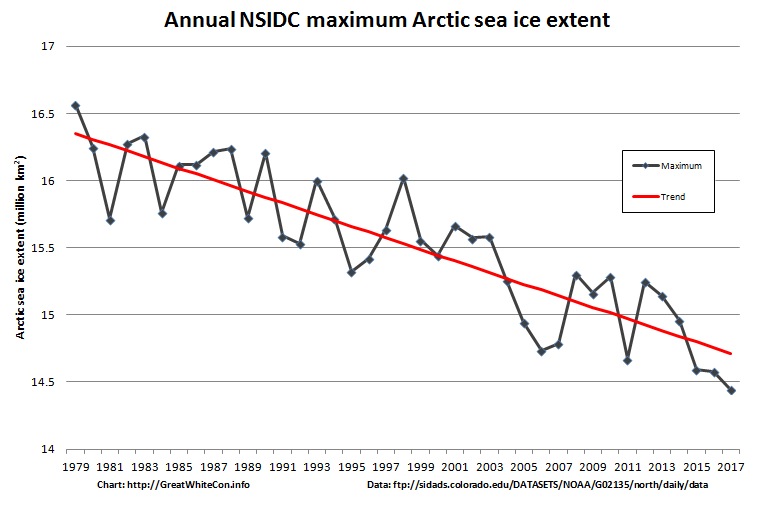
A “late surge” is looking increasingly unlikely. That being the case, here is our provisional long term graph of NSIDC daily Arctic sea ice extent:
Subject to an unanticipated “surge” the 2017 maximum of 14.447 million square kilometers occurred on March 5th.
JAXA extent has dropped steeply over the last couple of days, and it is now once again “lowest for the date since records began”:
The 2017 JAXA maximum of 13.878 million square kilometers occurred on March 6th.
In the continuing absence of updates to Cryosphere Today area, here’s the high resolution Arctic sea ice area graph calculated by “Wipneus” from University of Hamburg/JAXA AMSR2 data:
The maximum for that particular metric was 13.03 million square kilometers on March 3rd.
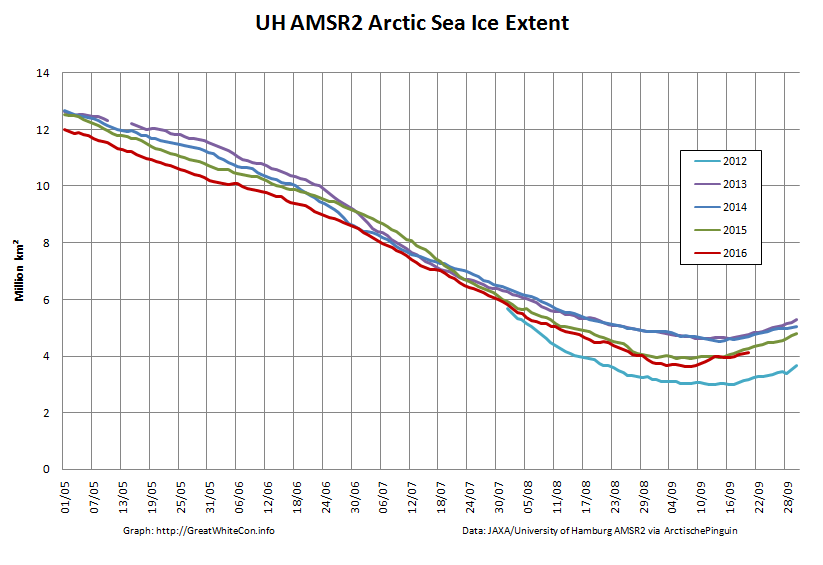
September 2016 is here at last! I posed this question at the start of the recent “Great Arctic Cyclone“:
I wonder what the minimum for 2016 will be, and on what date?
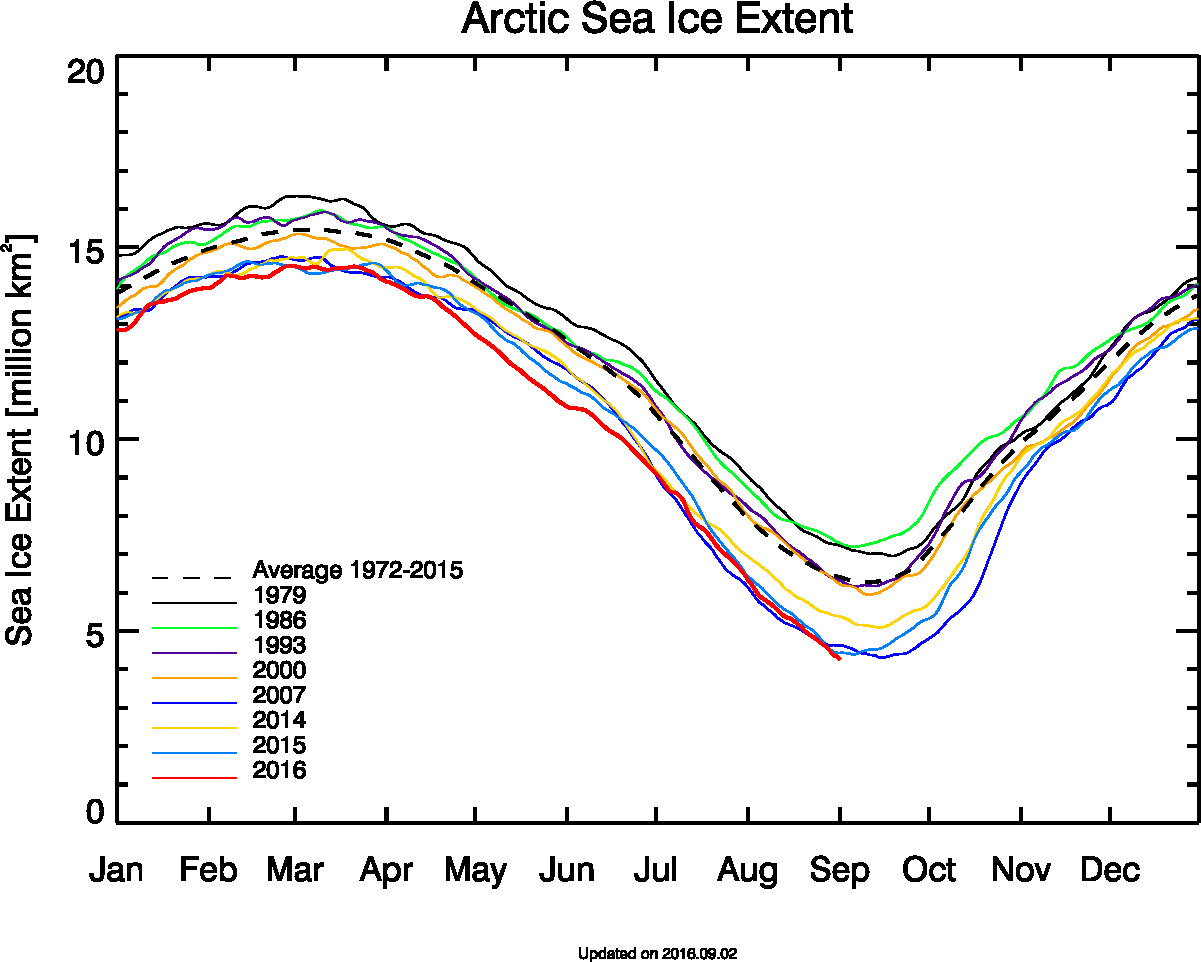
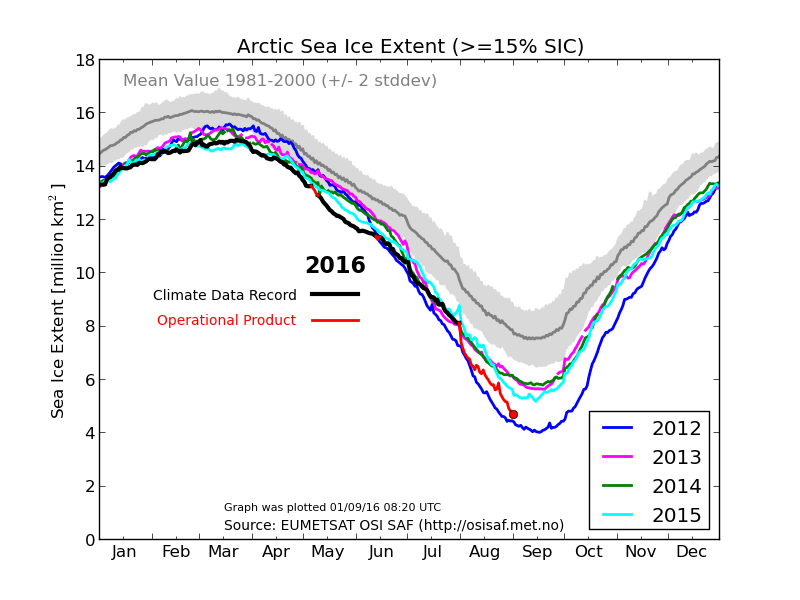
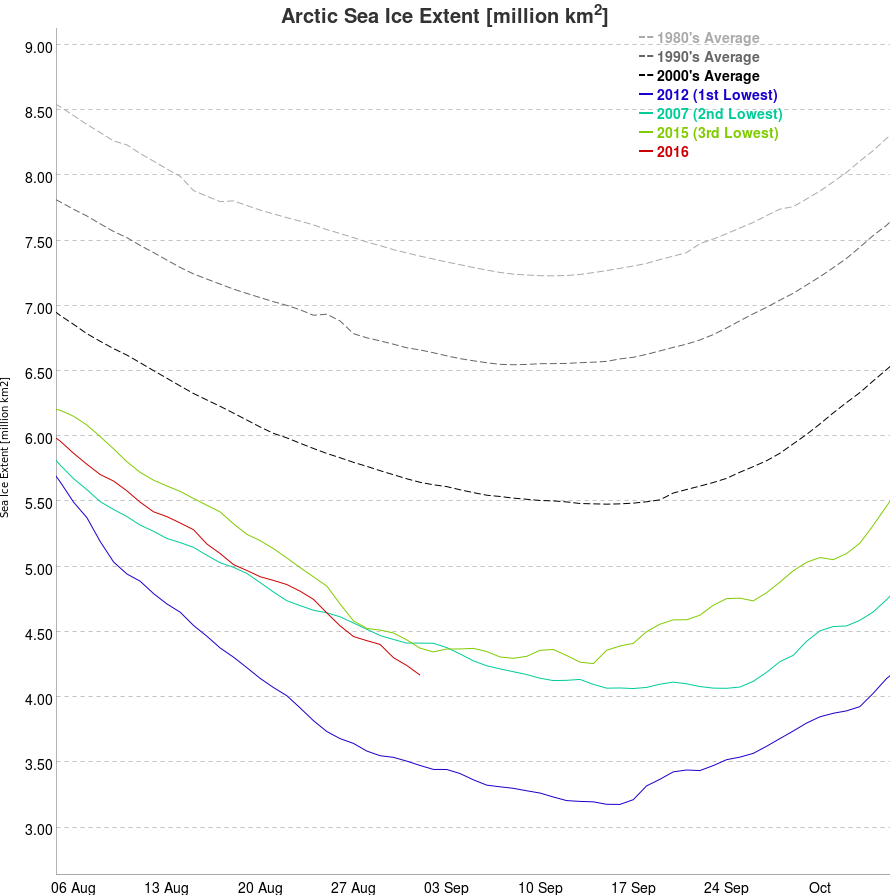
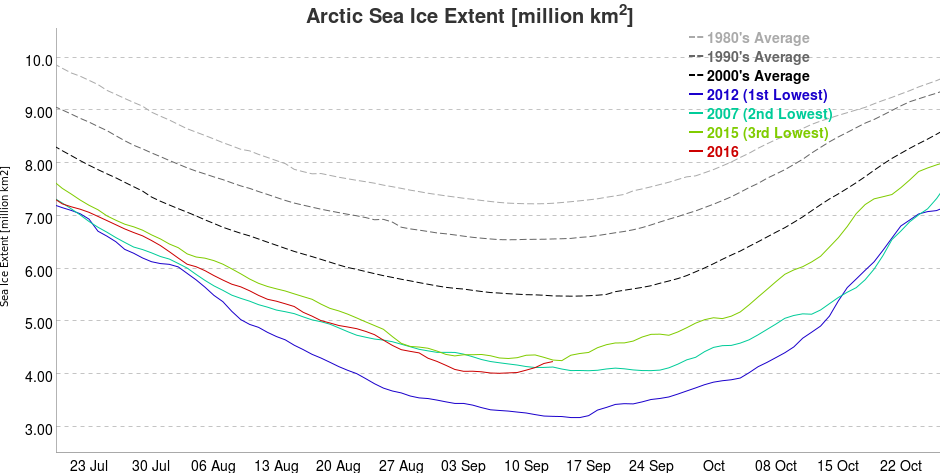
I’m still wondering, and the answer does of course depend on which Arctic sea ice metric you happen to be looking at. Here’s a few examples to be going on with. Firstly there’s Tony Heller’s extent metric du jour, from the University of Bremen:
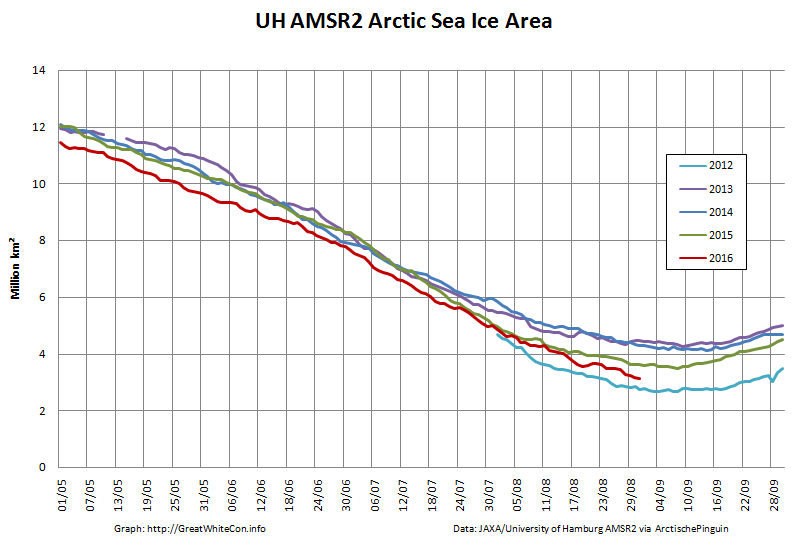
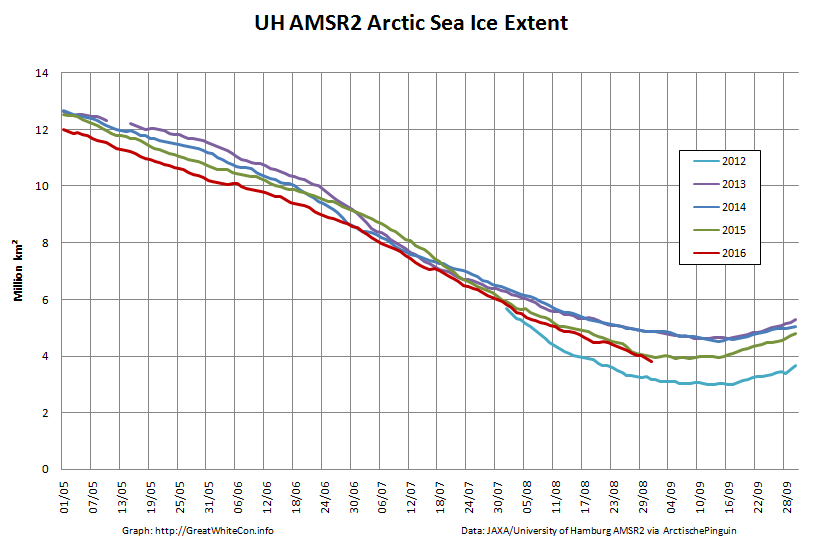
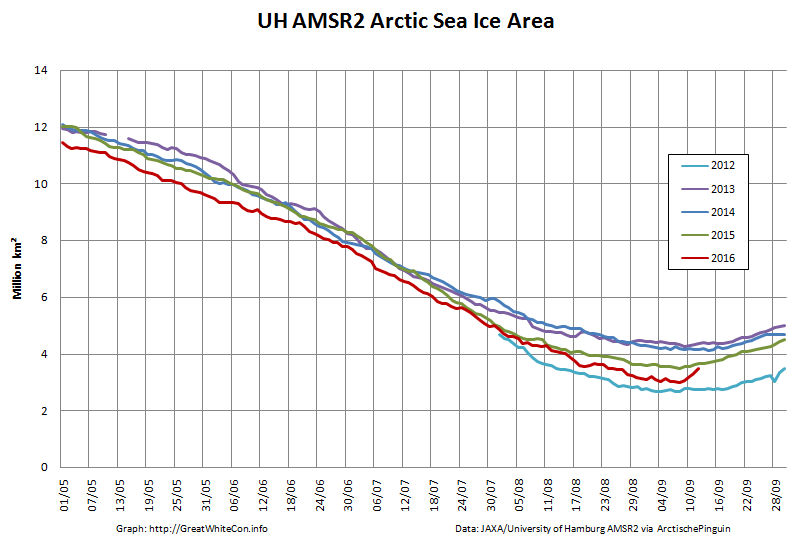
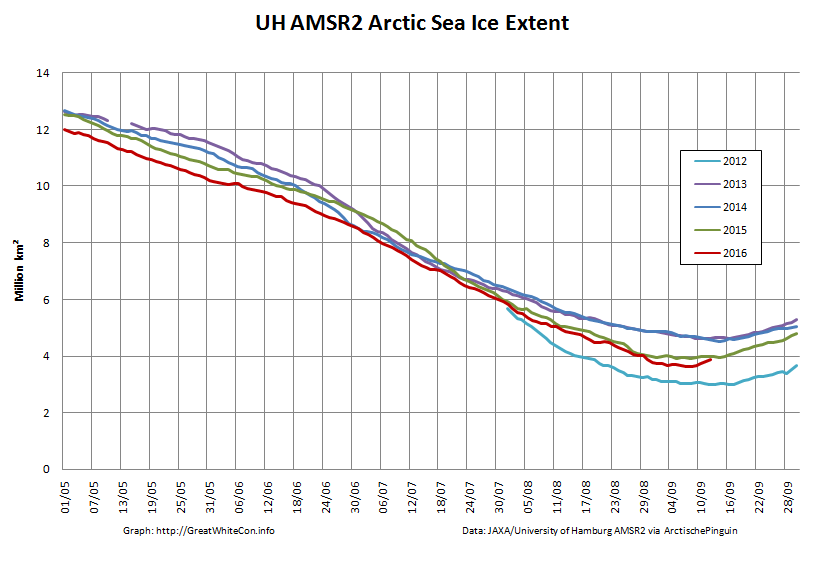
Finally here are “Snow White’s” favourite high resolution AMSR2 metrics derived by “Wipneus” from University of Hamburg AMSR2 concentration data:
Are there any other suggestions for numbers to keep a close eye on over the next few weeks?
[Edit – September 3rd]
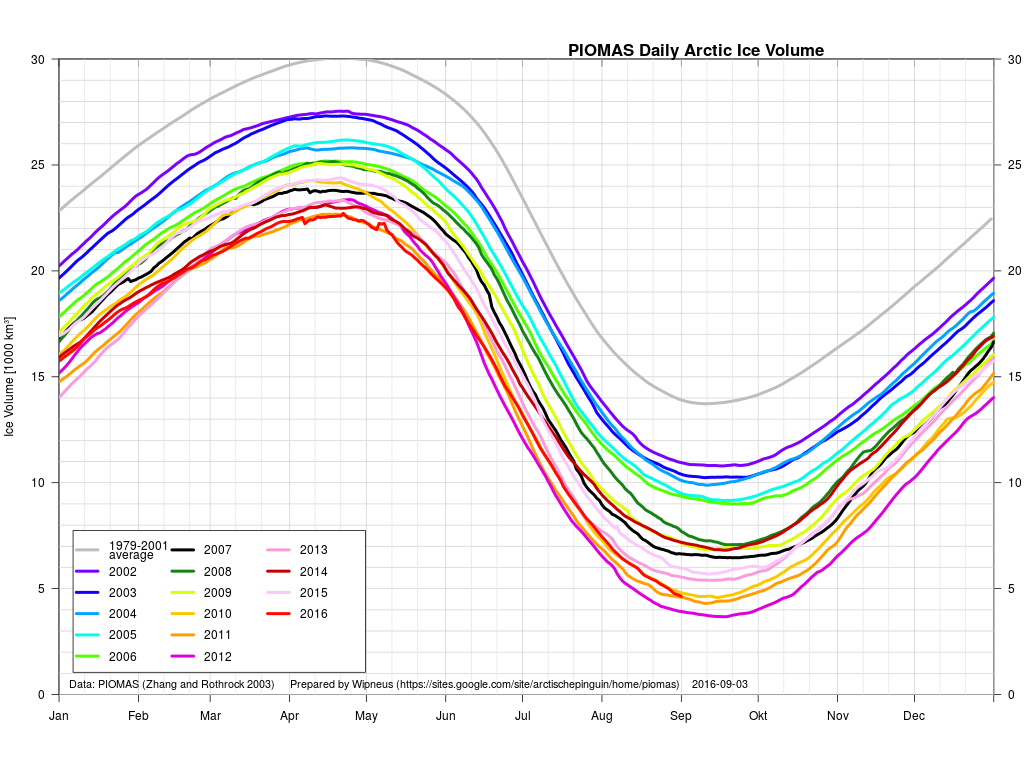
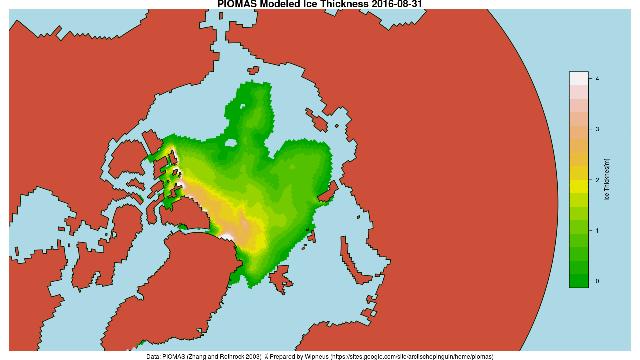
Arctic sea ice volume, as modelled by PIOMAS, has been updated to August 2016:
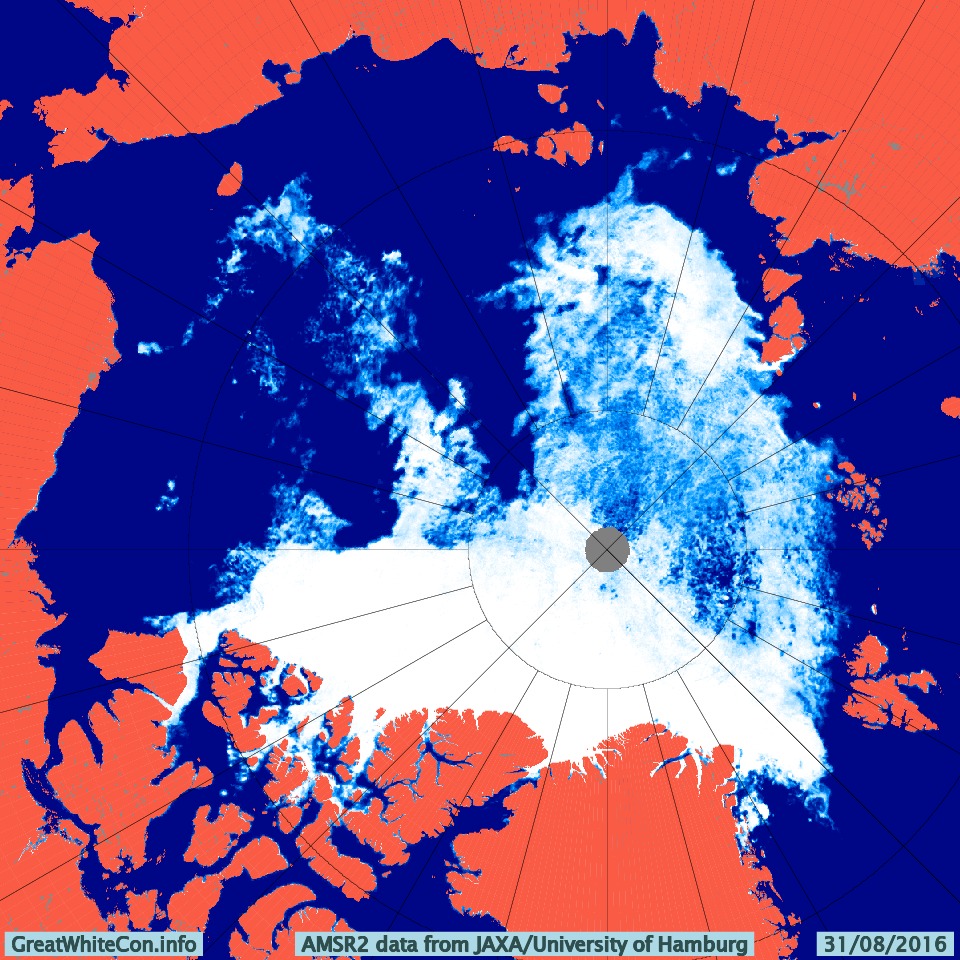
It’s currently 3rd lowest for the month, just a whisker behind 2011. Here’s the PIOMAS gridded data for August 31st 2016:
and for comparison purposes here’s the high res AMSR2 concentration map for the same date:
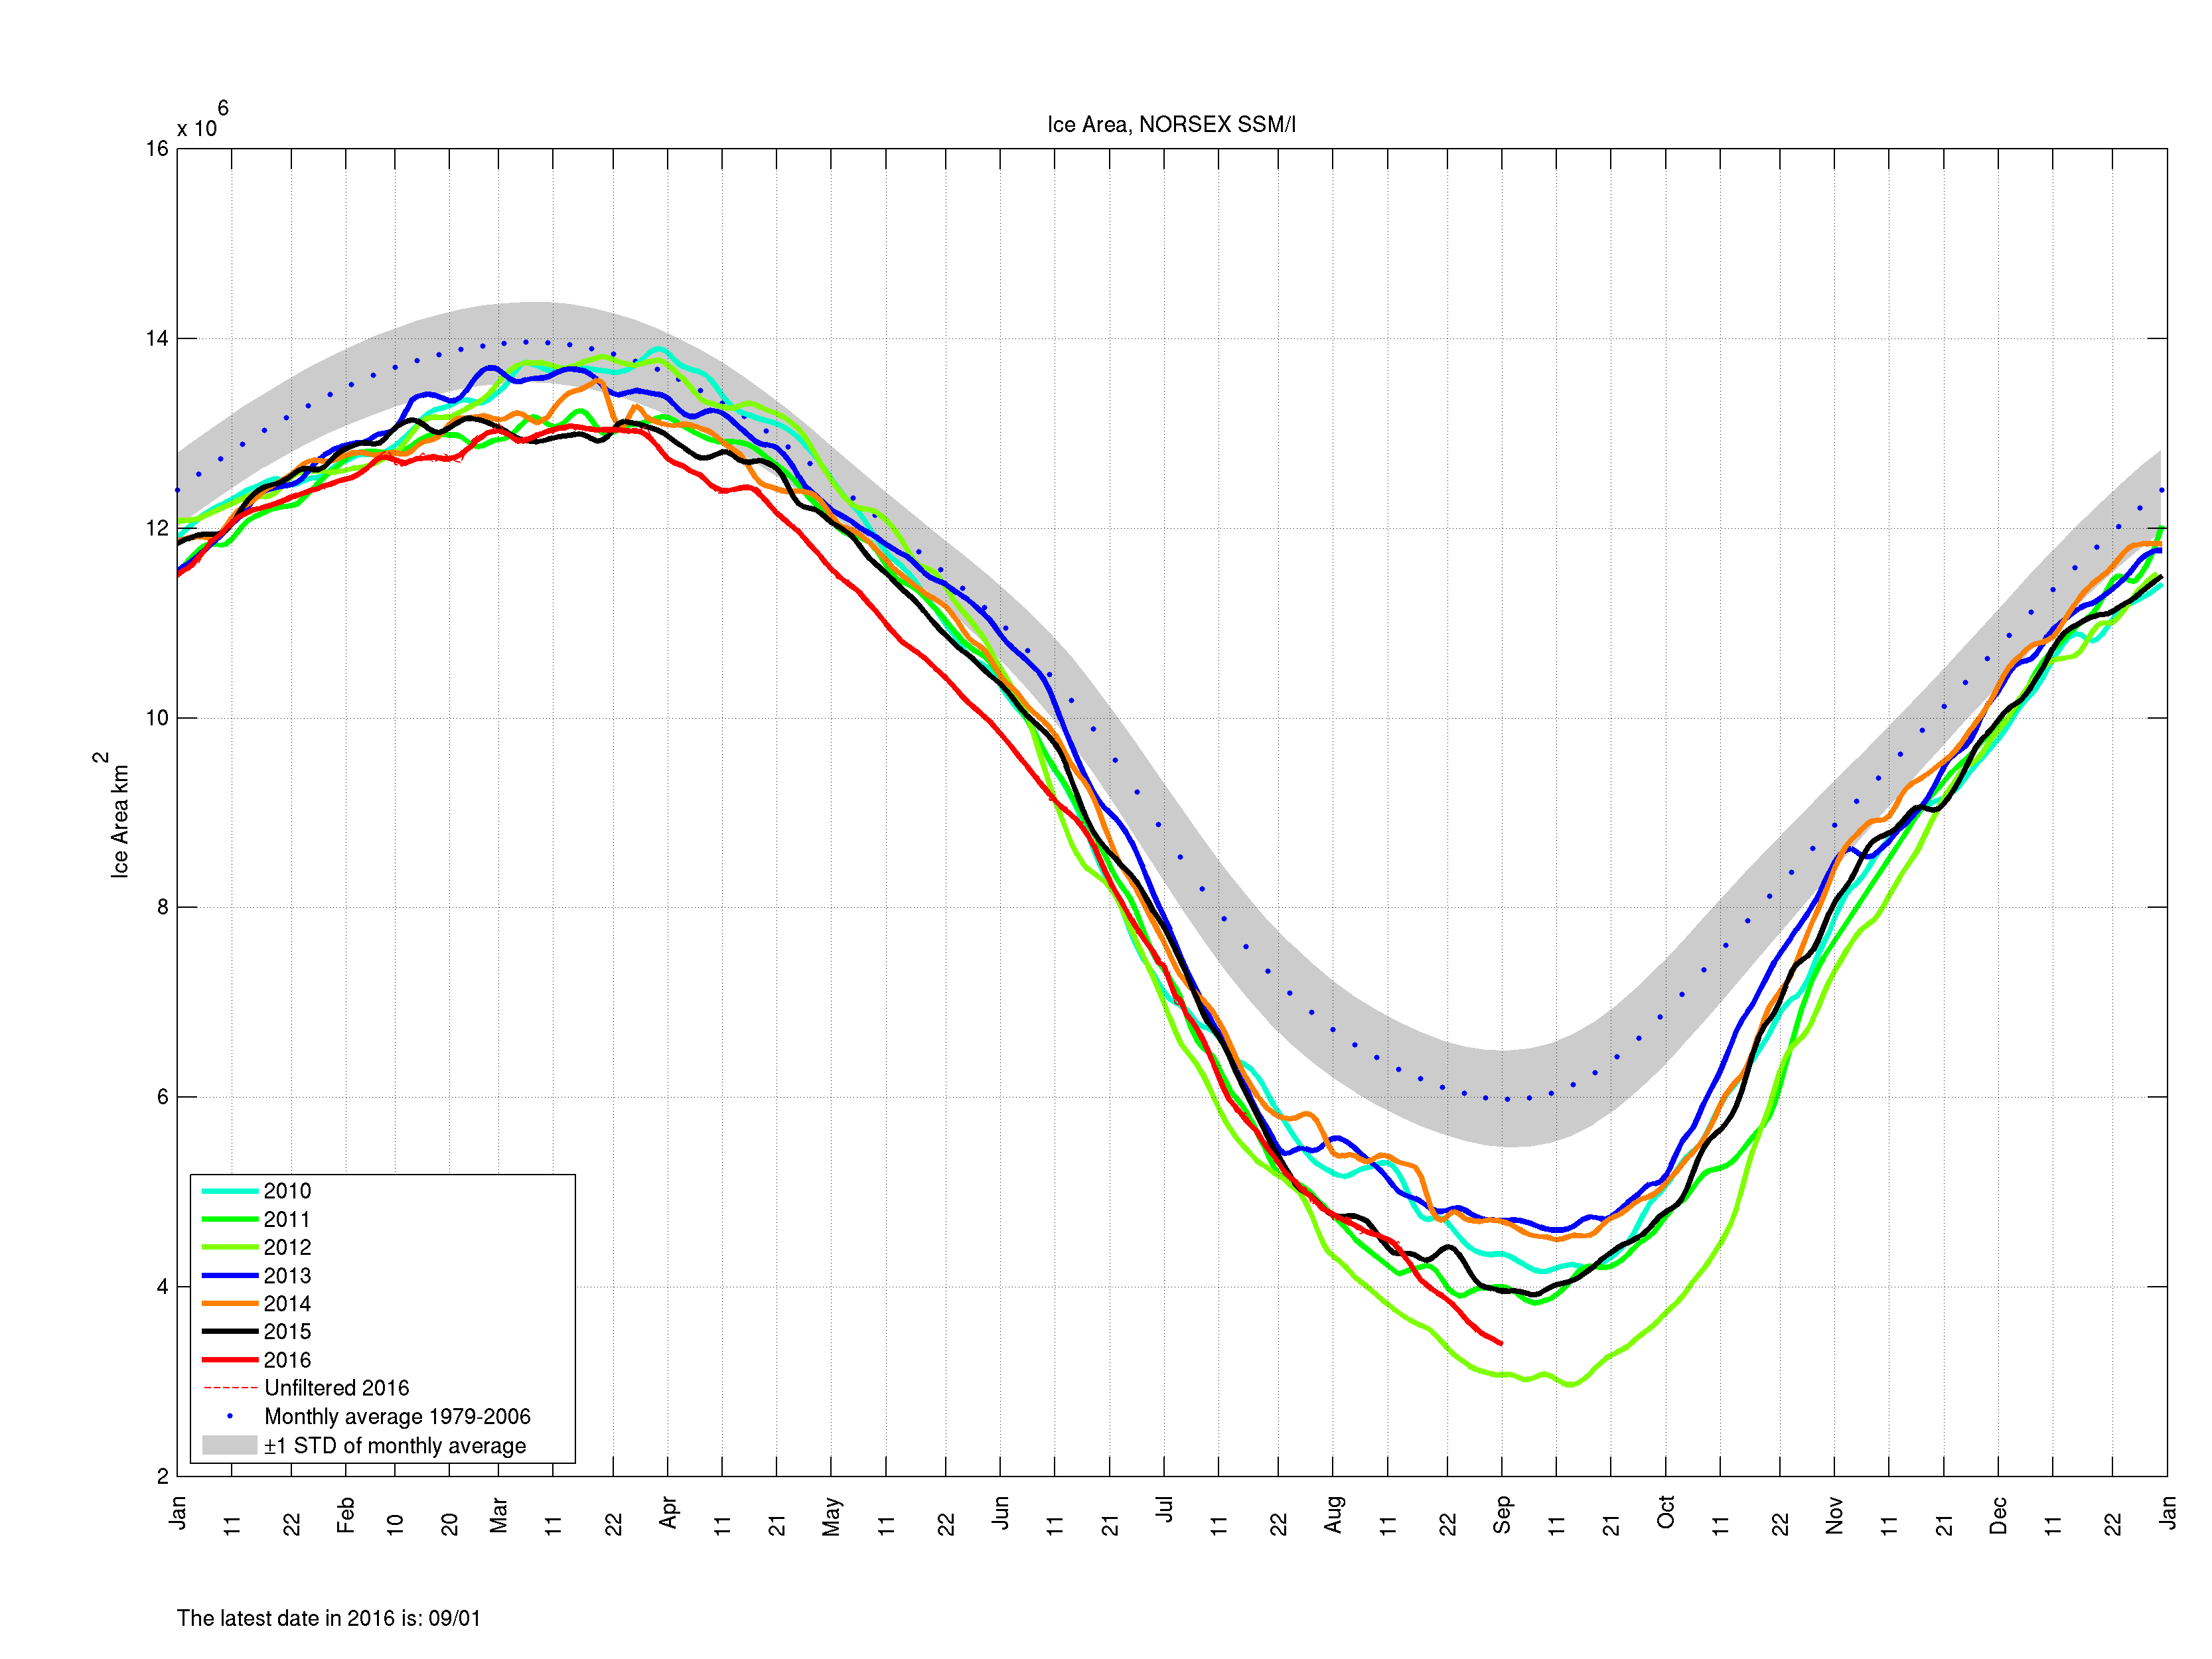
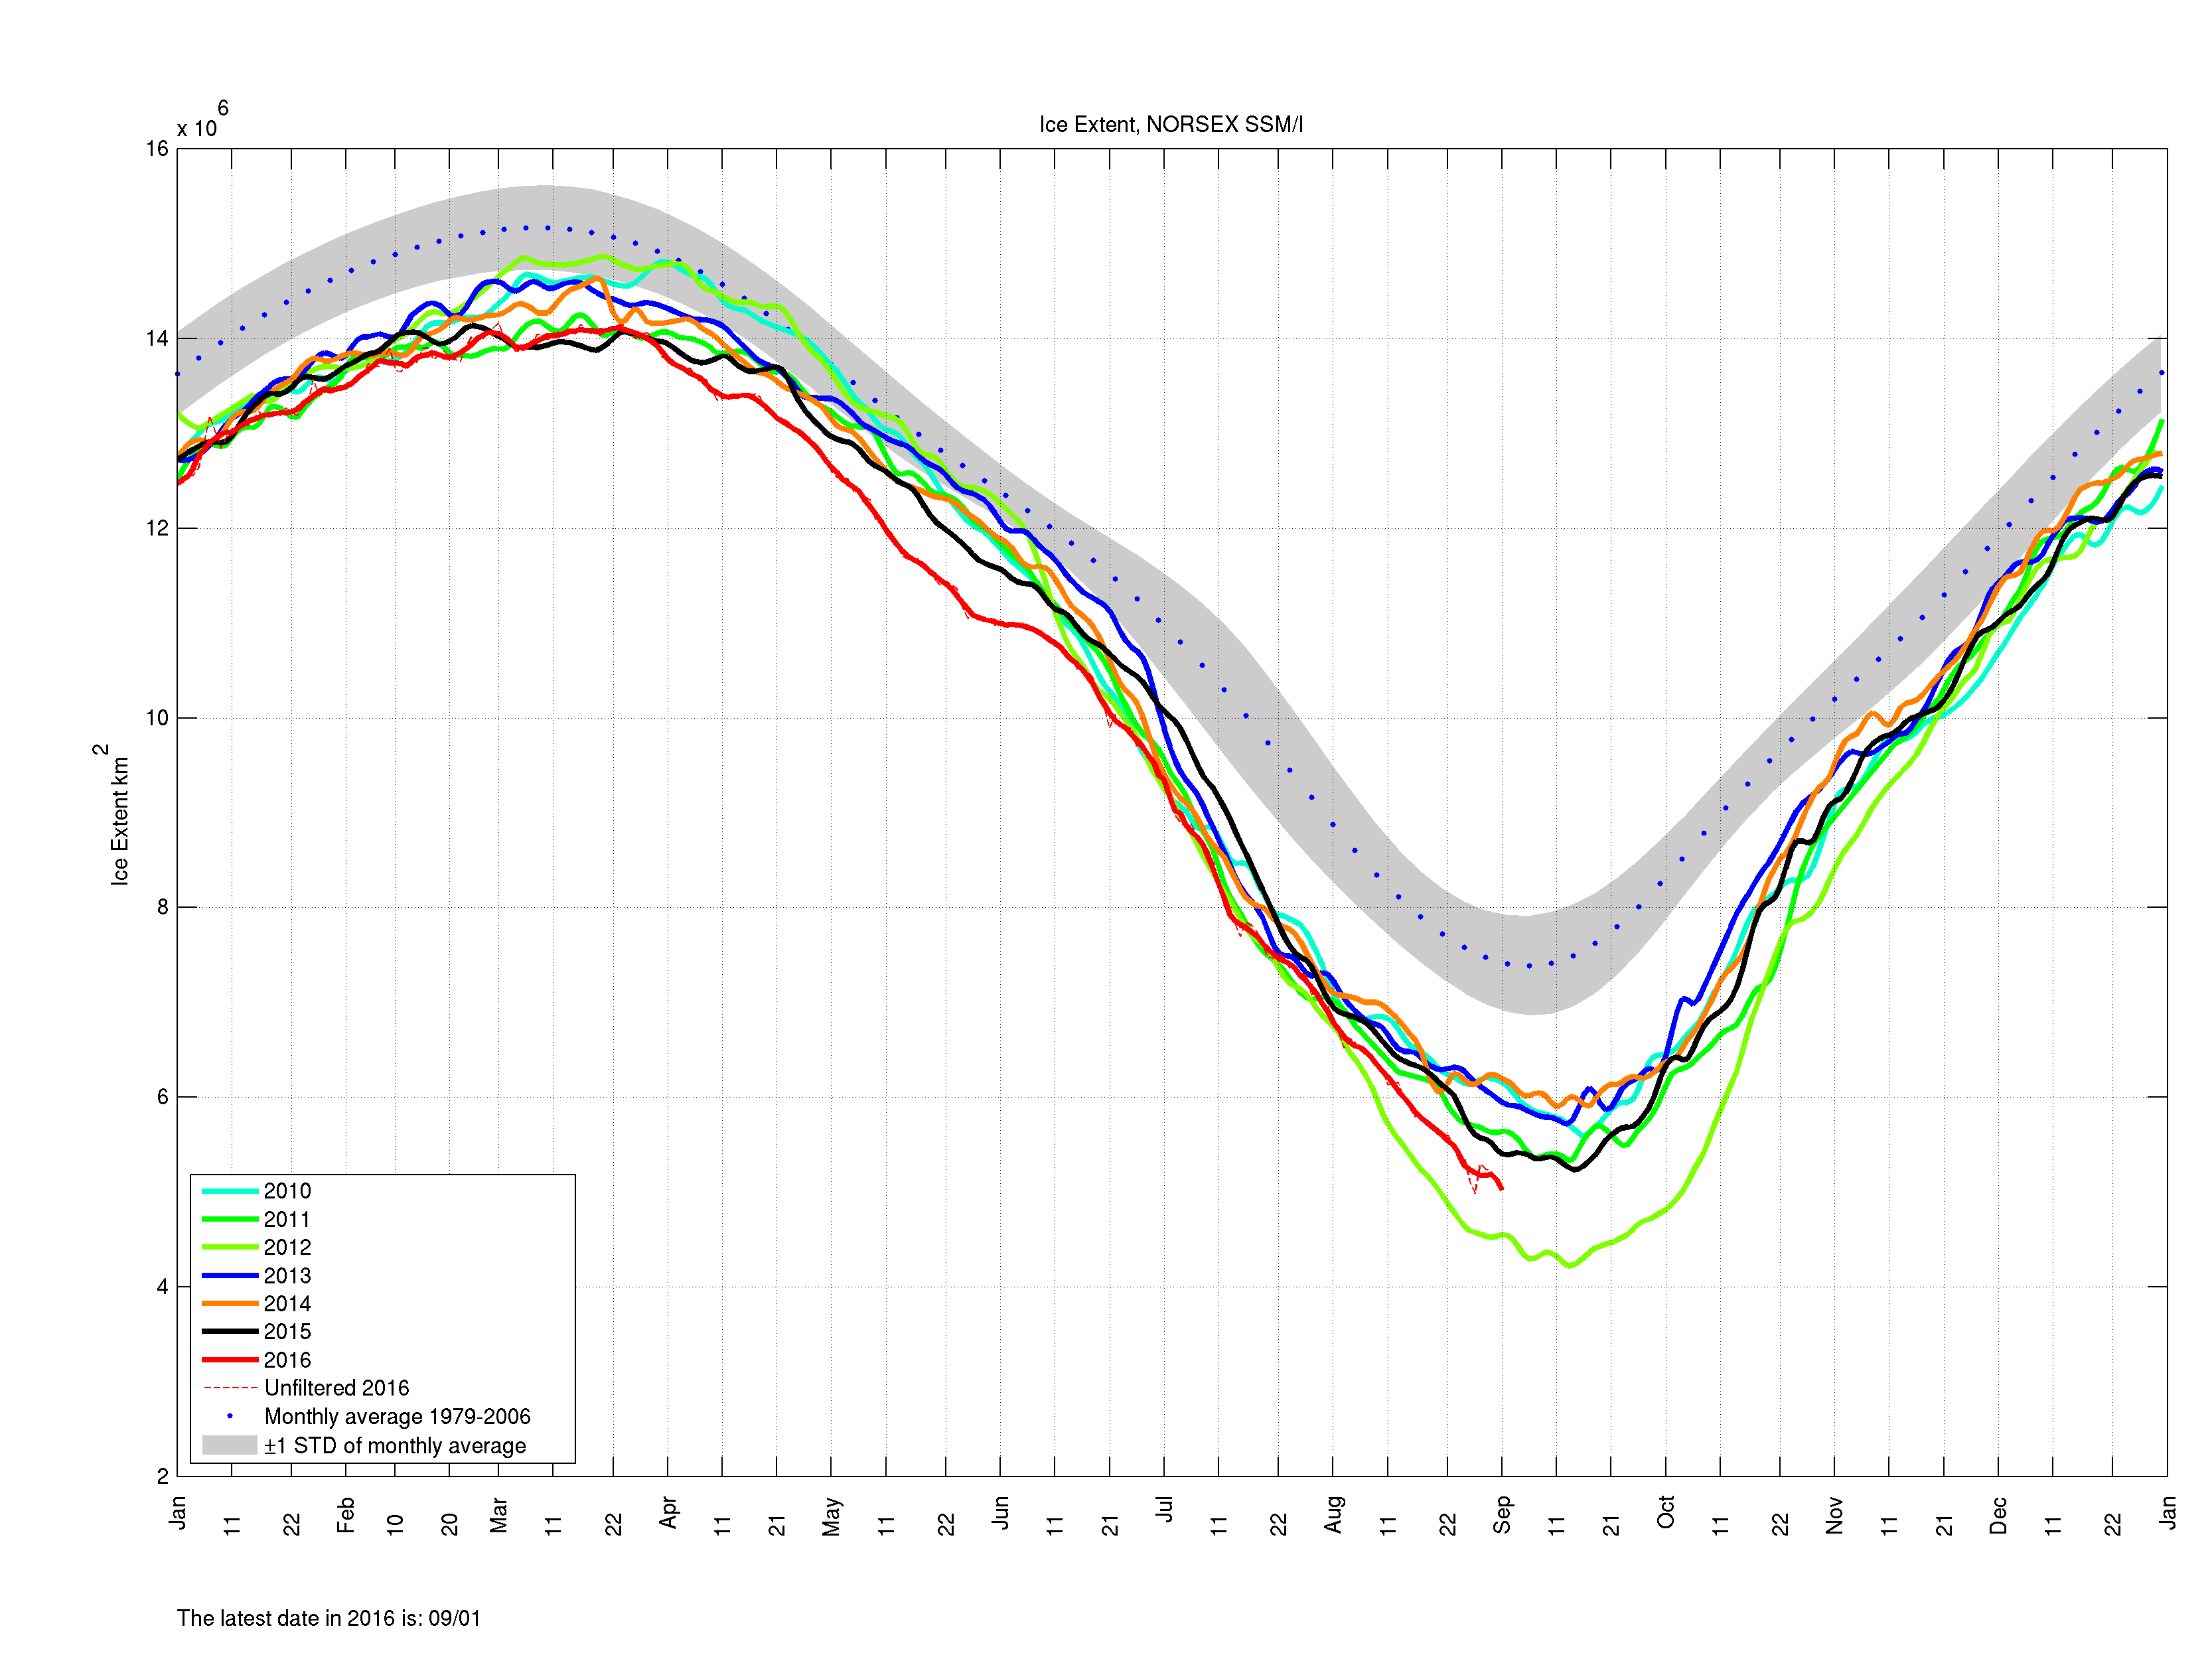
As suggested by Bill, here too are the Arctic Regional Ocean Observing System numbers. Much like the high res AMSR2 data they allow comparison between area and extent from the same sensor/algo combination, in this case SSMIS/NORSEX on a 25 km grid:
Both sources agree that currently the remaining ice is less compact in 2016 than it was in 2012.
[Edit – September 4th]
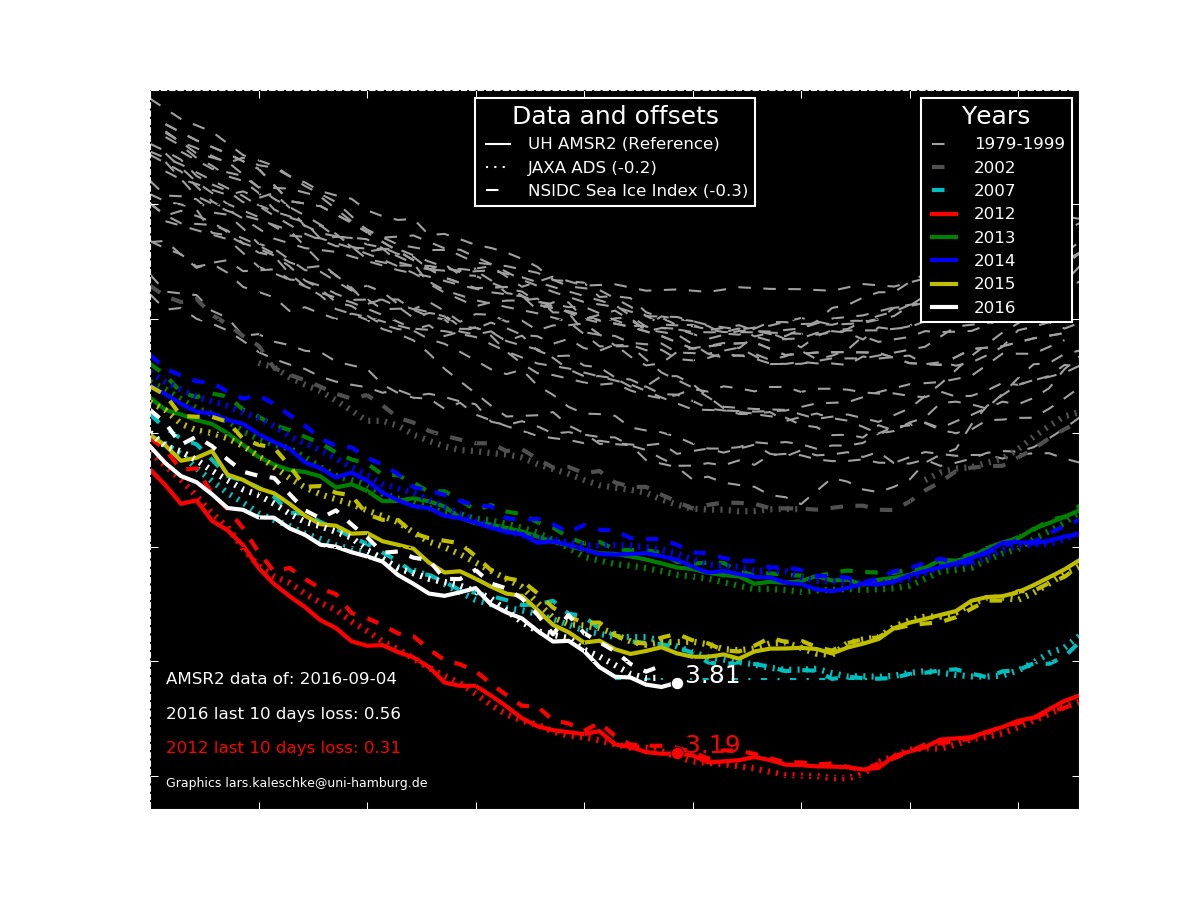
An interesting inter-metric comparison from Lars Kaleschke of the University of Hamburg:
Here’s another twist on the University of Hamburg’s AMSR2 extent, courtesy of Lars Kaleschke:
[Edit – September 11th]
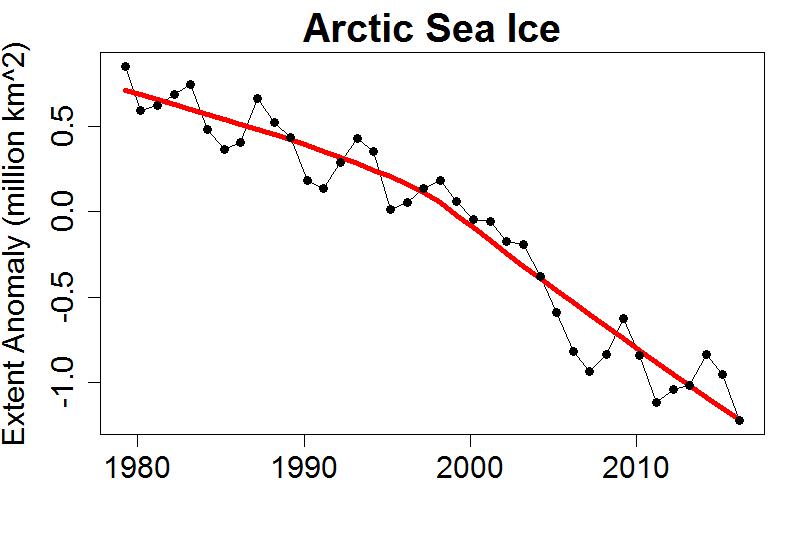
Several of the metrics displayed above have increased over the last day or two. The 2016 minimum may be upon us, but another few days will have to go by before that’s finally confirmed. Whilst we wait here’s another metric to consider, as described on “Tamino’s” Open Mind blog:
A plot of annual average extent also clearly shows the decline, and includes data from throughout the year rather than just the annual minimum. The figure for 2016 is the lowest on record, but the year isn’t done yet. If instead of averaging January-through-December we do September-through-August (to make the final year complete), we find that the most recent year is still the lowest on record:
Any way you look at it, Arctic sea ice is in decline. If you look at the entire year rather than just the annual minimum, the record year is this one.
[Edit – September 14th]
The refreeze has certainly started now. A quick look through the metrics. First of all the Hamburg University high resolution AMSR2 matched set:
Area just squeezed under 3 million km². Next up is JAXA extent:
which just failed to fall below 4 million km². Last but not least, just for the moment, is the NSIDC 5 day trailing averaged extent:
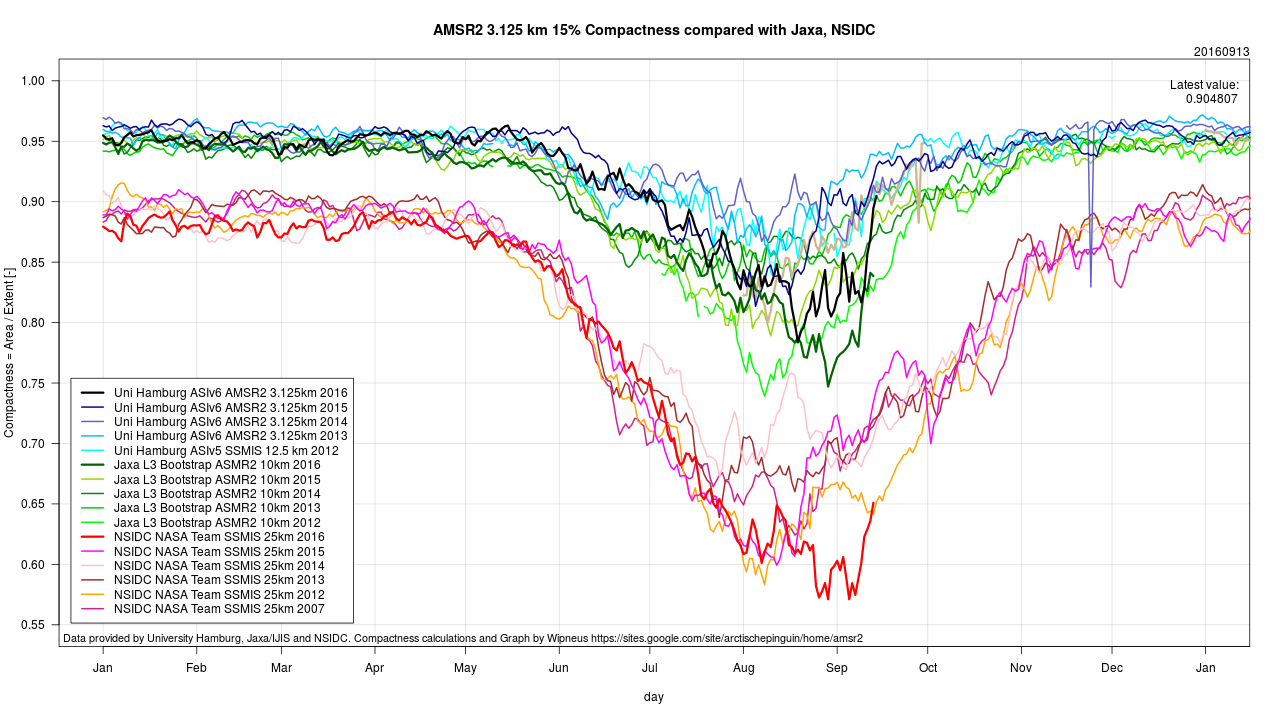
The most striking this year is the unusually large gap between area and extent for this time of year, illustrated by this “compactness” graph from Arctische Pinguin:
Note too the striking difference between different sensor/algo combinations for this metric!
[Edit – September 15th]
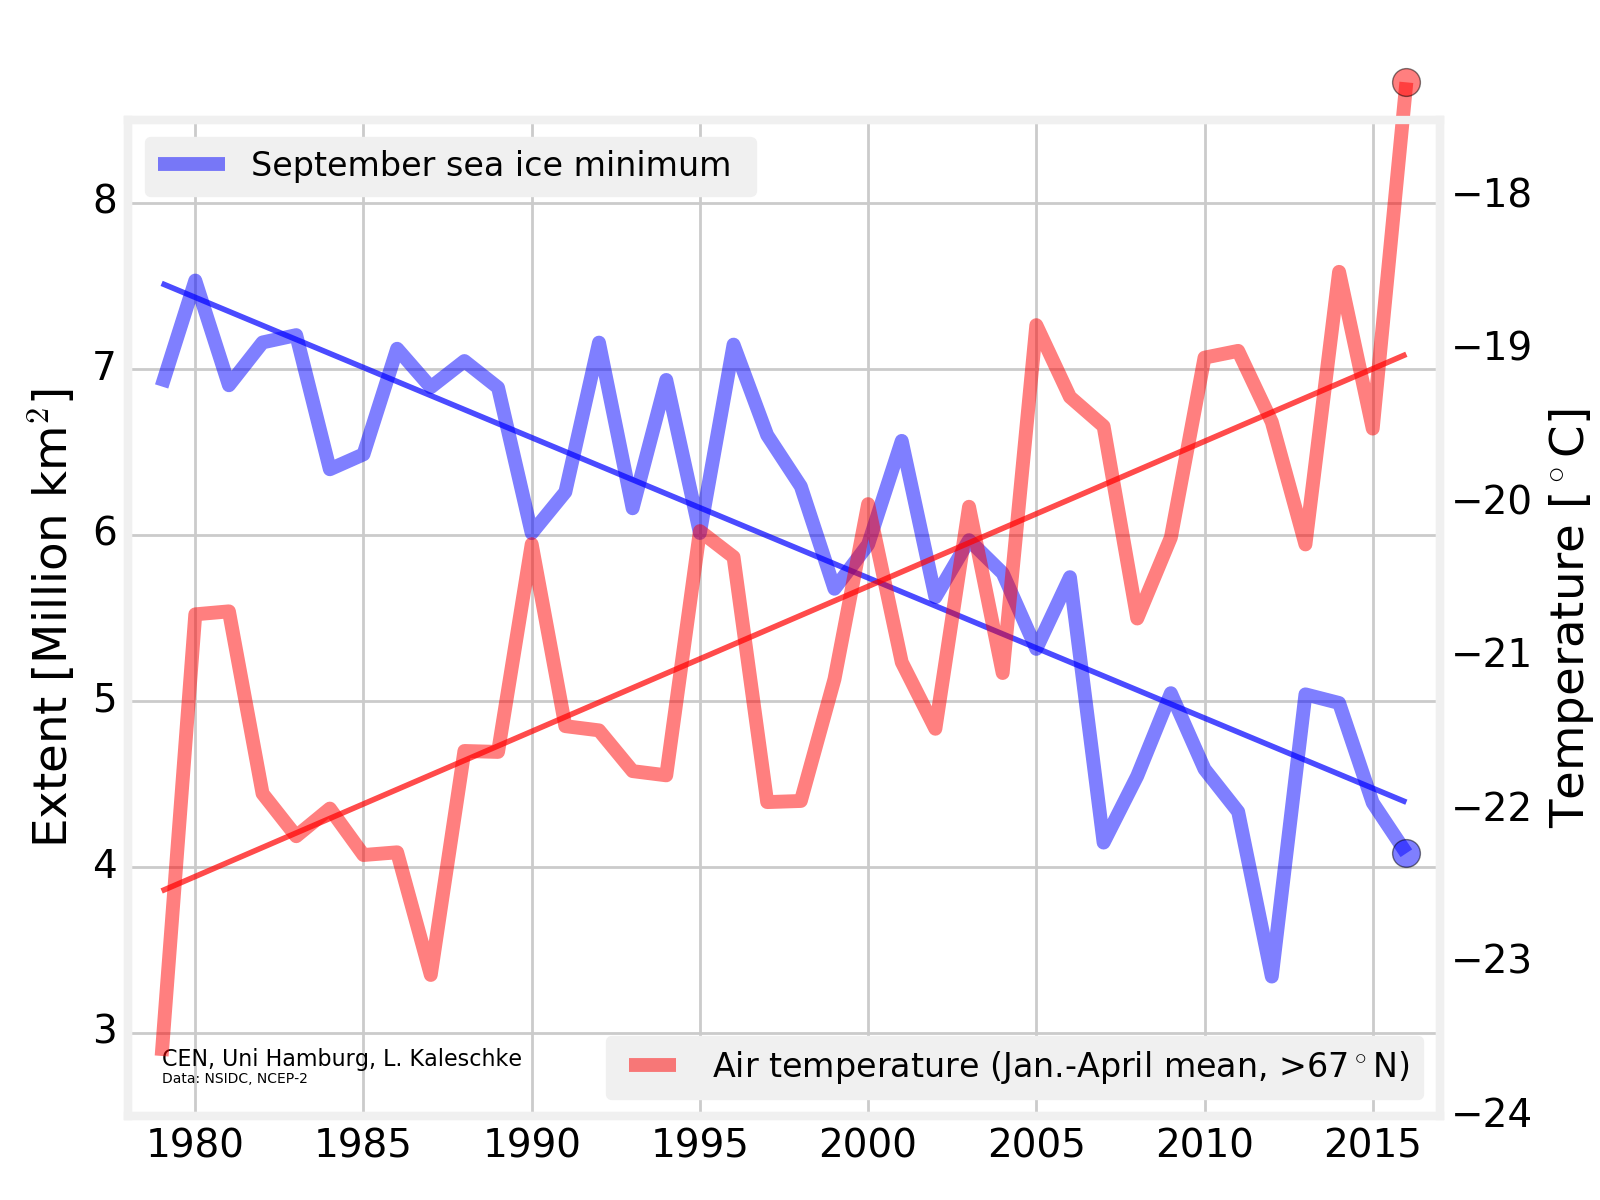
With the minimum now beyond doubt, here’s a new graphic from Lars Kaleschke of the University of Hamburg:
Need I say more?
[Edit – September 20th]
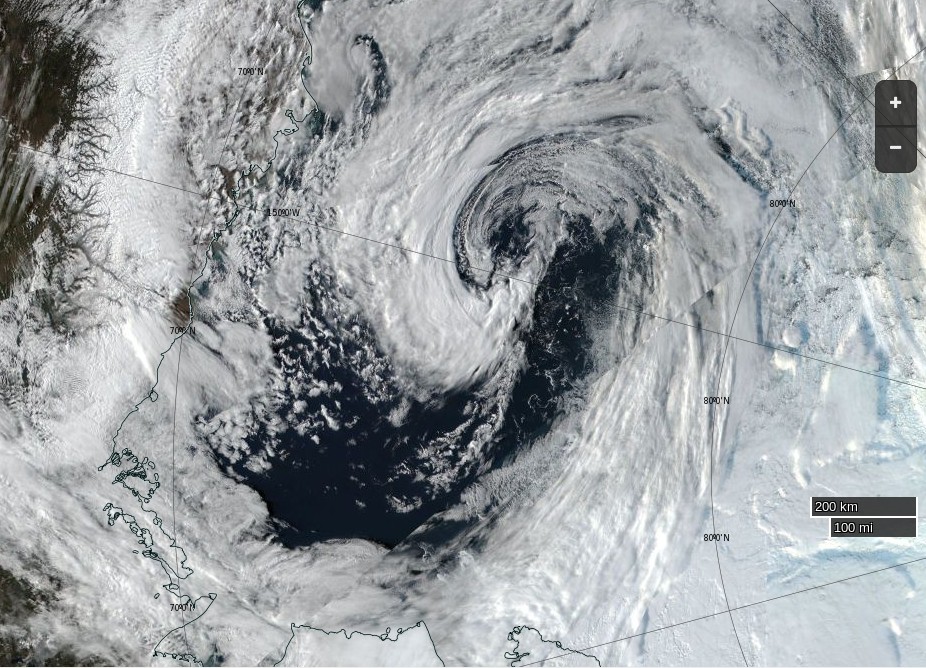
The September cyclone has now done its worst:
NASA Worldview “true-color” image of the Beaufort Sea on September 18th 2016, derived from the VIIRS sensor on the Suomi satellite
Leaving the area and extent metrics with an intriguing “double dip”:
2016 Minimum Milestones
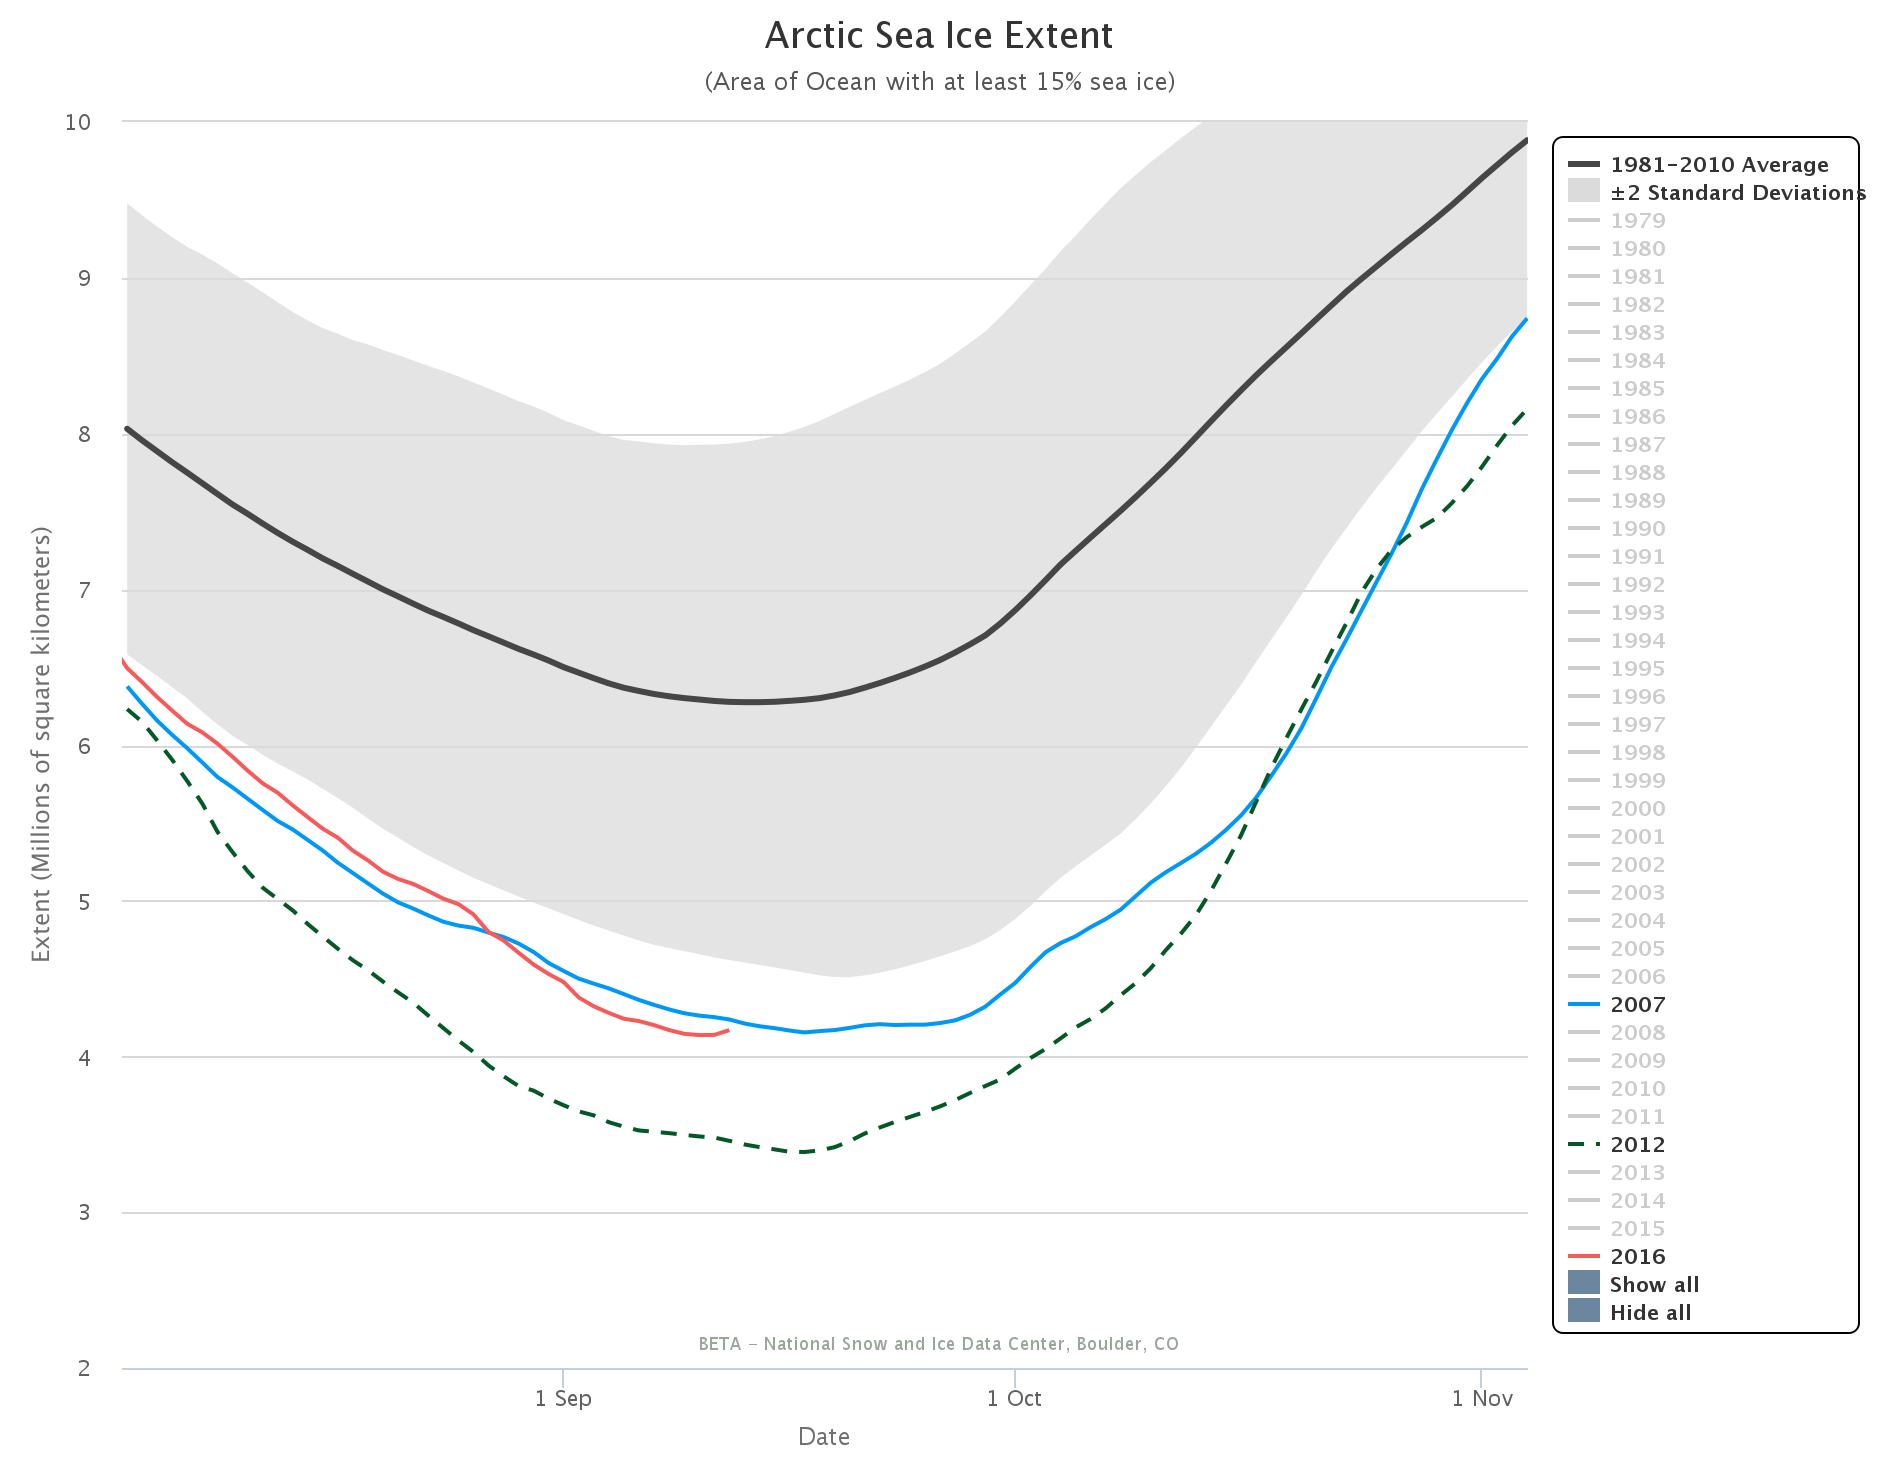
September 3rd – JAXA extent dropped to 2nd place below the 2007 minimum at 4.05 million km²
September 7th – JAXA extent minimum of 4.02 million km²
September 8th – NSIDC single day extent dropped to 2nd place below the 2007 minimum at 4.083 million km². This proved to the minimum value for the year as a whole.
September 9th – NSIDC 5 day trailing averaged extent dropped to 2nd place below the 2007 minimum at 4.146 million km²
September 10th – NSIDC 5 day trailing averaged extent minimum of 4.137 million km²
You will note that we were not the only ones to swiftly conclude that Judy’s assertion was lacking both veracity and verisimilitude! Then this morning came our old friends at the Global Warming Policy Forum with:
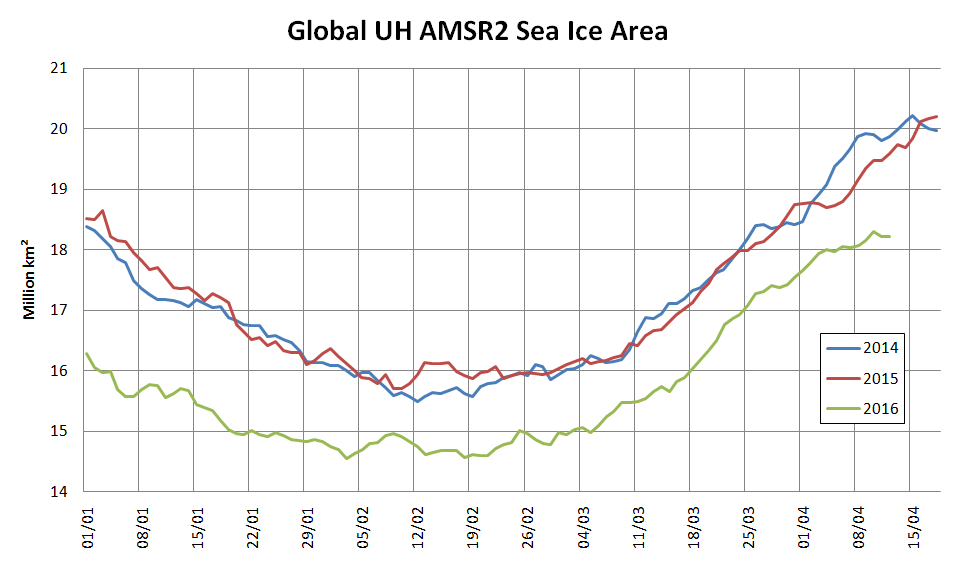
You will note that the GWPF adorned their “Tweet” with a graph purporting to show “Global sea ice anomalies”. We can only assume that Benny Peiser hadn’t read this April 11th article of ours, which pointed out that:
NSIDC has suspended daily sea ice extent updates until further notice, due to issues with the satellite data used to produce these images. The problem was initially seen in data for April 5 and all data since then are unreliable, so we have chosen to remove all of April from NSIDC’s archive.
To remedy that (no doubt?) inadvertent oversight on Benny’s part here is a graph we prepared earlier of absolute global sea ice area using reliable data from the AMSR2 instrument on the Japan Aerospace eXploration Agency’s SHIZUKU satellite:
The GWPF were followed this afternoon by Anthony Watts with:
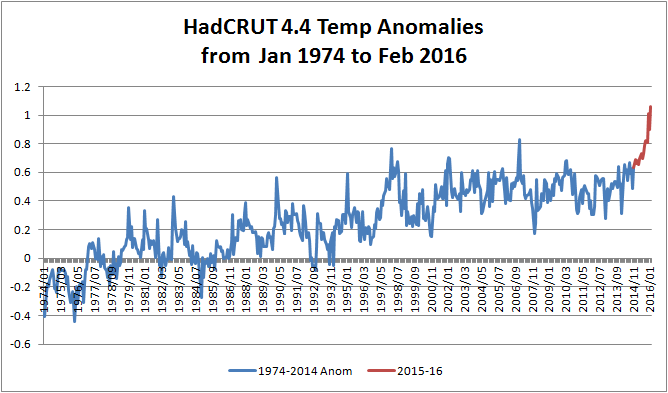
Both Prof. Curry and non Prof. Watts adorned their “Tweets” with a graph allegedly comparing “global temperature” with “tropical temperature”, but provided no graph of “polar temperature”. To remedy that (no doubt?) inadvertent oversight here is one we prepared earlier:
All members of this team of synchronised “Tweeters” provided links to an April 11th article by a certain Paul Dorian entitled, believe it or not:
In an interesting twist, the recent analysis found that the global ice area remained stable throughout the 1980s and the 1990s, while temperatures climbed suggesting “the global sea ice area is not particularly a function of the global average surface temperature.” [Source: Willis Eschenbach/”Watts Up With That” web site]
We can only assume that Paul Dorian hadn’t read this April 10th article of ours, which pointed out amongst other things that:
One feels compelled to ask why Willis’s global average temperature graph neglects to mention 2015 when he implies that it does?
Here’s an up to date version of one of those that Bill The Frog prepared for us earlier:
We must further assume that Paul hadn’t read this April 11th article by Mr. Watts either. It stated that:
A few years ago in 2009, I was the first to notice and write about a failure of the instrumentation for one of the satellites used by the National Snow and Ice Data Center (NSIDC) to show Arctic Sea Ice extent. Today, we have what appears to be a similar problem with satellite sea ice measurement.
It seems that Paul Dorian has finally read at least one out of all these informative articles, because the latest revision of his own piece of imaginative fiction now starts:
The source of global sea ice information cited in this posting was NOAA’s National Snow and Ice Data Center (NSIDC). They are now reporting issues with the satellite data used to produce these images and this information was not known at the time of the writing of this article.
Do you suppose we can now expect a similarly “fulsome apology” from the other players in this tragi-comic farce, together with all their rebloggers, retweeters, plagiarisers and other assorted acolytes?
No sooner has one of the usual suspects claimed that “Arctic Sea Ice Holds Firm” than a few more jump on the same bandwagon. The Global Warming Policy Forum have republished almost the whole of an article penned by our old friend Paul Homewood entitled “More Of The Usual Hype About Arctic Ice“. According to Paul (and Benny):
Far from collapsing, Arctic sea ice area has been remarkably stable in the last decade
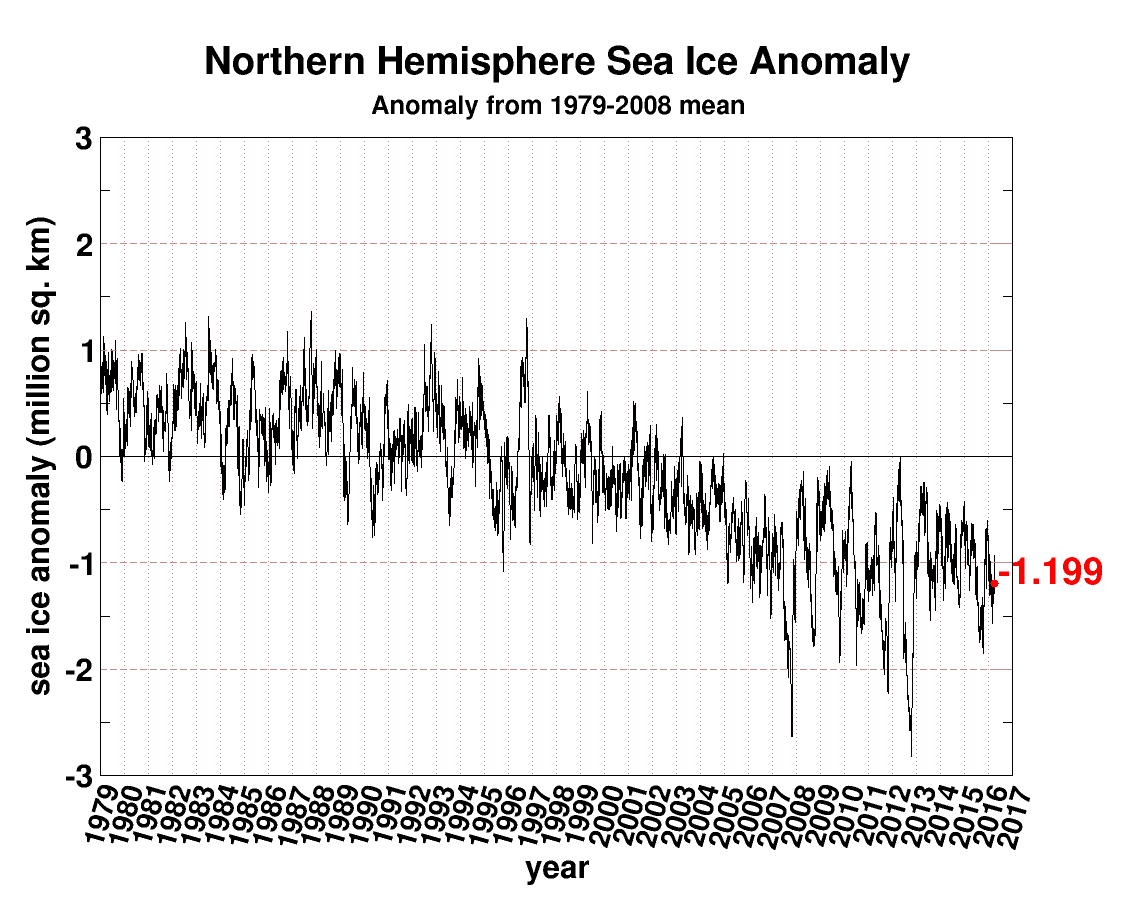
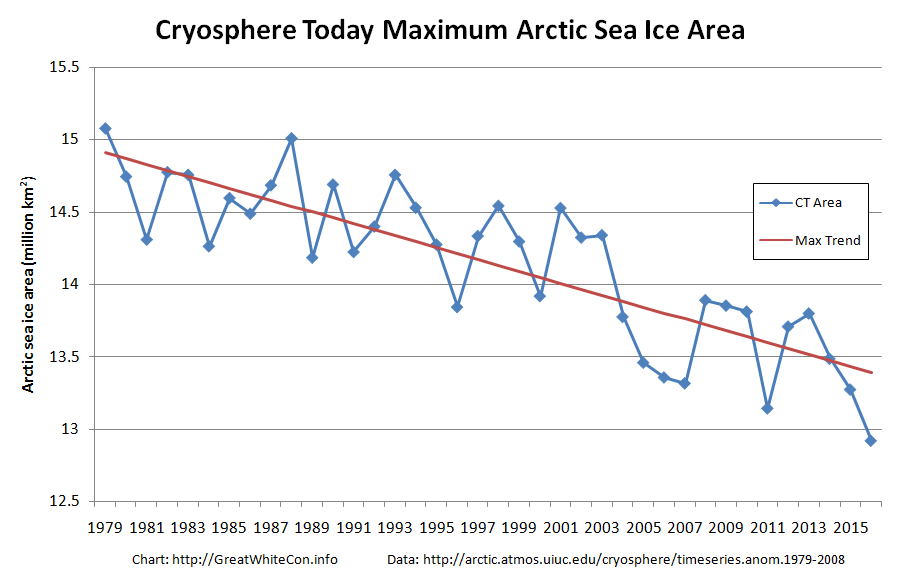
He illustrates his point using a slightly different version of the Cryosphere Today Arctic sea ice area anomaly graph employed by Andrew Montford on March 29th. Here’s the latest version:
For some strange reason Paul (and Benny) neglect to mention that the current anomaly of -1.199 million square kilometers is the most negative it has ever been for the day of the year in the entirety of the Cryosphere Today record going back to 1979. They also neglect to mention that the CT anomaly is typically much larger in summer than in winter, and that despite that fact the CT anomaly never fell as low as -1.199 at any time of year until 2006.
Make sure to follow the first link above for much more on anomalously misleading area graphs. However Paul (and Benny) are not content with just one misleading interpretation of an anomaly graph. The article continues:
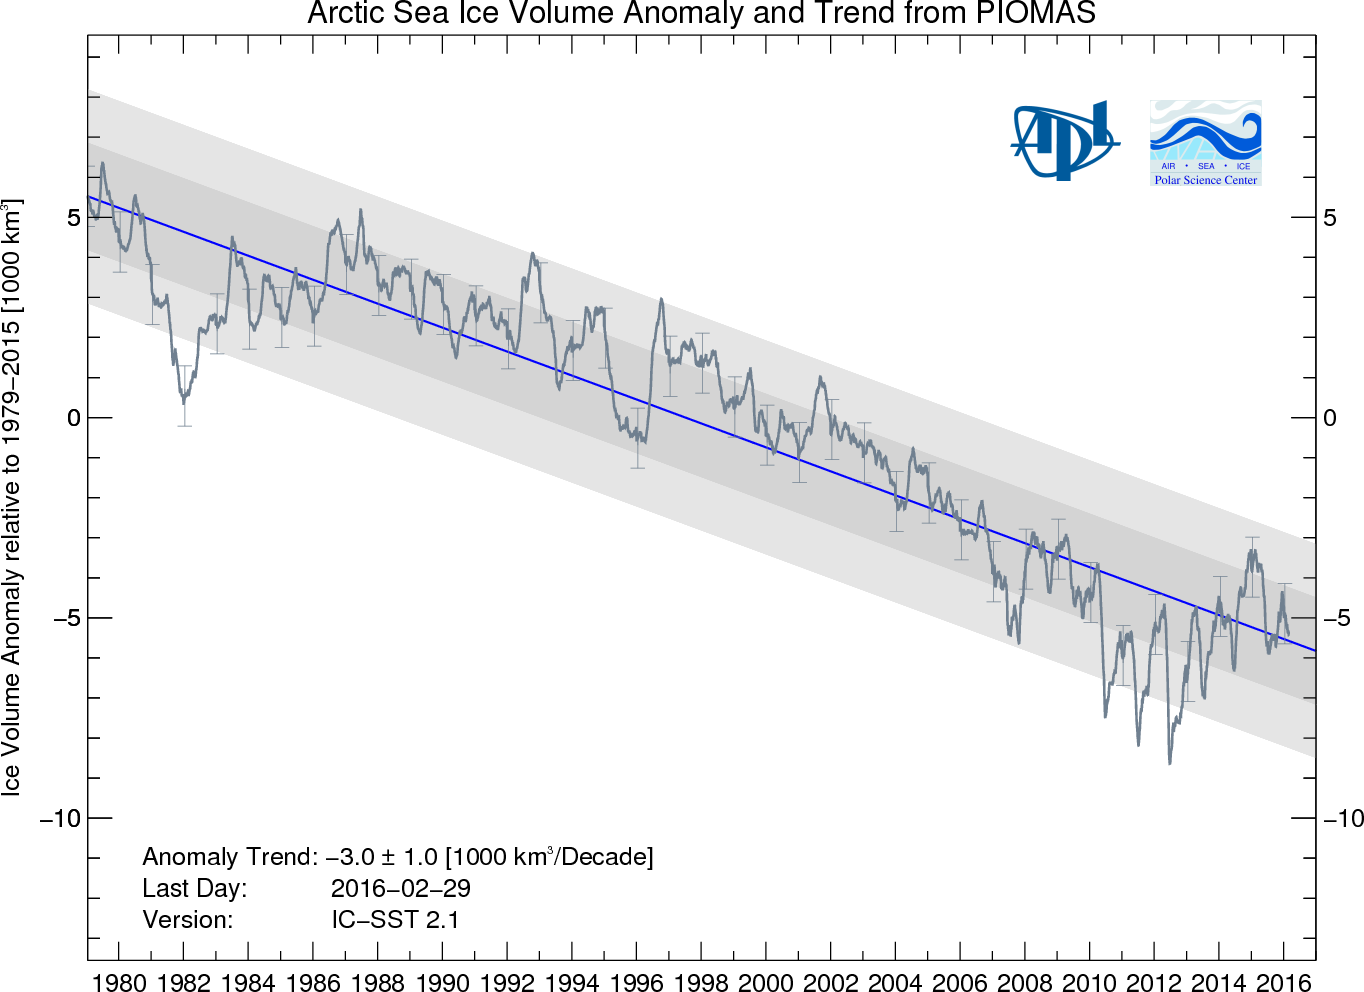
With multi year ice continuing to recover from 2008 lows, ice volume has also been growing in the last few years.
Volume is the second lowest on record [for February] since 1978 at 20.660 thousand km cubed
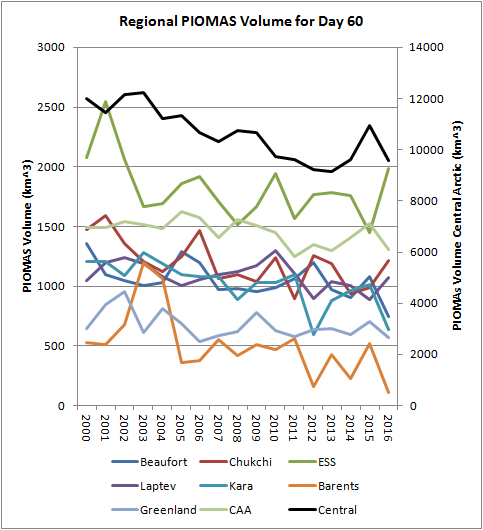
In the Central Arctic, where it matters most, sea ice volume at the end of February was only a whisker above where it was in 2012, according to PIOMAS at least. For those with short memories the CT Arctic sea ice area metric reached an *all time low of 2.23401 million square kilometers on September 13th 2012, and an *all time low anomaly of -2.81817 million square kilometers on October 14th 2012.
Today’s Arctic sea ice claim comes from the Bishop Hill blog of Andrew Montford, which recently stated that:
This morning’s story appears to be the hoary old “Arctic sea ice in freefall” one.
“The Arctic is in crisis. Year by year, it’s slipping into a new state, and it’s hard to see how that won’t have an effect on weather throughout the Northern Hemisphere,” said Ted Scambos, lead scientist at the Colorado-based NSIDC.”
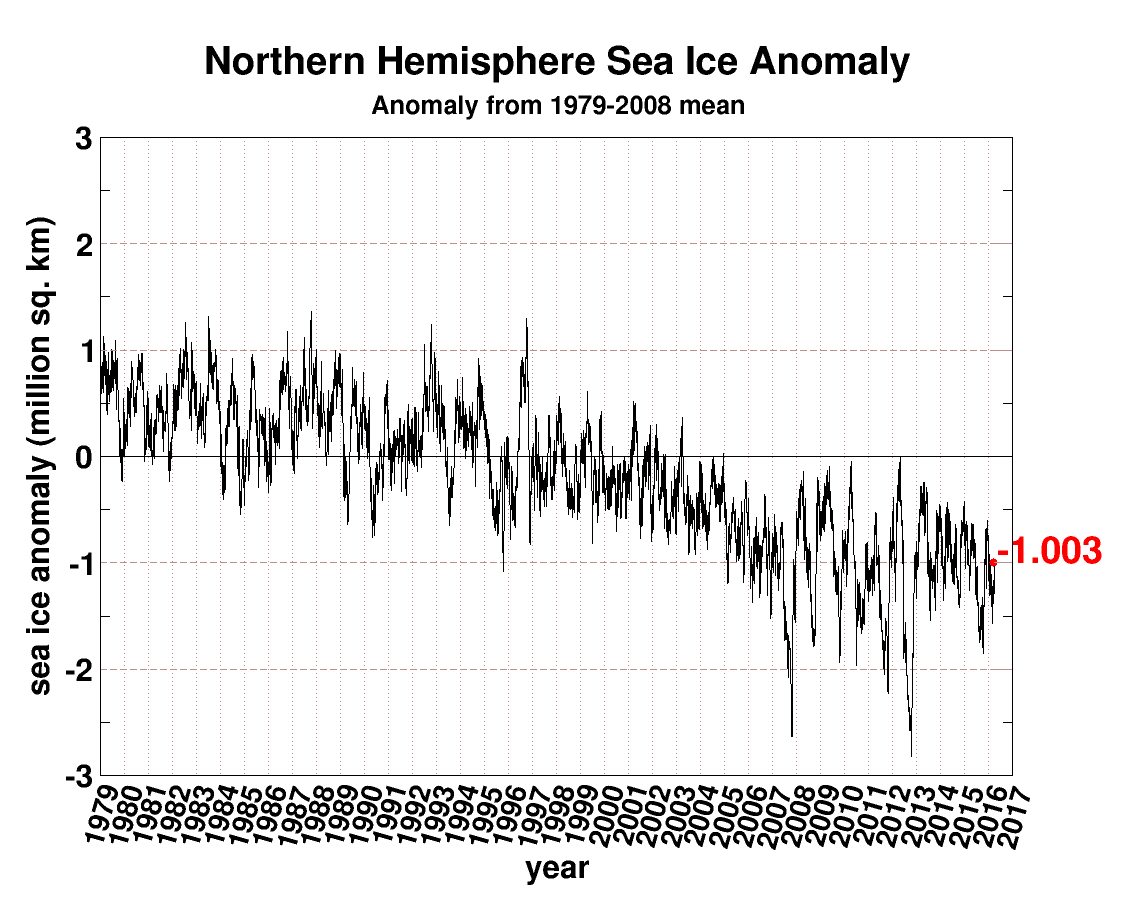
As usual on these occasions, I take a quick look at the Cryosphere Today anomaly page, where I find the sea ice apparently still stuck firmly in “pause” mode.
Having inadvertently wended my way onto The Bishop’s Hill via the northerly extension to Eli’s Rabett Warren I felt compelled, as usual, to quibble with Andrew’s “apparently firmly in ‘pause’ mode” claim. Since graphs in comments are not available over on The Hill, or The Rabett Run for that matter, let’s take a look at some graphic representations of the available data over here instead. Commenter “Golf Charlie” asks at The Bishop’s:
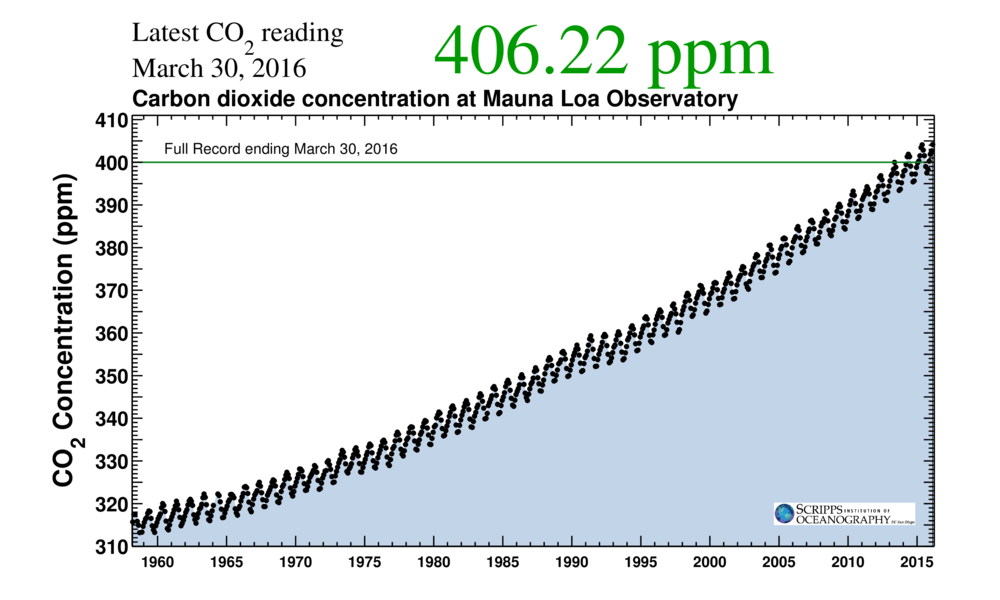
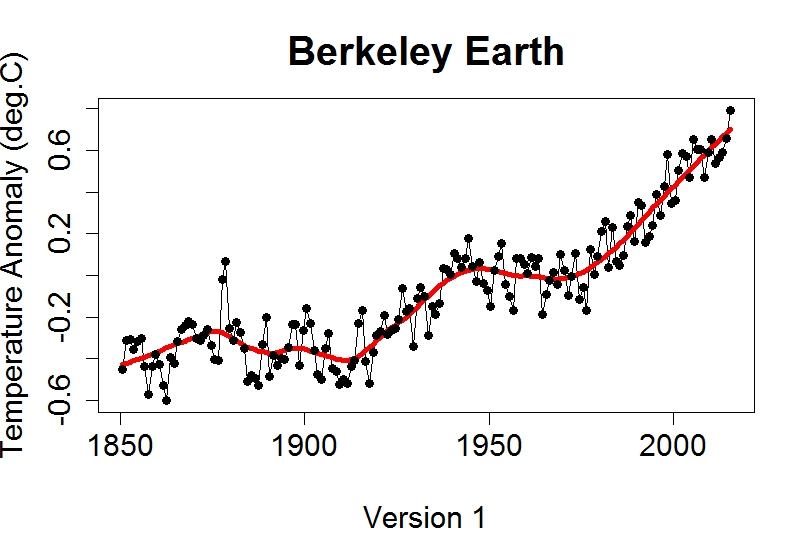
With CO₂ levels continuing to rise, why hasn’t temperature risen, and the ice disappeared as predicted?
Let’s see shall we? CO₂ levels are indeed continuing to rise:
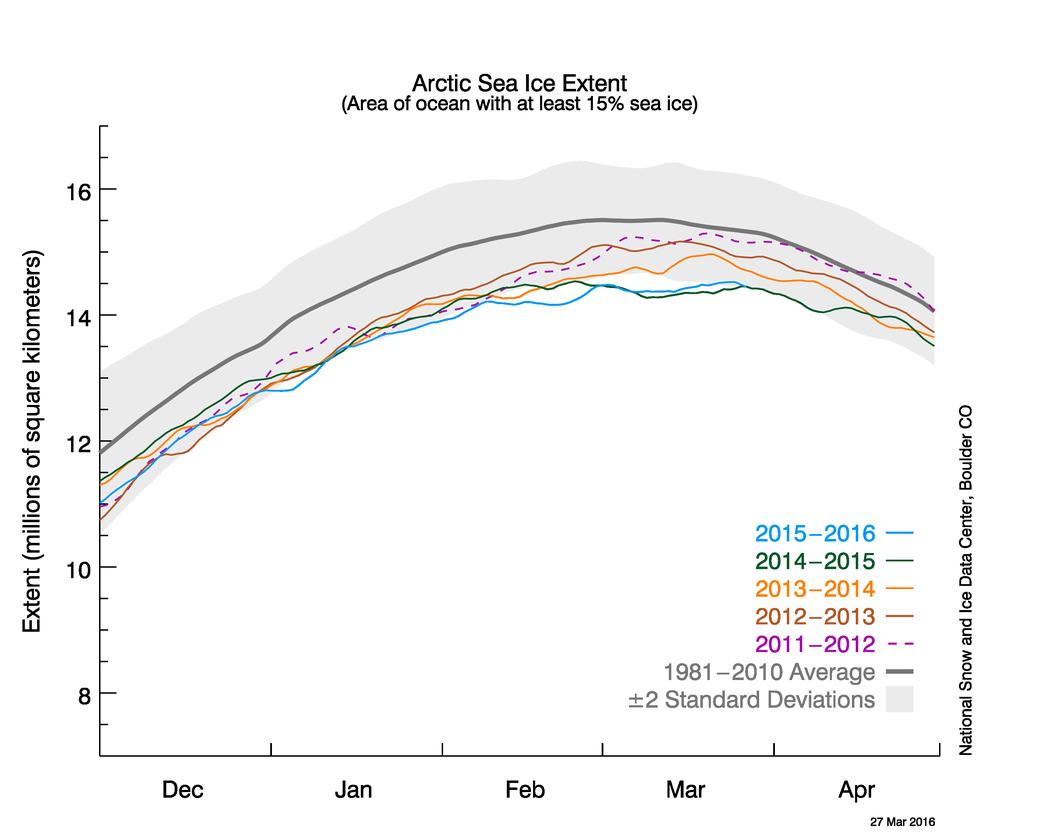
In the latest edition of their “Arctic Sea Ice News” the United States’ National Snow and Ice Data Center have announced that:
Arctic sea ice appears to have reached its annual maximum extent on March 24, and is now the lowest maximum in the satellite record, replacing last year’s record low. This year’s maximum extent occurred later than average. A late season surge in ice growth is still possible. NSIDC will post a detailed analysis of the 2015 to 2016 winter sea ice conditions in early April.
On March 24, 2016, Arctic sea ice likely reached its maximum extent for the year, at 14.52 million square kilometers (5.607 million square miles). This year’s maximum ice extent was the lowest in the satellite record, with below-average ice conditions everywhere except in the Labrador Sea, Baffin Bay, and Hudson Bay. The maximum extent is 1.12 million square kilometers (431,000 square miles) below the 1981 to 2010 average of 15.64 million square kilometers (6.04 million square miles) and 13,000 square kilometers (5,000 square miles) below the previous lowest maximum that occurred last year. This year’s maximum occurred twelve days later than the 1981 to 2010 average date of March 12. The date of the maximum has varied considerably over the years, occurring as early as February 24 in 1996 and as late as April 2 in 2010.
NASA’s Goddard Space Flight Center has also made a similar announcement, which includes this video:
The new record low follows record high temperatures in December, January and February around the globe and in the Arctic. The atmospheric warmth probably contributed to this lowest maximum extent, with air temperatures up to 10 degrees Fahrenheit above average at the edges of the ice pack where sea ice is thin, said Walt Meier, a sea ice scientist at NASA’s Goddard Space Flight Center in Greenbelt, Maryland.
The wind patterns in the Arctic during January and February were also unfavorable to ice growth because they brought warm air from the south and prevented expansion of the ice cover. But ultimately, what will likely play a bigger role in the future trend of Arctic maximum extents is warming ocean waters, Meier said.
“It is likely that we’re going to keep seeing smaller wintertime maximums in the future because in addition to a warmer atmosphere, the ocean has also warmed up. That warmer ocean will not let the ice edge expand as far south as it used to,” Meier said. “Although the maximum reach of the sea ice can vary a lot each year depending on winter weather conditions, we’re seeing a significant downward trend, and that’s ultimately related to the warming atmosphere and oceans.” Since 1979, that trend has led to a loss of 620,000 square miles of winter sea ice cover, an area more than twice the size of Texas.
This year’s record low sea ice maximum extent will not necessarily result in a subsequent record low summertime minimum extent, Meier said. Summer weather conditions have a larger impact than the extent of the winter maximum in the outcome of each year’s melt season; warm temperatures and summer storms make the ice melt fast, while if a summer is cool, the melt slows down.
Neither NASA or the NSIDC comment on one of the striking things about this winter’s NSIDC extent chart, which has effectively “plateaued” during March 2016 following an initial peak of 14.48 million square kilometers on March 2nd, which was only recently exceeded. This is also illustrated by the JAXA Arctic sea ice extent metric, for which the 2016 maximum was 13.96 million square kilometers on February 29th:
Now that the start of 2016 Arctic sea ice melting season has been called, albeit slightly hesitantly, by the experts at the NSIDC let’s also take a look at Cryosphere Today Arctic sea ice area:
The preliminary peak which we announced on March 16th has also recently been exceeded, but we now feel supremely confident in predicting that the 2016 CT area maximum will be less than 13 million square kilometers for the first time ever in the satellite record.
Thus begins what promises to be a very interesting 2016 Arctic sea ice melting season! As the NSIDC puts it:
There is little correlation between the maximum winter extent and the minimum summer extent—this low maximum does not ensure that this summer will see record low ice conditions. A key factor is the timing of widespread surface melting in the high Arctic. An earlier melt onset is important to the amount of energy absorbed by the ice cover during the summer. If surface melting starts earlier than average, the snow darkens and exposes the ice below earlier, which in turn increases the solar heat input, allowing more ice to melt. With the likelihood that much of the Arctic cover is somewhat thinner due to the warm winter, early surface melting would favor reduced summer ice cover.
We’ve recently been speculating about the effect on the sea ice in the Arctic of varying amounts of weather borne heat, wind and waves. The cumulative effect of all the assorted storms is that today a variety of sea ice metrics are all at their lowest ever level for the date, since their respective records began.
The JAXA/ADS extent was the first to fall below all previous years, and here’s how it looks today:
Note that it shows extent currently decreasing. Next came the Cryosphere Today area, which has also just decreased from the day before:
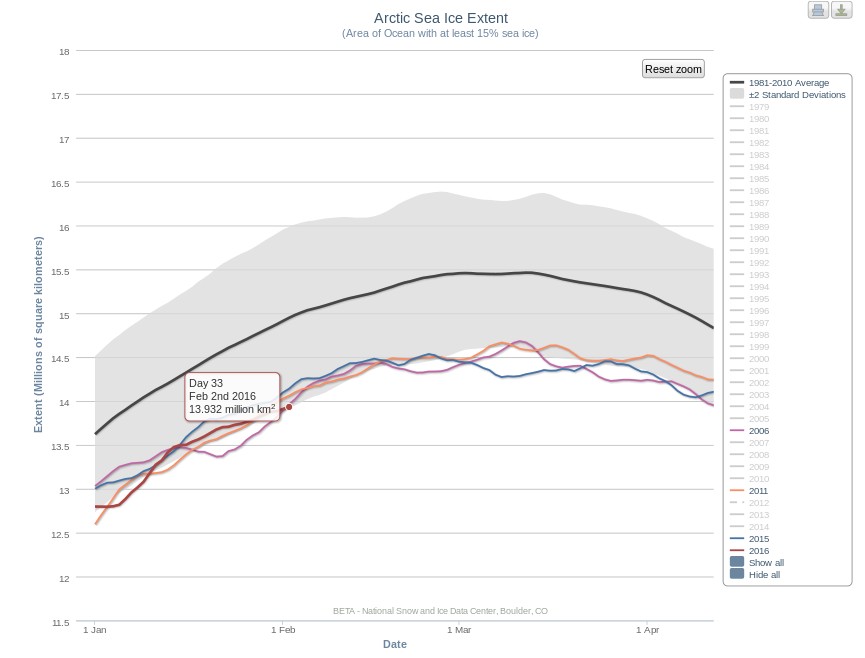
The latest metric to join the club is the 5 day averaged version of the NSIDC Arctic sea ice extent, which currently reveals:
Would any brave reader care to hazard a guess where and when the assorted Arctic sea ice metrics will eventually reach their maximum values for 2016?
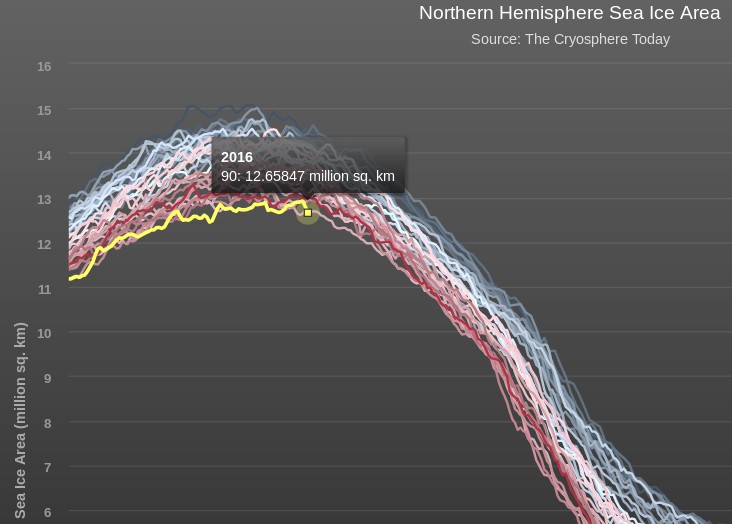
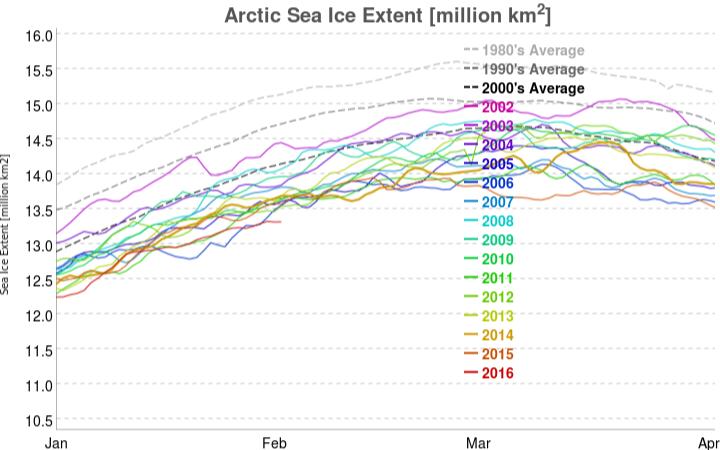
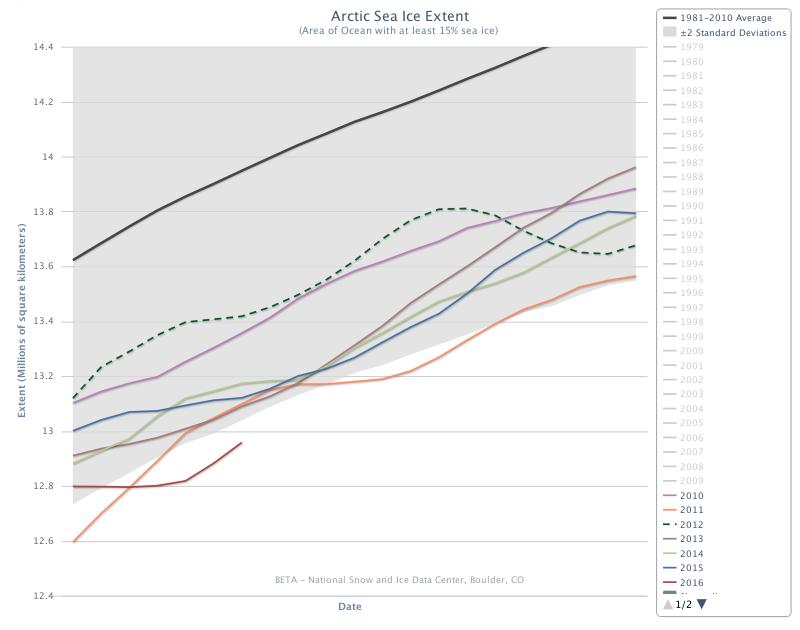
On January 1st 2016 the 15% concentration threshold daily Arctic sea ice extent metric reported by the United States National Snow and Ice Data Centre reached the lowest ever level for the first day of any year since their satellite derived records began in 1979. A couple of days later the more familiar 5 day trailing averaged extent also reached the lowest ever level for the date:
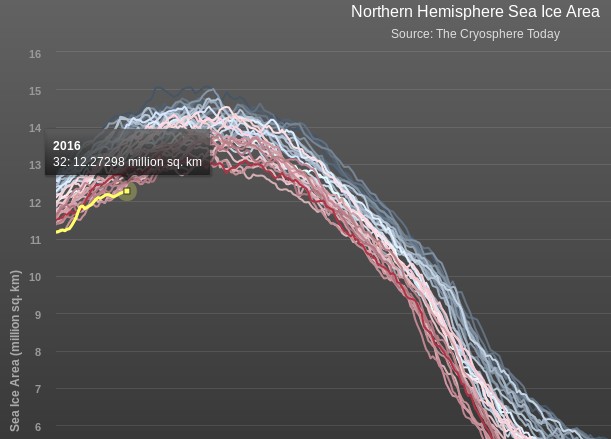
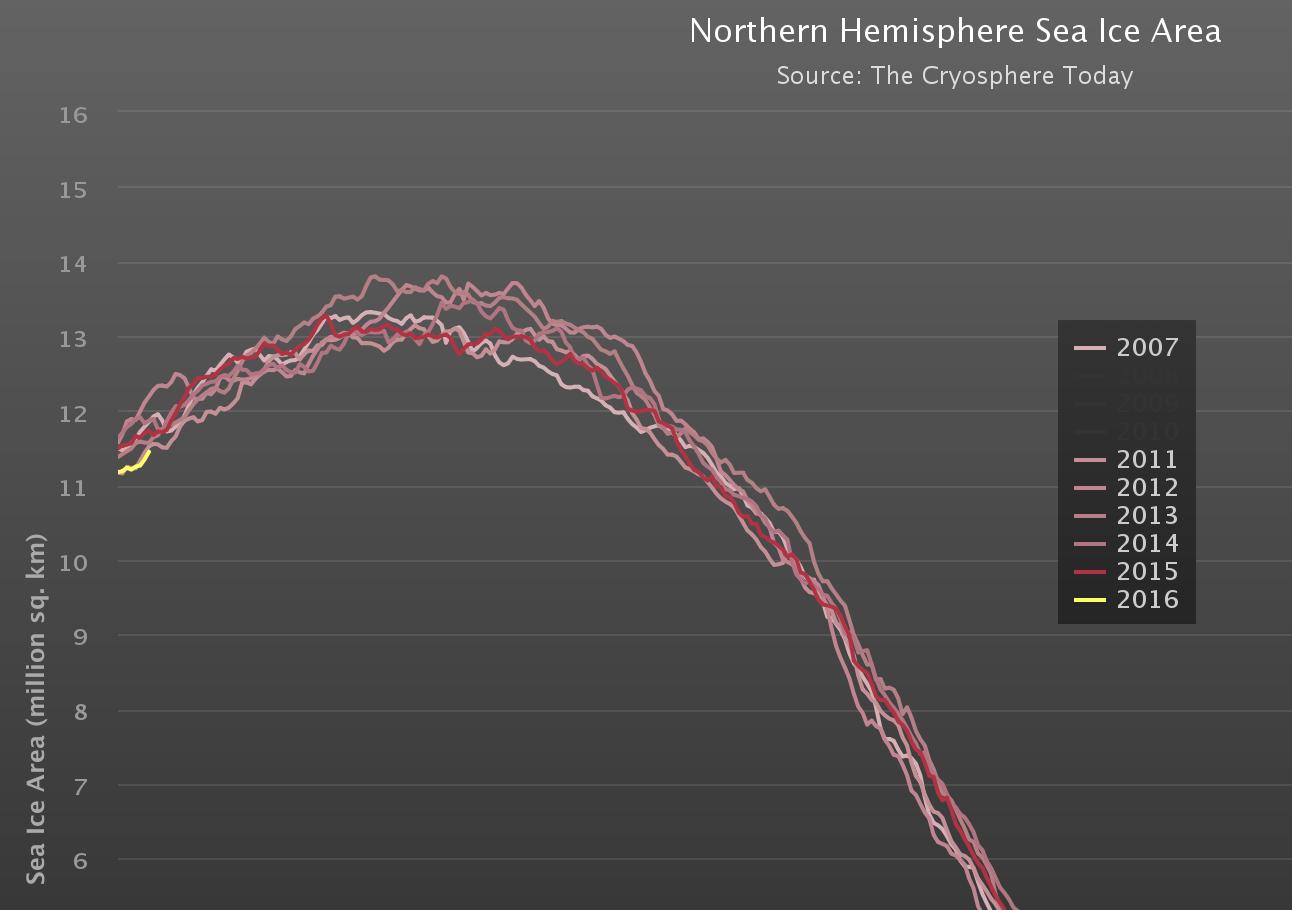
Cryosphere Today have been somewhat sluggish about updating their records of Arctic sea ice area, but have at long last revealed that their metric is now also at the lowest ever level for the date:
Meanwhile Great White Con commenter “Just A Thought” states that:
I find it hard, with what I do have access to, to see why everyone is so worried that the Arctic is melting.
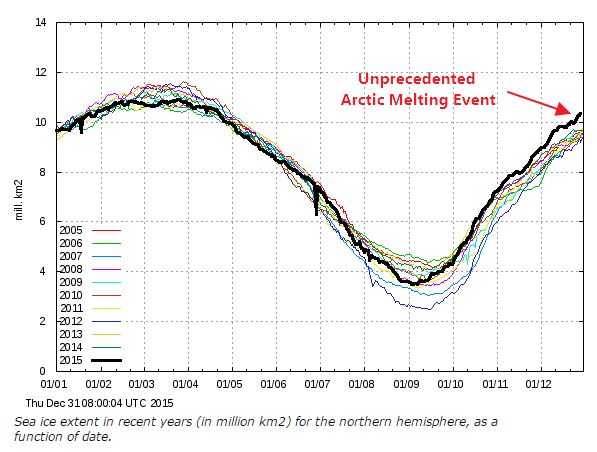
He or she has evidently only had access to the propaganda perpetrated by Tony Heller (AKA “Steve Goddard”) on his so called “Real Climate Science” blog. Mr. Heller’s latest Arctic pronouncement on December 31st 2015 is entitled “Arctic Meltdown Update” and claims that:
Experts say that a terrifying storm melted the North Pole yesterday. This unprecedented melting event has caused Arctic ice to reach its highest December extent in over a decade.
justifying that comment with the following graph of his beloved (albeit deprecated) 30% concentration threshold DMI extent metric:
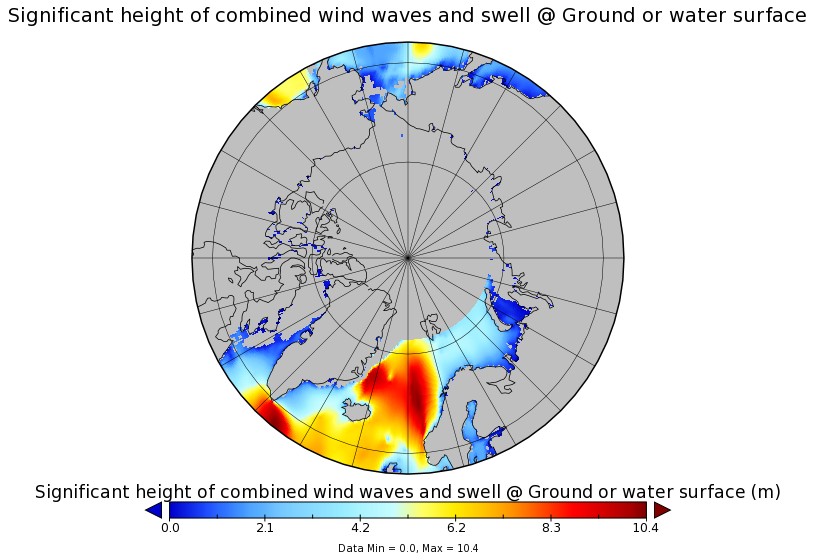
Here’s a video revealing the effect of the recent “terrifying storm” on the sea ice on the North Atlantic side of the Arctic:
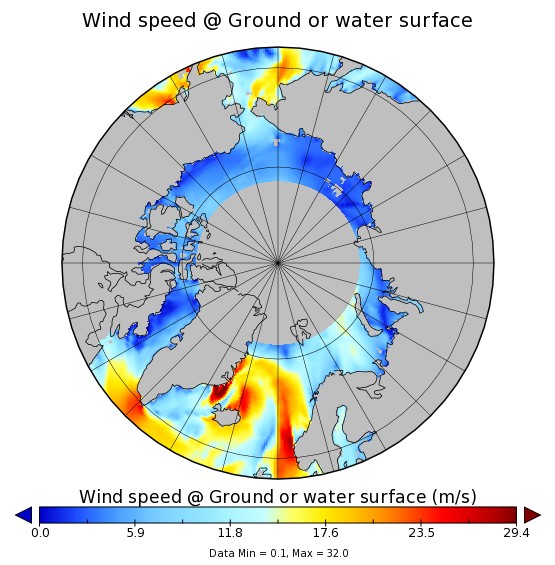
As you can see the ice at the North Pole didn’t melt away. However the ice edge did retreat in the immediate aftermath of what is referred to here in the United Kingdom as “Storm Frank“. Frank led to lots of flooding in the North of the nation, and also to some strong winds inside the Arctic Circle:
Those winds, travelling over a long stretch of open ocean, produced some pretty significant waves, speeding in the direction of the sea ice edge:
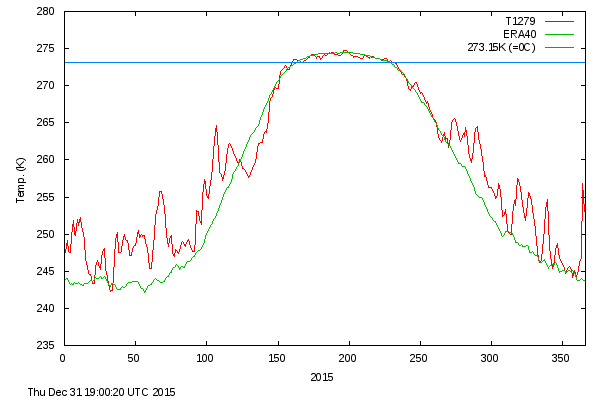
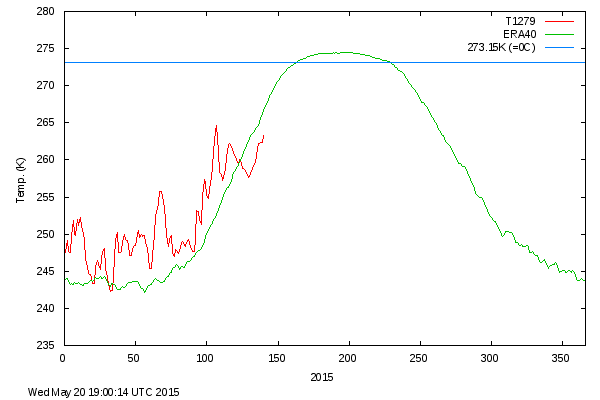
Meanwhile temperatures near the North Pole did briefly rise above the freezing point of sea ice in the middle of the Arctic winter. Here’s the Danish Meteorological Institute’s view of the air temperatures in the central Arctic:
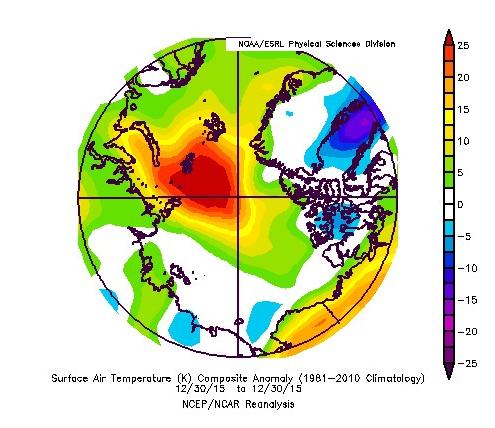
and here is NOAA’s temperature anomaly reanalysis for December 30th 2015:
Personally I reckon the 25 m/s winds and resulting 10 meter waves had more effect on the sea ice metrics than the 25 °C above normal air temperatures, but your mileage may of course vary, especially if your pseudonym is “Steve Goddard”!
There’s no rest for the wicked! Tony Heller, still better known as the pseudonymous “Steven Goddard”, is promulgating his erroneous Arctic sea ice narrative once again this morning. In an article entitled “Rommulans Never Learn” he has this to say:
From five years ago, the Arctic was doomed and I was a denier. And five years later, the ice is still almost exactly the same as twenty years ago.
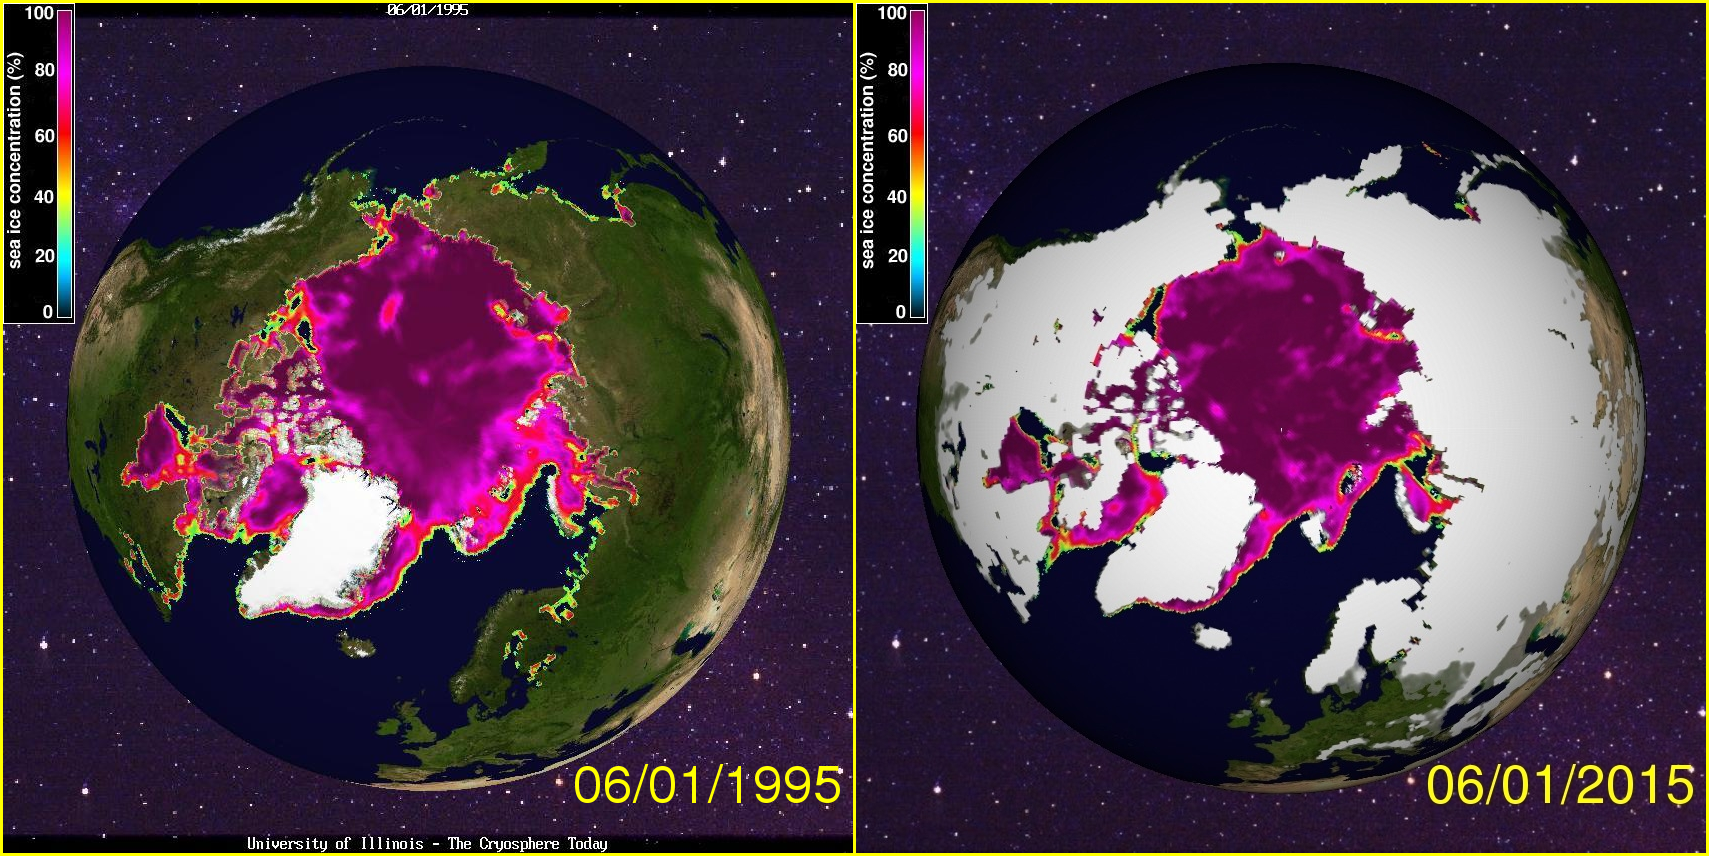
and he then presents this Cryosphere Today image comparing Arctic sea ice concentration on June 1st 2015 with the same date in 1995:
and comments:
Someone with an IQ over 30 might be able to figure it out, but not climate alarmists.
Obviously Steve/Tony hasn’t received our message yet, so we repeated it yet again:
At the risk of repeating myself repeating myself, the ice is NOT still almost exactly the same as twenty years ago:
“Can you see the dark blue areas in the 2015 image where there aren’t any in the 1995 image? Try looking at the Beaufort Sea, the Chukchi Sea, the Kara Sea and the North Water Polynya”
The shiny white area in the 2015 image is also of course a long way from the current reality.
For those with an IQ of 30 or less who would like to play “spot the difference” with us, here is a hastily prepared animation of a somewhat pixellated Chukchi Sea:
It is my duty to report what actually is happening, even if it isn’t what I expect.
I sure do wish Mr. Hunt would learn to do the same. Why on earth he would want to tell us ice was melting when it seemed obvious it was refreezing is beyond me. Does he have some deep need to humiliate himself, like a medieval person undergoing self-flagellation?
Of course I couldn’t take that lying down, so:
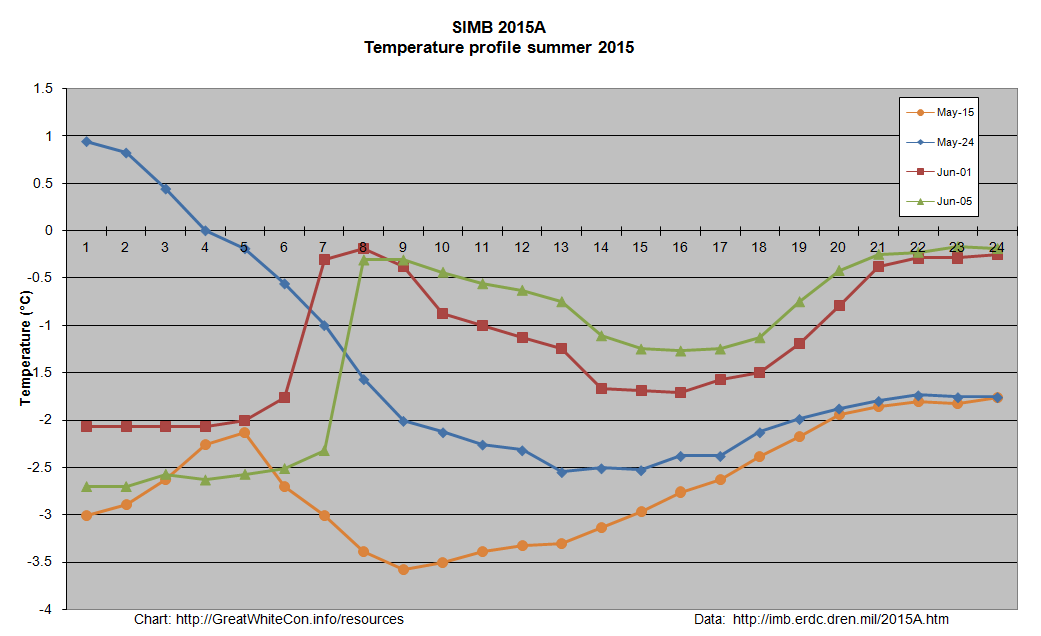
For your information, and that of anyone else who might be interested, the core temperature of the ice floe underneath 2015A got up to -1.34 °C yesterday:
Finally, for the moment at least, here’s an animated GIF of the North Water Polynya which I fear won’t impress Treesong very much:
[Edit 16:00 BST July 7th 2015]
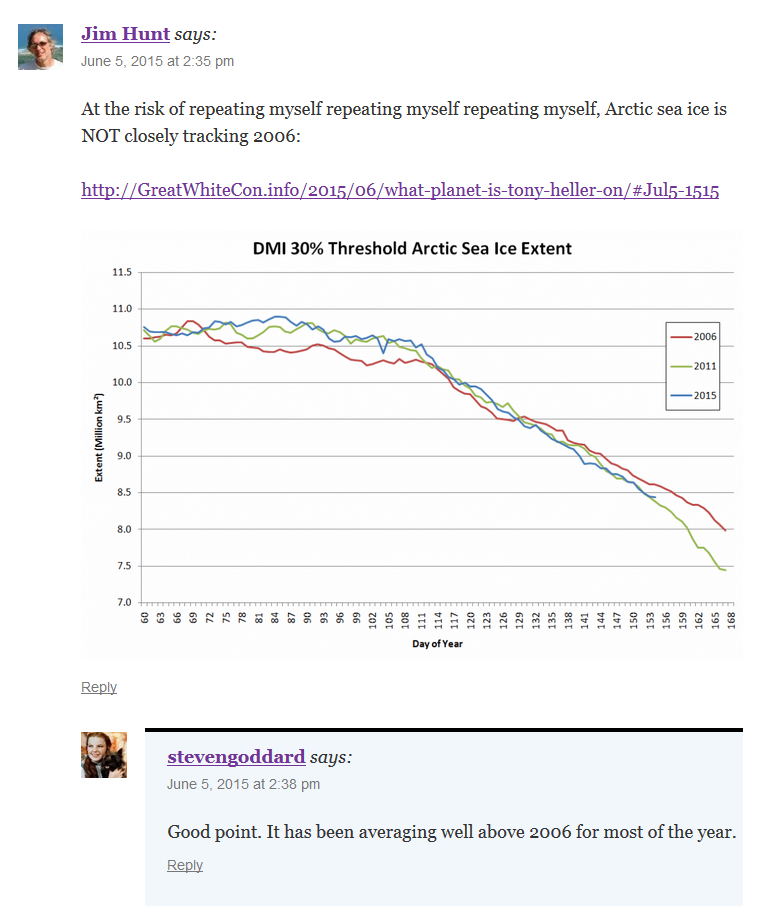
If you repeat something often enough does it eventually turn into the truth? Today’s Arctic article from Steve/Tony is strangely familiar. It is entitled “Arctic Sea Ice Continues To Track 2006“. However according to the NSIDC today:
[Edit 11:00 BST July 11th 2015]
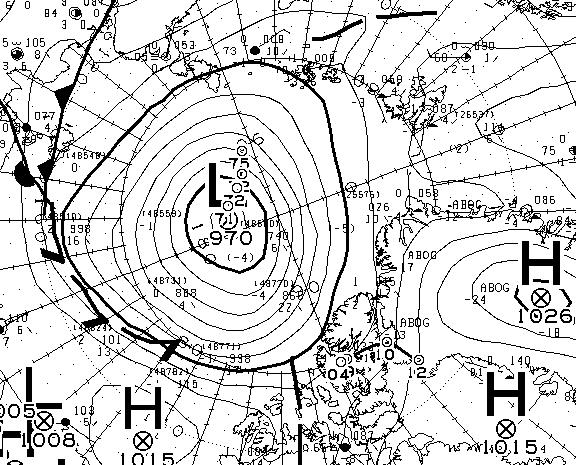
Steve/Tony keeps maintaining every day or two that “Arctic Sea Ice Continues To Track 2006”. There’s been a cyclone over the central Arctic with a minimum central pressure of 970 hPa (or mb if you prefer), which has caused some divergence of the sea ice:
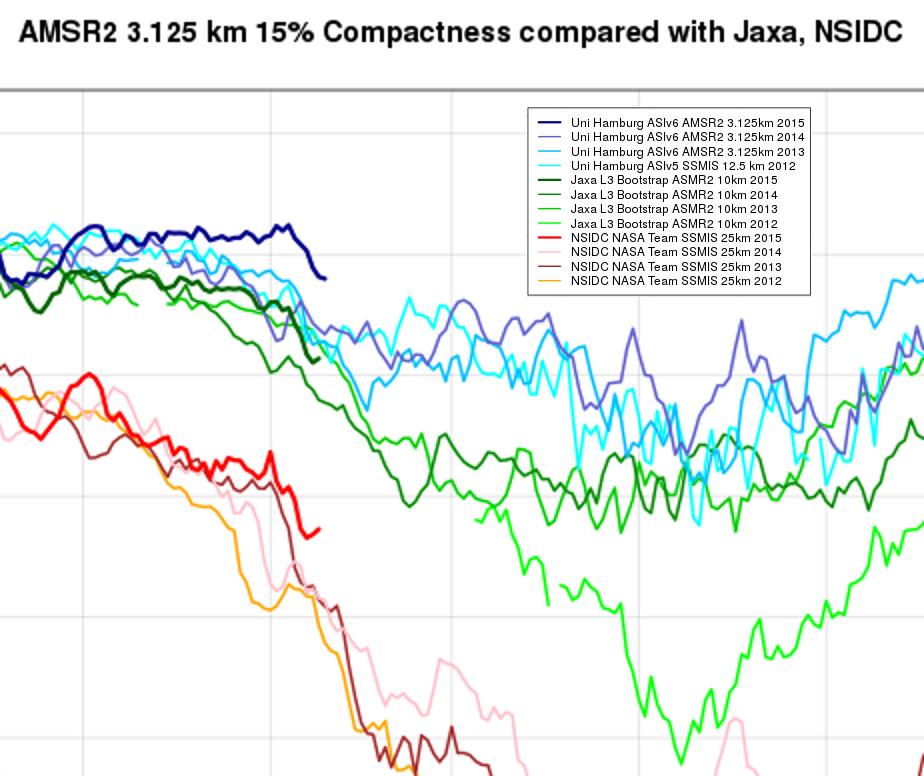
Here’s a closeup of the recent history of a variety of “compactness” metrics which illustrates that point:
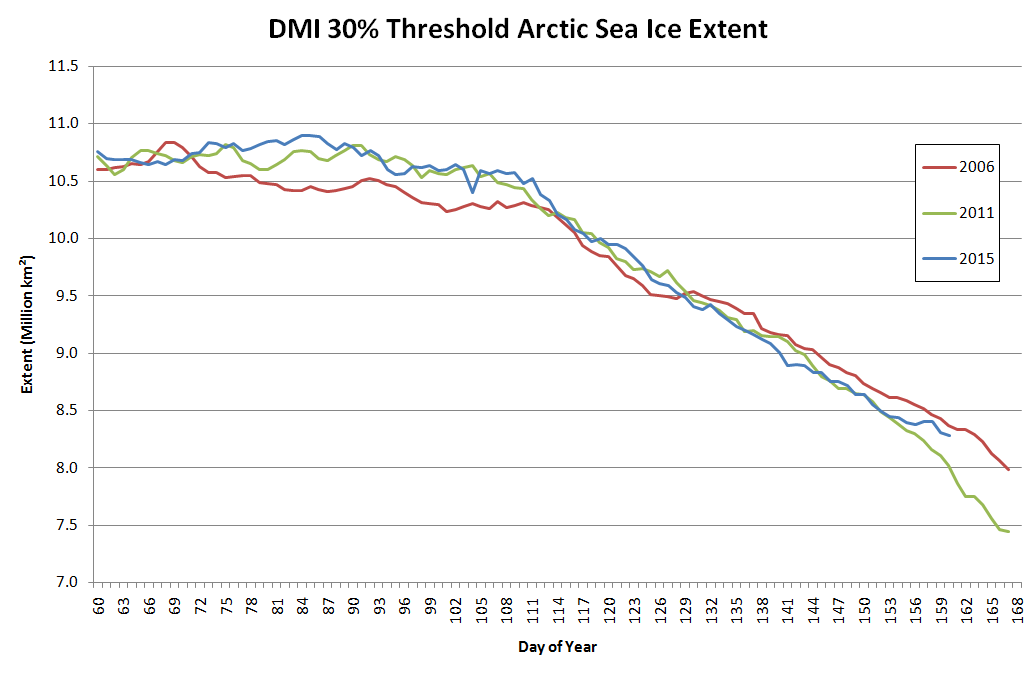
Across the board the sea ice in the Arctic is less compact than a few days ago as a result of the cyclone, but still more compact than on the same date in other recent years. Getting back to the extent metrics, here’s what the DMI 30% threshold version has been up to:
and here’s the NSIDC 5 day average of their 15% threshold flavoured variety:
Experts say that the Arctic is in a “death spiral” – but for the past two years it has been tracking 2005/2006 – the years with the two highest summer extents of the past decade.
For the past four years, summer melt season temperatures in the Arctic have been well below normal.
No matter how many times experts lie about it, the Arctic is not melting down.
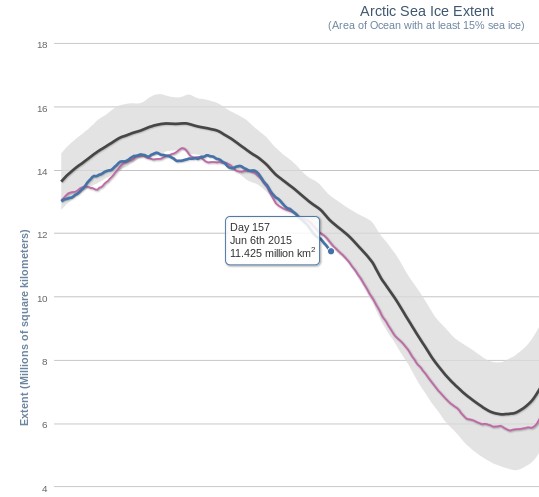
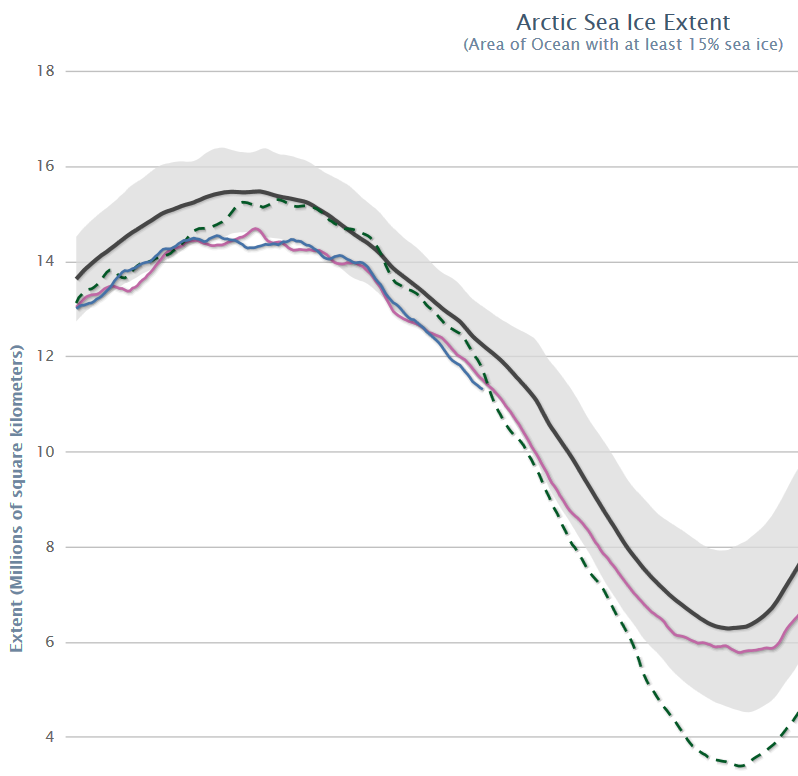
The Arctic, of course, has other ideas and continues to fail to conform to the narrative over at (un)Real Science. Today the NSIDC 5 day average extent Arctic sea ice extent is in actual fact at the lowest level for the time of year since their records began:
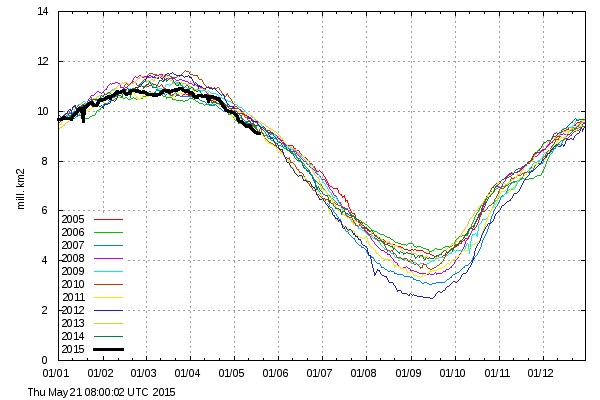
In view of “Steve”/Tony’s headline you may find it surprising that so is his much beloved DMI 30% threshold extent extent metric (displayed in full):
and so is the JAXA 15% extent extent:
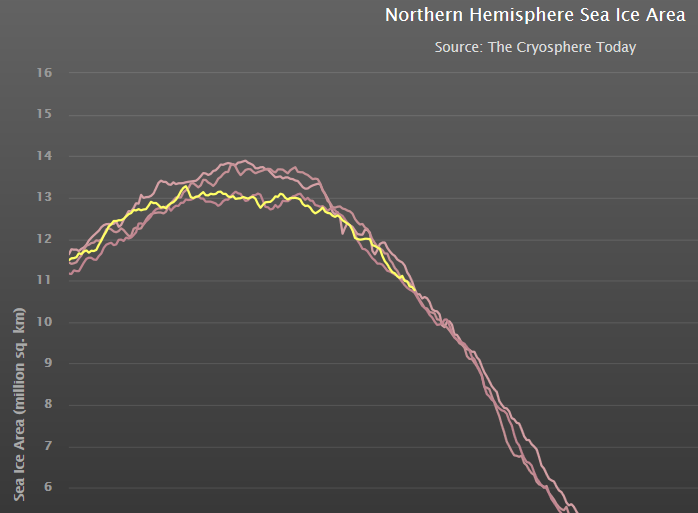
Holding out by the merest whisker (for the moment) is the Cryosphere Today area metric, which is nonetheless lower than on the same day in both 2005 and 2006:
Quod Erat Demonstrandum?
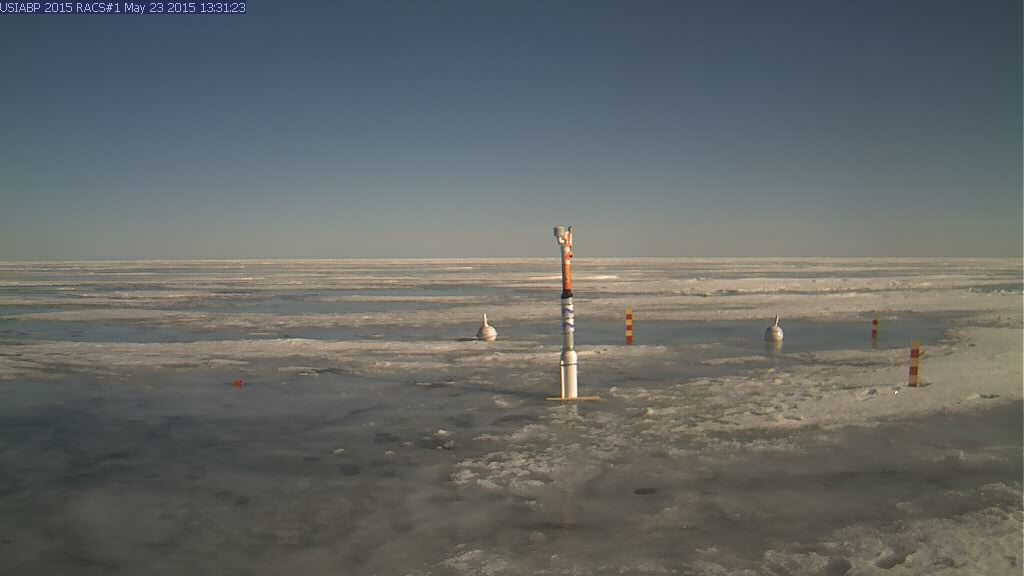
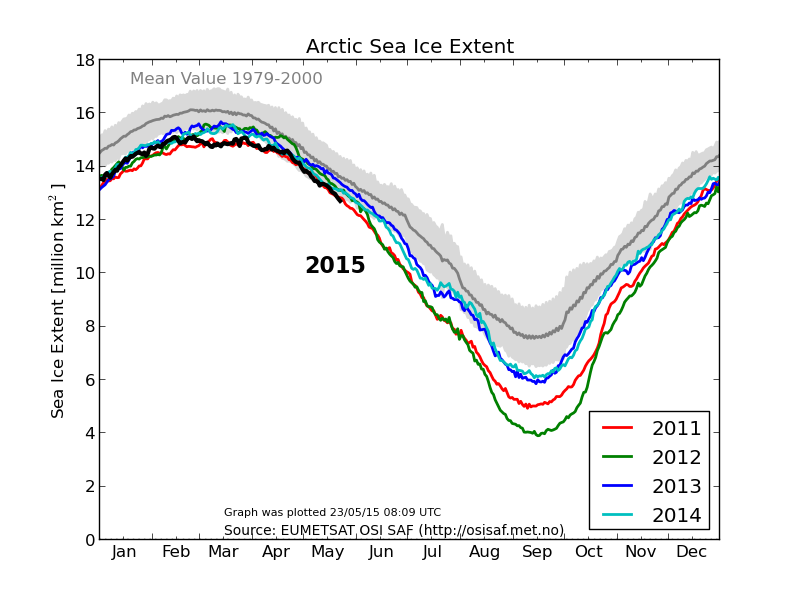
[Edit – May 23rd 2015]
After being used by a polar bear to inspect its feet, the webcam trained on ice mass balance buoy 2015A is now pointing in the right direction again. It reveals that the Arctic is in fact “melting down” even as “Steve”/Tony maintains that it isn’t:
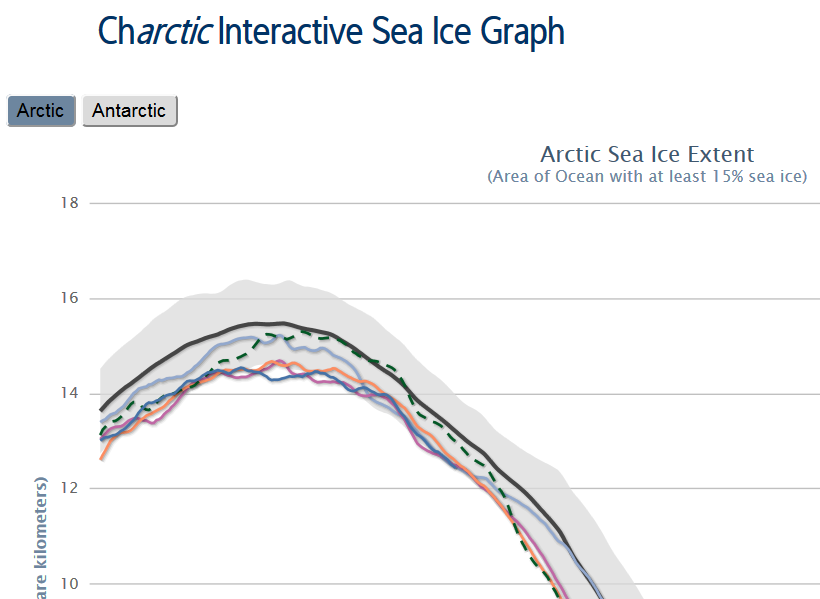
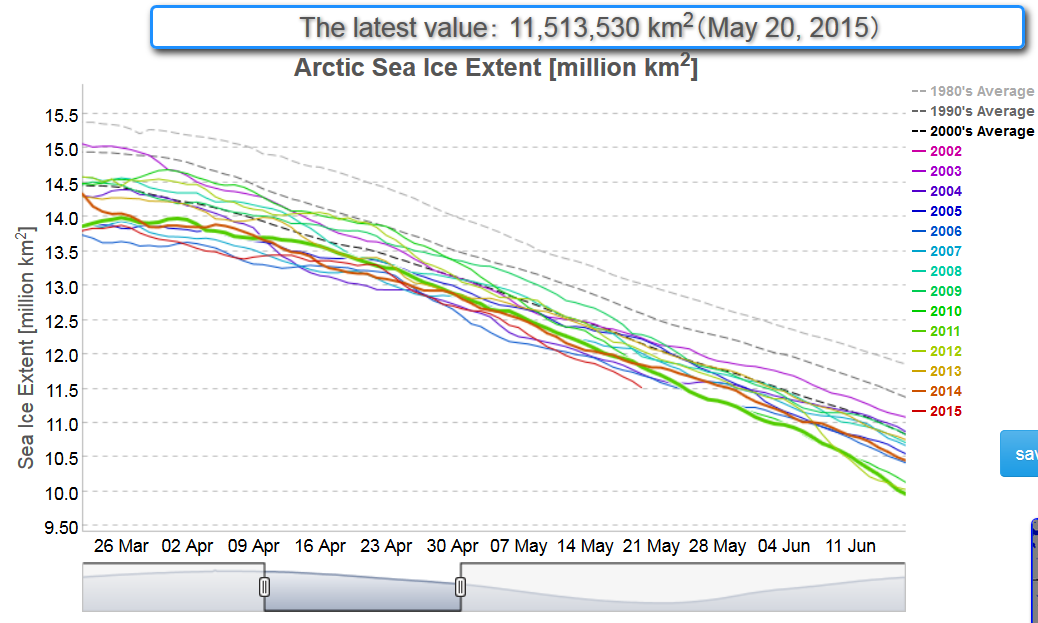
As if further proof were needed, the DMI 15% threshold extent graph extent is also now clearly lower than previous years at this time:
This website uses cookies to improve your experience. We'll assume you're ok with this, but you can opt-out if you wish. Cookie settingsACCEPT
Privacy & Cookies Policy
Privacy Overview
This website uses cookies to improve your experience while you navigate through the website. Out of these, the cookies that are categorized as necessary are stored on your browser as they are essential for the working of basic functionalities of the website. We also use third-party cookies that help us analyze and understand how you use this website. These cookies will be stored in your browser only with your consent. You also have the option to opt-out of these cookies. But opting out of some of these cookies may affect your browsing experience.
Necessary cookies are absolutely essential for the website to function properly. This category only includes cookies that ensures basic functionalities and security features of the website. These cookies do not store any personal information.
Any cookies that may not be particularly necessary for the website to function and is used specifically to collect user personal data via analytics, ads, other embedded contents are termed as non-necessary cookies. It is mandatory to procure user consent prior to running these cookies on your website.