Our title for today does of course refer to the inconvenient hiatus caused by the Gremlins currently stealing my comments from under the noses of Anthony Watts’ eagle eyed team of moderators before they can approve them as suitable for public view. Yesterday Mr. Watts published an article under the headline:
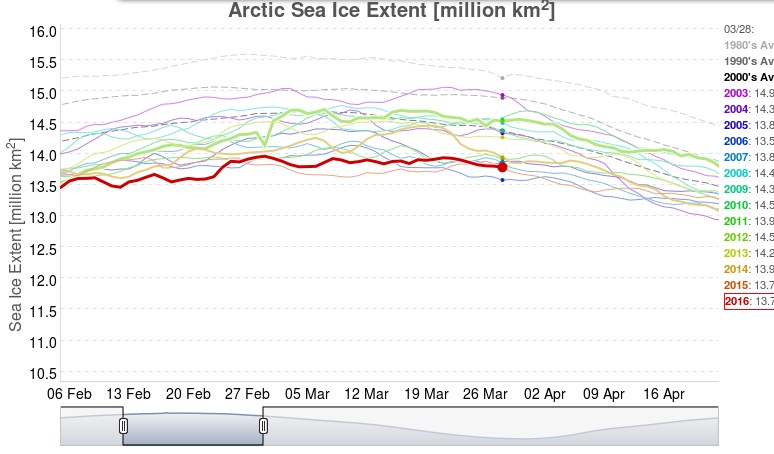
Since hitting its earliest minimum extent since 1997, Arctic sea ice has been expanding at a phenomenal rate. Already it is greater than at the same date in 2007, 2008, 2010, 2011, 2012 and 2015. Put another way, it is the fourth highest extent in the last ten years. Even more remarkably, ice growth since the start of the month is actually the greatest on record, since daily figures started to be kept in 1987.
As I wrote when looking at last year’s data the declining Arctic ice cover has been one of the most powerful images of climate change and that many who follow the debate don’t look too hard at the data. This results in superficial reporting that does not convey any of the complexities of the situation and as such is poor science communication.
With the data for 2016 now in it is time to look again at the claims of an “ice pause.”
In the spirit of improving science communication I commented as follows on Mr. Watts article, when seven previous comments were visible:
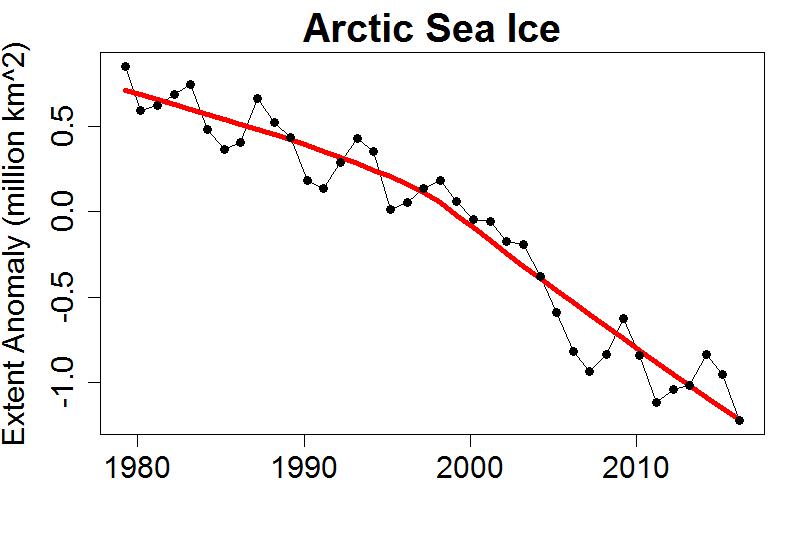
Annual average sea ice was all the rage last year:
You may well be wondering what a graph of annual average Arctic sea ice extent looks like? Take a look:
Discuss.
This morning (UTC) there are 197 comments visible under the WUWT article, but mine is not amongst them. Those Gremlins have a lot to answer for!
You may possibly think my comment was somewhat on the terse side? In part that’s because I’d just had a “debate” of sorts with one or more WUWT moderators who happily admitted to [snip]ping large parts of my side of the “conversation”. I certainly didn’t want to offend them by “taking pot shots” or engaging in “self promotion”. After all they had concluded their remarks by informing me that:
It is settled then …you are mendacious
The SIMPLEST solution is to stop attempting to post comments here. We are not required to carry them.
Needless to say my most recent witty riposte was grabbed by the Gremlins:
Just in case you were wondering what a mendacious moderator might mean:
[men-dey-shuh s]
adjective
1. telling lies, especially habitually; dishonest; lying; untruthful:
a mendacious person.
Halloween is a little way away still, but nonetheless I have a horror story to tell you. Are you sitting comfortably?
As our regular reader(s) will be aware we have been following the fortunes of the plucky little yacht Northabout on her Arctic circumnavigation with great interest. That includes the series of reports about the voyage on the BBC Radio 4 Today programme. Even recent passers by may have noticed that we were none too pleased with the most recent episode in the series!
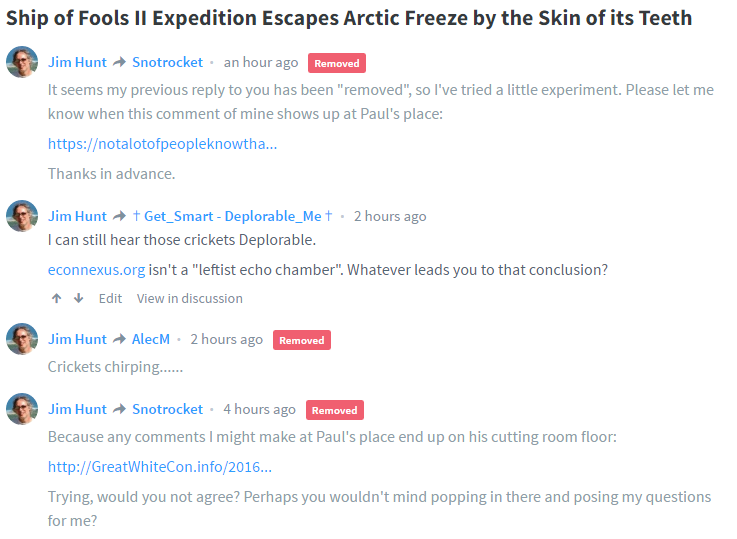
Now comes news that one of the numerous usual suspects has been blathering about both the Polar Ocean Challenge expedition and that BBC Radio 4 programme. Enter stage right James Delingpole at Breitbart. Under the catchy but erroneous headline:
The Polar Ocean Challenge expedition – aka Ship of Fools II – has escaped from the Arctic by the skin of its teeth. It was supposed to show how amazingly navigable the Arctic Circle has become now that climate change is supposedly melting the polar ice caps at a dangerous and unprecedented rate. But according to one observer who has followed their progress closely (see comments at Paul Homewood‘s place), the intrepid explorers – including a 14-year-old boy – came within just two days of calamity, after being hampered by unexpectedly large quantities of a mysterious substance apparently made of frozen water.
Regular readers will recall that not a lot of people know that Paul Homewood is the proprietor of a production line of porky pies full of horrifying Arctic anomalies. Mr. Delingpole references one batch of such Halloween howlers, wittily entitled:
The southern NWP route is now closed at the NE exit, with northern Prince Regent Sound blocked by 9/10 ice in freeze up mode. Exactly where they barely made it through after hours of probing on 9/12. Northabout made it through NWP with just two days to spare. Had they taken the planned 2 days resupplying in Barrow rather than 1, and the planned one day call at Cambridge Bay (meeting up with Polar Bound), they would not have made it out and would have had to turn around and overwinter at Cambridge Bay. It was that close.
Now how can I put this politely? That is pure unadulterated balderdash. If Mr. Delingpole thinks that a comment on a known “snow blind” blog constitutes evidence of anything he needs one of his heads examined. Deconstructing all the mistakes in just this one article about both Northabout and the BBC’s climate change coverage will involve a series with more episodes than BBC Radio 4s! However we have to start somewhere, so let’s examine this assertion first shall we?
Paul Homewood notes… it’s also the earliest minimum since 1997, indicating that the Arctic is currently experiencing a very cold spell.
Some skeptical fellows over on Twitter disagreed with me about the facts of the matter. This is how that “debate” proceeded:
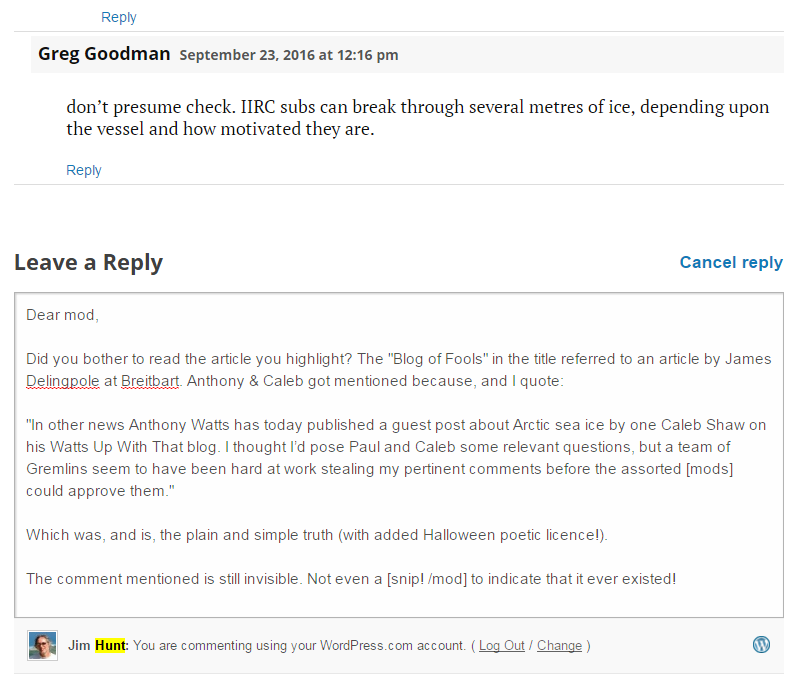
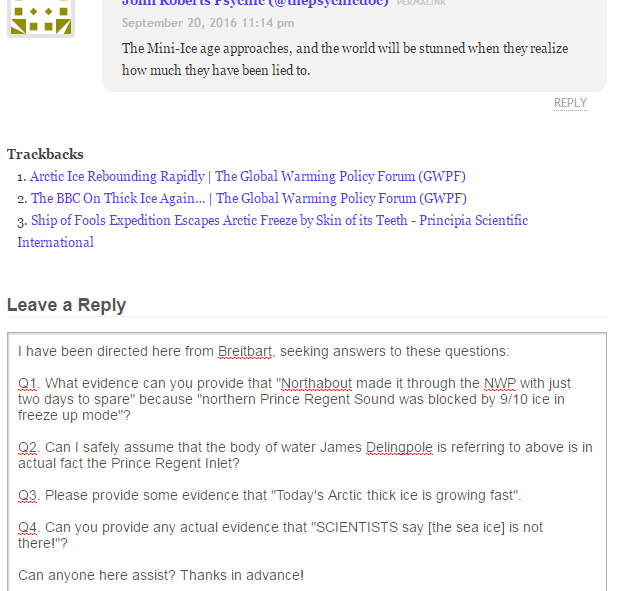
In other news Anthony Watts has today published a guest post about Arctic sea ice by one Caleb Shaw on his Watts Up With That blog. I thought I’d pose Paul and Caleb some relevant questions, but a team of Gremlins seem to have been hard at work stealing my pertinent comments before the assorted [mods] could approve them. By way of example, from Breitbart:
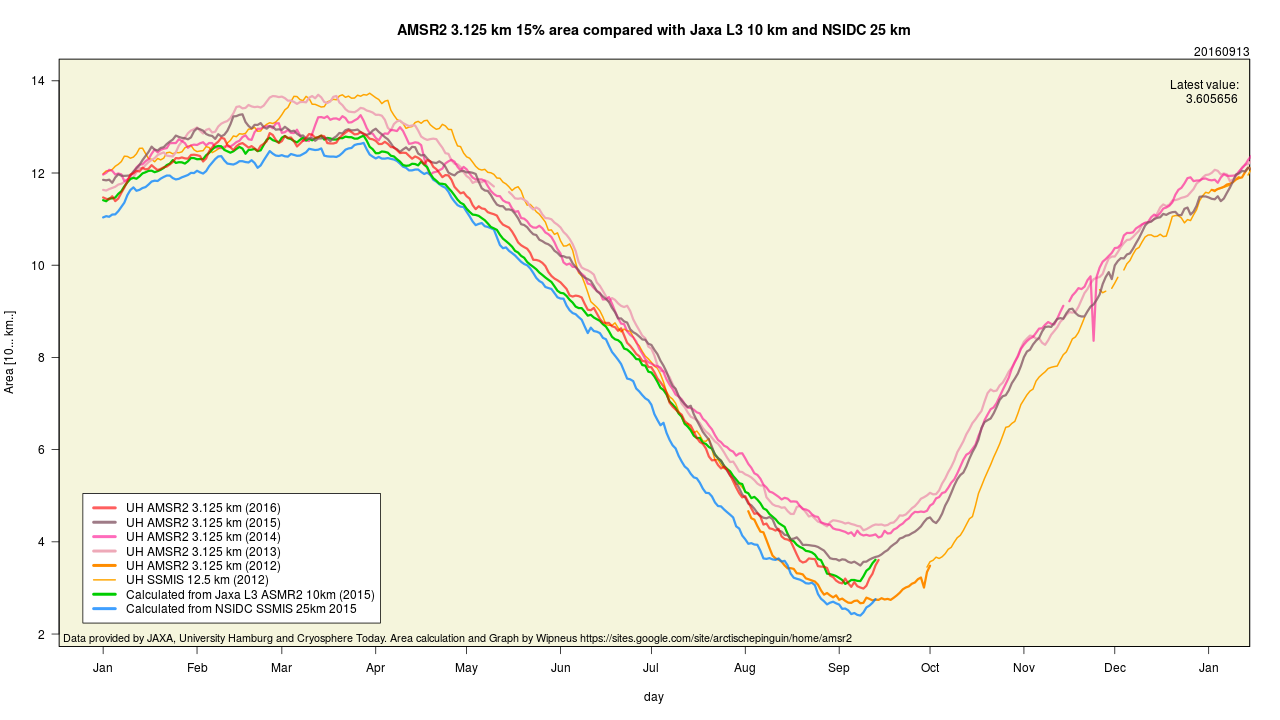
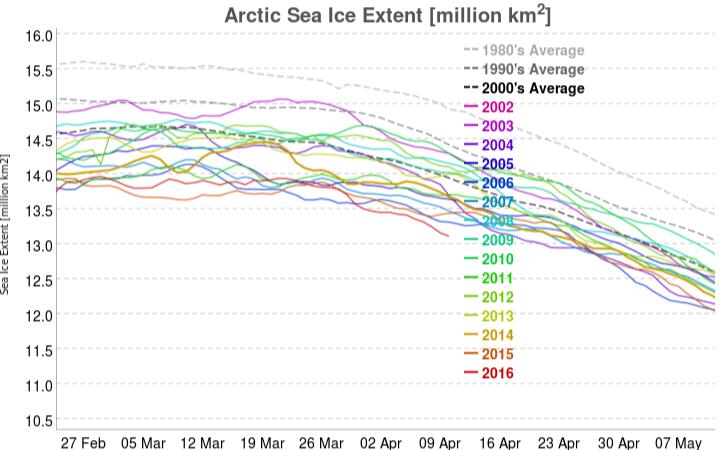
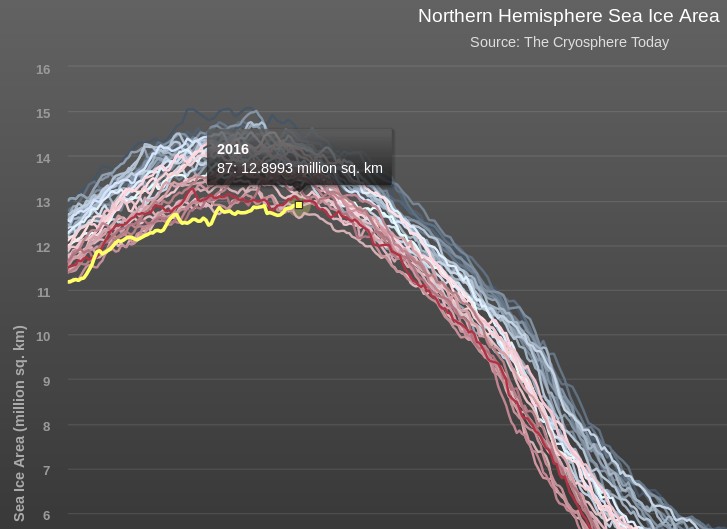
Today we bring a positive plethora of “Shock News!”. Starting with sea ice, yesterday Anthony Watts published an article on WUWT about the 2016 Arctic minimum extent. That’s not too surprising perhaps, but what’s shocking is that included one of Wipneus’ graphs of Arctic sea ice AREA that has been gracing our very own Arctic Sea Ice Graphs page since Anthony mocked us for not having such a thing. His take on this momentous event?
All of the data I’ve looked at agrees, Arctic sea ice is now on the upswing, and in a big way.
This graph from Wipneus shows the abruptness of the change.
Here it is, in all its glory:
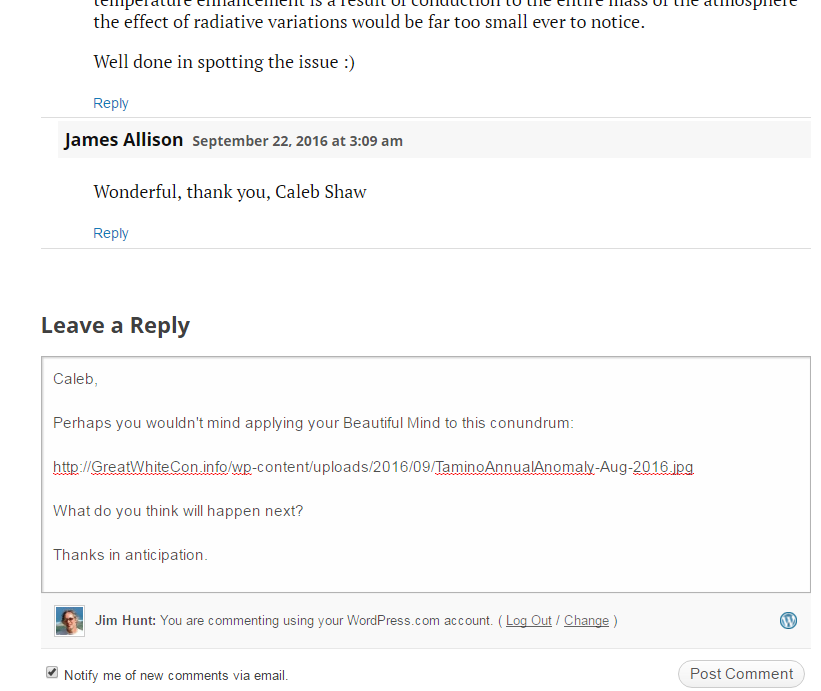
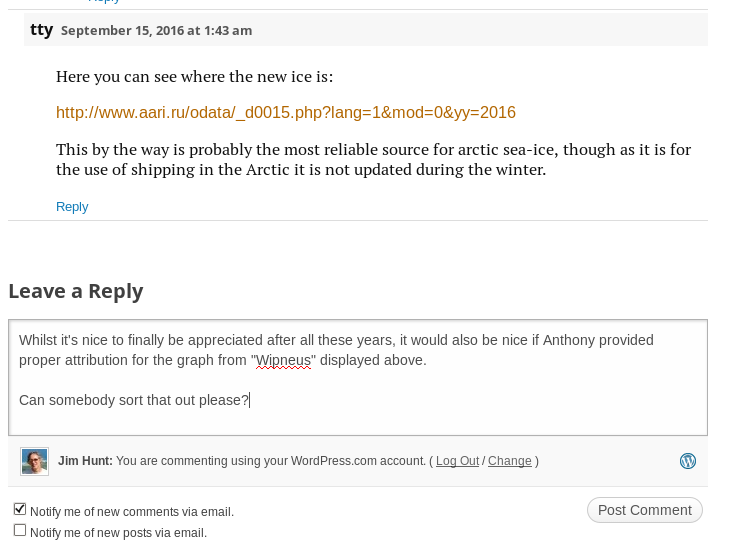
What’s not in the least surprising is that Anthony failed to provide a link to the source of the graph, and that our polite request for that to be corrected remains invisible took a long time to be approved over at Watts Up With That. Here it is, in all its ignominy:
As if that isn’t enough to cope with for one day, there was even bigger shock yesterday. Tony Heller stated:
which is accompanied by a screenshot from an Independent article which reads as follows:
One of Britain’s leading climate change sceptics – former Chancellor Nigel Lawson – has admitted that humans are causing global warming.
Speaking to the House of Lords’ Economic Affairs Committee, Lord Lawson said he did not “question for a moment” that carbon dioxide was a greenhouse gas.
And he accepted there was “huge agreement” among scientists that it was having “some effect” on the atmosphere.
But the former Conservative Cabinet minister argued it would be “crazy” for the UK to try to stop burning the fossil fuels that produce carbon dioxide, claiming countries like China were simply carrying on doing so.
Lord Lawson founded the Global Warming Policy Foundation in 2009 to oppose attempts to reduce the rise in temperatures and has emerged as one of Britain’s leading sceptics.
Here’s a recording of Nigel Lawson versus Adair Turner yesterday, testifying before the Economic Affairs Committee:
It seems as if the “97% consensus” on “anthropogenic global warming” is now at least 97.1%. I cannot help but wonder when Anthony Watts will reveal the news to his faithful followers? Meanwhile most of Tony’s many merry minions are unhappy bunnies this morning. 2015 “New Einstein” award winner Gail Combs complains:
The biggest problem is with that statement he just betrayed every skeptic and agreed that we are all tinfoil hat Den1ers.
It does not matter what else he added. That ‘sound bite’ is a HUGE WIN for the other side. Add the Ship of Fools ‘win’ and they will bash us into the ground.
I am sorry Tony, but it is a complete PR disaster especially right before the US elections.
As you well know this has never been about science. Our side plays by the Marquess of Queensberry Rules, their side are dirty street fighters using Alinsky’s Rules for Radicals and lie and cheat and browbeat at every turn. So their side wins EVERY D@MN TIME!
Mr. Heller comments:
I completely agree with [Nigel Lawson]. Do you consider me to be a “real skeptic” ?
Answers on a virtual postcard please, in the space provided below.
According to the old saying “A change is as good as a rest”, so rather than plagiarise today’s title from a “skeptical” web site we’ve invented this one all by ourselves. Northabout is a small yacht with big ideas. (S)he wants to circumnavigate the North Pole in one summer season. However certain cryoblogospheric commenters are somewhat skeptical that this can be achieved this year. Take Tony Heller for example:
There has been very little melt going on in the Arctic Ocean the last few days, due to cold cloudy weather.
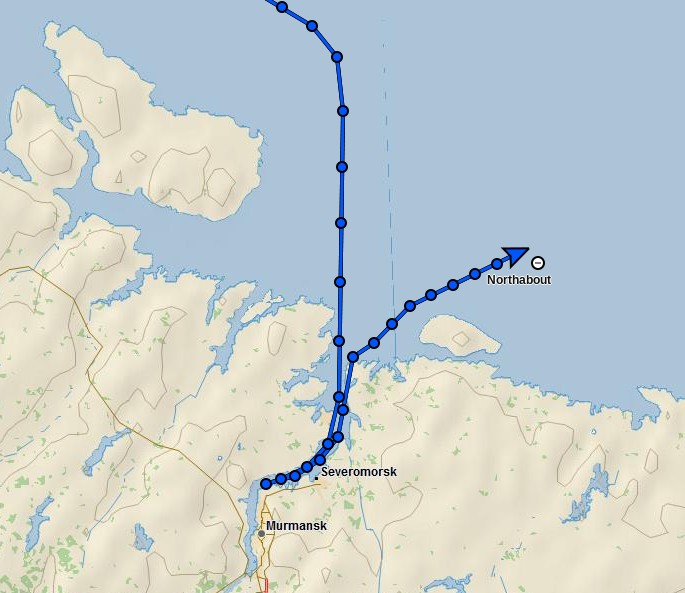
A group of climate clowns were planning on sailing around the entire Arctic Ocean through the Northeast and Northwest Passages (to prove there isn’t any ice in the Arctic) but are stuck in Murmansk because the Northeast Passage is completely blocked with ice.
The “group of climate clowns” aboard Northabout that Mr. Heller refers to are led by David Hempleman-Adams. According to the Polar Ocean Challenge web site:
David is one of the most experienced and successful adventurers in the world.
In his forty years as an adventurer, David was the first person to reach the highest peaks on all seven continents and journey fully to the North and South Geographical and Magnetic Poles. He has broken forty-seven Federation Aeronautique Internationale ballooning records
My name is Tony Heller. I am a whistle blower. I am an independent thinker who is considered a heretic by the orthodoxy on both sides of the climate debate.
I have degrees in Geology and Electrical Engineering, and worked on the design team of many of the world’s most complex designs, including some which likely power your PC or Mac. I have worked as a contract software developer on climate and weather models for the US government.
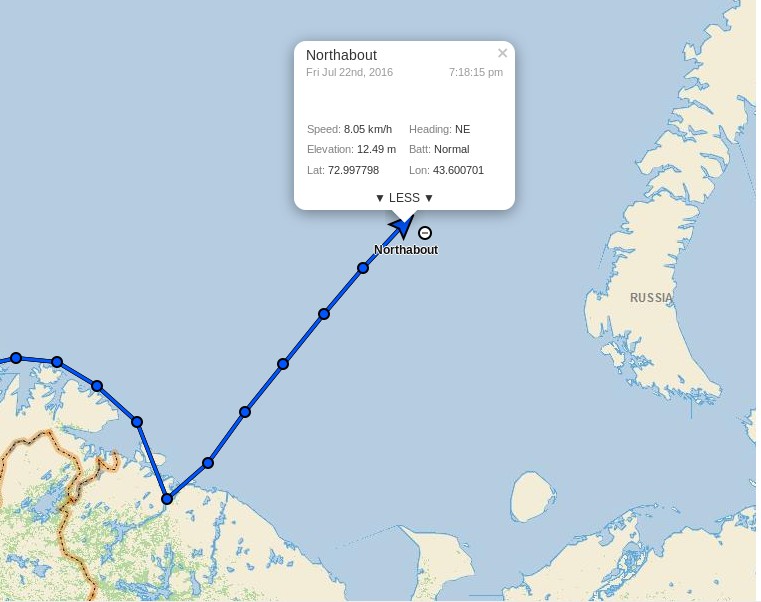
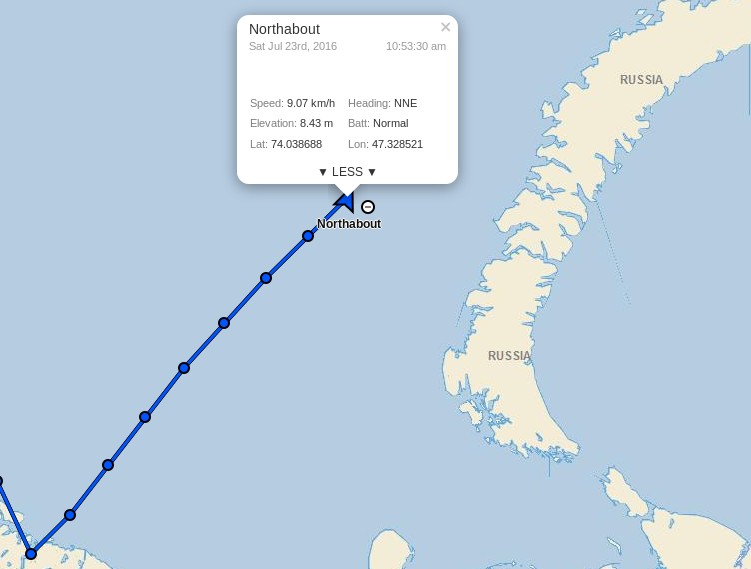
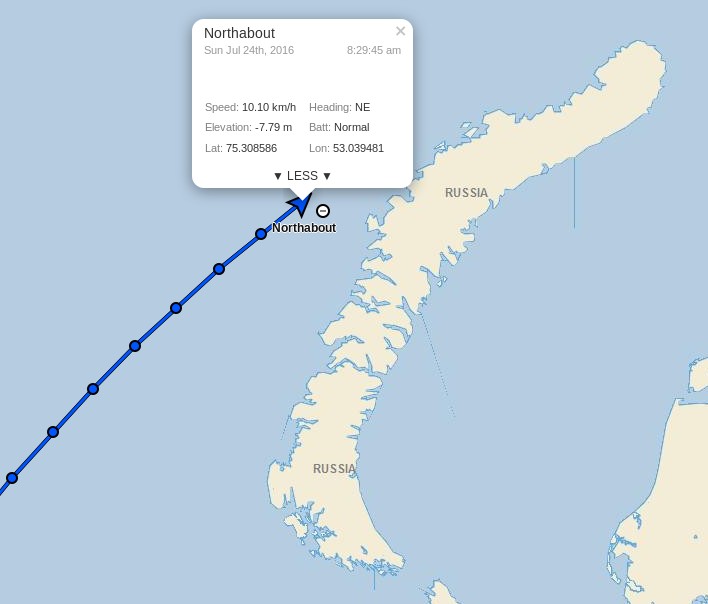
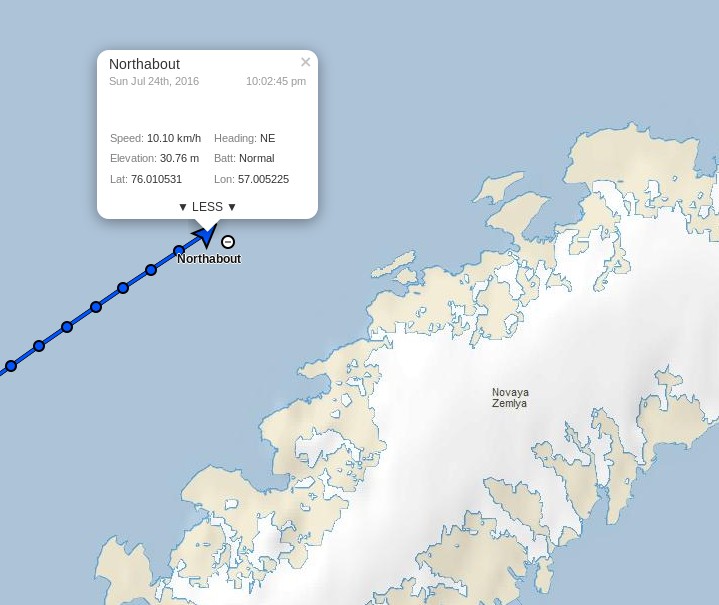
However despite Tony’s long list of qualifications he is evidently currently quite confused, since according to the Polar Ocean Challenge live tracking map David and Northabout are not in actual fact “stuck in Murmansk” at all:
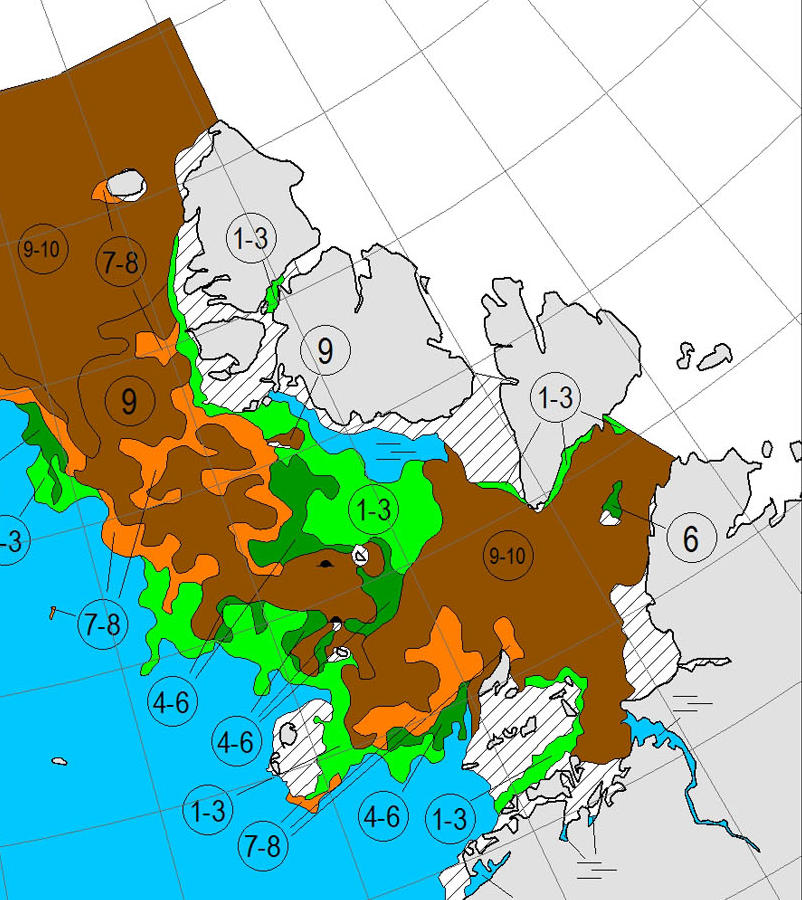
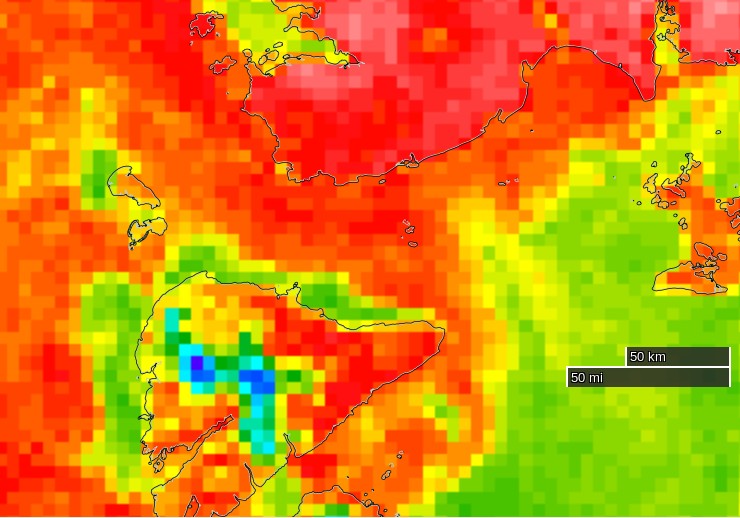
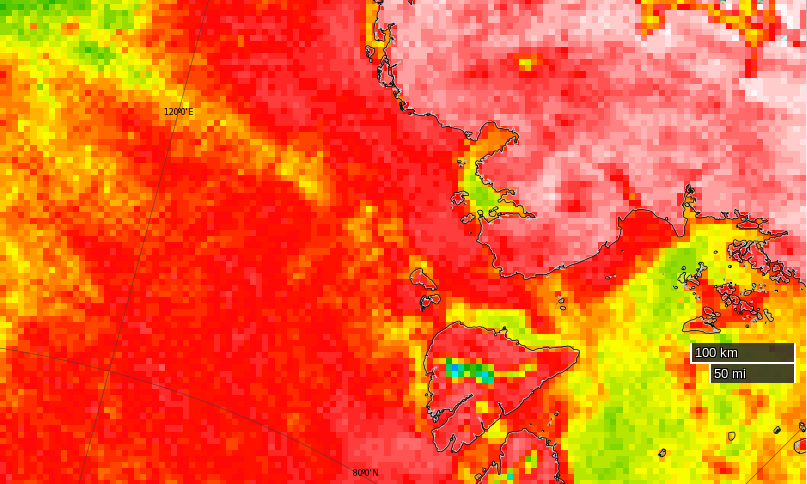
This shouldn’t come as surprise to anyone with an internet connection and a desire to check the facts, since as we speak there is currently remarkably little sea ice cover on the Atlantic side of the Arctic Ocean:
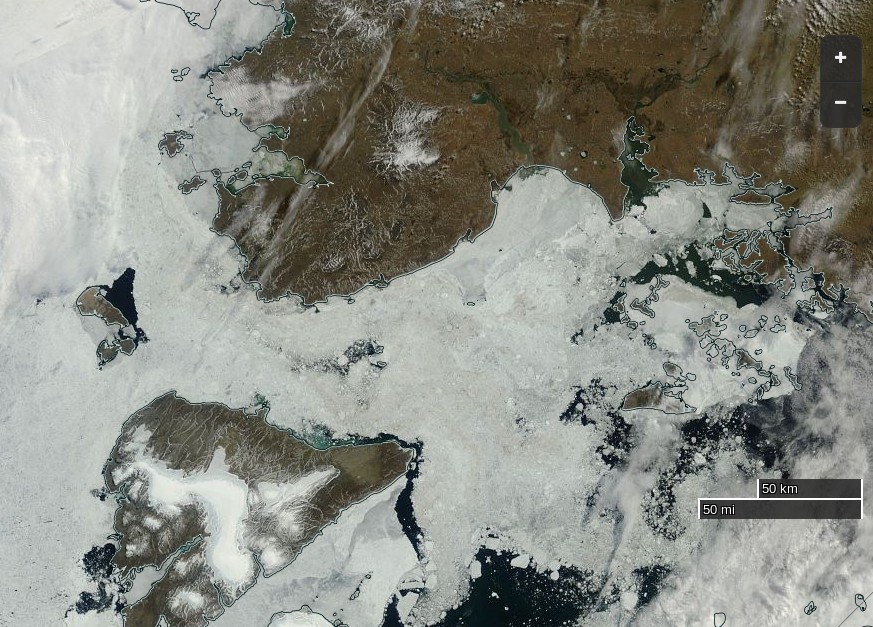
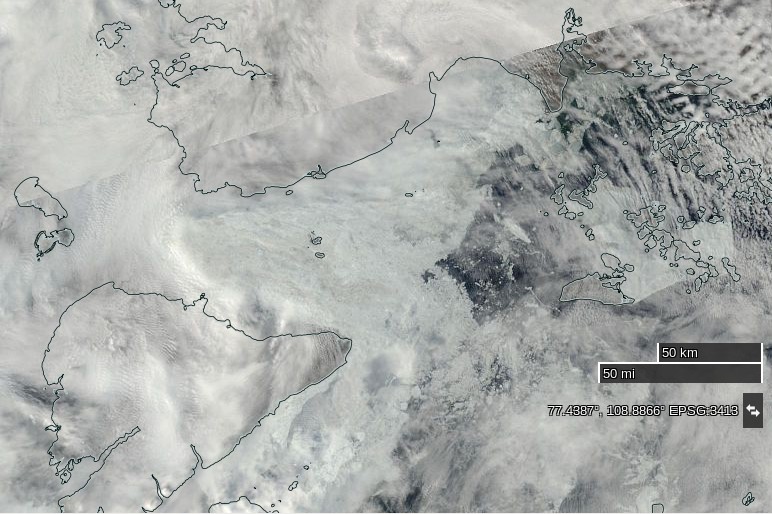
Hence Northabout should find the next leg of his/her voyage across the Barents and Kara Seas pretty plain sailing. However Vilkitsky Strait, the passage from the Kara into the Laptev Sea, is currently looking a trifle tricky:
NASA Worldview “true-color” image of the Vilkitsky Strait on July 20th 2016, derived from the MODIS sensor on the Terra satellite
Do you suppose Tony Heller suffers from precognitive dreams?
[Edit – July 22nd 2016]
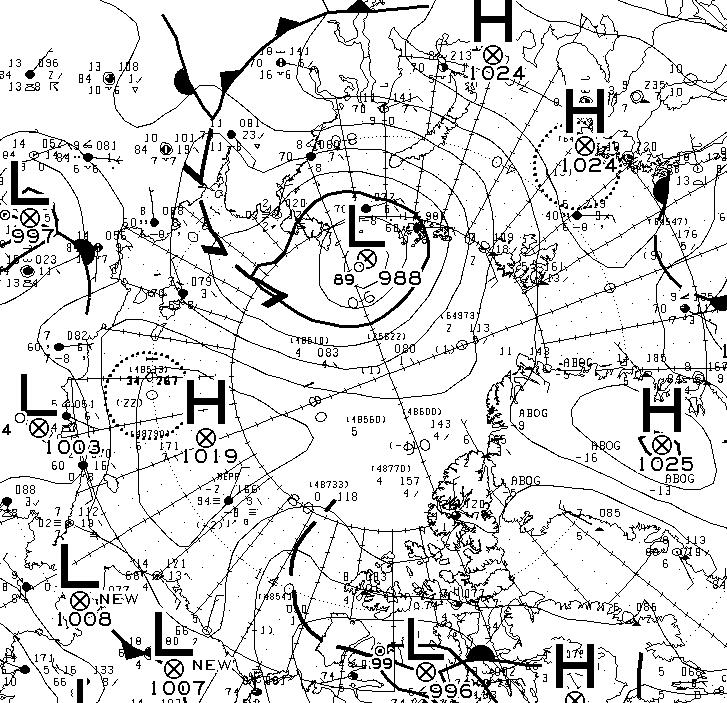
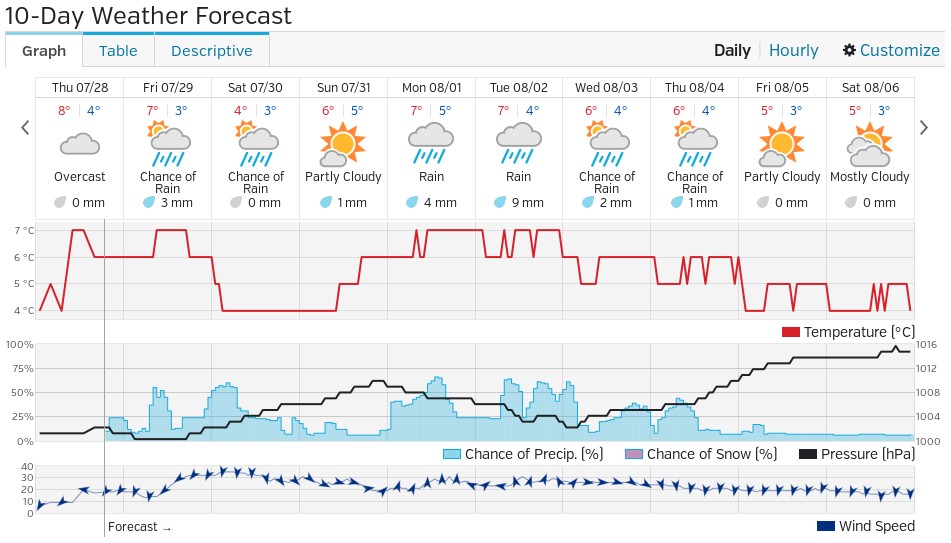
According to Environment Canada this morning there’s a 988 hPa central pressure cyclone causing a bit of a blow in the Vilkitsky Strait at the moment:
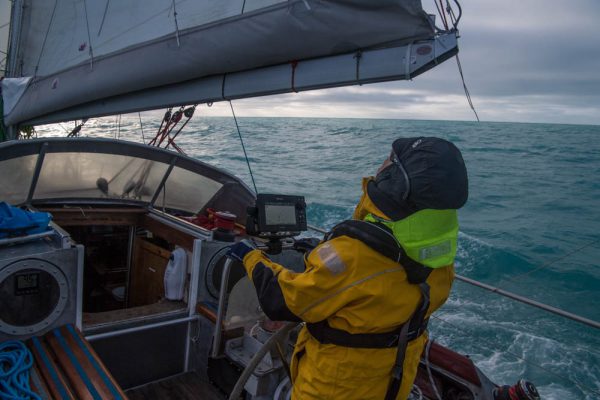
Sea and air temperature getting colder as we venture further north. Saw quite a lot of Dolphins for the first time around the Yacht. Still sea gulls flying behind and skimming the waves.
Had some promising Canadian ice charts yesterday, but that’s a long way off. Today we should get an update with the Russian side. fingers crossed it is still not solid around the cape and Laptev sea. That could slow us down considerably. The wind has been blowing the pack ice against the land, so very difficult to get around the shore, but let’s see what Santa brings.
P.S. Maintaining his usual modus operandi, Tony Heller has penned a new article today, containing a satellite image remarkably similar to the one just above. Under the headline “The 2016 Franklin Expedition” he tells his loyal readership:
The Polar Ocean Challenge is headed off into the ice.
They will run into this in three days – hundreds of miles of solid ice. Without an icebreaker, they are going nowhere. I asked them on Twitter if they have an icebreaker. I haven’t received a response, and will be monitoring them by satellite to see if they are cheating.
By some strange coincidence we’re “monitoring them by satellite” too:
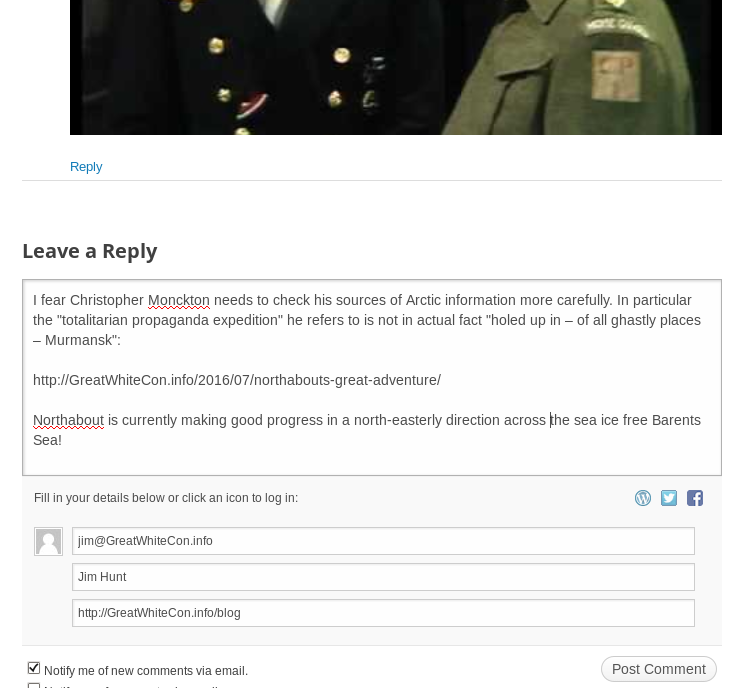
As for ice melt, yet another totalitarian propaganda expedition intended to “raise awareness” of climate “catastrophe” by trying to sail around the Arctic in the summer has just come a cropper owing to – er – too much ice. Neither the North-East Passage nor the North-West Passage is open, so the expedition is holed up in – of all ghastly places – Murmansk. That’ll teach Them.
However my corrective comment has yet to see the light of day at WUWT:
Meanwhile Northabout resolutely presses on regardless, and has just passed 74 degrees North:
whilst the sea ice edge in the north-eastern Kara Sea has retreated somewhat over the last three days:
NASA Worldview “true-color” image of the Vilkitsky Strait on July 23rd 2016, derived from the MODIS sensor on the Terra satellite
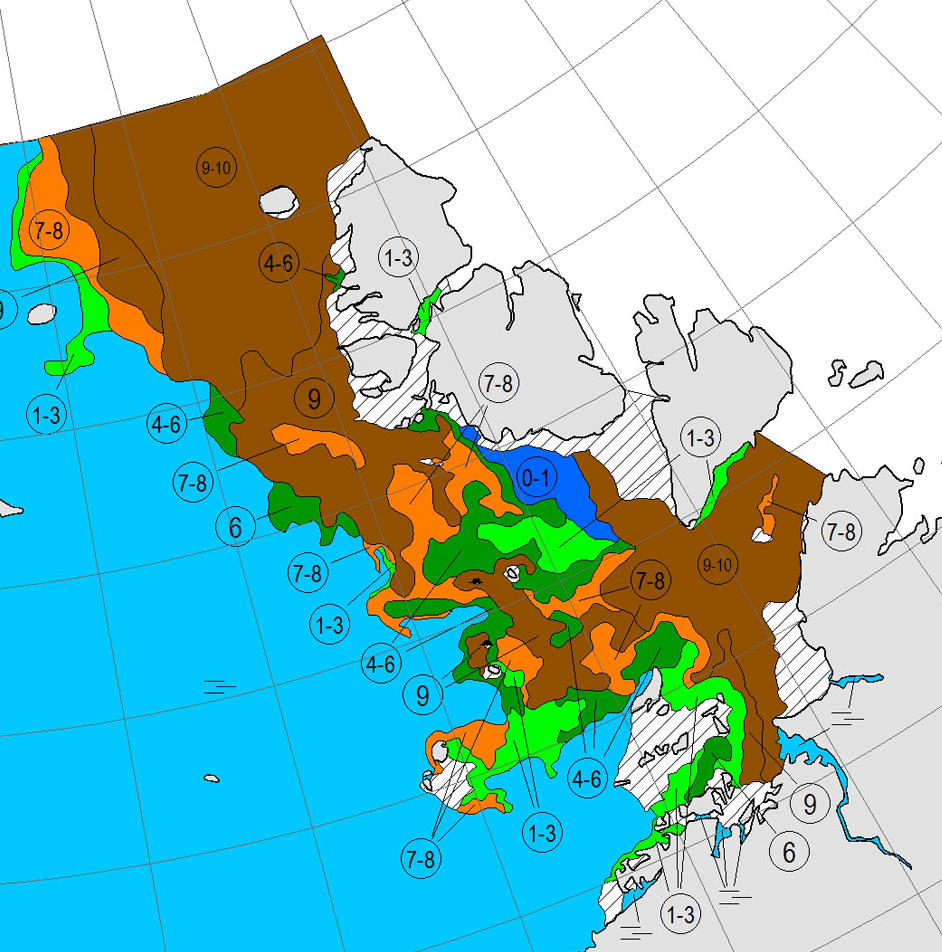
Here’s the July 20-22nd AARI map of the Vilkitsky Strait area:
On the topic of Arctic sea ice melt in general Viscount Monckton opines over on WUWT that:
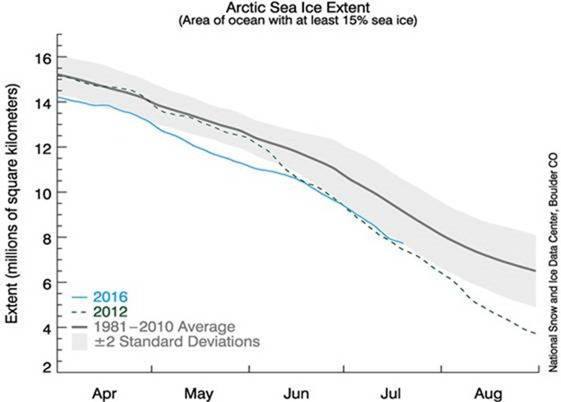
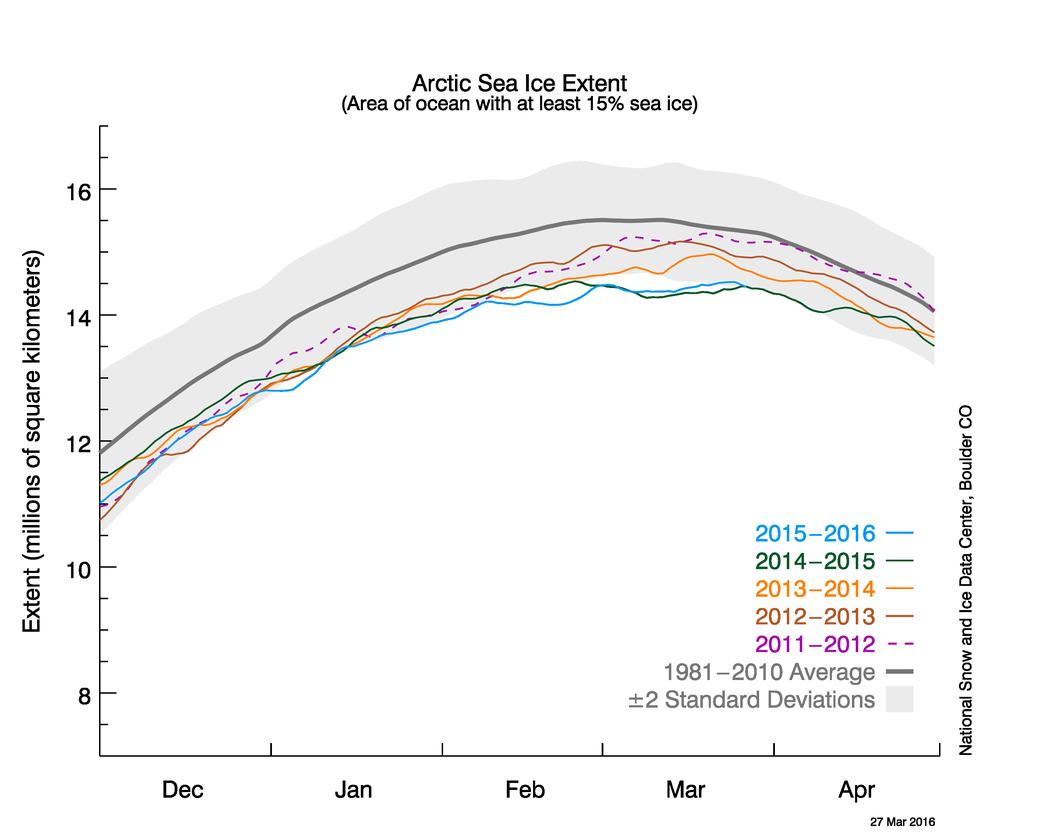
According to the National Snow and Ice Data Center’s graph, also available at WUWT’s sea-ice page, it’s possible, though not all that likely, that there will be no Arctic icecap for a week or two this summer:
Even if the ice disappears for a week or two so what? The same was quite possibly true in the 1920s and 1930s, which were warmer than today in the northern hemisphere, but there were no satellites to tell us about it.
The Good Lord seems to have a very tenuous grasp on reality, since the NSIDC’s graph shows nothing of the sort. Perhaps he is merely indulging in irony?
[Edit – July 24th 2016]
Northabout passed the 75 degrees North milestone overnight:
Clouds obscure the Vilkitsky Strait in visible light this morning but passive microwaves make it through the murk, albeit with reduced resolution. They reveal the sea ice edge in the Kara Sea receding and a narrow passage opening up along the Northern side of the Strait (North is down in the image):
NASA Worldview passive microwave image of the Vilkitsky Strait on July 24th 2016, derived from the AMSR2 instrument on the Shizuku satellite
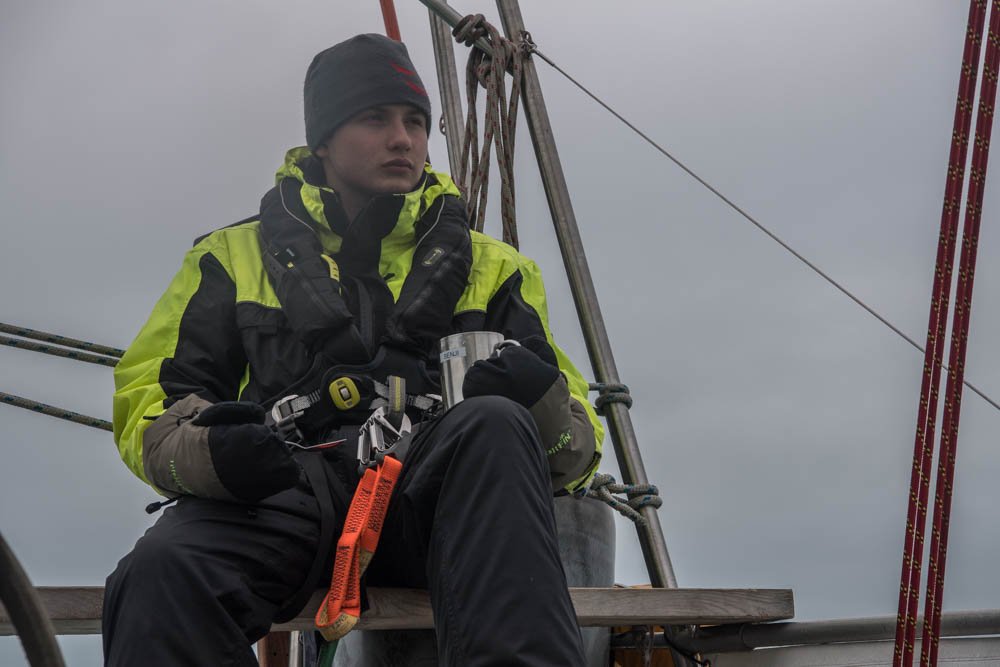
According to Ben Edwards’ latest blog post from the Barents Sea:
I just wore a T-shirt on my first watch out of Murmansk. Today I wore my trawler suit and a primaloft under it with gloves and a hat….
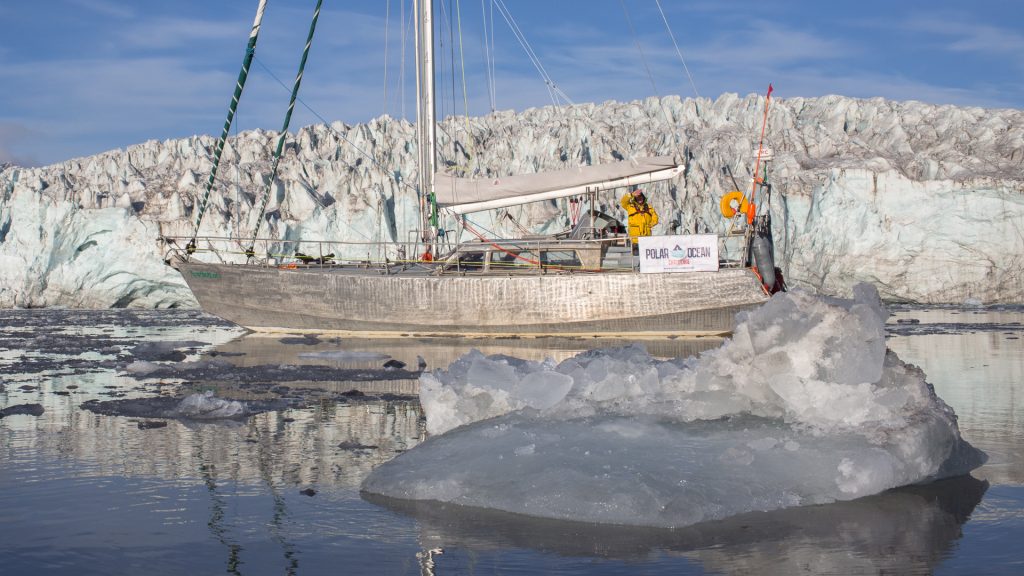
As the cryodenialosphere continue to retweet and reblog their regurgitated rubbish here’s a picture from last year of Northabout amidst some ice, especially for those apparently unable to distinguish a small yacht from a large icebreaker:
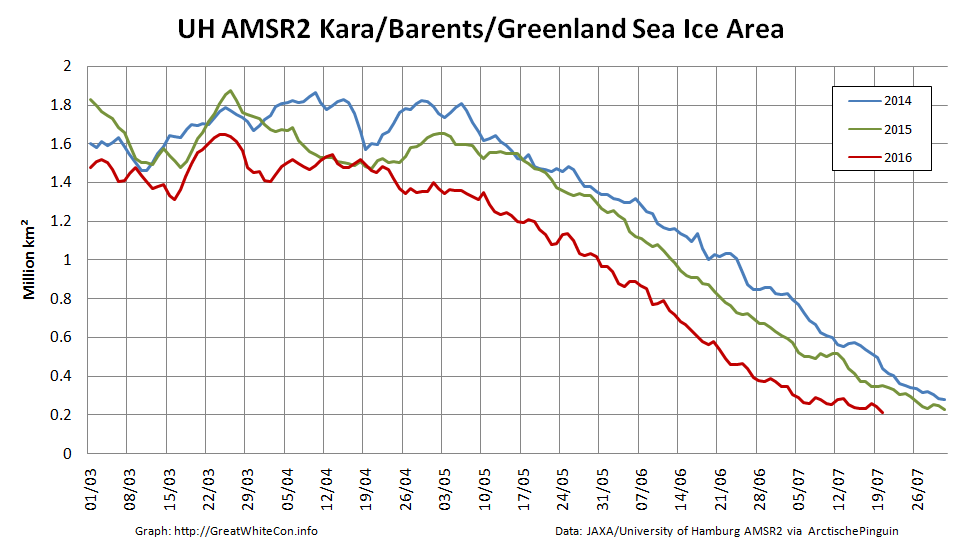
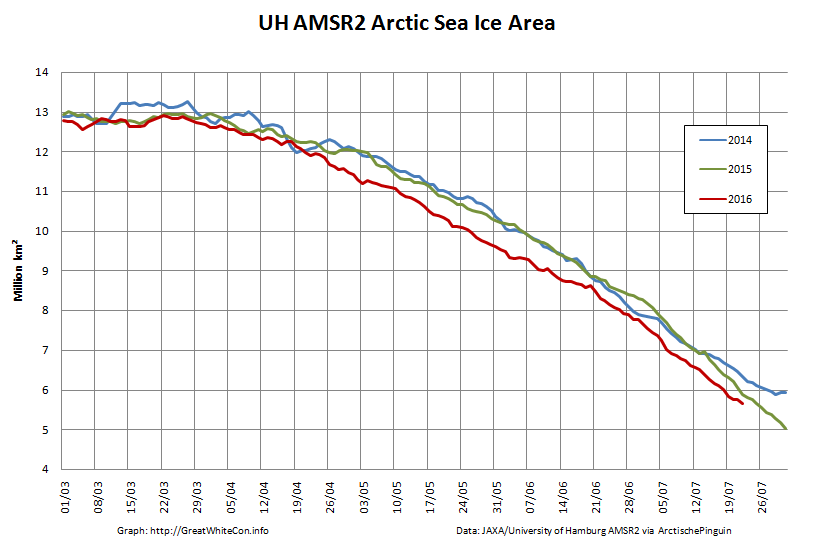
Meanwhile Arctic sea ice continues its inexorable decline:
[Edit – July 24th 2016 PM]
Shock News! Tony Heller has just published yet another article about Northabout’s Great Adventure, and yours truly gets a mention. In the headline no less!! Read all about it at:
Meanwhile the commenters over at unReal Science keep blathering on about icebreakers even though one of the more inquisitive denizens posted thisextract from the “Ship’s Log” over there yesterday:
Partly checked the new ice charts on www.nsra.ru, we still have no chance of getting through yet, not past the cape or through the Laptev sea. Nikolai, Our Russian Captain who is very familiar with this route, impresses on me that this is a very unusual year and normally clear, Not what I want to hear. We are under sail, so saving fuel, and will find a small island to shelter until we get improvements. We are still 5 days from the ice, so lets hope for some southerly winds to push the ice from shore.
Northabout is heading for the Kara Sea past the northern tip of Novaya Zemlya, and has now passed 76 degrees North:
[Edit – July 25th 2016]
The skies are still cloudy over the Vilkitsky Strait and Cape Chelyuskin, so here’s another AMSR2 passive microwave visualisation of the state of play. Note the change of scale:
NASA Worldview passive microwave image of the Vilkitsky Strait on July 25th 2016, derived from the AMSR2 instrument on the Shizuku satellite
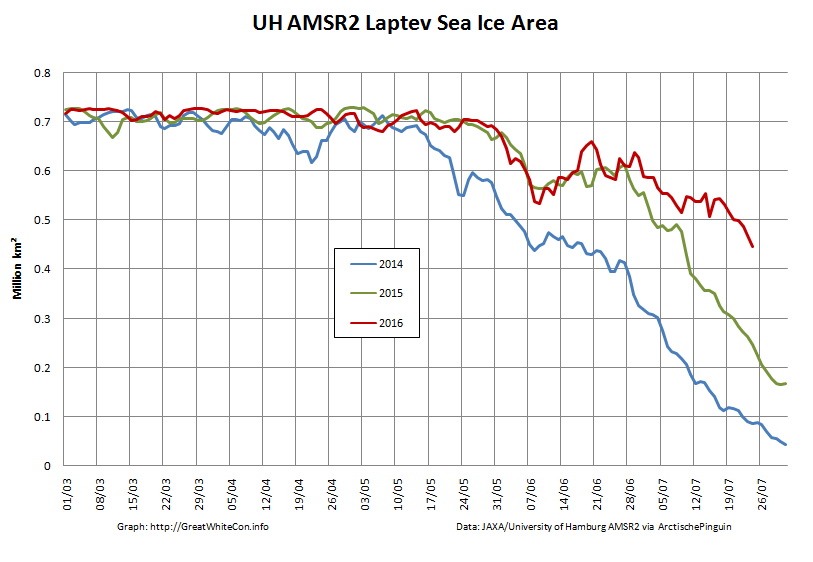
The sea ice area in the Laptev Sea has finally started decreasing at a more “normal” rate for late July, but still has a lot of catching up to do compared to recent years:
Meanwhile over at “Watts Up With That” at least one reader of Christopher Monckton’s purple prose is clearly confused. Needless to say my clarifying comment is still invisible to him:
Finally, for the moment at least, here’s some moving pictures of dolphins having fun in the Barents Sea:
[Edit – July 26th 2016]
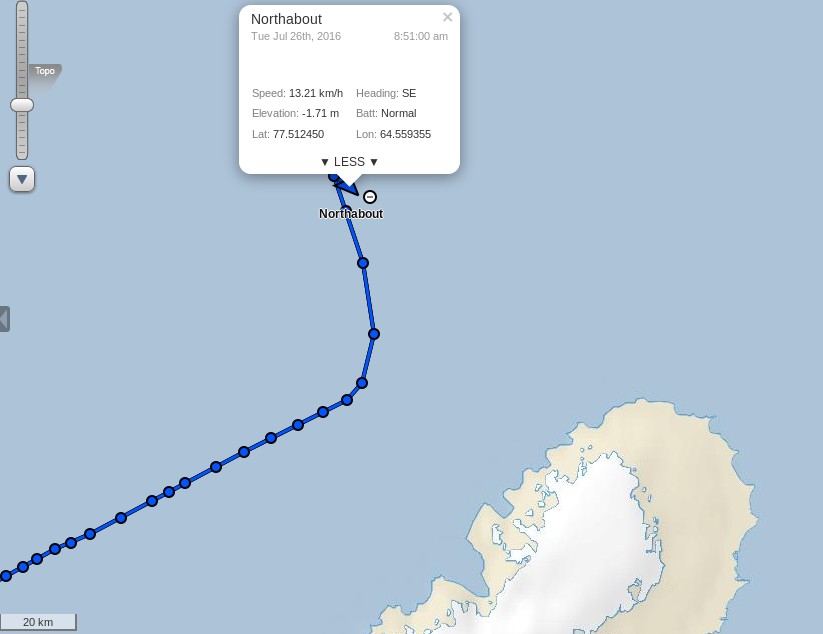
I was expecting Northabout to have entered the Kara Sea by now, but instead (s)he has headed north, and is now well above the 77th parallel:
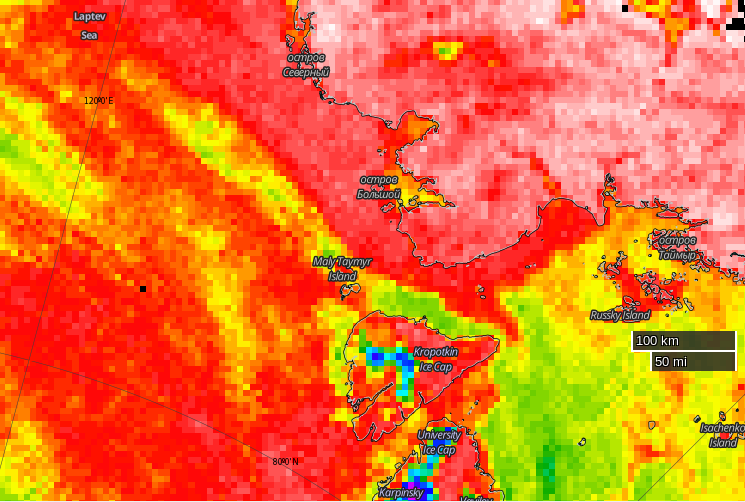
It’s still pretty cloudy up there so here once again is the latest AMSR2 passive microwave visualisation of the Vilkitsky Strait area, with a few place names added for a bit of variety:
NASA Worldview passive microwave image of the Vilkitsky Strait on July 26th 2016, derived from the AMSR2 instrument on the Shizuku satellite
P.S. The Polar Ocean Challenge team explain via Twitter:
@GreatWhiteCon Ha ha! Thanks for interest! Waiting game, manoeuvring, strategy. Difficult to update in choppy conditions! New SHIPSLOG now
— PolarOceanChallenge (@PolarOceanChall) July 26, 2016
Choppy sea, taking four hour tacks. These sea conditions make it hard to sleep, cook or relax.
We are considering many elements all the time. We are due new Russian Ice charts today.
We know the North west is pretty clear, but this year is a very unusual year in the north east passage. Normally the Laptev Sea would be pretty open now as in previous years. It is not. This is also partly due to the wind blowing the pack ice down south and consolidating next to the land.
So, we need to get through the straight and through the Laptev Sea. So where do we wait until we can do this? We have deliberately taken our time to get to this point, and used the wind as much as we can to conserve fuel.
Now the weather has changed, the wind direction has also changed. From the calm turquoise seas, to choppy short seas, wet, windy and cold.
So we took a long tack north, and then tacked east again. There is No hurry. We will slowly make our way east, and if we can find an island with no fast ice around, will look for a sheltered spot, until we get better ice conditions.
The other options are to Heave to and wait, but this is a sailing Yacht, she needs to sail. And if we get a Southerly blow, it could change our chances very quickly to get around, so we need to be close to react.
So, another day at the office.
There was a report on the BBC Radio 4 Today programme this morning from the crew of Northabout, and an interview with Dr. Ed Blockley from the UK Met Office about the current state of sea ice in the Arctic:
Note in particular the part at 2:59:00 where Justin Webb says to Ed:
I thought that I’d read somewhere that [Northabout] had got stuck.
I cannot help but wonder what on Earth gave him that idea?
[Edit – July 27th 2016]
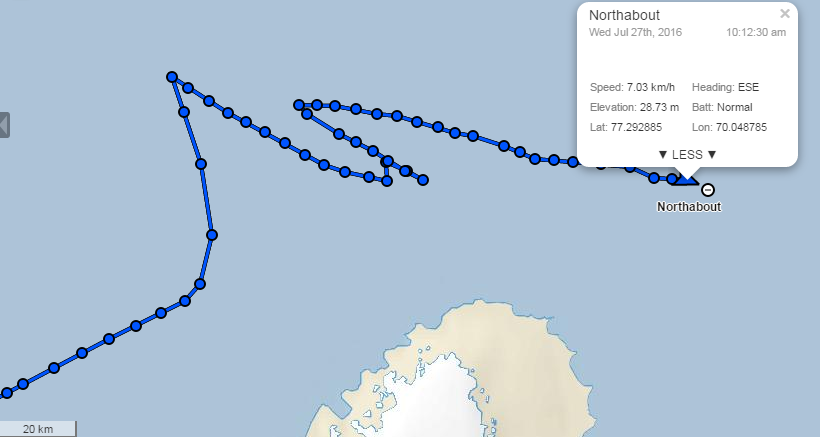
After “going round in circles” north of Novaya Zemlya yesterday Northabout is now heading East across the Kara Sea:
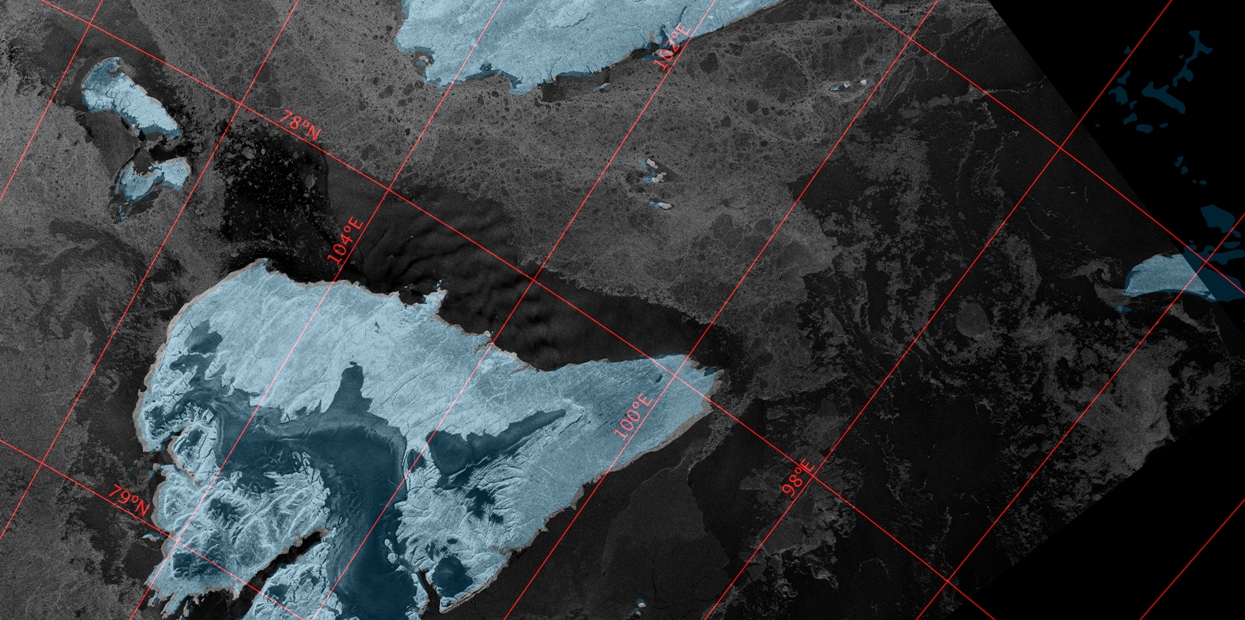
Synthetic aperture radar images from the European Space Agency’s Sentinel 1A satellite have started flowing through Polarview once again, so here’s one of where Northabout is heading:
Sentinel 1A synthetic aperture radar image of the Vilkitsky Strait on July 26th 2016
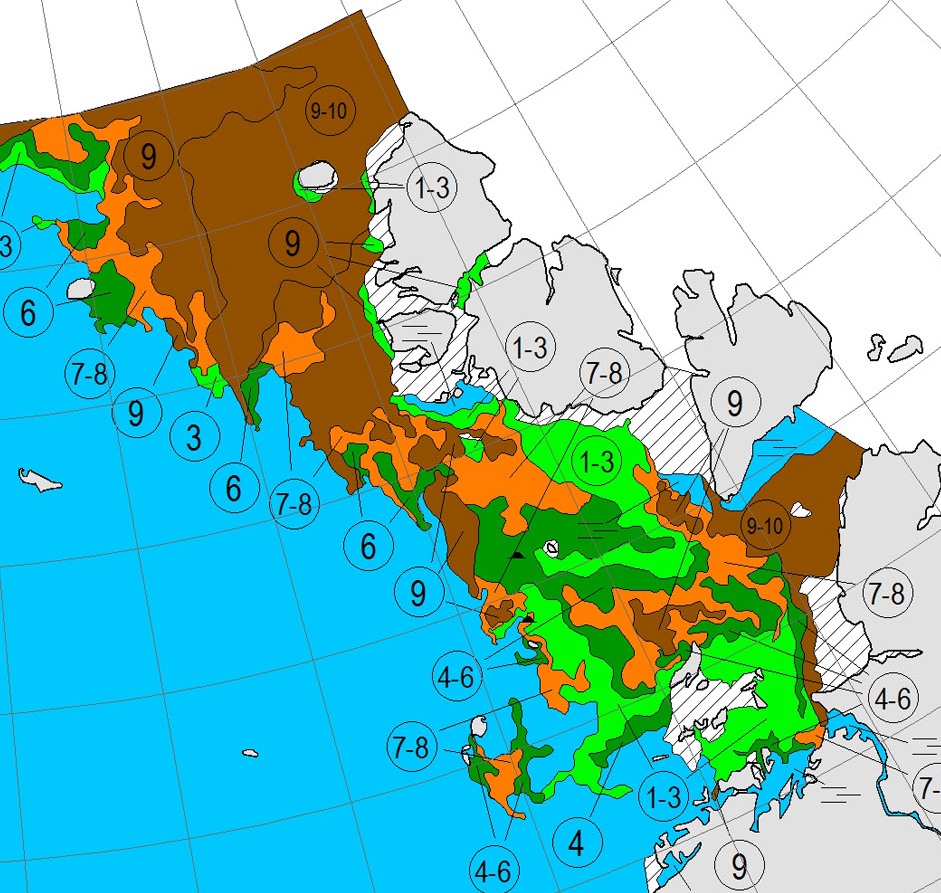
Here’s the current Arctic and Antarctic Research Institute map of the same area:
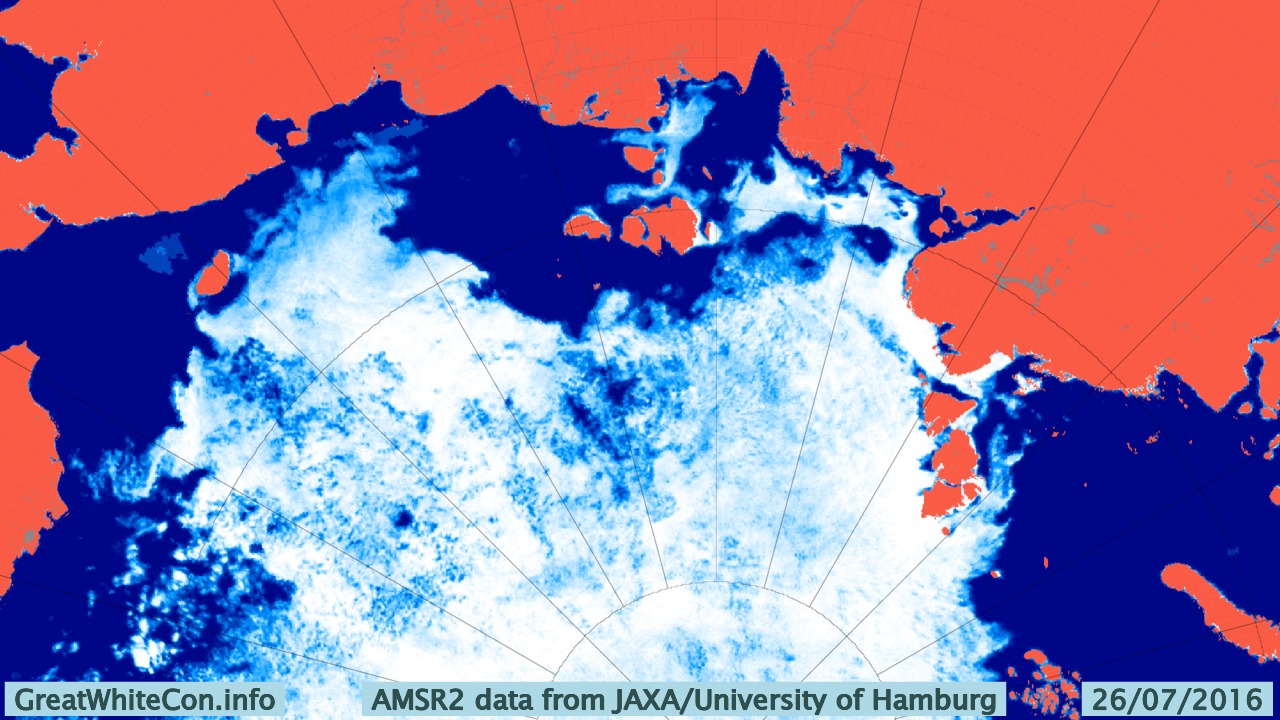
There’s still no way through by which Northabout might avoid an encounter with 9-10 tenths sea ice coverage. Then of course there’s the Laptev Sea to contend with too. Here’s the latest AMSR2 visualisation from the University of Hamburg:
It’s not exactly plain sailing there either just yet!
[Edit – July 28th 2016]
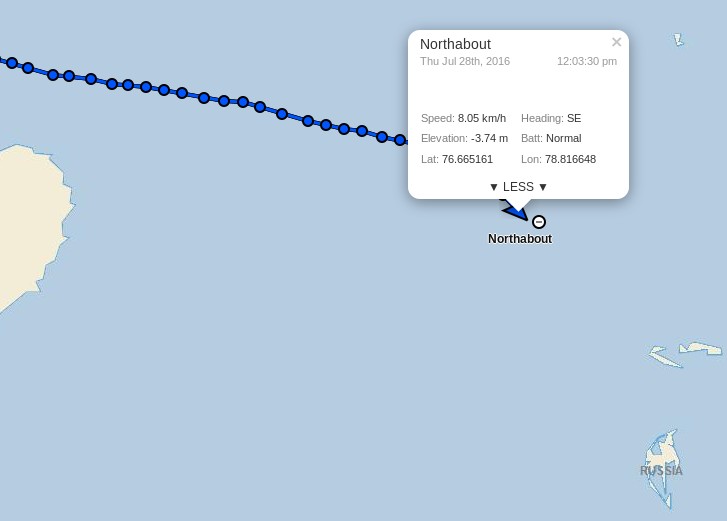
This morning Northabout has almost reached 79 degrees East, and appears to be heading in the direction of Ostrov Troynoy:
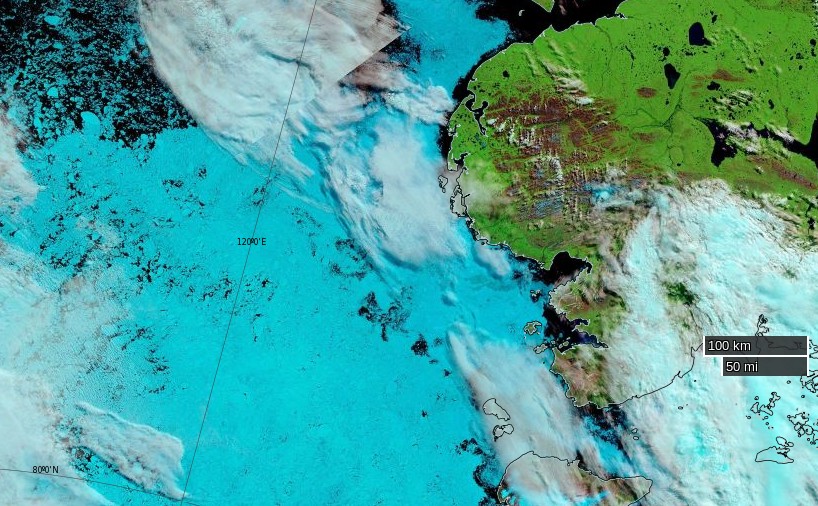
The clouds over the Laptev Sea have cleared somewhat as the recent cyclone heads for the Beaufort Sea, to reveal that the “brick wall” of ice referred to in certain quarters now looks more like Swiss cheese:
NASA Worldview “false-color” image of the Laptev on July 28th 2016, derived from the MODIS sensor on the Terra satellite
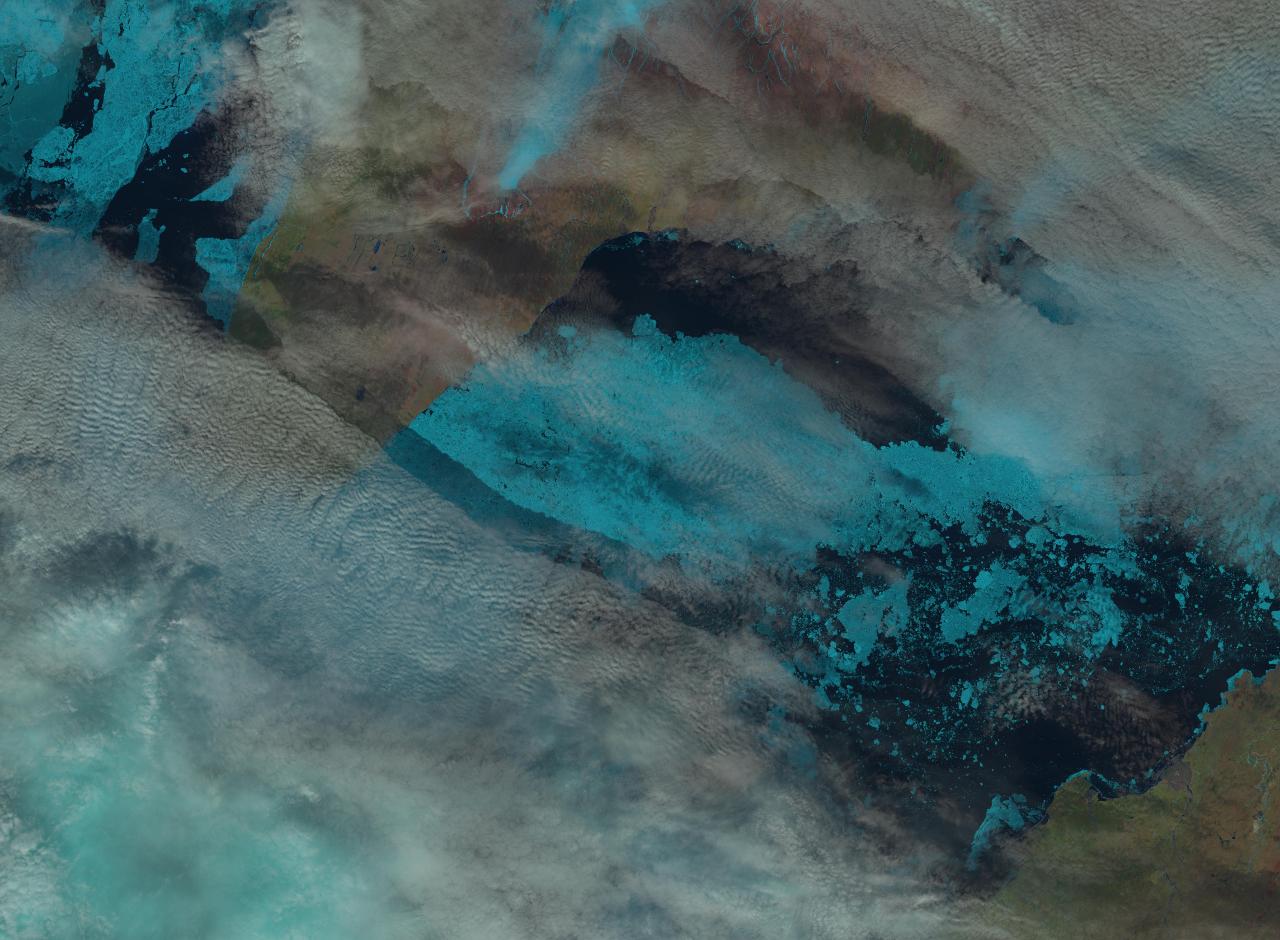
Here’s a close up look at the Vilkitsky Strait from the Landsat 8 satellite this morning. Note that unlike the MODIS image above, north is at the top of this one:
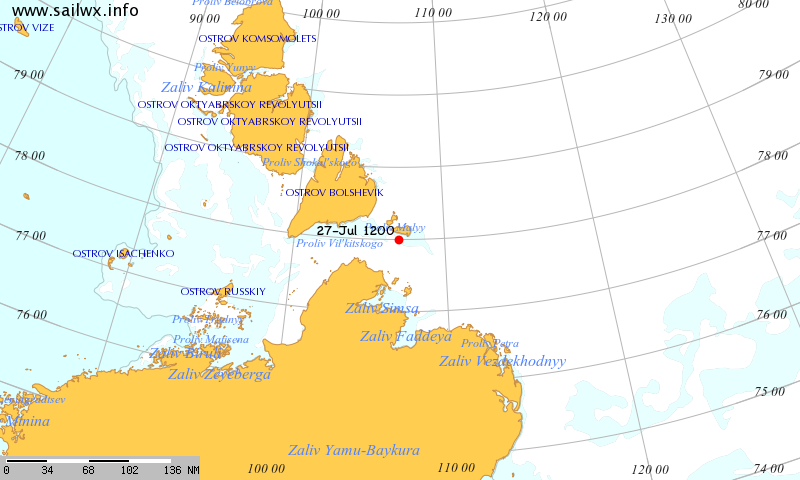
Meanwhile according to SailWX the Russian icebreaker Yamal is traversing the Vilkitsky Strait from east to west:
You will note that we were not the only ones to swiftly conclude that Judy’s assertion was lacking both veracity and verisimilitude! Then this morning came our old friends at the Global Warming Policy Forum with:
You will note that the GWPF adorned their “Tweet” with a graph purporting to show “Global sea ice anomalies”. We can only assume that Benny Peiser hadn’t read this April 11th article of ours, which pointed out that:
NSIDC has suspended daily sea ice extent updates until further notice, due to issues with the satellite data used to produce these images. The problem was initially seen in data for April 5 and all data since then are unreliable, so we have chosen to remove all of April from NSIDC’s archive.
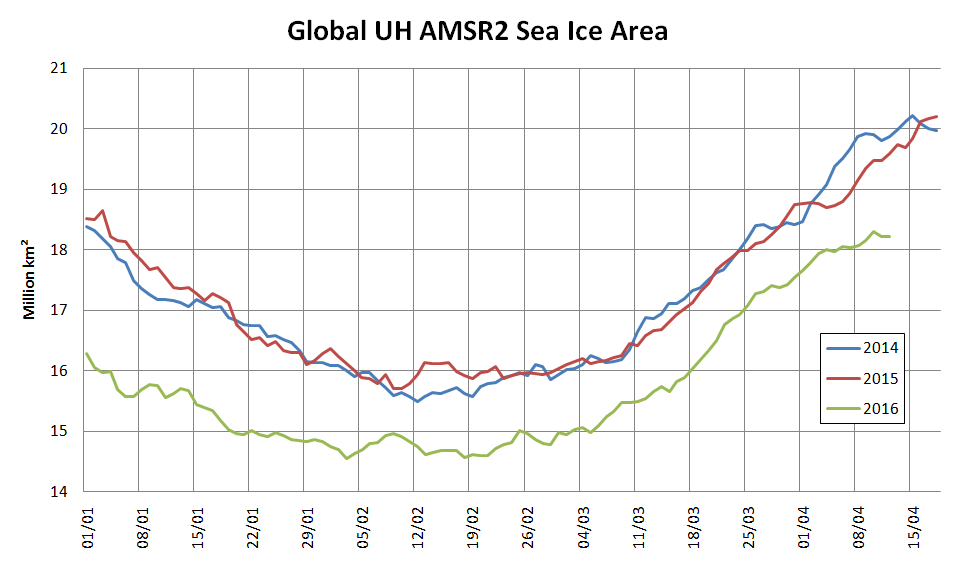
To remedy that (no doubt?) inadvertent oversight on Benny’s part here is a graph we prepared earlier of absolute global sea ice area using reliable data from the AMSR2 instrument on the Japan Aerospace eXploration Agency’s SHIZUKU satellite:
The GWPF were followed this afternoon by Anthony Watts with:
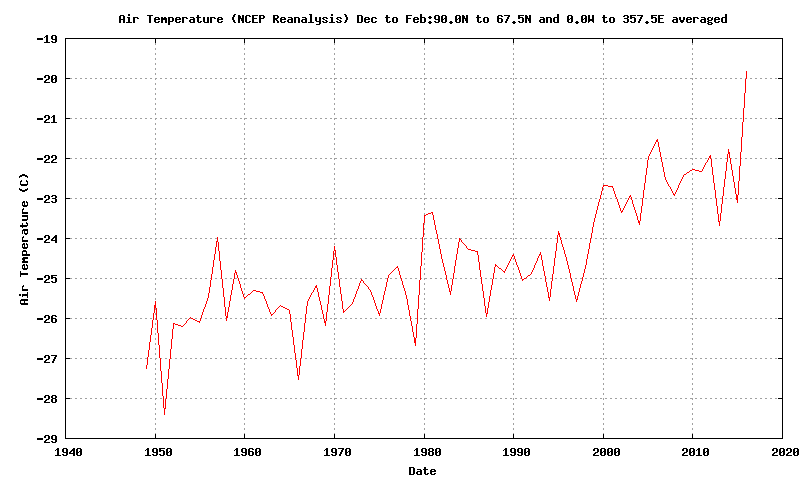
Both Prof. Curry and non Prof. Watts adorned their “Tweets” with a graph allegedly comparing “global temperature” with “tropical temperature”, but provided no graph of “polar temperature”. To remedy that (no doubt?) inadvertent oversight here is one we prepared earlier:
All members of this team of synchronised “Tweeters” provided links to an April 11th article by a certain Paul Dorian entitled, believe it or not:
In an interesting twist, the recent analysis found that the global ice area remained stable throughout the 1980s and the 1990s, while temperatures climbed suggesting “the global sea ice area is not particularly a function of the global average surface temperature.” [Source: Willis Eschenbach/”Watts Up With That” web site]
We can only assume that Paul Dorian hadn’t read this April 10th article of ours, which pointed out amongst other things that:
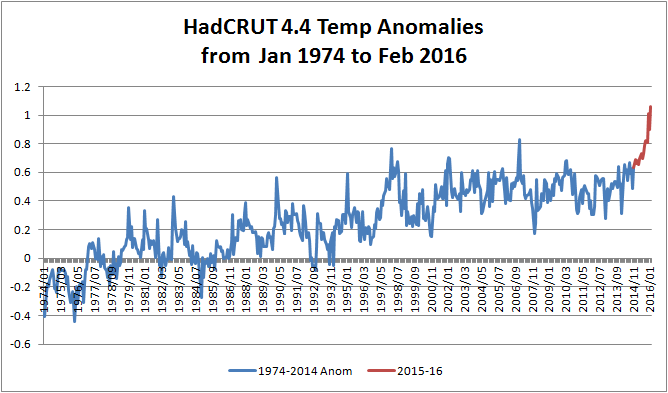
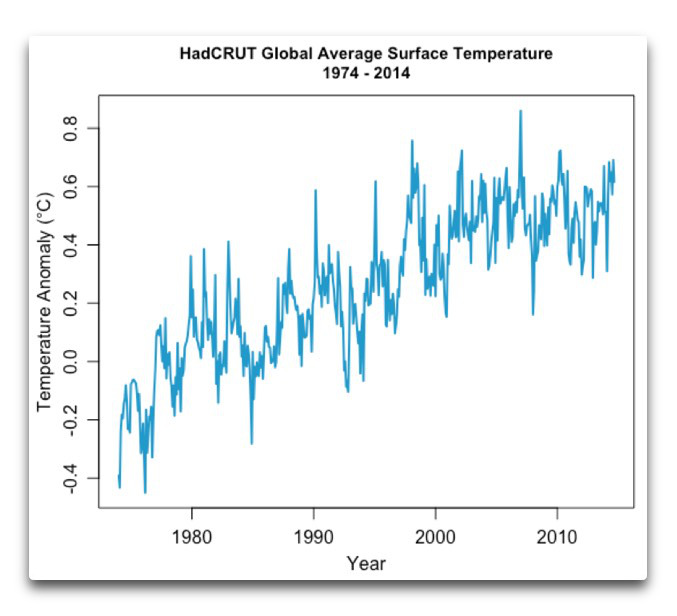
One feels compelled to ask why Willis’s global average temperature graph neglects to mention 2015 when he implies that it does?
Here’s an up to date version of one of those that Bill The Frog prepared for us earlier:
We must further assume that Paul hadn’t read this April 11th article by Mr. Watts either. It stated that:
A few years ago in 2009, I was the first to notice and write about a failure of the instrumentation for one of the satellites used by the National Snow and Ice Data Center (NSIDC) to show Arctic Sea Ice extent. Today, we have what appears to be a similar problem with satellite sea ice measurement.
It seems that Paul Dorian has finally read at least one out of all these informative articles, because the latest revision of his own piece of imaginative fiction now starts:
The source of global sea ice information cited in this posting was NOAA’s National Snow and Ice Data Center (NSIDC). They are now reporting issues with the satellite data used to produce these images and this information was not known at the time of the writing of this article.
Do you suppose we can now expect a similarly “fulsome apology” from the other players in this tragi-comic farce, together with all their rebloggers, retweeters, plagiarisers and other assorted acolytes?
Skeptical sorts across the cryoblogosphere are in meltdown mode at the moment. They seem to be unaware that satellites don’t last forever in the harsh environment of space, and the individual scientific instruments carried by a satellite don’t either. Some failures are more spectacular than others however. By way of illustration here’s one recent report from Space.com:
The February [2015] explosion of an American military satellite may cause some problems for orbiting spacecraft after all, a new study reports.
The U.S. Air Force’s 20-year-old Defense Meteorological Satellite Program Flight 13 (DMSP-F13) craft blew apart on Feb. 3 after experiencing a power-system faillure. Analyses by the European Space Agency and other organizations found that the cloud of space junk generated by the explosion shouldn’t pose much of a threat to their missions, but the new research suggests that not all spacecraft are in the clear.
Another DMSP satellite started pushing up the metaphorical daisies earlier this year. Last month Space Flight Now reported that:
The U.S. Air Force has been unable to send commands to the service’s newest weather satellite for nearly a month, and engineers are trying to determine if the spacecraft can be salvaged, officials said last week.
The polar-orbiting Defense Meteorological Satellite Program Flight 19, or DMSP F19, spacecraft stopped responding to orders from the ground Feb. 11, the Air Force said in a March 3 press release.
“At this time, it is not known what caused the anomaly or if the satellite will be recovered, and the anomaly is under investigation,” the Air Force said. “There are no other known issues with the satellite.”
Designed for a five-year service life, DMSP F19 launched April 3, 2014, from California atop a United Launch Alliance Atlas 5 rocket. It is the newest in the Air Force’s series of DMSP weather observatories designed to help forecasters predict storms, clouds, fog and dust storms that could inhibit global military operations.
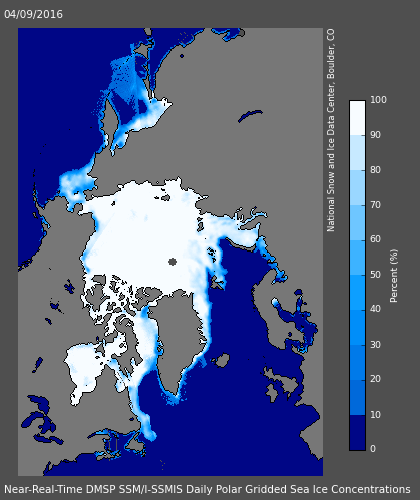
The data provided by the Special Sensor Microwave Imager/Sounder (SSMIS) instrument carried aboard several of the DMSP series of satellites is used by the National Snow and Ice Data Center to calculate their Sea Ice Index metric of Arctic sea ice extent. However suddenly Boulder has a problem. As we reported earlier this week the SSMIS sensor carried by DMSP F17 appears to be malfunctioning. This can be seen in this visualisation of the data from the European Ocean and Sea Ice Satellite Application Facility(OSI-SAF):
Look closely at the top centre of the image to see a large patch of spurious “sea ice”. Here’s the resulting SII extent graph from the NSIDC:
Anthony Watts reported this news in typically fanciful fashion:
There is this small notice on the NSIDC page:
“The daily sea ice extent images are currently displaying erroneous data. NSIDC is investigating.”
It looks to be a problem with the DMSP F17 satellite.
Makes you wonder how long this has been going on and if the anomalously low readings we’ve seen for awhile are due to a slow sensor degradation.
Time will tell.
For a more realistic interpretation of the facts we suggest that instead of reading the propaganda perpetrated at WUWT you instead examine this graph derived using data from the AMSR2 sensor on board the Japanese SHIZUKU satellite:
Mr. Watts evidently takes a very US centric view of these matters, since he neglected to report this timely news bulletin from the OSI-SAF:
Due to the previously reported problems with one of the channels on SSMIS onboard DMSP F17, OSI SAF is now working on replacing DMSP F17 with DMSP F18 in our sea ice products.
Currently, the switch to F18 has been implemented for the ice concentration product (OSI-401). The product dated 20160410 has been reprocessed and is available on our FTP server, ftp://osisaf.met.no/prod/ice/conc/ and ftp://osisaf.met.no/archive/ice/conc/2016/04
The ice edge and type products (OSI-402 and OSI-403) will be updated to use F18 tomorrow, 2016-04-12.
It seems Willis Eschenbach, the current Watts Up With That resident sea ice expert, is already beavering away endeavouring to prove Anthony’s case for him:
We have no way to know if this has been a gradual decrease followed by a failure, so yes, it’s certainly possible that the previous data is bad. Doesn’t mean it is, but we’d be fools not to check.
We suggested a simple check:
Why not compare the NSIDC’s SSMIS data from F-17 with JAXA’s AMSR2 data from Shizuku? Wouldn’t that do the trick?
Willis replied:
I meant that just from the bad reading alone, we don’t know if the previous data is bad. Yes, we can check it in the way you suggest and other ways … which is why I said we’d be fools not to check.
We think that if he does his due diligence he will find that he is in actual fact engaged on a fool’s errand, but time will indeed tell. Let’s wait and see what Willis n Willard can come up with, shall we? Meanwhile we also cannot help but wonder what the dynamic duo might make of our own due diligence replicating the results of another collaboration of theirs:
As our regular reader(s) will be aware, Anthony Watts has been plagiarising our content and republishing it on his “Watts Up With That” blog. In a perplexing perversity he has also been refusing to publish content that we have happily contributed to the self same blog. Hence we have taken the liberty of basing our title for today on a recent WUWT guest post by Willis Eschenbach entitled:
Here’s what Willis had to say at the end of his article:
My Usual Request: Misunderstandings are the curse of the internet. If you disagree with me or anyone, please quote the exact words you disagree with, so we can all understand the exact nature of your objections. I can defend my own words. I cannot defend someone else’s interpretation of some unidentified words of mine.
My Other Request: If you believe that e.g. I’m using a method wrong or using the wrong dataset, please educate me and others by demonstrating the proper use of the method or the right dataset. Simply claiming I’m wrong about methods doesn’t advance the discussion unless you can point us to the right way to do it.
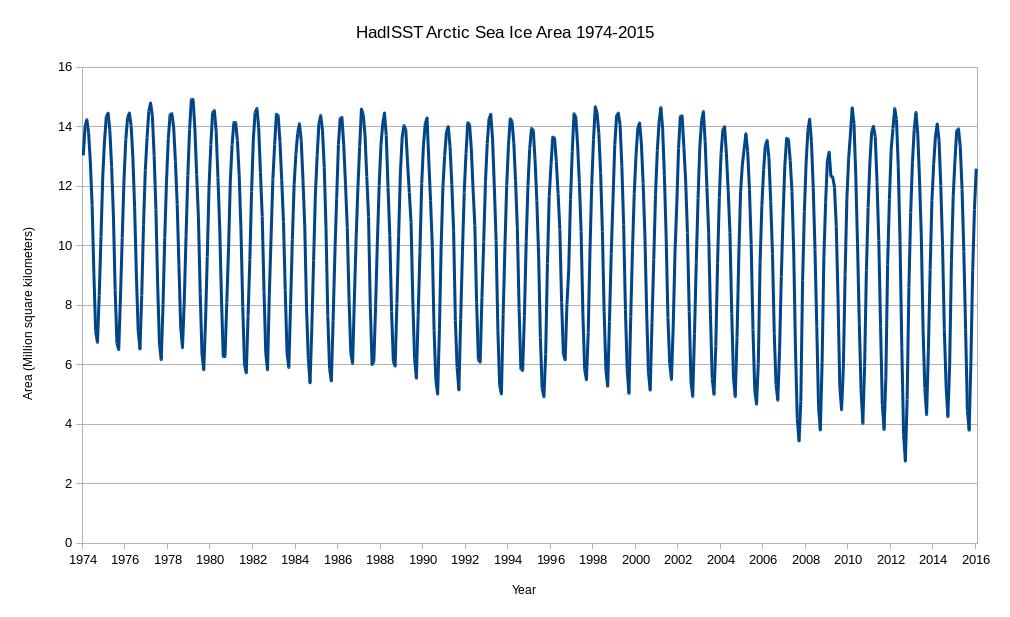
Data: The Hadley HadISST ice (and sea surface temperature) data is available here. I used the NetCDF file HadISST_ice.nc.gz (~15Mb) at the bottom of the page.
and here’s a copy of our still invisible comment:
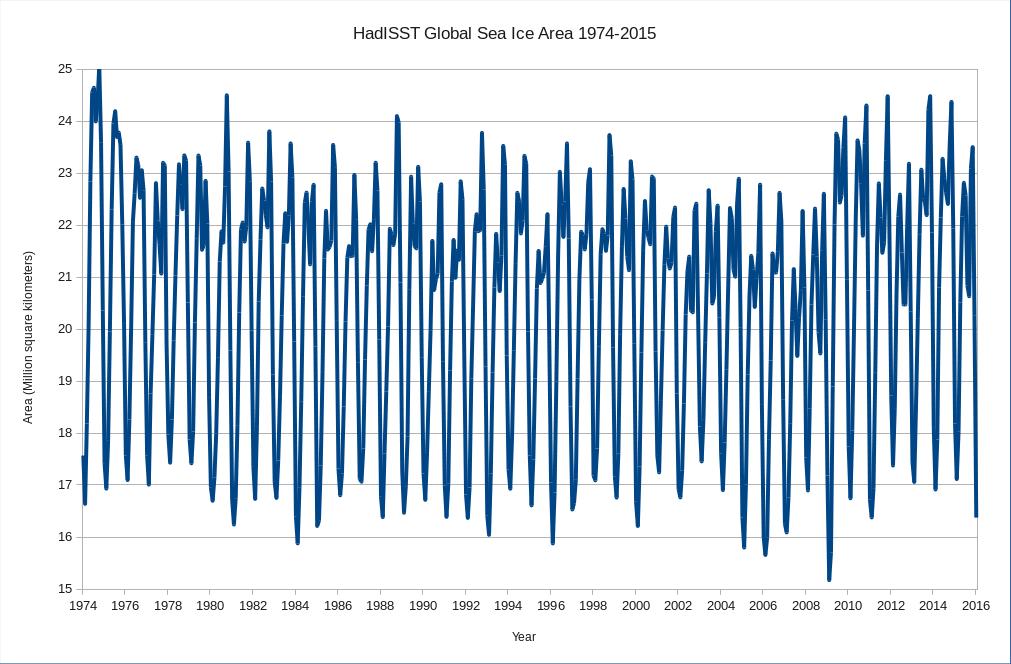
Epitomising the indomitable spirit of scientific skepticism we set out to duplicate the results obtained by Mr. Eschenbach and answer our own question as well as his. Here is what we’ve discovered. Firstly global sea ice area since 1974:
and then Arctic sea ice area since 1974:
Now as our very own learned guest poster Bill The Frog all too briefly pointed out to Willis Eschenbach on April 7th:
Ignoring Bill’s helpful hint Willis concluded that:
We’re pretty sure that the global average surface temperature increased from the mid-1970s to about 1998. However, we see no sign of this in the global sea ice area data. Instead, ice area remained stable throughout the 1980s and the 1990s, while temperatures climbed:
Next, we’re also pretty sure that there was no significant change in the global average temperature from about 1998 to 2015, the end of the ice data. Despite that, starting in 2000 the ice area first dipped to a low in about 2007, and since then has been climbing rapidly.
This supports a curious conclusion, which is that in modern times at least, the global sea ice area is not particularly a function of the global average surface temperature. Go figure…
Now that we’re in possession of all this newly revealed data about historical sea ice area and censorship in the cryospheric blogosphere what should we “go figure”? Firstly one feels compelled to ask why Willis’s global average temperature graph neglects to mention 2015 when he implies that it does?
Should you figure anything else please free to answer our query on a virtual postcard, in the space provided for that purpose below. You may additionally like to vent your feelings concerning this controversial cover-up of our changing climate over on Twitter using the #SnipGate hashtag.
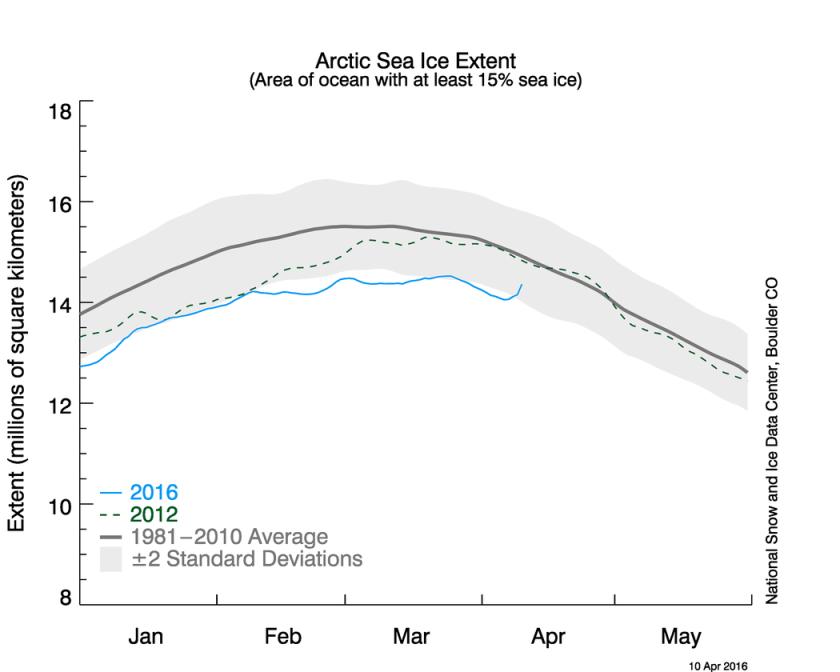
In the latest edition of their “Arctic Sea Ice News” the United States’ National Snow and Ice Data Center have announced that:
Arctic sea ice appears to have reached its annual maximum extent on March 24, and is now the lowest maximum in the satellite record, replacing last year’s record low. This year’s maximum extent occurred later than average. A late season surge in ice growth is still possible. NSIDC will post a detailed analysis of the 2015 to 2016 winter sea ice conditions in early April.
On March 24, 2016, Arctic sea ice likely reached its maximum extent for the year, at 14.52 million square kilometers (5.607 million square miles). This year’s maximum ice extent was the lowest in the satellite record, with below-average ice conditions everywhere except in the Labrador Sea, Baffin Bay, and Hudson Bay. The maximum extent is 1.12 million square kilometers (431,000 square miles) below the 1981 to 2010 average of 15.64 million square kilometers (6.04 million square miles) and 13,000 square kilometers (5,000 square miles) below the previous lowest maximum that occurred last year. This year’s maximum occurred twelve days later than the 1981 to 2010 average date of March 12. The date of the maximum has varied considerably over the years, occurring as early as February 24 in 1996 and as late as April 2 in 2010.
NASA’s Goddard Space Flight Center has also made a similar announcement, which includes this video:
The new record low follows record high temperatures in December, January and February around the globe and in the Arctic. The atmospheric warmth probably contributed to this lowest maximum extent, with air temperatures up to 10 degrees Fahrenheit above average at the edges of the ice pack where sea ice is thin, said Walt Meier, a sea ice scientist at NASA’s Goddard Space Flight Center in Greenbelt, Maryland.
The wind patterns in the Arctic during January and February were also unfavorable to ice growth because they brought warm air from the south and prevented expansion of the ice cover. But ultimately, what will likely play a bigger role in the future trend of Arctic maximum extents is warming ocean waters, Meier said.
“It is likely that we’re going to keep seeing smaller wintertime maximums in the future because in addition to a warmer atmosphere, the ocean has also warmed up. That warmer ocean will not let the ice edge expand as far south as it used to,” Meier said. “Although the maximum reach of the sea ice can vary a lot each year depending on winter weather conditions, we’re seeing a significant downward trend, and that’s ultimately related to the warming atmosphere and oceans.” Since 1979, that trend has led to a loss of 620,000 square miles of winter sea ice cover, an area more than twice the size of Texas.
This year’s record low sea ice maximum extent will not necessarily result in a subsequent record low summertime minimum extent, Meier said. Summer weather conditions have a larger impact than the extent of the winter maximum in the outcome of each year’s melt season; warm temperatures and summer storms make the ice melt fast, while if a summer is cool, the melt slows down.
Neither NASA or the NSIDC comment on one of the striking things about this winter’s NSIDC extent chart, which has effectively “plateaued” during March 2016 following an initial peak of 14.48 million square kilometers on March 2nd, which was only recently exceeded. This is also illustrated by the JAXA Arctic sea ice extent metric, for which the 2016 maximum was 13.96 million square kilometers on February 29th:
Now that the start of 2016 Arctic sea ice melting season has been called, albeit slightly hesitantly, by the experts at the NSIDC let’s also take a look at Cryosphere Today Arctic sea ice area:
The preliminary peak which we announced on March 16th has also recently been exceeded, but we now feel supremely confident in predicting that the 2016 CT area maximum will be less than 13 million square kilometers for the first time ever in the satellite record.
Thus begins what promises to be a very interesting 2016 Arctic sea ice melting season! As the NSIDC puts it:
There is little correlation between the maximum winter extent and the minimum summer extent—this low maximum does not ensure that this summer will see record low ice conditions. A key factor is the timing of widespread surface melting in the high Arctic. An earlier melt onset is important to the amount of energy absorbed by the ice cover during the summer. If surface melting starts earlier than average, the snow darkens and exposes the ice below earlier, which in turn increases the solar heat input, allowing more ice to melt. With the likelihood that much of the Arctic cover is somewhat thinner due to the warm winter, early surface melting would favor reduced summer ice cover.
Commenter Henry P over on “Steve Goddard’s” (un)Real Science blog poses the following question:
Unfortunately, we do not have any record of ice around 1929. But there was an eyewitness report of the melting of ice around 1923. Noting that Antarctic ice is currently increasing, my question to you Jim is simply this: why do you think that Arctic melt now is more than 87 years ago?
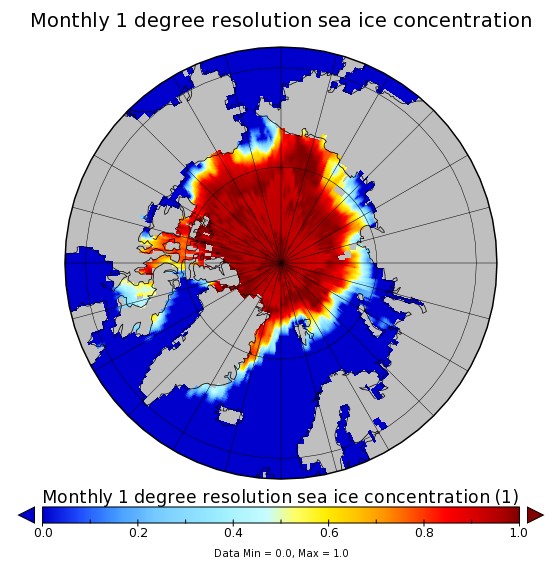
By way of a partial answer to that question, the United Kingdom’s Meteorological Office (Met Office or UKMO for short) maintains the Hadley Centre Sea Ice and Sea Surface Temperature data set (HadISST for short). Unfortunately Henry P is obviously sadly misinformed, since according to the Met Office:
HadISST is a unique combination of monthly globally-complete fields of SST and sea ice concentration on a 1 degree latitude-longitude grid from 1870 to date.
Here is what the HadISST data set reveals for September 1929:
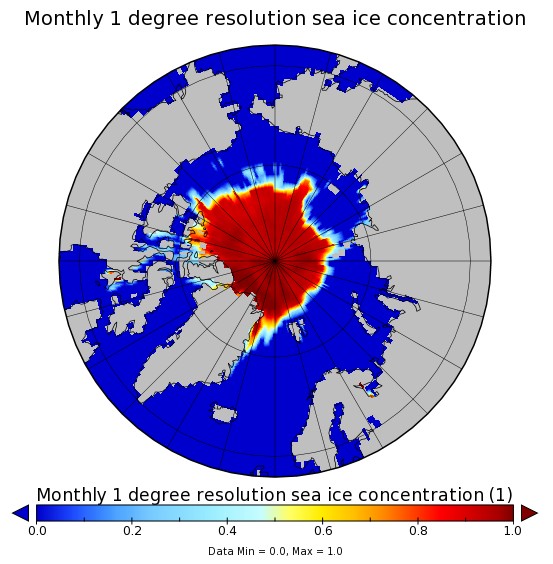
compared to September 2015:
Surely a working pair of Mark 1 eyeballs should be sufficient to allow even a dyed in the wool denizen of (un)Real Science to spot the difference?
With apologies to O’Reilly Media Inc. here’s a brief history of the “DMIGate” story, viewed through Anthony Watts’ distorting spectacle lenses.
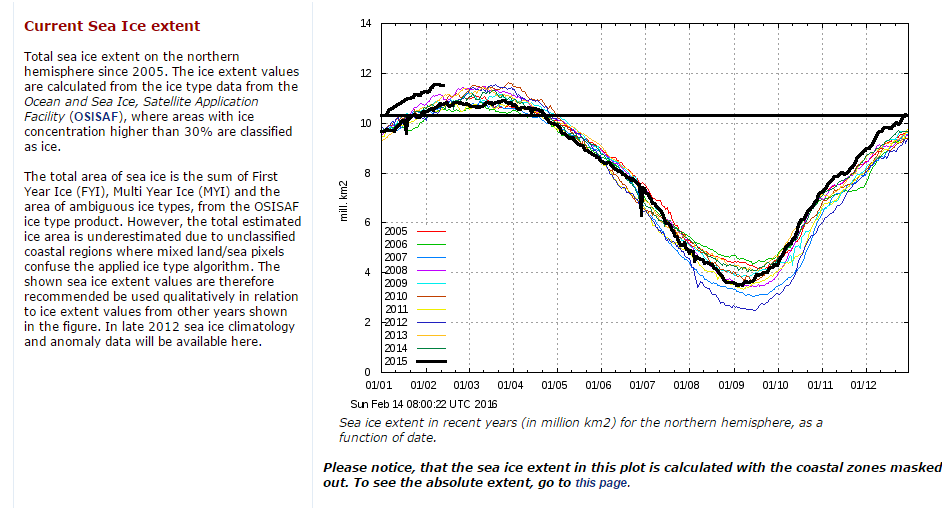
0) Here is the February 14th 2016 edition of the Danish Meteorological Institutes’s long “deprecated” 30% concentration threshold Arctic sea ice extent graph in question:
1) On August 14th 2013 Anthony Watts wrote on his “Watts Up With That” blog:
There has been so much skulduggery going on in the climate establishment in recent years that it is hard to avoid the conclusion that this graph has been withdrawn simply because it gives the “wrong” results.
3) Anthony Watts refuses to publish any and all comments on his blog pointing out what he himself had confirmed that DMI said in August 2013.
You post off topic or disrupt threads with the sort of unsubstantiated nonsense you post above, and both demand to have these off topic comments heard and then play the “look Watts is censoring me!” game when your comments don’t meet our site comment policy and/or are abusive in nature.
David – Are you suffering from acute snow blindness too, just like poor Paul Homewood? Try reading this if you haven’t already. Try reading it again if you have:
In view of the incontrovertible evidence why would anyone believe anything Paul Homewood, Anthony Watts and Judith Curry claim about “Climate Etc.” ever again?
This website uses cookies to improve your experience. We'll assume you're ok with this, but you can opt-out if you wish. Cookie settingsACCEPT
Privacy & Cookies Policy
Privacy Overview
This website uses cookies to improve your experience while you navigate through the website. Out of these, the cookies that are categorized as necessary are stored on your browser as they are essential for the working of basic functionalities of the website. We also use third-party cookies that help us analyze and understand how you use this website. These cookies will be stored in your browser only with your consent. You also have the option to opt-out of these cookies. But opting out of some of these cookies may affect your browsing experience.
Necessary cookies are absolutely essential for the website to function properly. This category only includes cookies that ensures basic functionalities and security features of the website. These cookies do not store any personal information.
Any cookies that may not be particularly necessary for the website to function and is used specifically to collect user personal data via analytics, ads, other embedded contents are termed as non-necessary cookies. It is mandatory to procure user consent prior to running these cookies on your website.