This comes to you a couple of days early, but the clocks have just changed to British Summer Time in the once United Kingdom and there is news to impart.
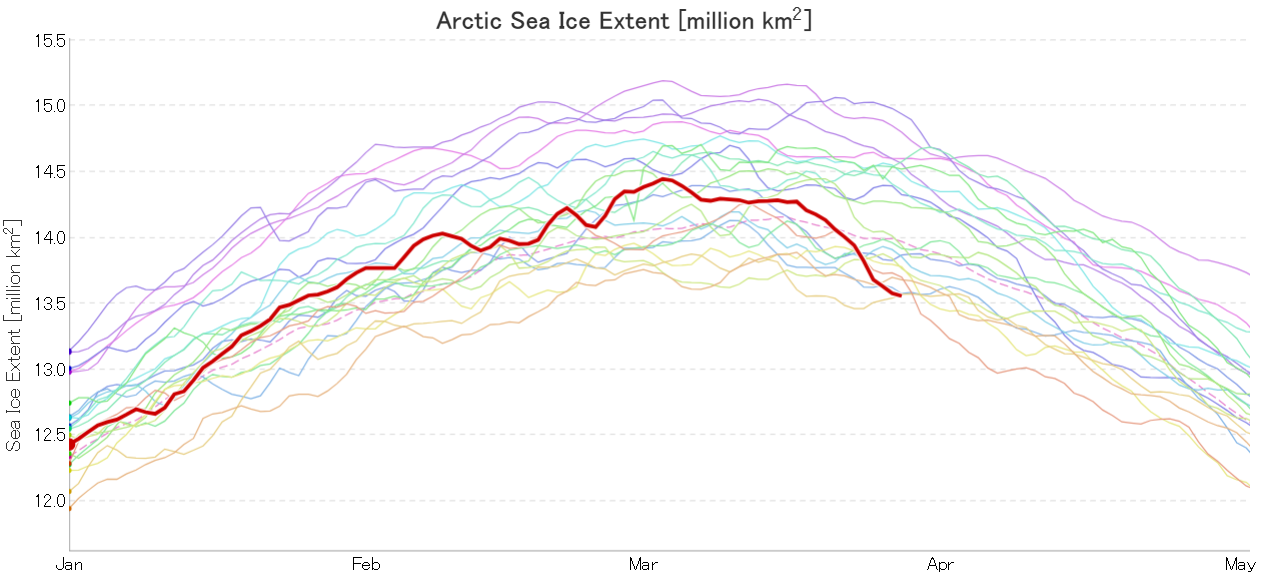
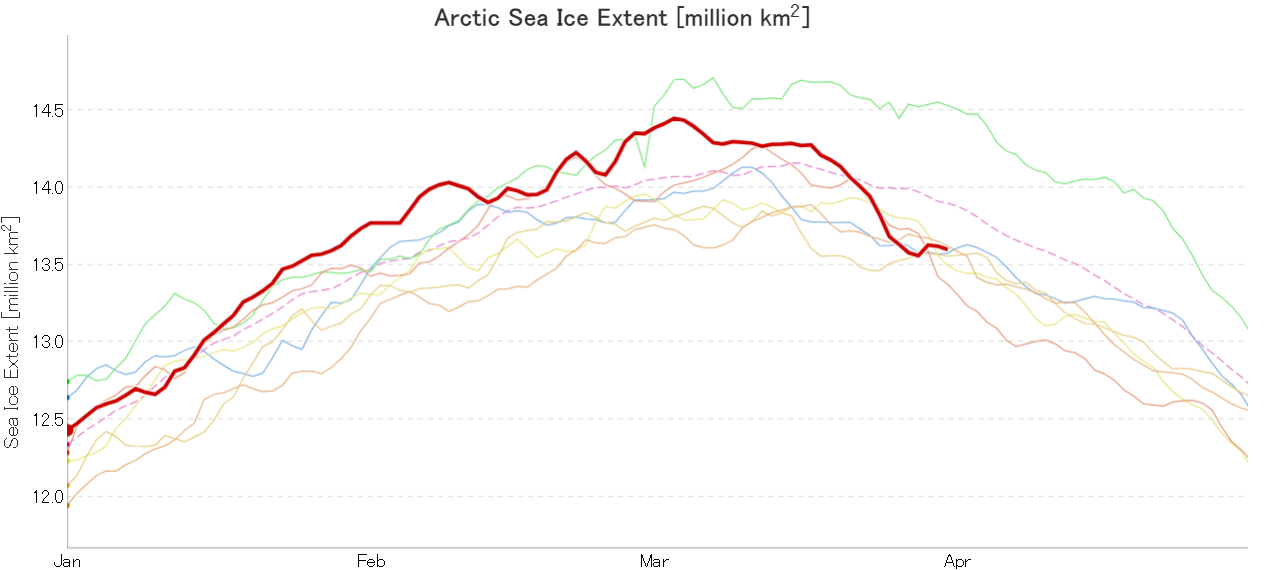
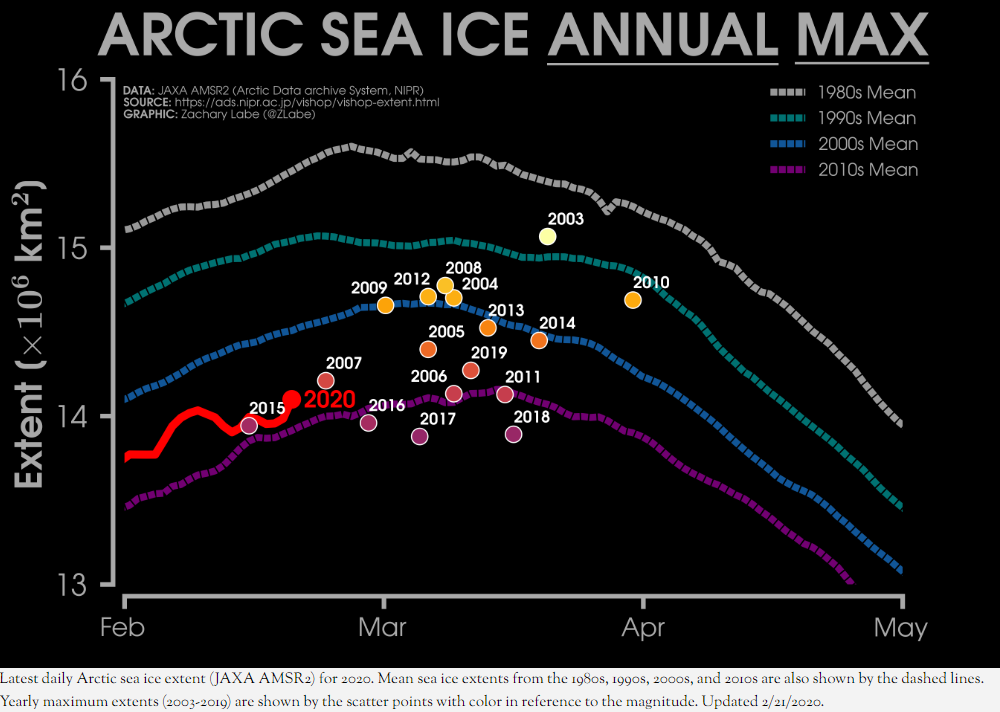
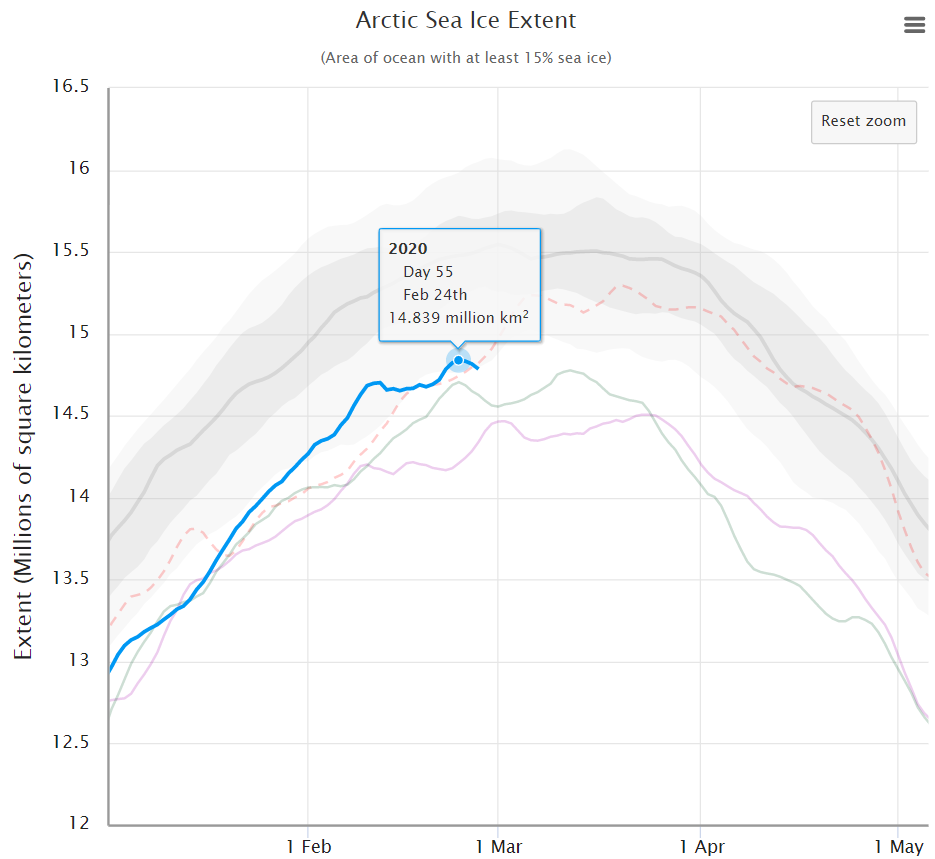
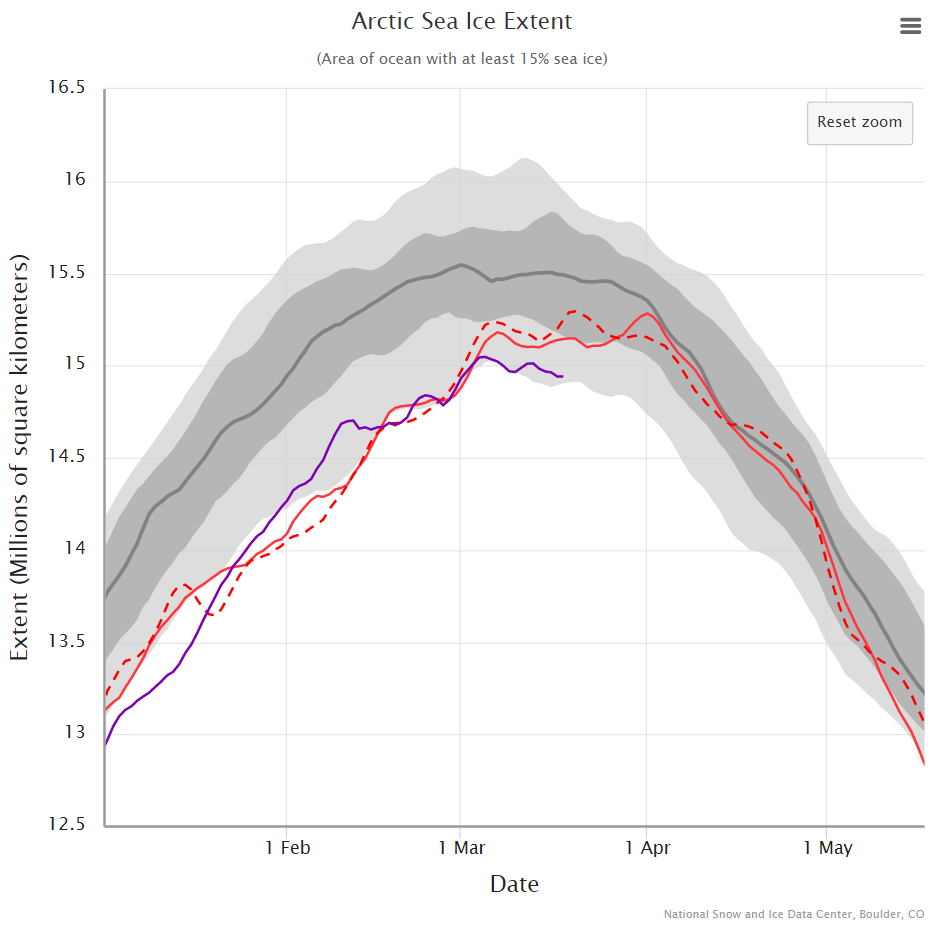
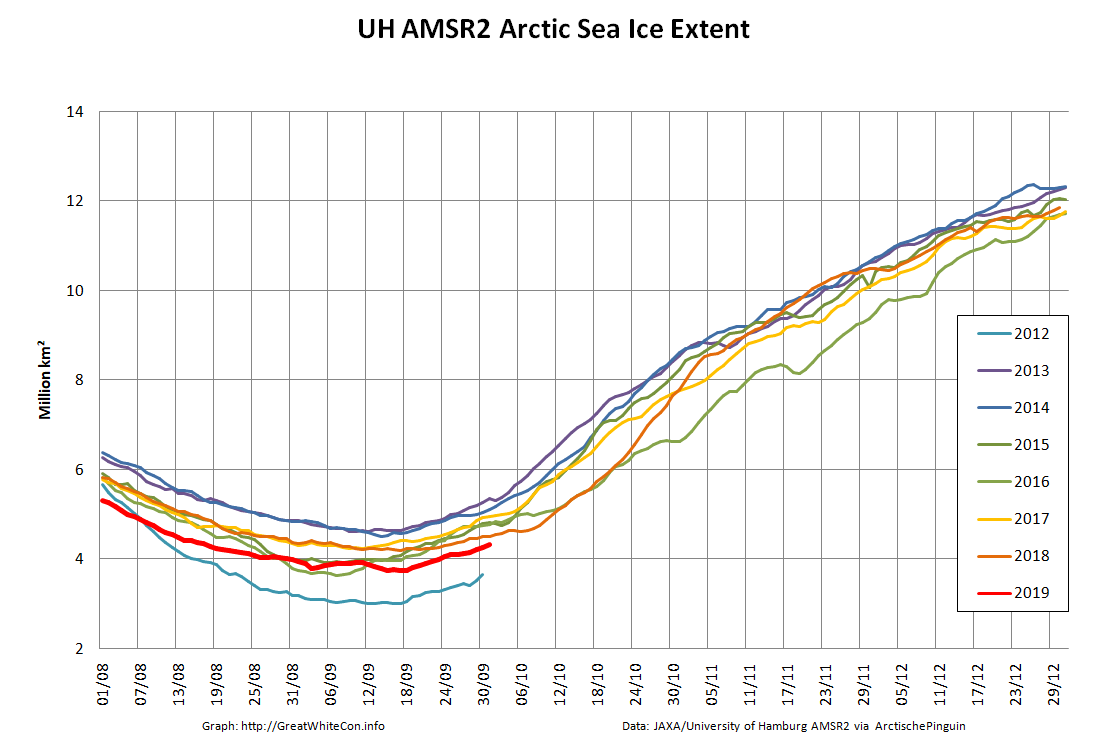
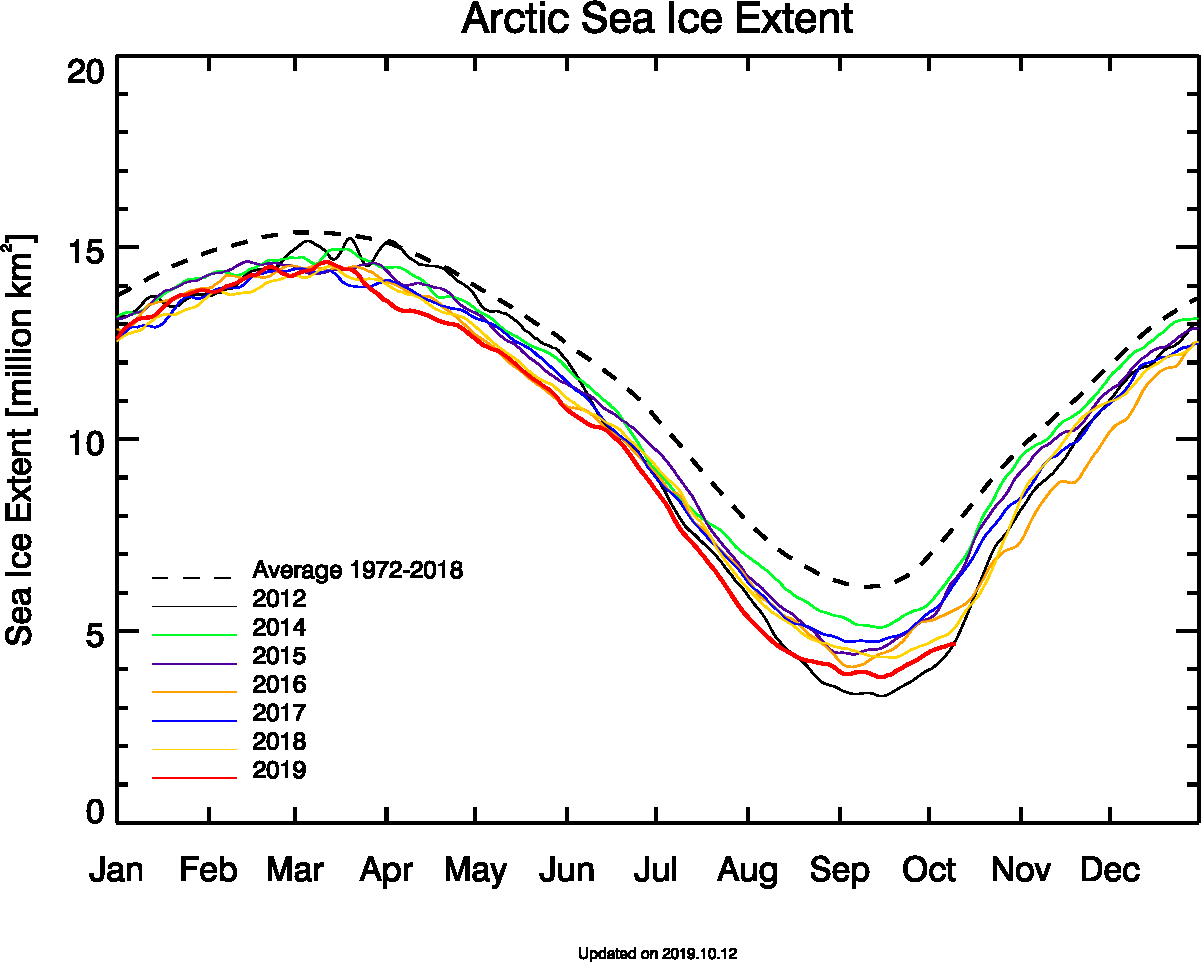
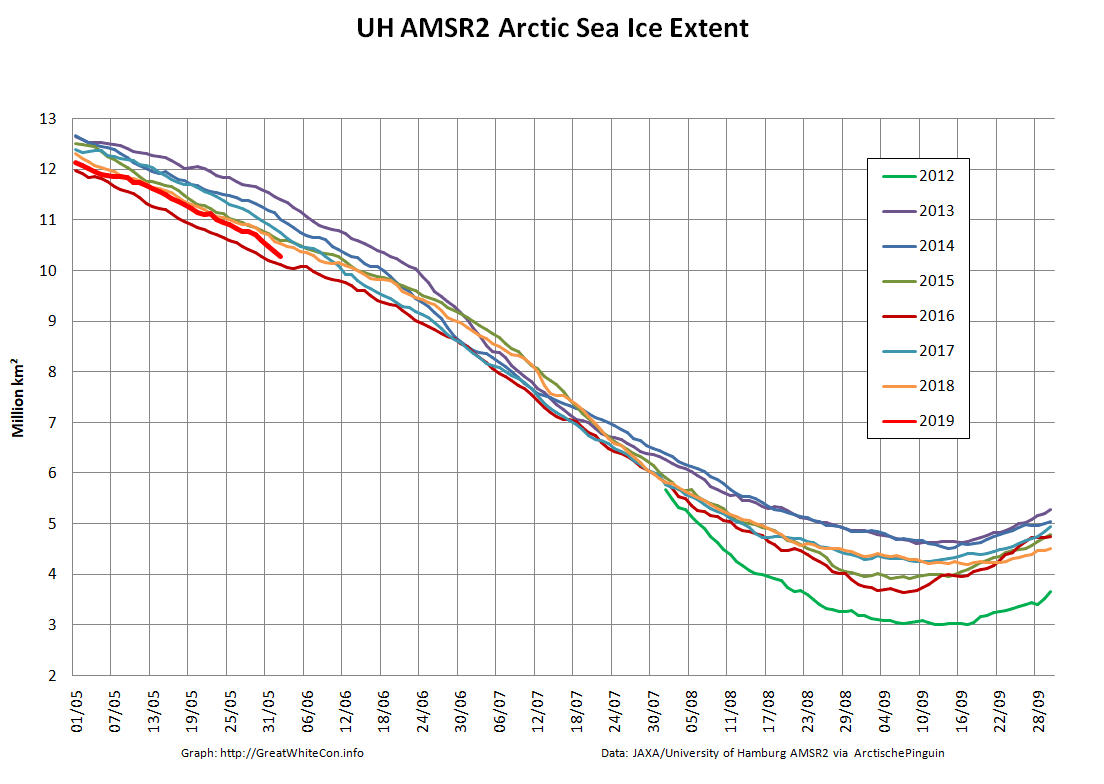
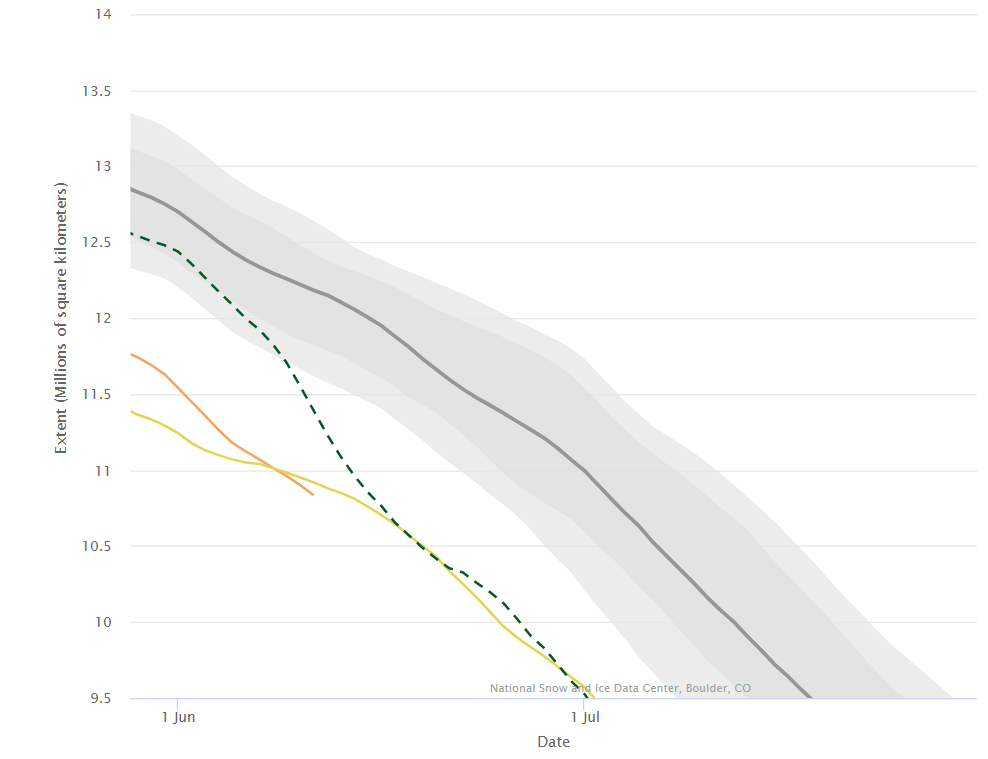
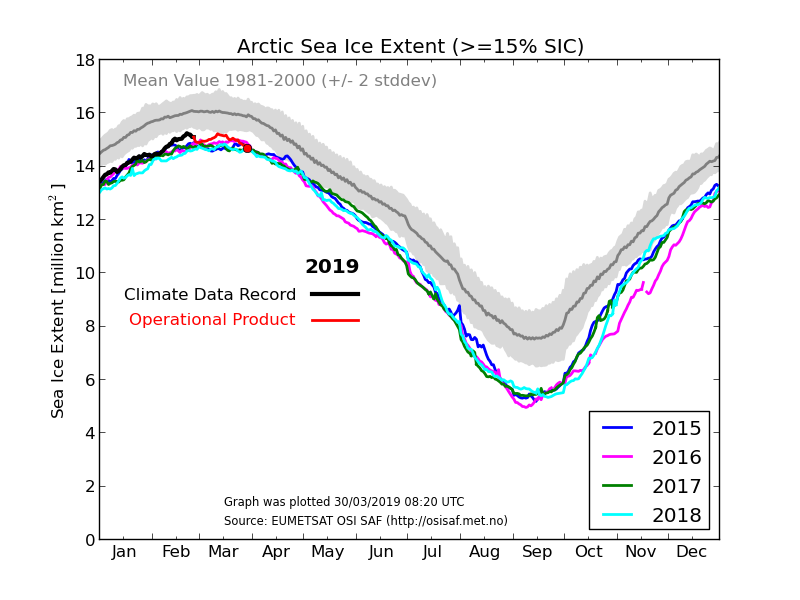
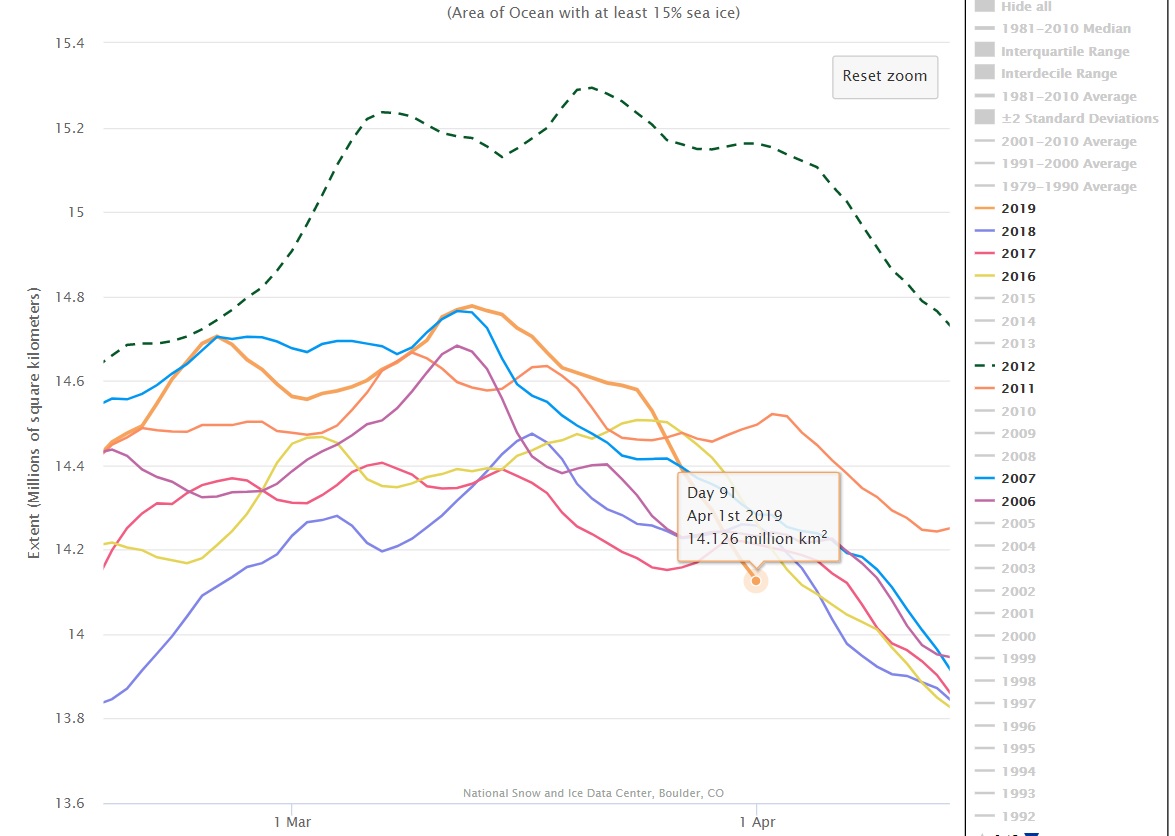
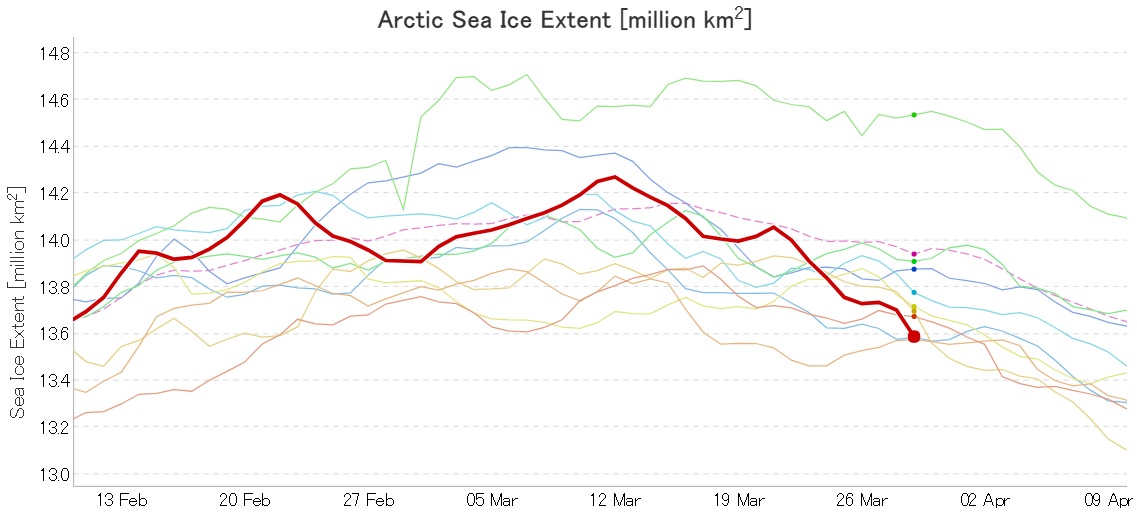
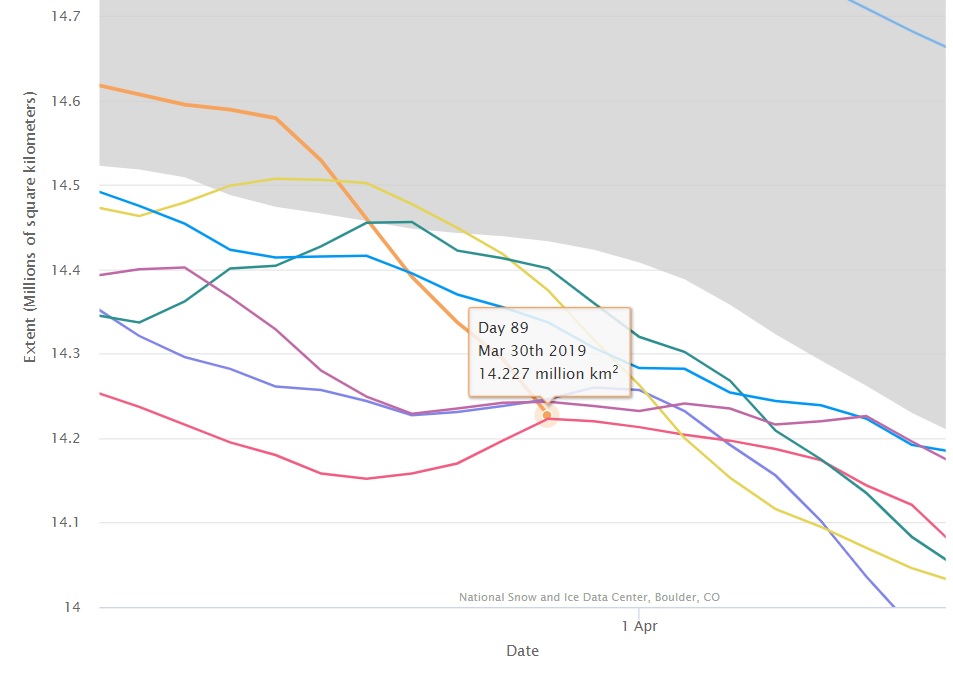
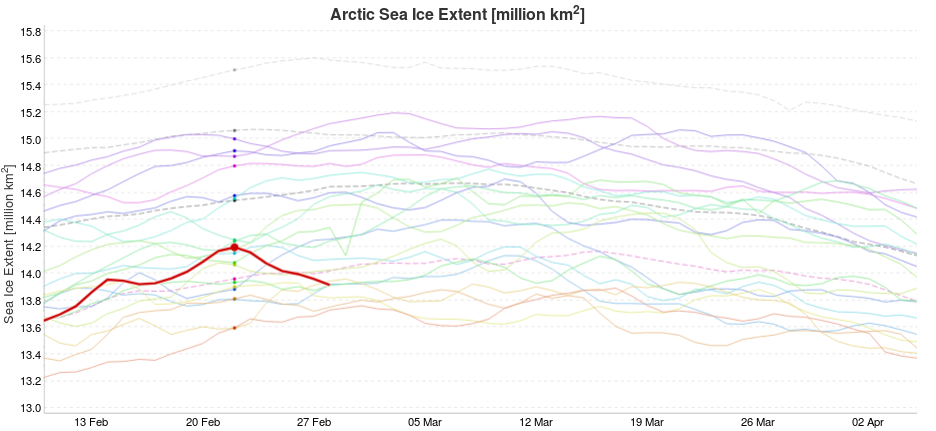
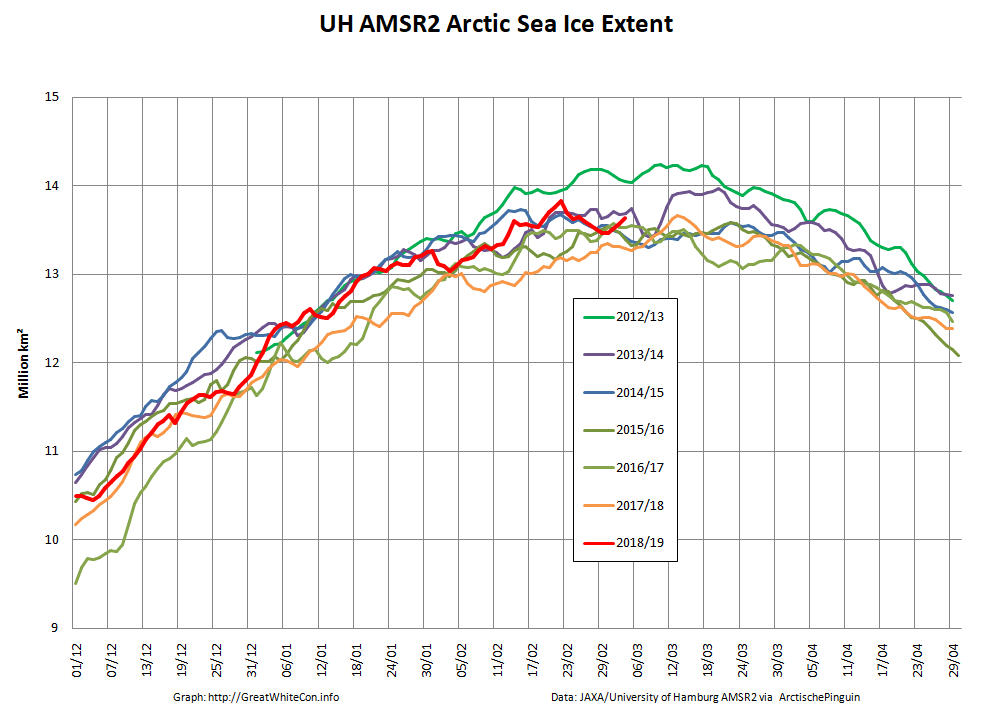
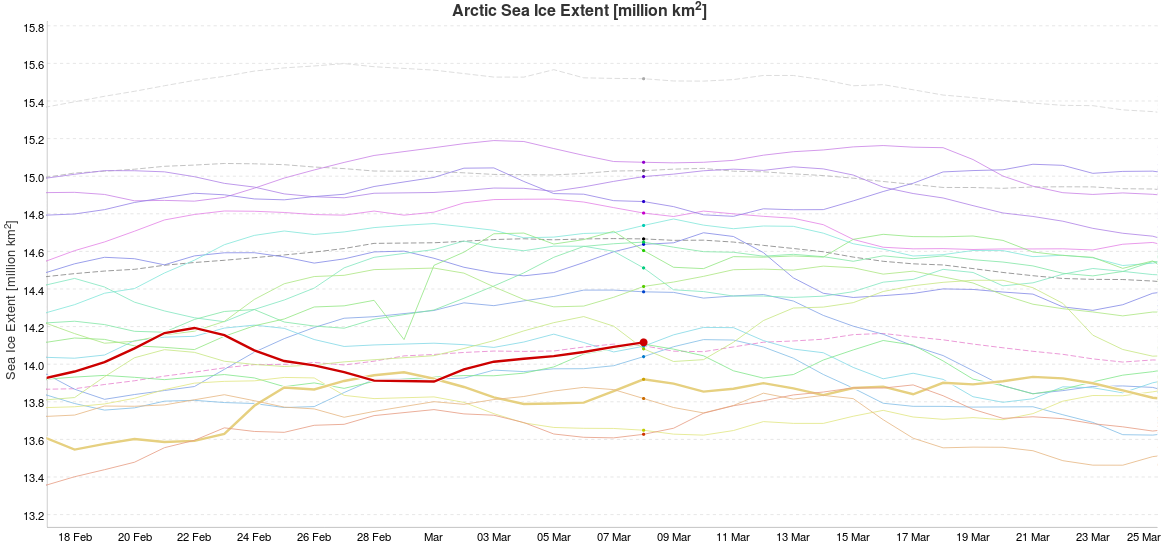
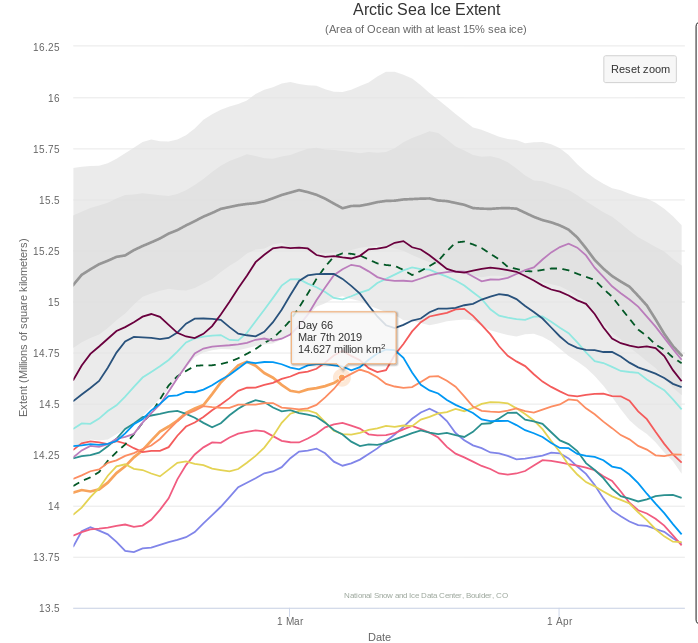
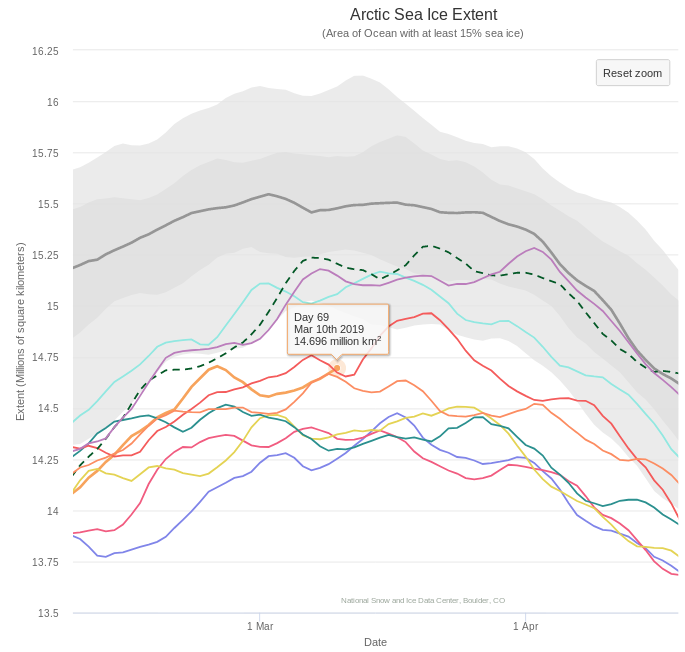
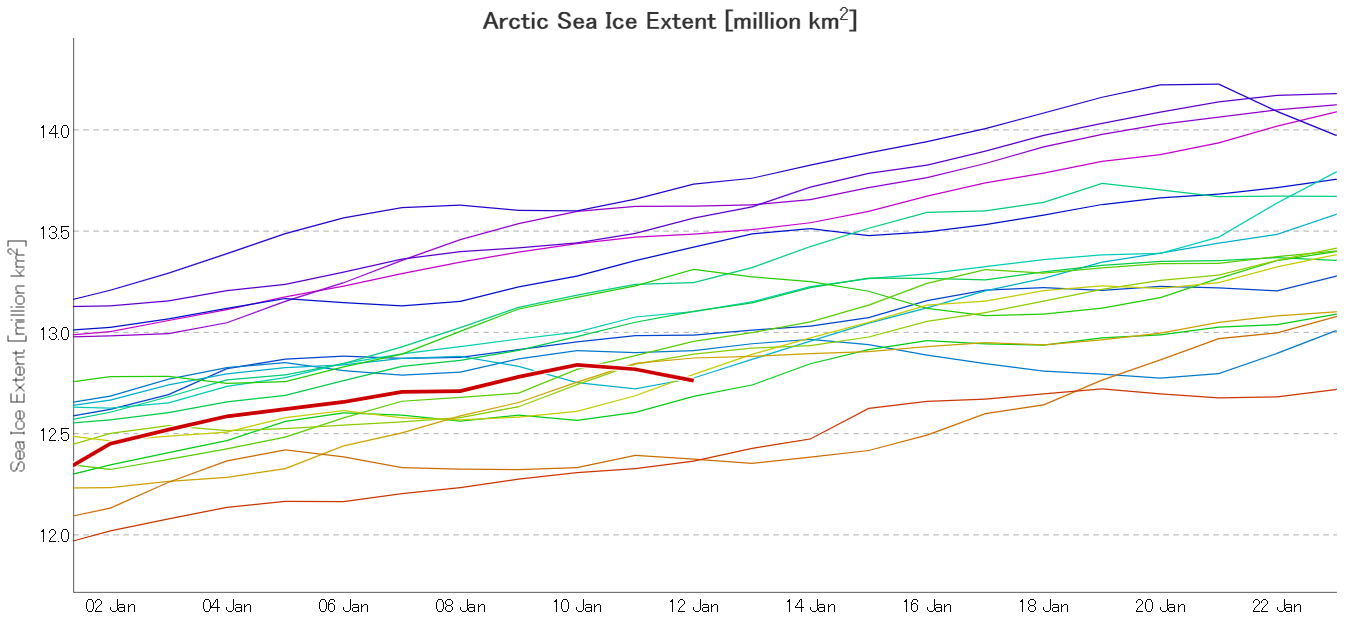
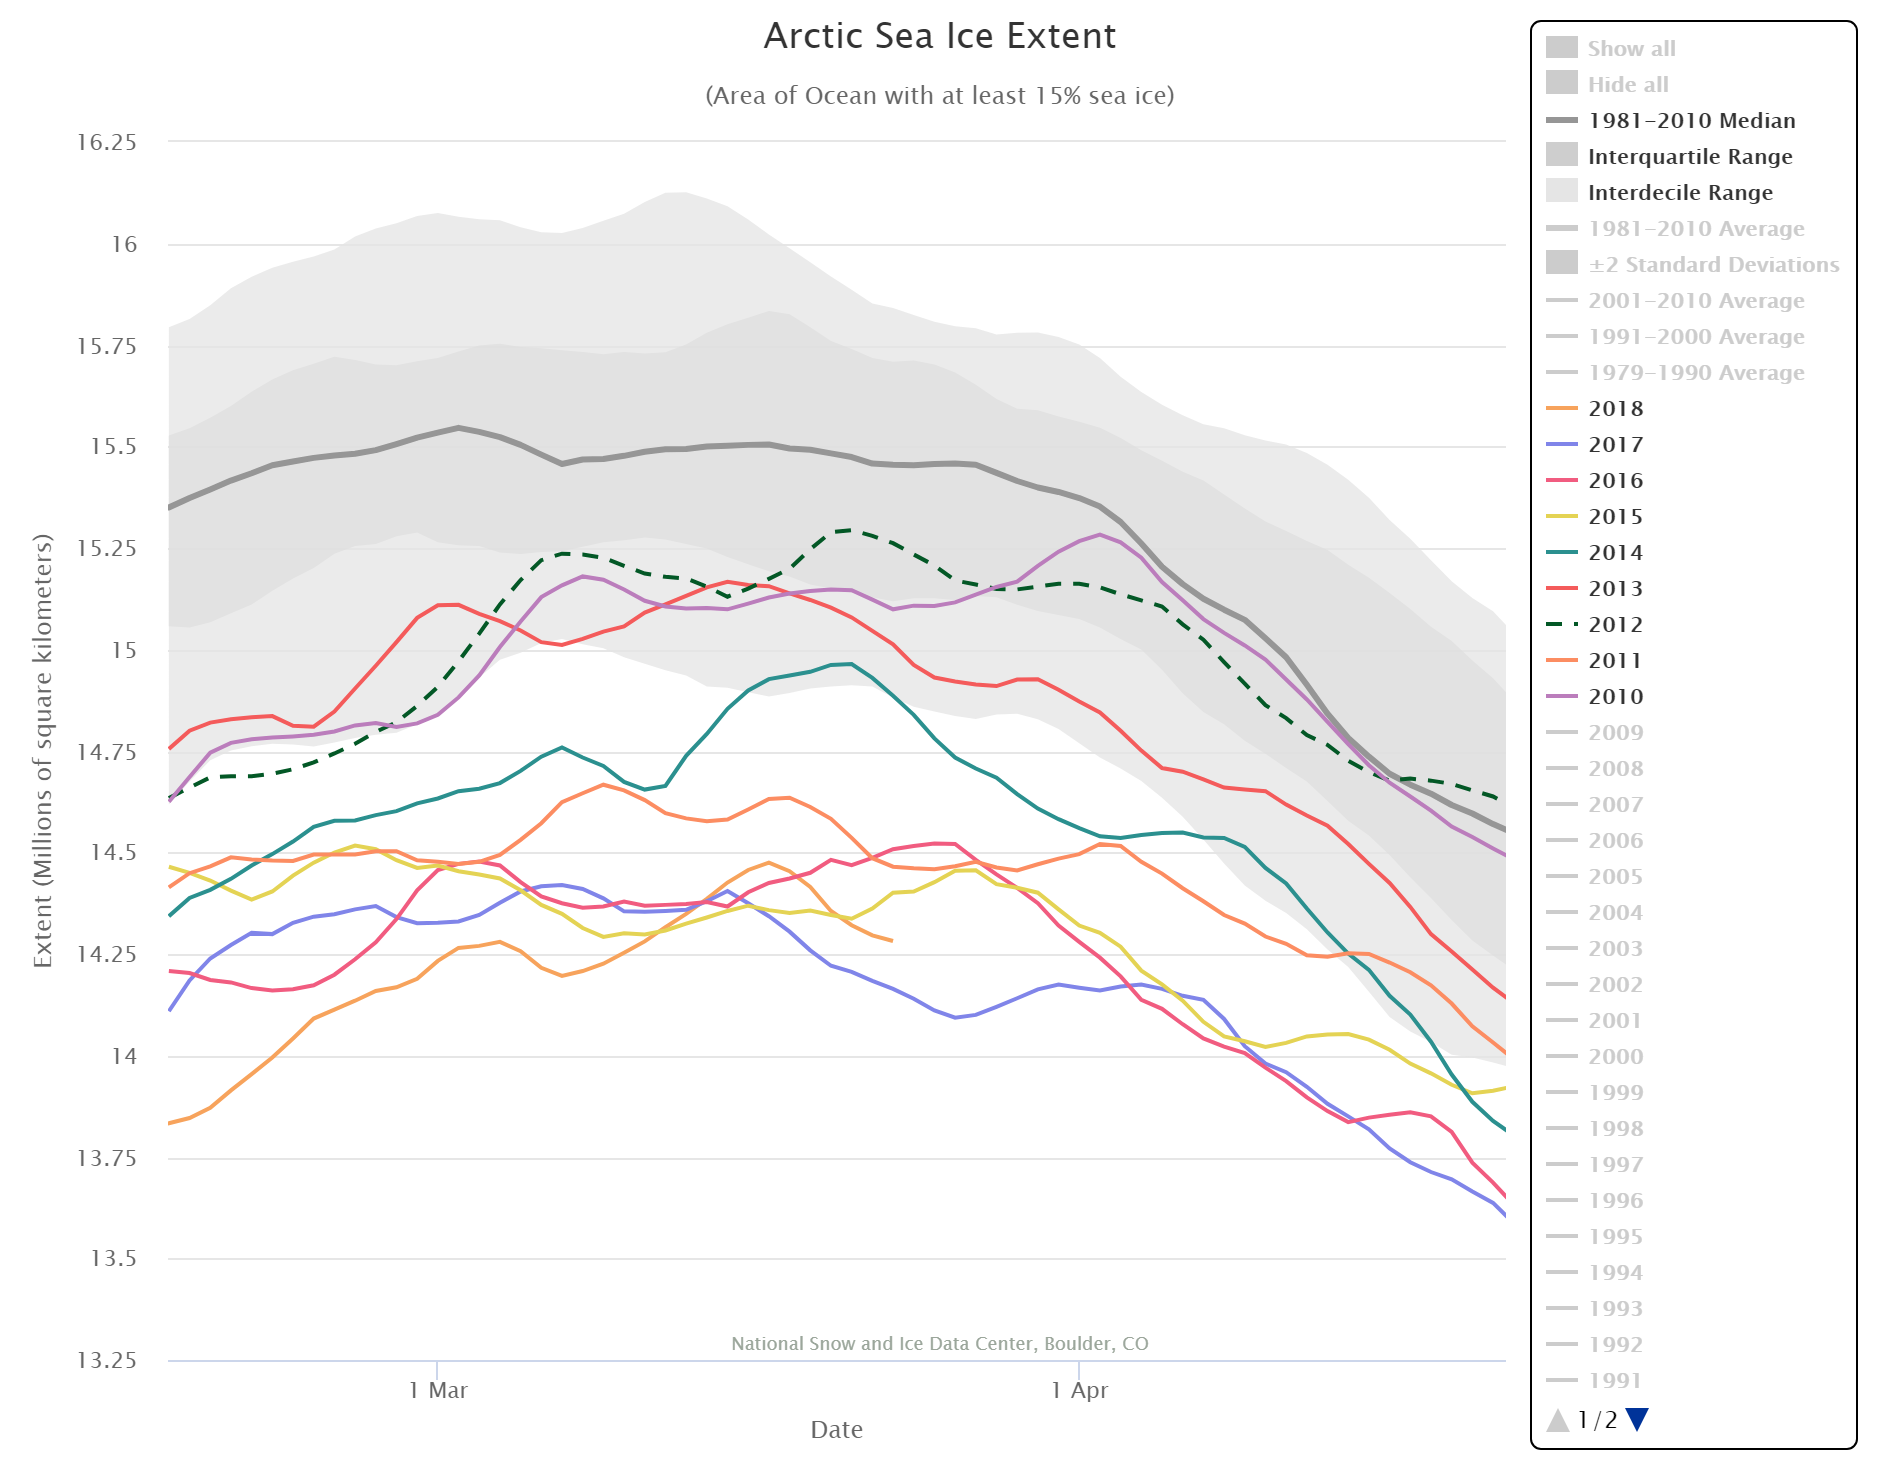
JAXA Arctic sea ice extent has fallen to the lowest level for the date in their satellite era records going back to 1979. This graph shows every year since 2000:
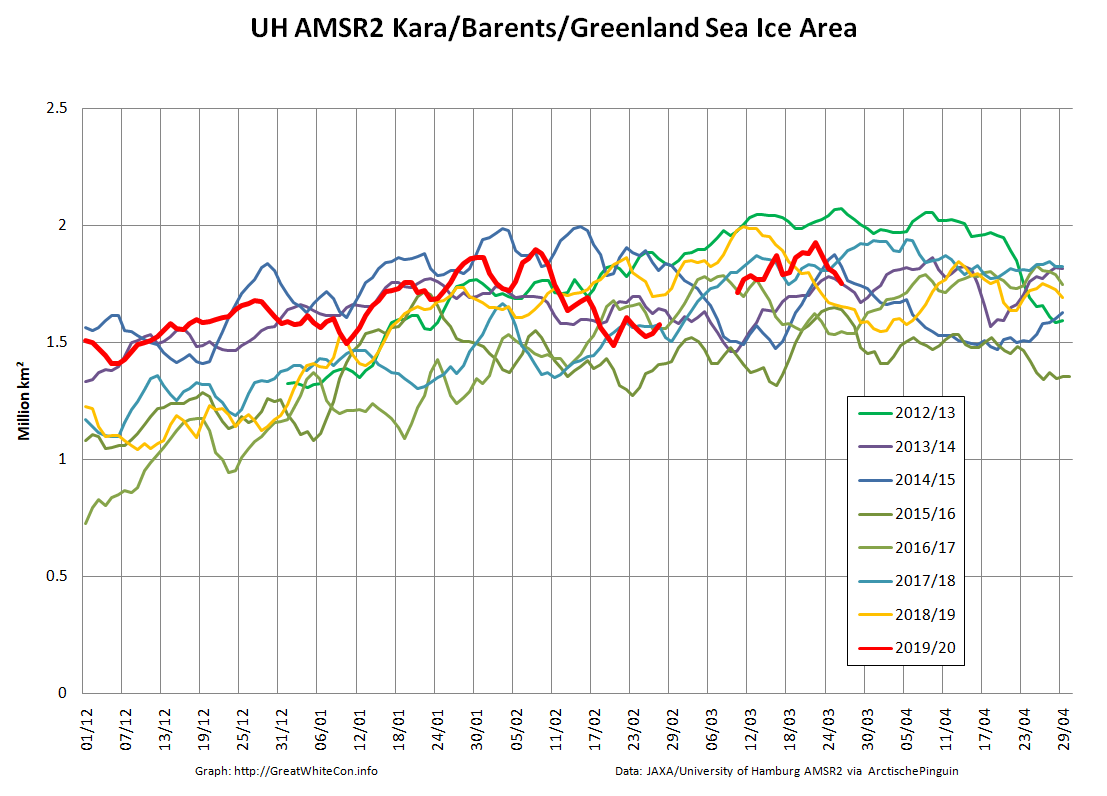
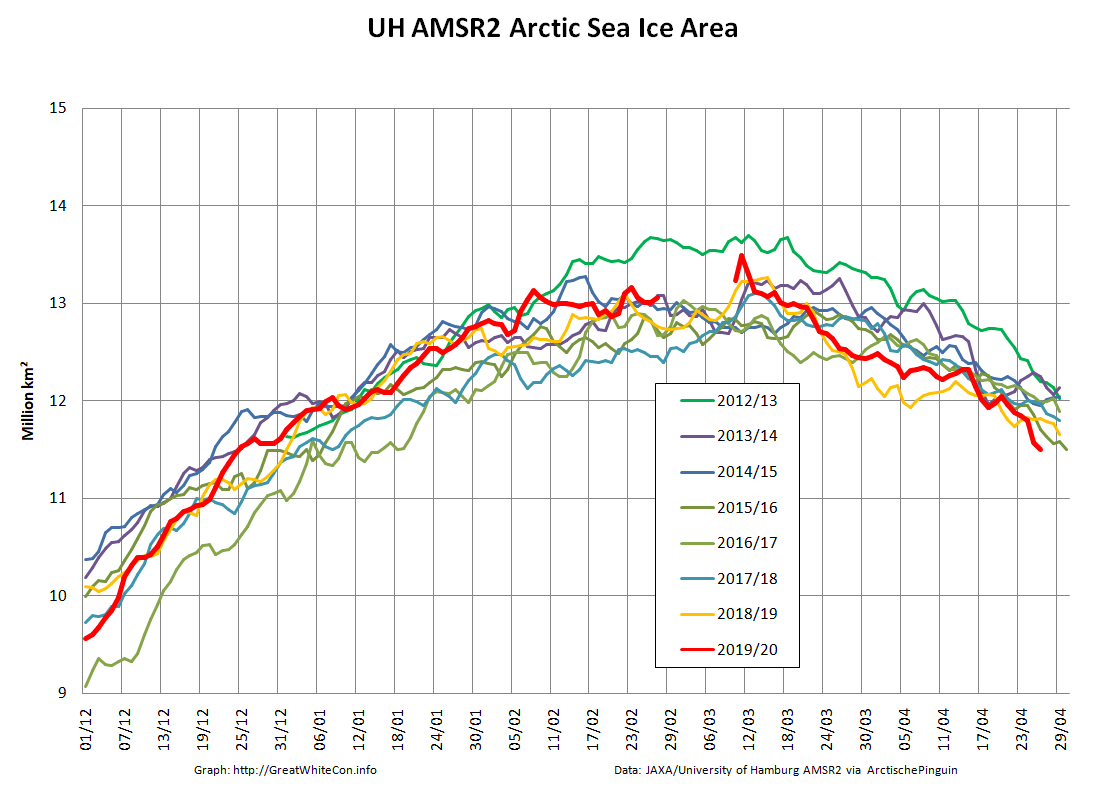
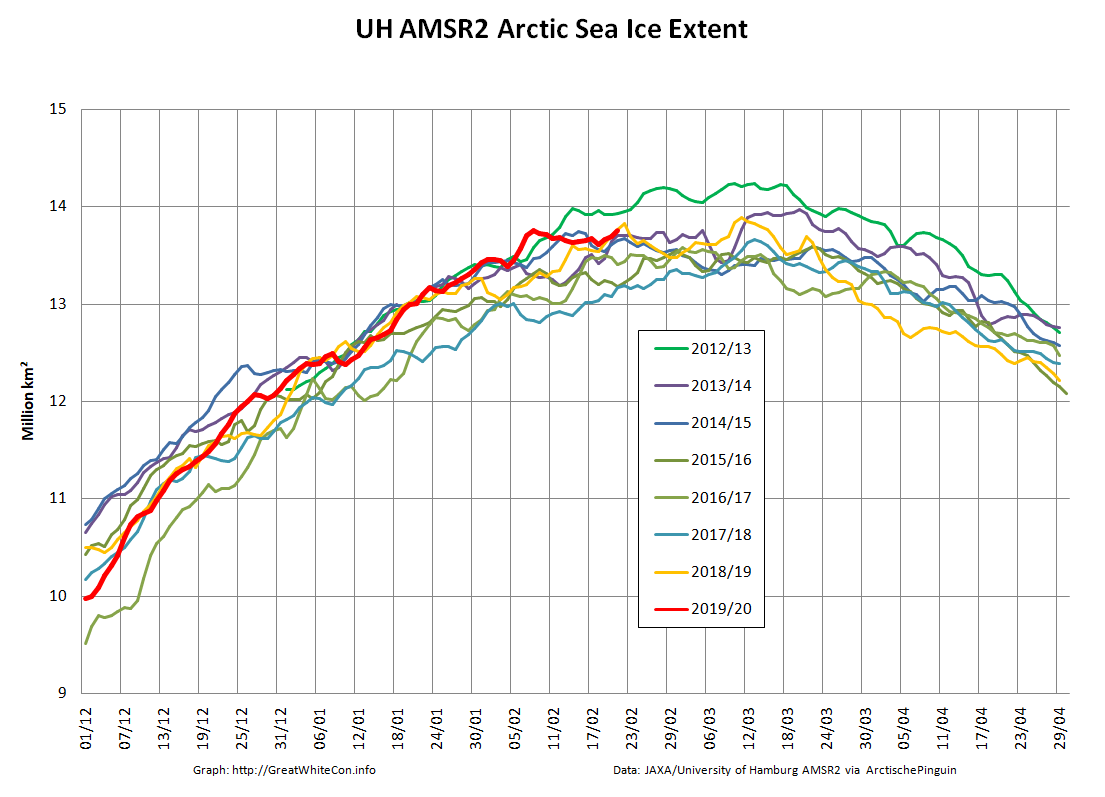
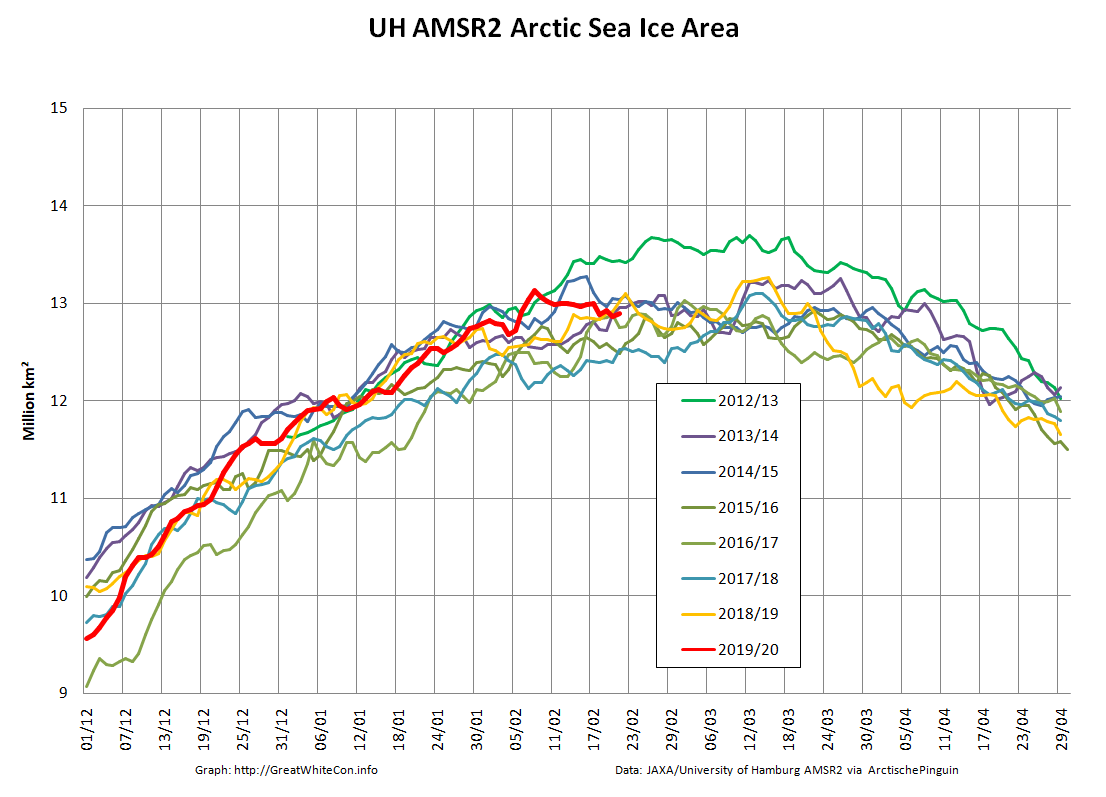
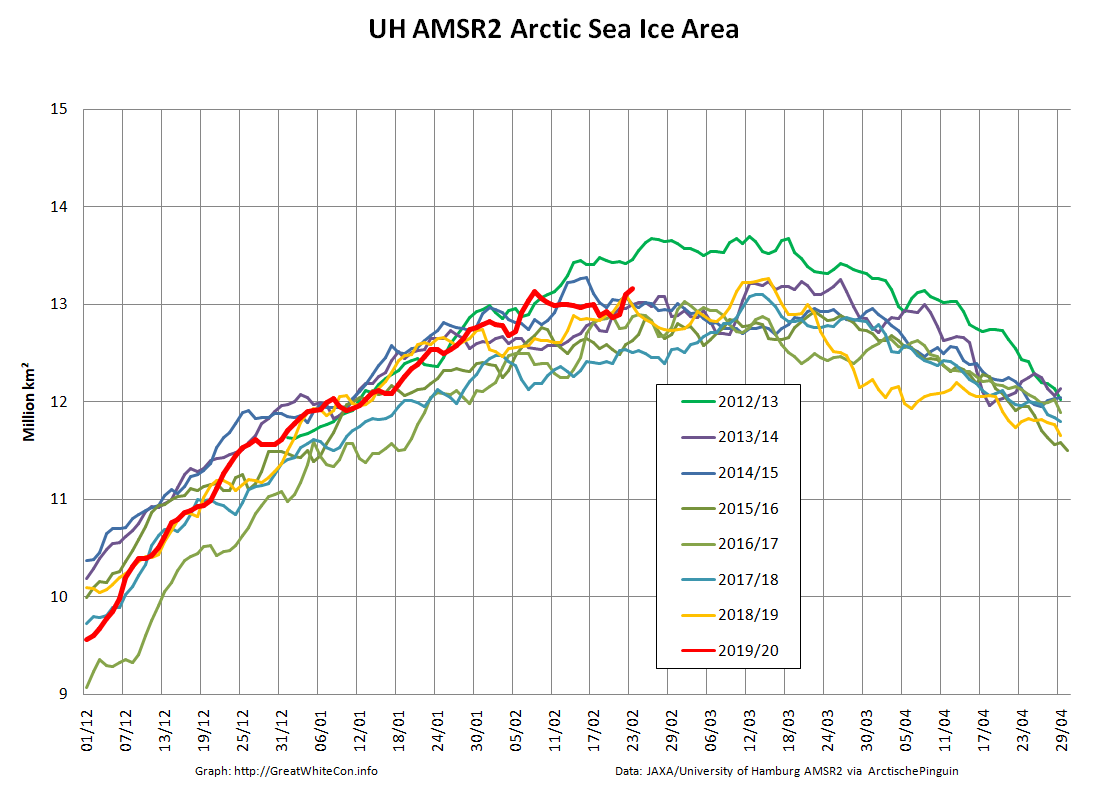
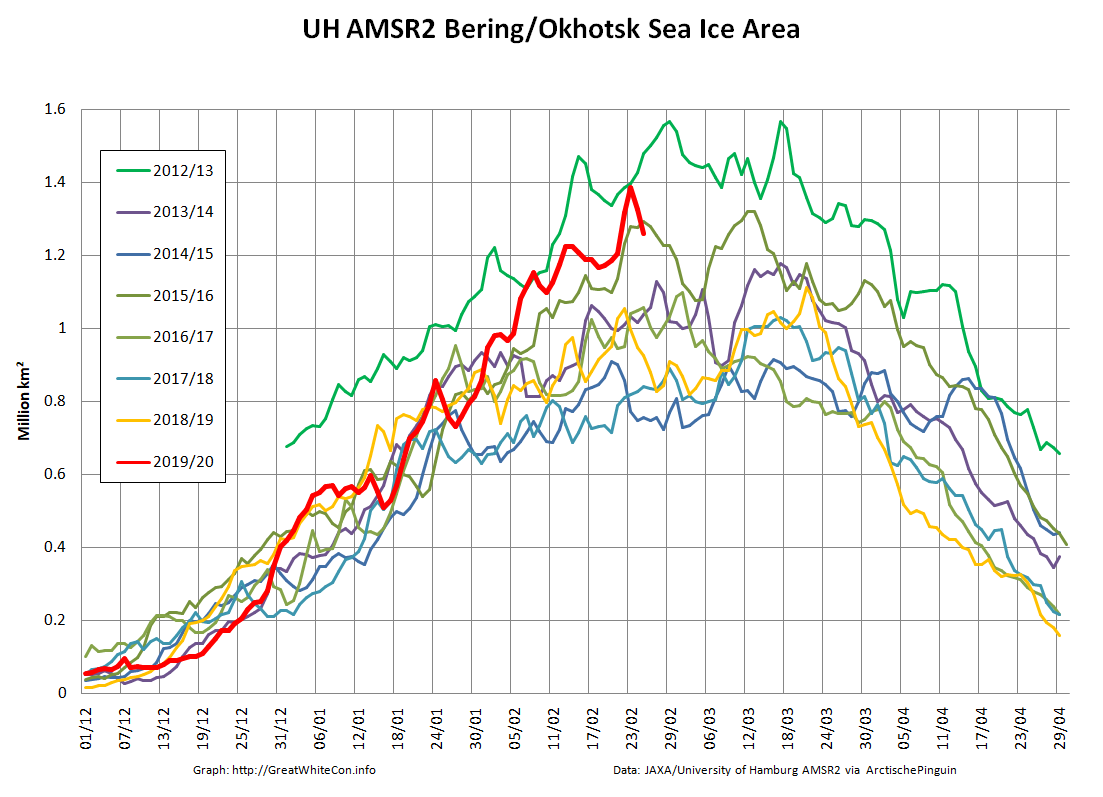
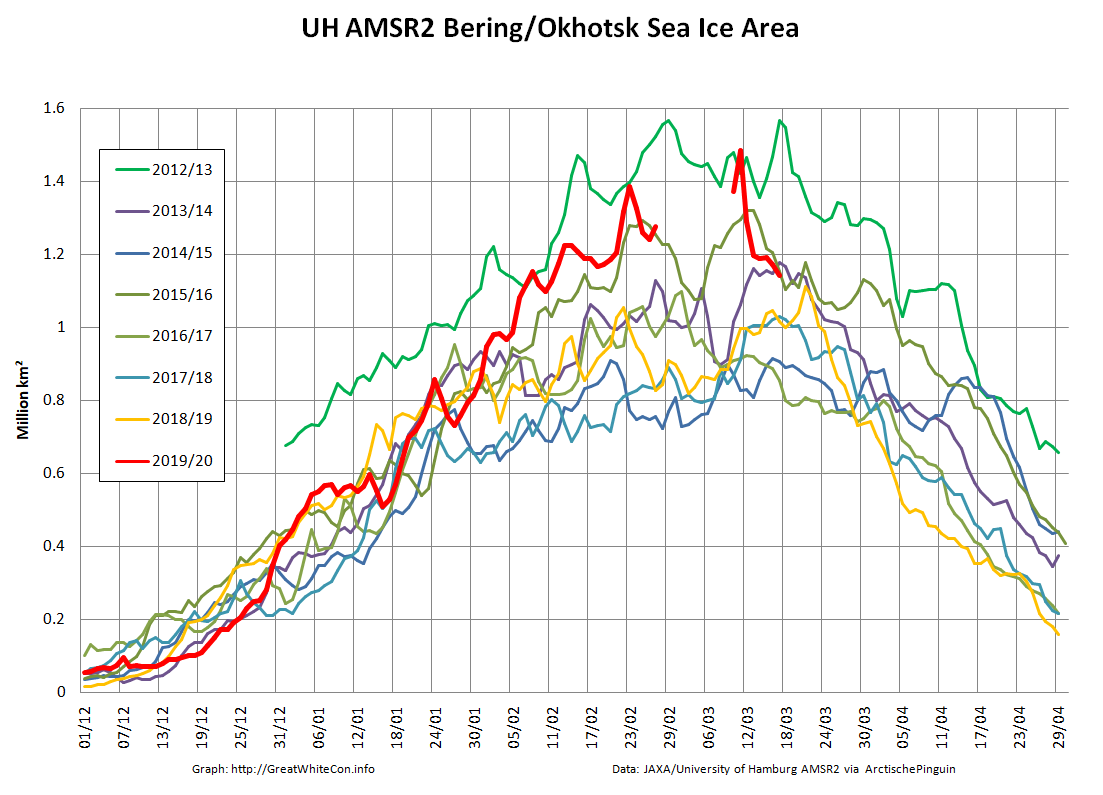
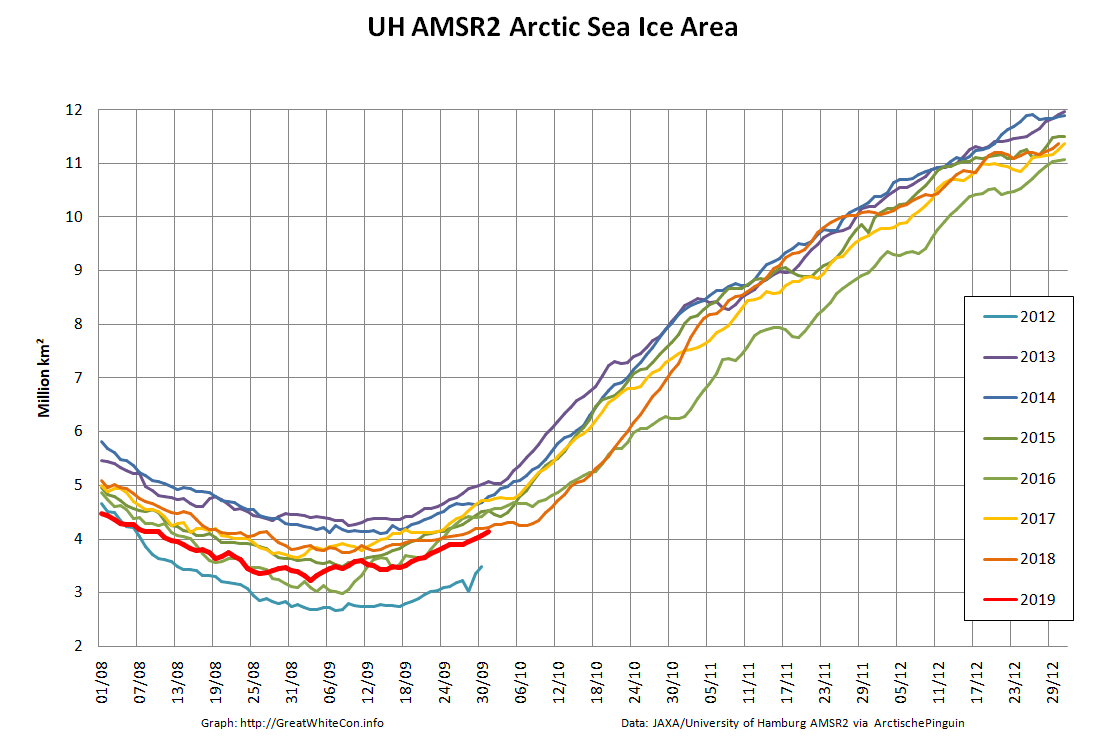
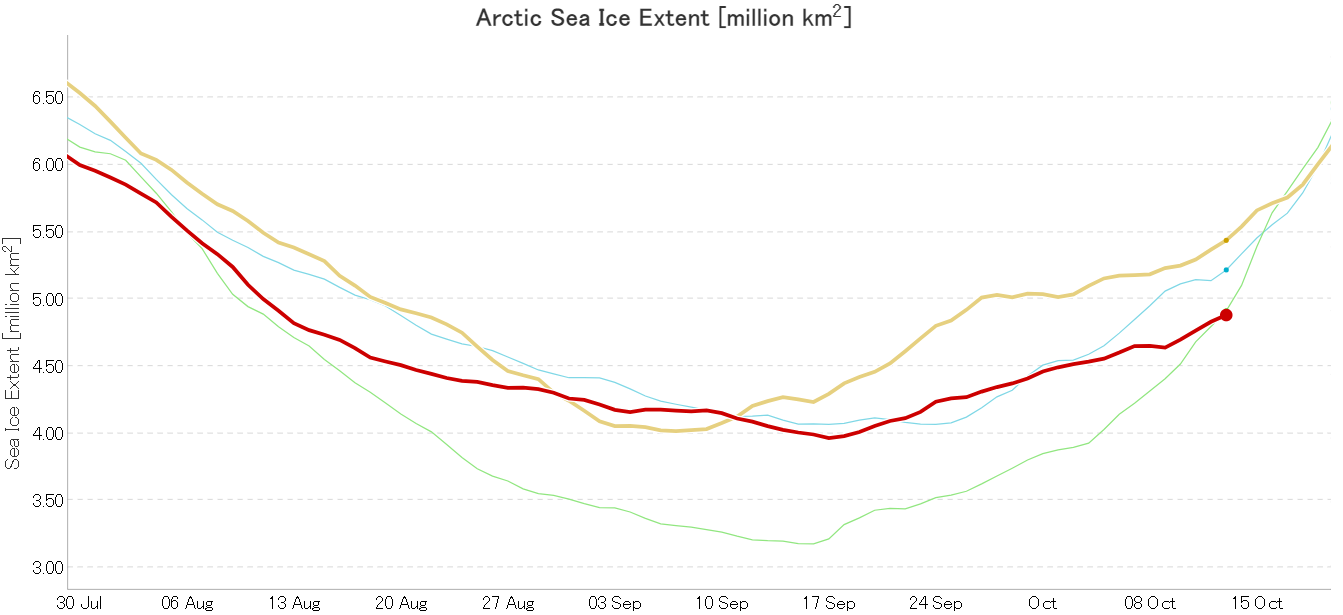
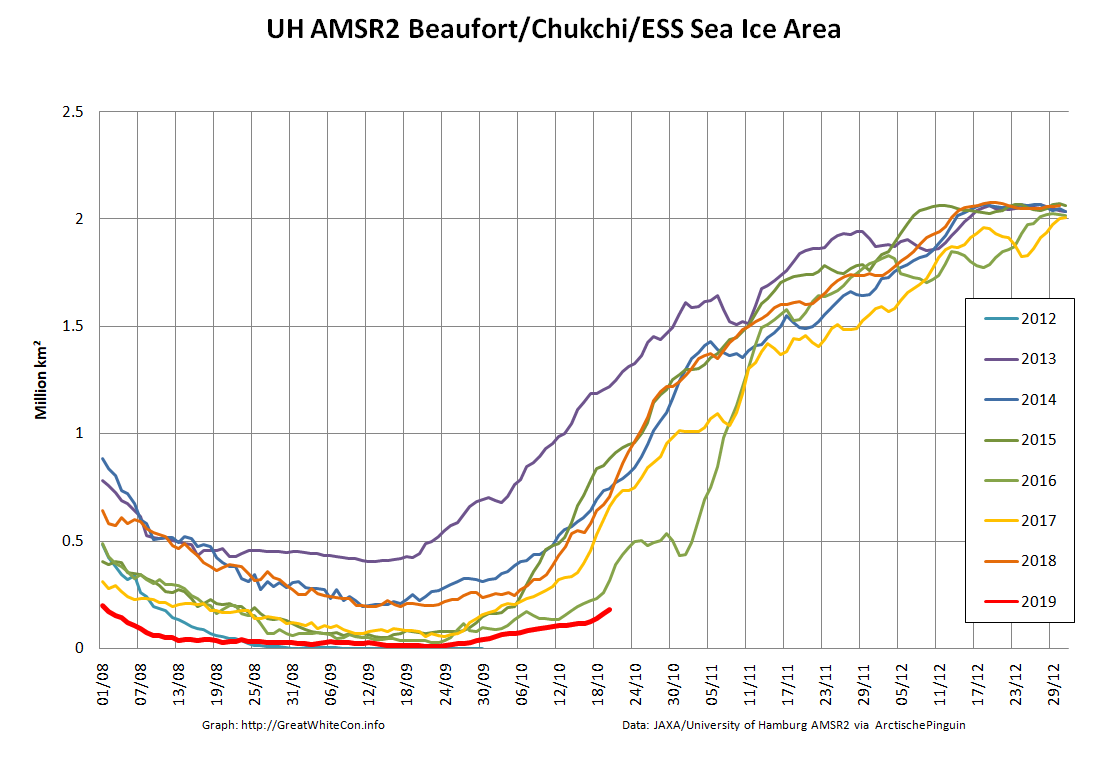
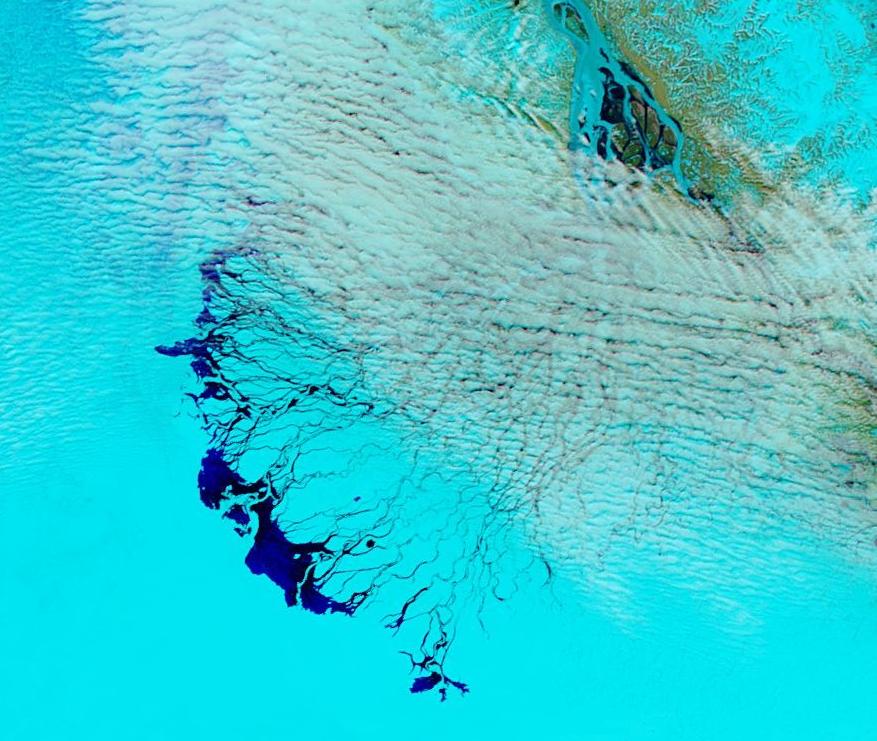
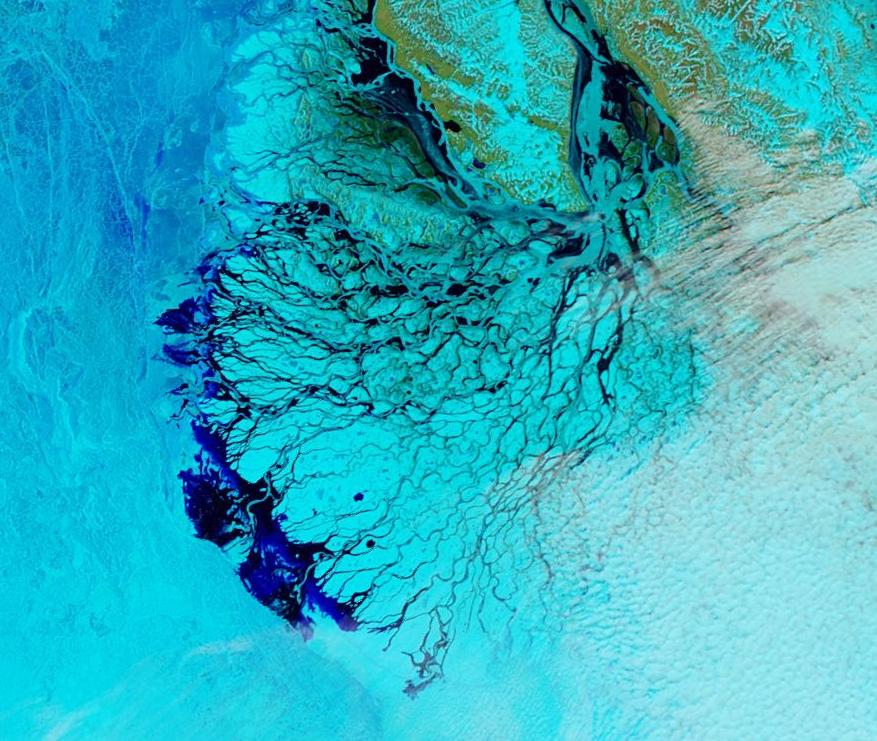
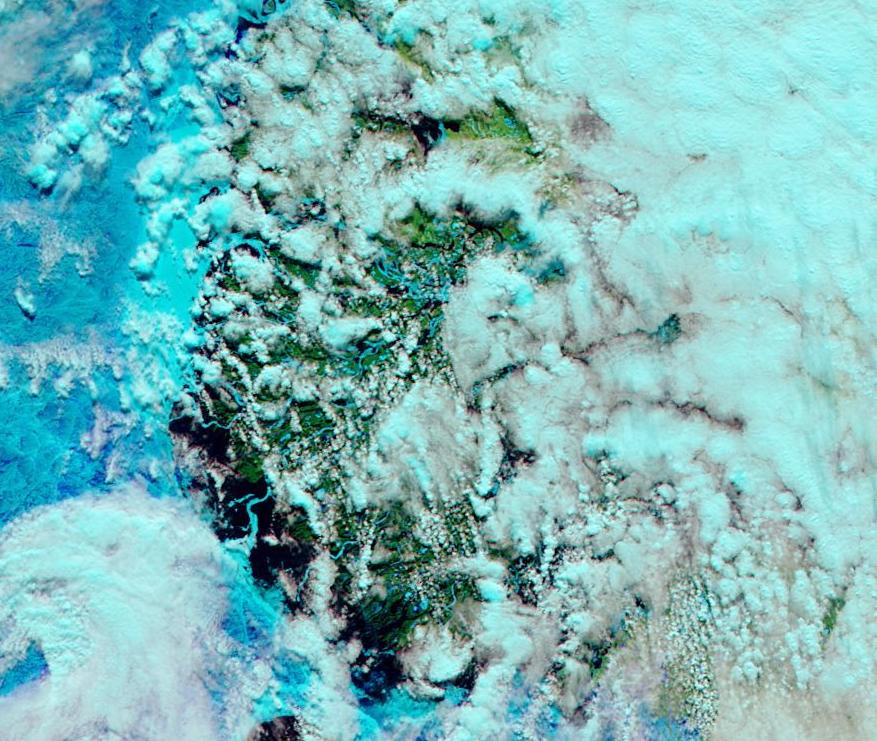
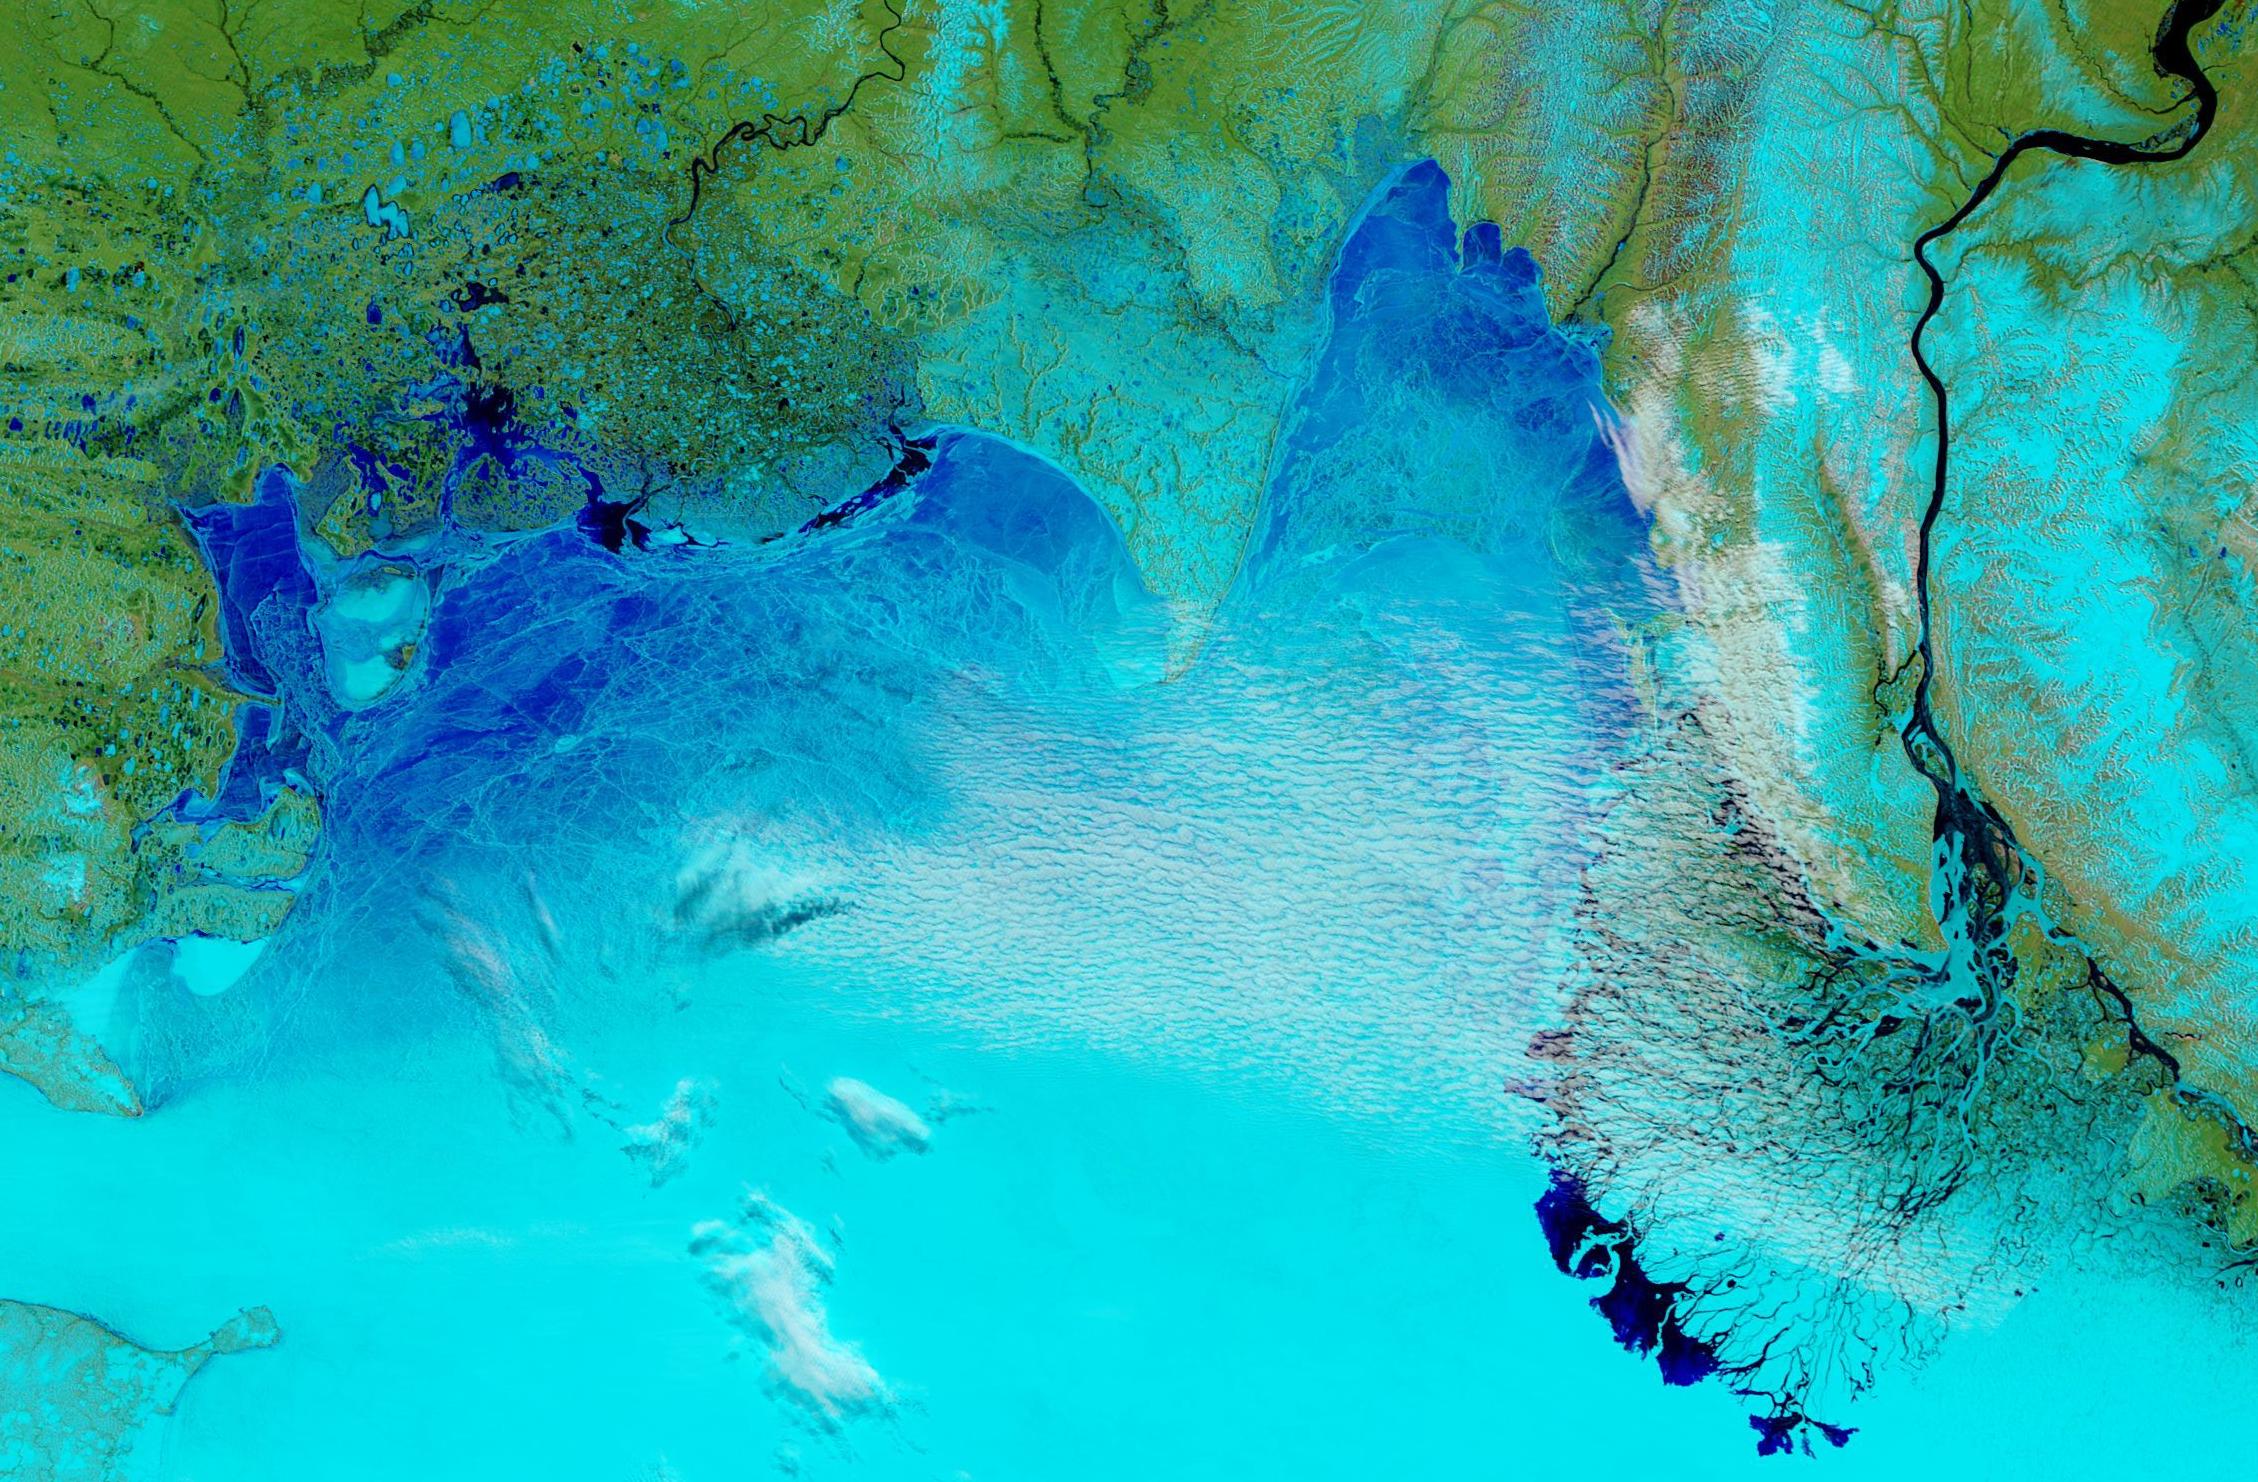
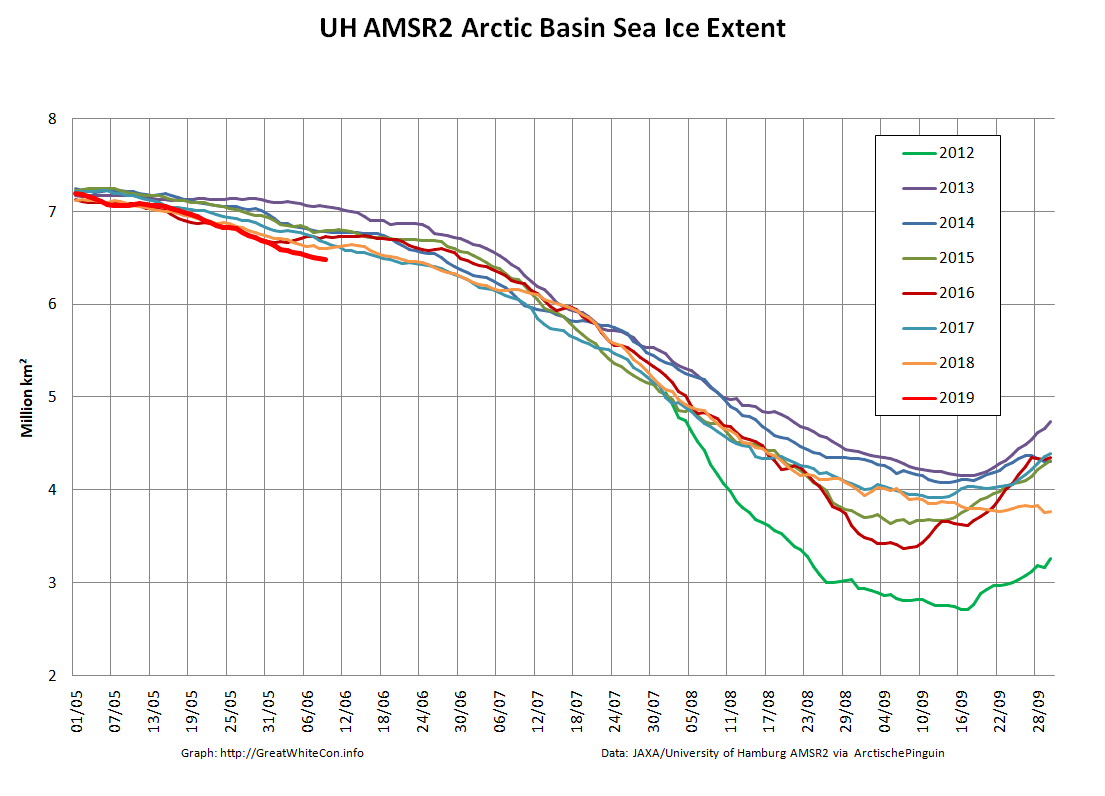
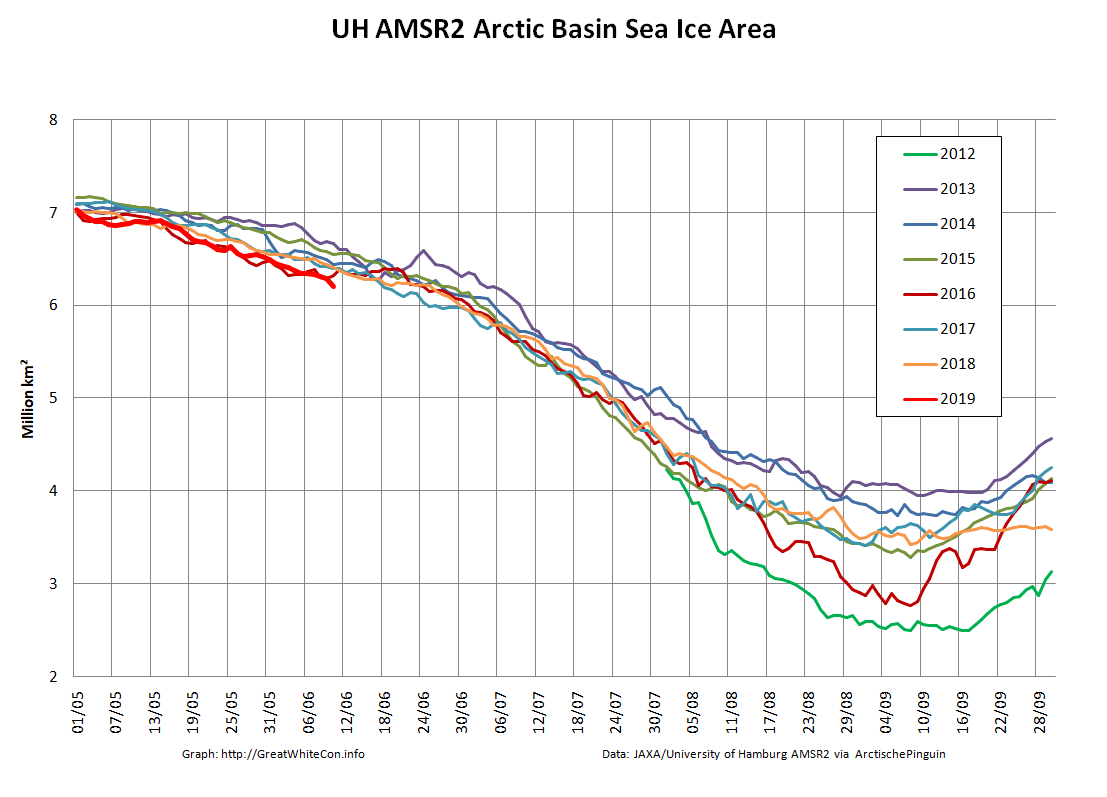
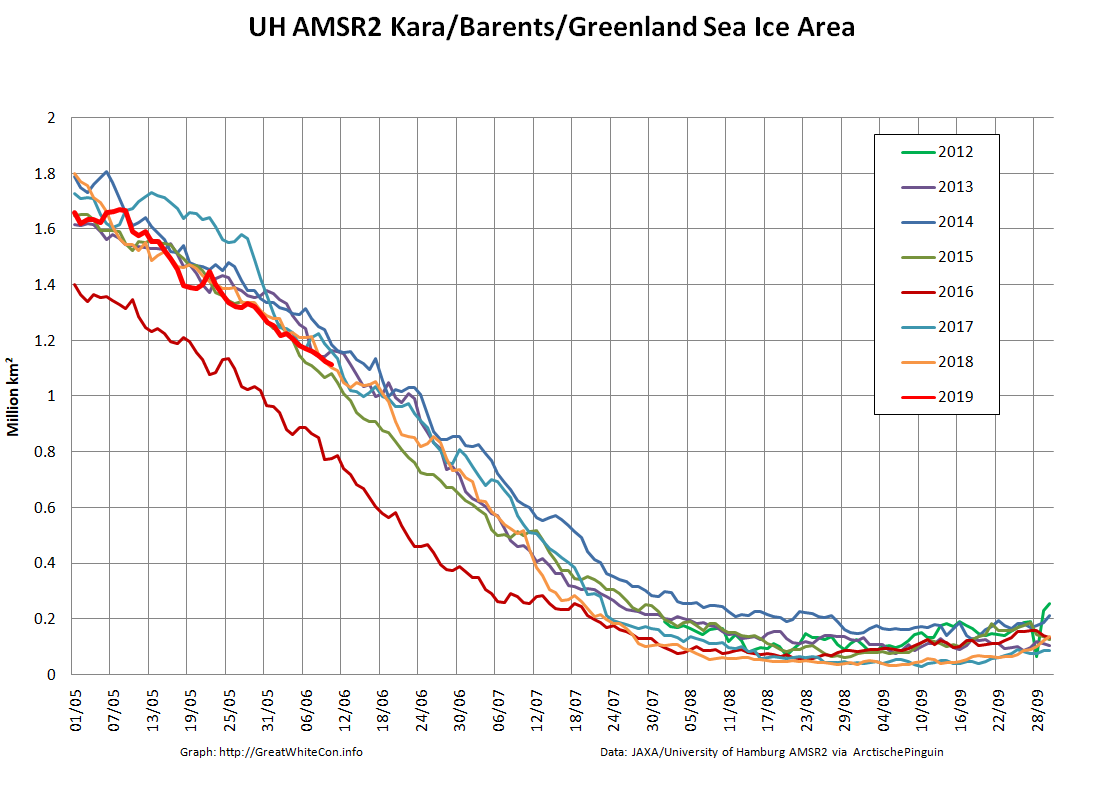
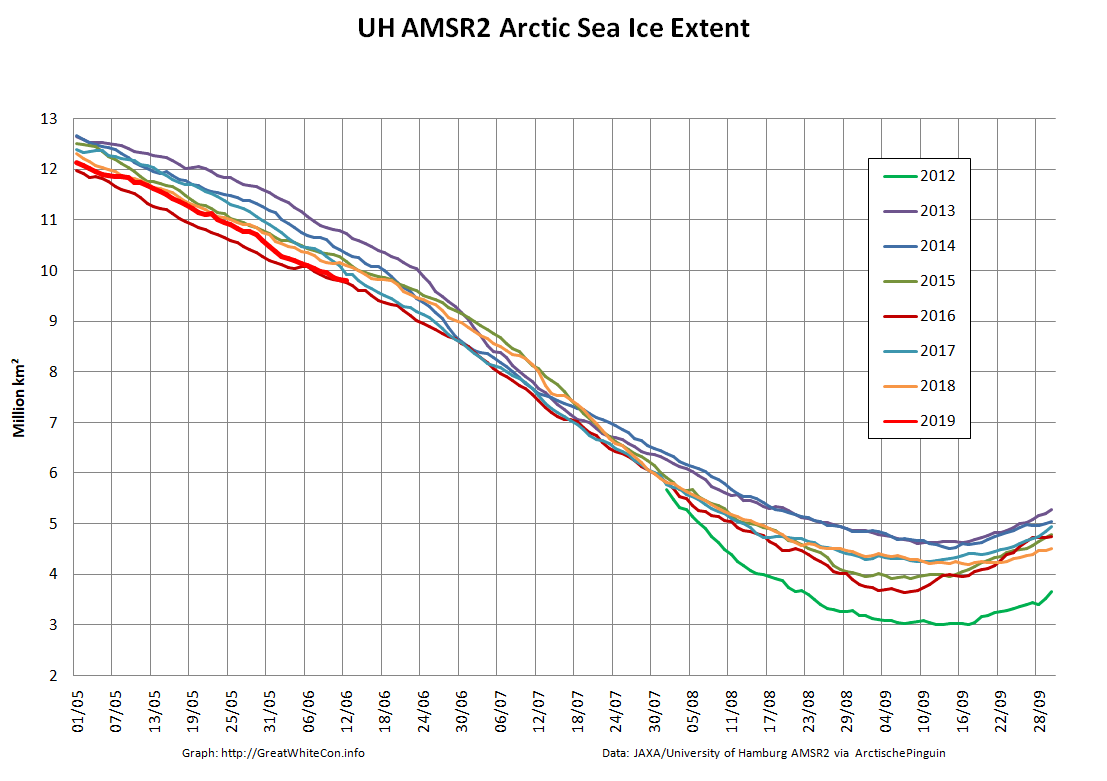
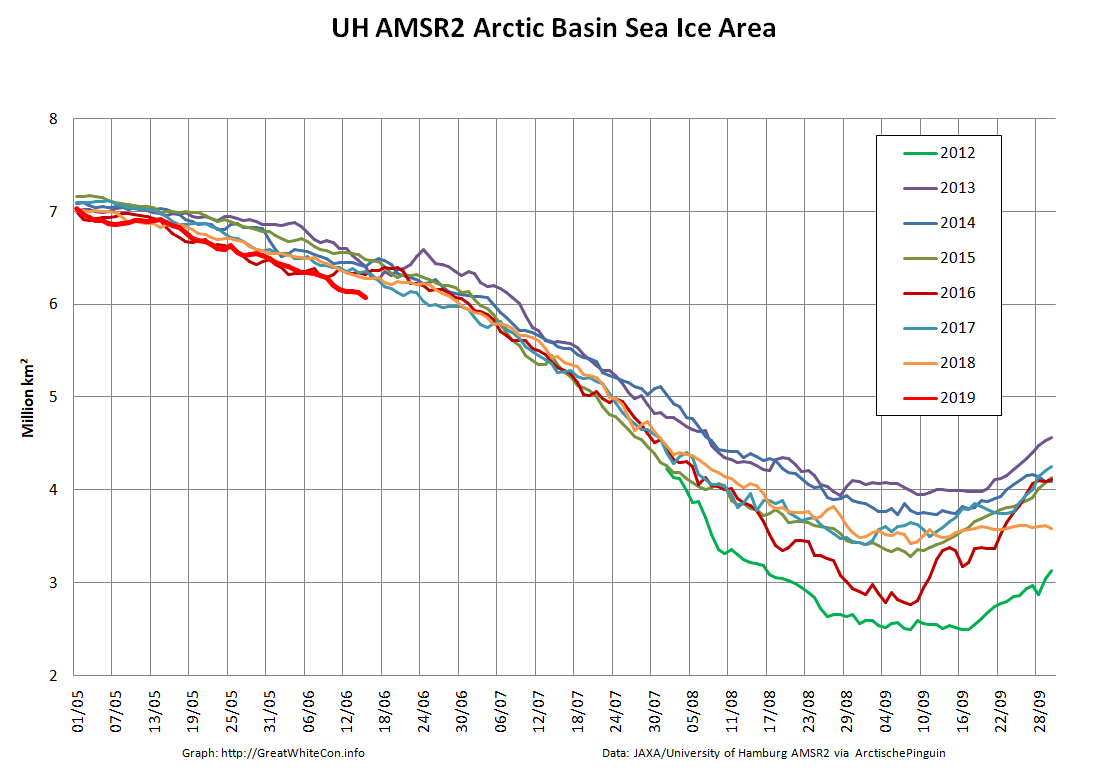
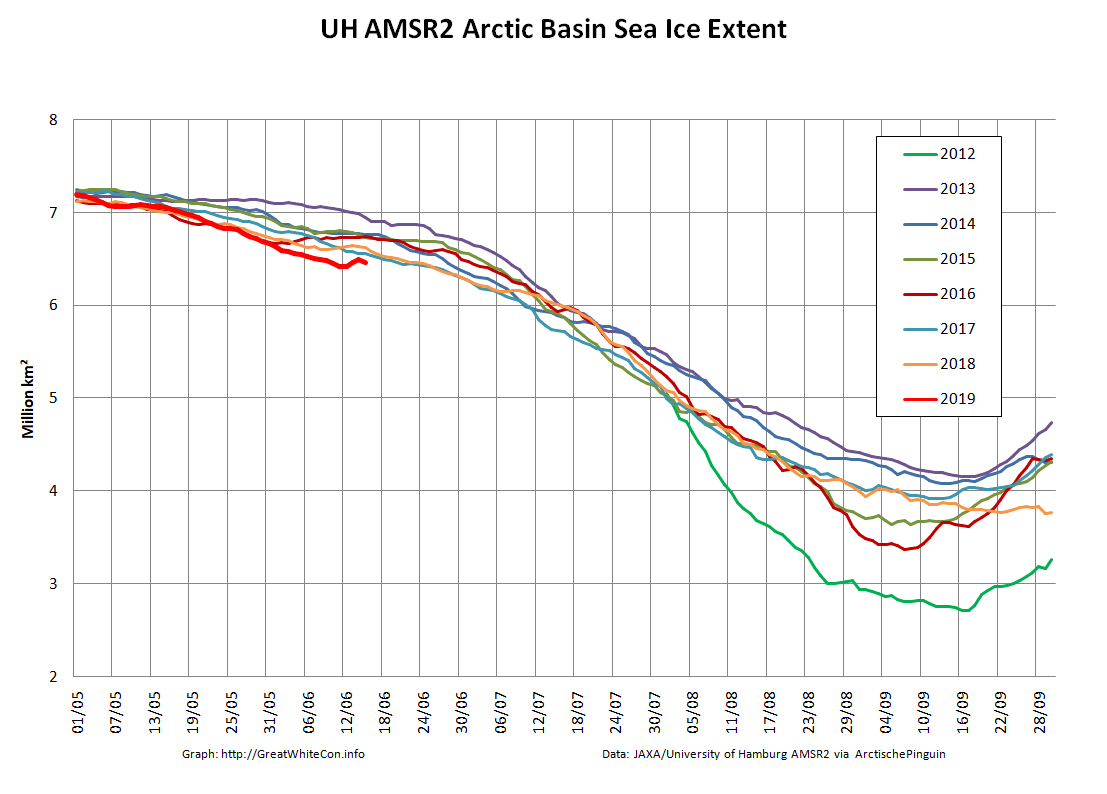
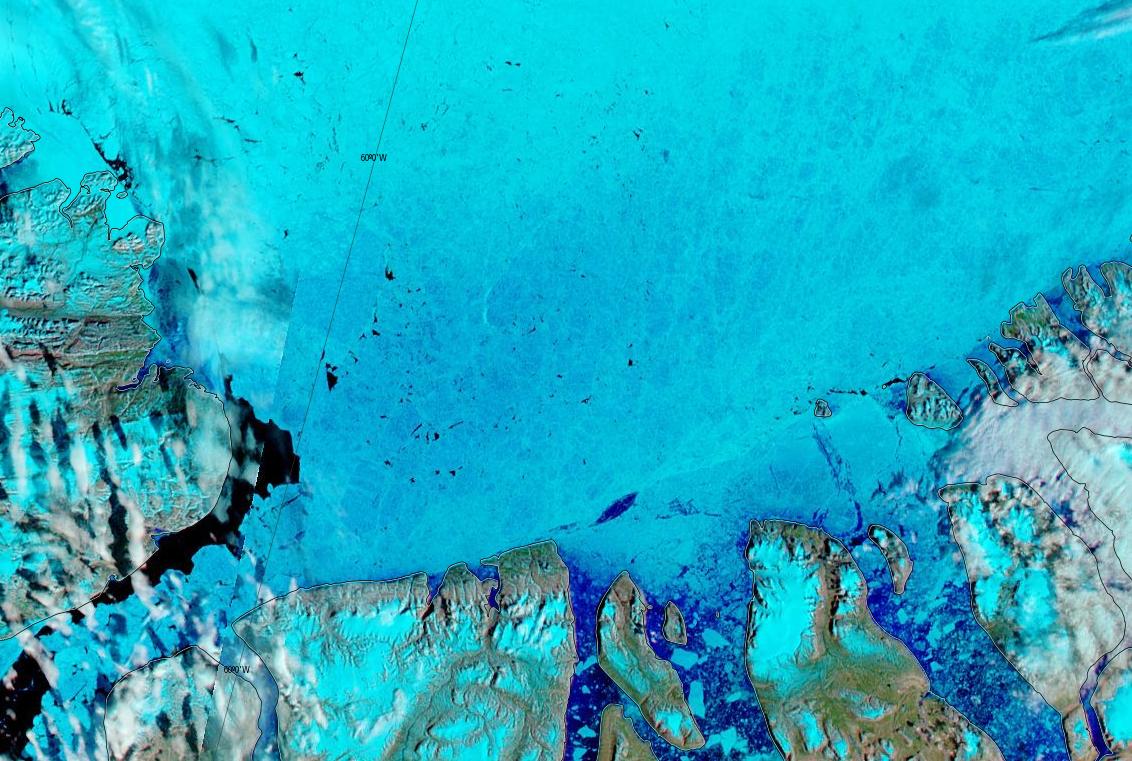
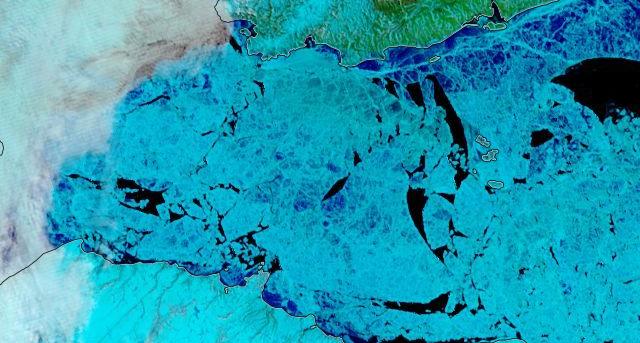
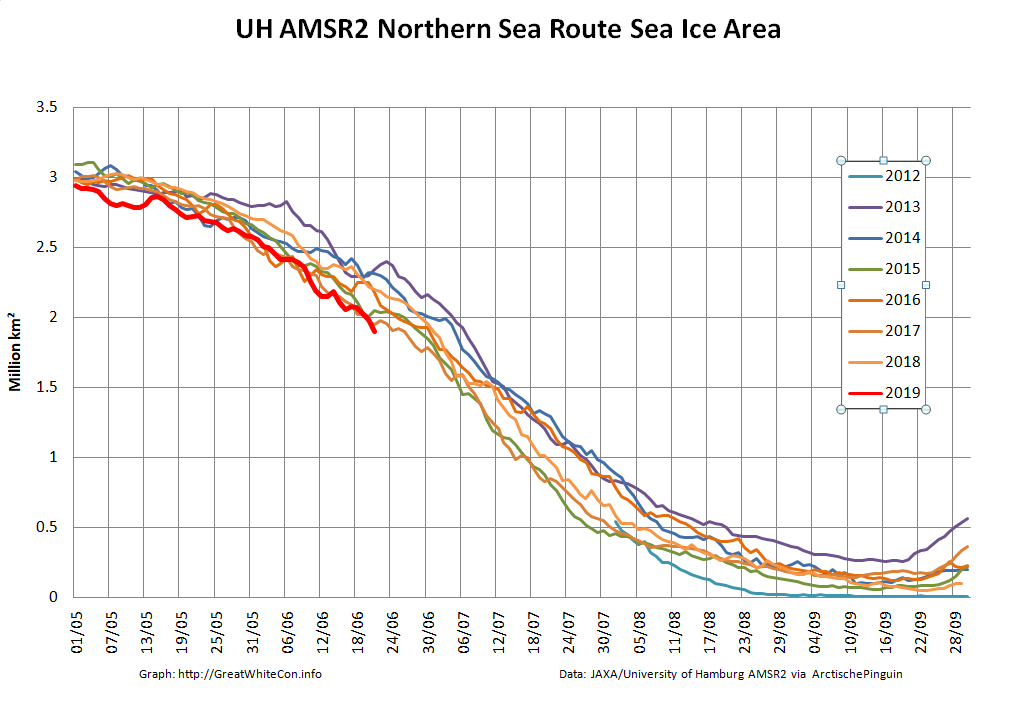
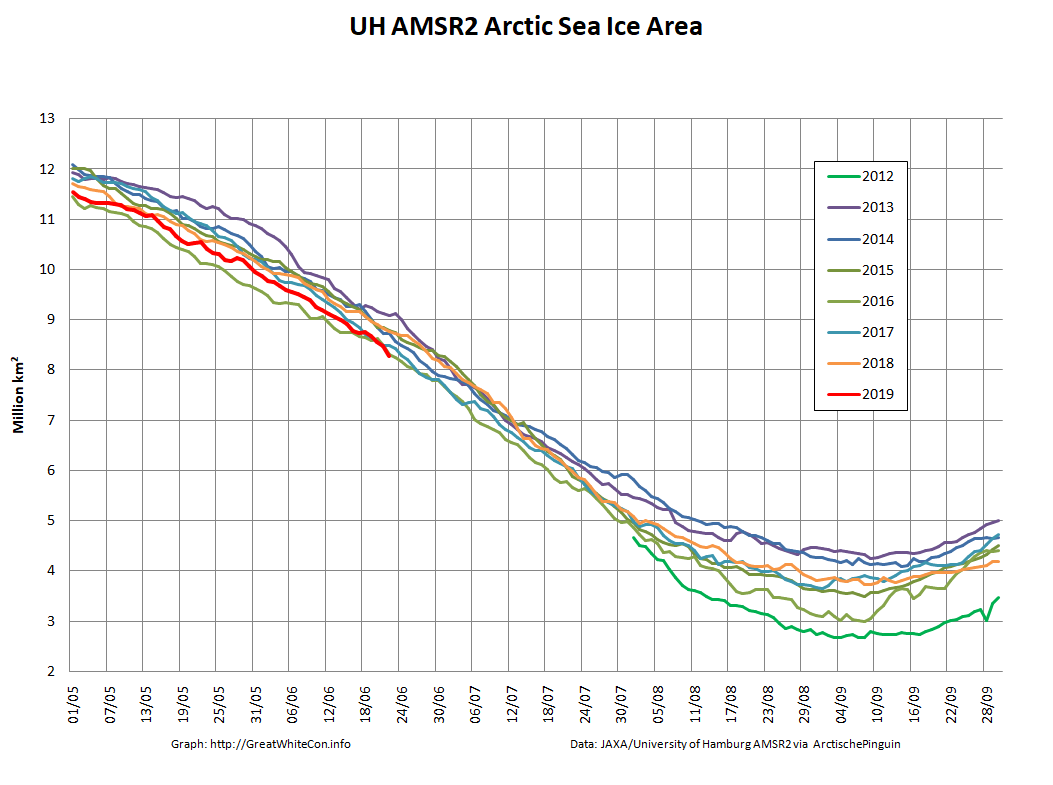
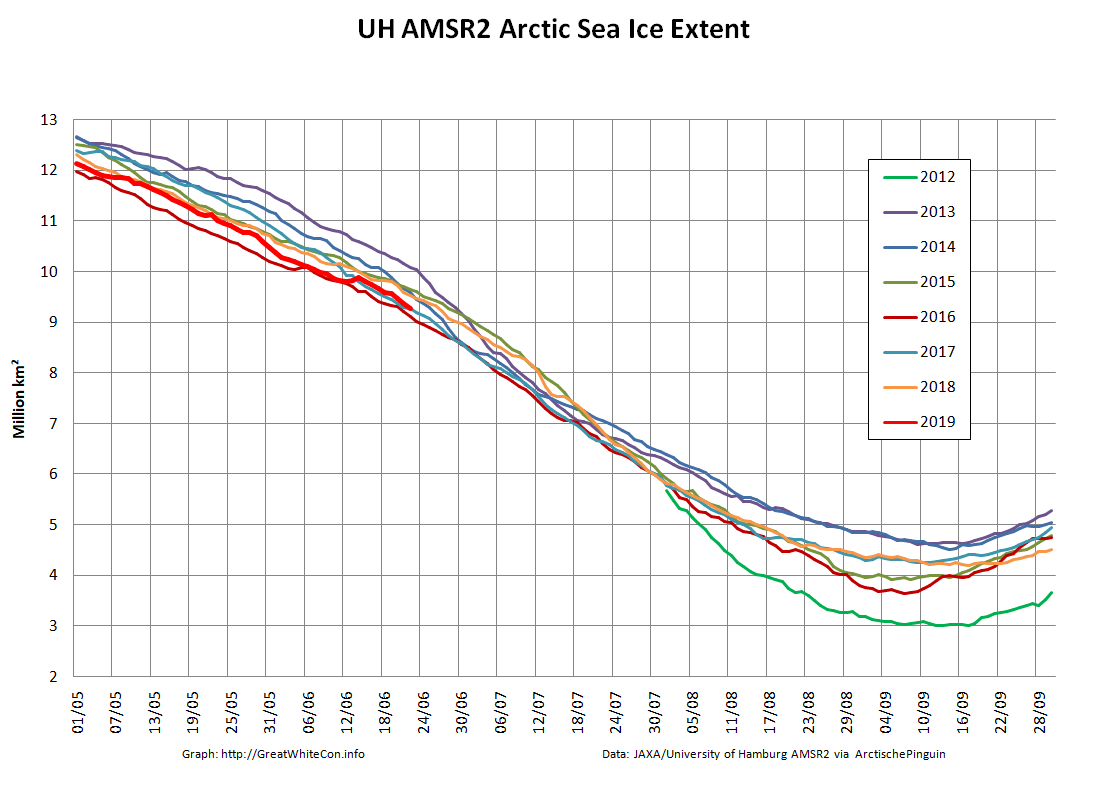
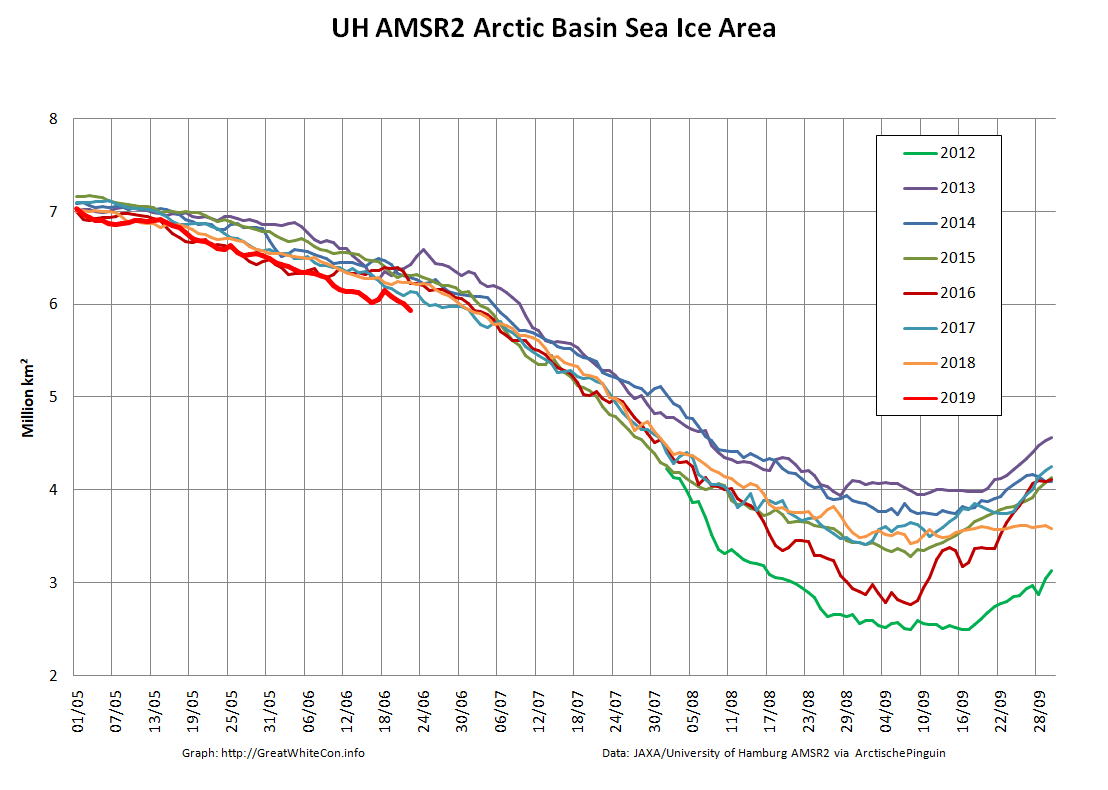
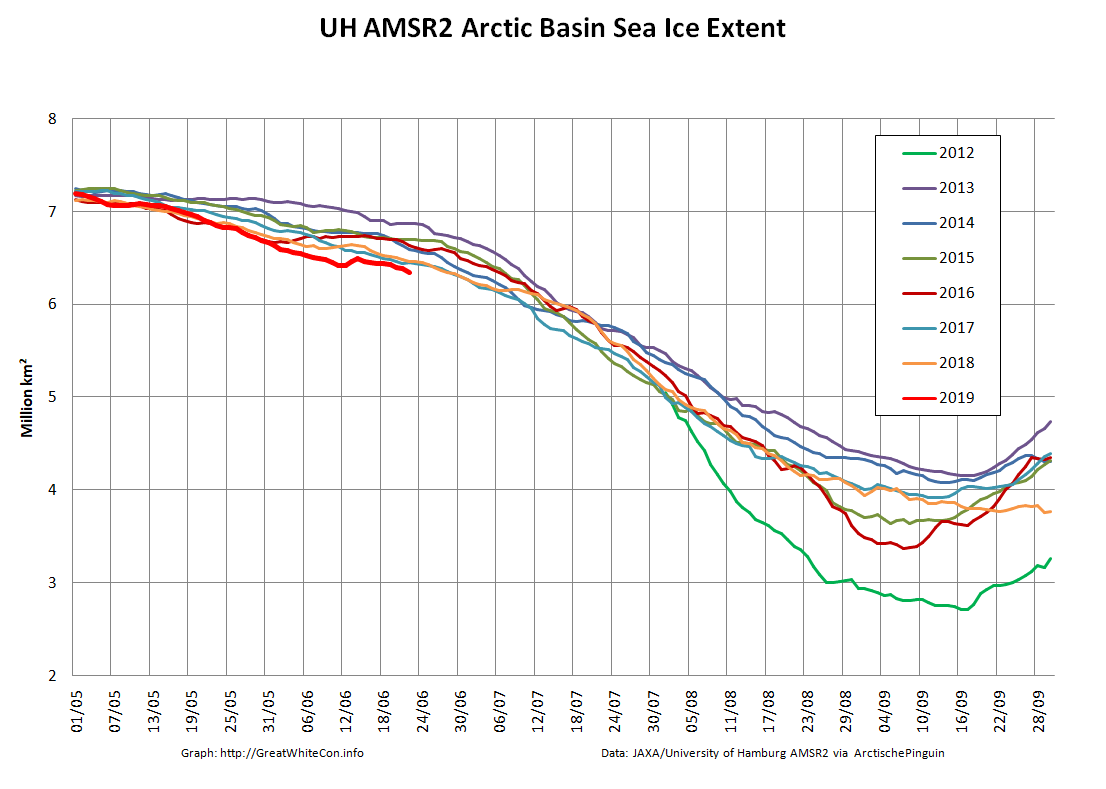
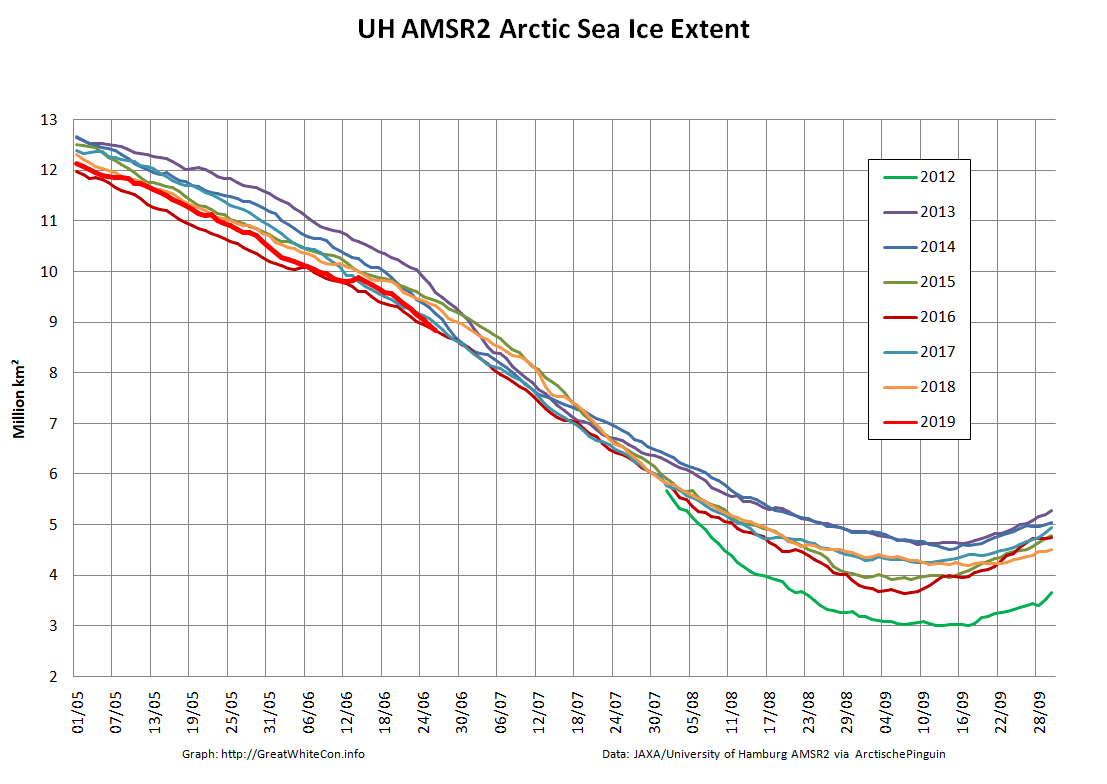
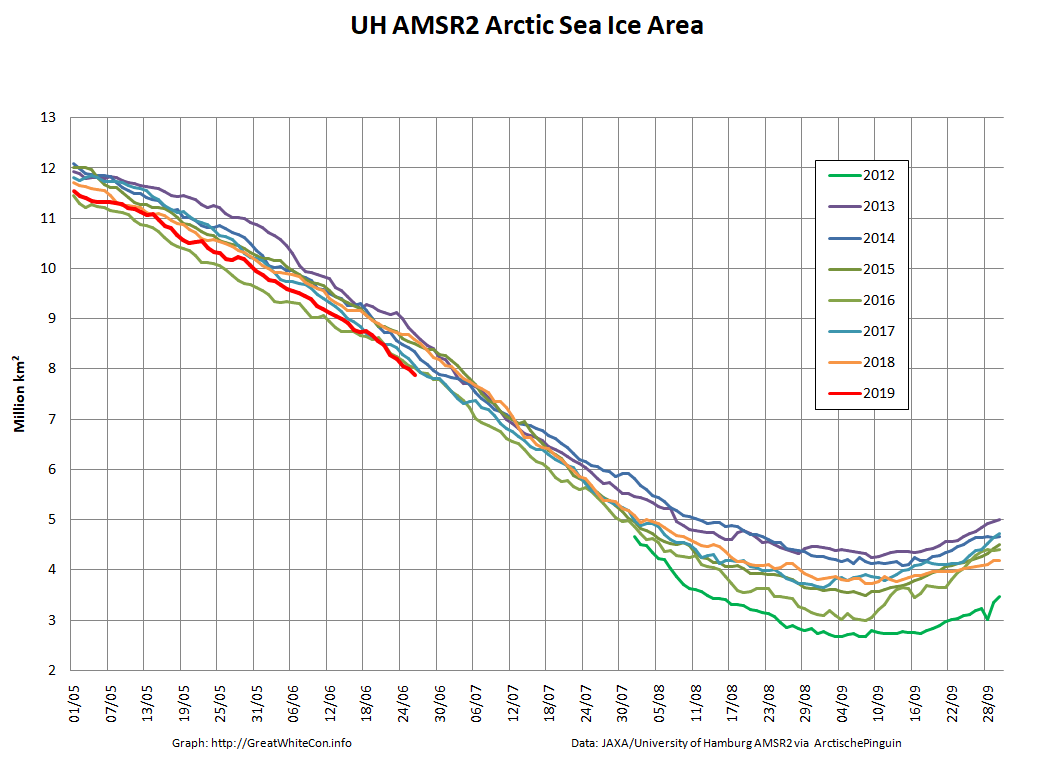
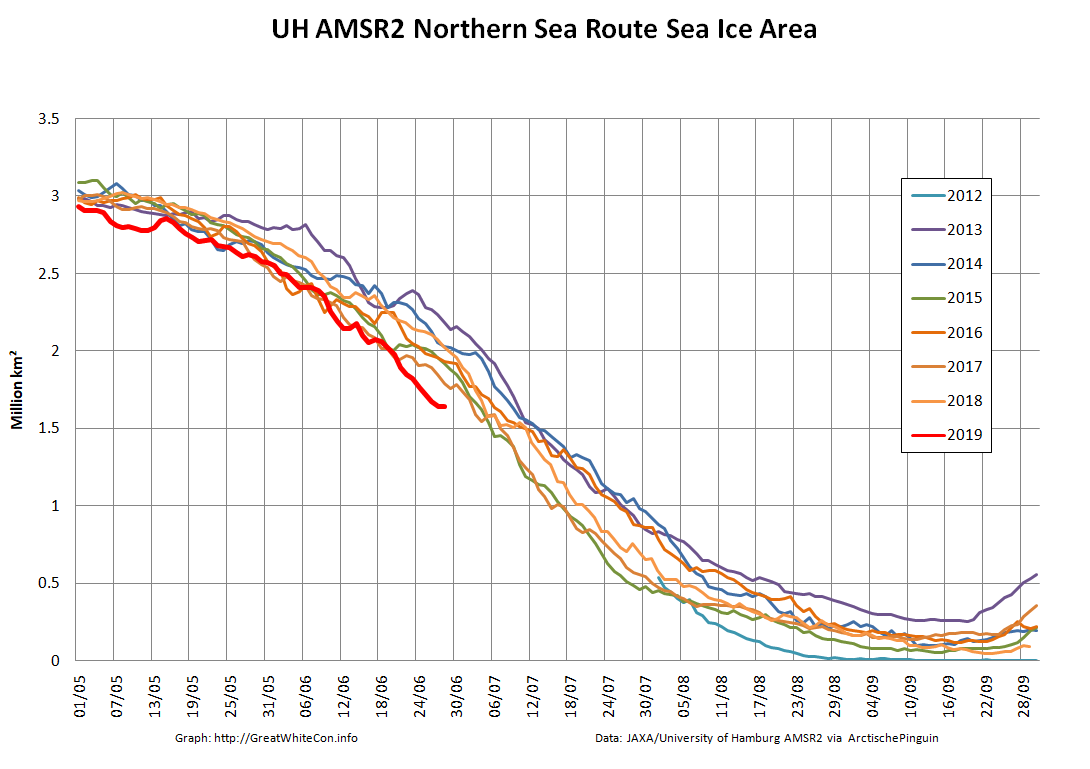
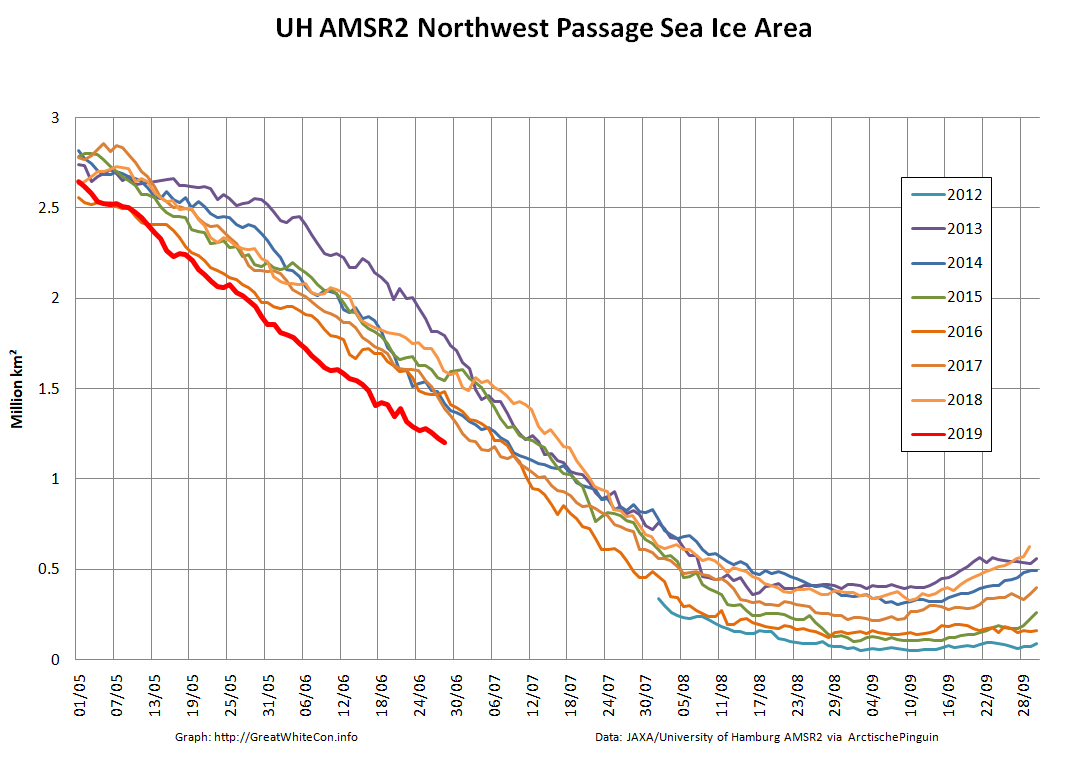
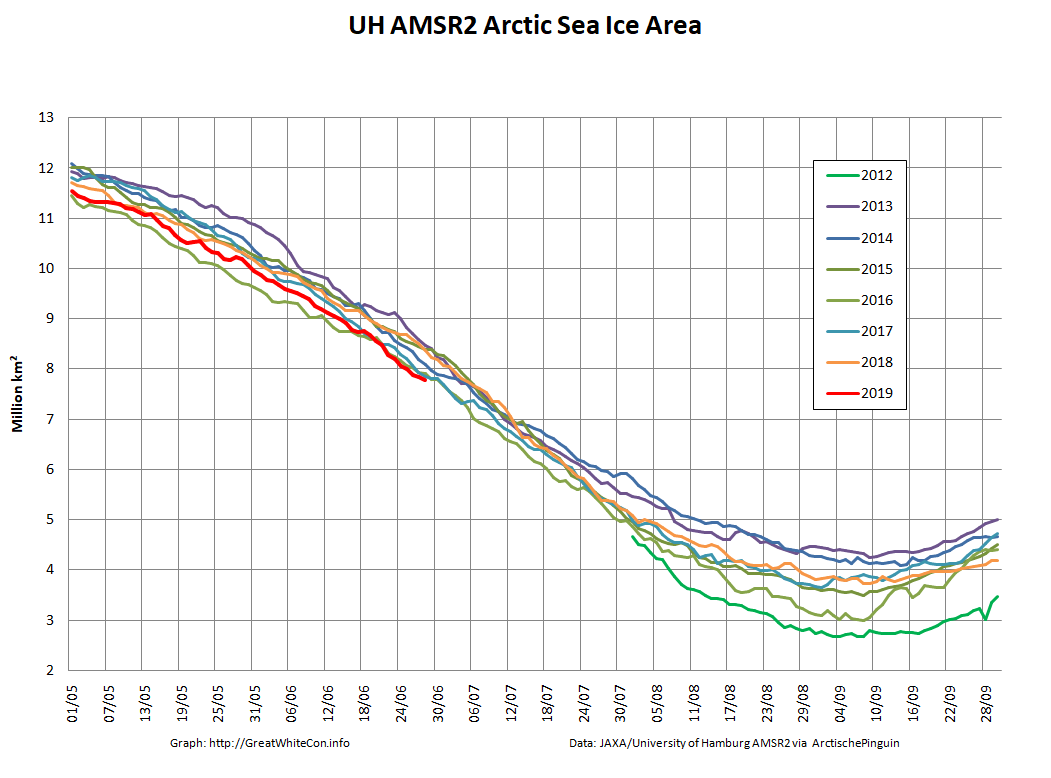
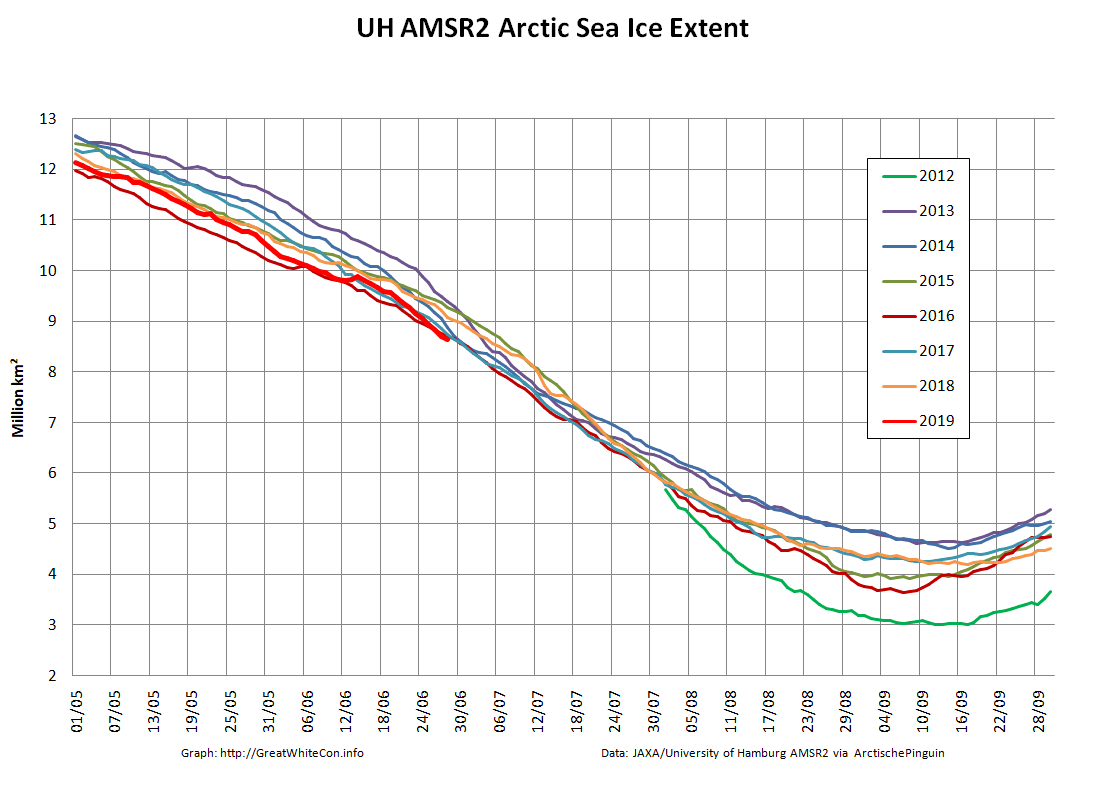
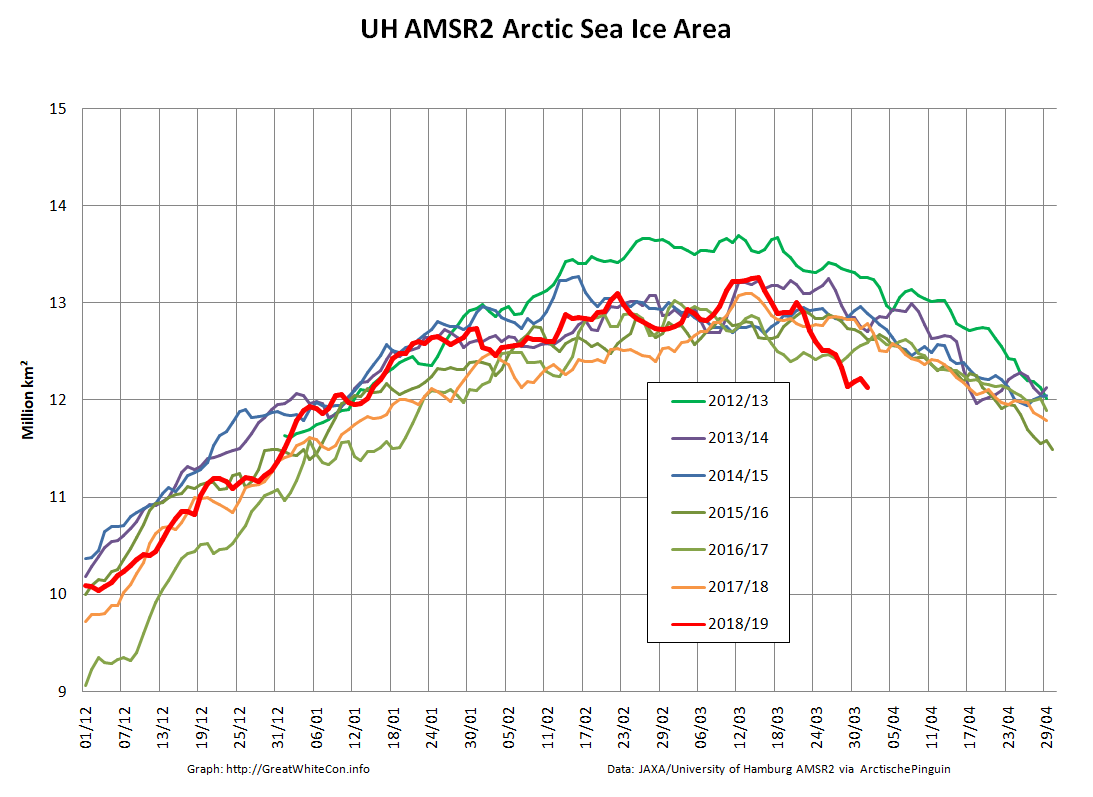
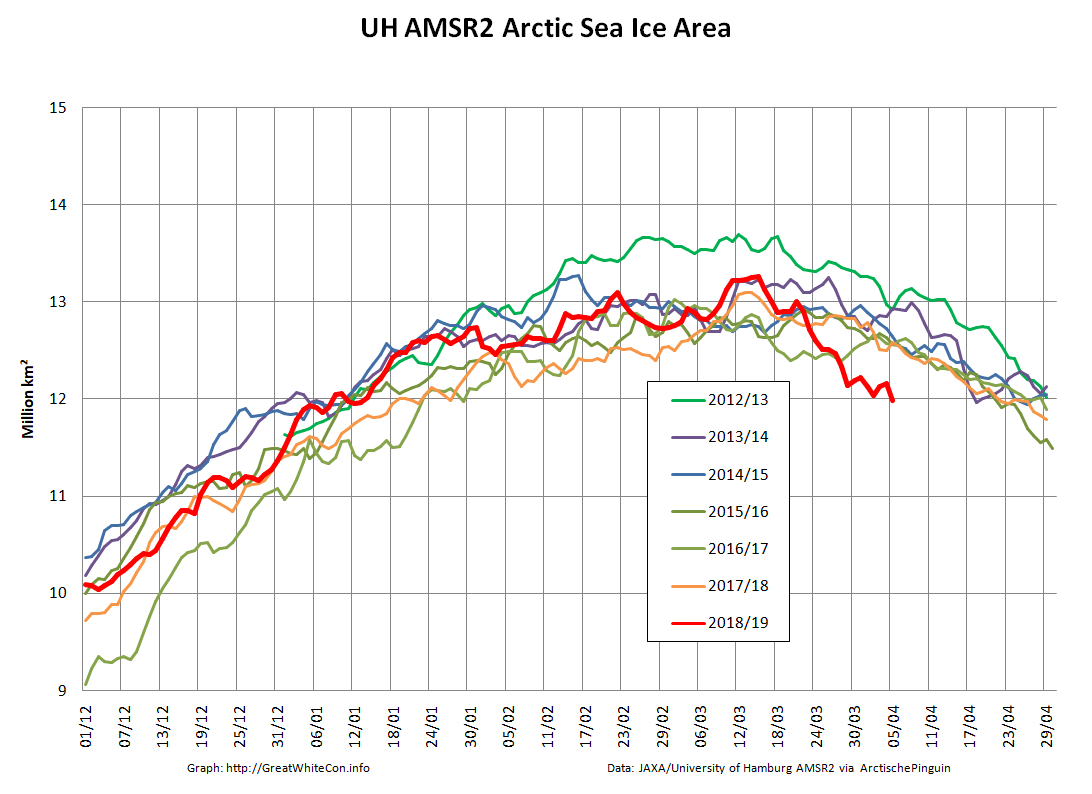
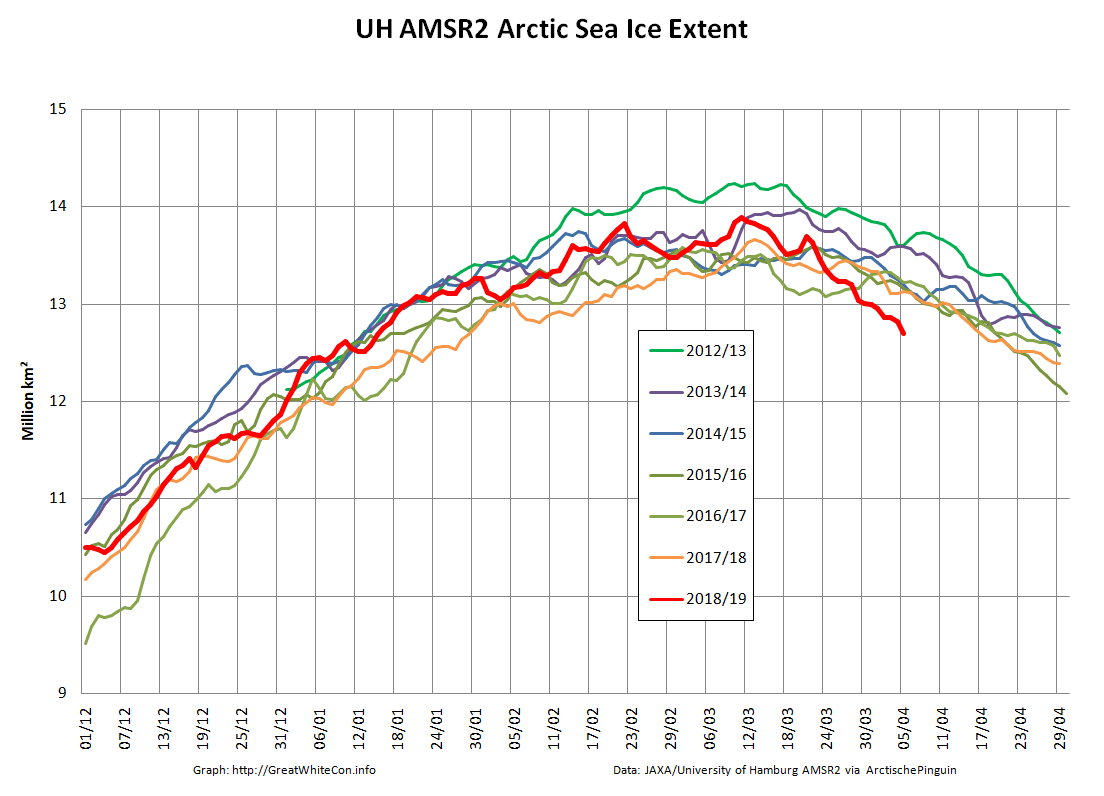
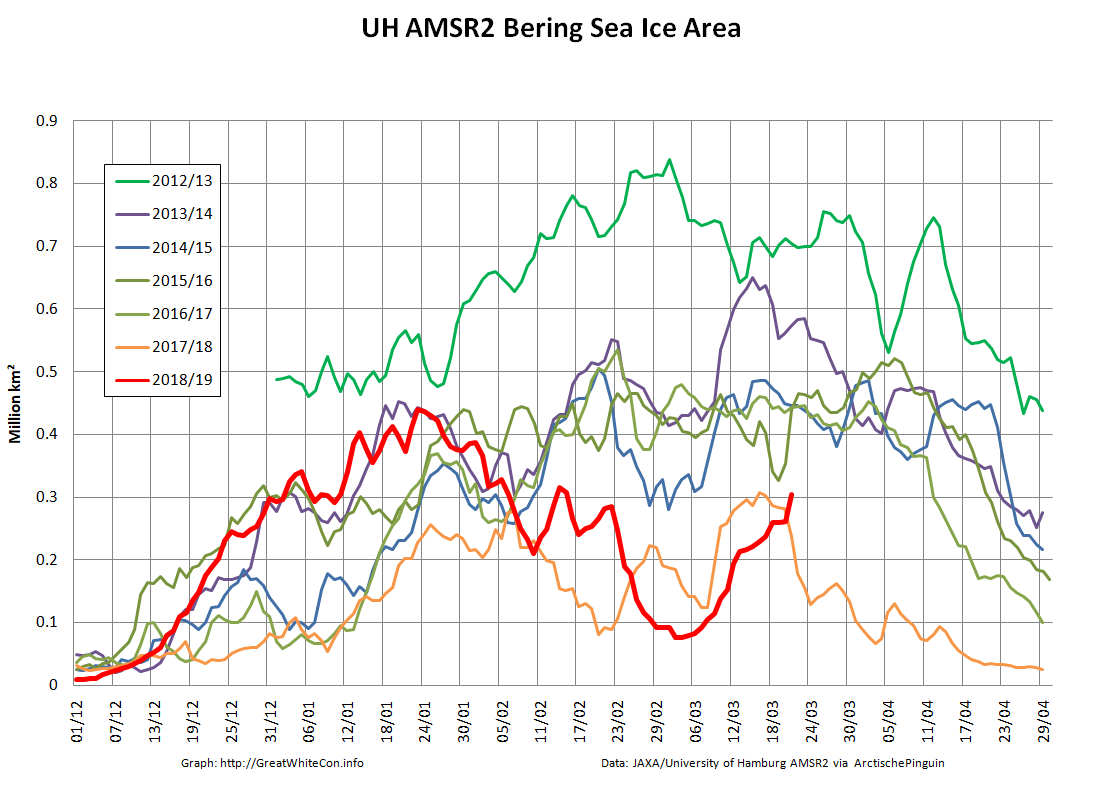
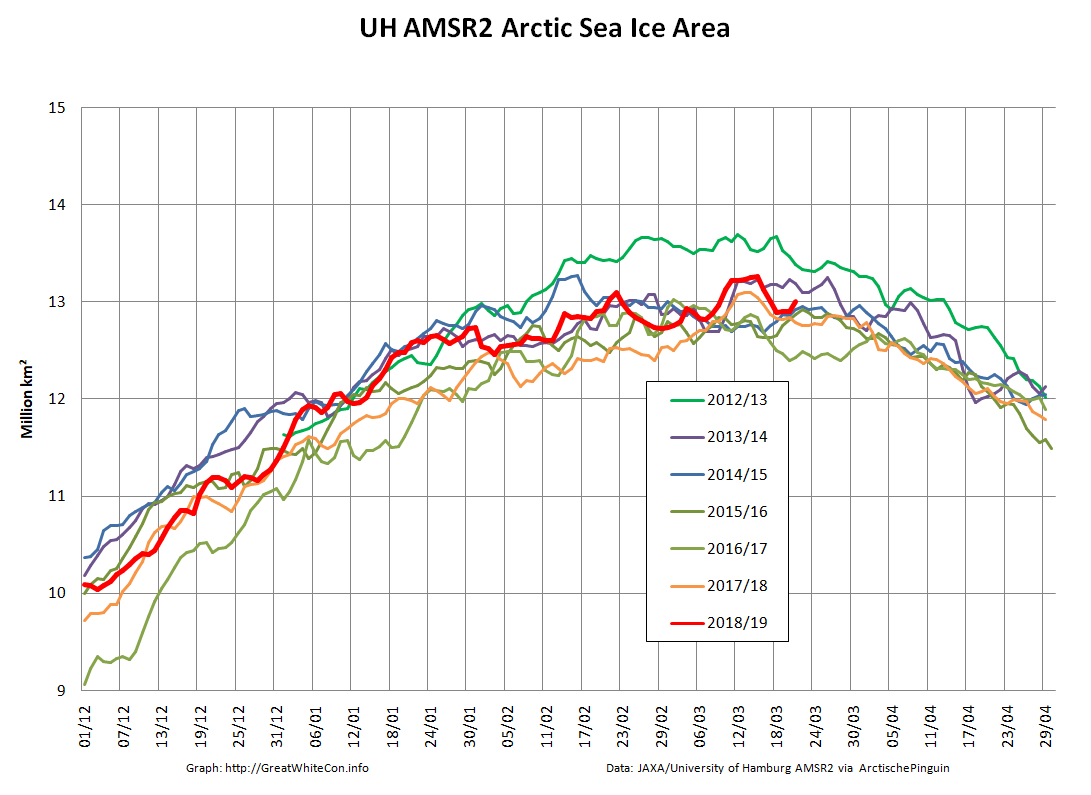
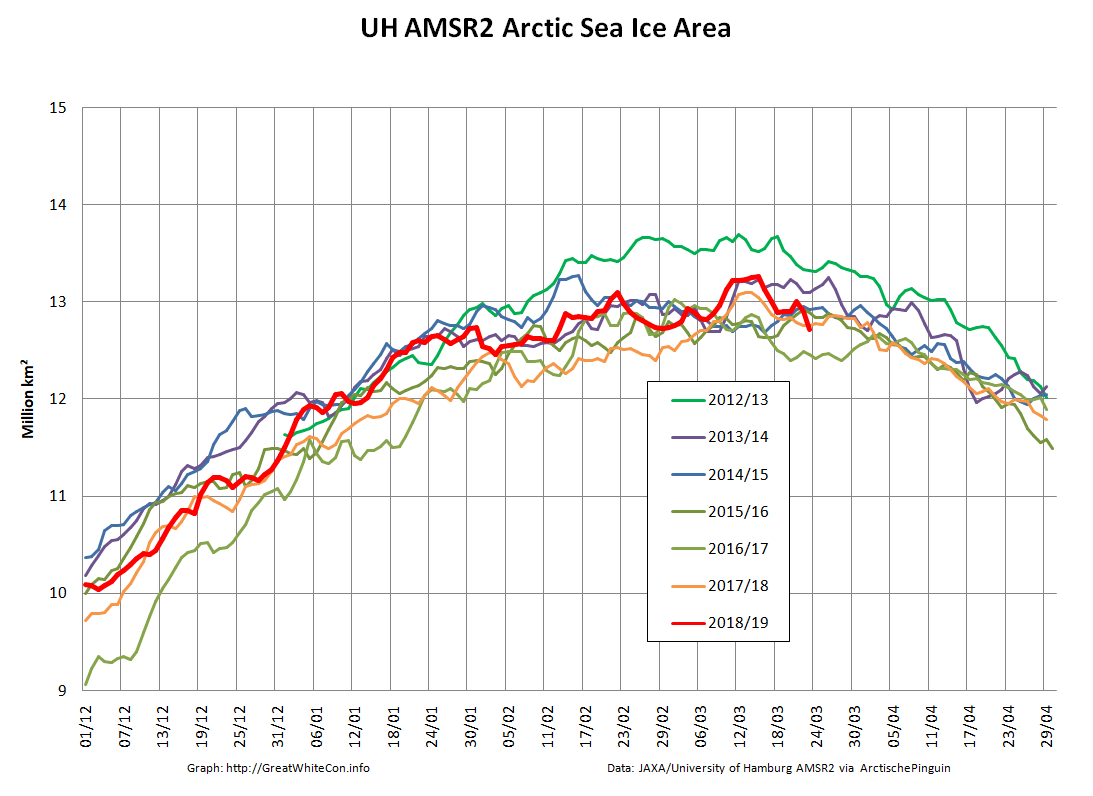
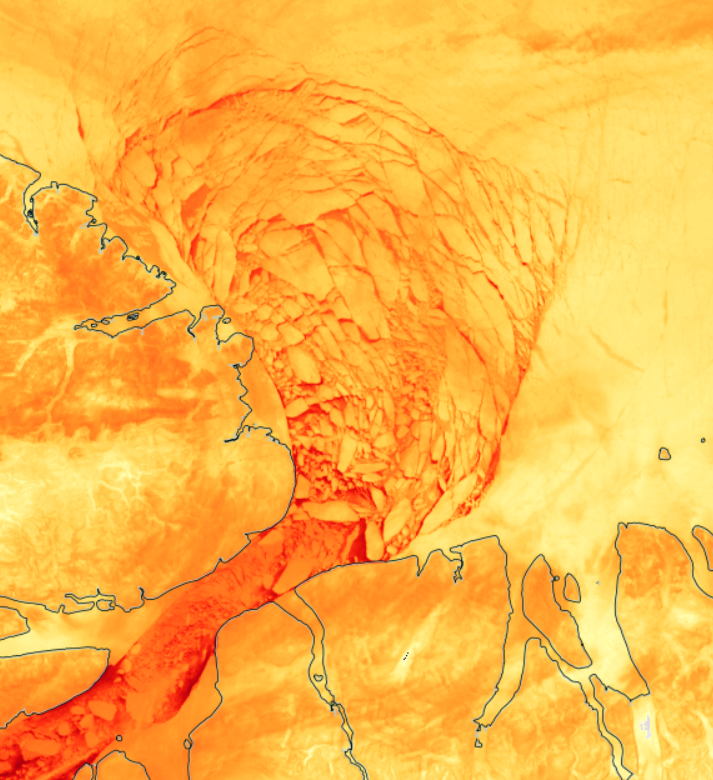
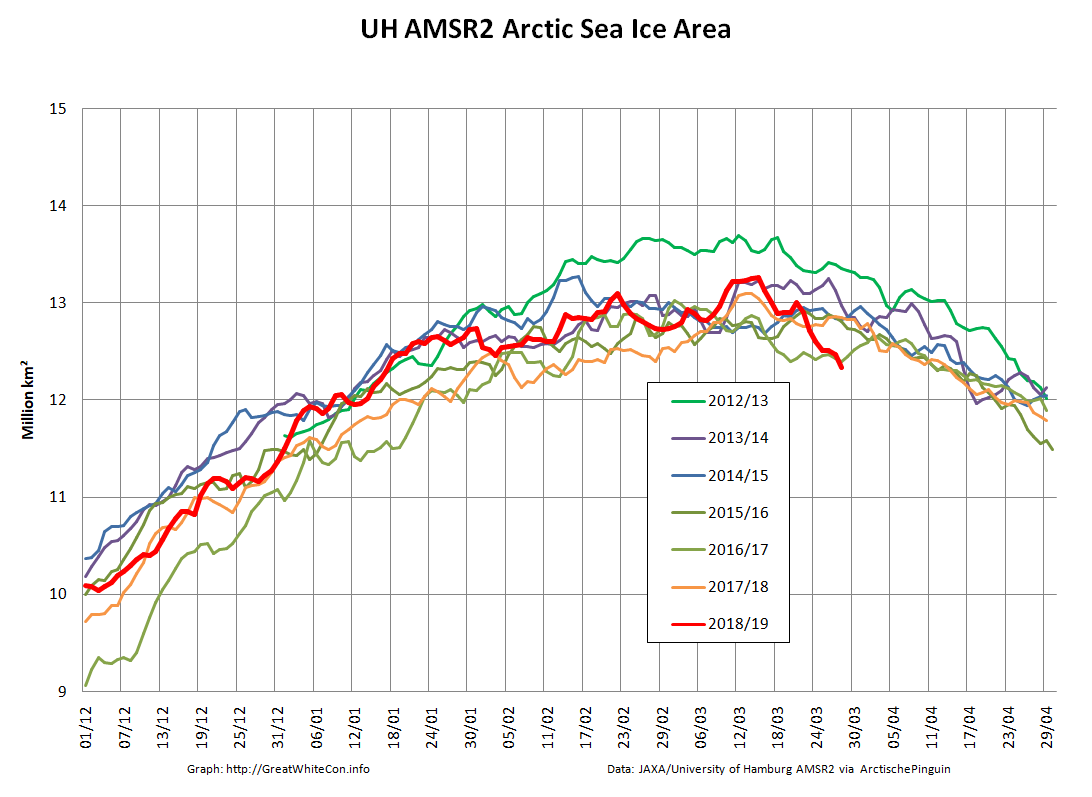
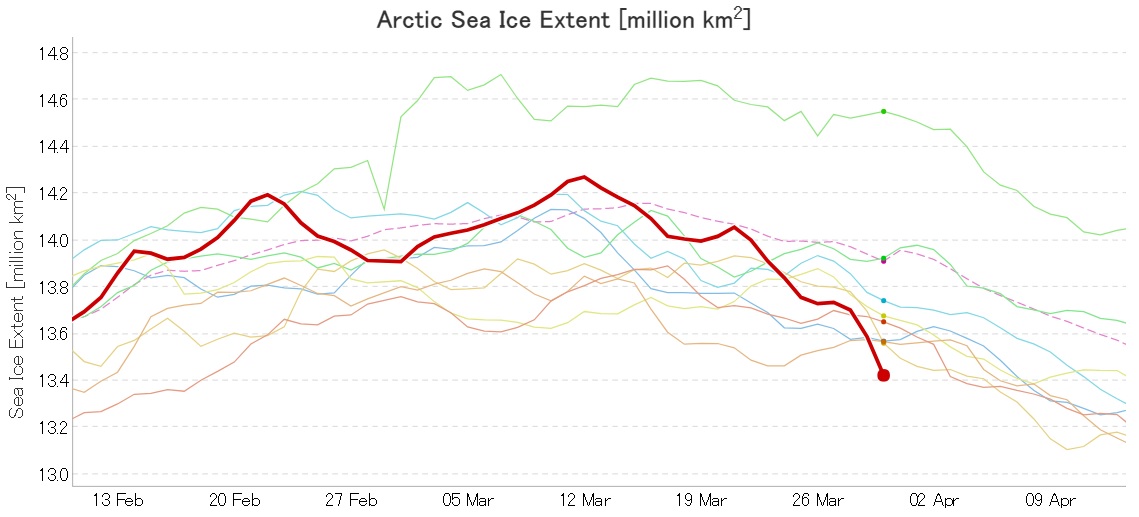
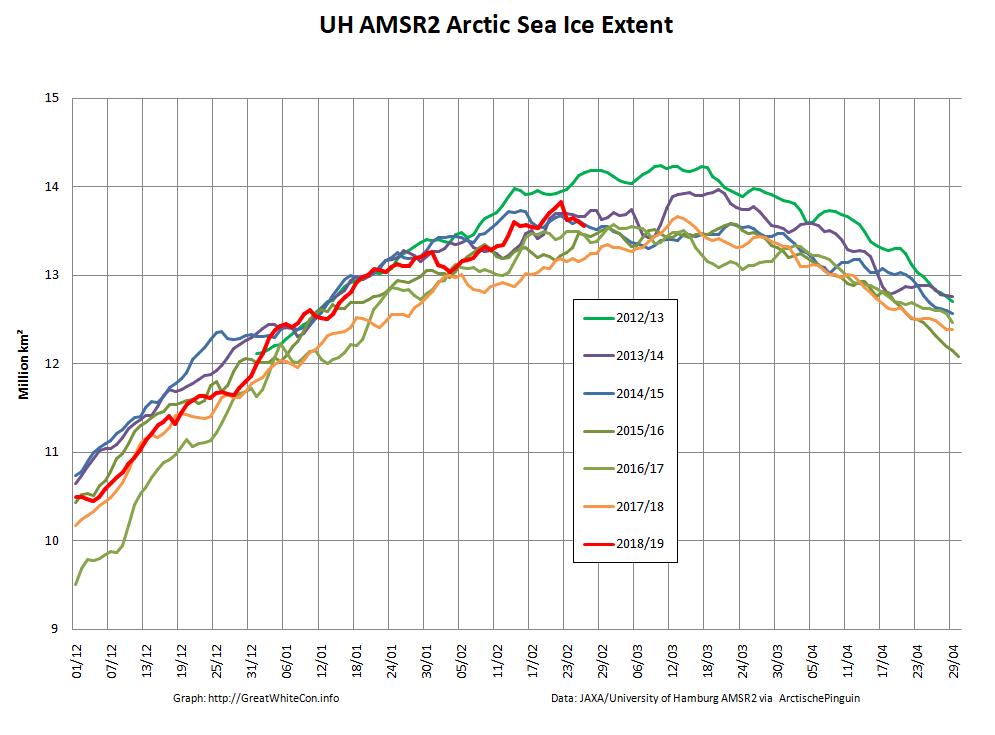
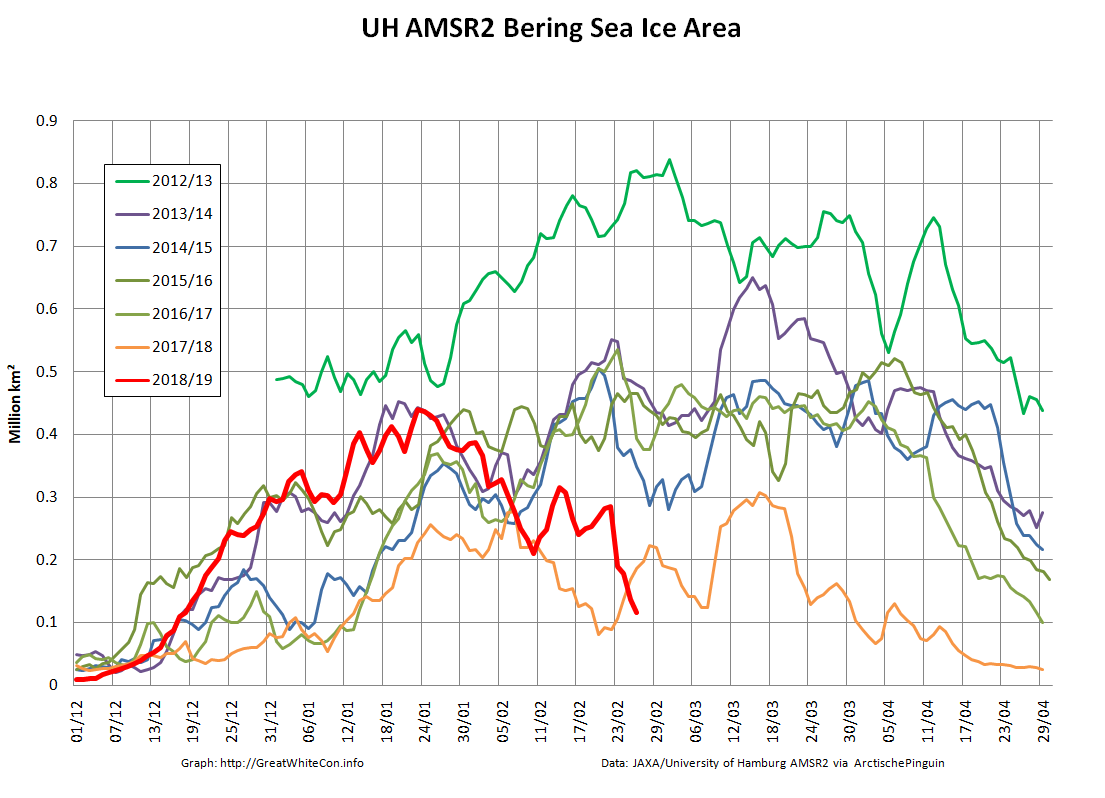
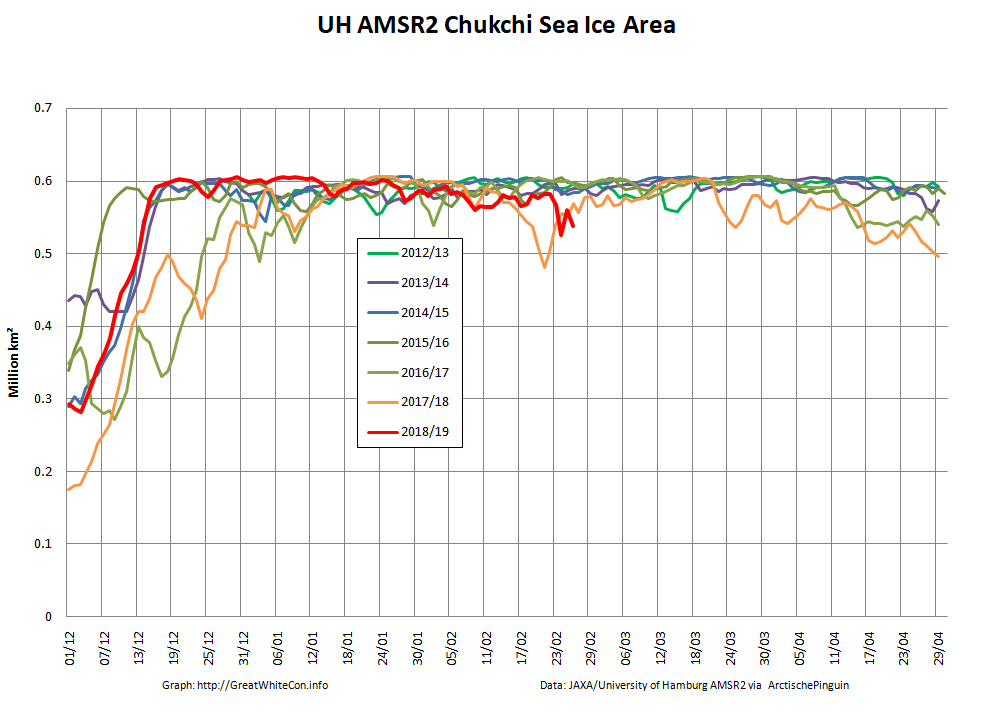
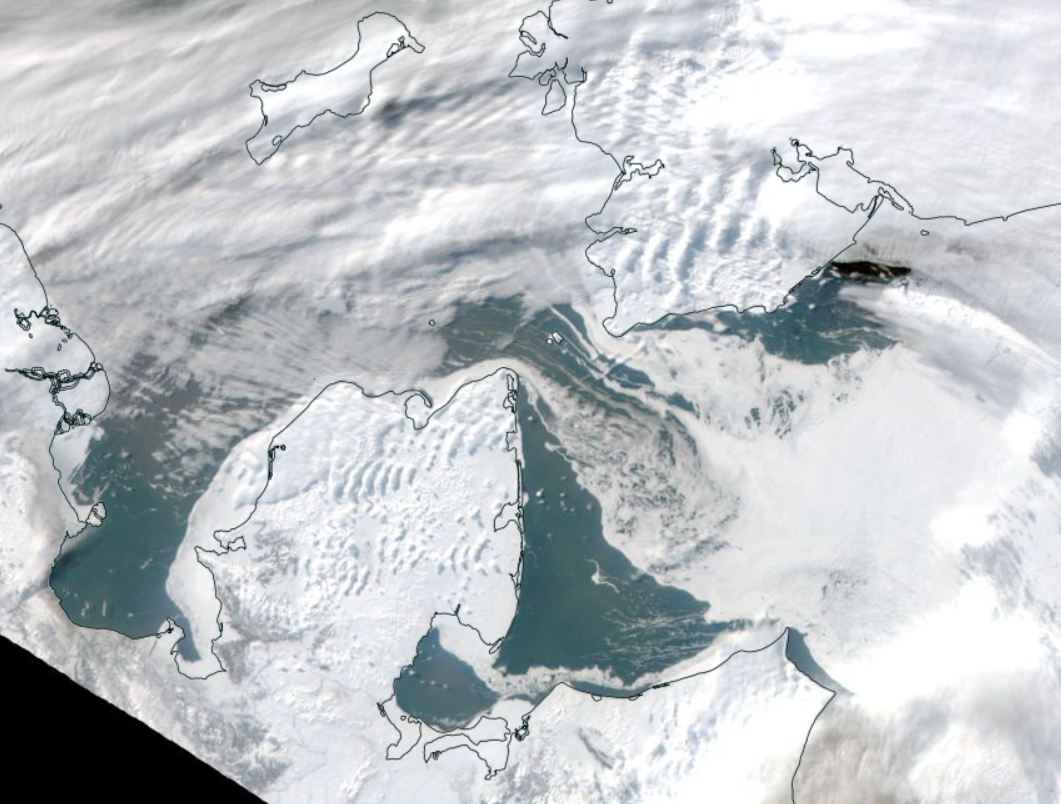
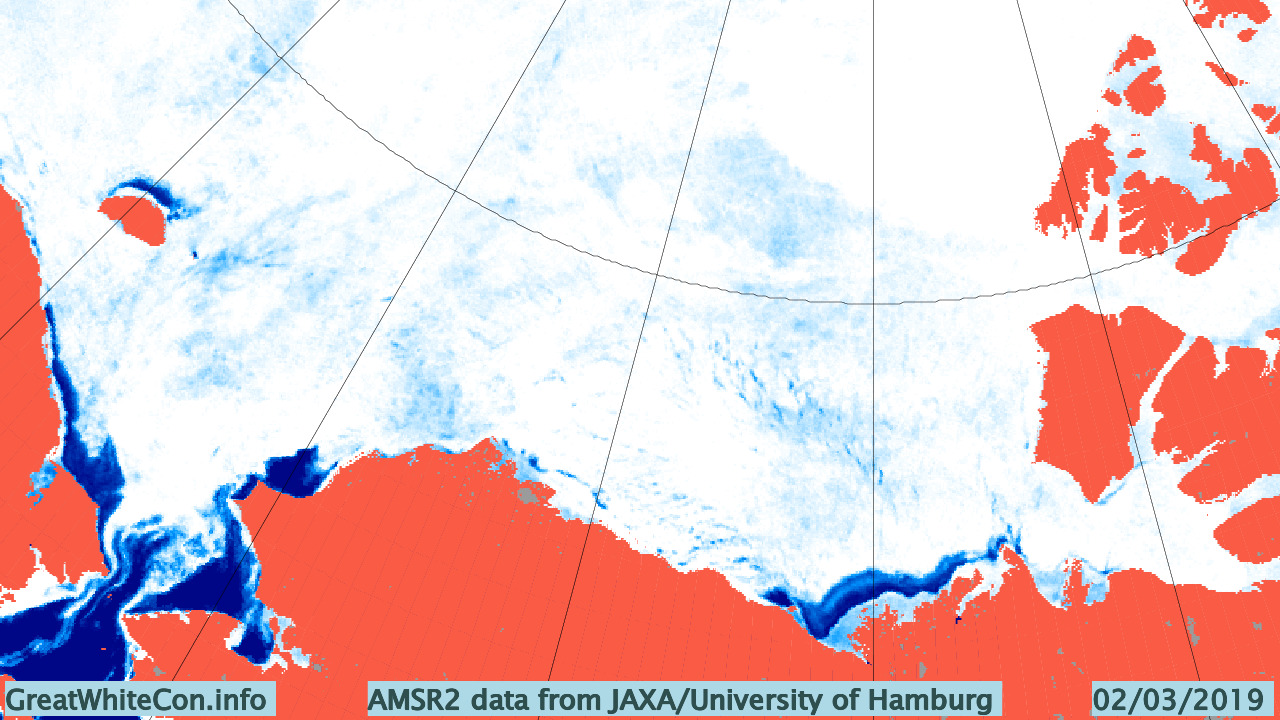
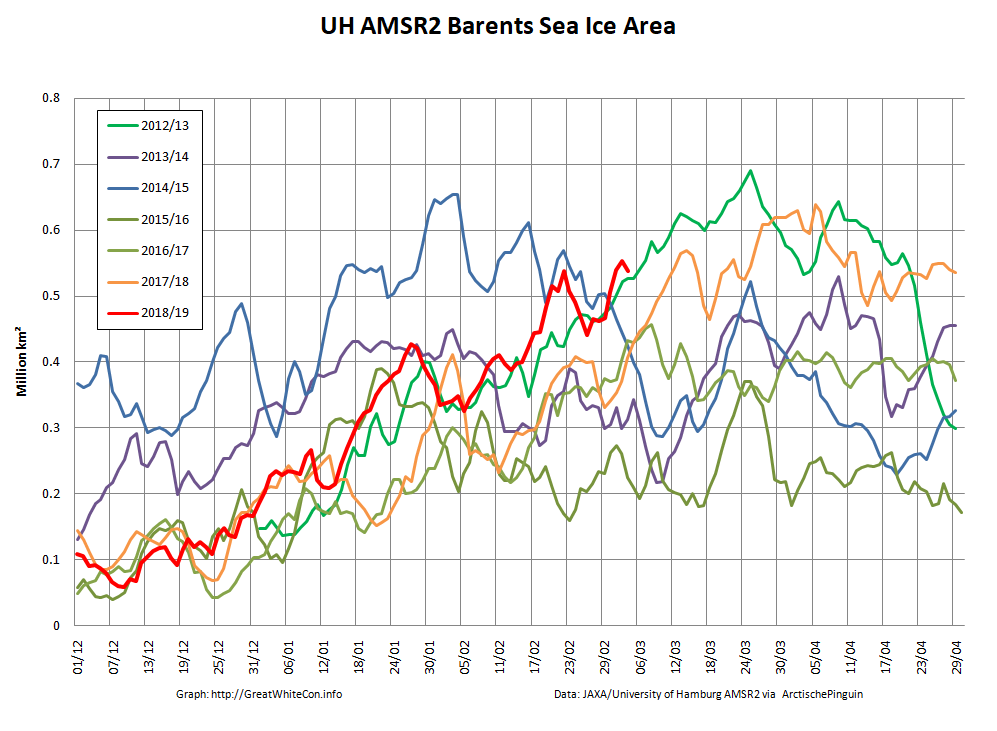
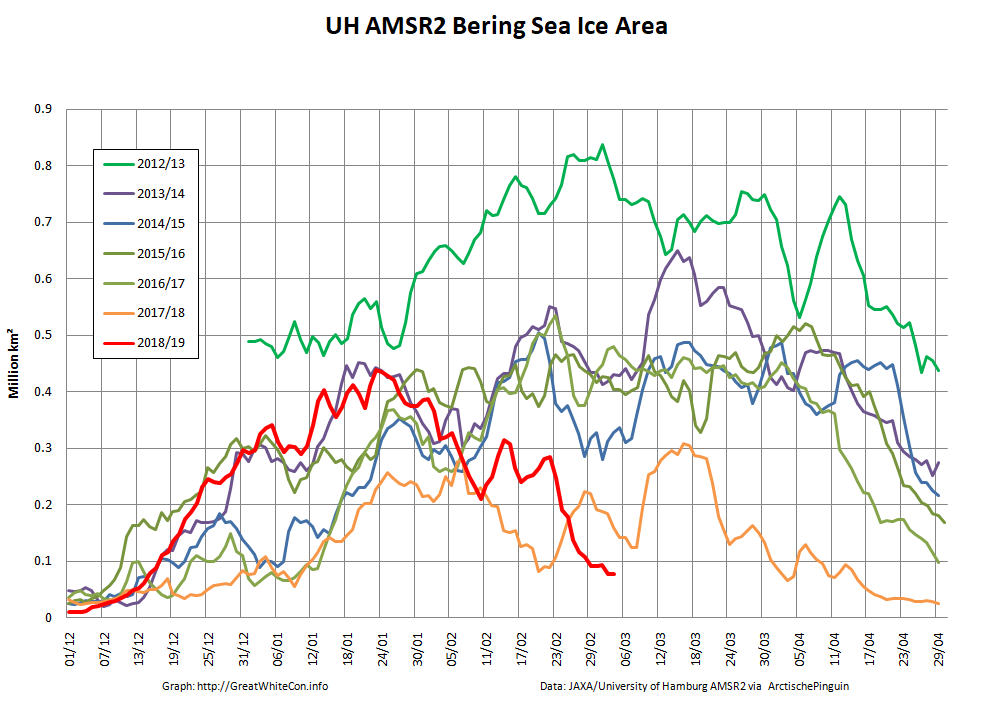
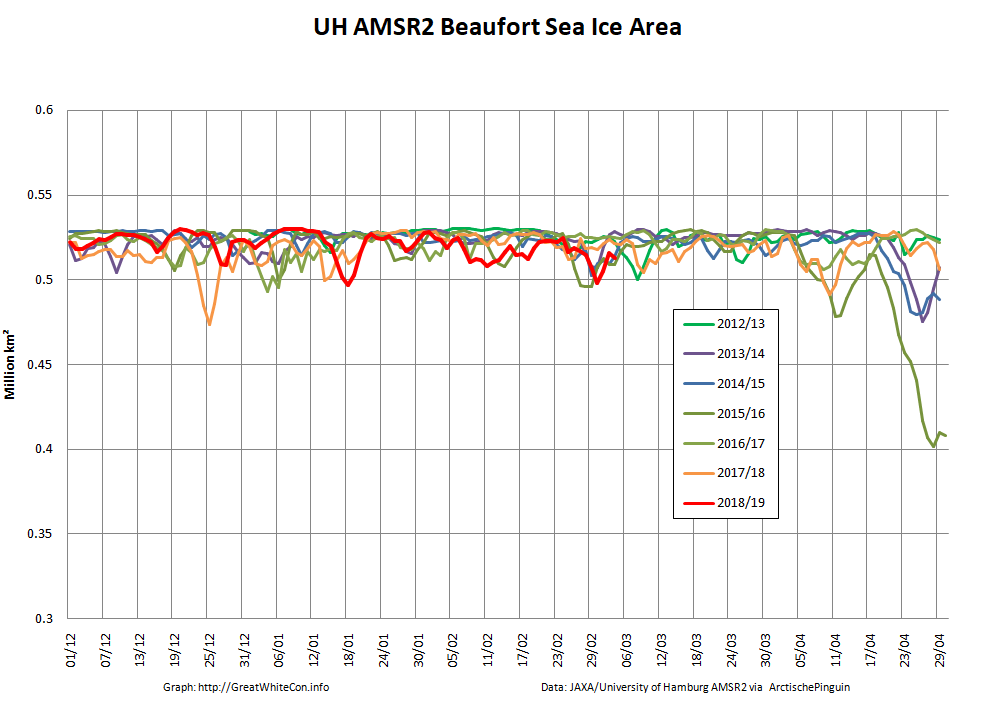
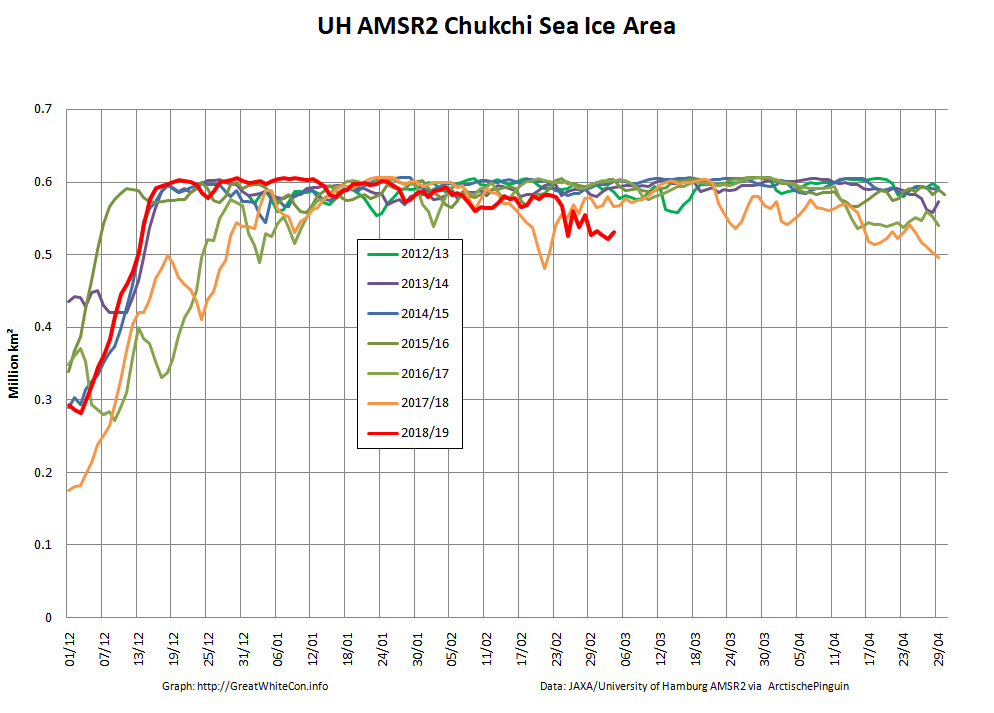
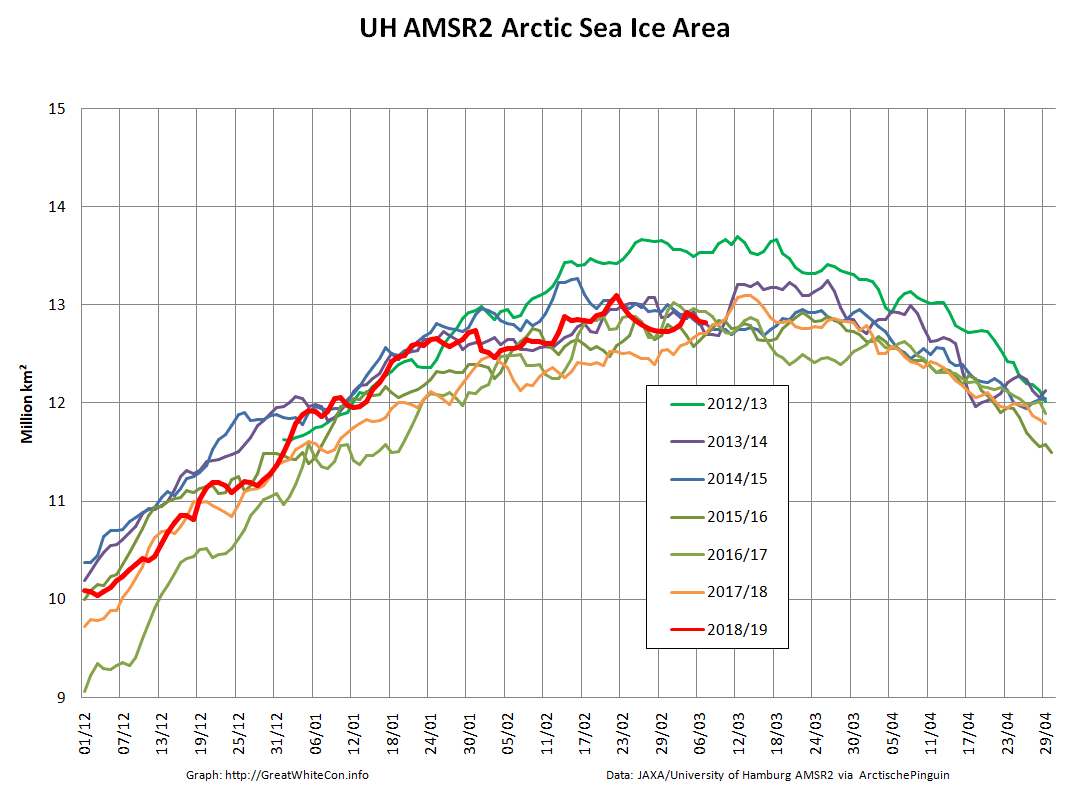
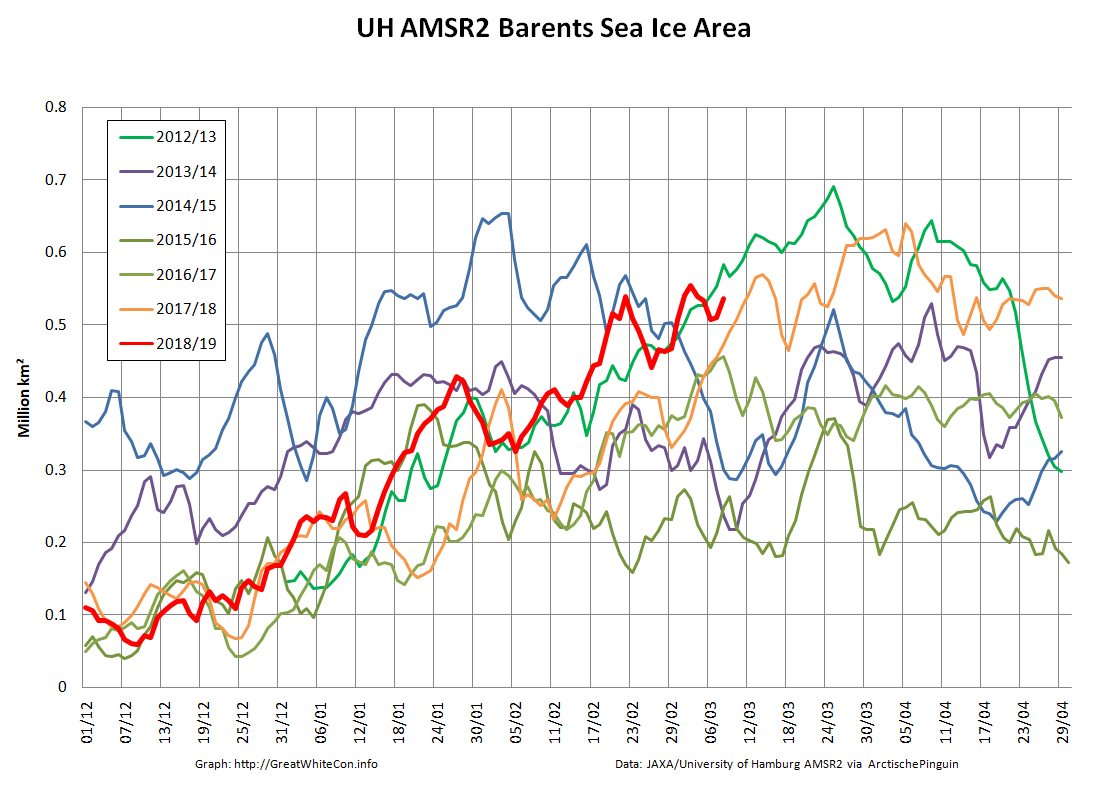
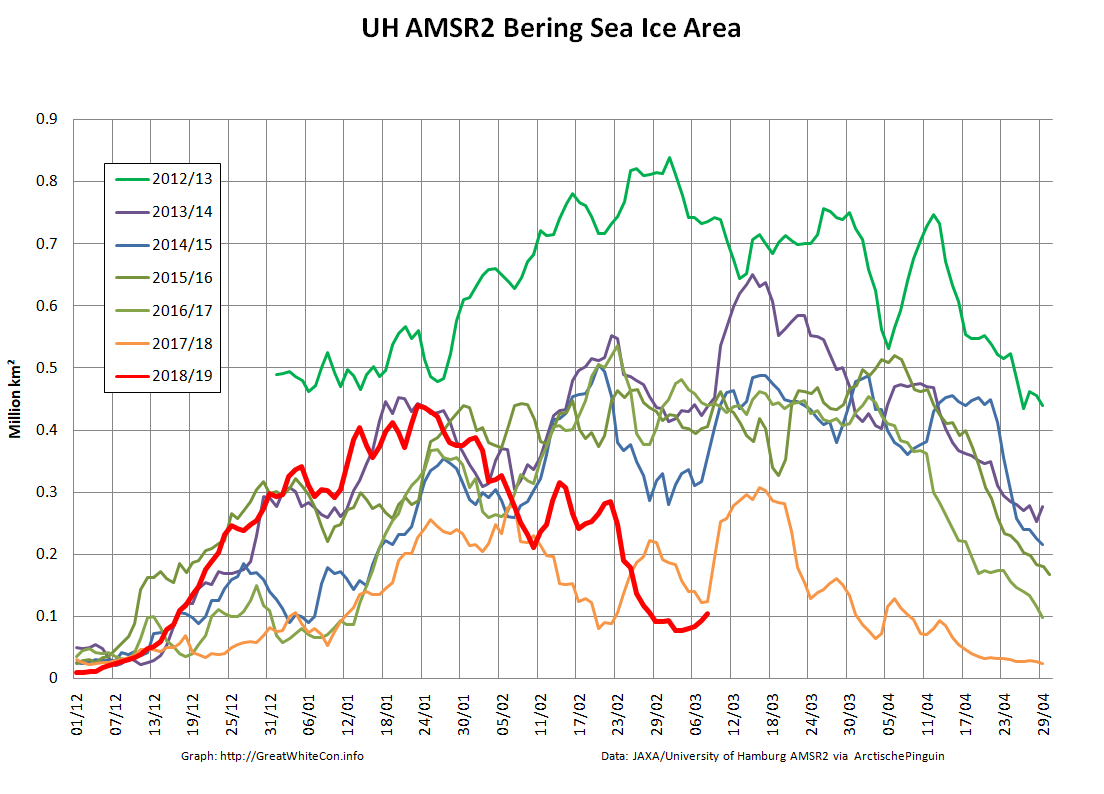
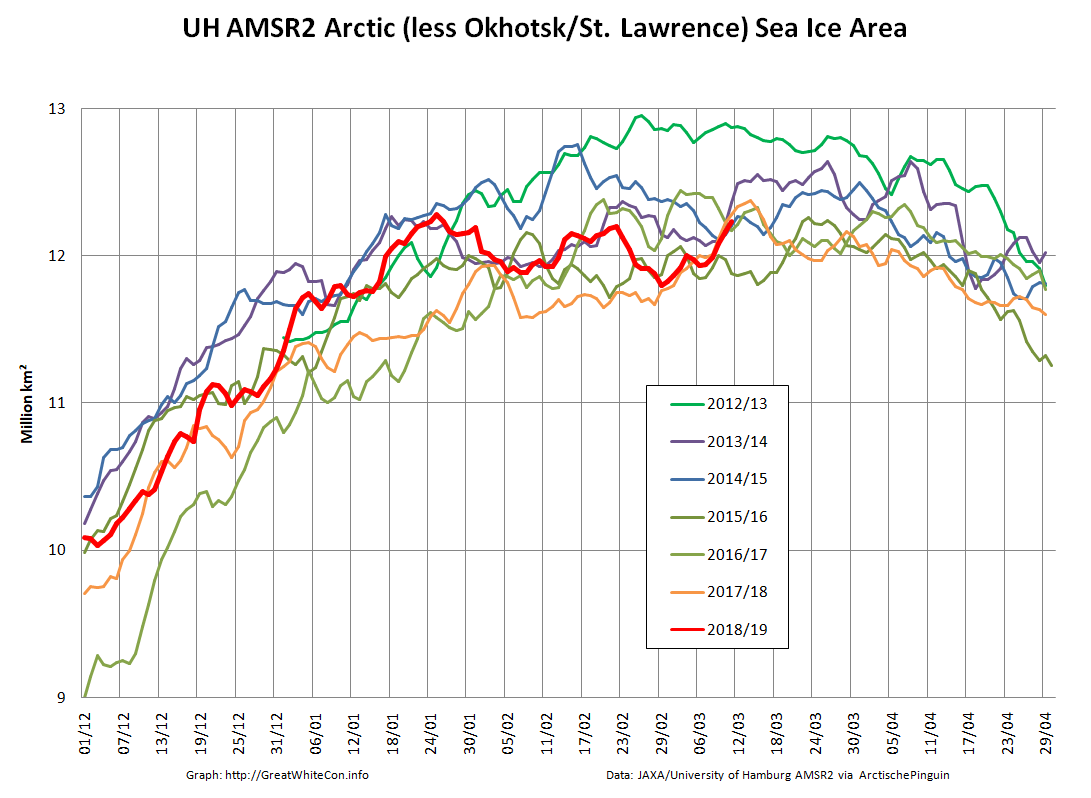
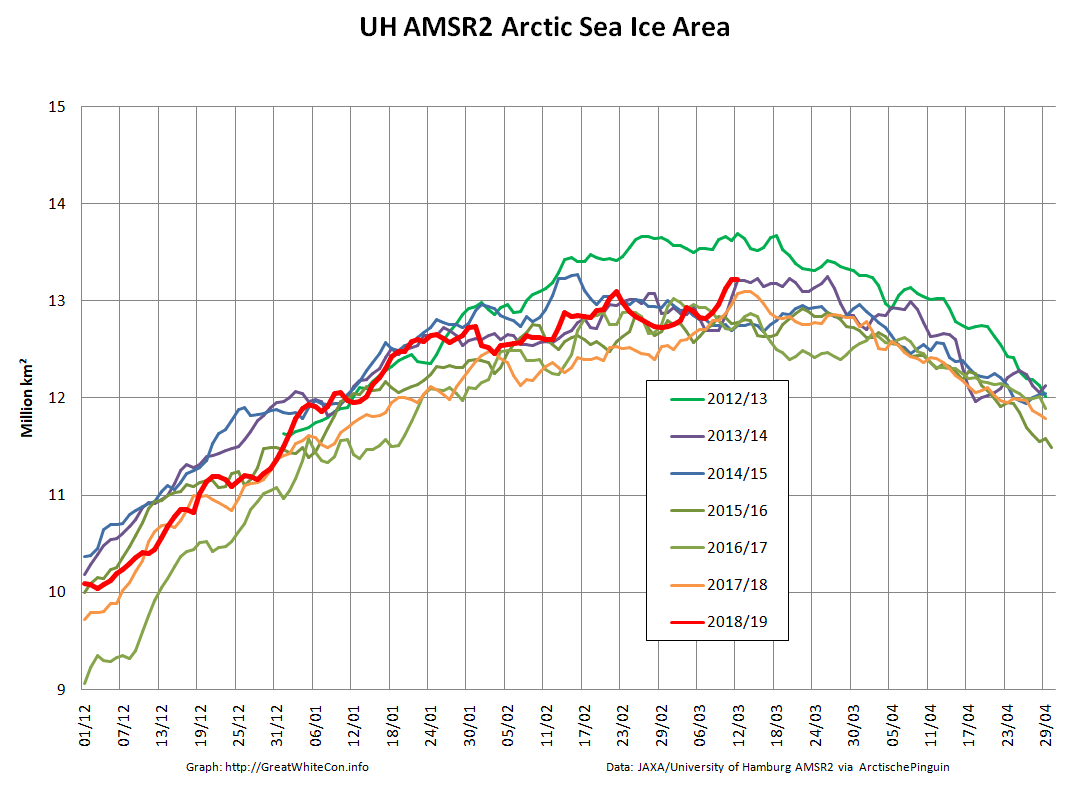
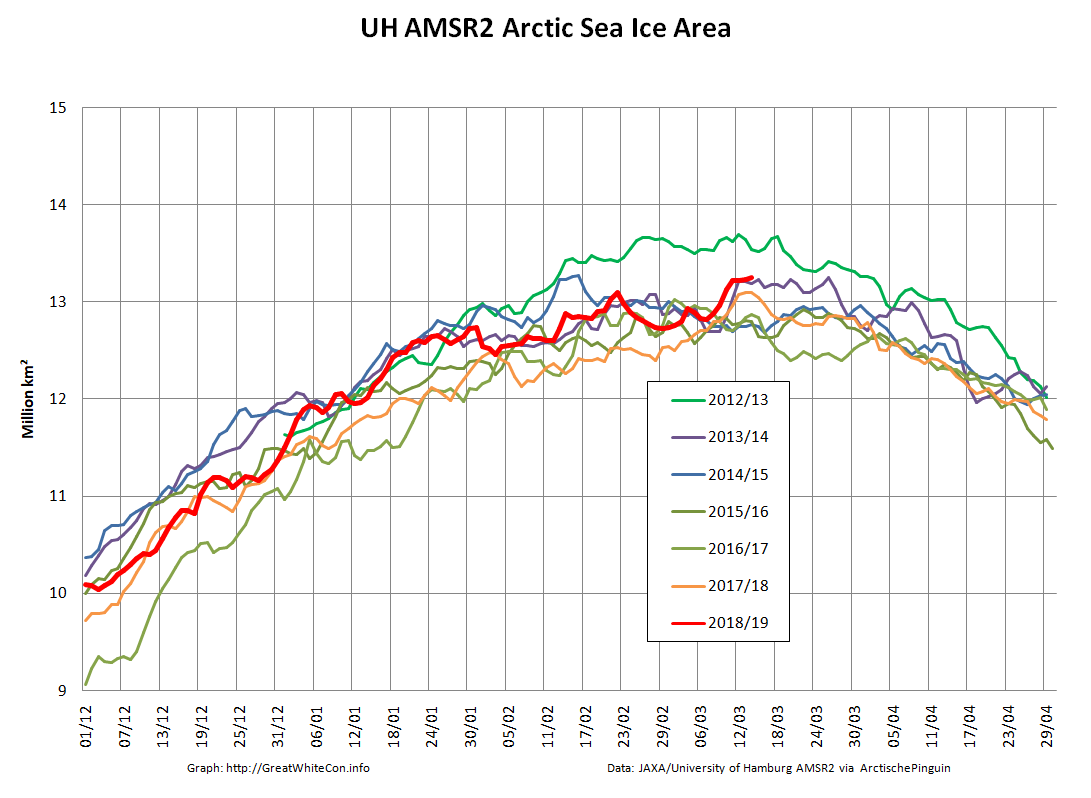
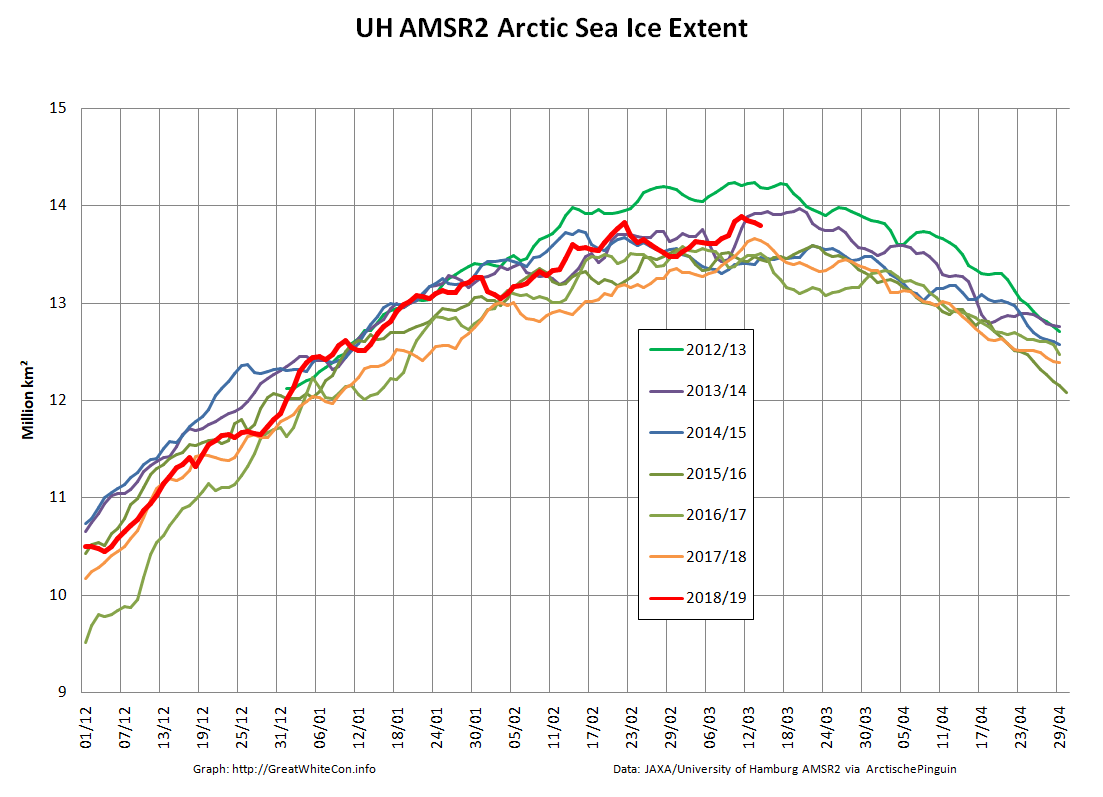
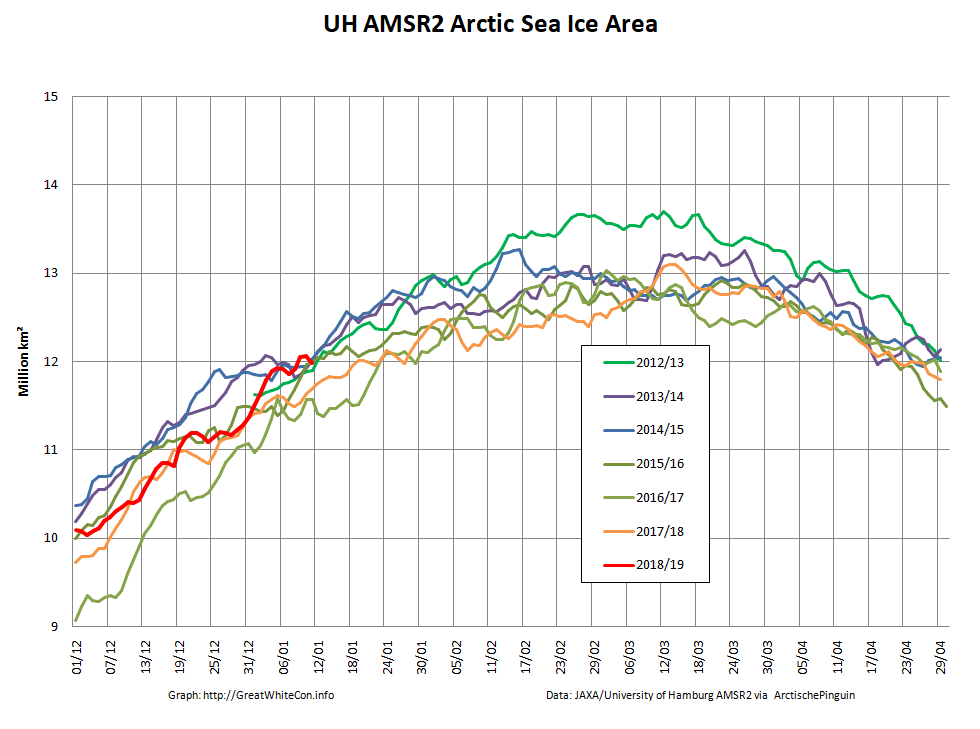
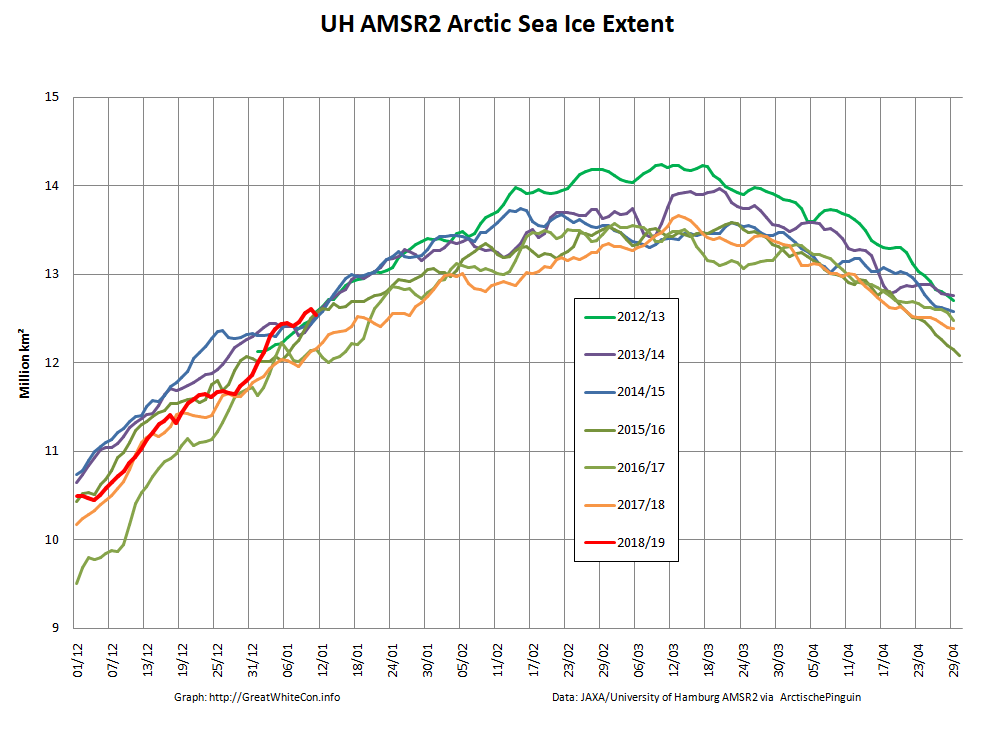
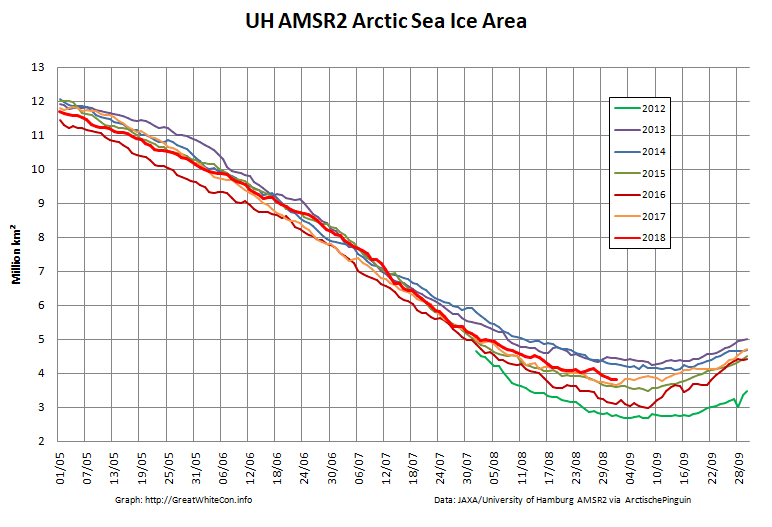
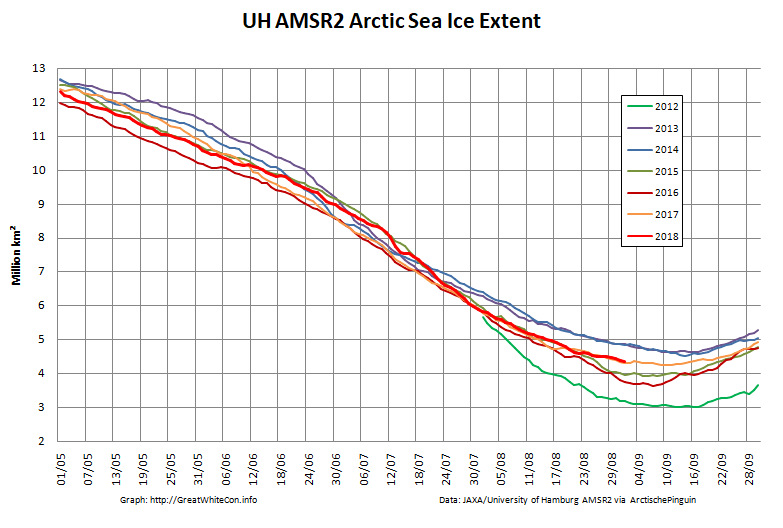
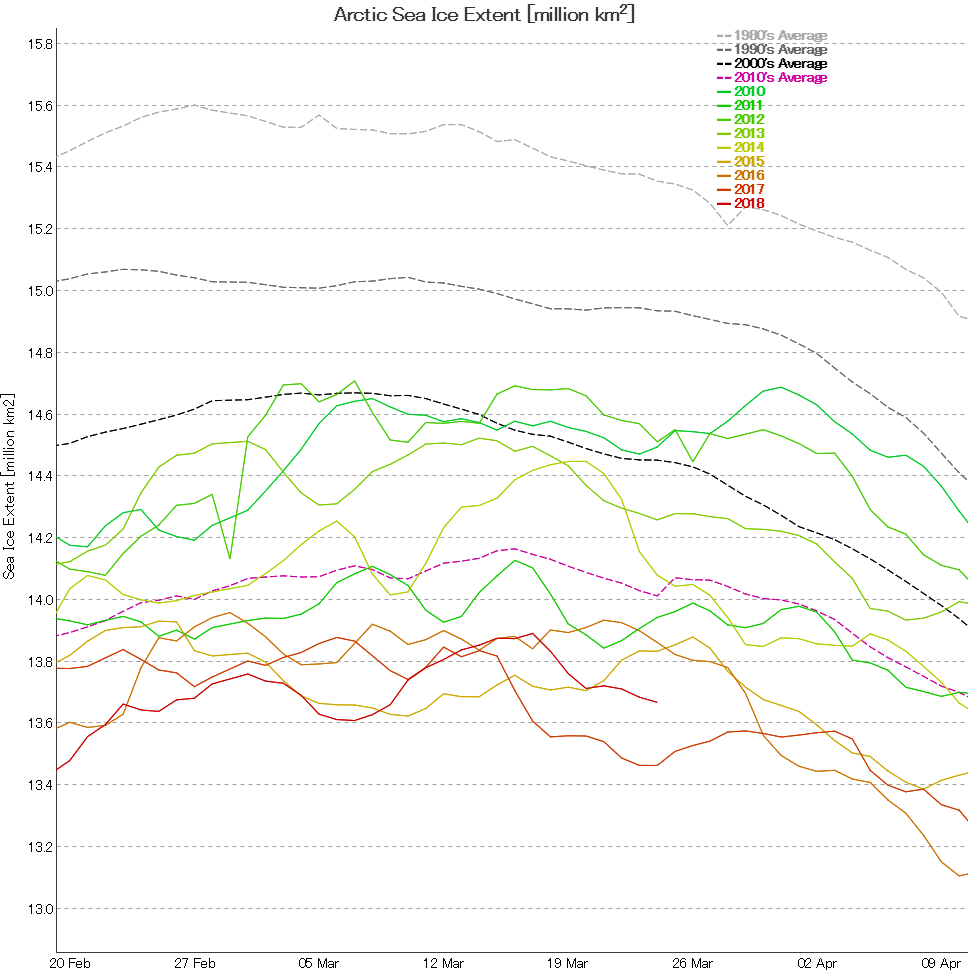
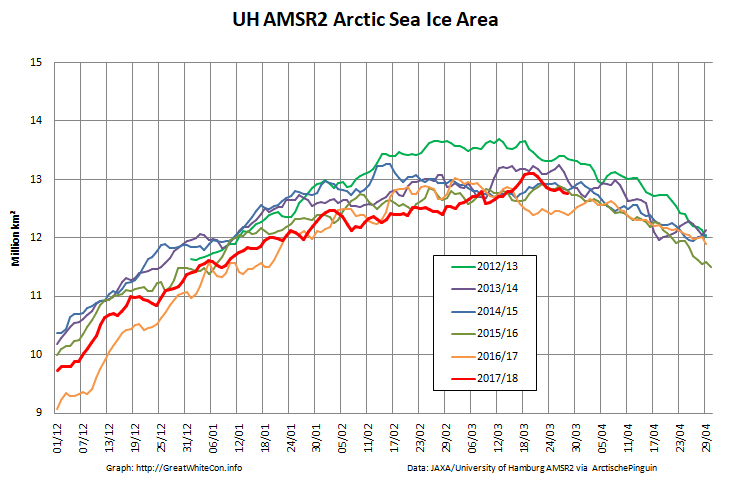
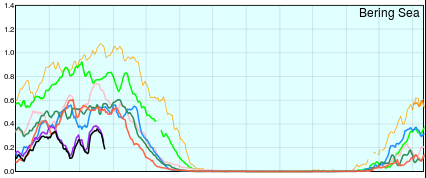
The high resolution AMSR2 regional graphs make clear that the precipitous drop on the Pacific periphery has continued:

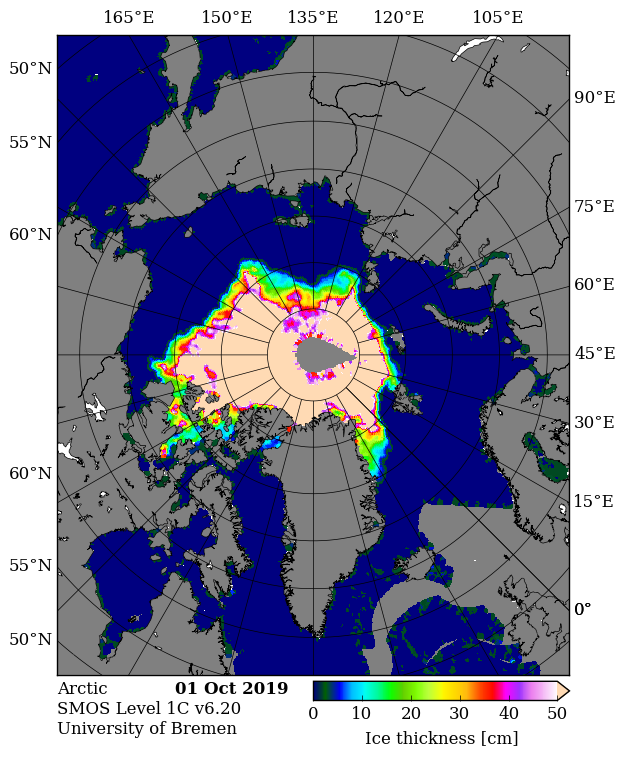
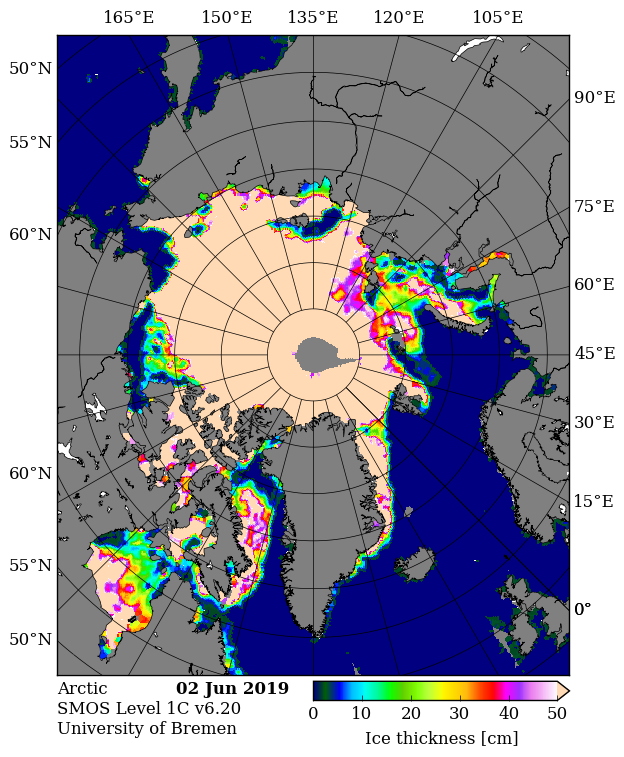
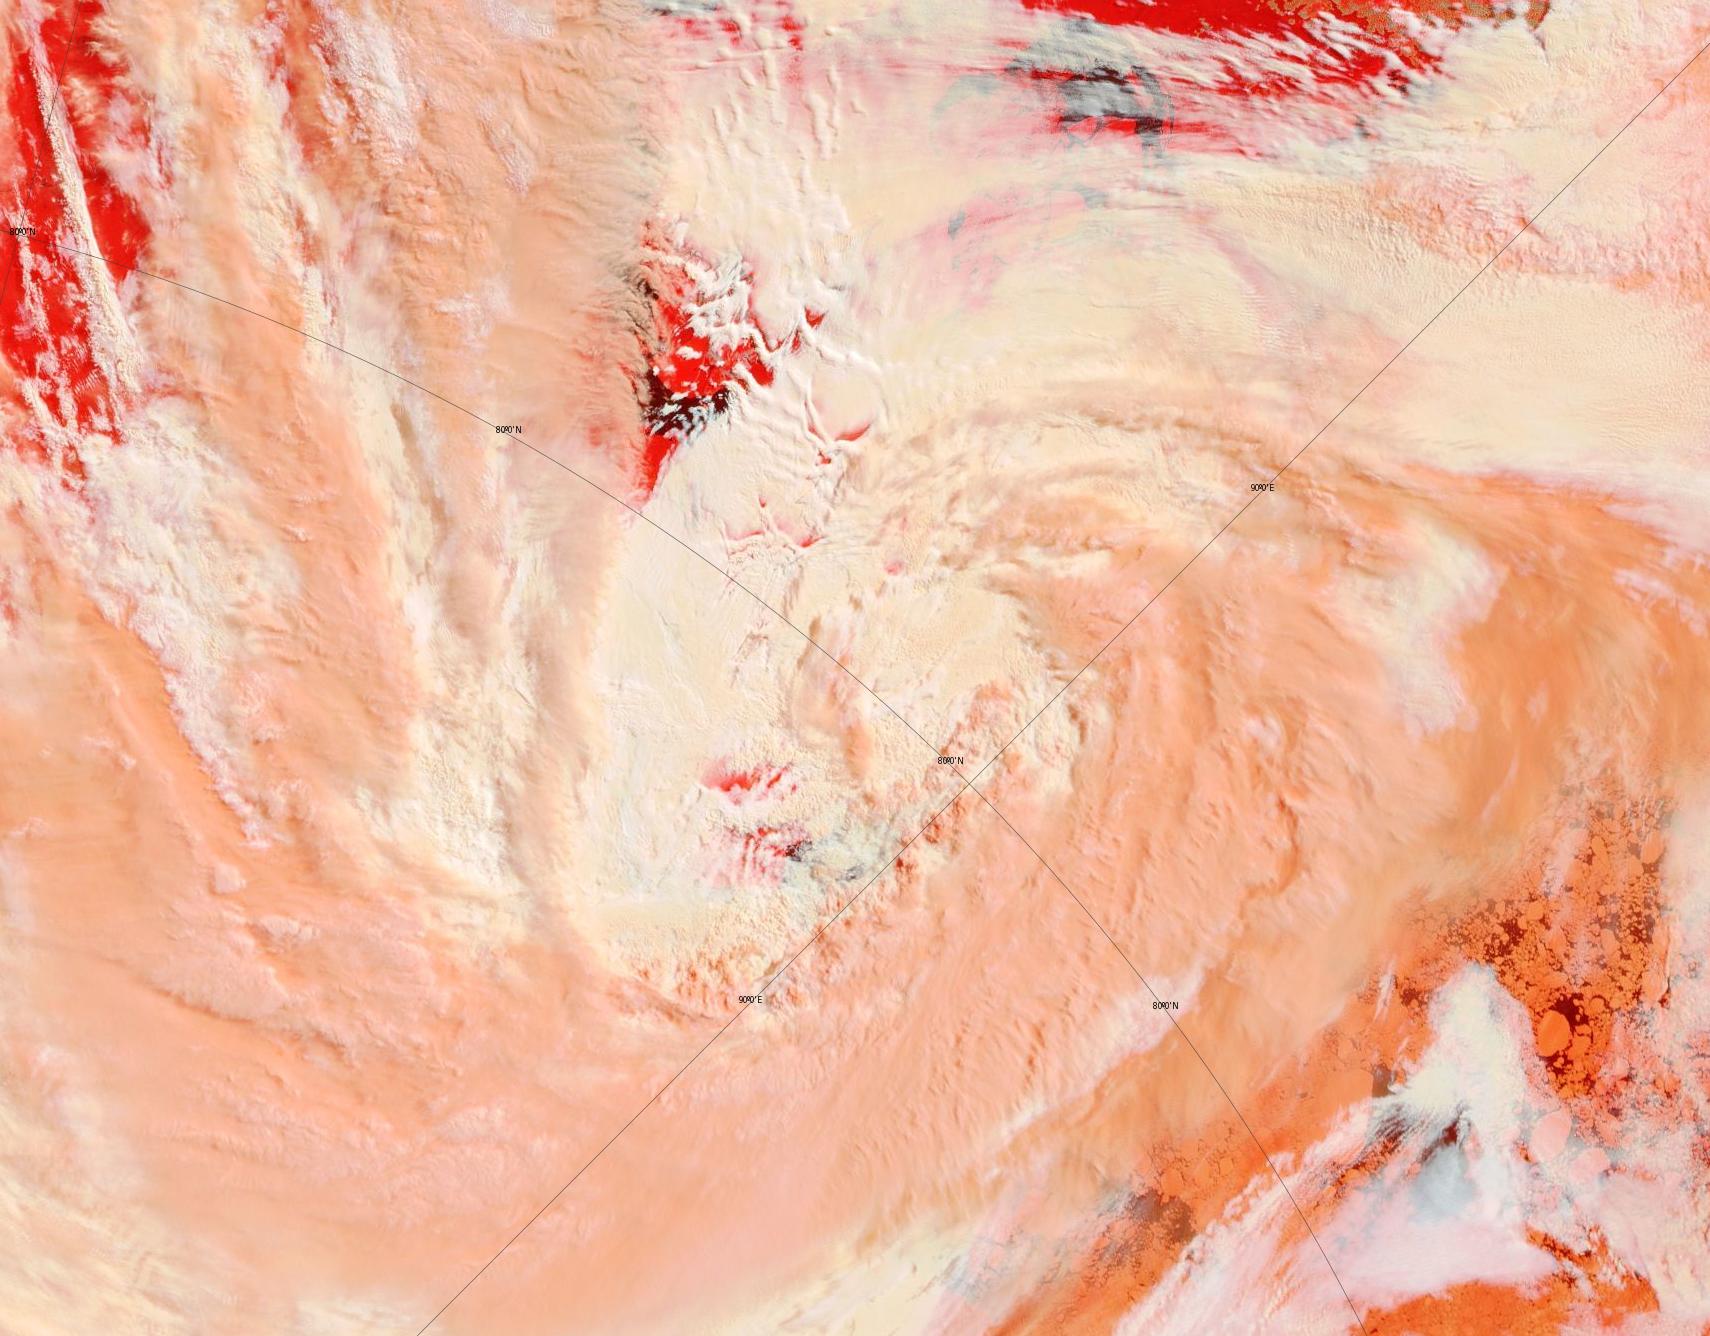
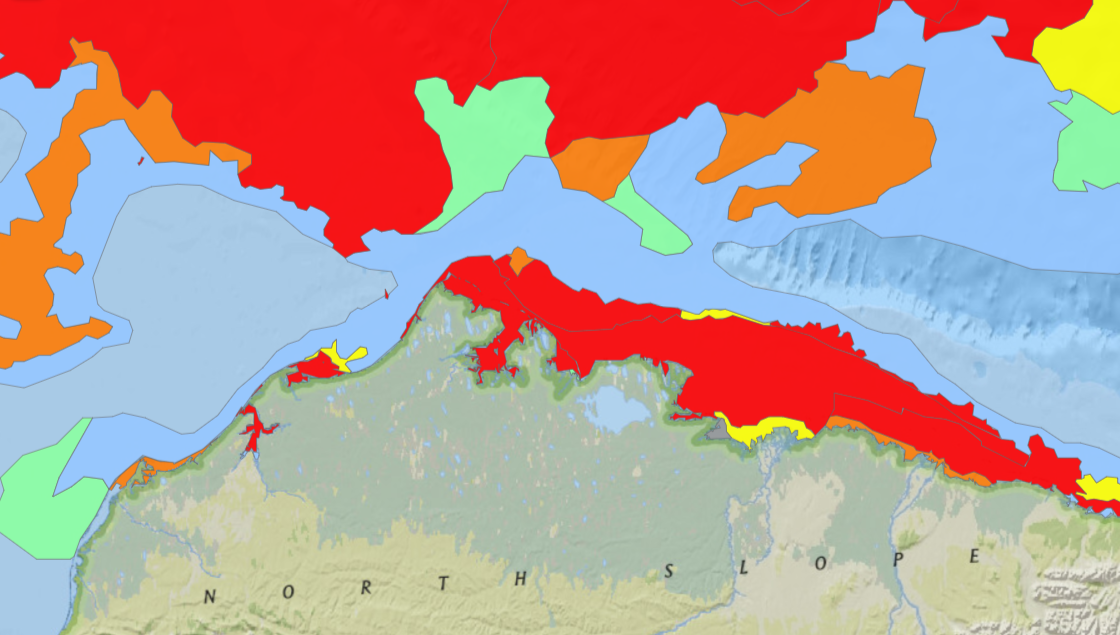
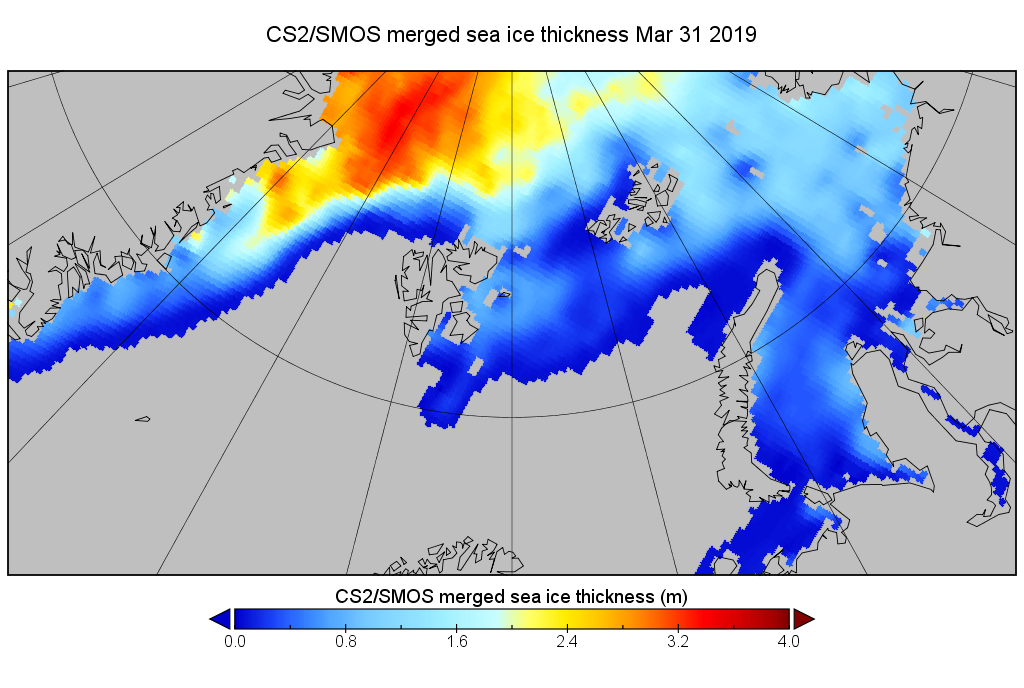
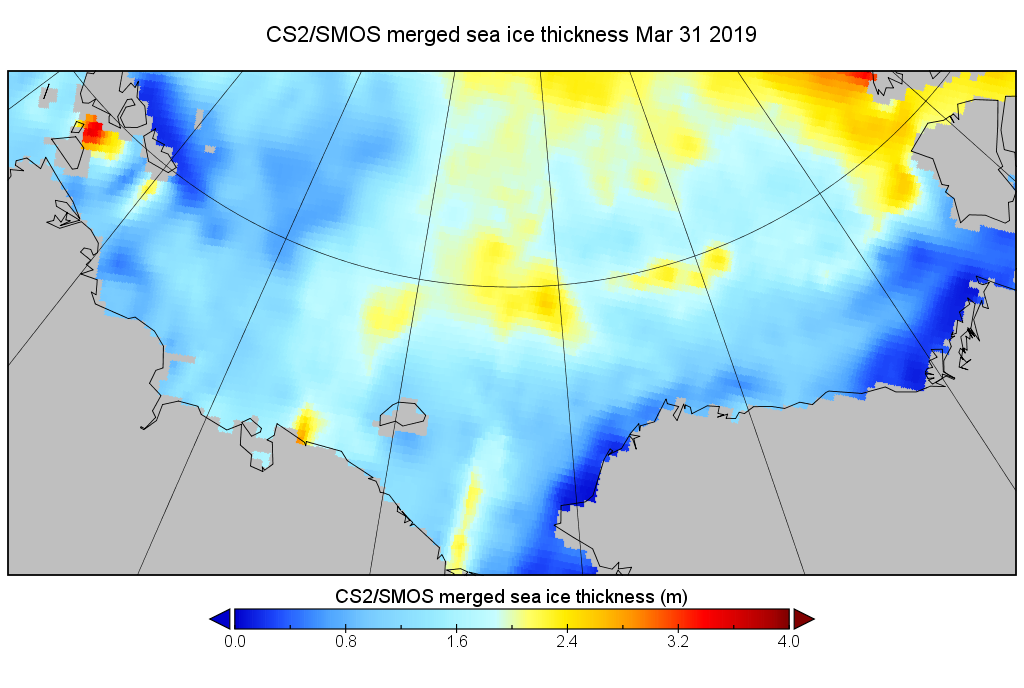
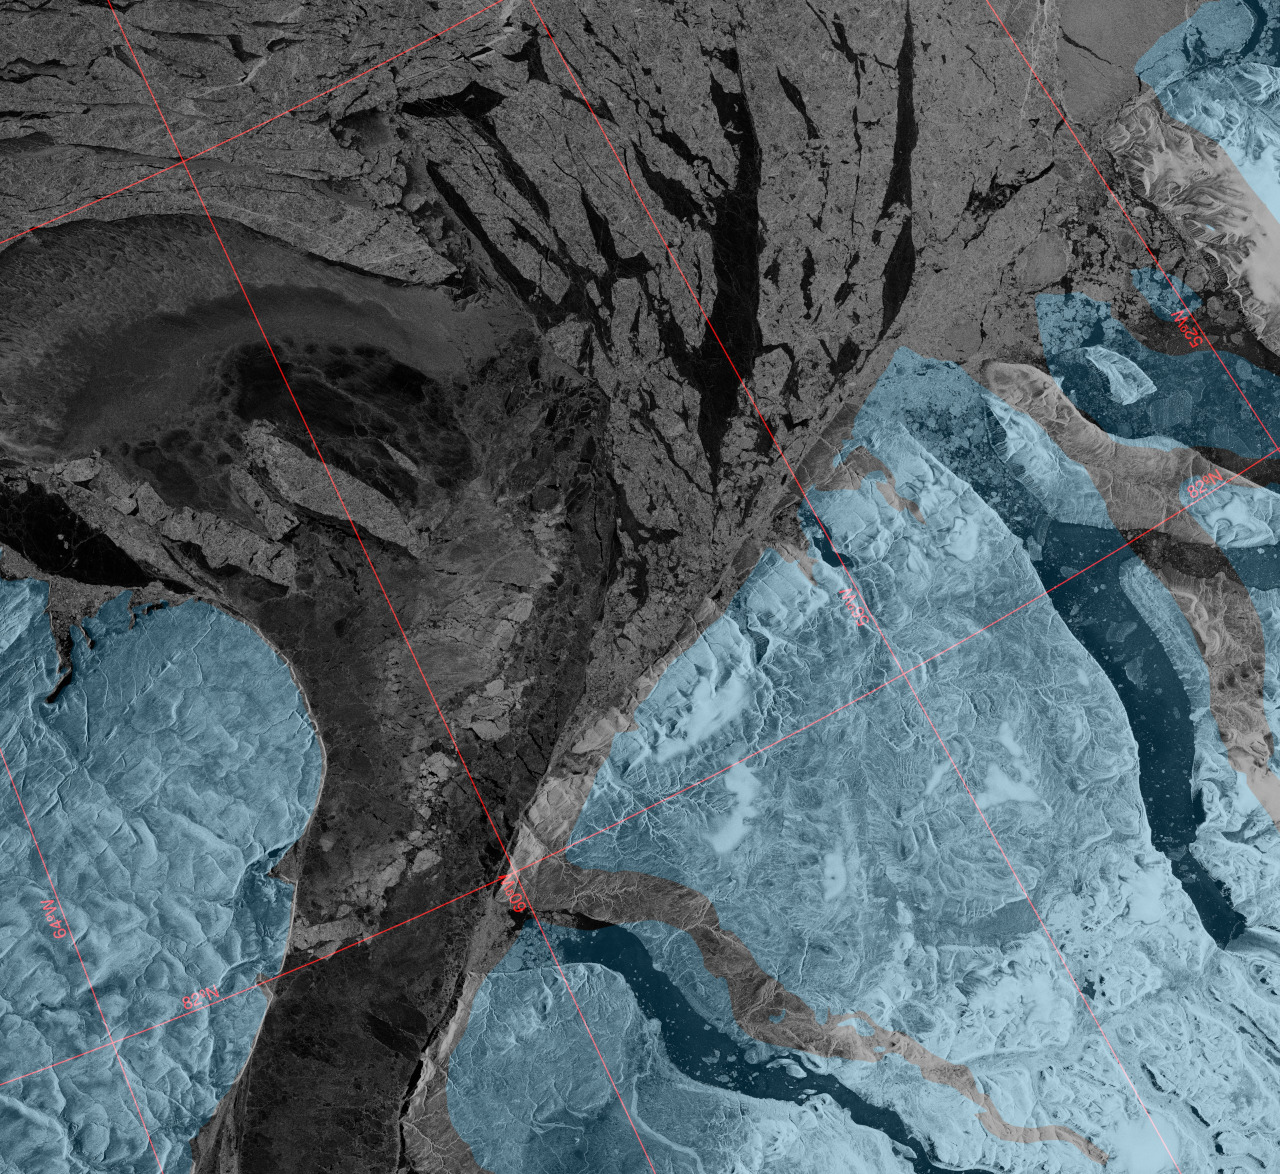
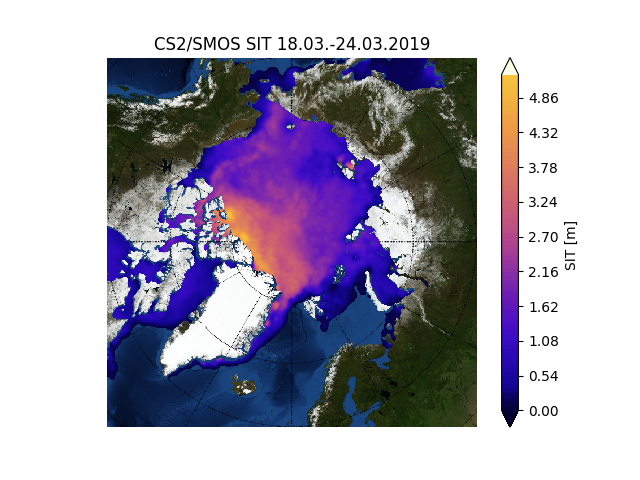
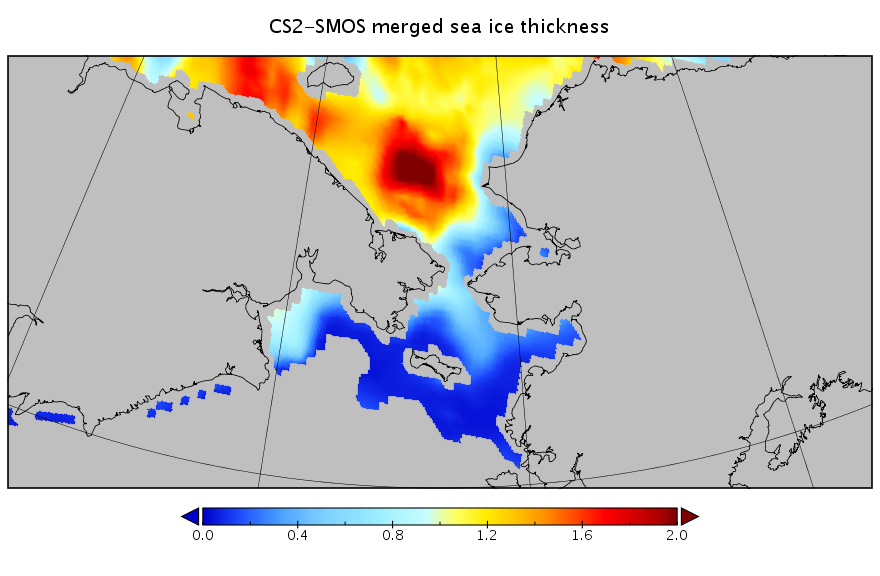
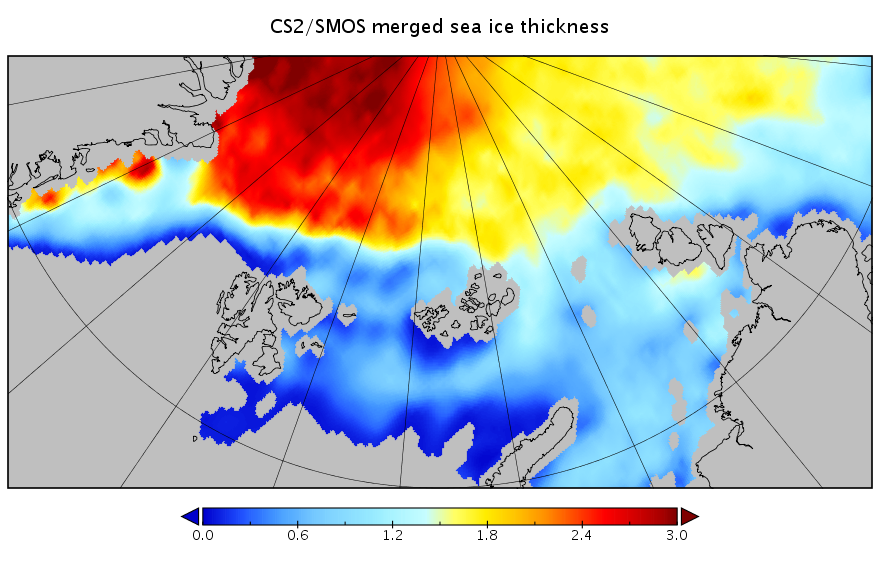
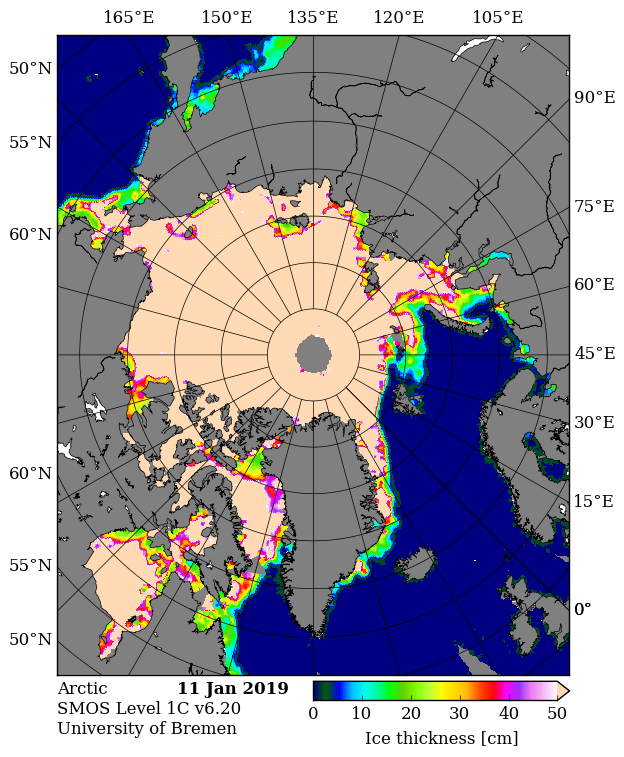
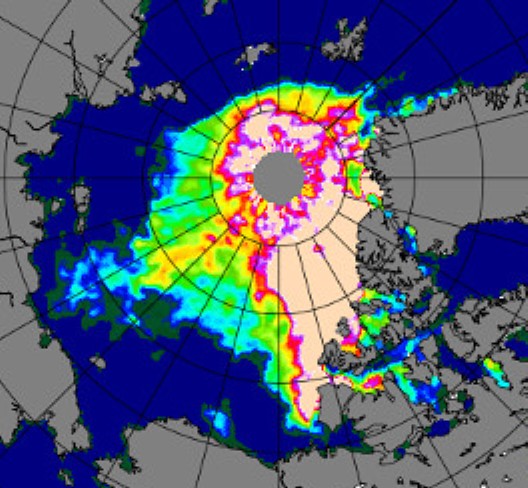
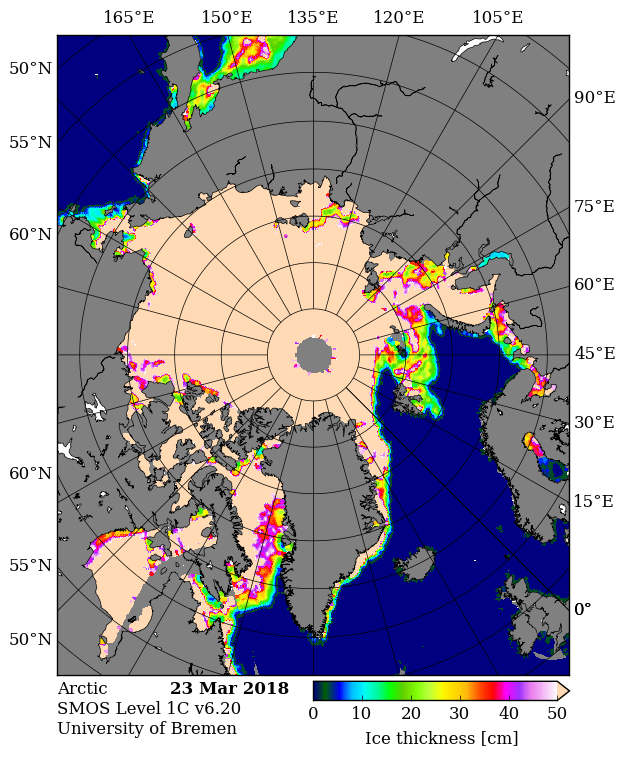
The current combined SMOS/SMAP Arctic sea ice “thinness” map makes clear that there is plenty more thin ice ready for melting in the Sea of Okhotsk and Baffin Bay:
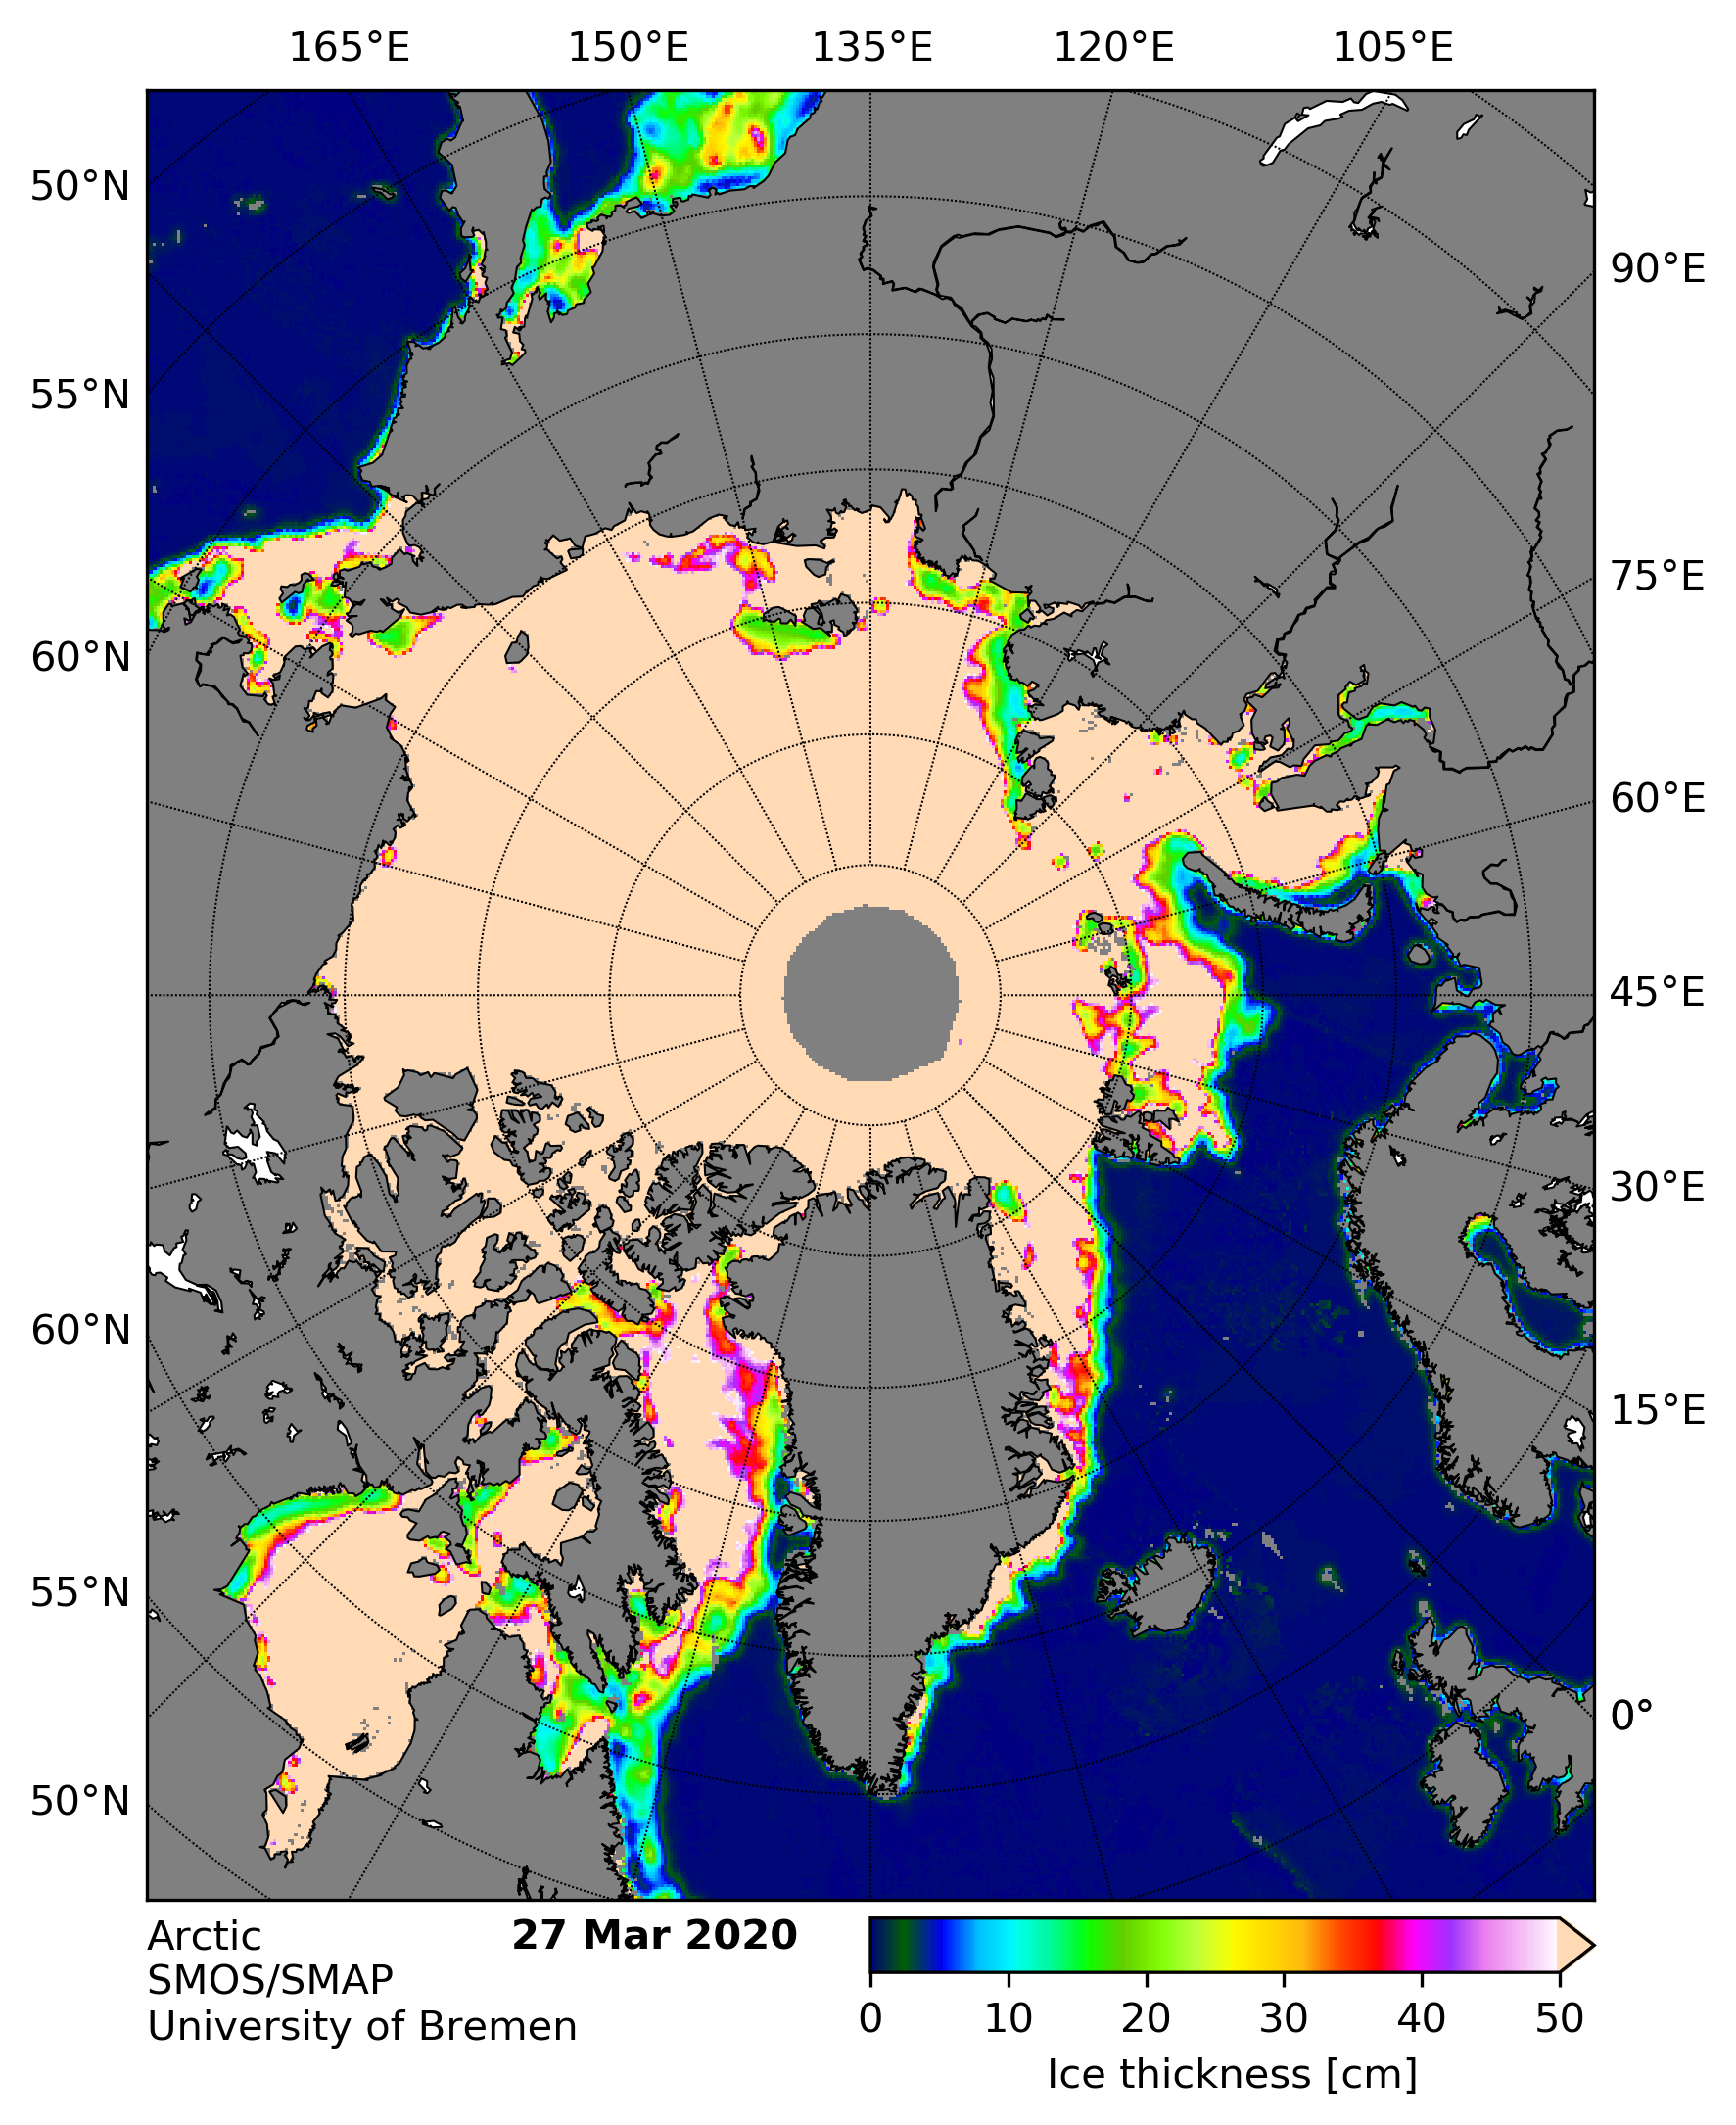
There is also a large area of thin ice in the Laptev Sea, which will be interesting to watch once the 2020 melting season gets underway in earnest.
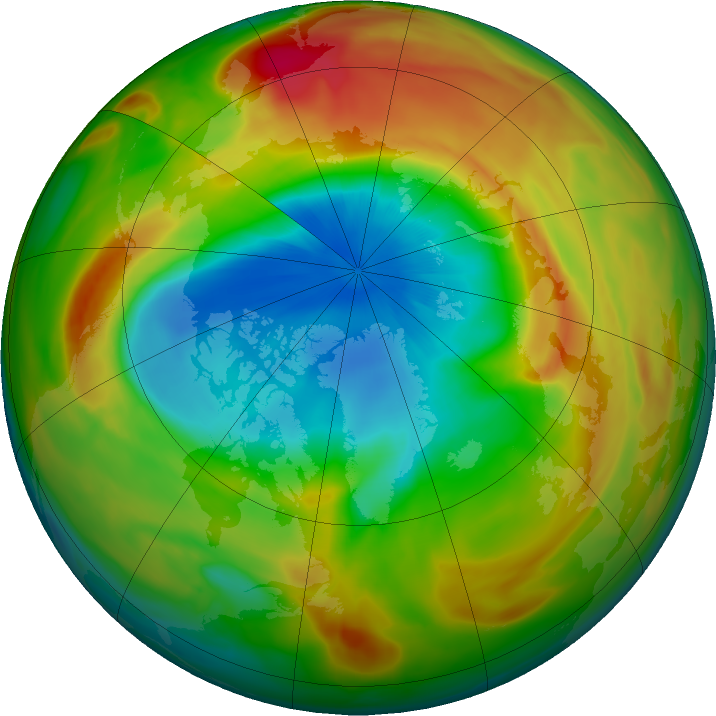
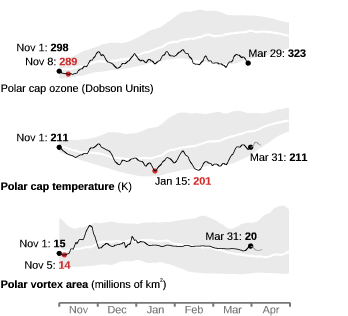
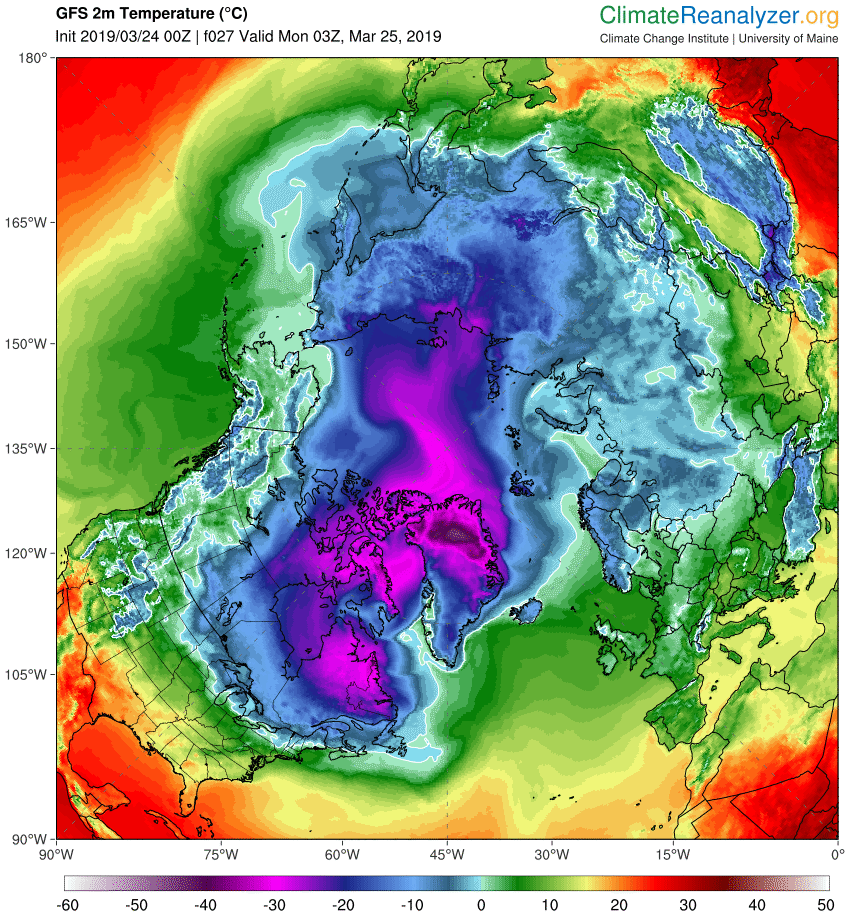
Today is All Fools’ Day, but this is no joke. Thanks to the consistent polar vortex over the Northern Hemisphere winter there is currently an anomalous “ozone hole” over the North Pole. As recently described in Nature:
A vast ozone hole — probably the biggest on record in the north — has opened in the skies above the Arctic. It rivals the better-known Antarctic ozone hole that forms in the southern hemisphere each year.
Record-low ozone levels currently stretch across much of the central Arctic, covering an area about three times the size of Greenland. The hole doesn’t threaten people’s health, and will probably break apart in the coming weeks. But it is an extraordinary atmospheric phenomenon that will go down in the record books.
“From my point of view, this is the first time you can speak about a real ozone hole in the Arctic,” says Martin Dameris, an atmospheric scientist at the German Aerospace Center in Oberpfaffenhofen.
Here are the latest graphics from the “Arctic Ozone Watch” section of the NASA web site:
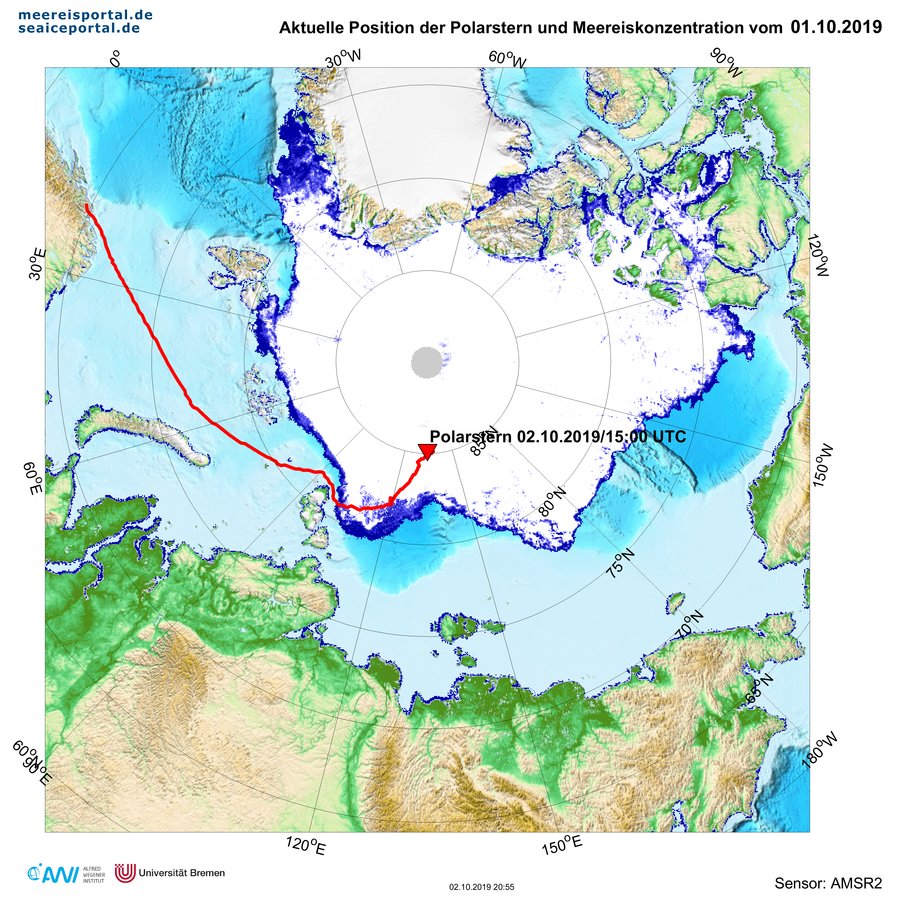
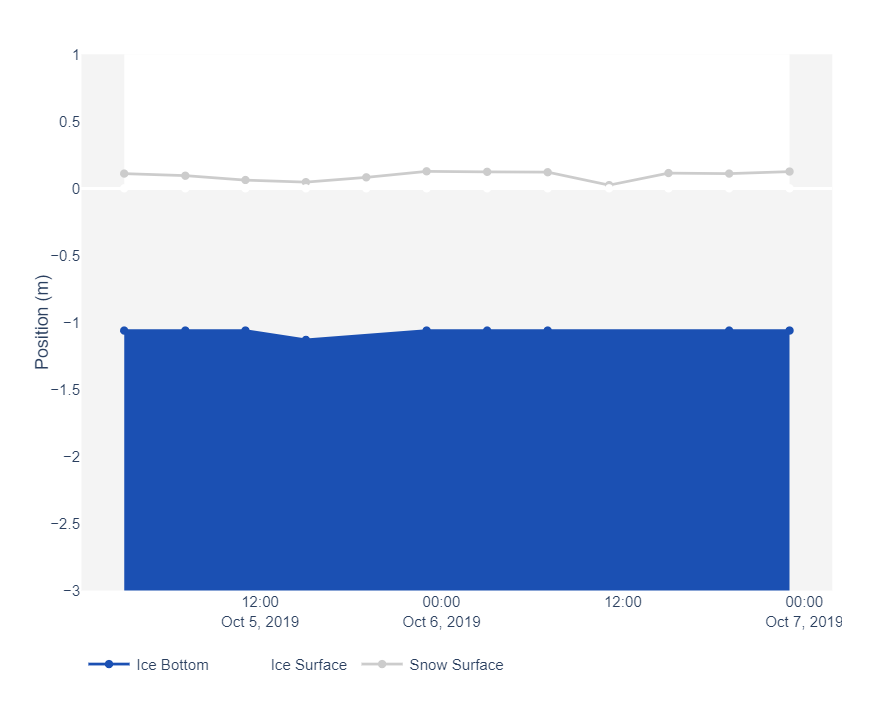
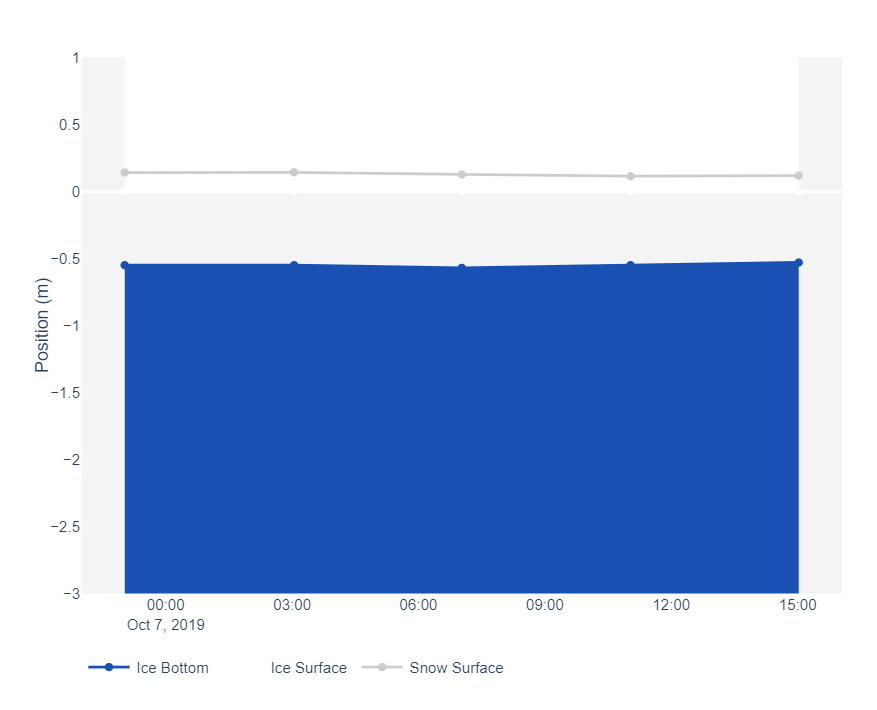
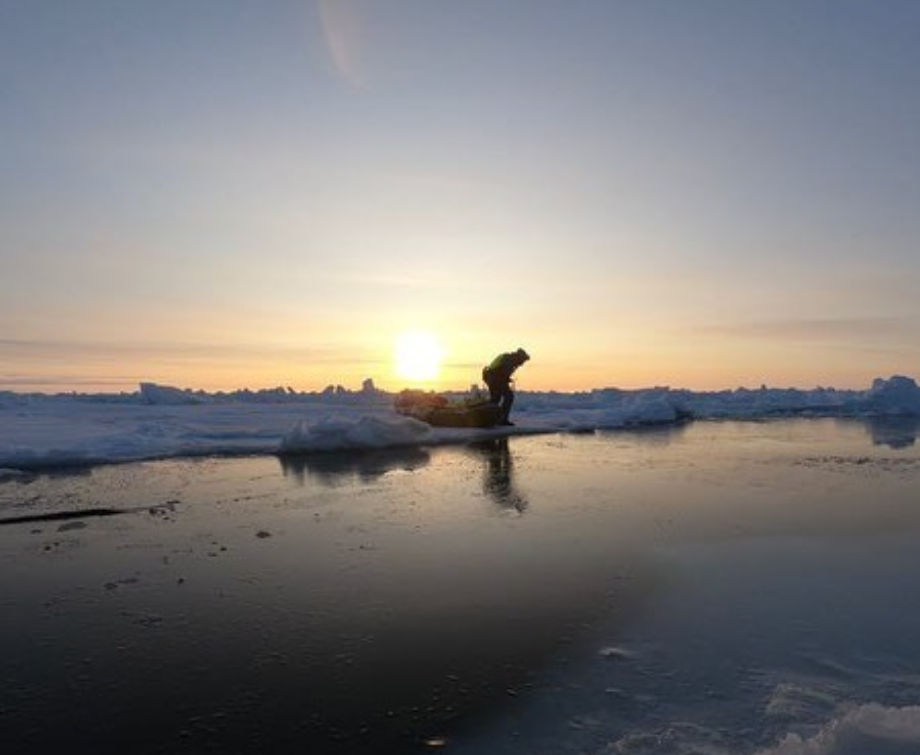
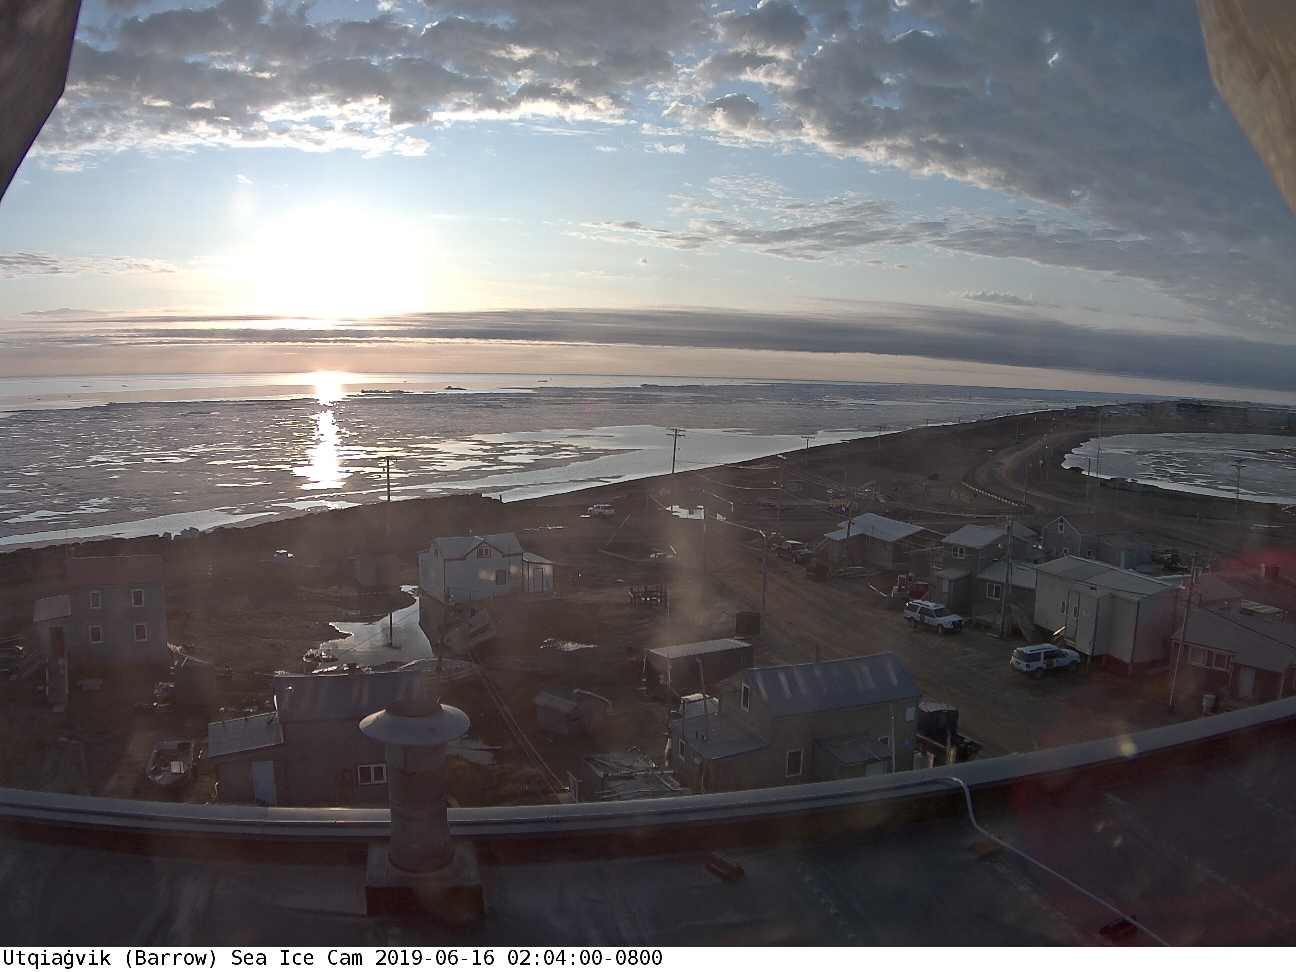
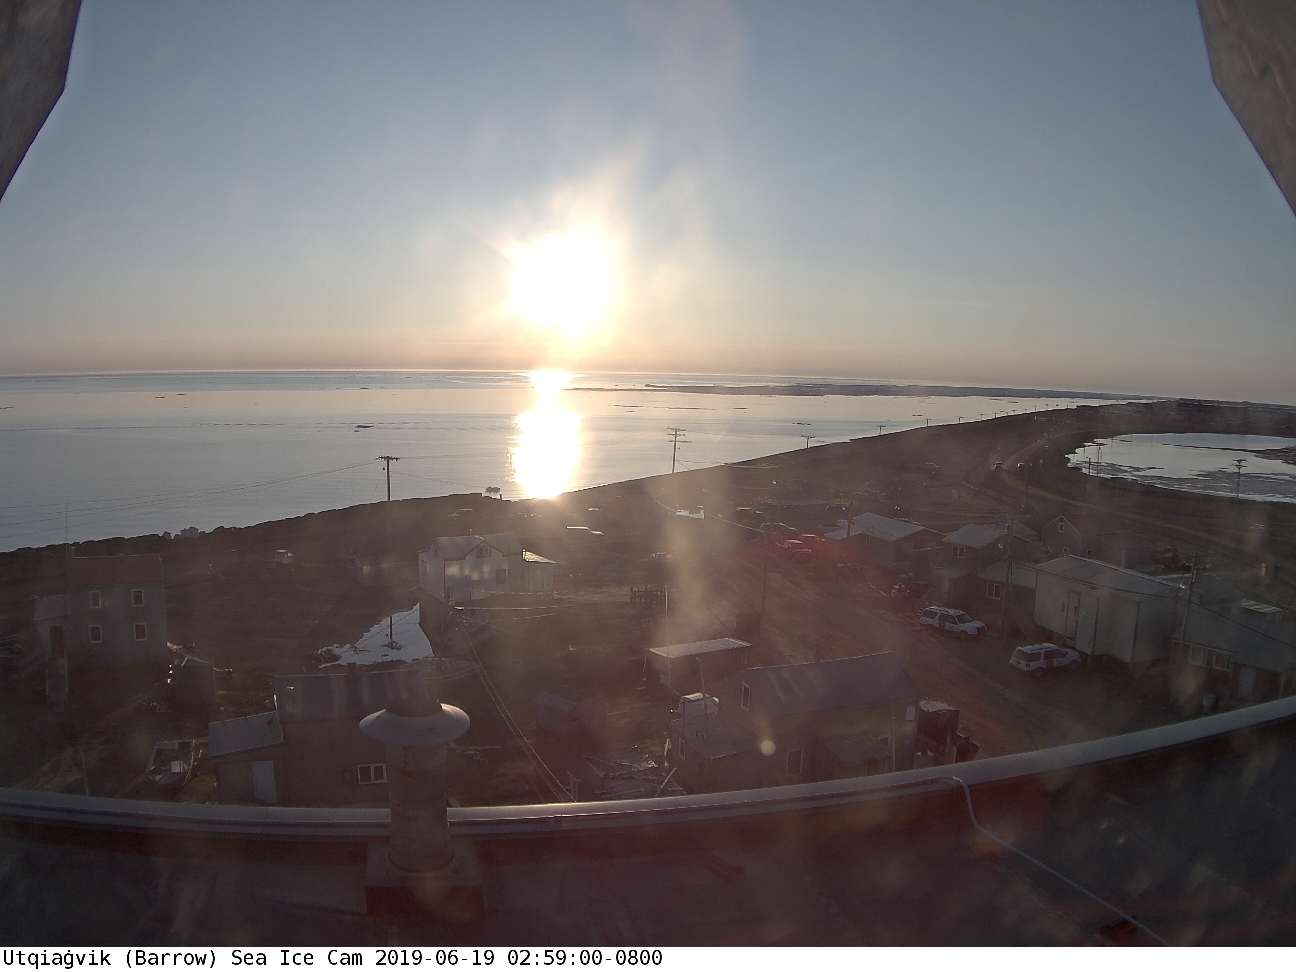
Observations made during the still ongoing MOSAiC expedition, have confirmed the satellite derived measurements:
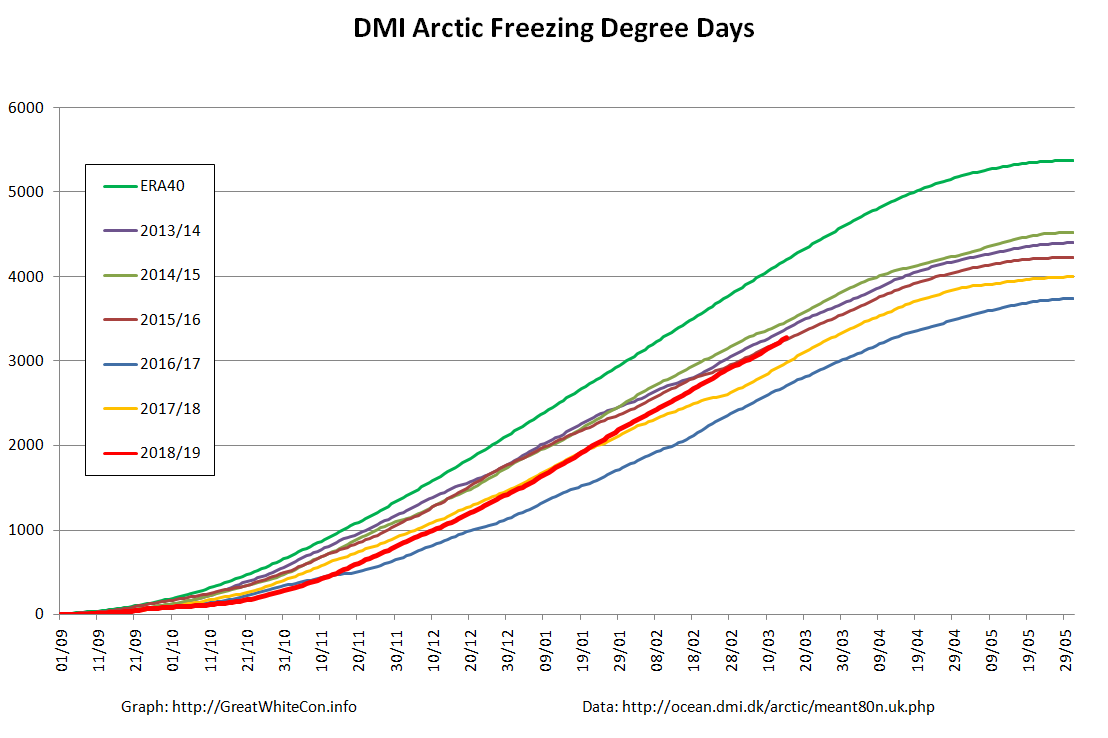
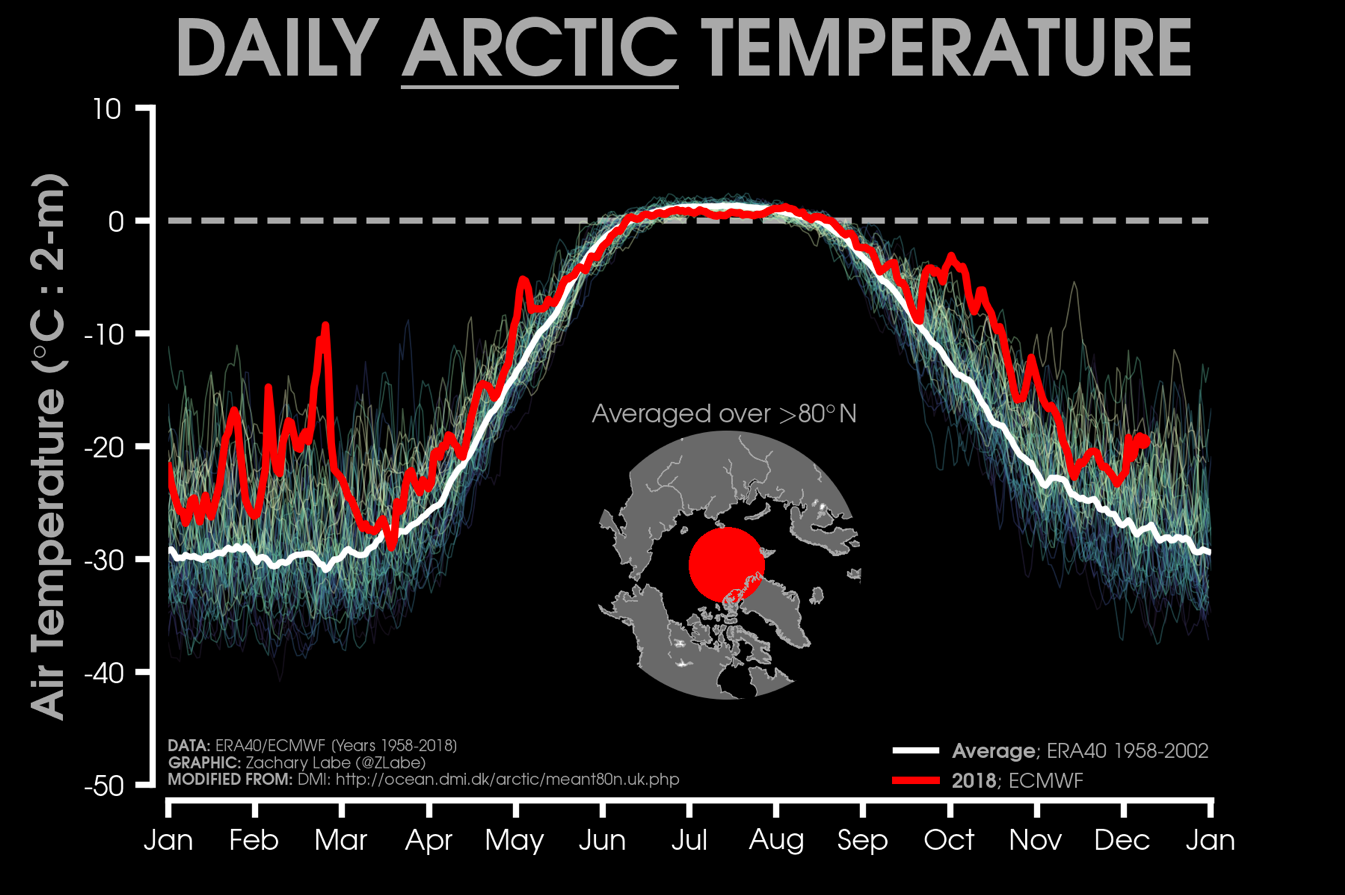
This year, powerful westerly winds flowed around the North Pole and trapped cold air within a ‘polar vortex’. There was more cold air above the Arctic than in any winter recorded since 1979, says Markus Rex, an atmospheric scientist at the Alfred Wegener Institute in Potsdam, Germany. In the chilly temperatures, the high-altitude clouds formed, and the ozone-destroying reactions began.
Researchers measure ozone levels by releasing weather balloons from observing stations around the Arctic (including the Polarstern icebreaker, which is frozen in sea ice for a year-long expedition). By late March, these balloons measured a 90% drop in ozone at an altitude of 18 kilometres, which is right in the heart of the ozone layer. Where the balloons would normally measure around 3.5 parts per million of ozone, they recorded only around 0.3 parts per million, says Rex. “That beats any ozone loss we have seen in the past,” he notes.
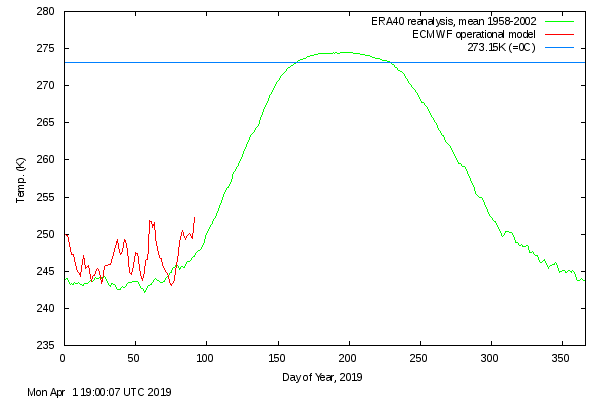
I’ve previously conjectured about the potential effect of the strong polar vortex on Northern Hemisphere snow cover this Spring, and here’s NOAA’s current snow extent graph:

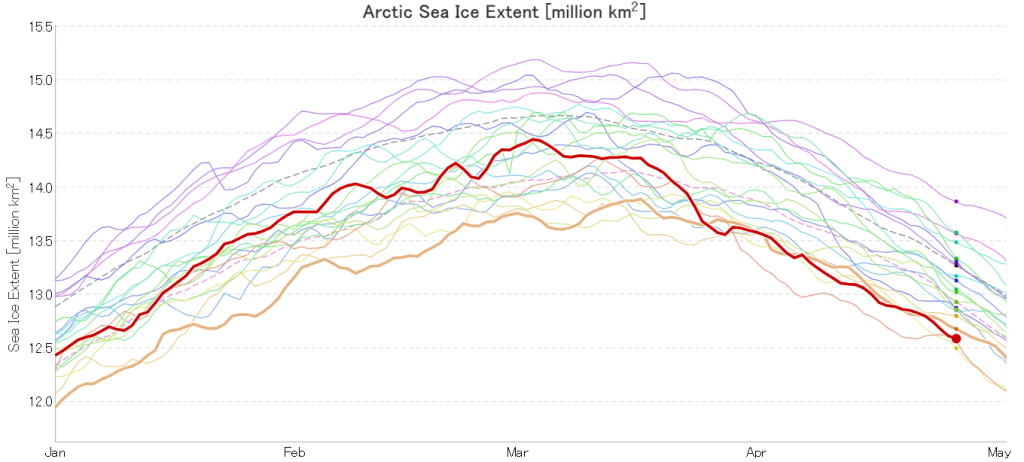
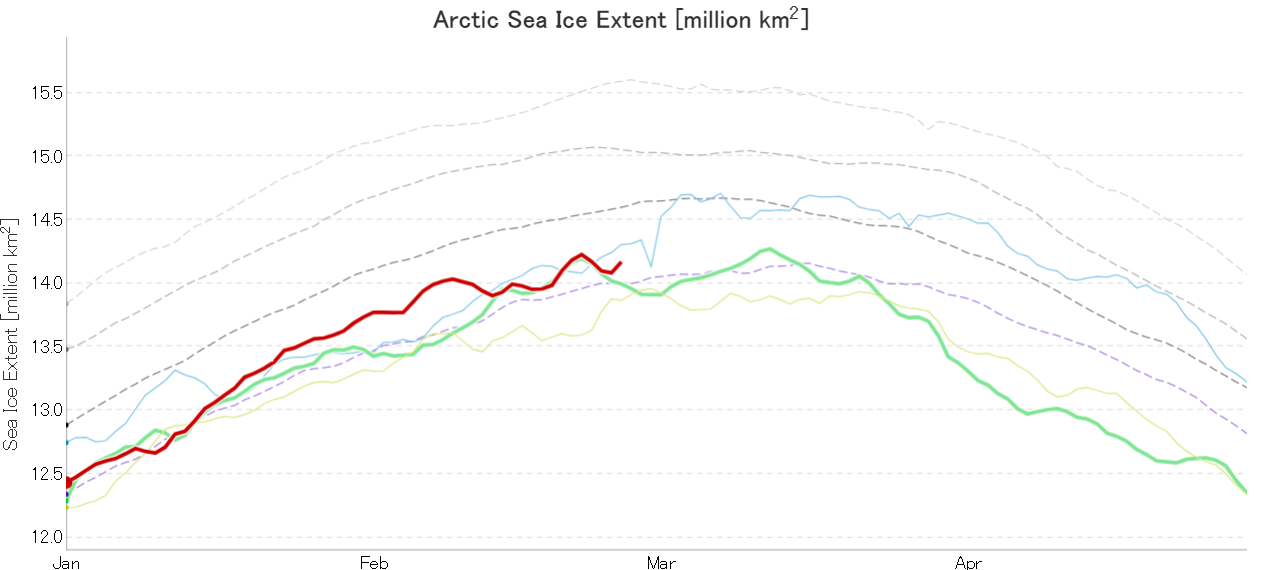
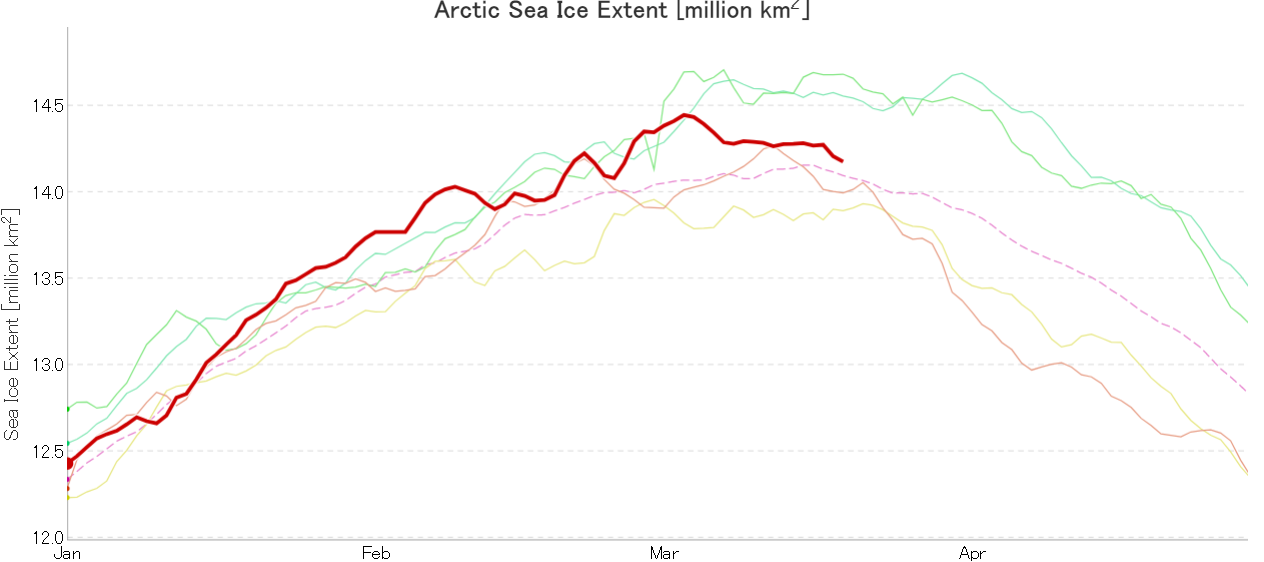
JAXA extent’s precipitous recent decline has abated, and it’s now 5th lowest for the date in the satellite era:
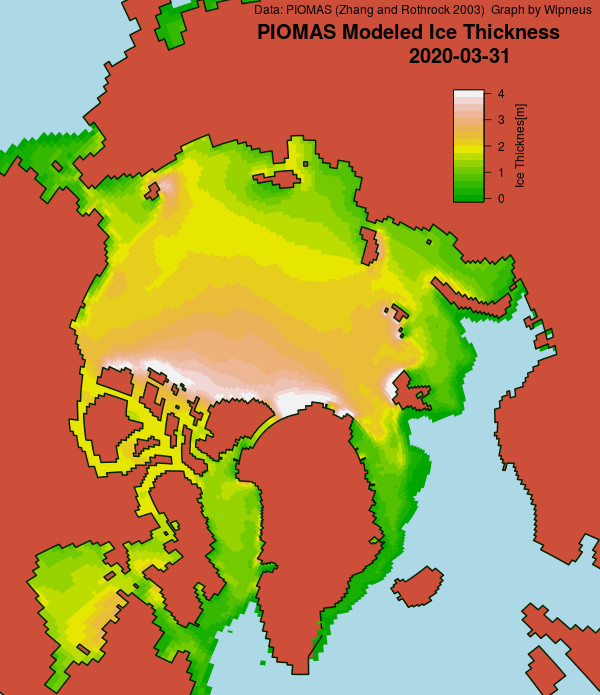
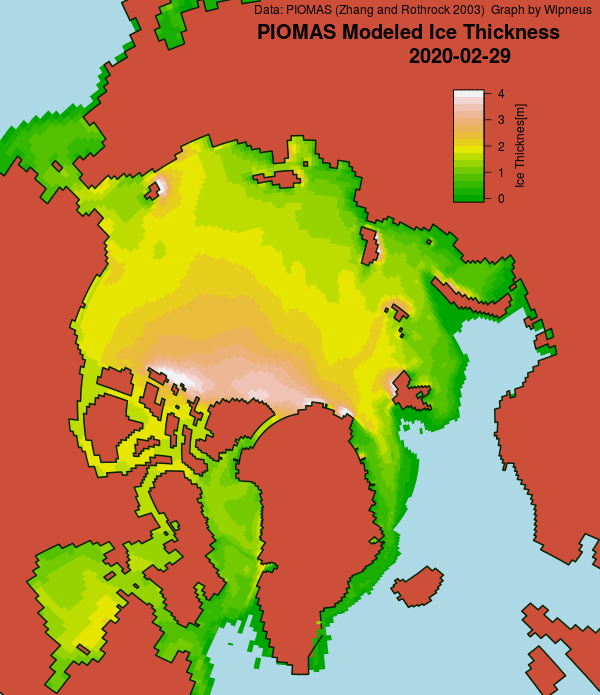
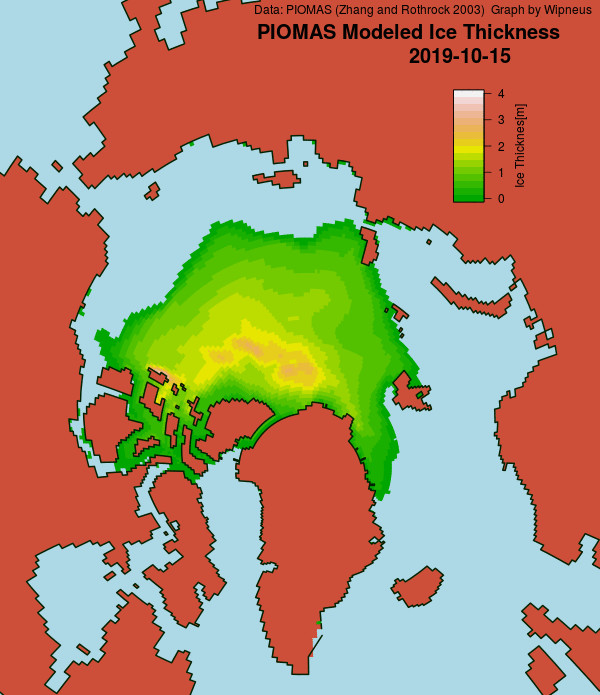
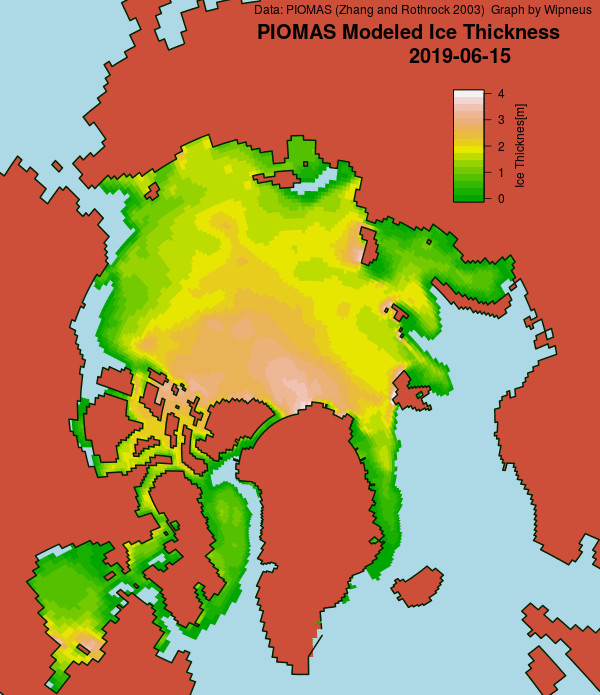
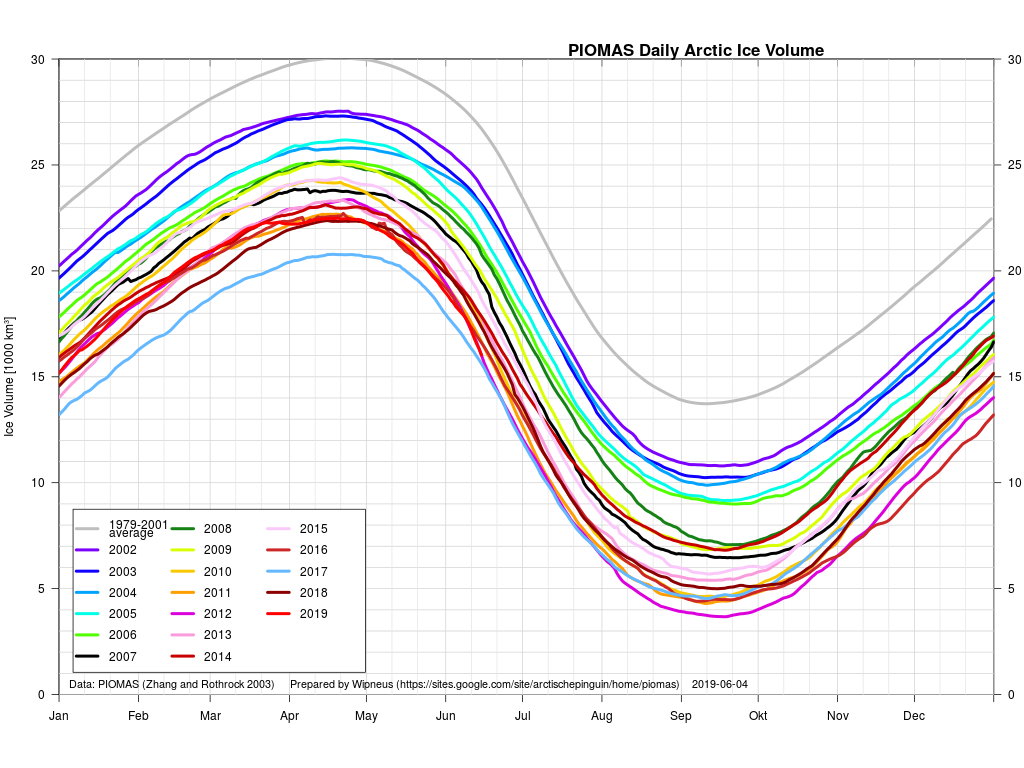
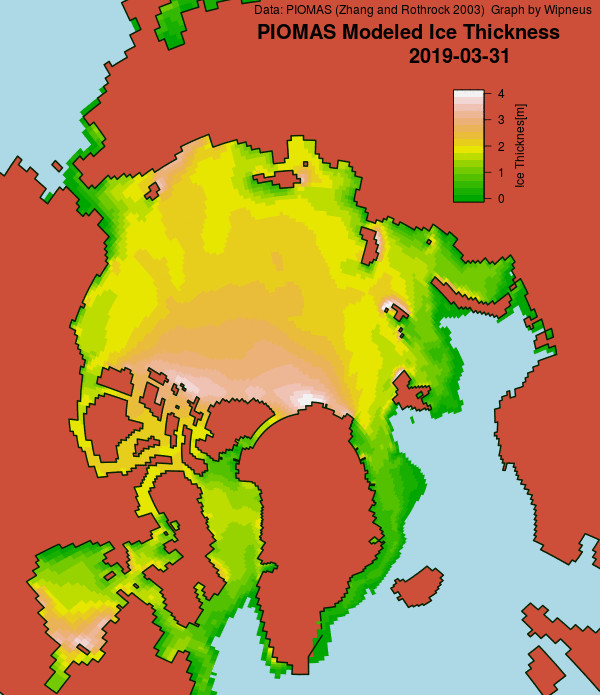
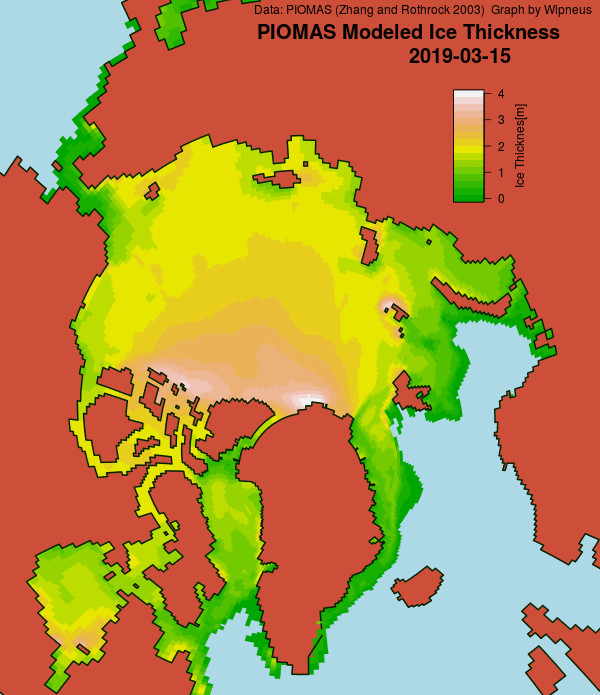
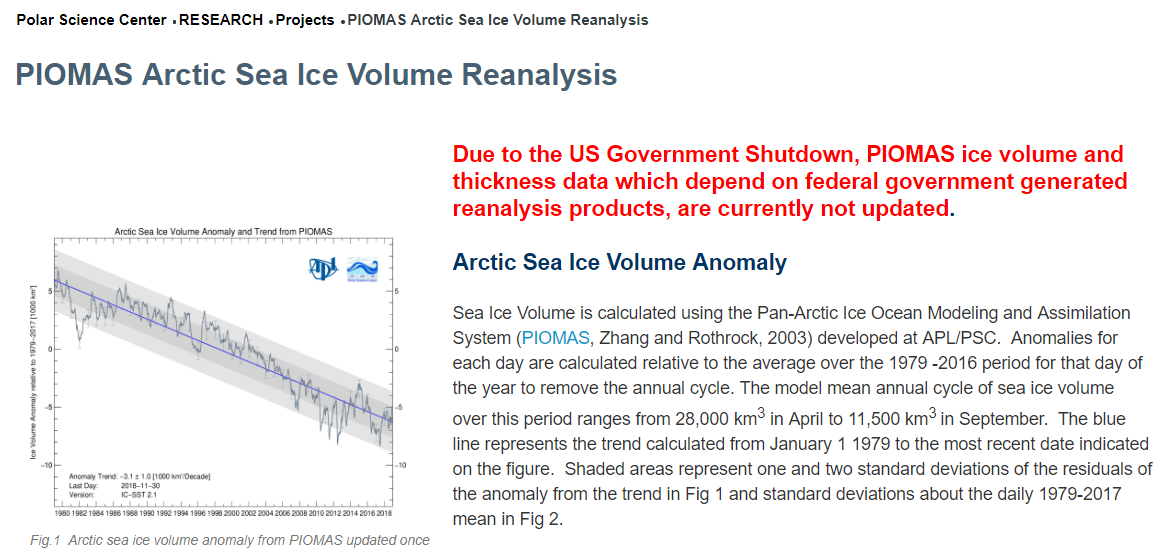
Here’s the March 31st PIOMAS Arctic sea ice gridded thickness map:
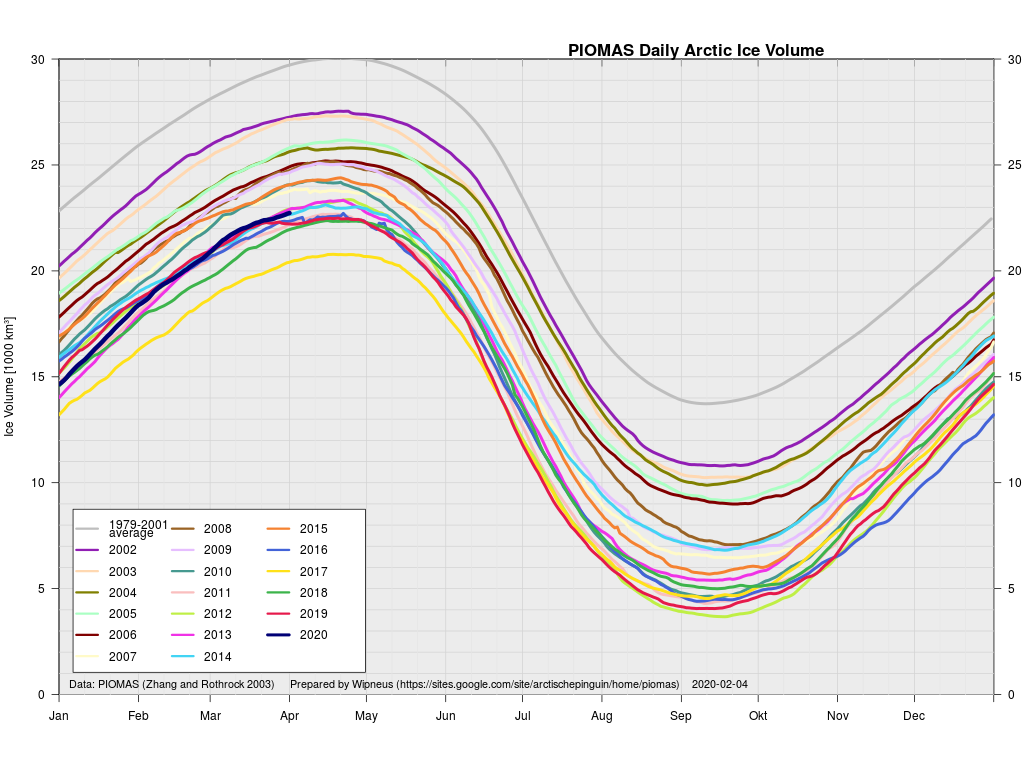
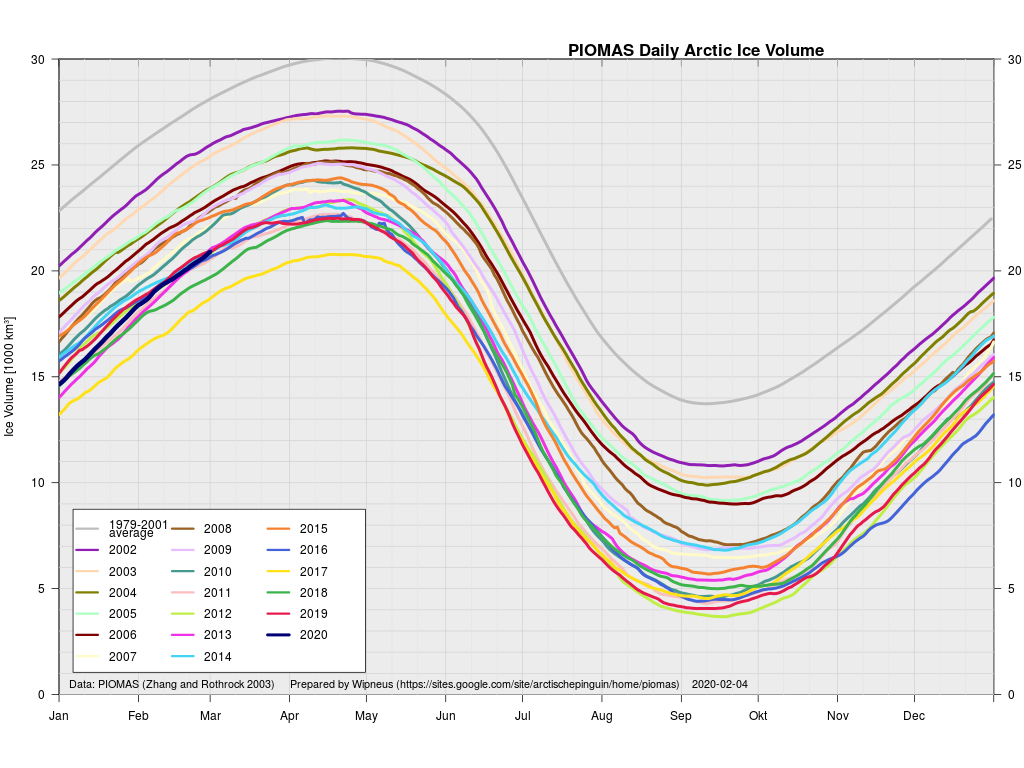
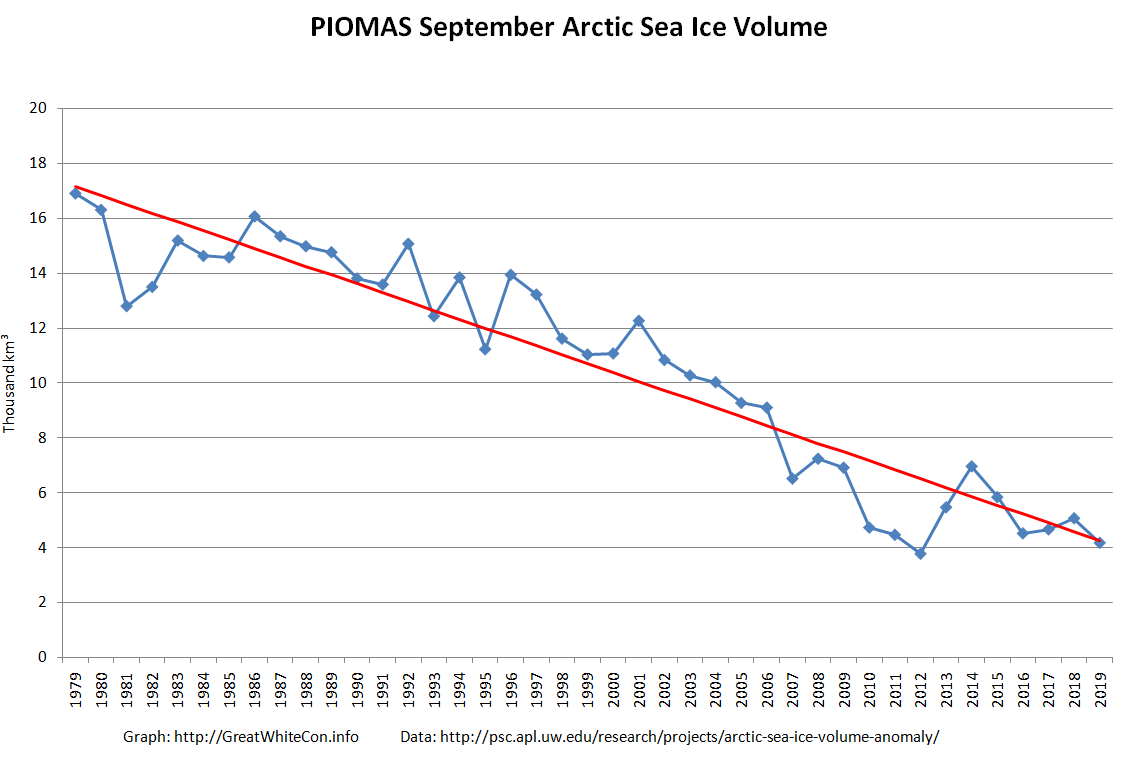
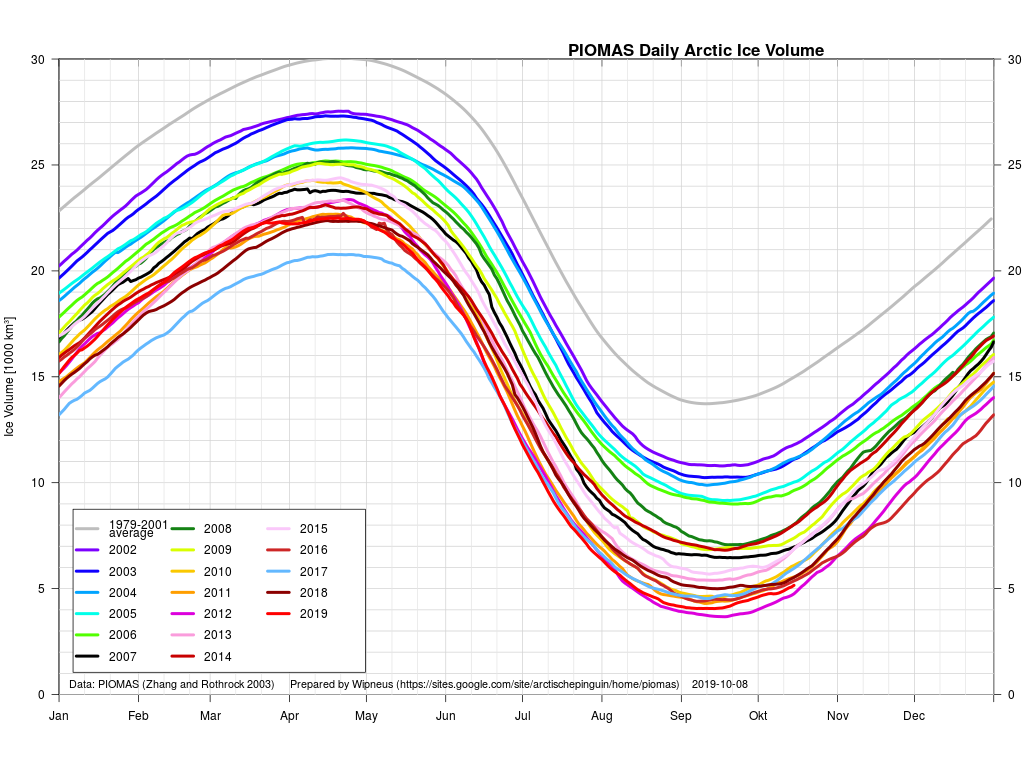
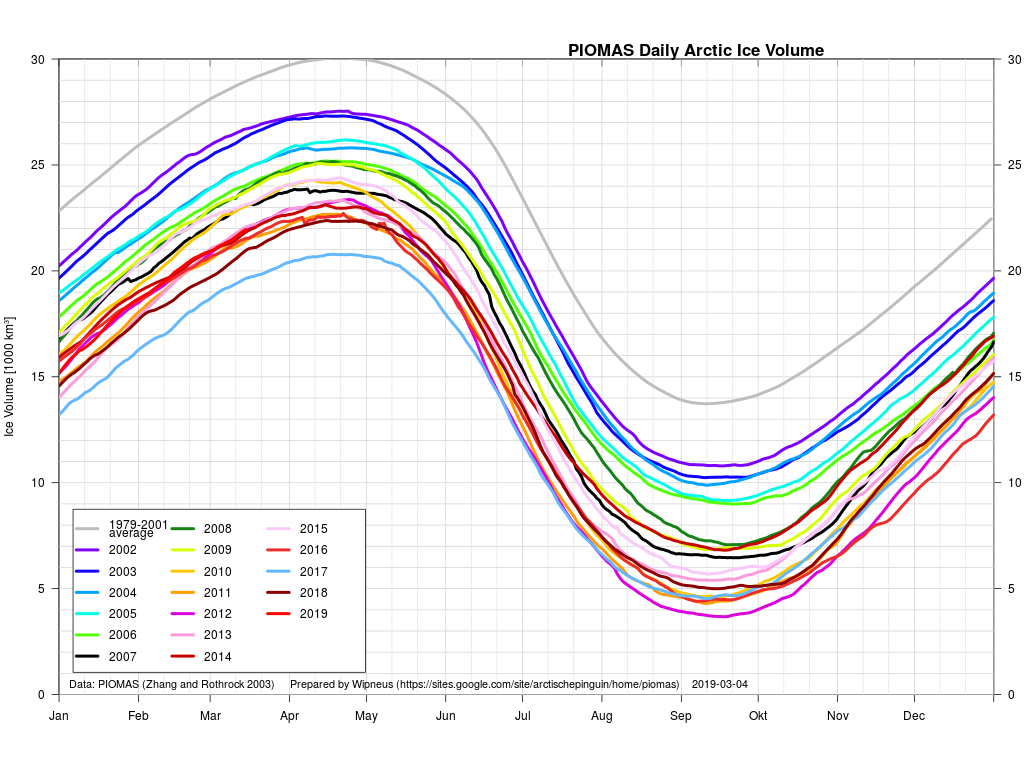
together with the traditional volume graph:
Wipneus comments on the Arctic Sea Ice Forum that:
Ice is thickening impressively against the Canadian Archipelago and North Greenland.
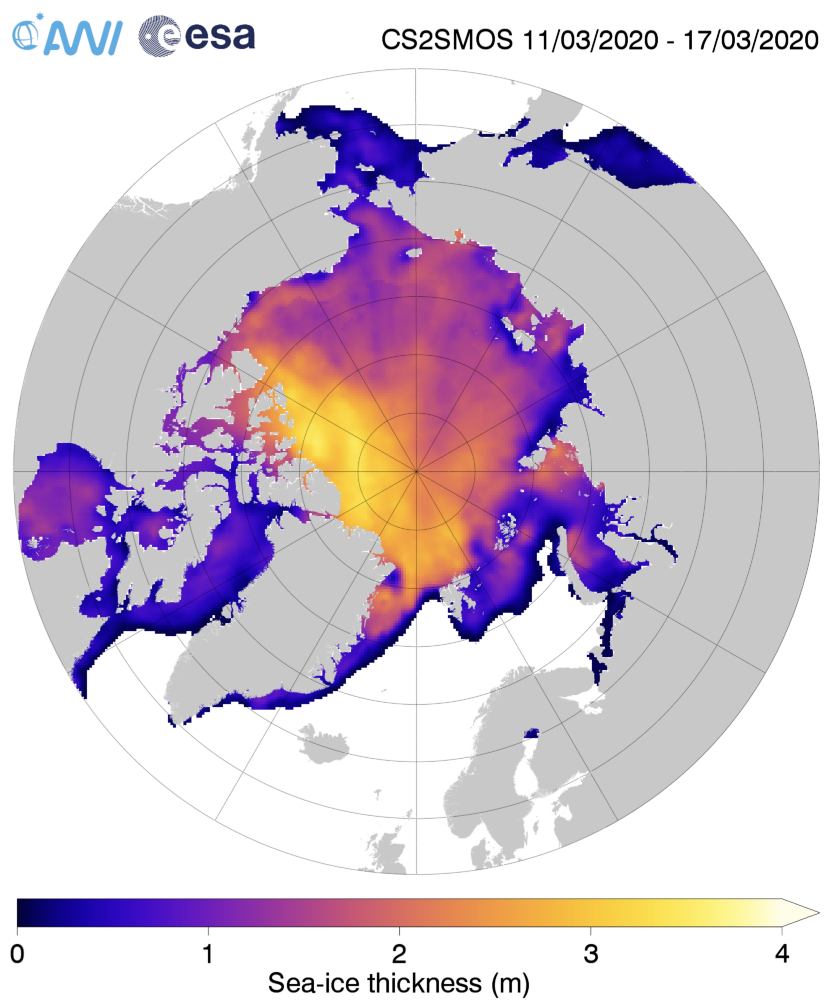
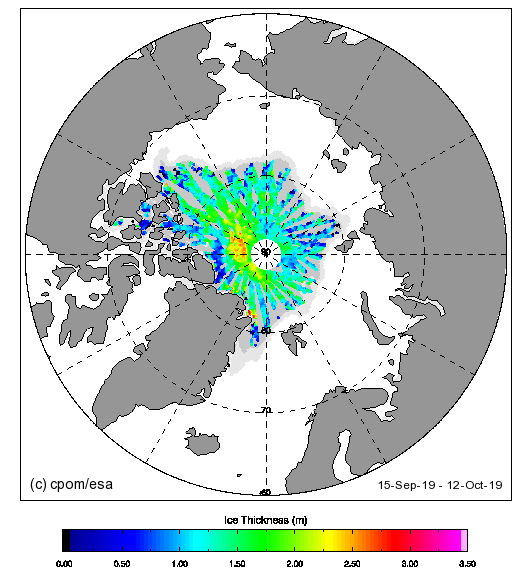
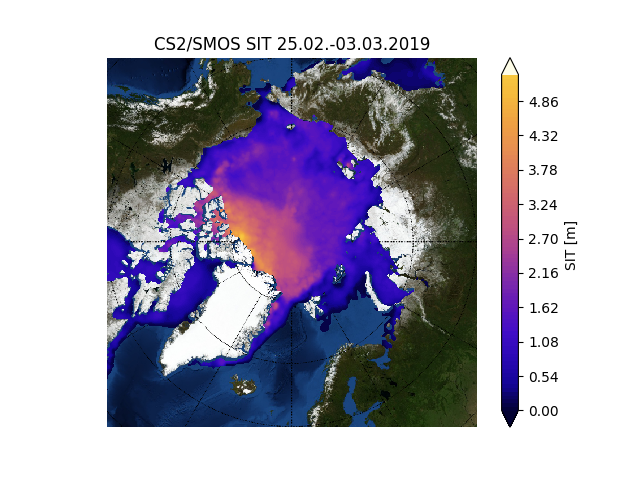
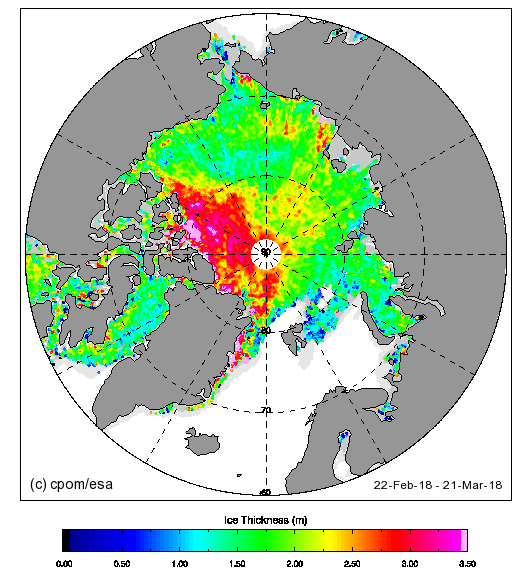
That is indeed the case with the PIOMAS “modelled” numbers, but is much less obvious in the latest CryoSat-2/SMOS “measured” thickness map where ice over 4 metres thick is still conspicuous by its absence North of Greenland:

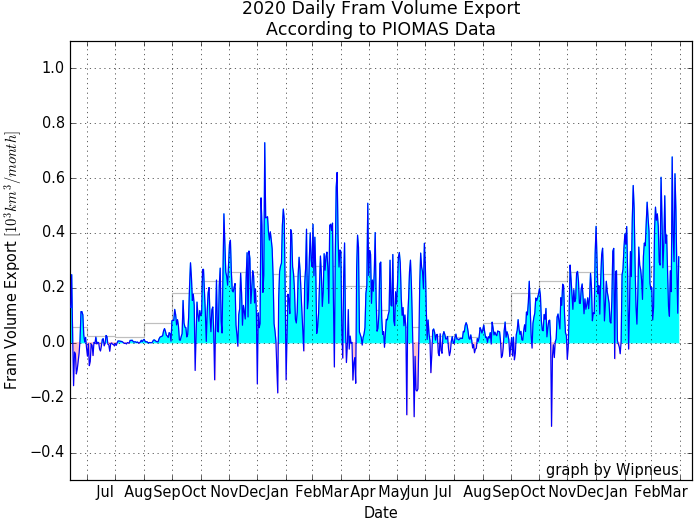
Plus a bonus graph for “Turbulent Eddie”, who suggests that:
[There’s] not much thick ice on the East Coast of Greenland, indicating the increase was from reduced loss through the Fram Strait?
together with the latest AARI ice age map:
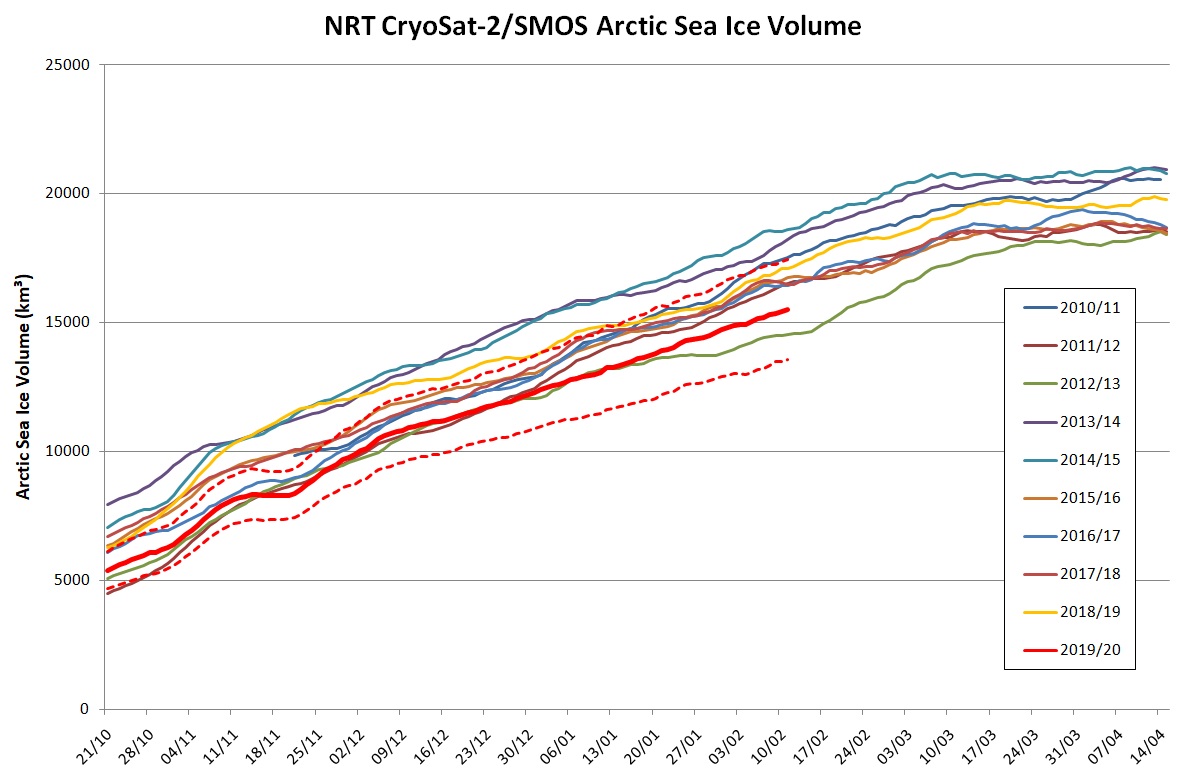
Here’s the latest update of our novel NRT volume metric:
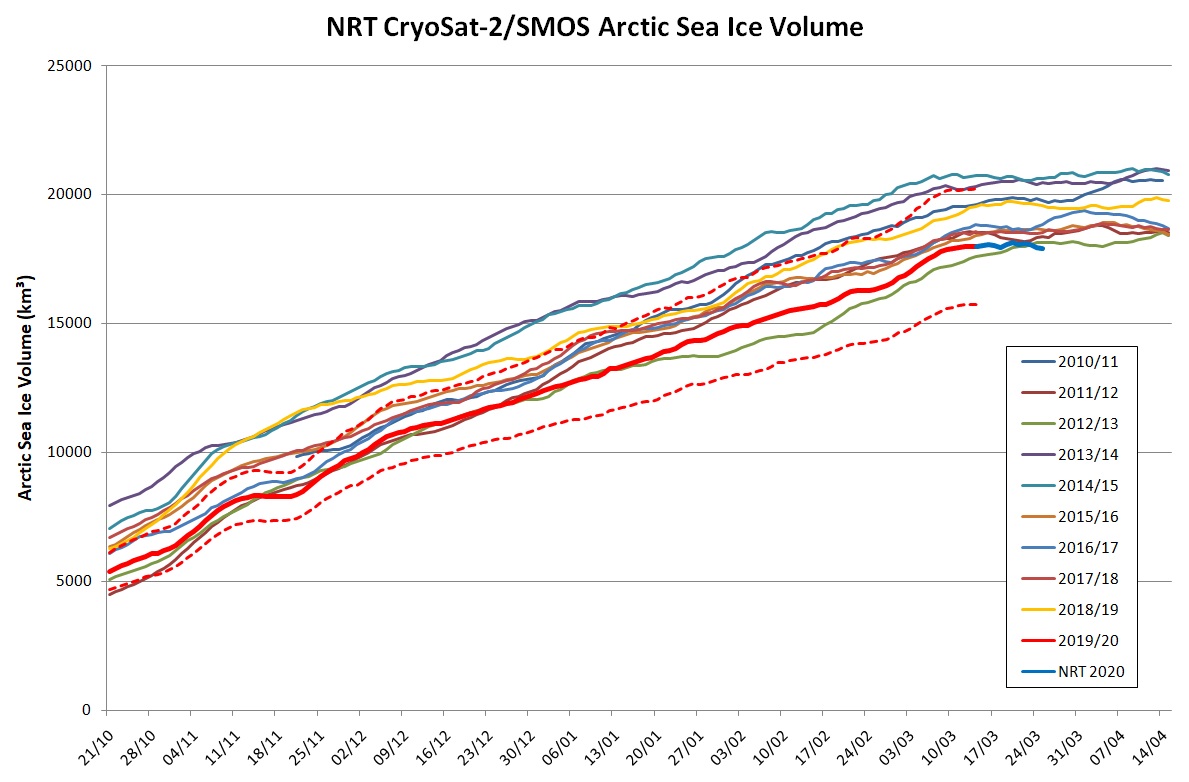
I’ve applied a crude correction to the still problematic NRT data so that it at least coincides with the reanalysed data on March 14th. Whilst we await the reanalysed numbers for the rest of March and early April it looks as though Arctic sea ice volume reached at least a temporary peak on March 20th 2020.
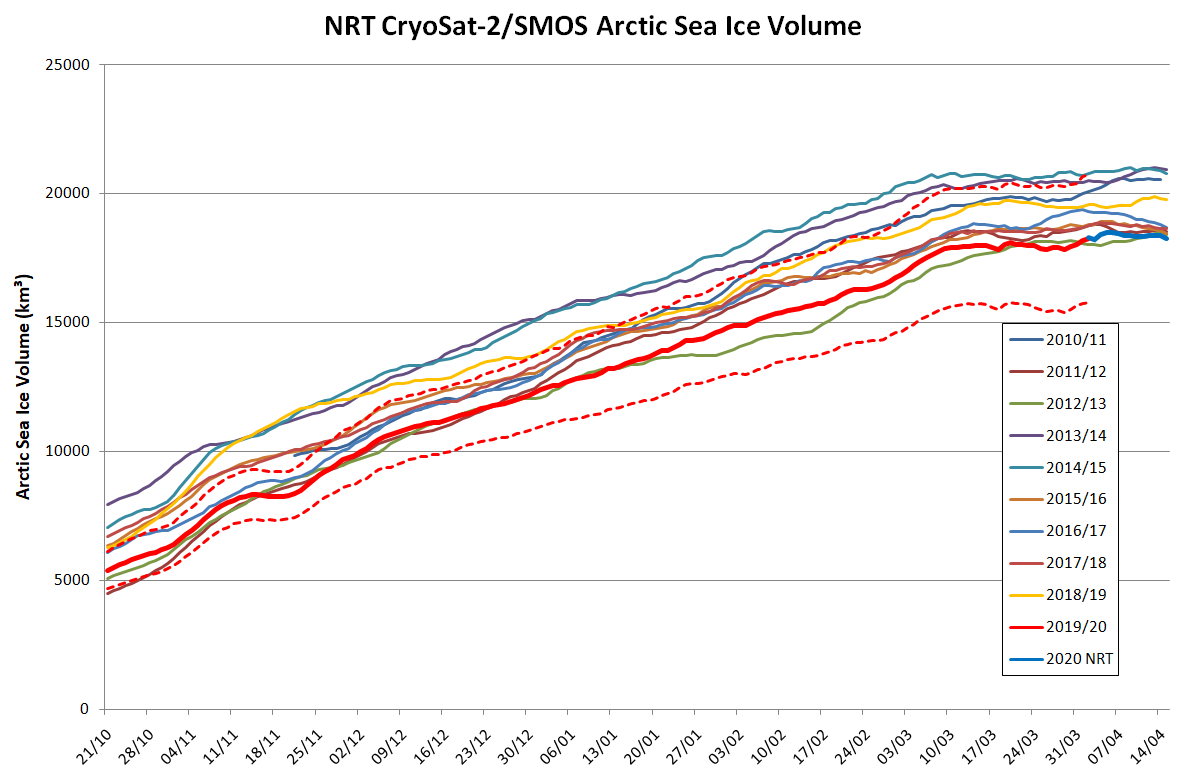
Here’s another update of our novel NRT volume metric, still incorporating my “fudge factor”:
Note also this handy hint from Stefan Hendricks on Twitter:
The reprocessed #Cryosat2 data is fine though and for the recent winter there is a corrected CS2SMOS version: ftp://ftp.awi.de/sea_ice/product/cryosat2_smos/v202_2/
— Stefan Hendricks (@sthendric) April 19, 2020
Wipneus has crunched the mid month PIOMAS gridded thickness numbers. Here’s the result:
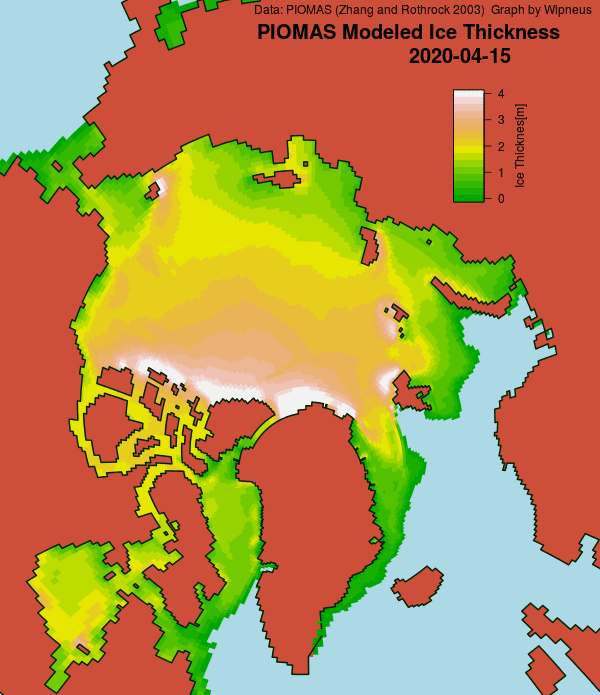

The discrepancy between the PIOMAS model and the CryoSat-2 “reality” is still very evident.
With another week’s worth of reanalysed data now processed, it now seems certain that the CS2/SMOS Arctic sea ice volume maximum was 18469 km³ on April 6th:

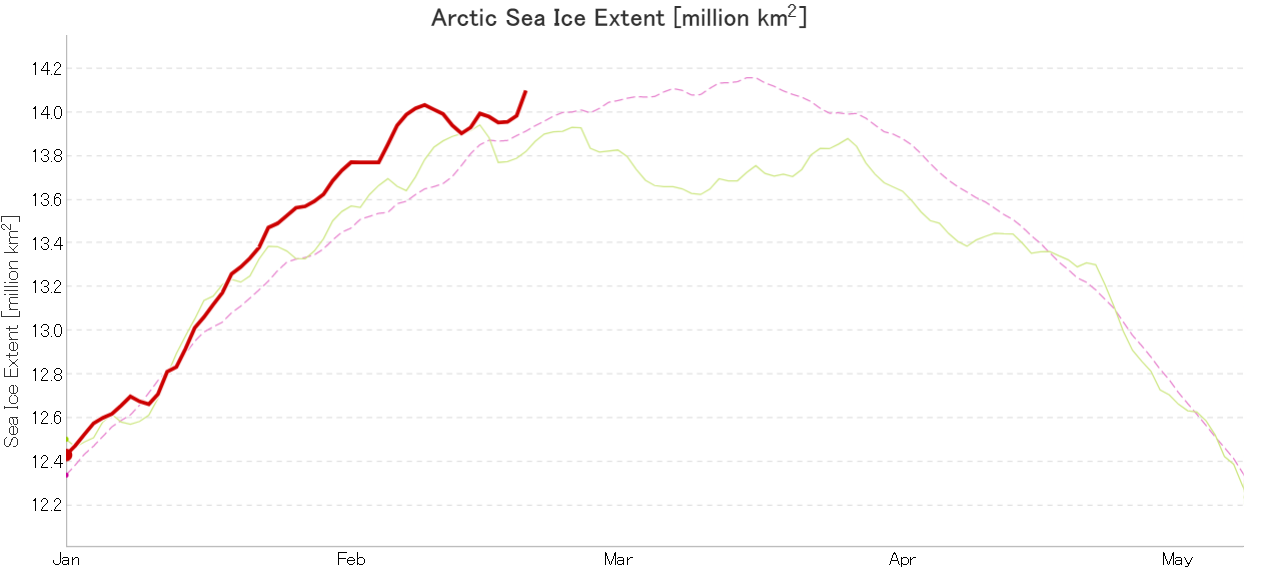
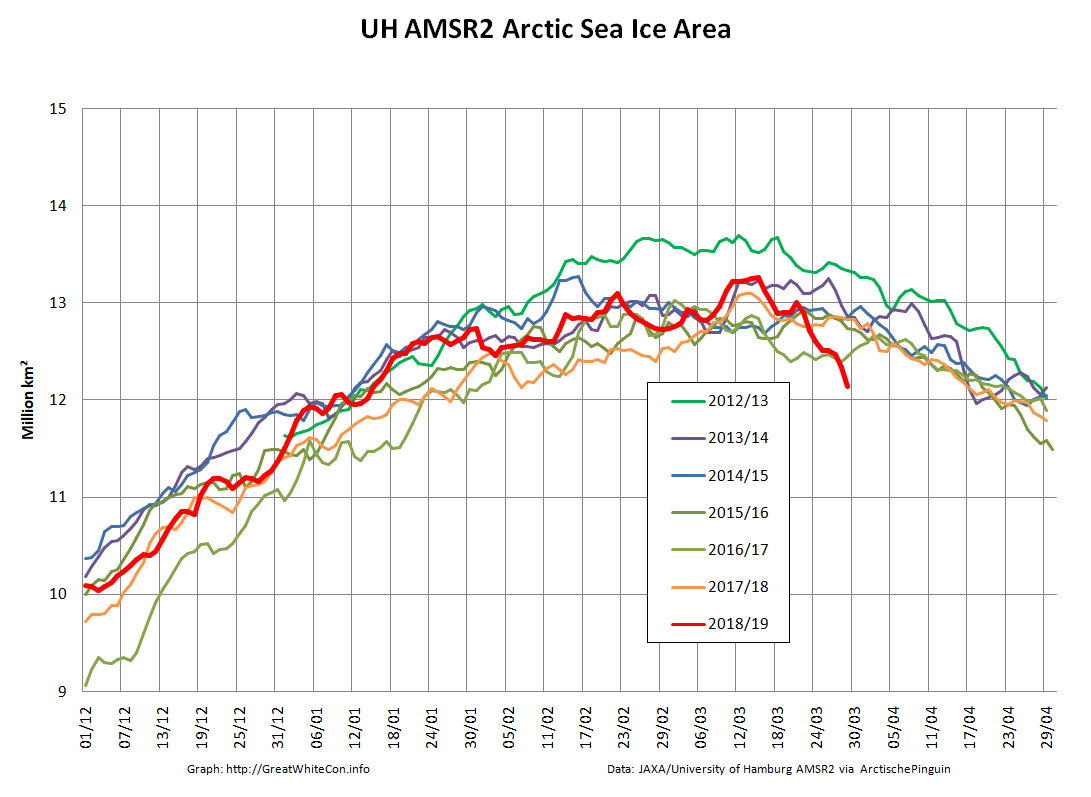
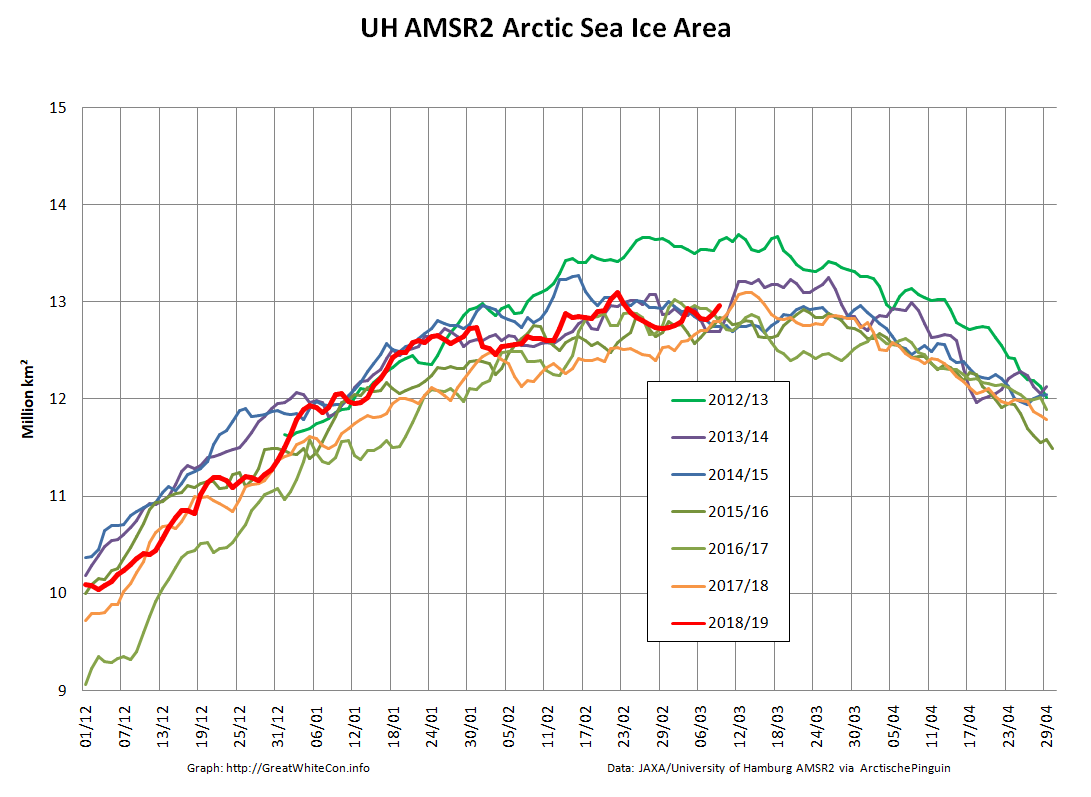
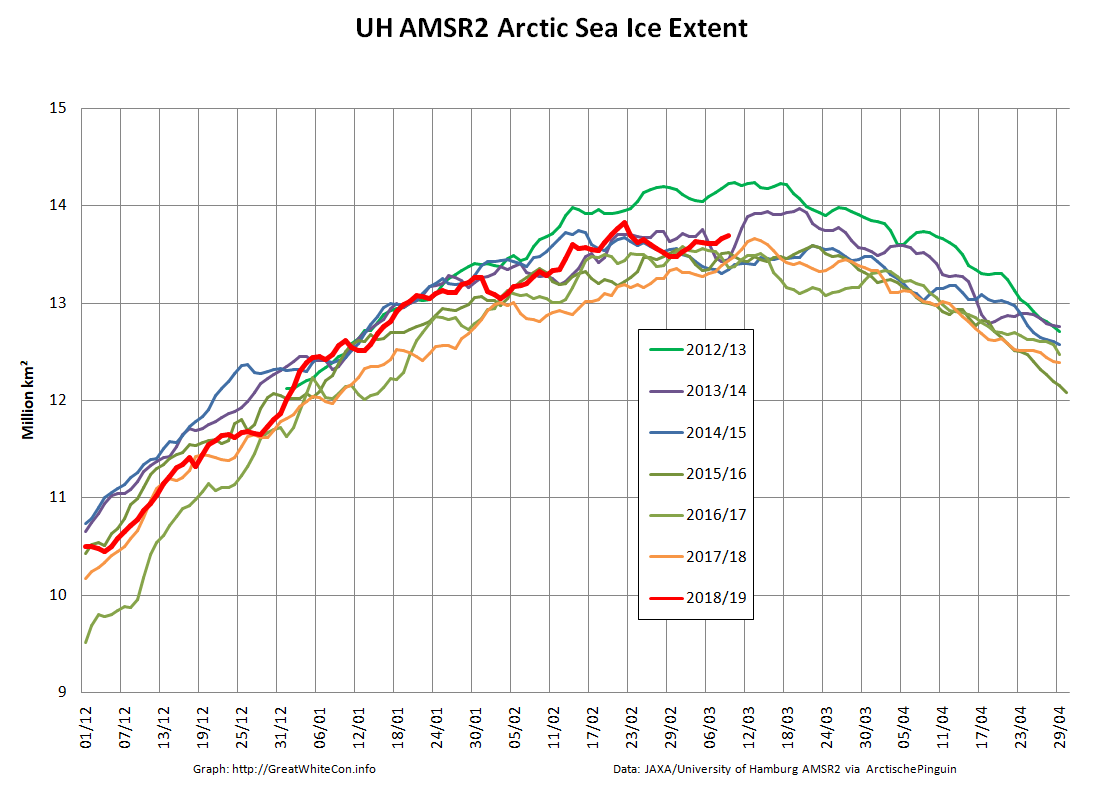
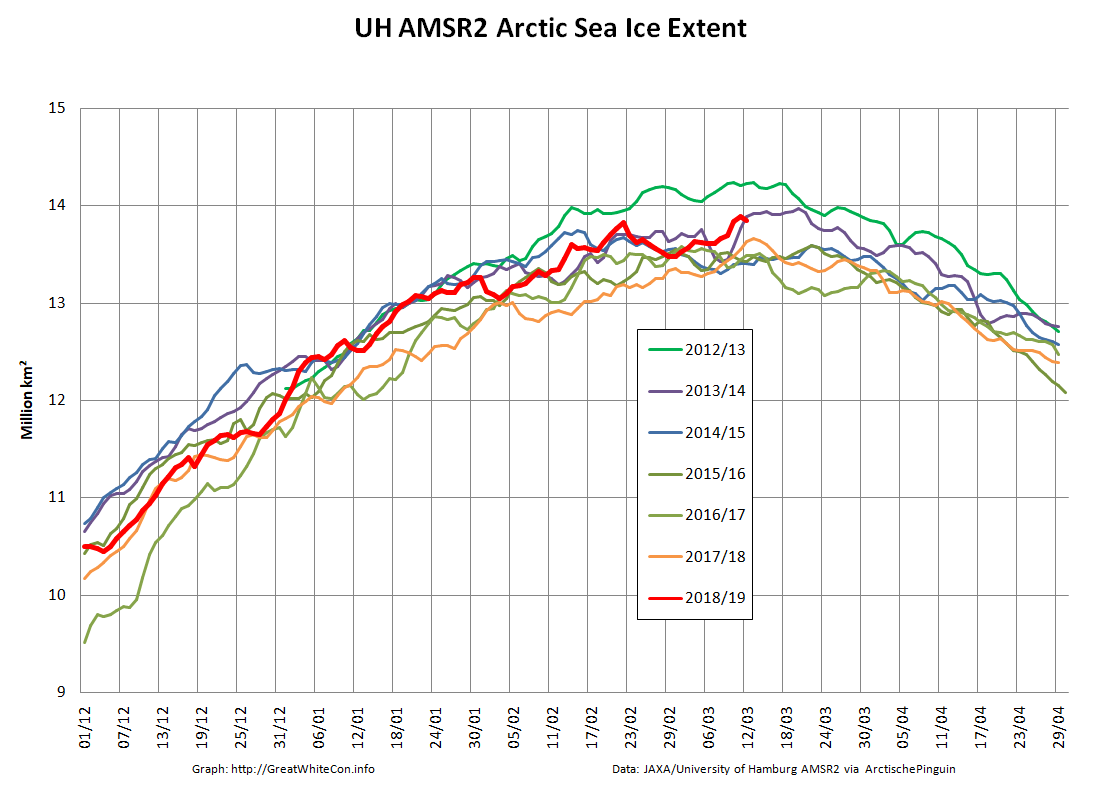
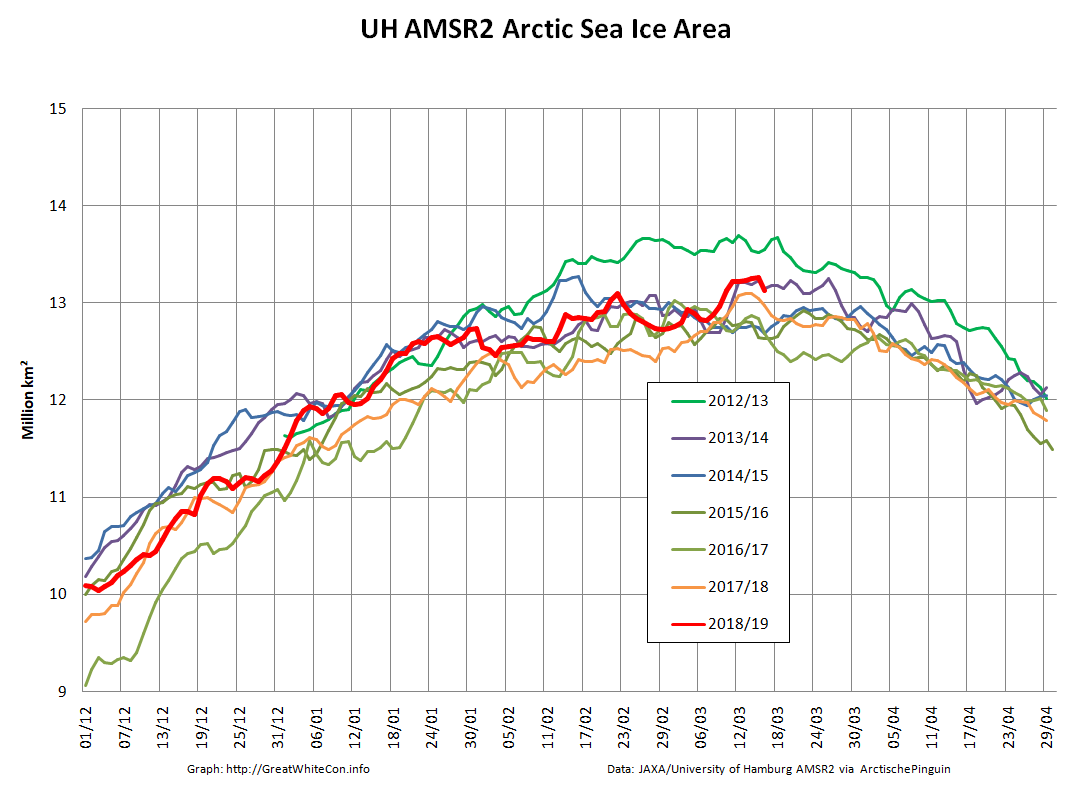
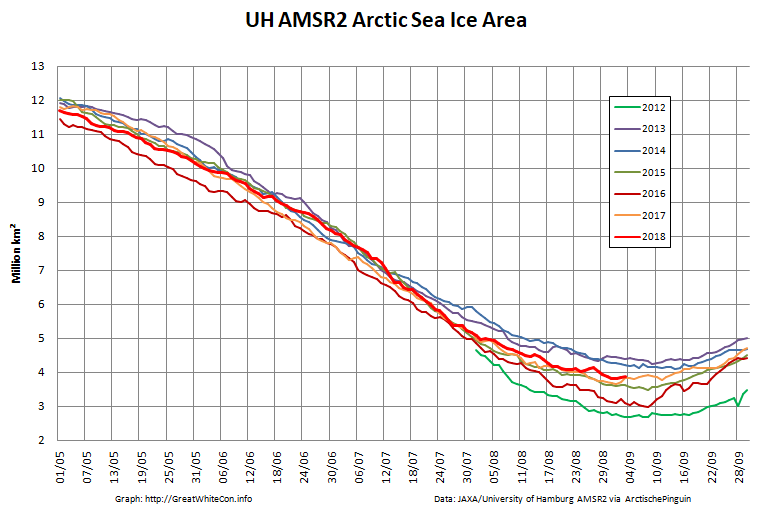
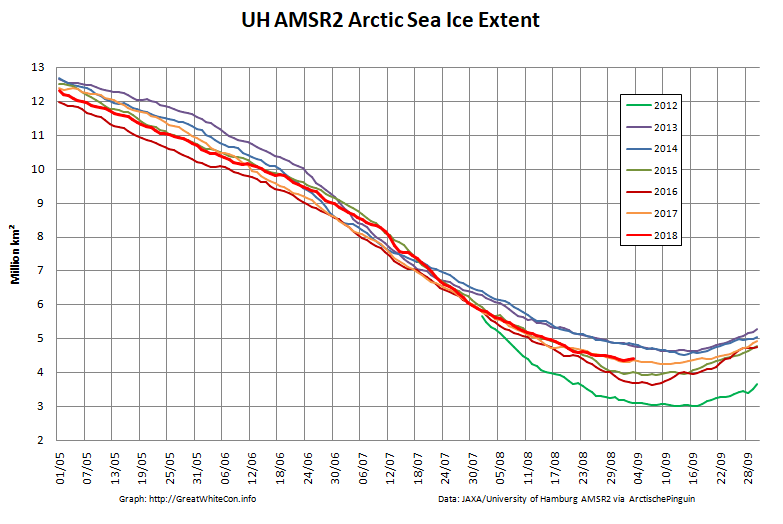
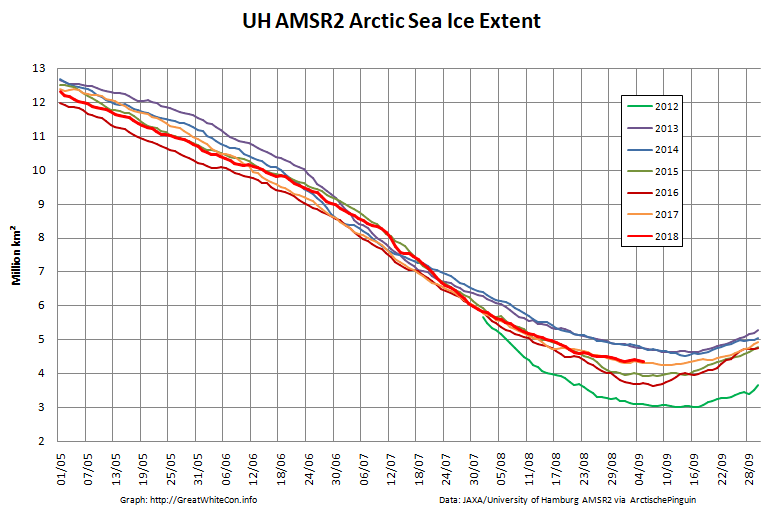
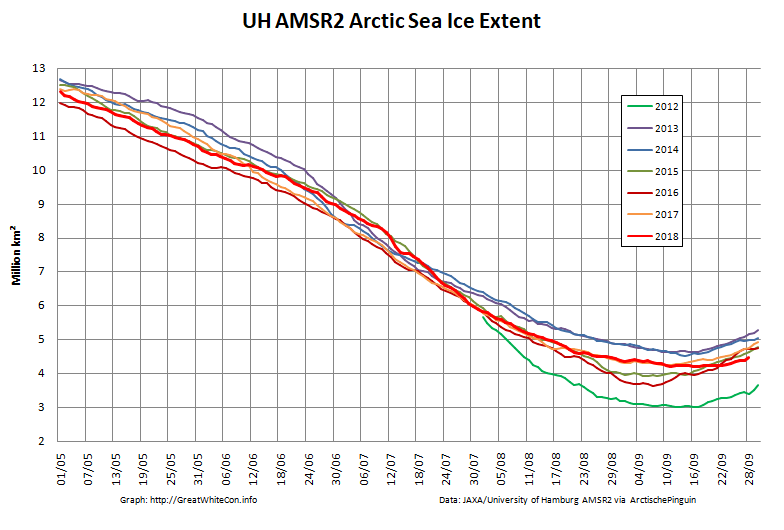
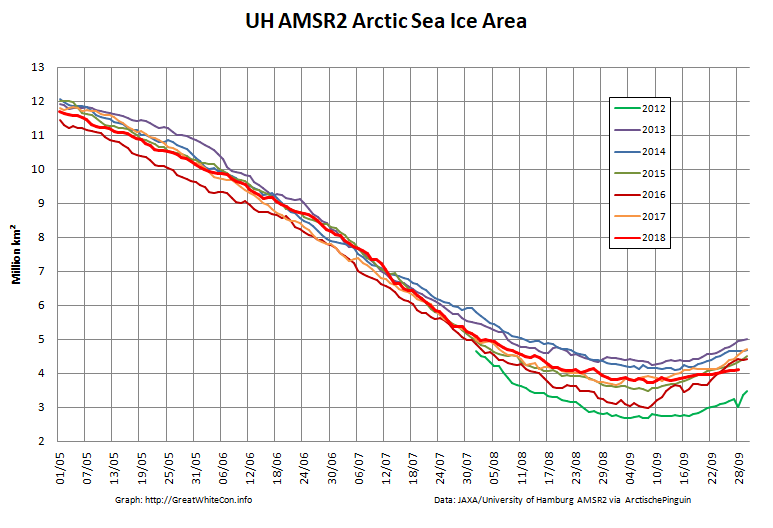
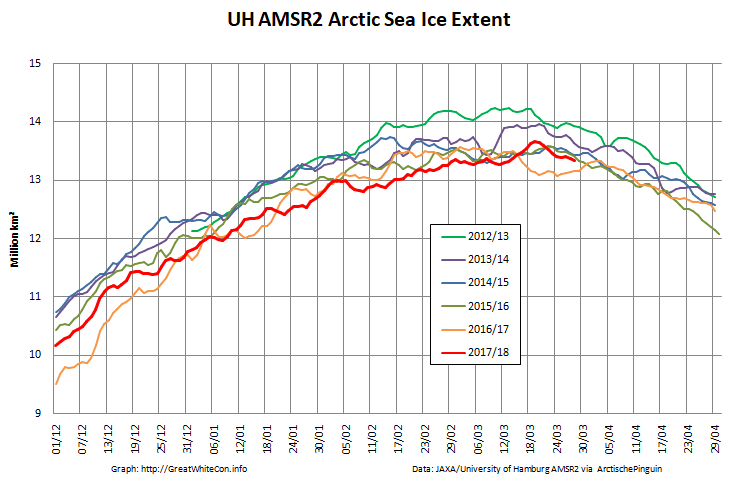
The high resolution AMSR2 area and extent metrics are now both “lowest for the date” in the AMSR2 record:

JAXA/ViSHOP AMSR2 extent isn’t quite there yet:


