There’s no rest for the wicked! Tony Heller, still better known as the pseudonymous “Steven Goddard”, is promulgating his erroneous Arctic sea ice narrative once again this morning. In an article entitled “Rommulans Never Learn” he has this to say:
From five years ago, the Arctic was doomed and I was a denier. And five years later, the ice is still almost exactly the same as twenty years ago.
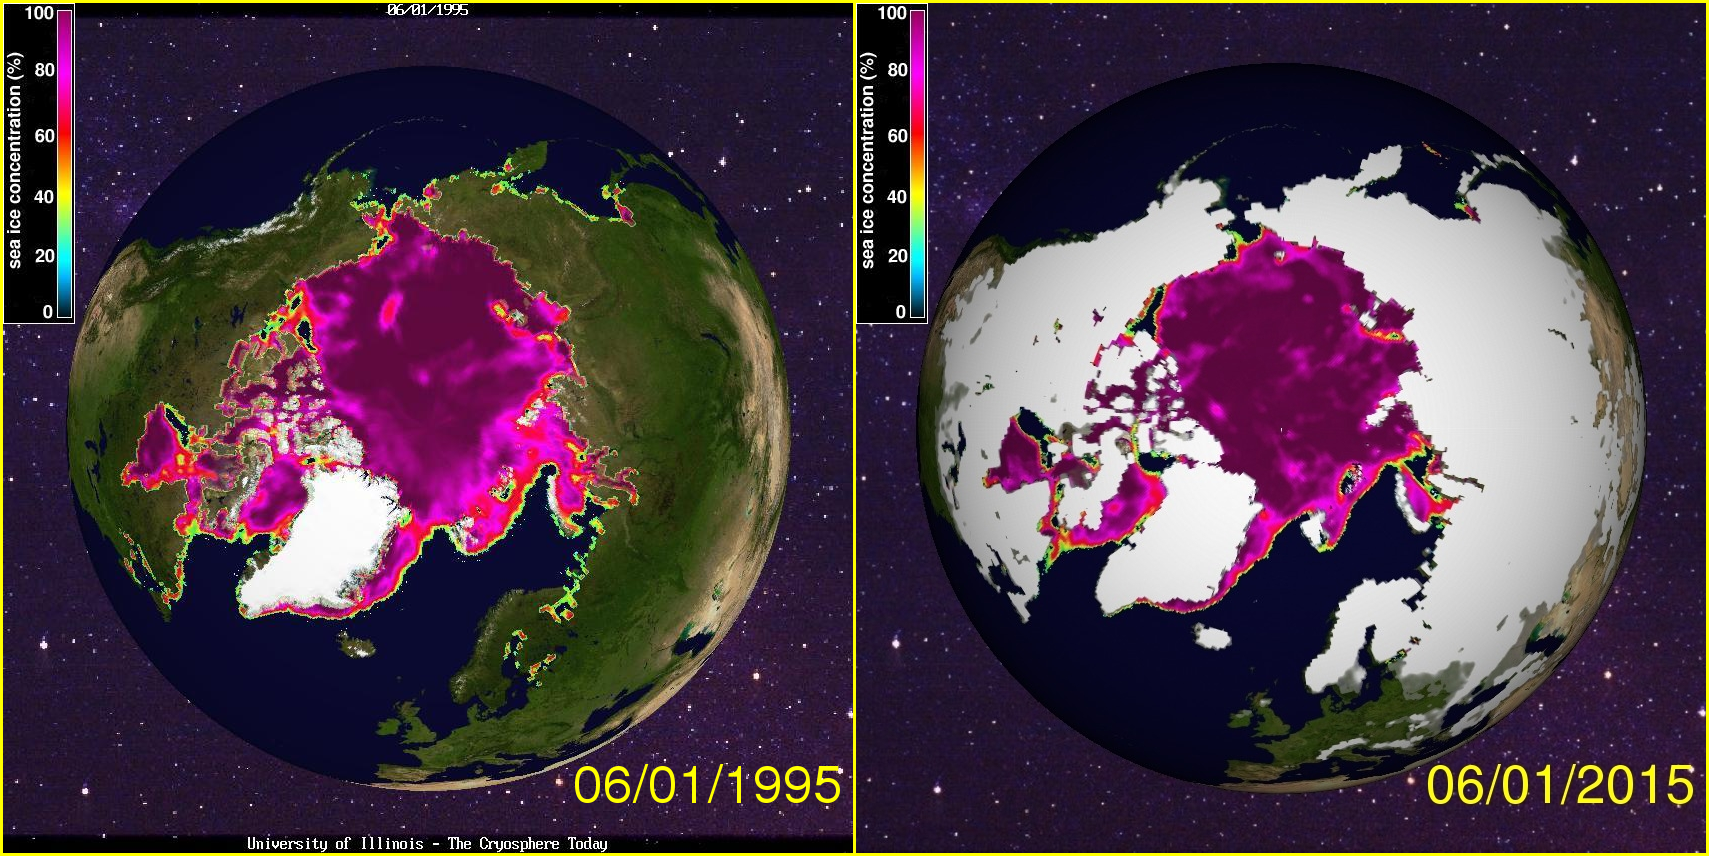
and he then presents this Cryosphere Today image comparing Arctic sea ice concentration on June 1st 2015 with the same date in 1995:
and comments:
Someone with an IQ over 30 might be able to figure it out, but not climate alarmists.
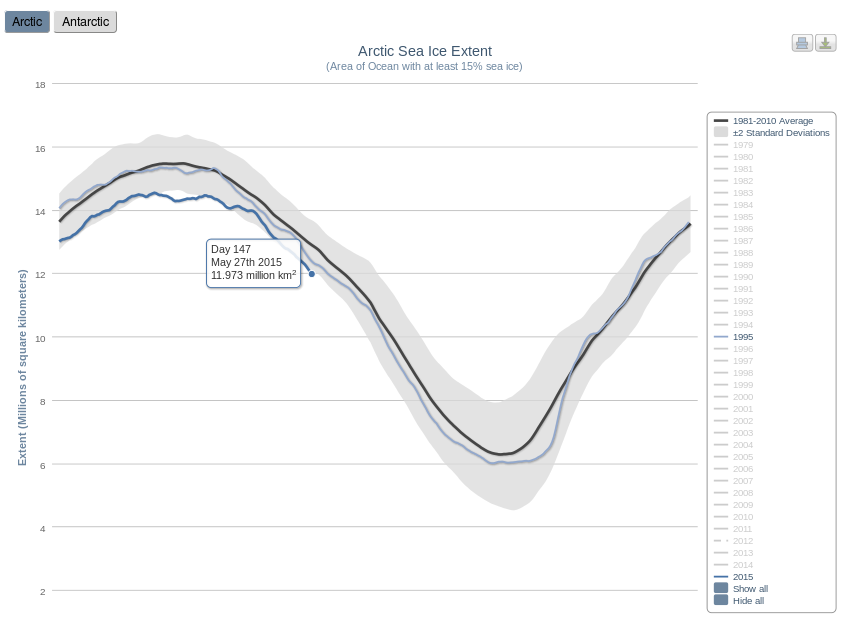
Obviously Steve/Tony hasn’t received our message yet, so we repeated it yet again:
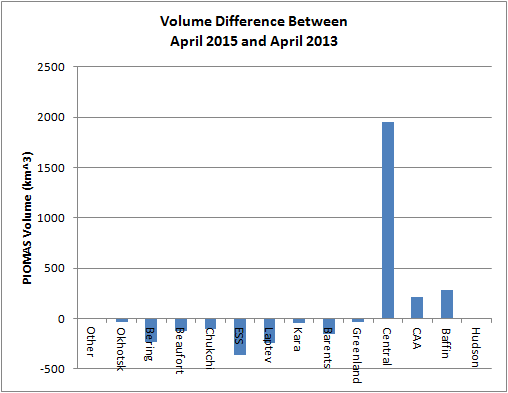
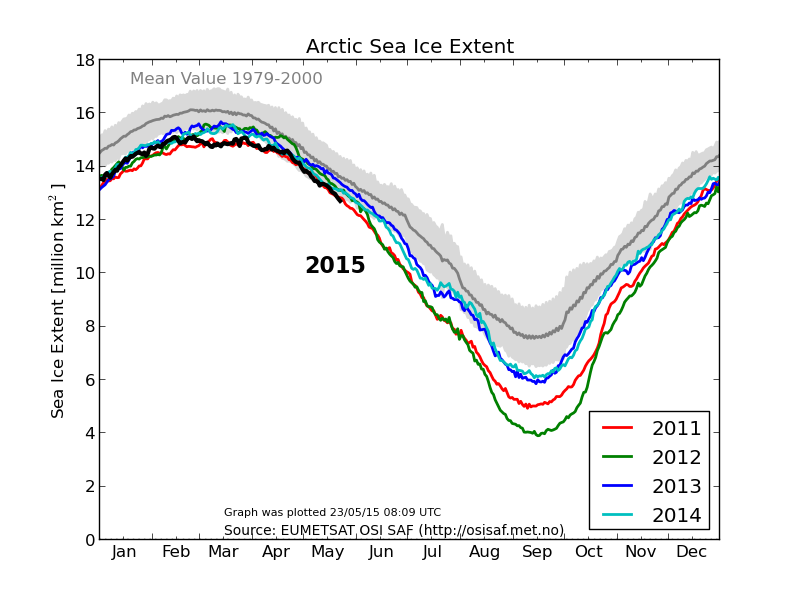
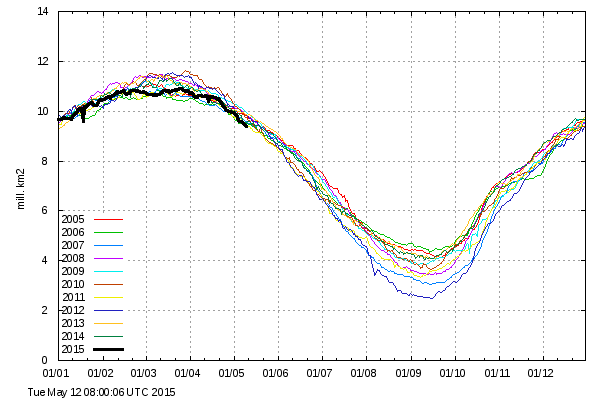
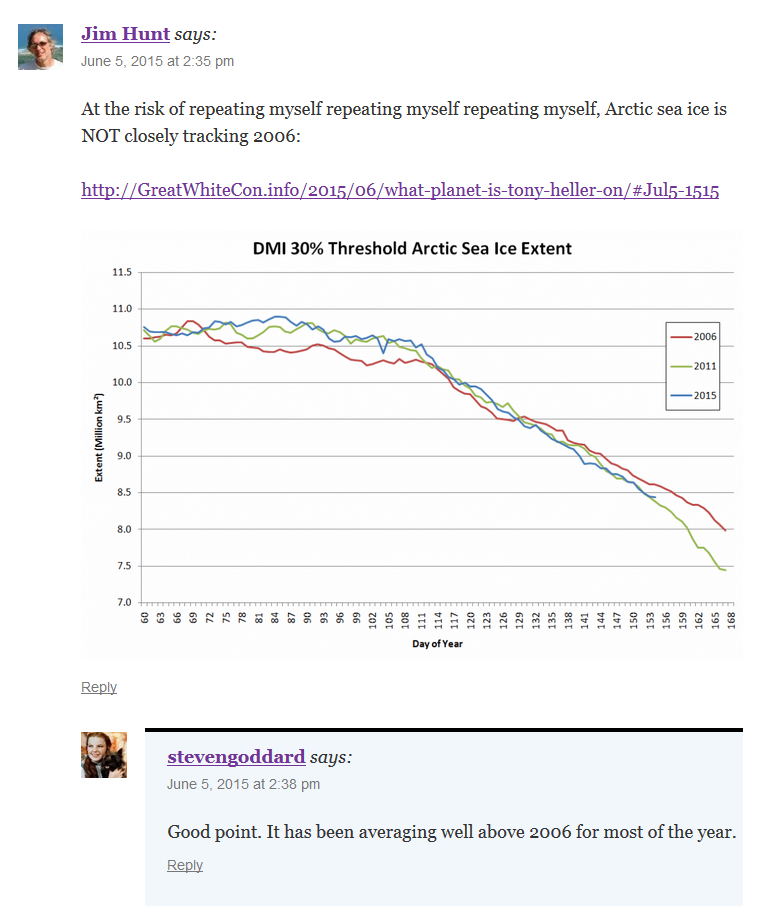
At the risk of repeating myself repeating myself, the ice is NOT still almost exactly the same as twenty years ago:
https://stevengoddard.wordpress.com/2015/05/29/trouble-looming-for-arctic-alarmists/#comment-524677
“Can you see the dark blue areas in the 2015 image where there aren’t any in the 1995 image? Try looking at the Beaufort Sea, the Chukchi Sea, the Kara Sea and the North Water Polynya”
The shiny white area in the 2015 image is also of course a long way from the current reality.
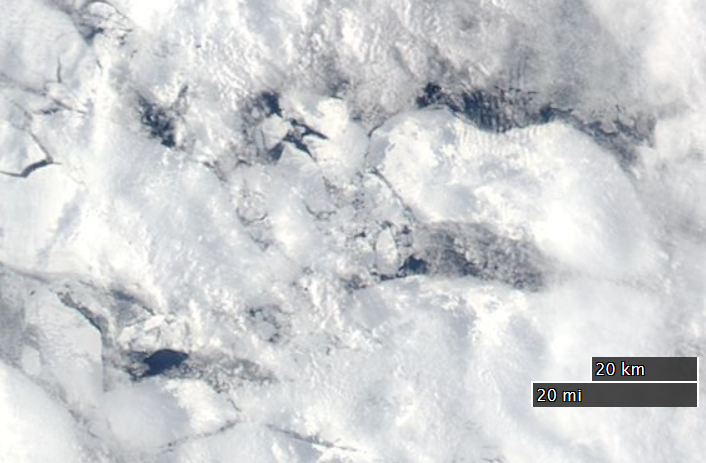
For those with an IQ of 30 or less who would like to play “spot the difference” with us, here is a hastily prepared animation of a somewhat pixellated Chukchi Sea:
[Edit 15:15 BST July 5th 2015]
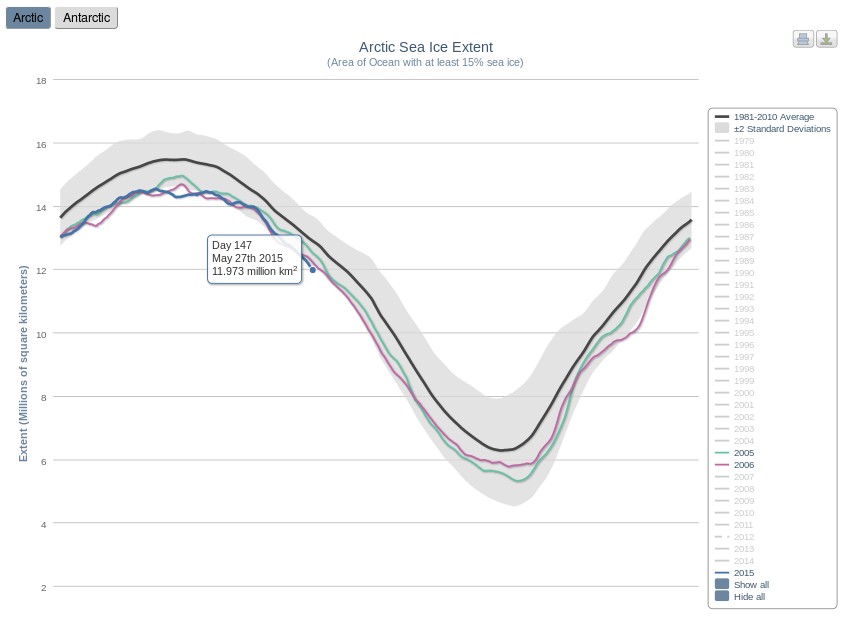
Steve/Tony has published another article about the Arctic today. This one is entitled “Scientific American Calls For An Ice-Free Arctic In 12 Weeks” and claims yet again that:
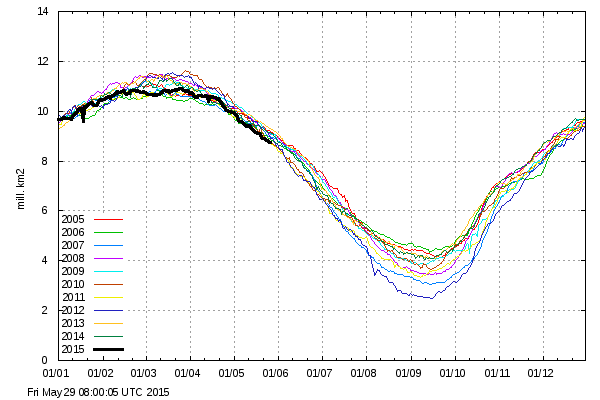
Arctic sea ice is closely tracking 2006, the summer with the highest minimum of the past decade.
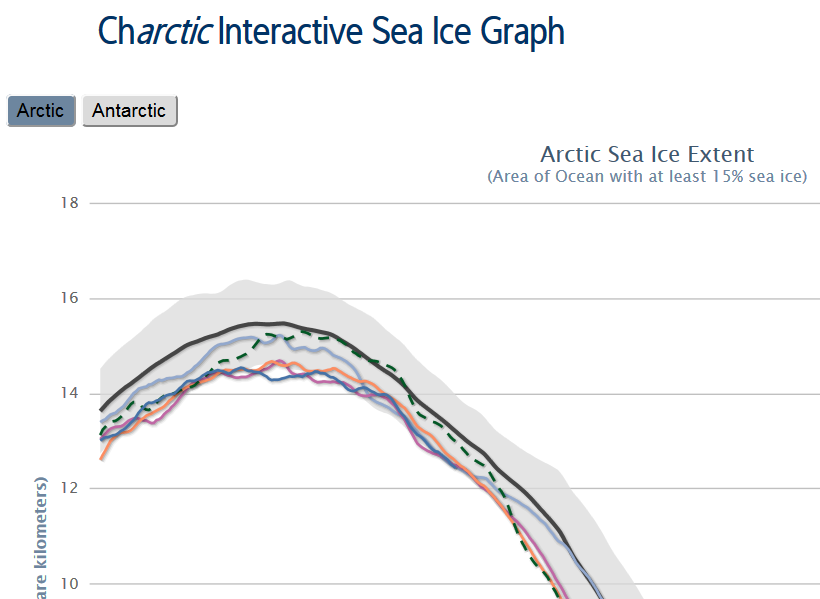
Have we got news for you Tony? Using your preferred metric du jour:
[Edit 10:15 BST July 6th 2015]
“Caleb” is giving me still more stick over at “Real Science”:
It is my duty to report what actually is happening, even if it isn’t what I expect.
I sure do wish Mr. Hunt would learn to do the same. Why on earth he would want to tell us ice was melting when it seemed obvious it was refreezing is beyond me. Does he have some deep need to humiliate himself, like a medieval person undergoing self-flagellation?
Of course I couldn’t take that lying down, so:
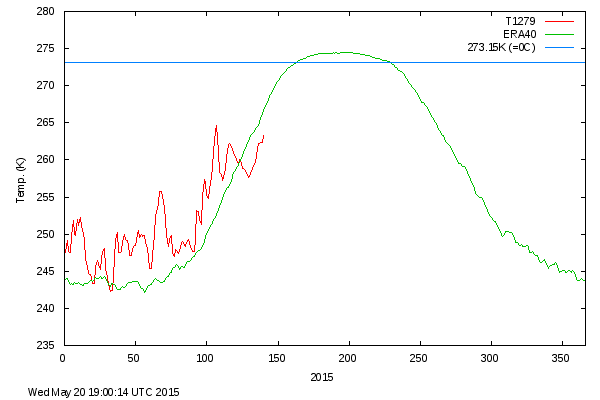
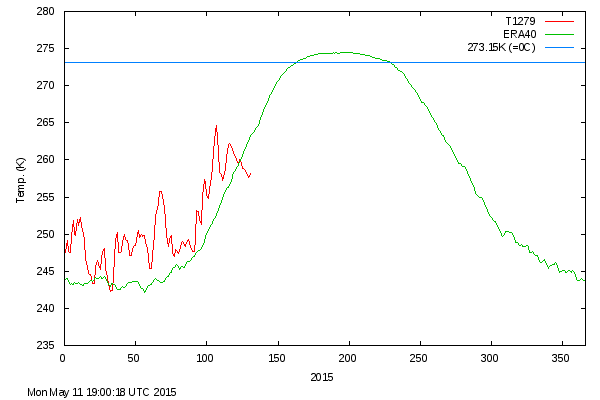
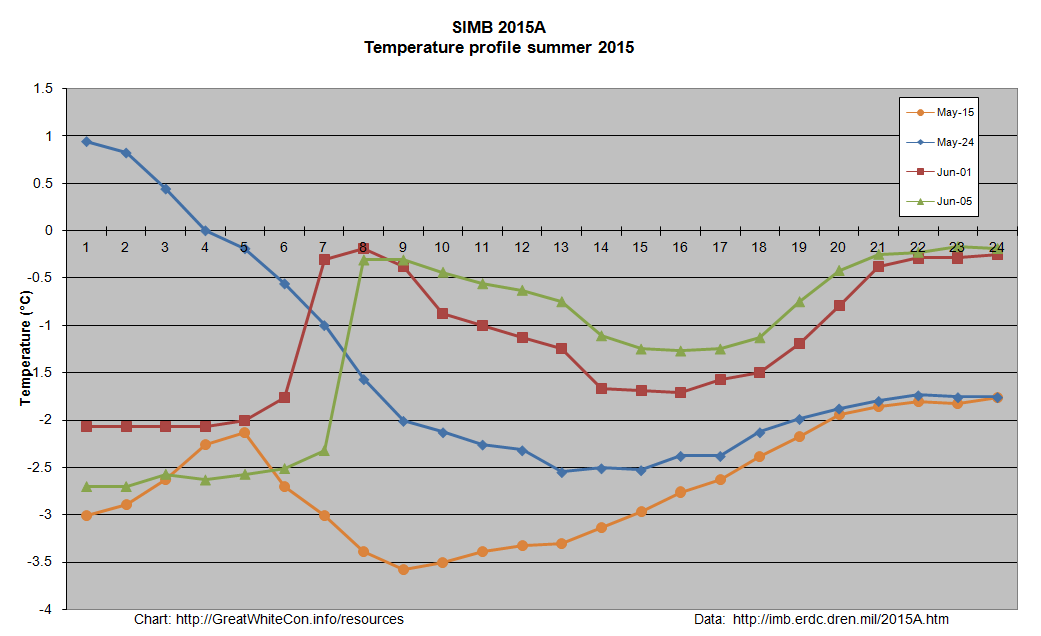
For your information, and that of anyone else who might be interested, the core temperature of the ice floe underneath 2015A got up to -1.34 °C yesterday:
Finally, for the moment at least, here’s an animated GIF of the North Water Polynya which I fear won’t impress Treesong very much:
[Edit 16:00 BST July 7th 2015]
If you repeat something often enough does it eventually turn into the truth? Today’s Arctic article from Steve/Tony is strangely familiar. It is entitled “Arctic Sea Ice Continues To Track 2006“. However according to the NSIDC today:
[Edit 11:00 BST July 11th 2015]
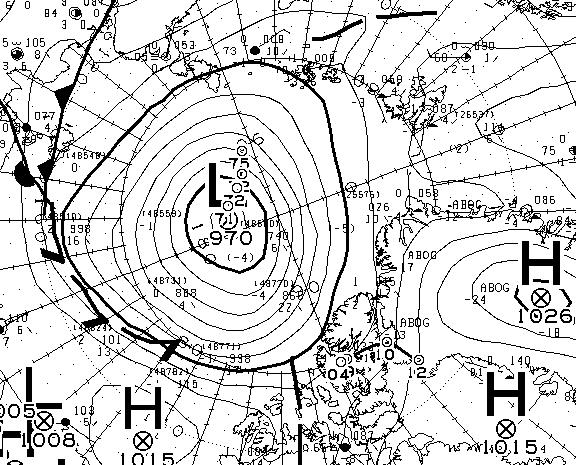
Steve/Tony keeps maintaining every day or two that “Arctic Sea Ice Continues To Track 2006”. There’s been a cyclone over the central Arctic with a minimum central pressure of 970 hPa (or mb if you prefer), which has caused some divergence of the sea ice:
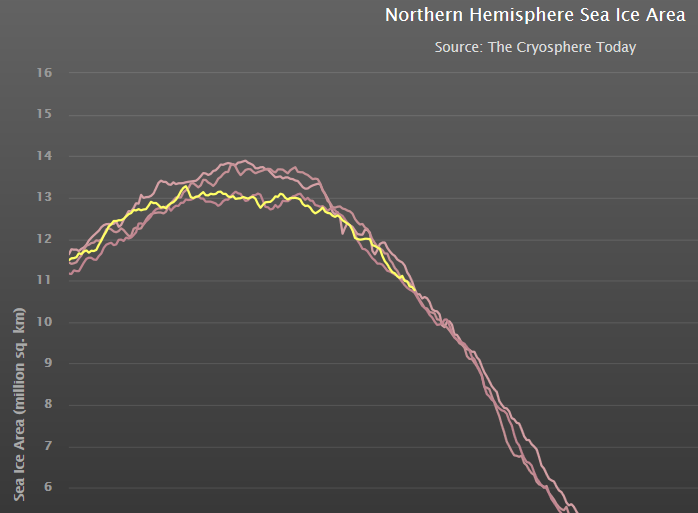
Here’s a closeup of the recent history of a variety of “compactness” metrics which illustrates that point:
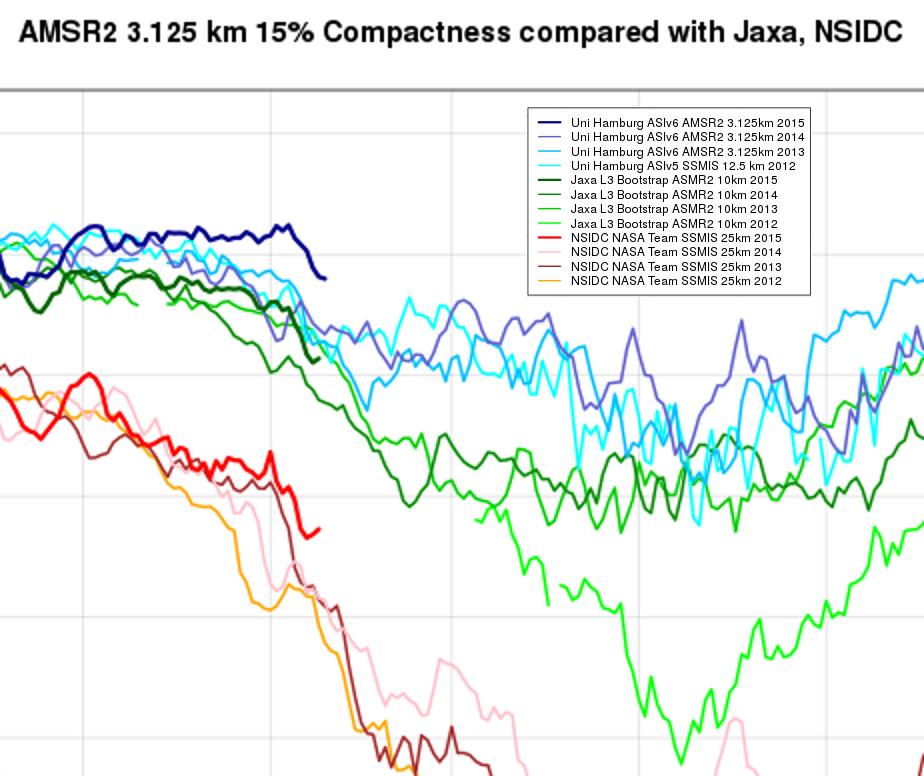
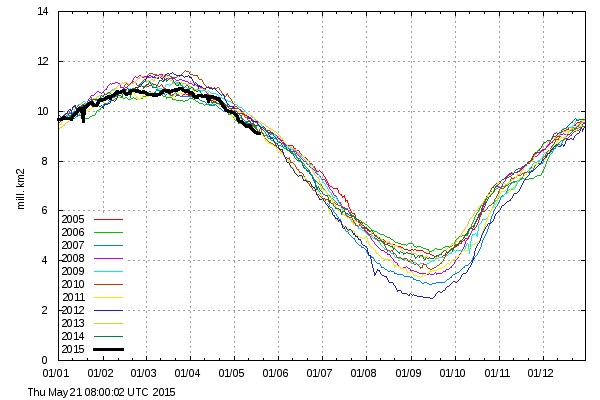
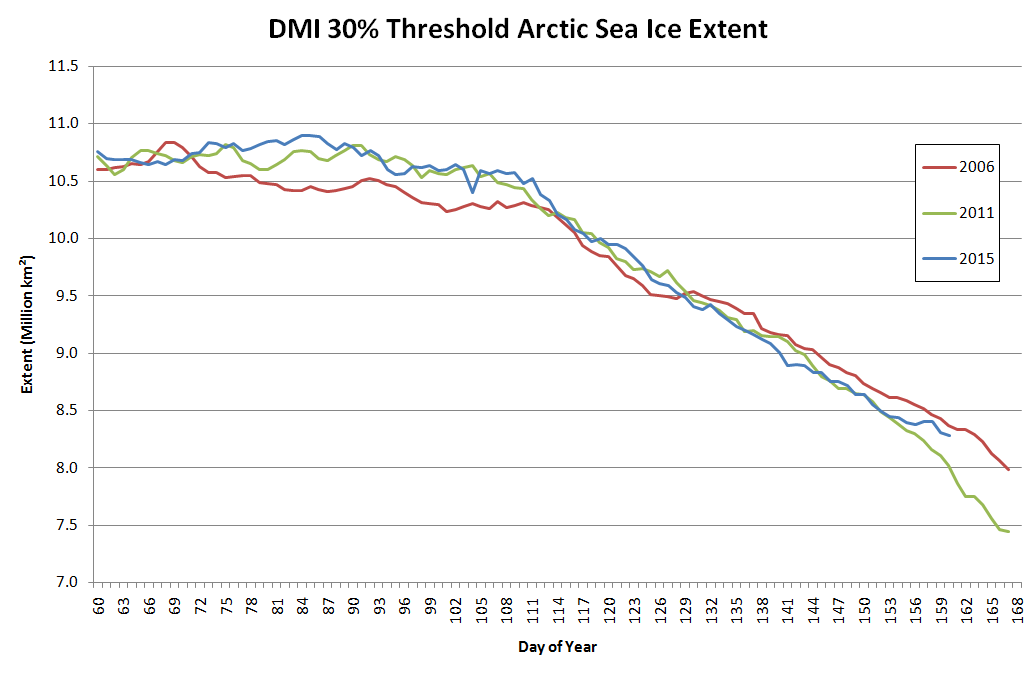
Across the board the sea ice in the Arctic is less compact than a few days ago as a result of the cyclone, but still more compact than on the same date in other recent years. Getting back to the extent metrics, here’s what the DMI 30% threshold version has been up to:
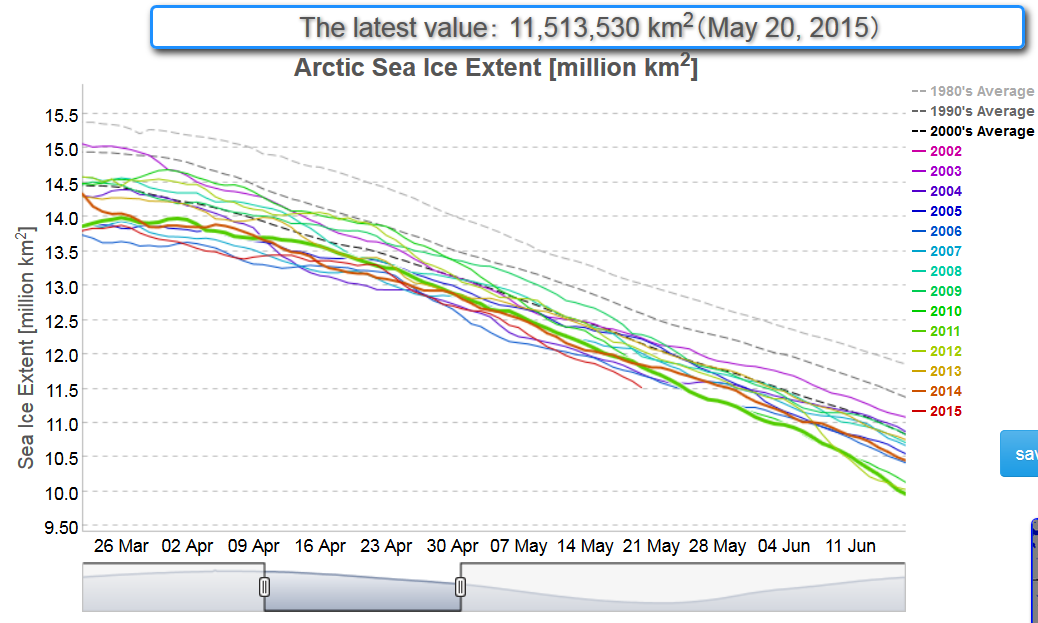
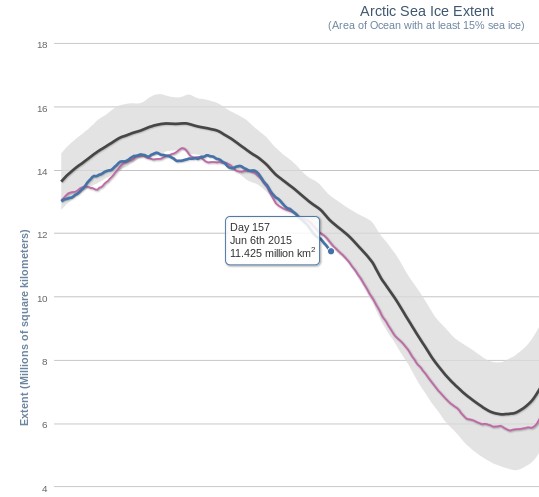
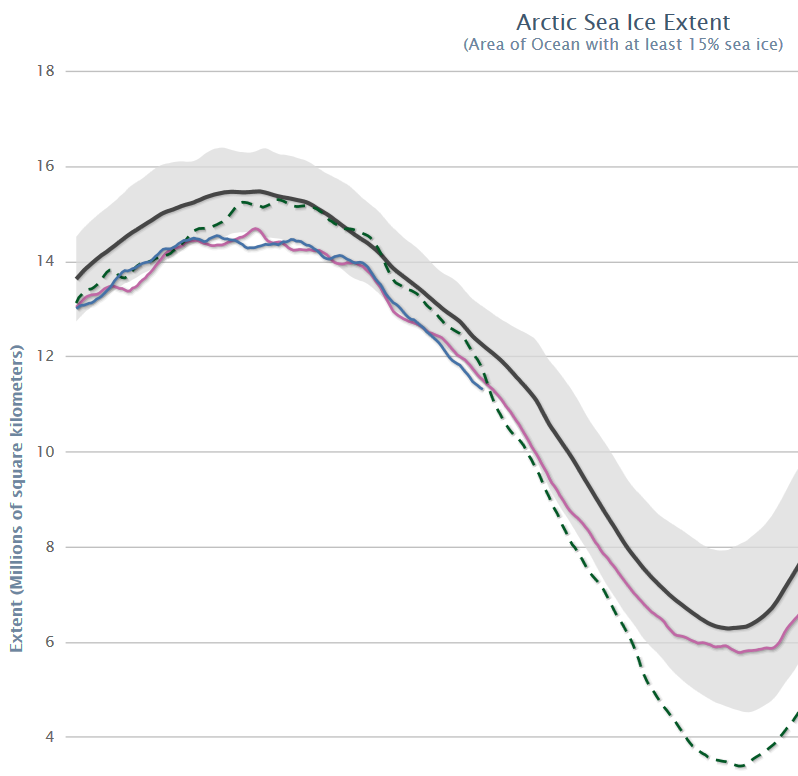
and here’s the NSIDC 5 day average of their 15% threshold flavoured variety:
[/Edit]