The show is over, and it went pretty much as Alice F. predicted it would. Lamar Smith has passed his verdict on the morning’s proceedings in strangely untheatrical style:
https://twitter.com/jim_hunt/status/847123725963198464
My own mileage certainly varied from Lamar’s! Here’s a hasty summary of events via the distorting lens of Twitter:
A more detailed analysis of United States’ House Committee on Science, Space and Technology’s “show trial” of climate models will follow in due course, but for now if you so desire you can watch the entire event on YouTube:
I’ll have to at least watch the bit where my live feed cut out as Dana Rohrabacher slowly went ballistic with Mike Mann:
https://twitter.com/jim_hunt/status/847109097103216643
Please bear in mind that correlation does not necessarily imply causation!

I wonder whether at this juncture Mike wishes he’d taken David Titley’s advice?
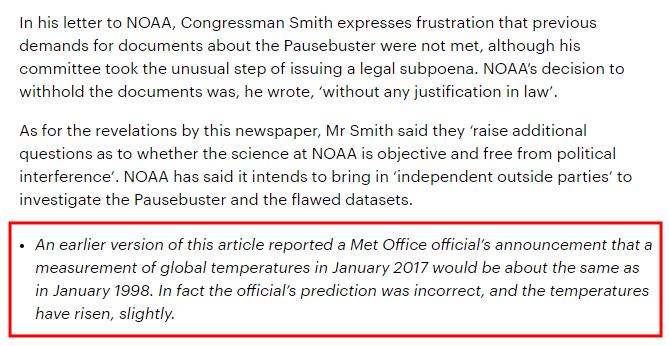
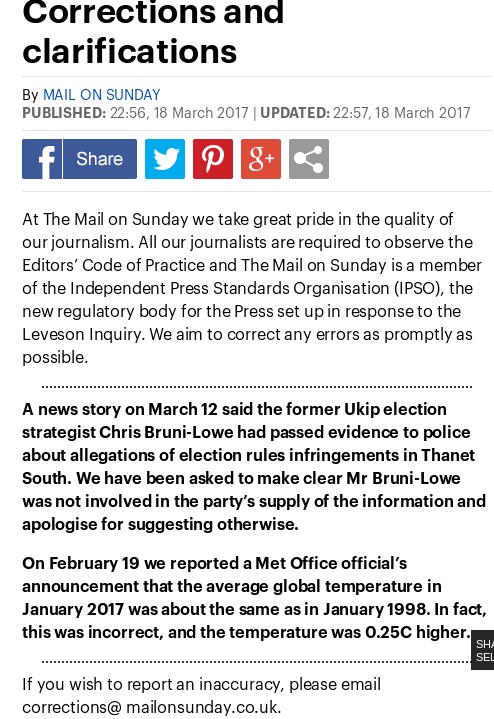
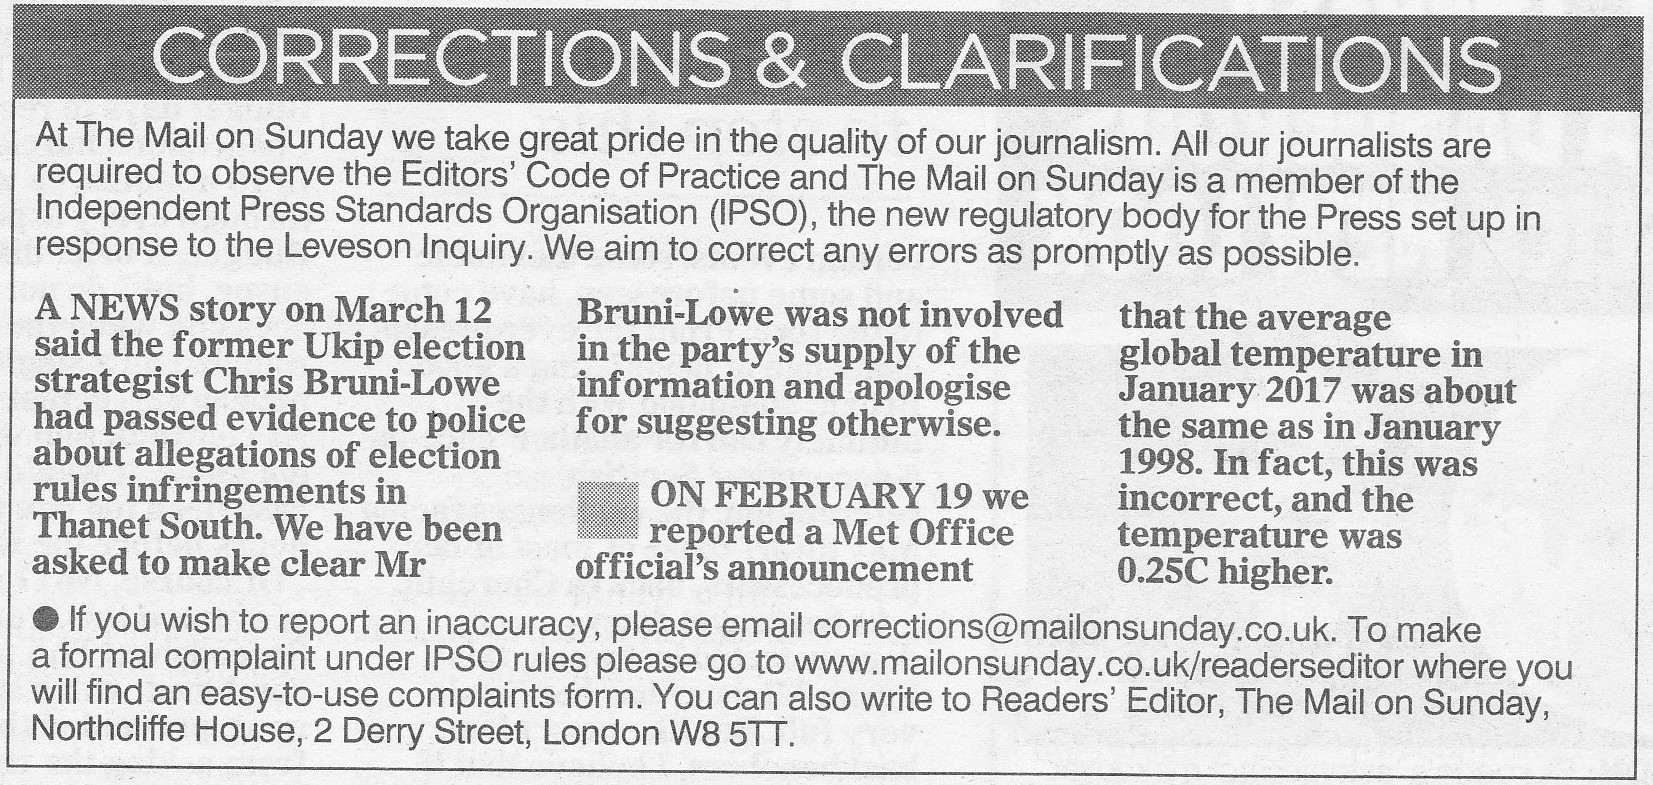
Nevertheless, given our long running campaign against the climate science misinformation frequently printed in the Mail on Sunday it gives us great pleasure to reprint in full the following extract from his written testimony today:
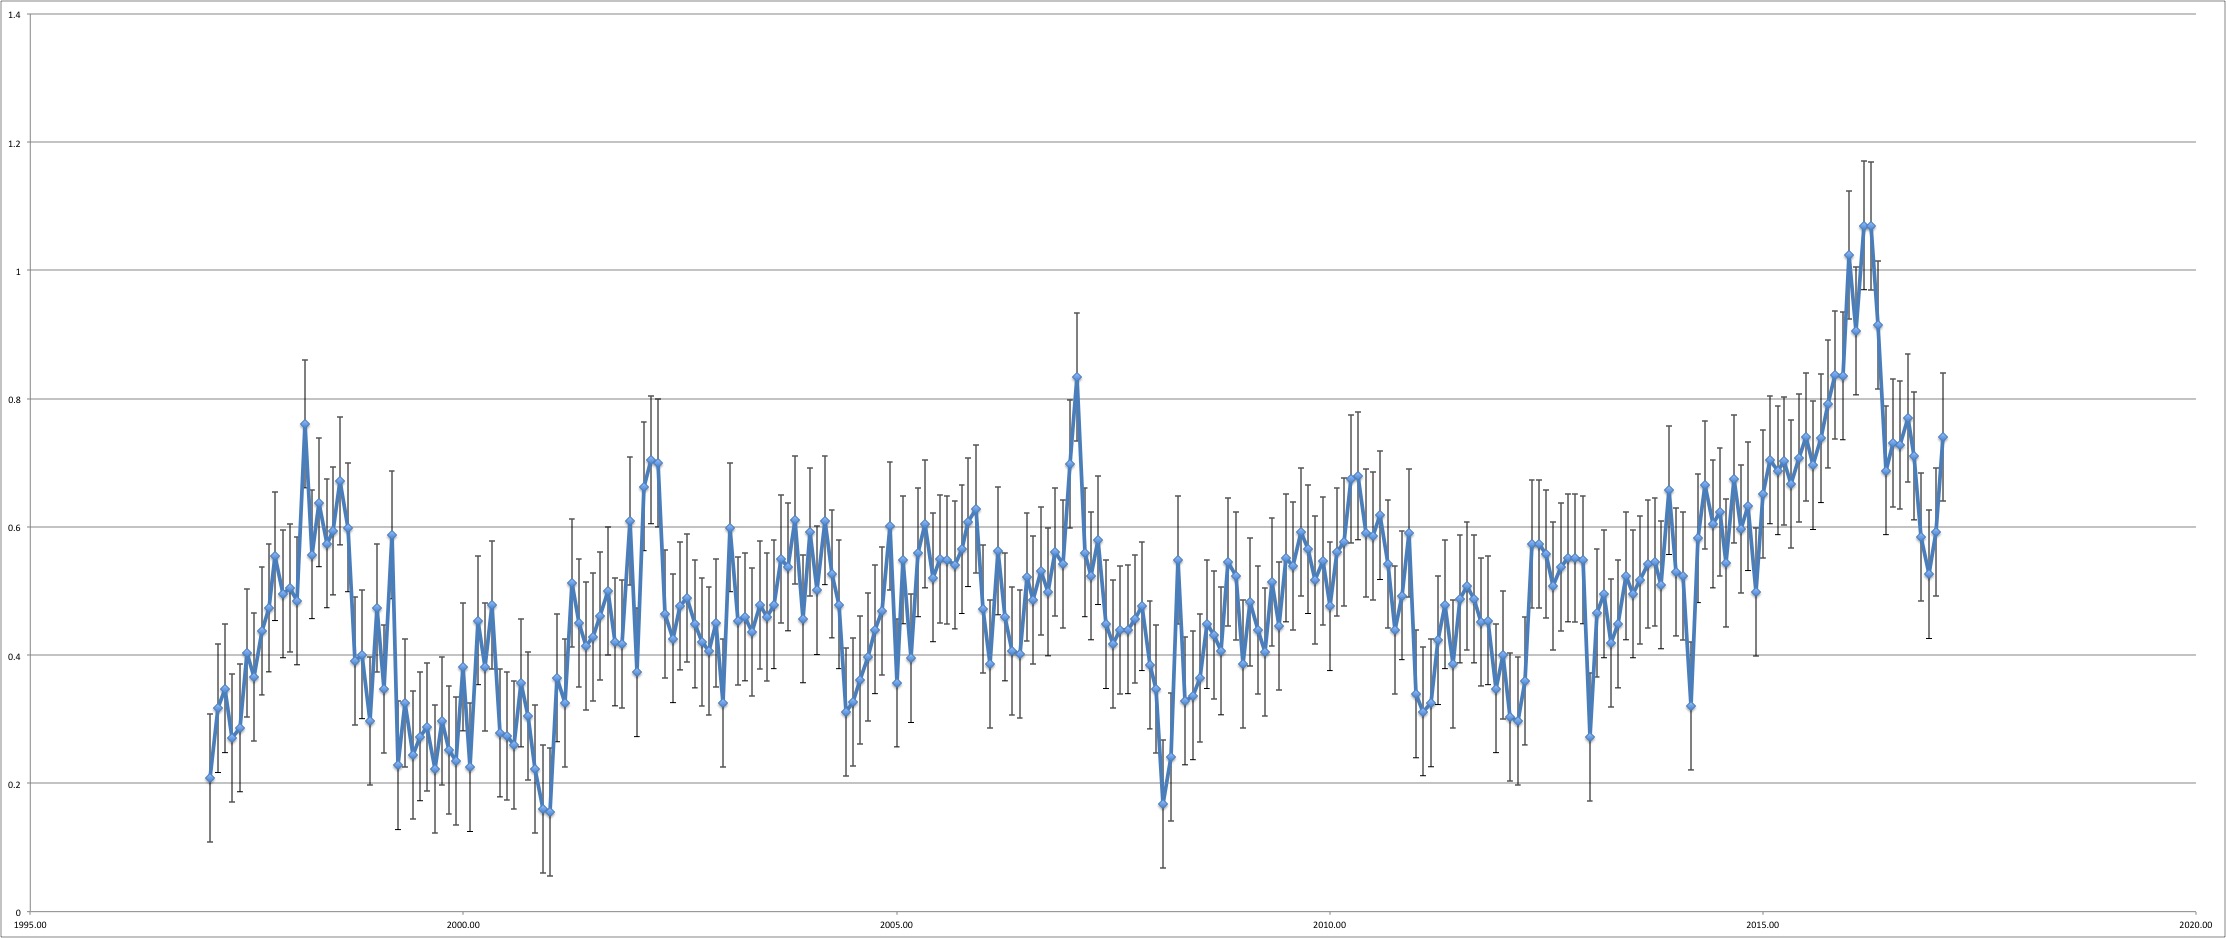
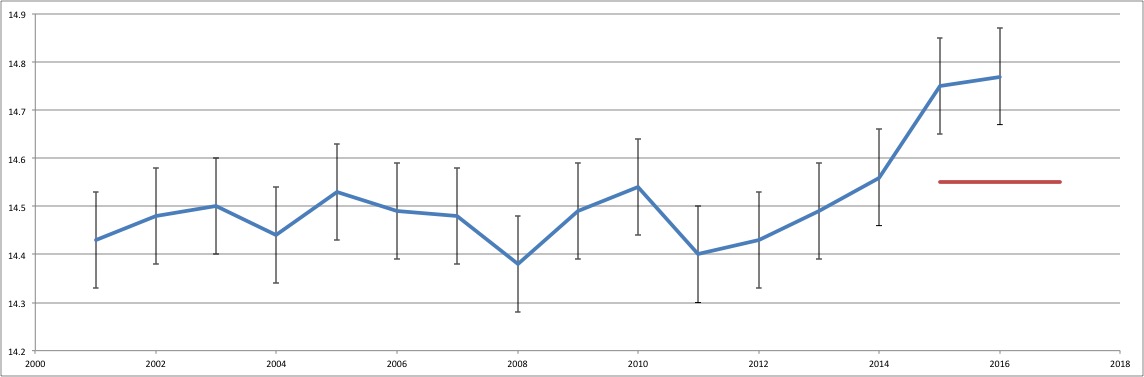
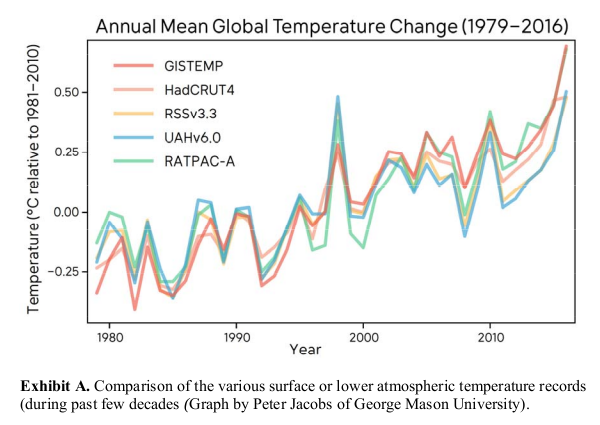
For proper context, we must consider the climate denial myth du jour that global warming has “stopped”. Like most climate denial talking points, the reality is pretty much the opposite of what is being claimed by the contrarians. All surface temperature products, including the controversial UAH satellite temperature record, show a clear long-term warming trend over the past several decades:
We have now broken the all-time global temperature record for three consecutive years and a number of published articles have convincingly demonstrated that global warming has continued unabated despite when one properly accounts for the vagaries of natural short-term climate fluctuations. A prominent such study was published by Tom Karl and colleagues in 2015 in the leading journal Science. The article was widely viewed as the final nail in the “globe has stopped warming” talking point’s coffin.
Last month, opinion writer David Rose of the British tabloid the Daily Mail — known for his serial misrepresentations of climate change and his serial attacks on climate scientists, published a commentary online attacking Tom Karl, accusing him of having “manipulated global warming data” in the 2015 Karl et al article. This fake news story was built entirely on an interview with a single disgruntled former NOAA employee, John Bates, who had been demoted from a supervisory position at NOAA for his inability to work well with others.
Bates’ allegations were also published on the blog of climate science denier Judith Curry (I use the term carefully—reserving it for those who deny the most basic findings of the scientific community, which includes the fact that human activity is substantially or entirely responsible for the large-scale warming we have seen over the past century — something Judith Curry disputes). That blog post and the Daily Mail story have now been thoroughly debunked by the actual scientific community. The Daily Mail claim that data in the Karl et al. Science article had been manipulated was not supported by Bates. When the scientific community pushed back on the untenable “data manipulation” claim, noting that other groups of scientists had independently confirmed Karl et al’s findings, Bates clarified that the real problem was that data had not been properly archived and that the paper was rushed to publication. These claims too quickly fell apart.
Though Bates claimed that the data from the Karl et al study was “not in machine-readable form”, independent scientist Zeke Hausfather, lead author of a study that accessed the data and confirmed its validity, wrote in a commentary “…for the life of me I can’t figure out what that means. My computer can read it fine, and it’s the same format that other groups use to present their data.” As for the claim that the paper was rushed to publication, Editor-in-chief of Science Jeremy Berg says, “With regard to the ‘rush’ to publish, as of 2013, the median time from submission to online publication by Science was 109 days, or less than four months. The article by Karl et al. underwent handling and review for almost six months. Any suggestion that the review of this paper was ‘rushed’ is baseless and without merit. Science stands behind its handling of this paper, which underwent particularly rigorous peer review.”
Shortly after the Daily Mail article went live, a video attacking Karl (and NOAA and even NASA for good measure) was posted by the Wall Street Journal. Within hours, the Daily Mail story spread like a virus through the right-wing blogosphere, appearing on numerous right-wing websites and conservative news sites. It didn’t take long for the entire Murdoch media empire in the U.S, U.K. and elsewhere to join in, with the execrable Fox News for example alleging Tom Karl had “cooked” climate data and, with no sense of irony, for political reasons.
Rep. Lamar Smith (R-TX), chair of this committee has a history25 of launching attacks on climate science and climate scientists. He quickly posted a press release praising the Daily Mail article, placing it on the science committee website, and falsely alleging that government scientists had “falsified data”. Smith, it turns out, had been planning a congressional hearing timed to happen just days after this latest dustup, intended to call into question the basis for the EPA regulating carbon emissions. His accusations against Karl and NOAA of tampering with climate data was used in that hearing to claim that the entire case for concern over climate change was now undermined.
That’s pretty much the way we see things too Mike!
In the aftermath of Wednesday’s hearing, the accusations are flying in all directions. By way of example:
https://twitter.com/jim_hunt/status/847443788880429057
No clarification has yet been forthcoming from Dr. Pielke.
The denialosphere is of course now spinning like crazy attempting to pin something, anything, on Michael Mann. Over at Climate Depot Marc Morano assures his loyal readers that:
Testifying before Congress, climate scientist Michael Mann denies any affiliation or association to the Climate Accountability Institute despite his apparent membership on the Institute’s Council of Advisors.
Whilst correctly quoting Dr. Mann as saying:
I can provide – I’ve submitted my CV you can see who I’m associated with and who I am not.
Here’s the video Marc uses to support his case:
Meanwhile over on Twitter:
As I said before, Mann said "No." He then added "I've submitted my CV. You can see who I'm associated with". The CV contradicts his lie.
— Stephen McIntyre (@ClimateAudit) March 30, 2017
Today is All Fools’ Day, but this is no joke. Last night Judith Curry posted an article on her “Climate Etc.” blog entitled “‘Deniers,’ lies and politics“. Here is an extract from it:
Mann ‘denies’ being associated with the Climate Accountability Institute [link to above Marc Morano video]. Julie Kelly writes in an article Michael Mann Embarrasses Himself Before Congress:
“Turns out Mann appears to be a bit of a denier himself. Under questioning, Mann denied being involved with the Climate Accountability Institute even though he is featured on its website as a board member. CAI is one of the groups pushing a scorched-earth approach to climate deniers, urging lawmakers to employ the RICO statute against fossil-fuel corporations. When asked directly if he was either affiliated or associated with CAI, Mann answered “no.” [JC note: Mann also lists this affiliation on his CV]
Some additional ‘porkies’ are highlighted in an article by James Delingpole.
Now the first thing to note is that I’d already explained the context of Mr. Mann’s “interrogation” by Rep. Clay Higgins on Judith’s blog several times:
At the risk of repeating myself Mann said, and I quote:
“I’ve submitted my CV. You can see who I’m ‘associated’ with”
His CV states, quoted by McIntyre:
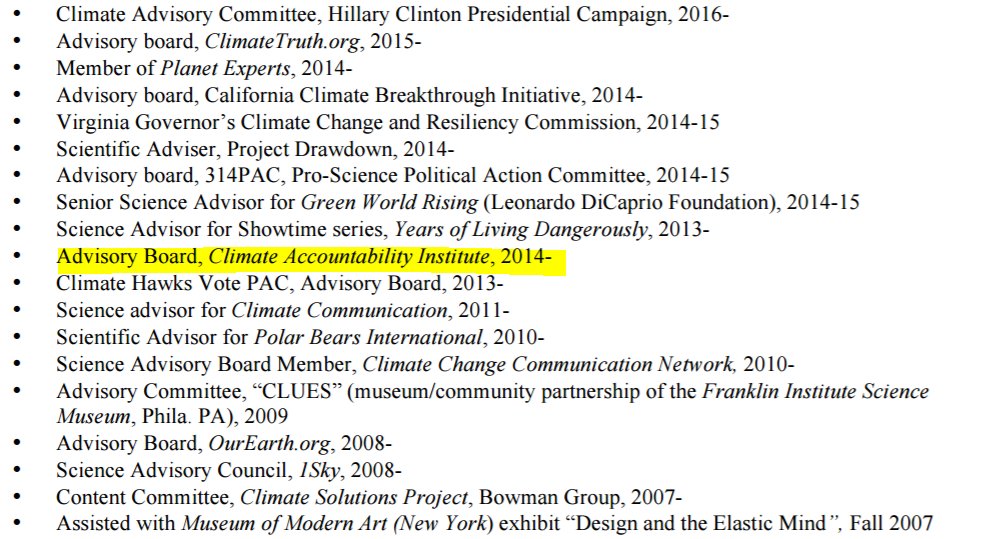
Why on Earth Judith chose to repeat the “CAI” allegation is beyond me.
Secondly, Prof. Mann is NOT featured on the CAI website as a board member. He is instead listed as a member of their “Council of Advisors”.
Thirdly, quoting James Delingpole as a source of reliable information about anything “climate change” related is also beyond me. Needless to say Mr. Delingpole also repeats the CAI nonsense, whilst simultaneously plagiarising our long standing usage of the term “Porky pie“!
All of which brings me on to my next point. In the video clip above Rep. Higgins can be heard to say:
These two organisations [i.e the Union of Concerned Scientists & the Climate Accountability Institute], are they connected directly with organised efforts to prosecute man influenced climate sceptics via RICO statutes?
to which Dr. Mann replied:
The way you’ve phrased it, I would find it extremely surprising if what you said was true.
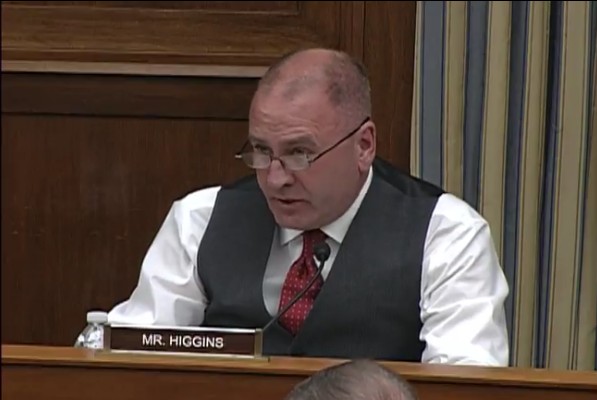
Now please skip to the 1 hour 31:33 mark in the video of the full hearing to discover what Marc Morano left out. Rep. Higgins asks Dr. Mann:
Would you be able to at some future date provide to this committee evidence of your lack of association with the organisation Union of Concerned Scientists and lack of your association with the organisation called Climate Accountability Institute? Can you provide that documentation to this committee Sir?
This is, of course, a “when did you stop beating your wife” sort of a question. How on Earth do you prove a “lack of association with an organisation”. Supply a video of your entire life? Dr. Mann responded less pedantically:
You haven’t defined what “association” even means here, but it’s all in my CV which has already been provided to Committee.
So what on Earth are Rep. Higgins and ex. Prof. Curry on about with all this “RICO” business? With thanks to Nick Stokes on Judith’s blog, the document he refers to seems to be the only evidence for the insinuations:
It turns out that what the congressman was probably referring to was a workshop they mounted in 2012 (not attended by Mann), which explored the RICO civil lawsuit mounted against tobacco companies.
It does mention for example “the RICO case against the tobacco companies” but it never mentions anything that might conceivably be (mis)interpreted as “pushing a scorched-earth approach to climate deniers”.
That being the case, why on Earth do you suppose Judith Curry chose to mention that phrase on her blog last night and why did Clay Higgins choose to broach the subject on Wednesday?
Perhaps this really is an April Fools’ joke? Over on Twitter Stephen McIntyre continues to make my case for me. Take a look:
https://twitter.com/jim_hunt/status/848397908802248704
And he’s not the only one! Alice F.’s sixth sense tells her that another Storify slideshow will be required to do this saga justice!