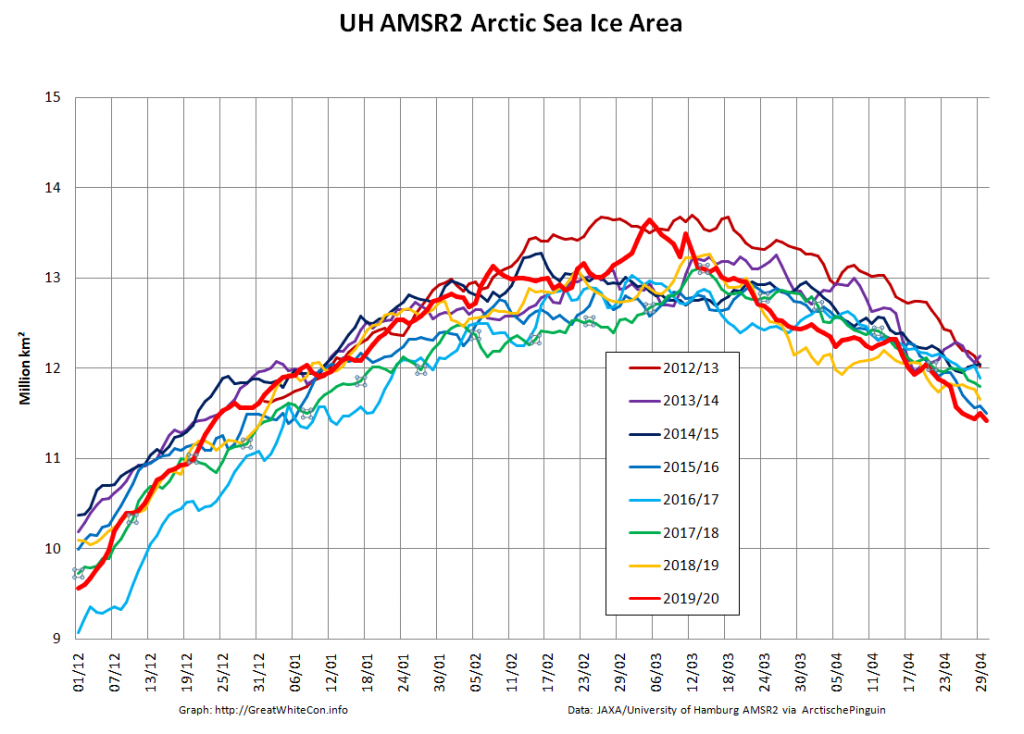
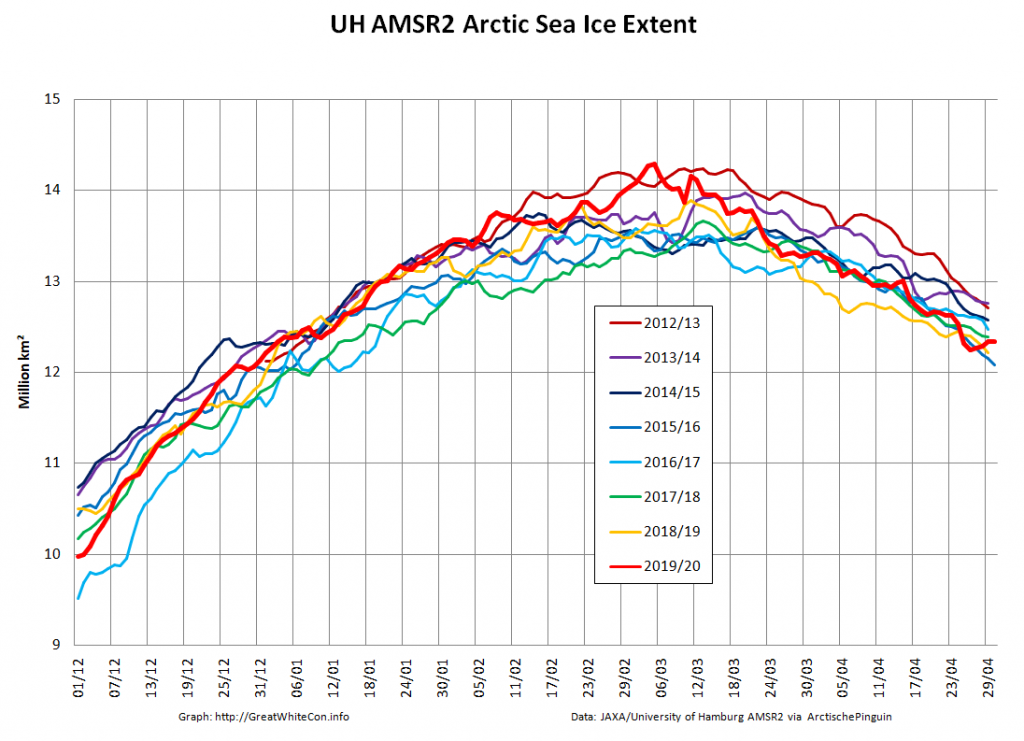
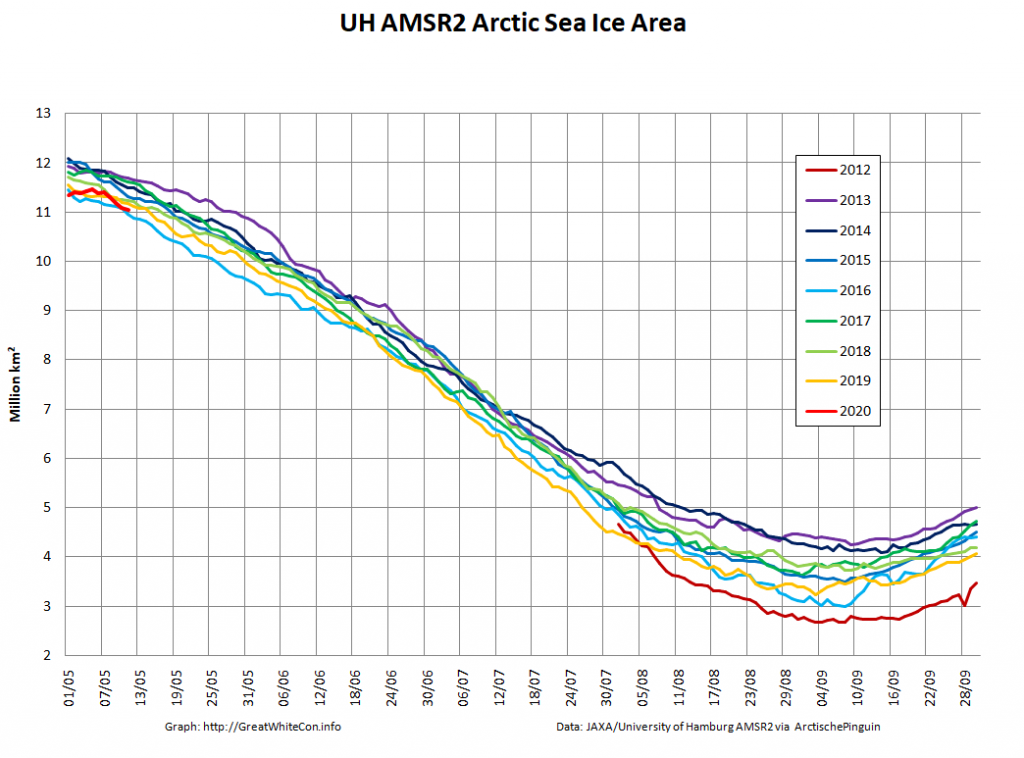
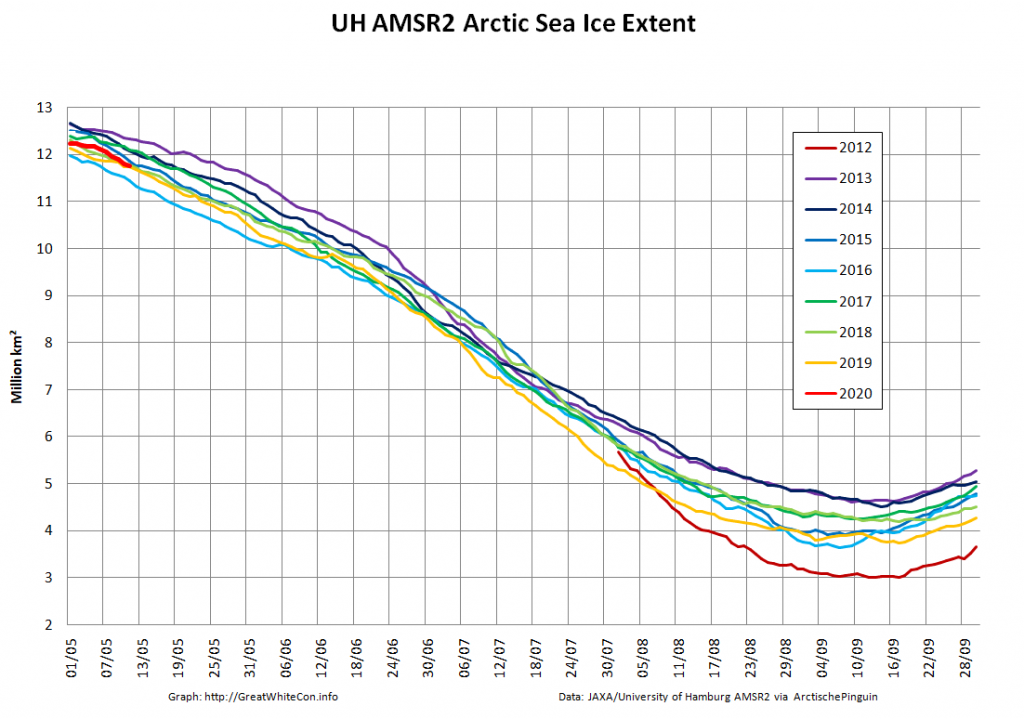
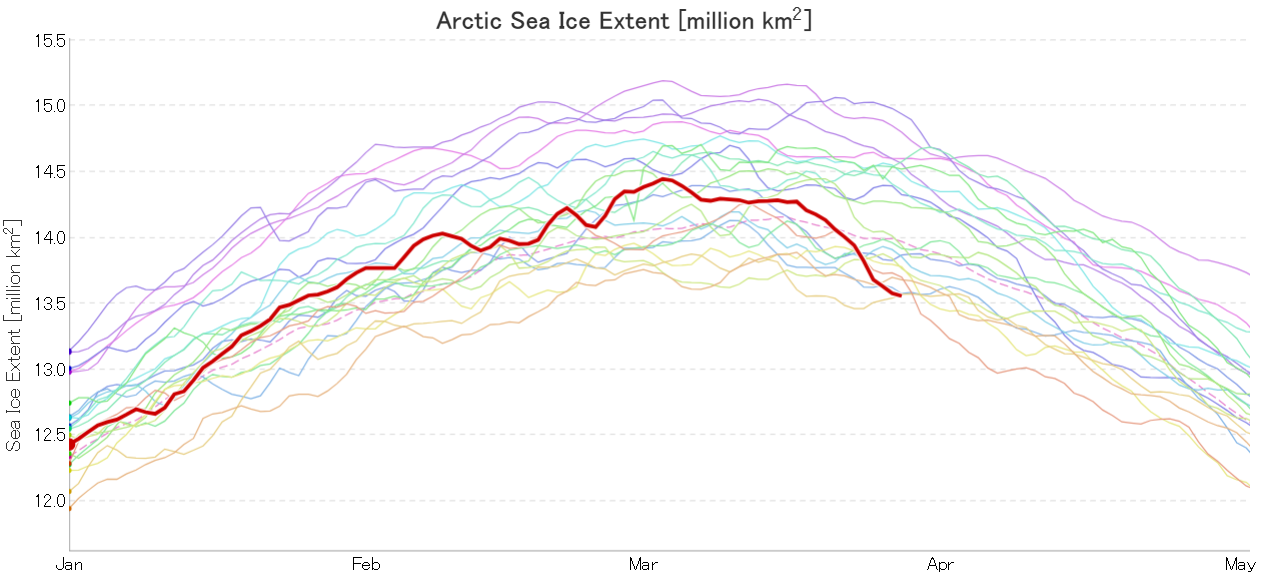
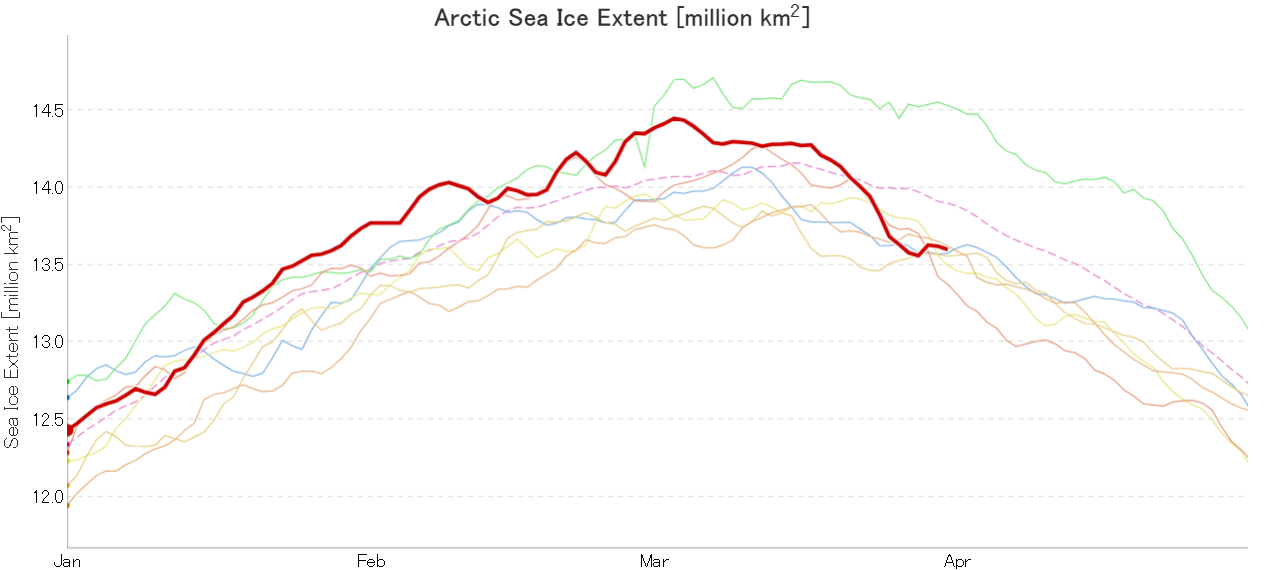
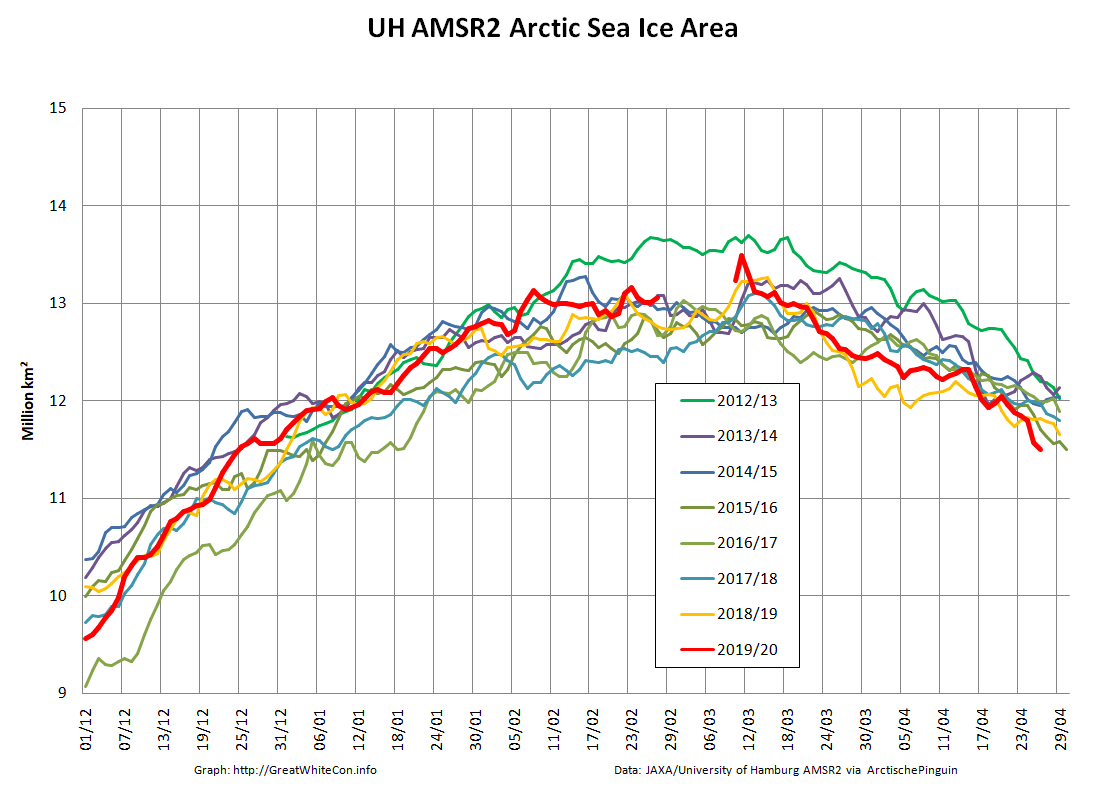
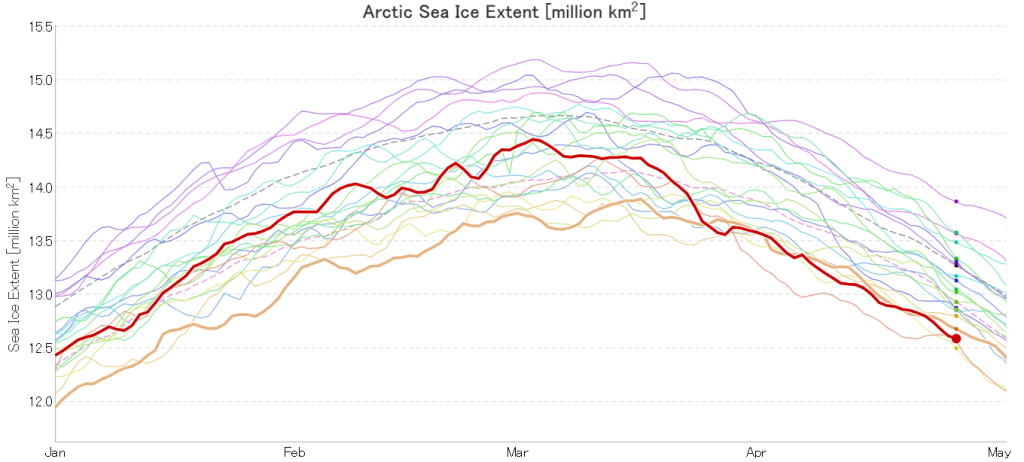
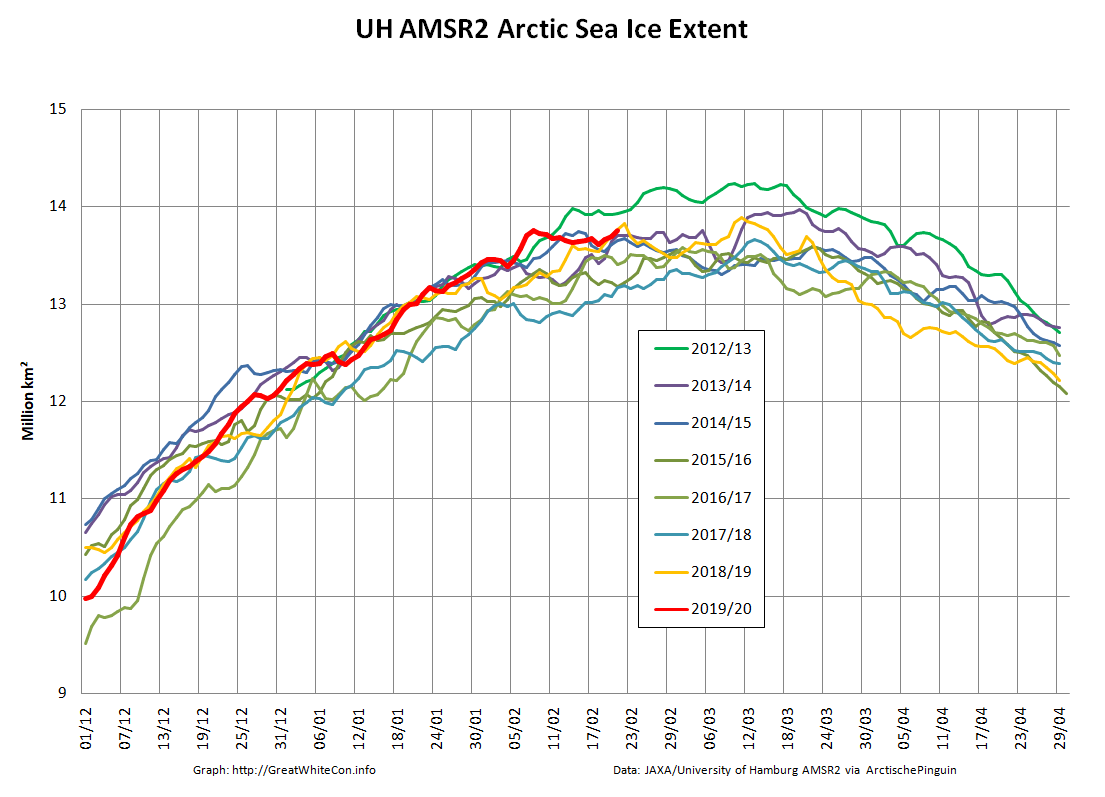
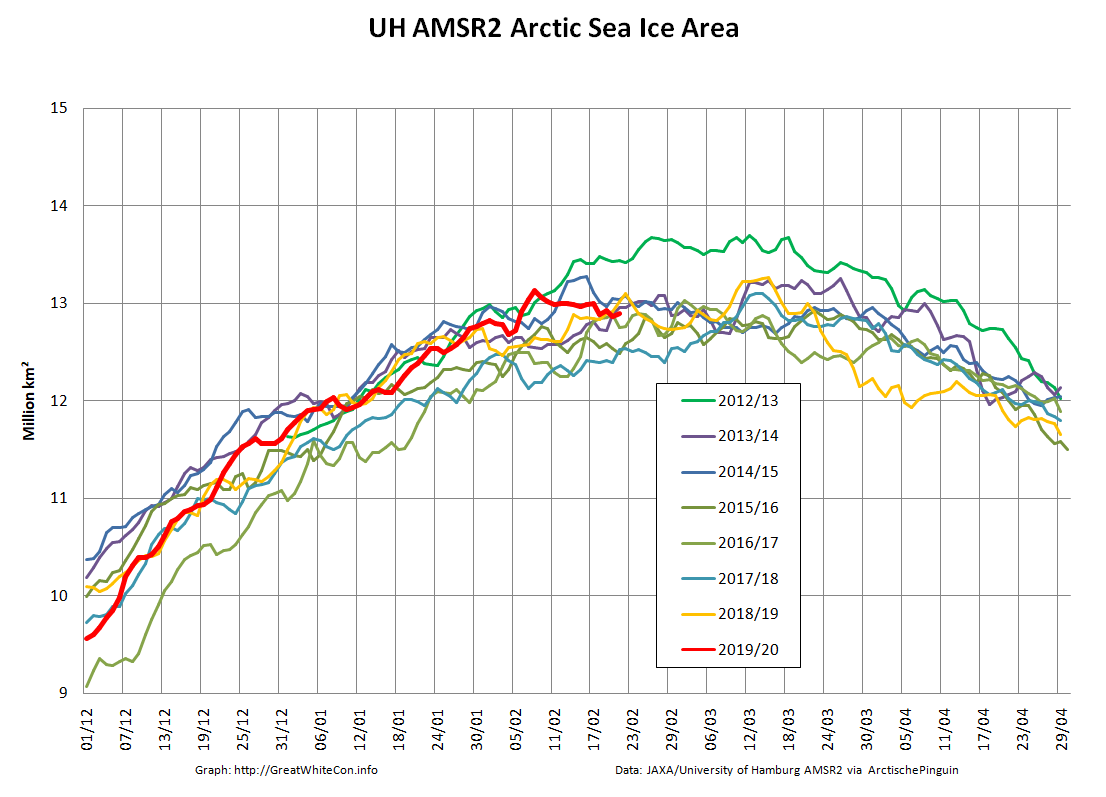
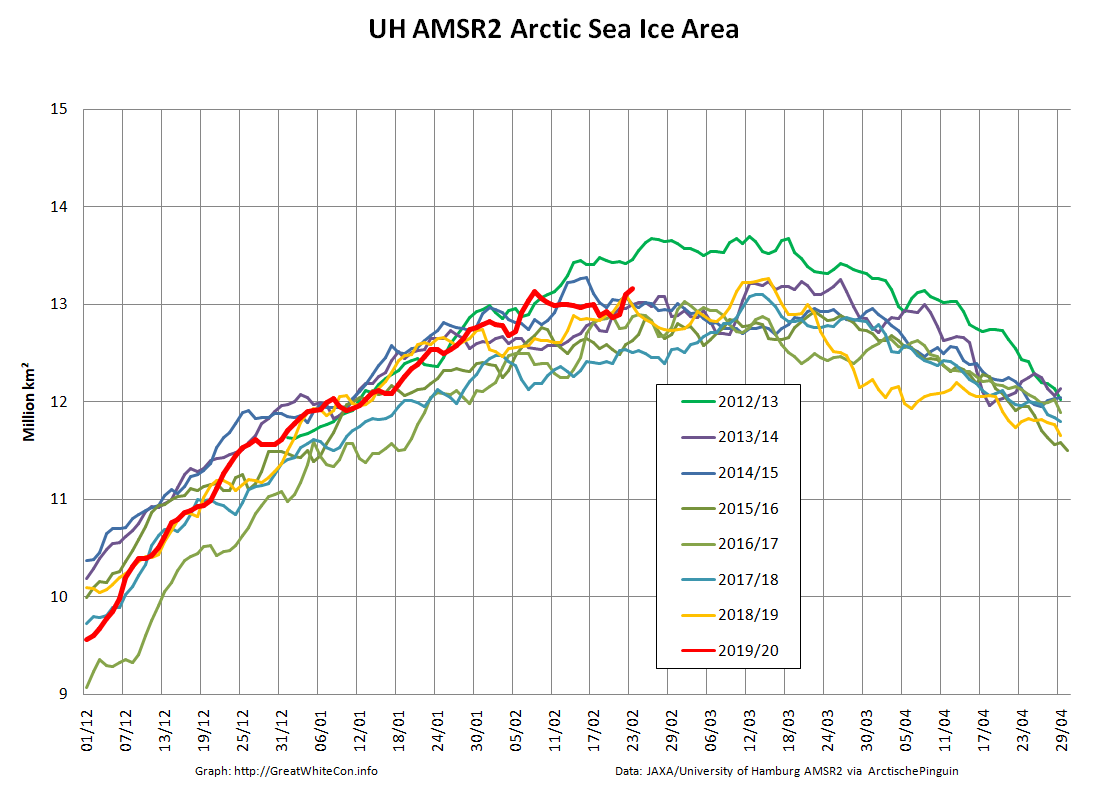
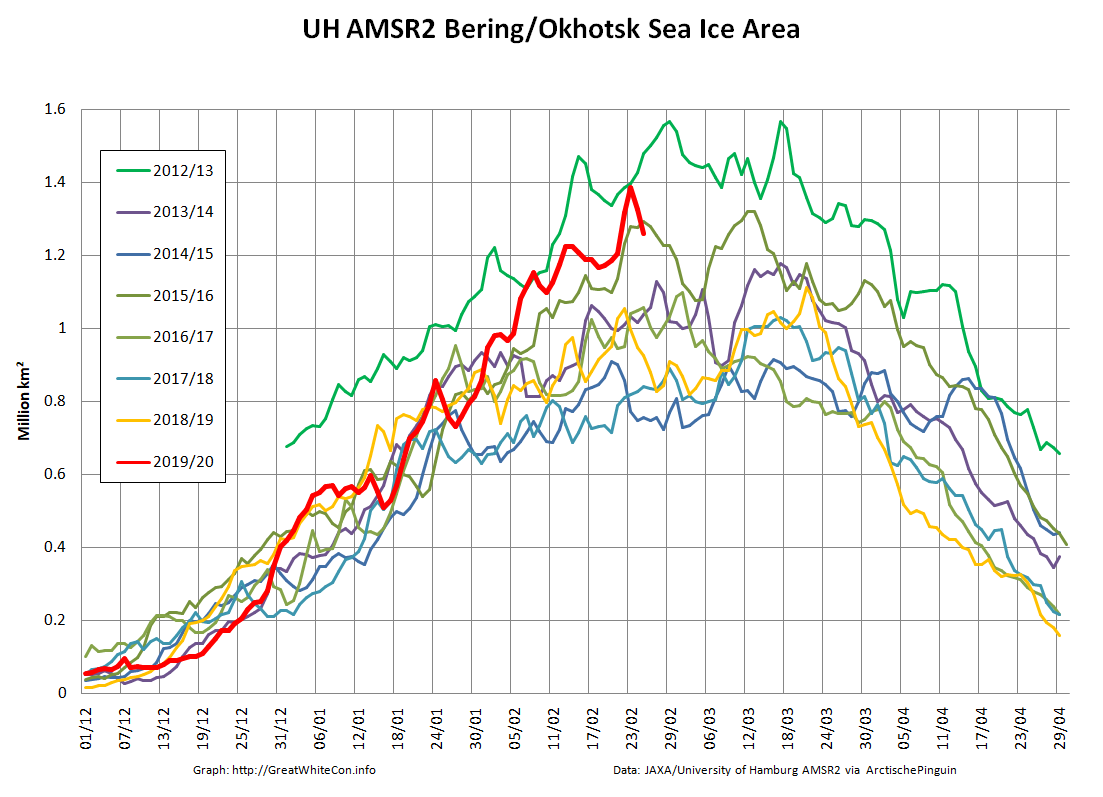
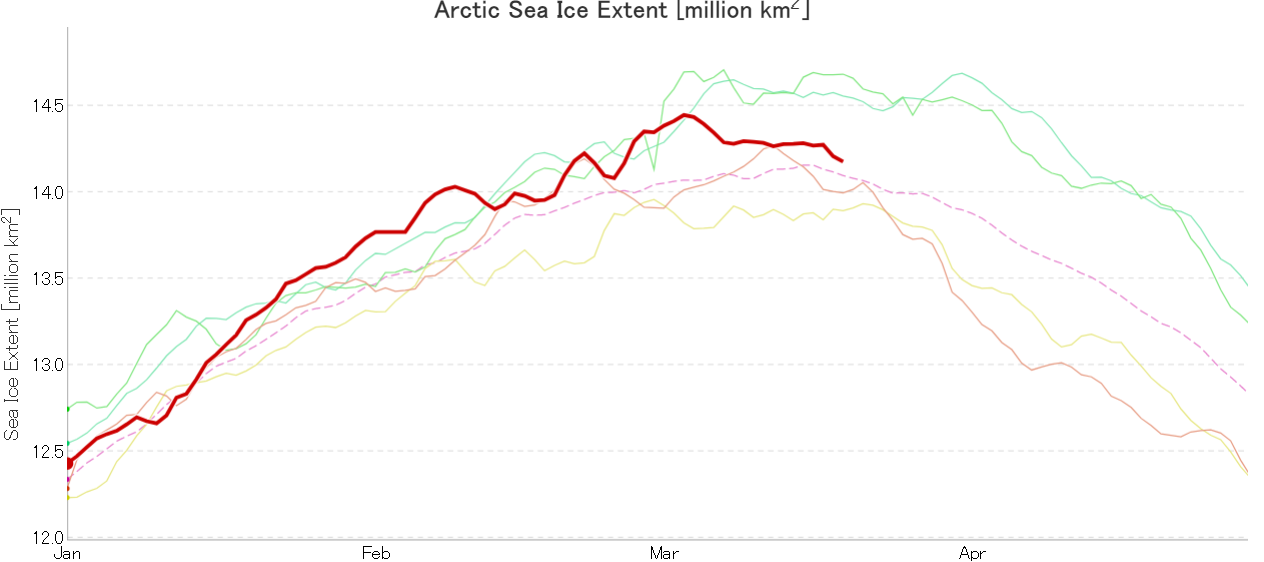
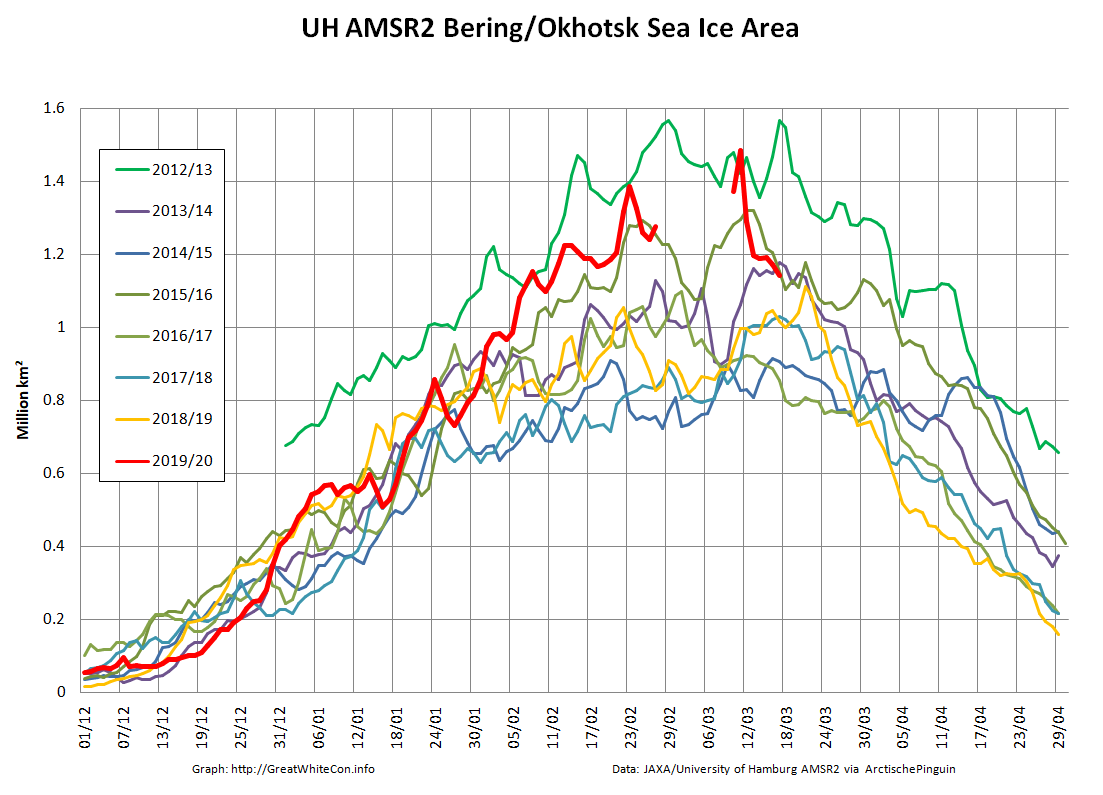
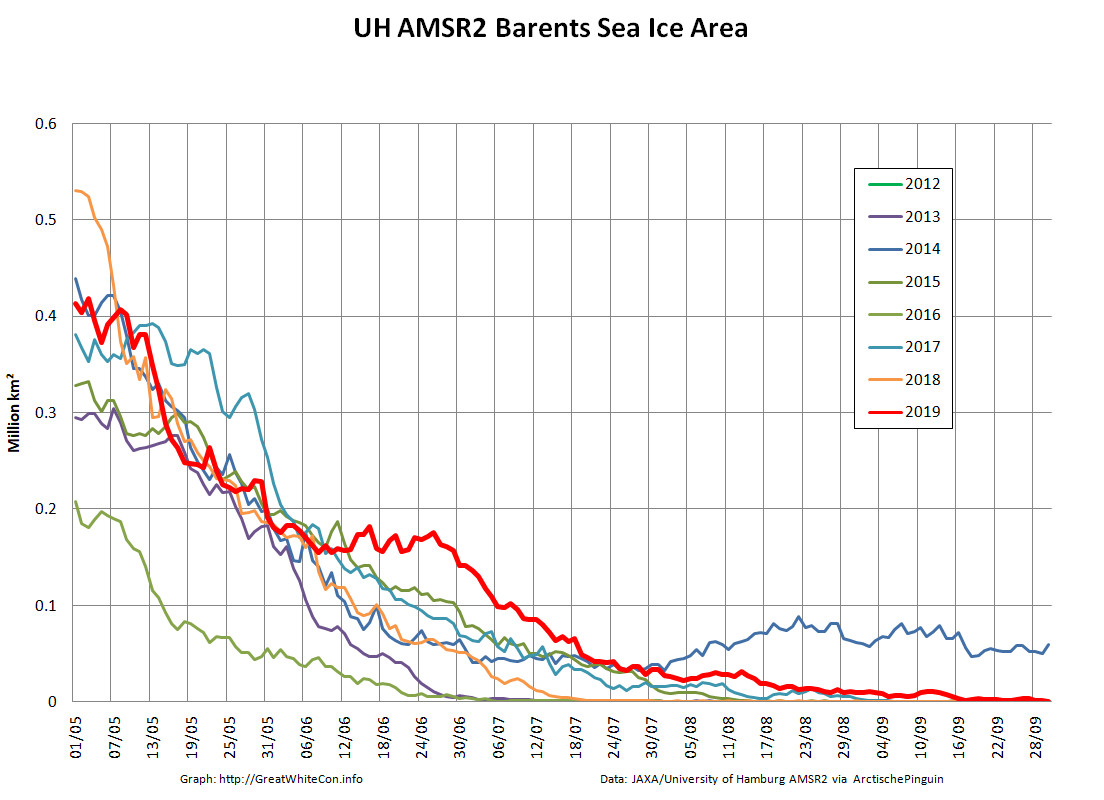
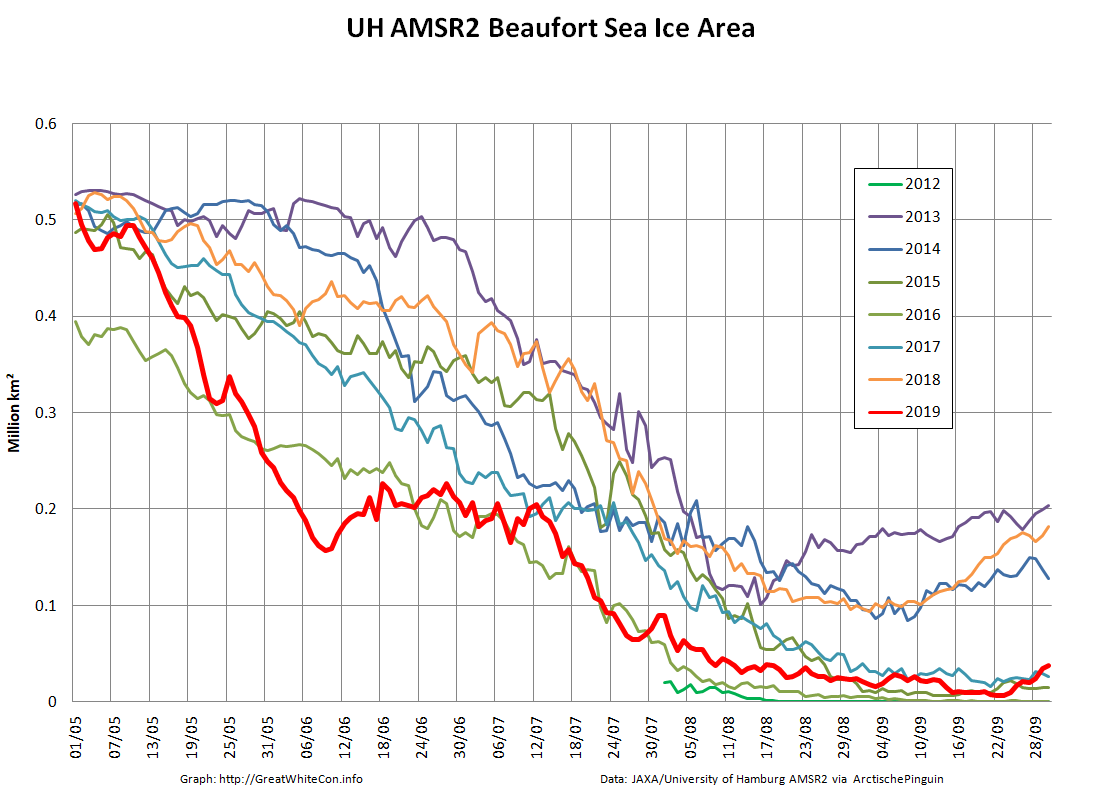
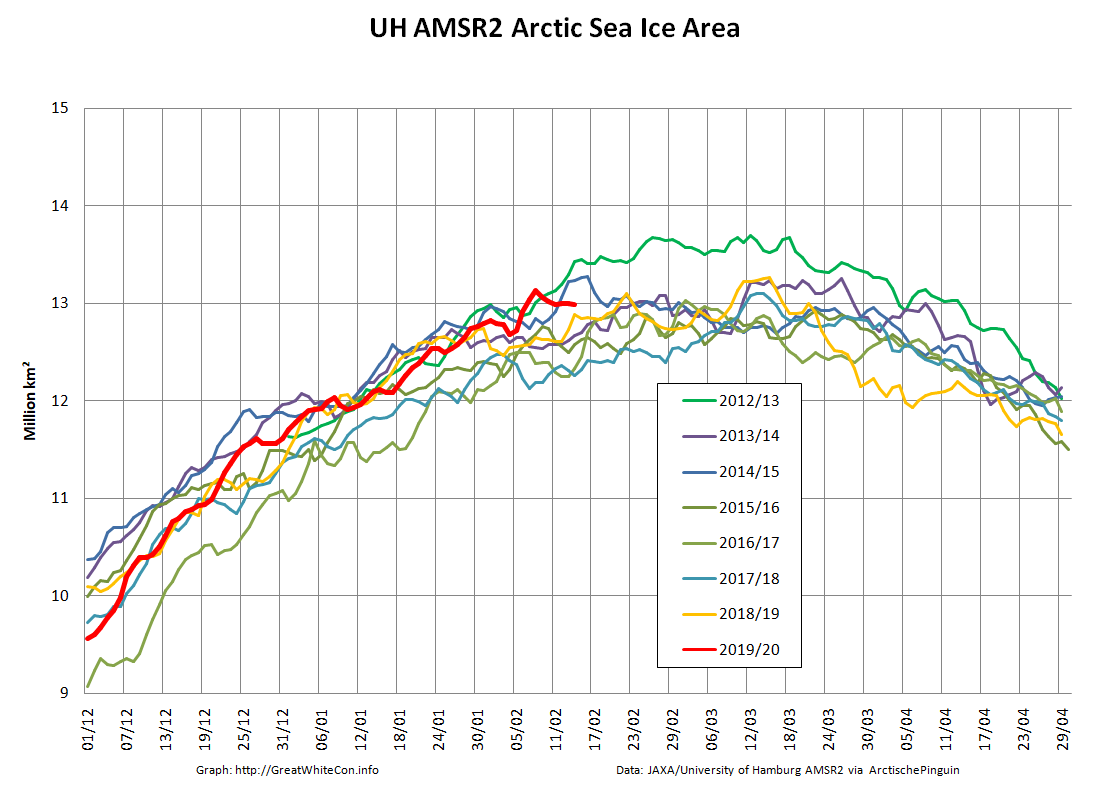
As is our current habit this month’s report begins with the high resolution Arctic sea ice area and extent graphs based on the University of Hamburg’s AMSR2 concentration maps:
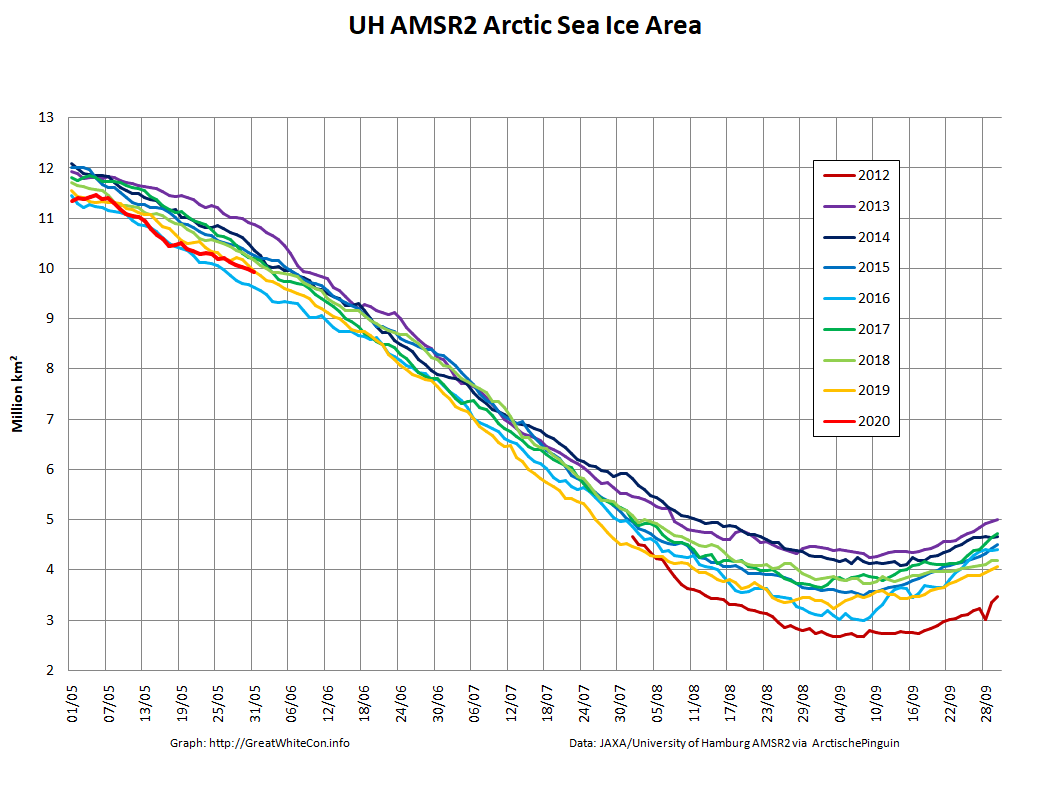
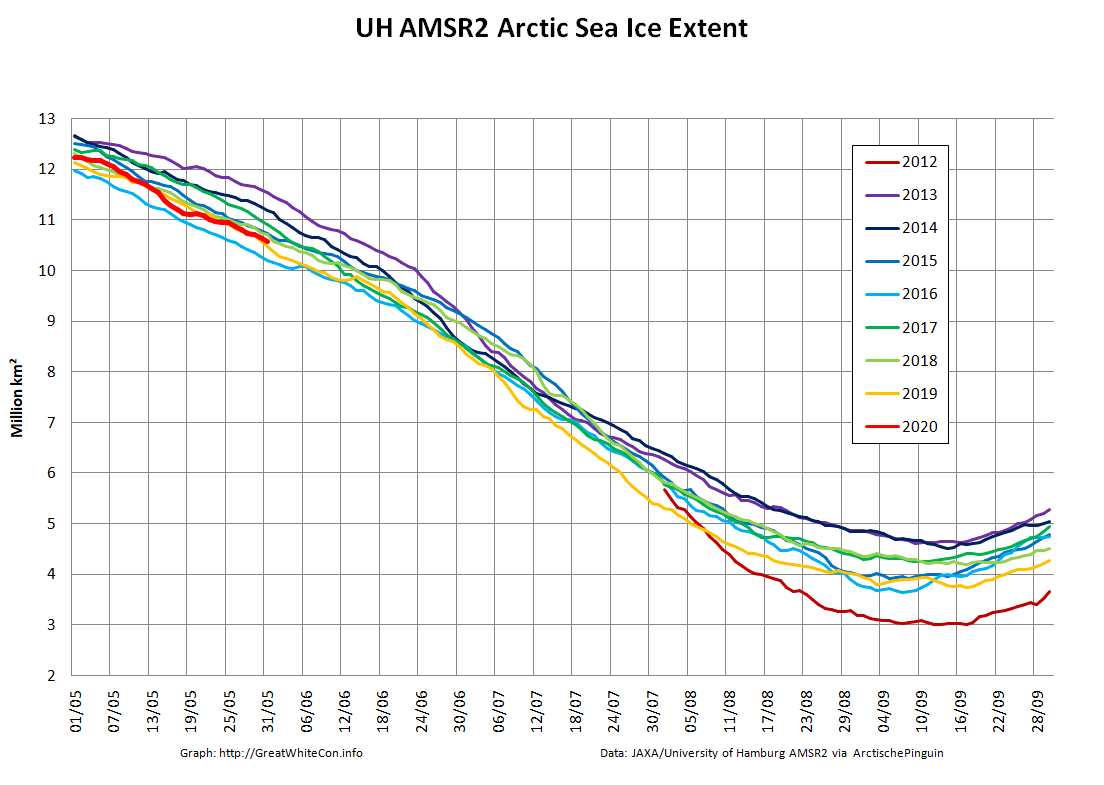
Area and extent are currently vying for second place with 2019 on the “lowest for the date” leader board, a little behind 2016 at this point in the 2020 melting season.
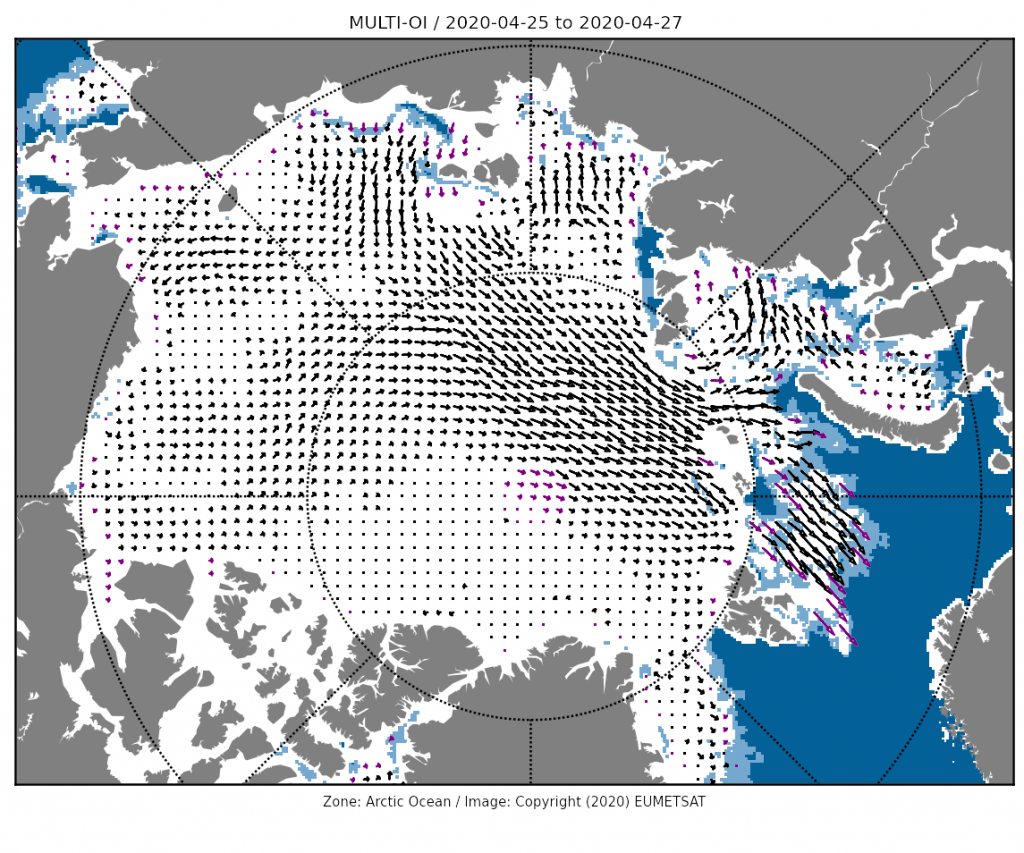
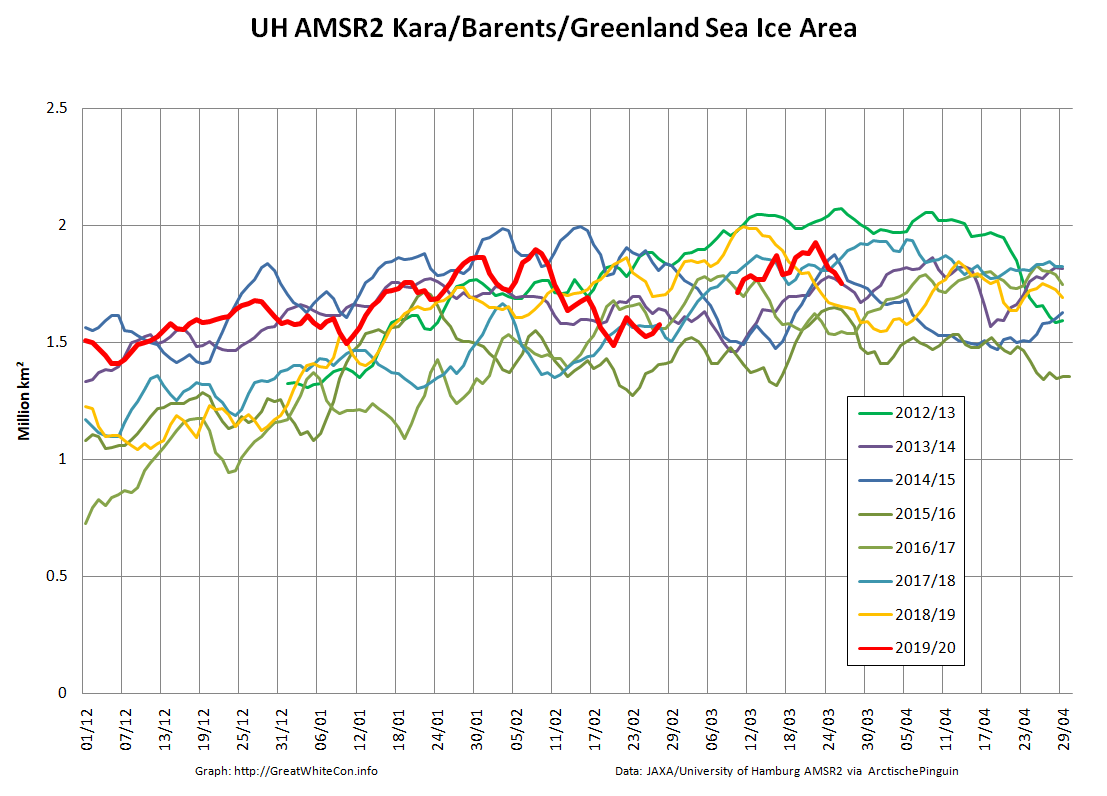
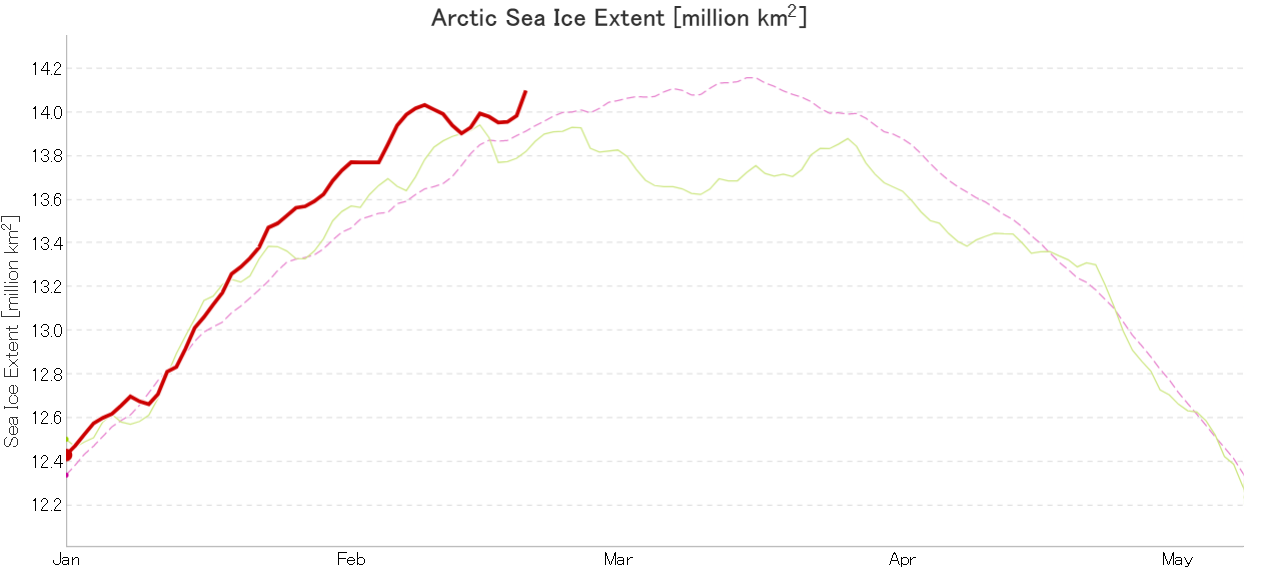
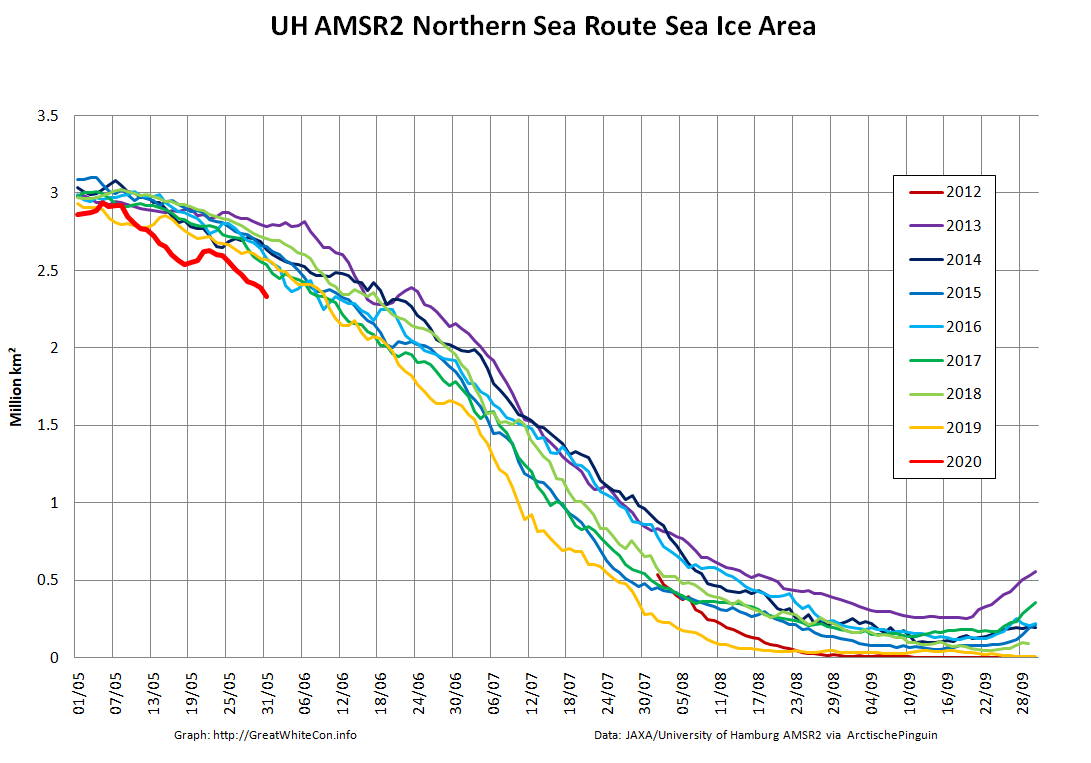
However following the extremely warm spring in Siberia, the sea ice area along the assorted sea that comprise the Northern Sea Route is well below all previous years in the AMSR2 record:
Another effect of the sweltering Siberian spring is evident in the melt ponds visible below the clouds across the southernmost parts of the Laptev Sea:
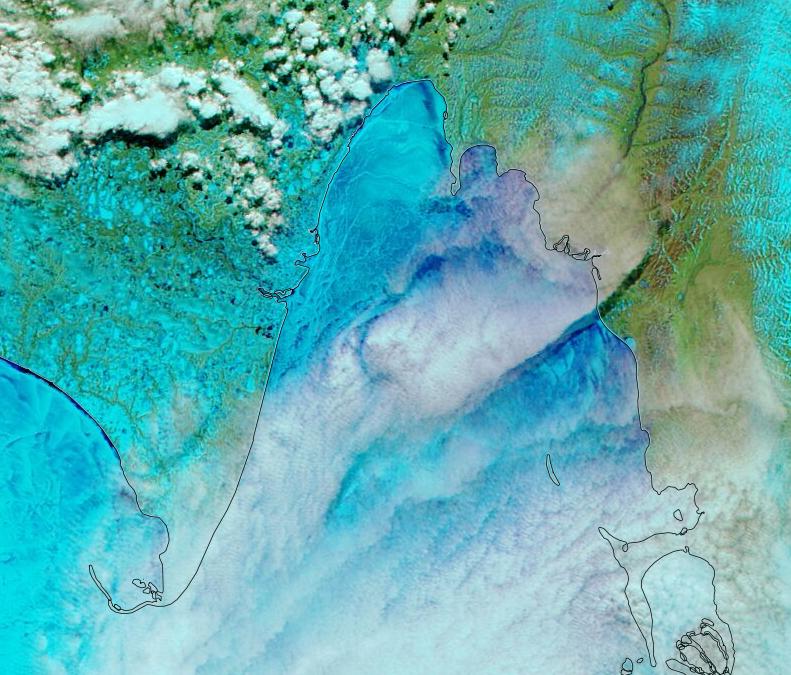
plus the East Siberian Sea and Chaunskaya Bay:

[Edit – June 4th]
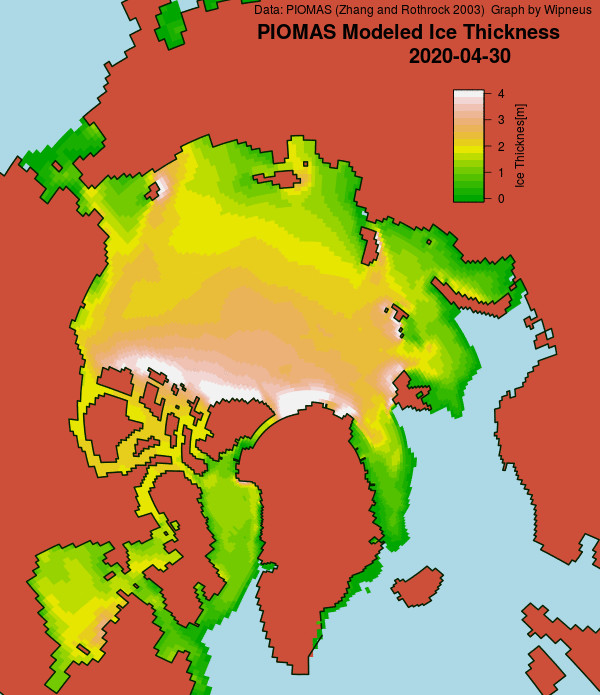
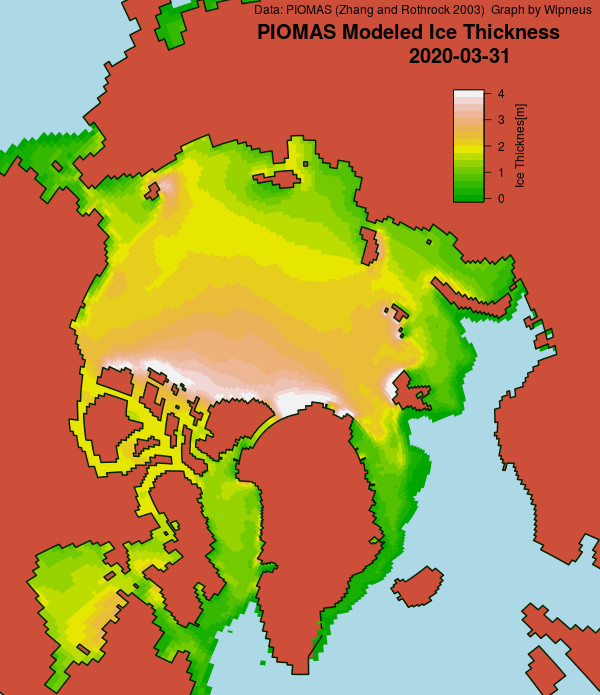
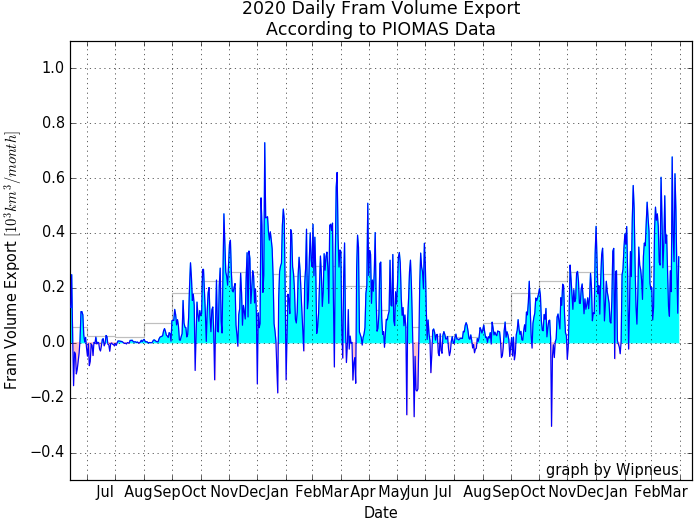
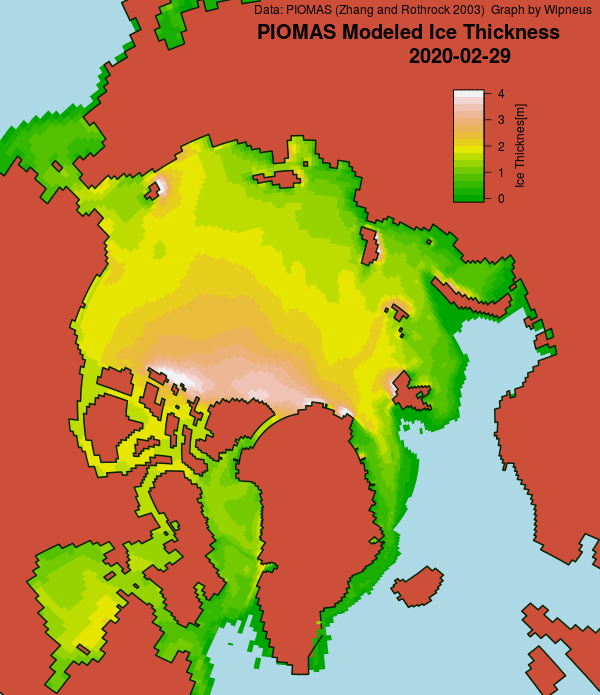
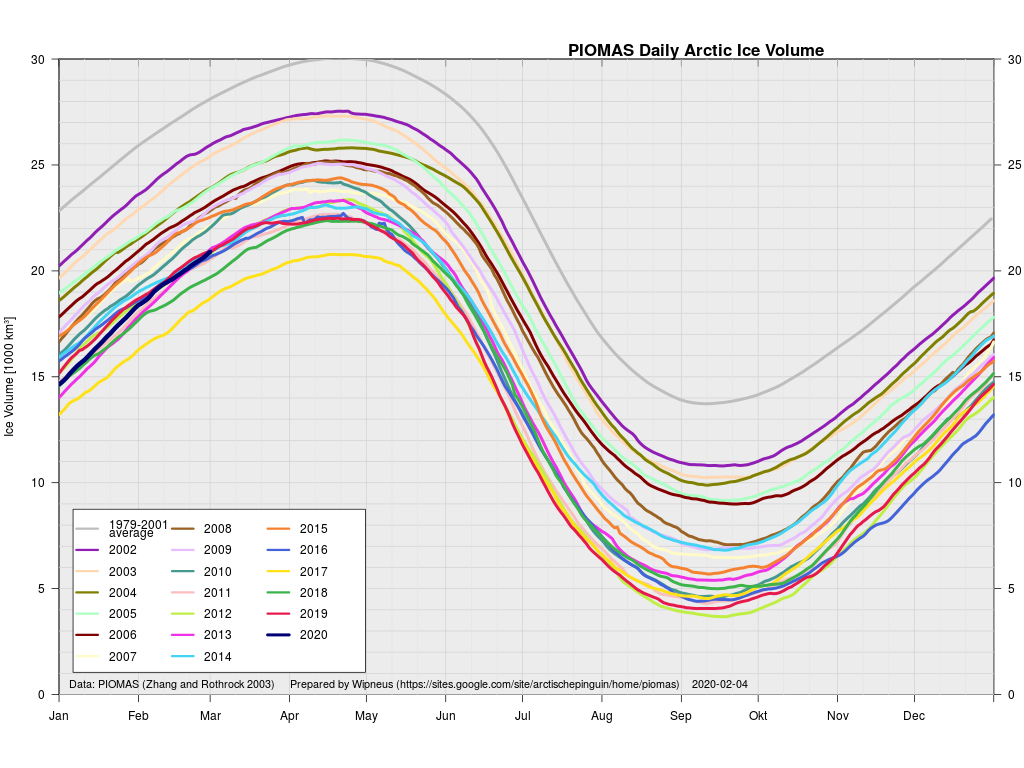
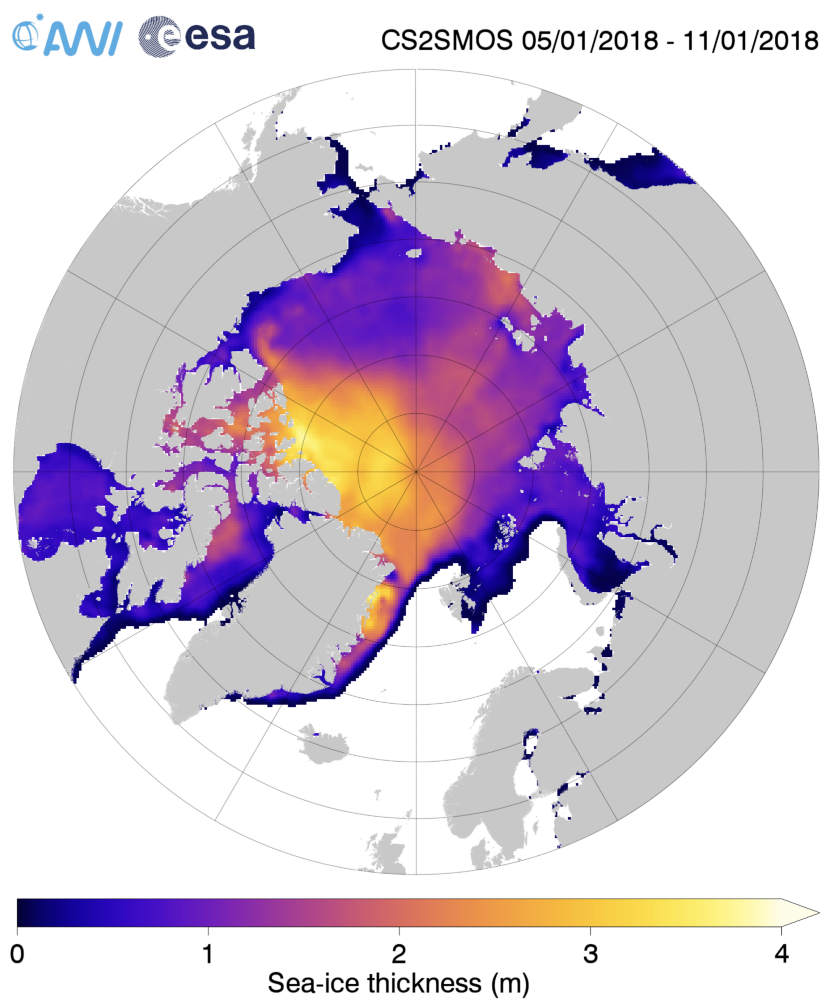
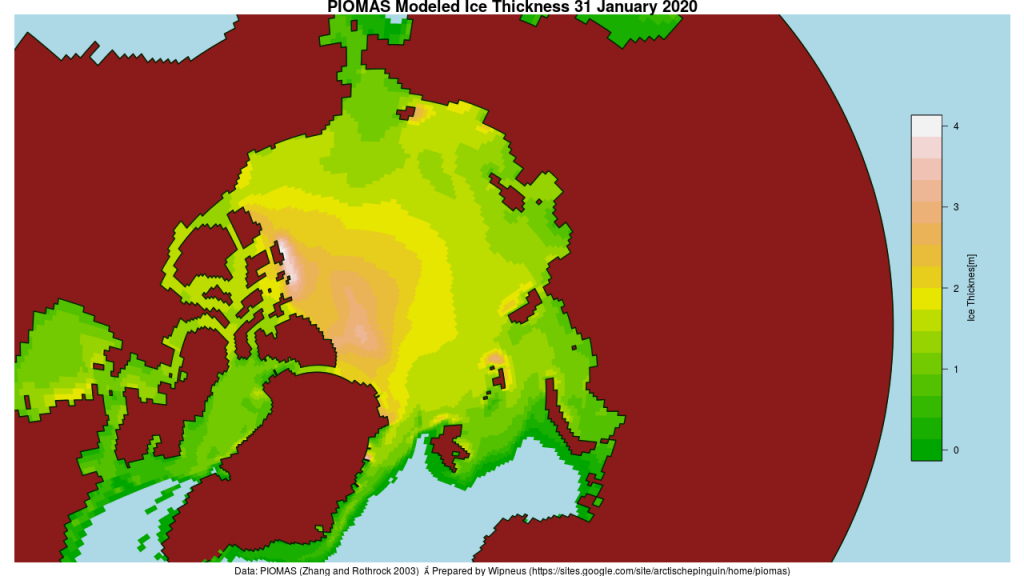
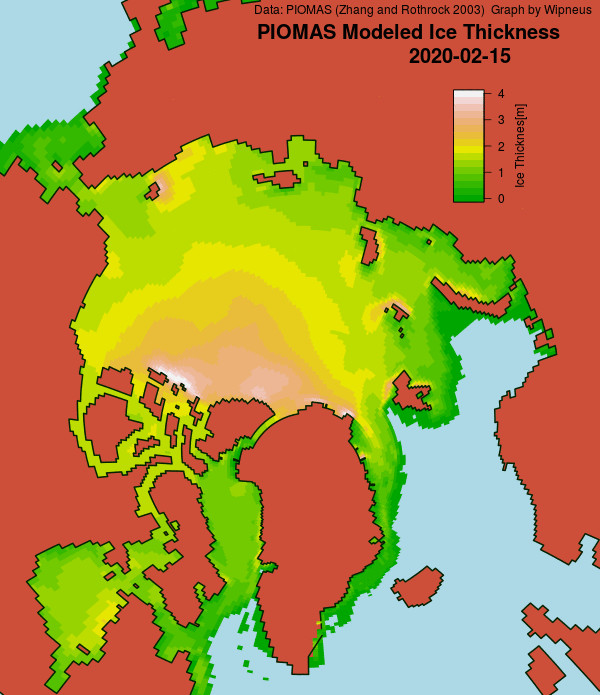
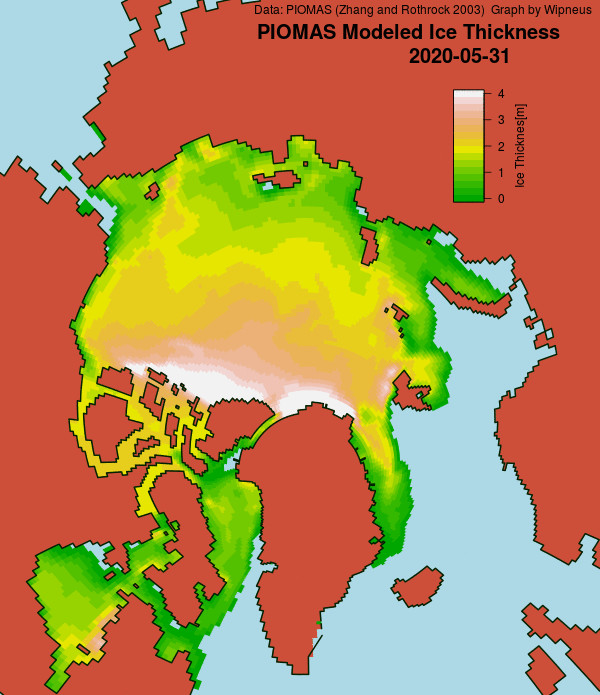
The May 31st PIOMAS gridded thickness numbers have been released, and Wipneus has crunched the numbers:
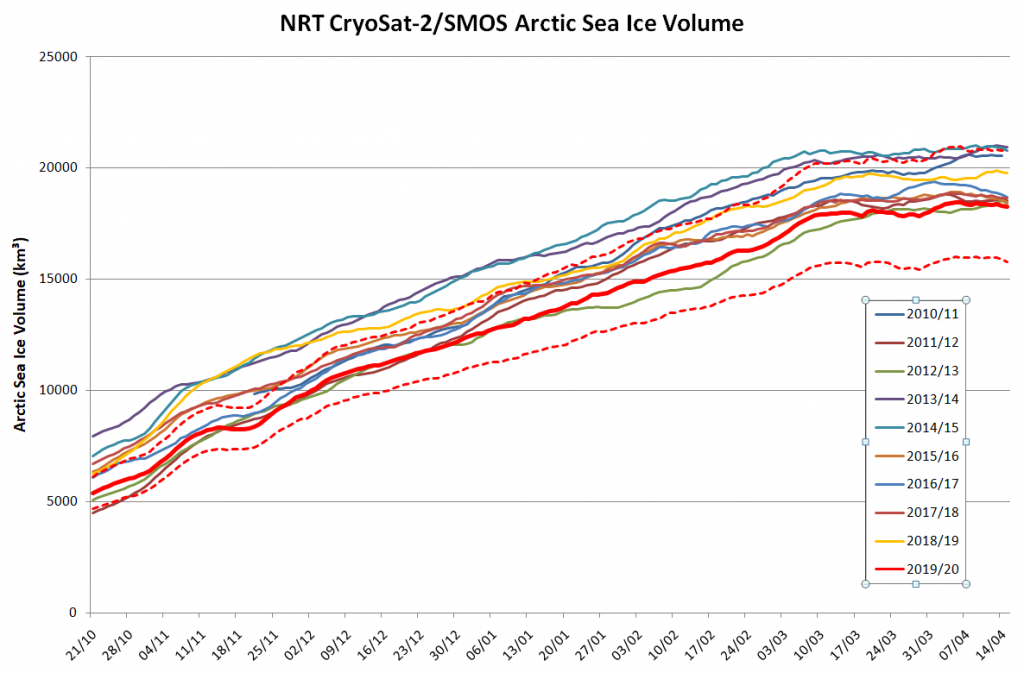
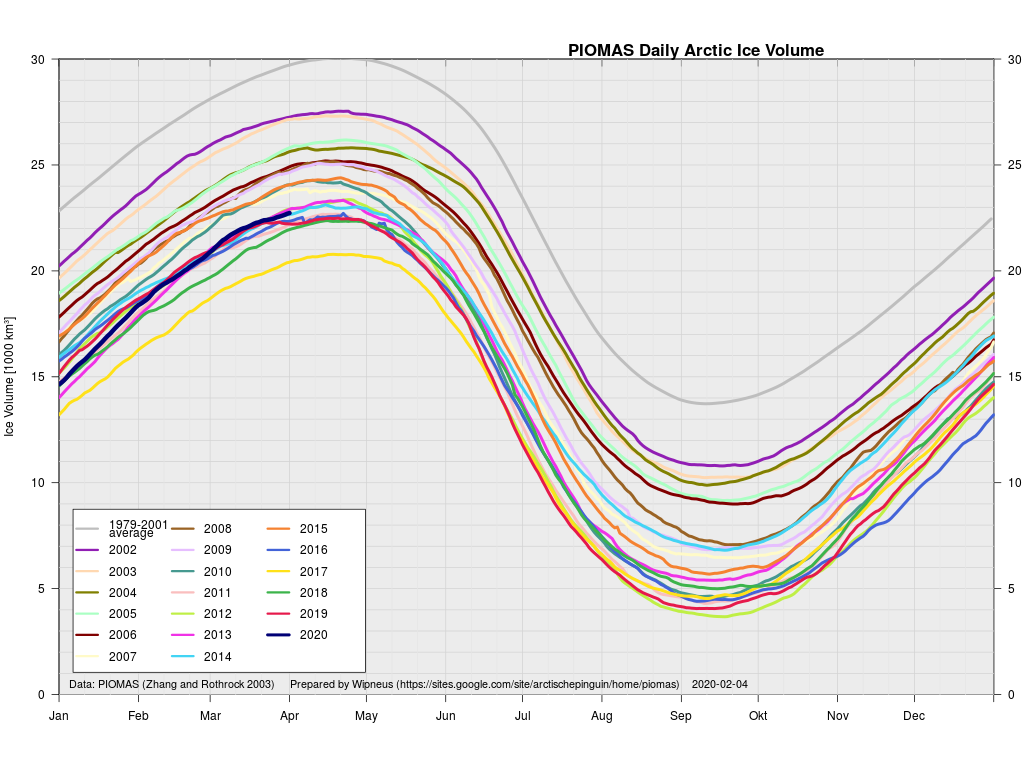
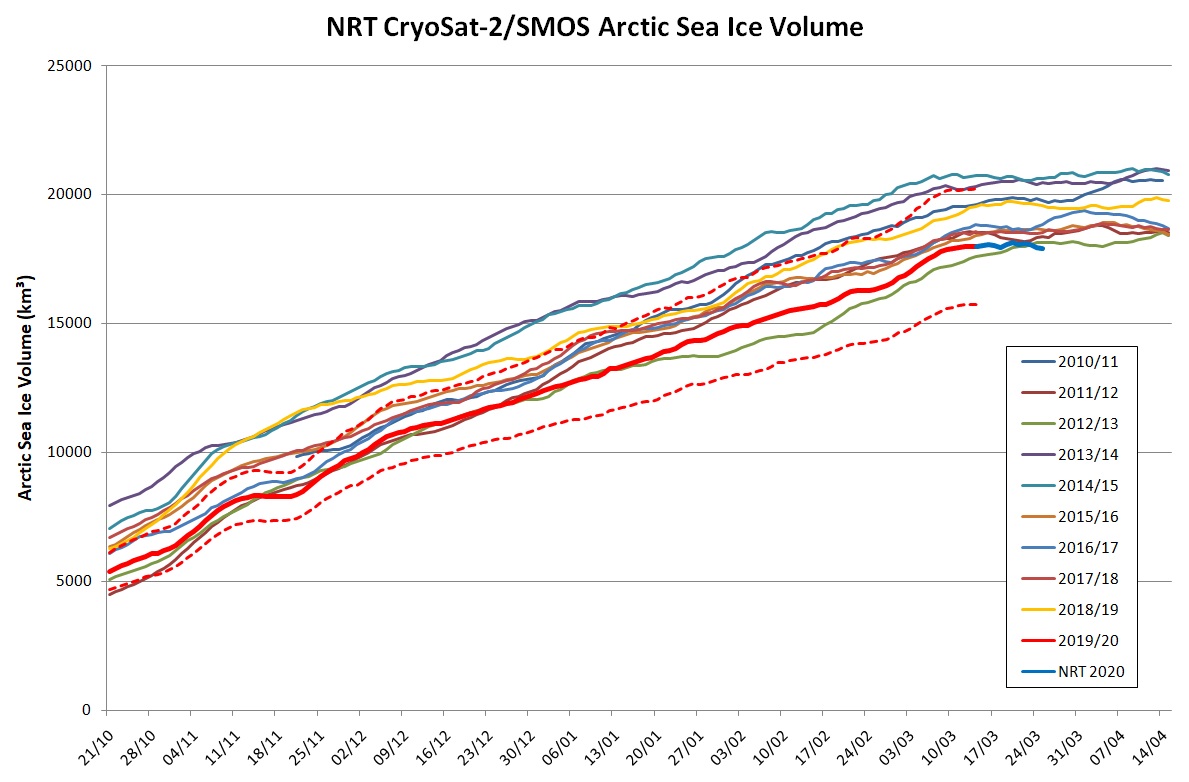
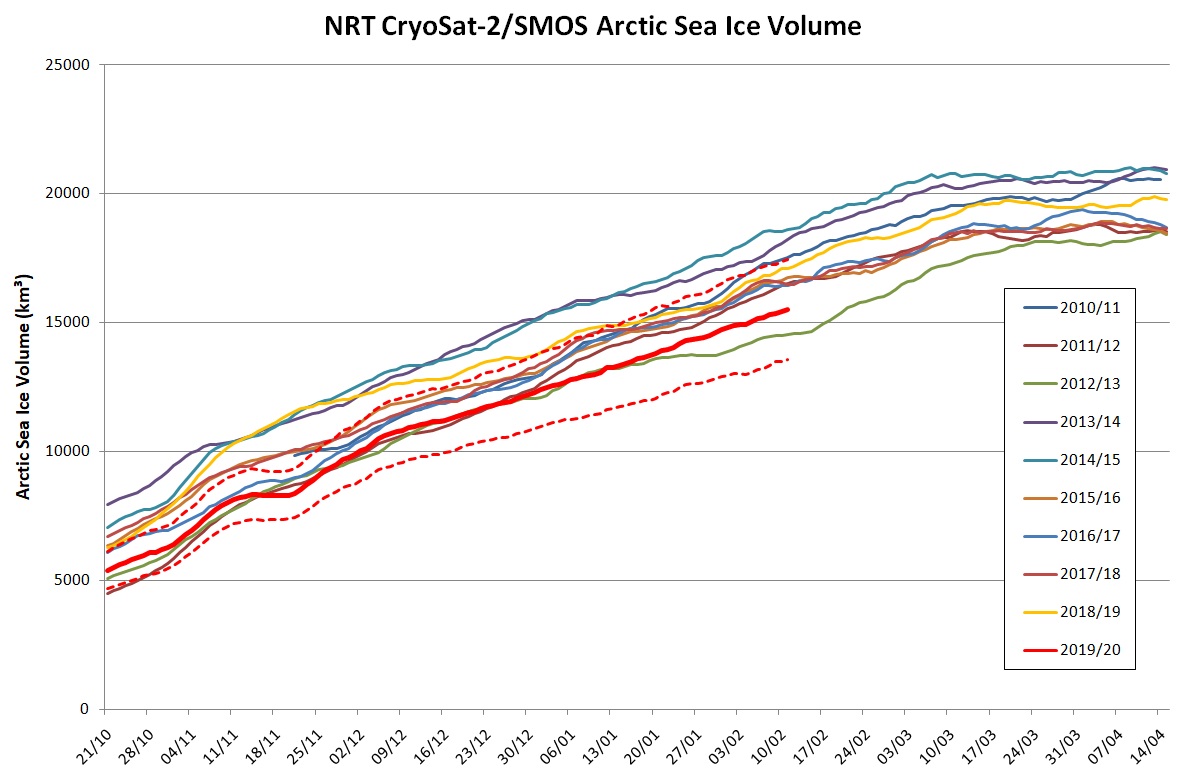
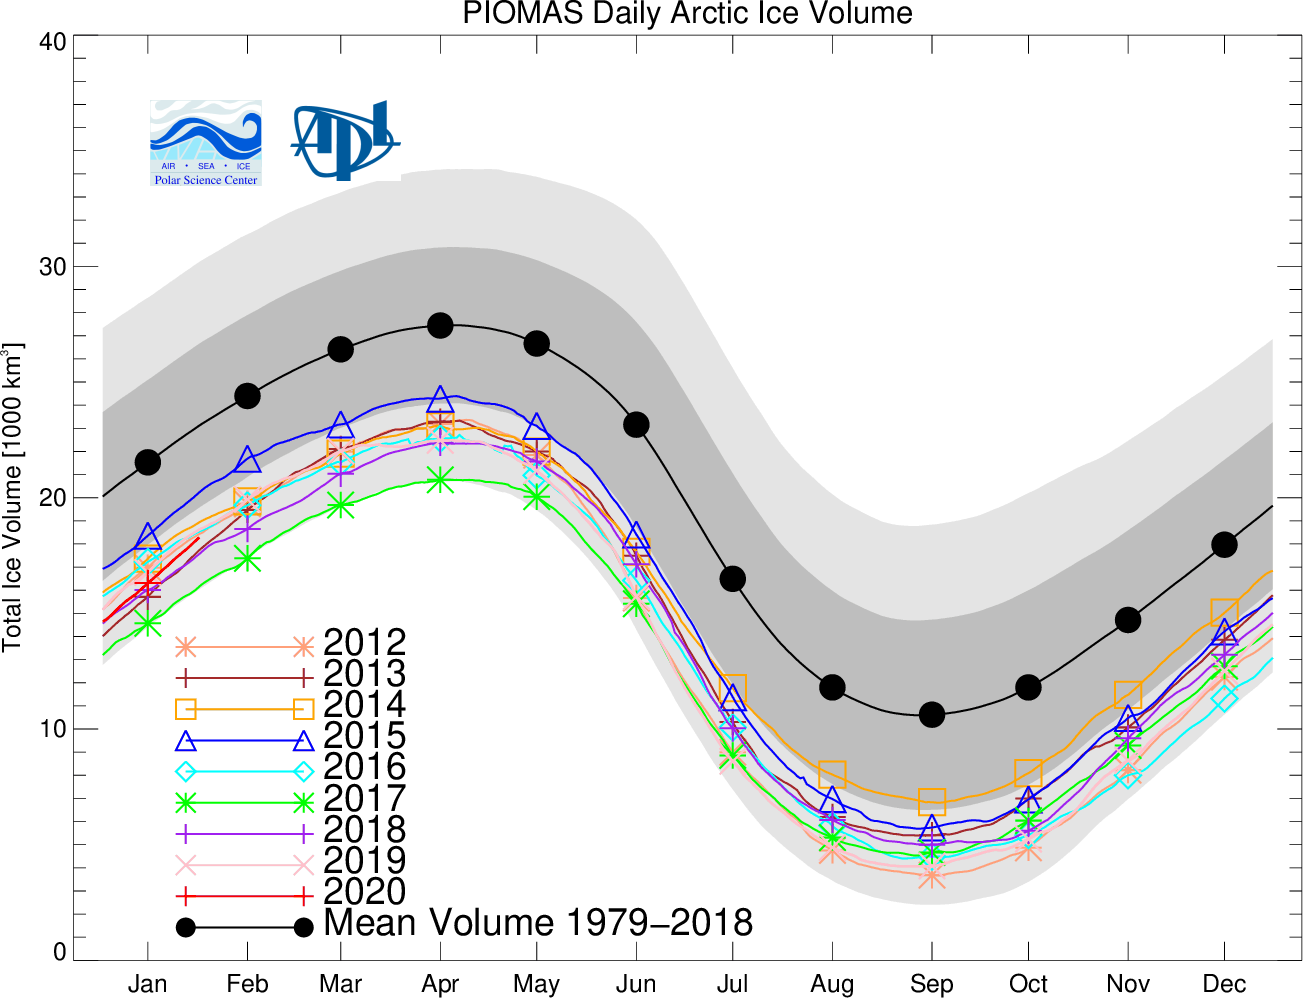
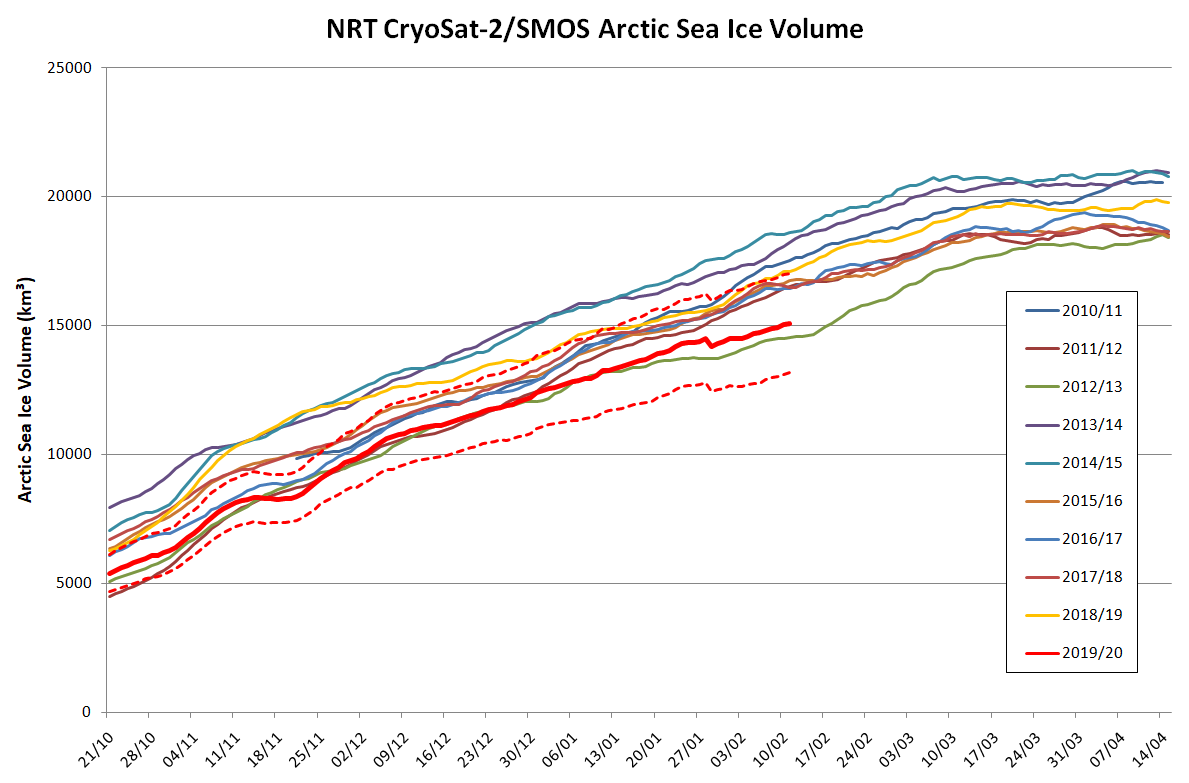
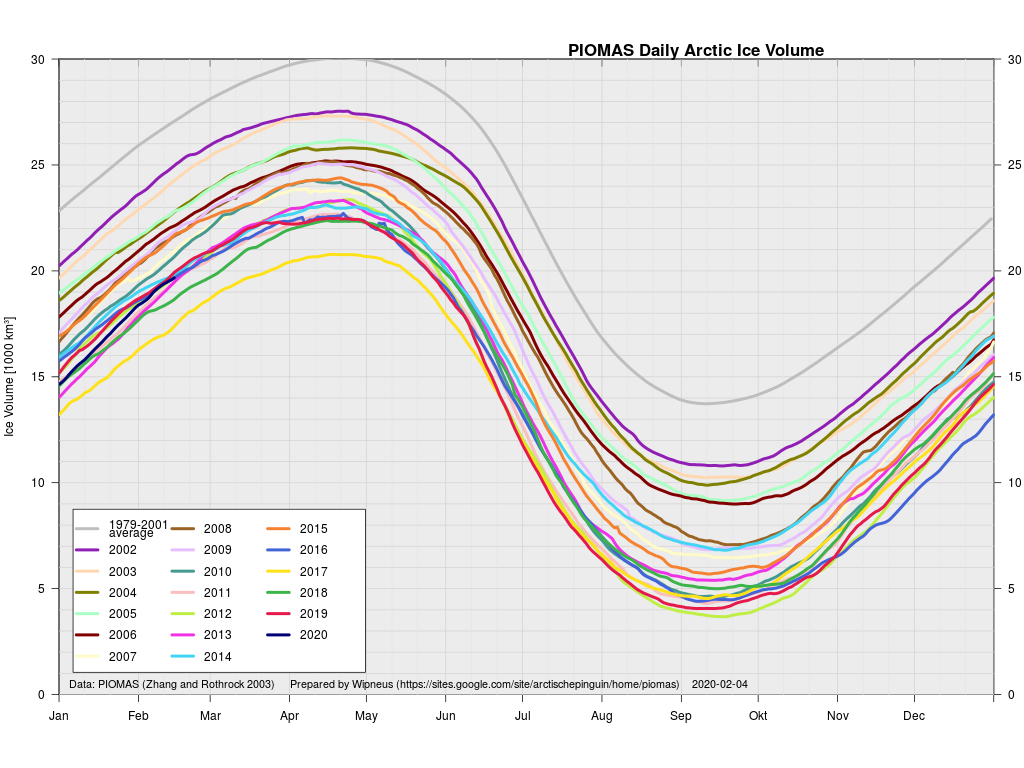
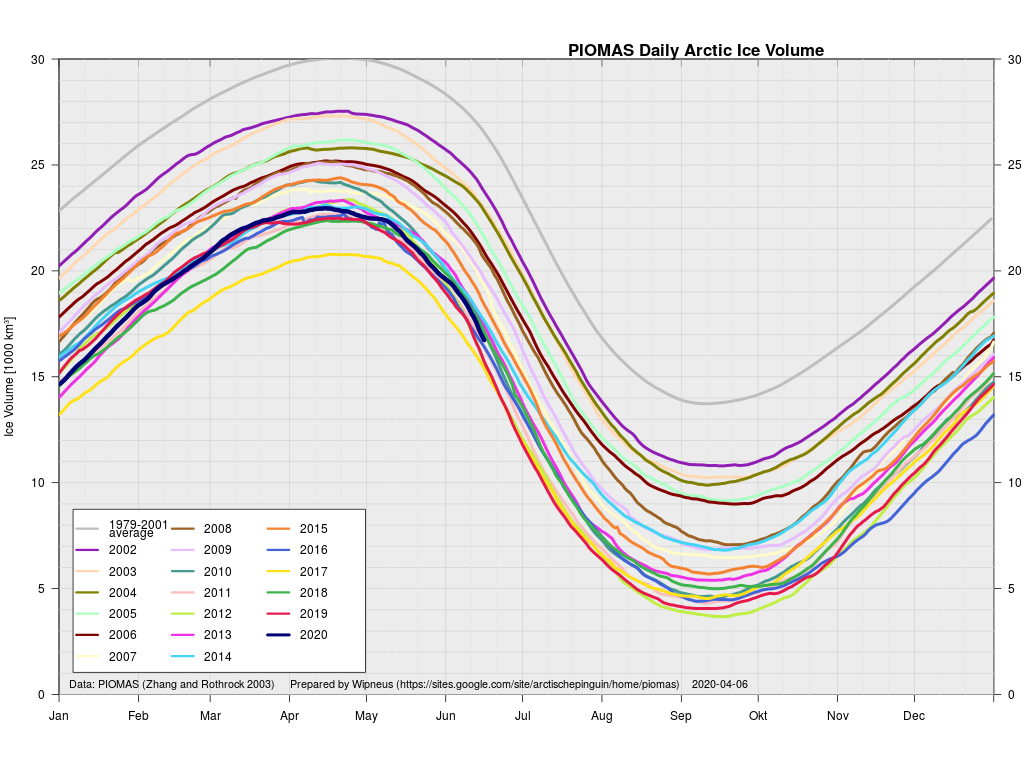
Here too is the latest volume graph:
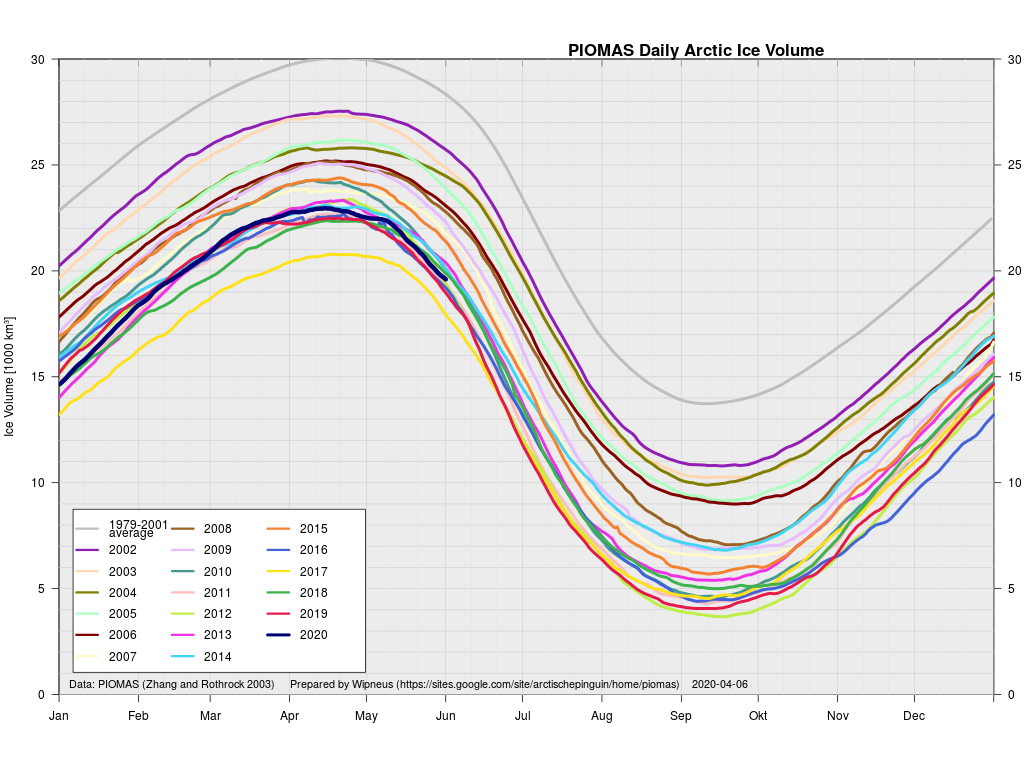
According to the Polar Science Center’s May 2020 update:
Average Arctic sea ice volume in May 2020 was 21,500 km3. This value is 1700 km3 above the record minimum value of 19,800 km3 set in 2017, making it the sixth lowest on record. Monthly ice volume was 39% below the maximum in 1979 and 25% below the mean value for 1979-2019. May 2020 ice volume falls 0.8 standard deviations above the trend line. Daily volume anomalies for May progressed at a fairly normal pace for recent years. Average ice thickness is in the middle of the pack for the more recent years. Ice thickness anomalies for May 2020 relative to 2011-2018 continue the April pattern and show relatively thin ice along the Russian Coast and thicker than normal sea ice in the Barents sea. There are some fairly strong positive anomalies in the eastern Beaufort and north of Greenland. This anomaly pattern is likely due to the very strong positive Arctic-Oscillation index pattern that occurred during the Winter of 2020.
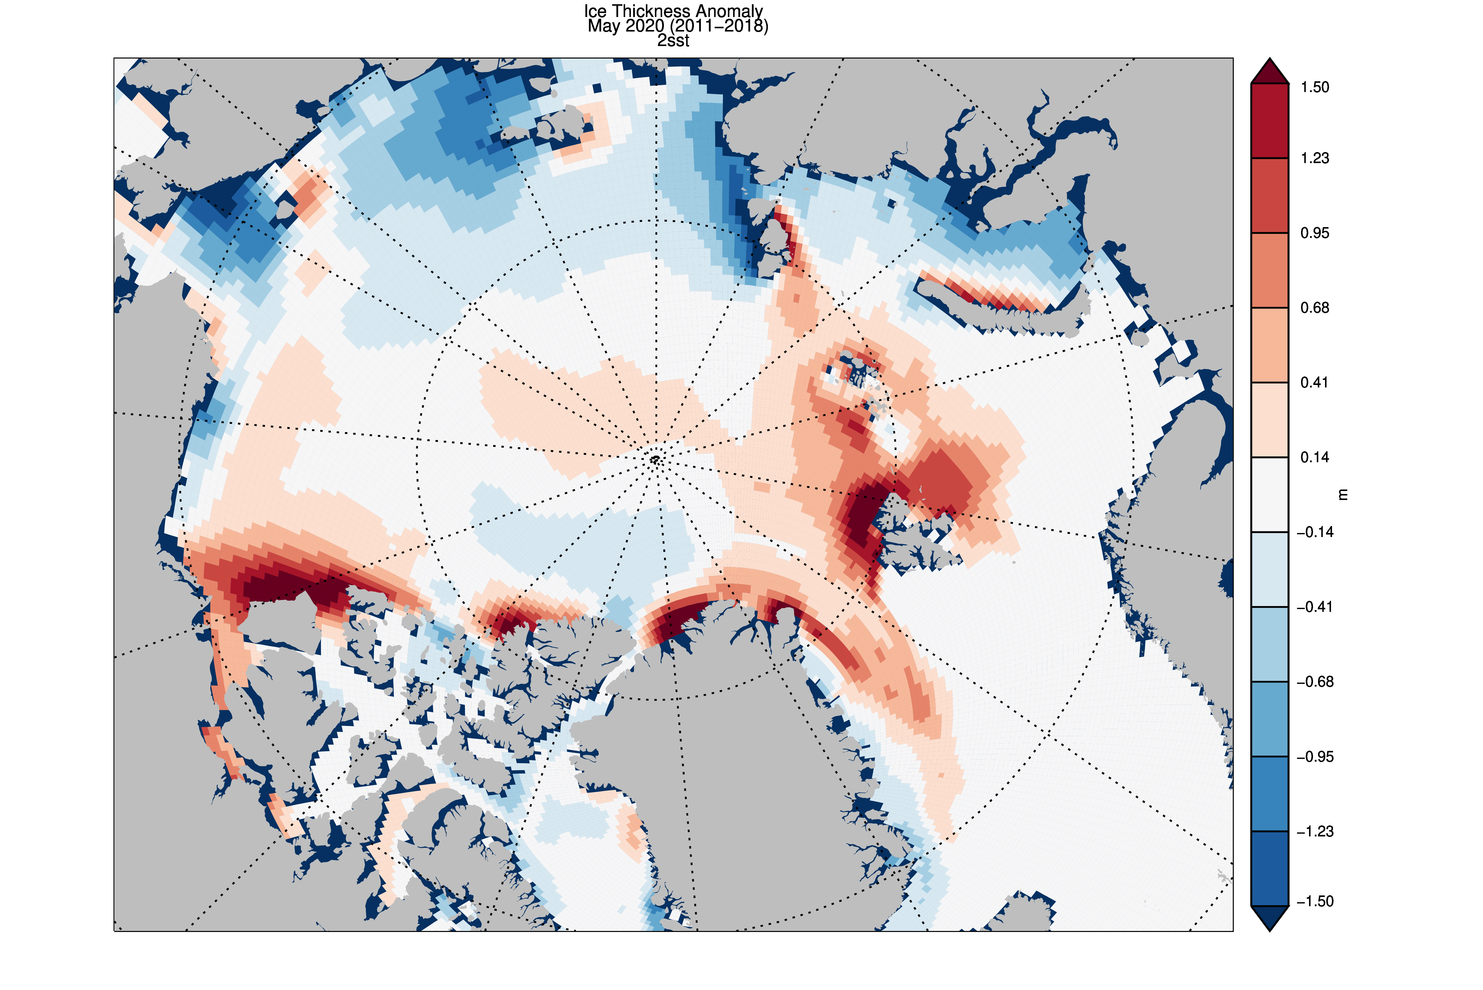
There looks to be a lot of anomalously thick ice waiting to melt out on the Atlantic periphery, and it will be interesting to see how the thicker ice in the eastern Beaufort Sea fares as the melting season progresses.
As also suggested by the area graph above, the Northern Sea Route is going to be open early in 2020. In fact a ice hardened tanker has already begun its journey through, unsupported by an icebreaker:
It was the “Christophe de Margerie” that on the 19th May kickstarted this year’s shipping season across the eastern part of the Northern Sea Route. The vessel owned and operated by Russian shipping company Sovcomflot loaded up liquefied natural gas in Sabetta and is due to arrive in the Chinese port of Jingtang on the 11th June. It was the earliest east-bound shipment on the route ever for this kind of vessel.
By 27th May, the ship had made it almost to Wrangel Island, information from ship tracker service MarineTraffic shows. The “Christophe de Margerie” is accompanied by nuclear powered icebreaker “Yamal”.
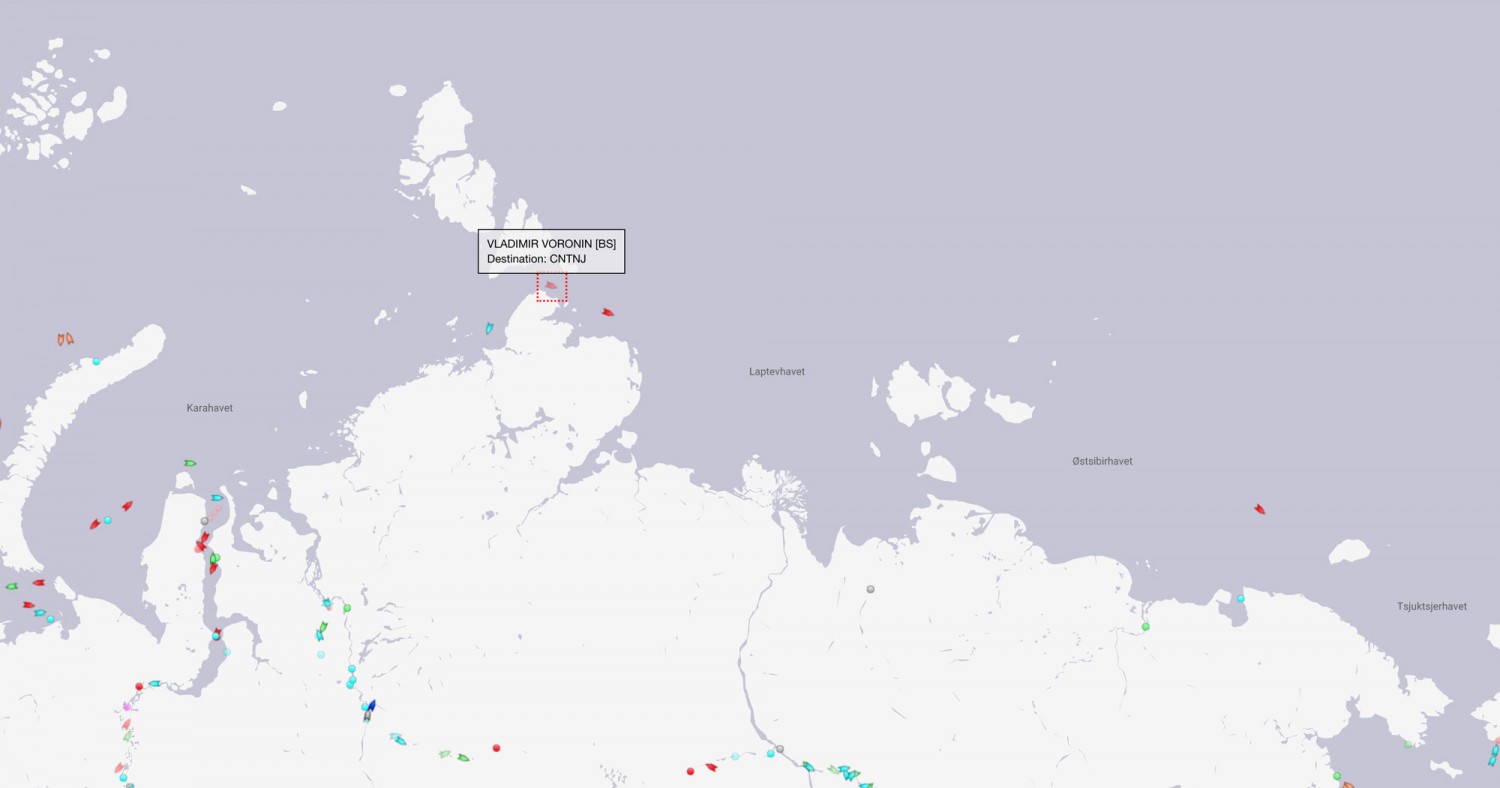
In the wake of the almost 300 meter long vessel now follows the “Vladimir Voronin”, a vessel that is operated by company Teekay. The “Vladimir Voronin” on the 25th May left Sabetta and was on May 27th located in the Vilkitsky Strait north of the Taymyr Peninsula.
The ”Vladimir Voronin” is not accompanied by icebreaker. The “50 Let Pobedy” that escorted the ship out of Sabetta and eastwards towards the Vilkitsky Strait has now returned and appears to be on its way back to Sabetta.
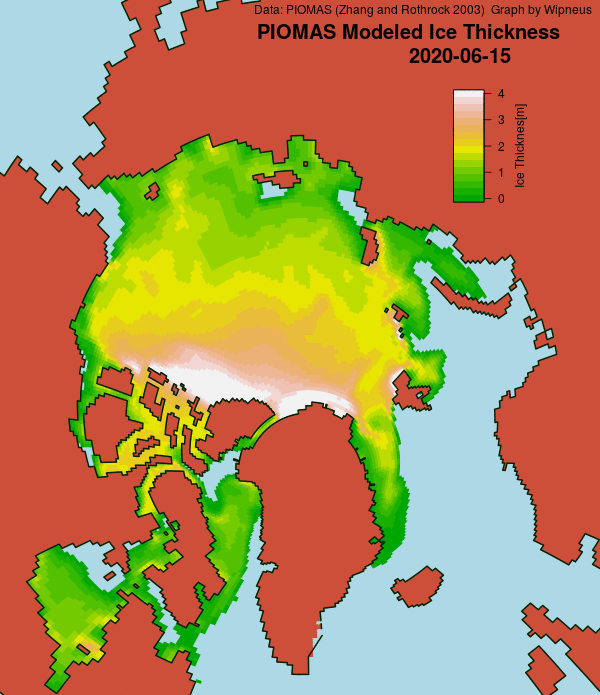
[Edit – June 17th]
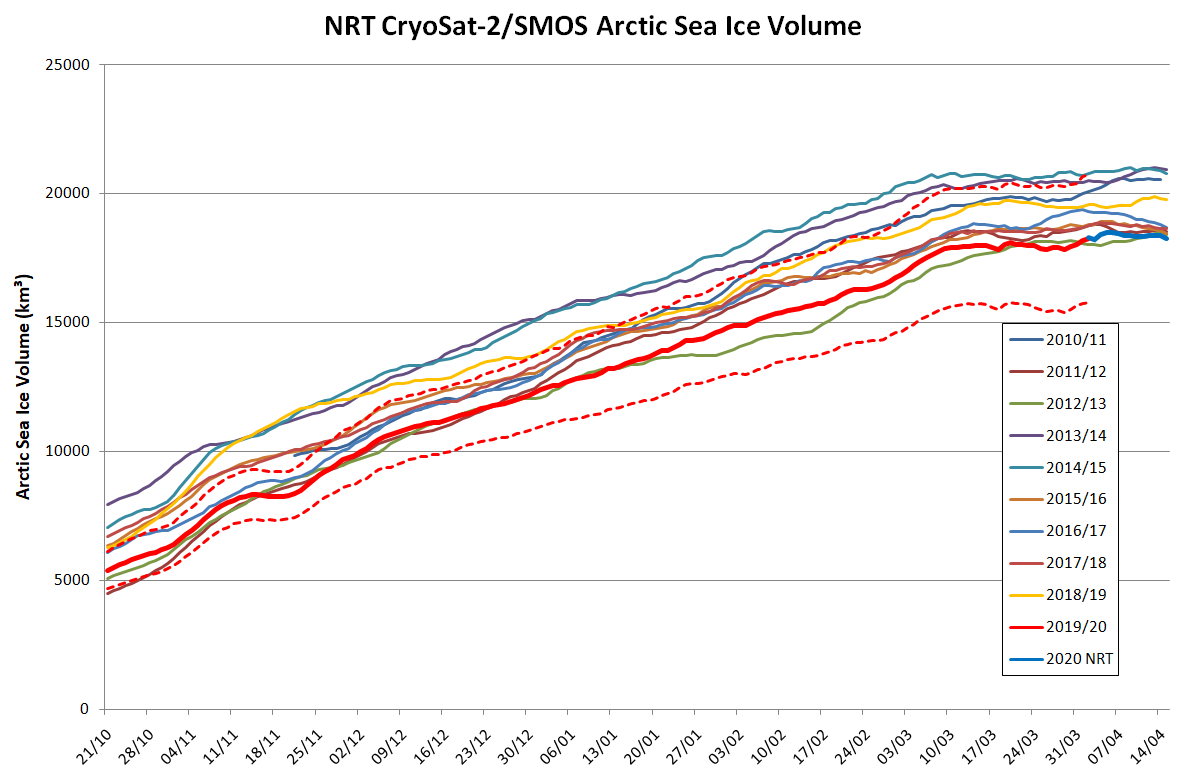
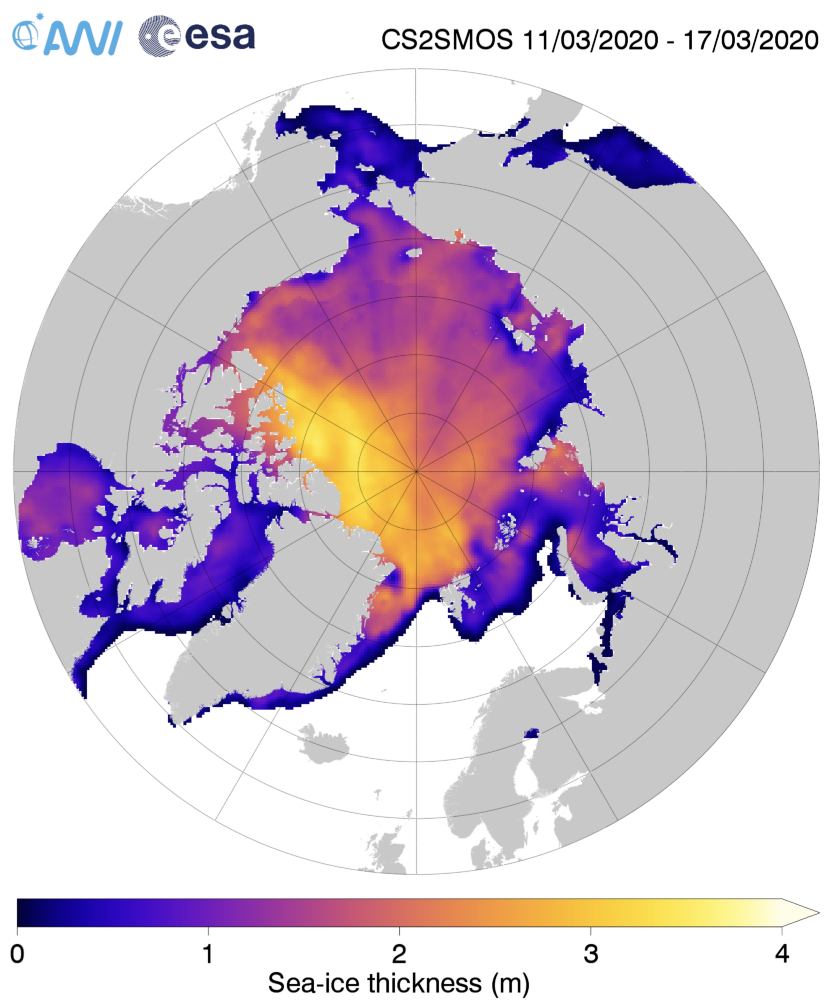
The mid month PIOMAS gridded thickness numbers have just been released. Here’s the thickness map:
and the volume graph:
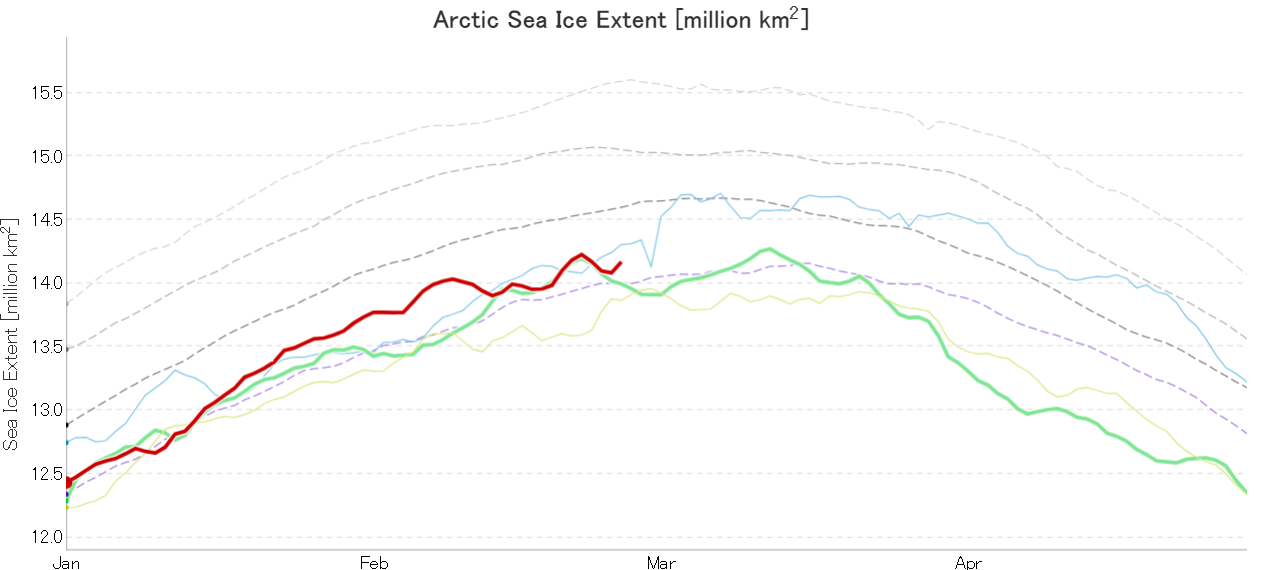
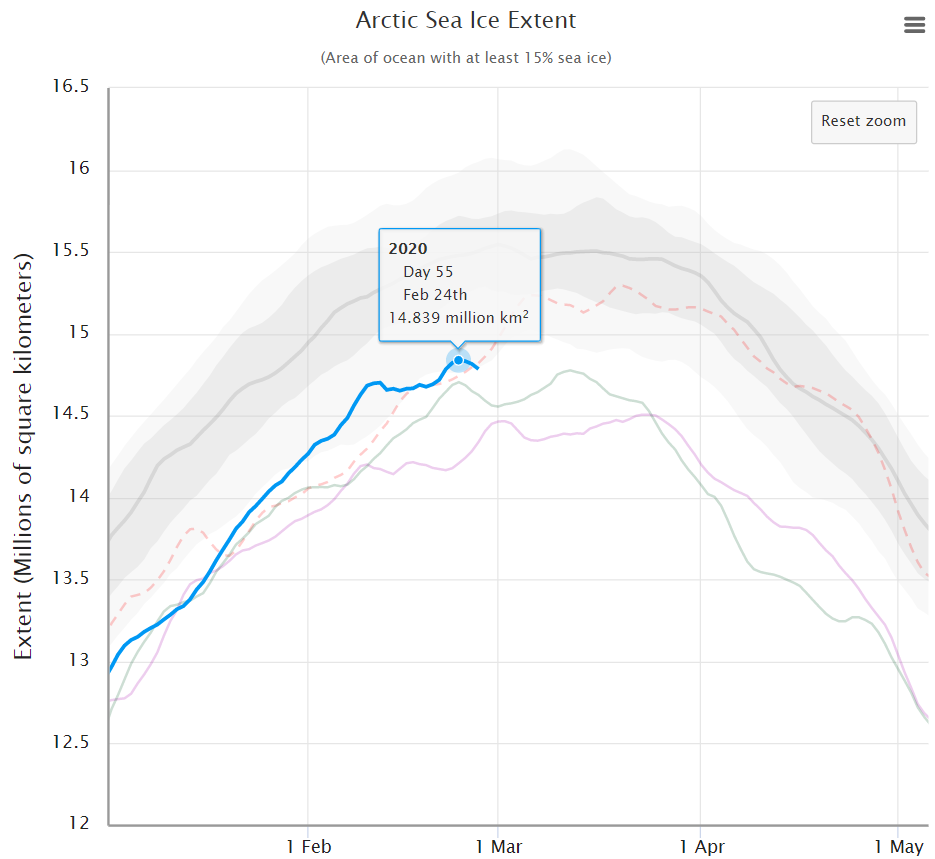
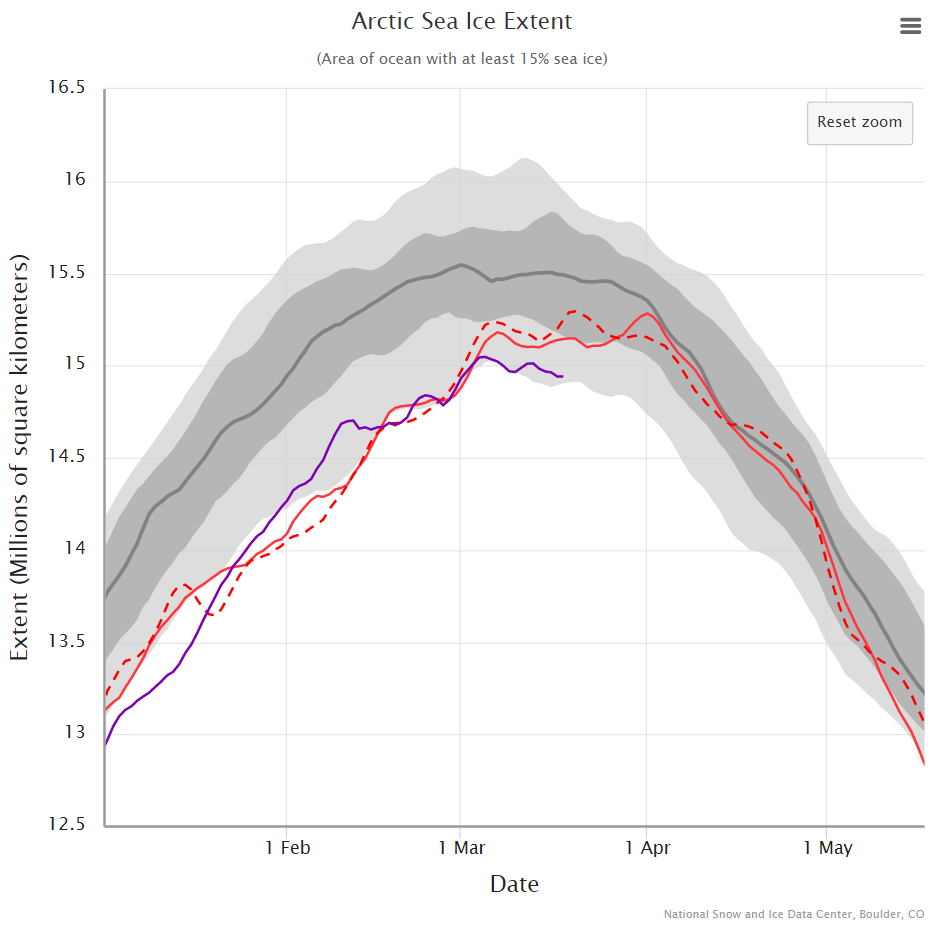
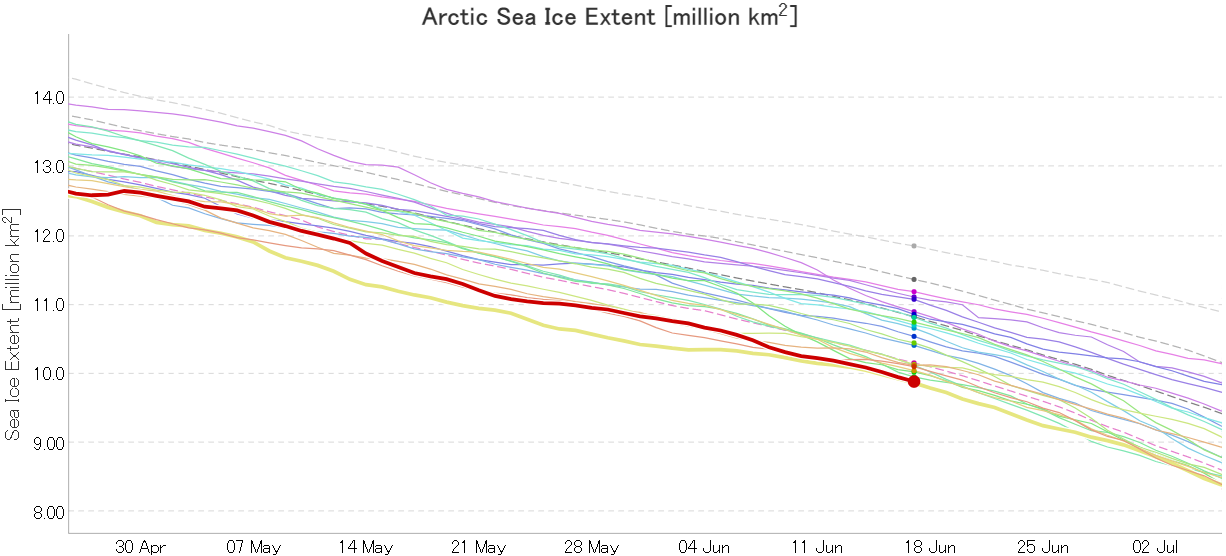
In addition JAXA extent is now in a “statistical tie” with 2019 in the “lowest for the date” competition:
Watch this space!