On several previous occasions “Snow White” and I have documented Ron Clutz’s misuse of MASIE Arctic sea ice extent data on his “Science Matters” blog. We agree with Ron that science matters, so on several occasions we have attempted to direct his attention to my interview with NASA/NSIDC scientist Walt Meier. Walt’s words of wisdom included:
Year-to-year comparisons and trend estimates will be more accurate in the passive microwave data than in MASIE.
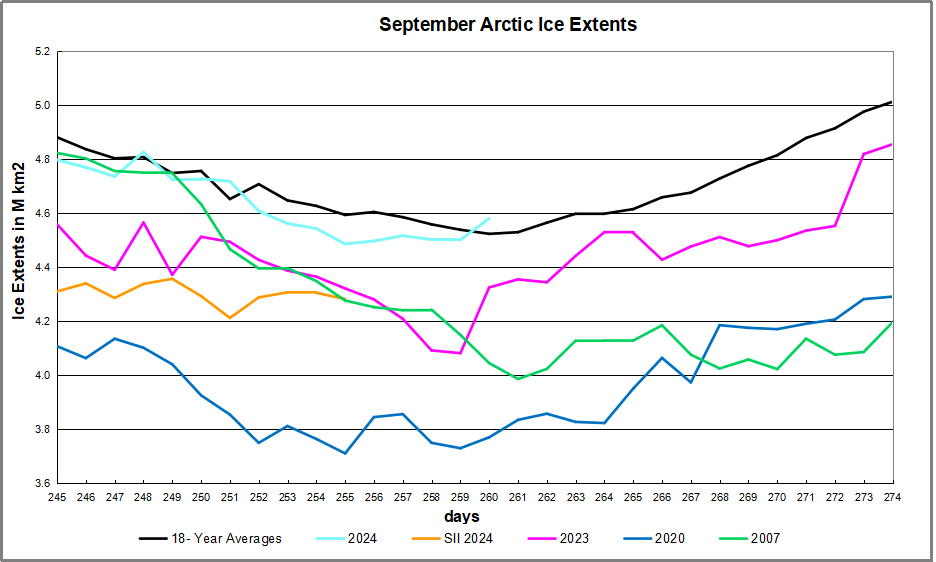
It will probably not surprise you to learn that Ron has not learned anything from our repeated efforts. In his article entitled “2024 Arctic Ice Beats 2007 by Half a Wadham” earlier today Ron proudly displays this graph:
You will note that Ron does not provide details of his data source. However I have recently noted a sudden lack of SSMIS passive microwave data emanating from NOAA. The OSI SAF reported it this way on September 12th:
Dear OSI SAF Sea Ice Concentration User,
Due to missing input data, we have not been able to generate L2 products, corresponding to F-16 / F-17 / F-18 since Sep 11 19:36 UTC.
We apologize for any inconvenience.
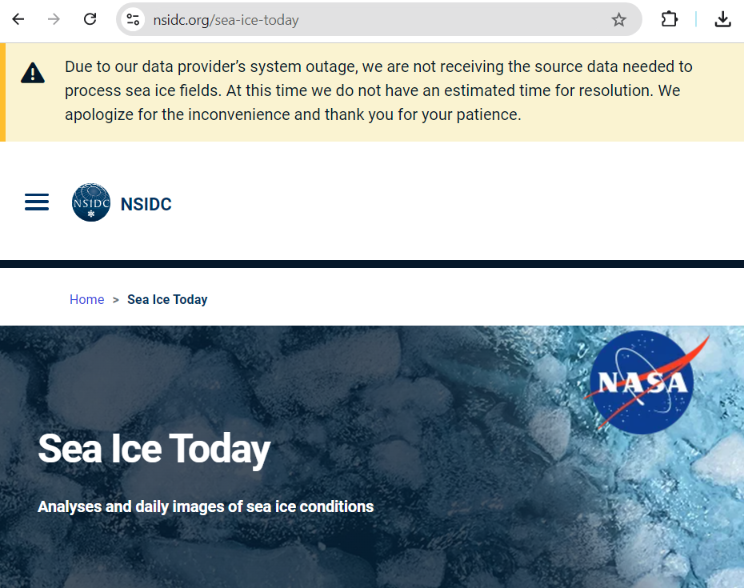
The NSIDC’s sea ice home page puts it this way today:
Now day 260 of 2024 is September 16th, so it seems safe to assume that Ron is erroneously using his favourite MASIE metric for year to year comparisons yet again. In his article Ron states that:
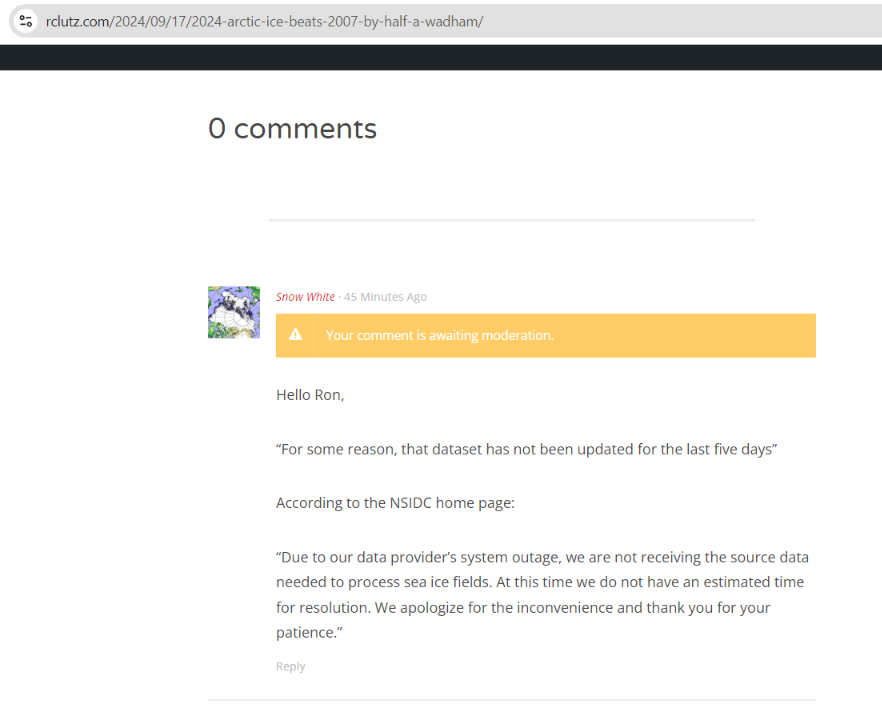
SII was reporting deficits as high as 0.5M km2 (half a Wadham) compared to MASIE early in September. For some reason, that dataset has not been updated for the last five days.
It appears as though Ron has also not yet learned how to find NSIDC’s sea ice home page on the world wide interweb!
I added this hopefully helpful comment below Ron’s article. For some strange reason it is yet to emerge from his moderation queue:
[Update – September 18th]
Our regular reader(s) will not be surprised to learn that my helpful comment yesterday is no longer in Ron’s moderation queue, but is now languishing underfoot on his cutting room floor.
Ron has written another Arctic article using the graph reproduced above. This one is entitled: “2024 Arctic Ice Abounds at Average Daily Minimum“. In it Ron assures his flock of faithful followers that:
We are close to the annual Arctic ice extent minimum, which typically occurs on or about day 260 (mid September). Some take any year’s slightly lower minimum as proof that Arctic ice is dying, but the image above shows the Arctic heart is beating clear and strong.
Over this decade, the Arctic ice minimum has not declined, but since 2007 looks like fluctuations around a plateau.
Ron has also changed his phraseology regarding the recent SSMIS data outage. This time it reads:
For some reason, apparently data access issues, that dataset has not been updated for the last five days.
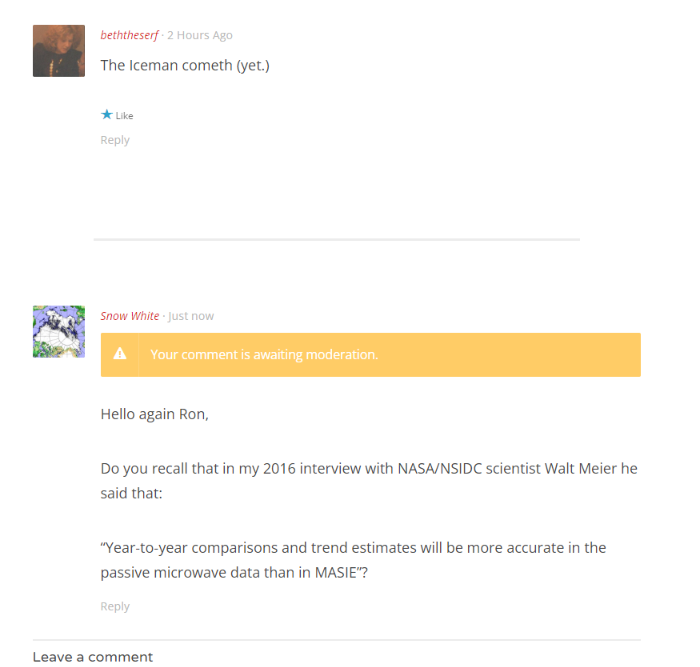
“Snow White” felt compelled to leave Ron another helpful comment concerning his new words of Arctic wisdom:
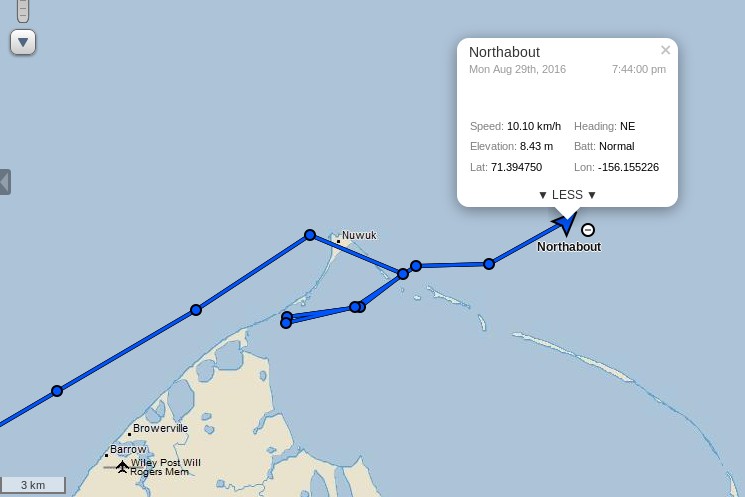
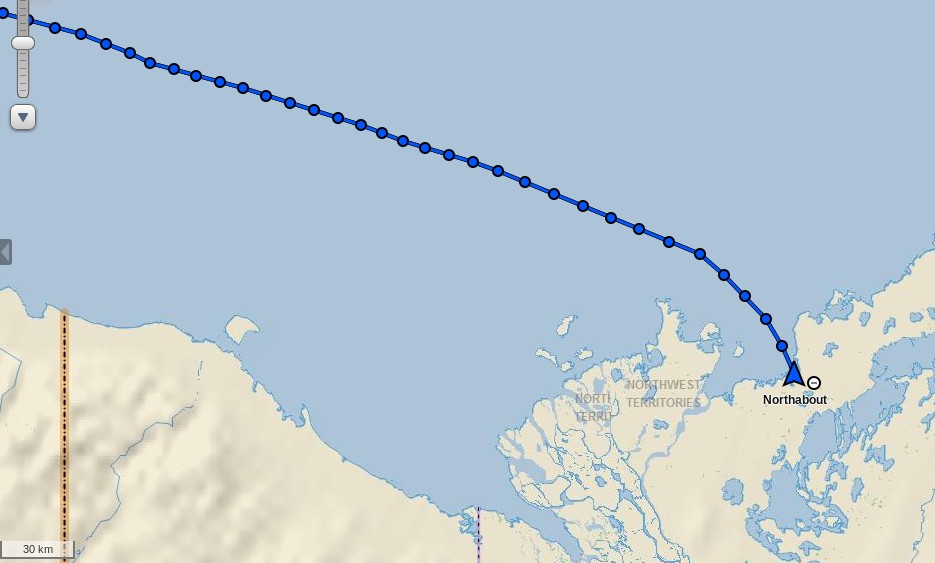
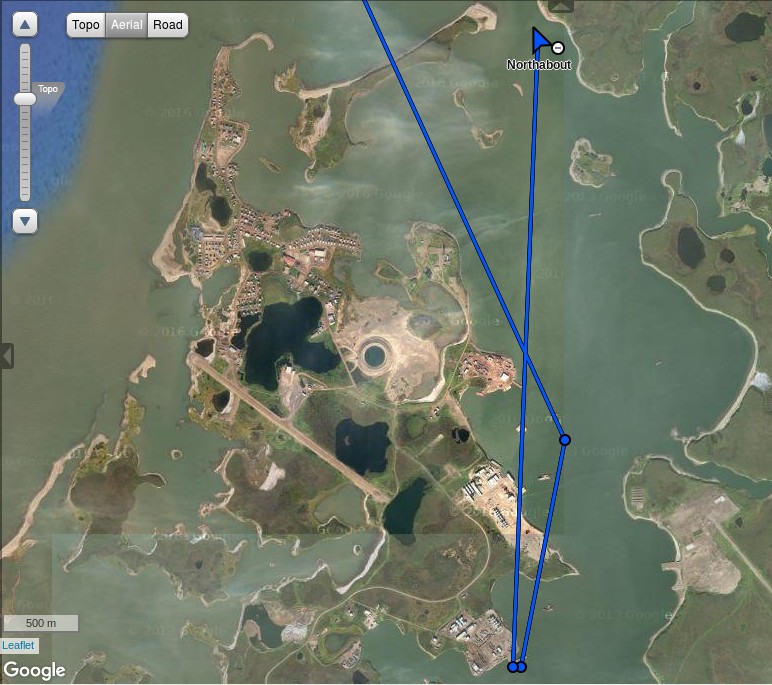
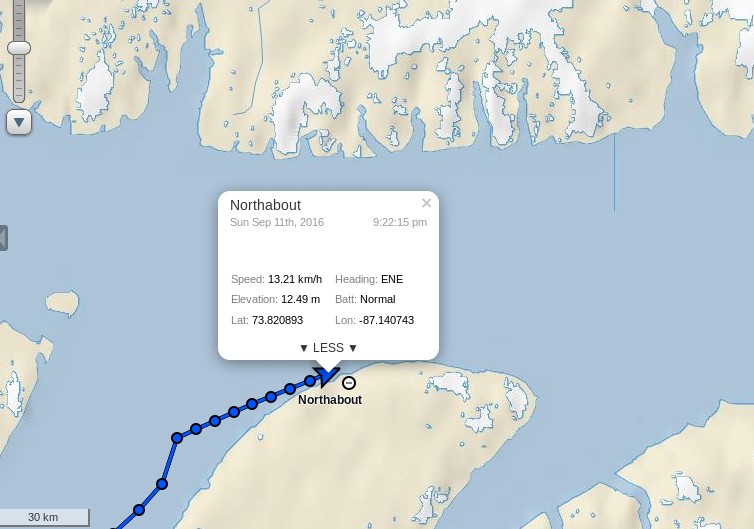
After the briefest of stops in Elson Lagoon behind Point Barrow Northabout is on the move once again:
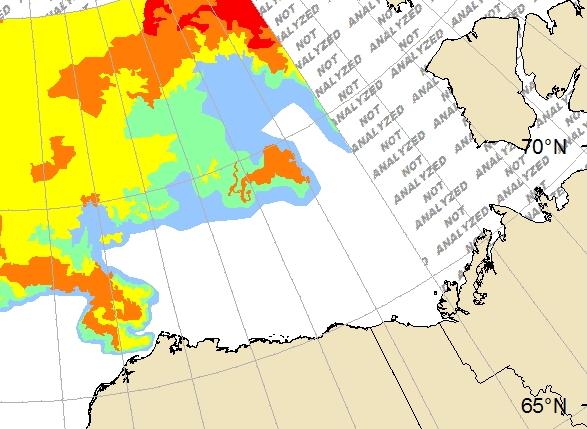
She’s currently heading out into the Beaufort Sea before following in the giant footsteps of the cruise liner Crystal Serenity in the direction of the Amundsen Gulf and the Canadian Arctic Archipelago. Here’s the United States National Weather Service’s current ice chart for Alaskan waters:
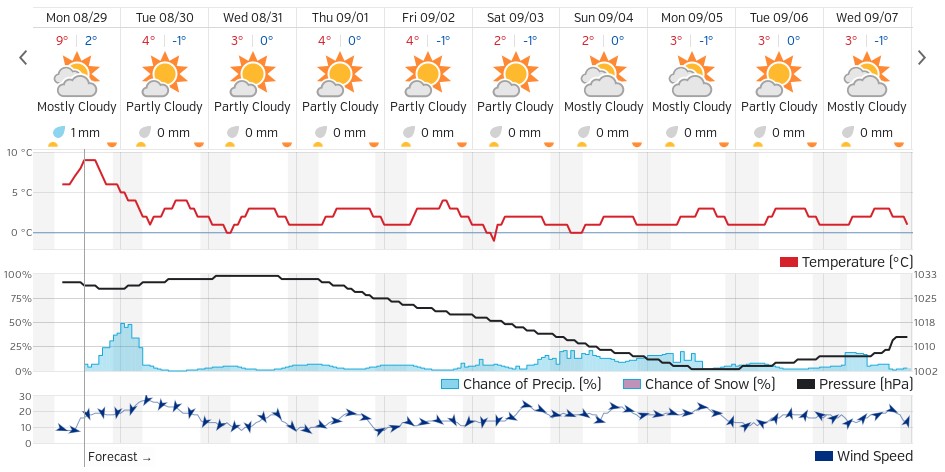
There looks to be far less to worry about ice wise on the next leg of the Polar Ocean Challenge than on the previous one! The weather forecast isn’t too bad either, with high pressure over the Beaufort Sea and a fair bit of sunshine. Here’s the Weather Underground forecast for Ulukhaktok, Crystal Serenity’s first port of call in the CAA:
There is currently a “small craft advisory” warning in effect for the Beaufort Sea coast:
CAPE HALKETT TO FLAXMAN ISLAND-
207 PM AKDT MON AUG 29 2016
…SMALL CRAFT ADVISORY IN EFFECT FROM TUESDAY MORNING THROUGH
TUESDAY AFTERNOON…
TONIGHT
E WINDS 20 KT. SEAS BUILDING TO 4 FT.
TUE
E WINDS 25 KT. SEAS 5 FT.
TUE NIGHT
E WINDS 20 KT. SEAS 6 FT.
WED
E WINDS 20 KT. SEAS 6 FT.
WED NIGHT
E WINDS 20 KT. SEAS 5 FT.
THU
NE WINDS 20 KT. SEAS 4 FT.
THU NIGHT
NE WINDS 15 KT. SEAS 4 FT.
FRI
N WINDS 10 KT. SEAS 2 FT.
SAT
N WINDS 15 KT. SEAS 3 FT.
All in all it looks like fairly plain sailing for the foreseeable future, with only occasional moderate headwinds to contend with.
[Edit – August 30th]
It seems my “fairly plain sailing” conclusion was overly hasty. According to the latest “Ship’s Log“:
The weather forecast is pants. A 30/35 knot headwind along the coast . No one has the appetite for it, so we are heading North, slacker winds, staysail out, still a choppy sea and uncomfortable, but not as bad as 30 knots. Hopefully no ice tonight on my watch.
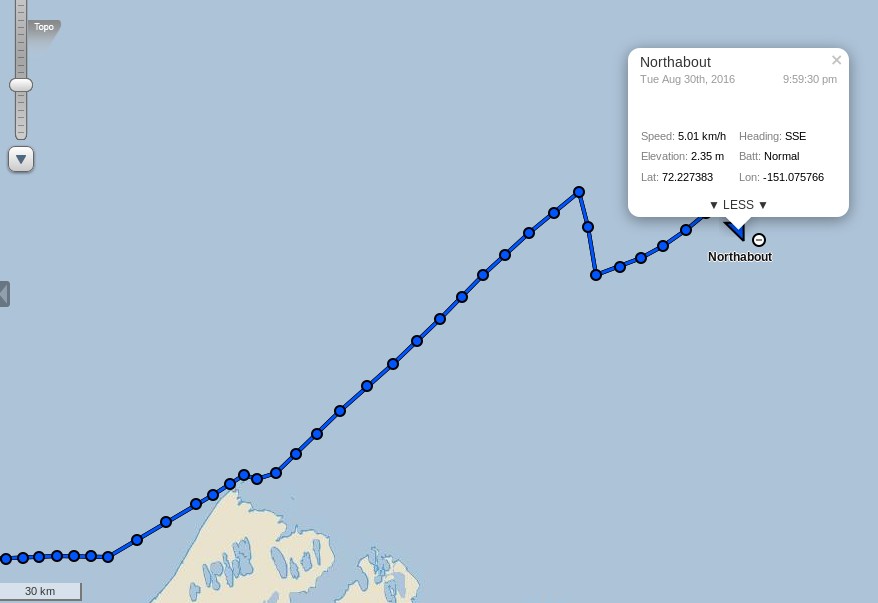
This is the end result:
As Phil points out below:
Our next stop along the North West Passage is Tuktoyaktuk. That’s when we can use a pontoon, get rid of our rubbish, fill the tanks, do the laundry and have a shower. 500nm away.
[Edit – August 31st]
The Polar Ocean Challenge team report via Twitter:
They have some more to carry out in Tuk too. Despite the great “groove” displayed above Ben Edwards reports that:
Joy of joys, the auto-helm’s stopped working. Dad (Steve Edwards, crew), thinks he knows why so we’ll hopefully be able to fix it in Tuk. In the meantime we’re back to helming by hand. This is a mixed blessing, on the one hand it’s really irritating to have to helm in large swells and with a strong headwind because any movement you make is at first ignored, and then exaggerated by, the wind. So it’s hard to keep a decent track and it makes it harder to look out for ice. On the other hand, moving and putting effort into the steering keeps you warm which is nice and it means you don’t have to put as many clothes on which is also nice because when you go down stairs and it’s twenty four degrees it can get quite uncomfortable.
We all had our job lists, ice lights, bilge pumps, laundry, shopping but the man who gets the Vodka Salute is unquestionably Steve.
I dropped him off wth Willard. Two peas in a pod. They made a broken Pilot Spigot. That sounds quite easy but it took the whole day in a machine shop in a container, working to fine tolerances, and many modifications. Fitting it in the bowels of the Lazzerette in cold weather and driving rain. It worked first time. Brilliant effort.
Issued 07:00 AM MDT 04 September 2016
Today Tonight and Monday
Wind – Northwest 15 knots diminishing to light late this morning then becoming northwest 15 Monday morning.
Waves
Seas – 1 metre.
Weather & Visibility – Chance of showers changing to periods of rain near noon then to chance of showers tonight and Monday. Fog patches dissipating early this evening.
My famous last words? Plain sailing by the look of it!
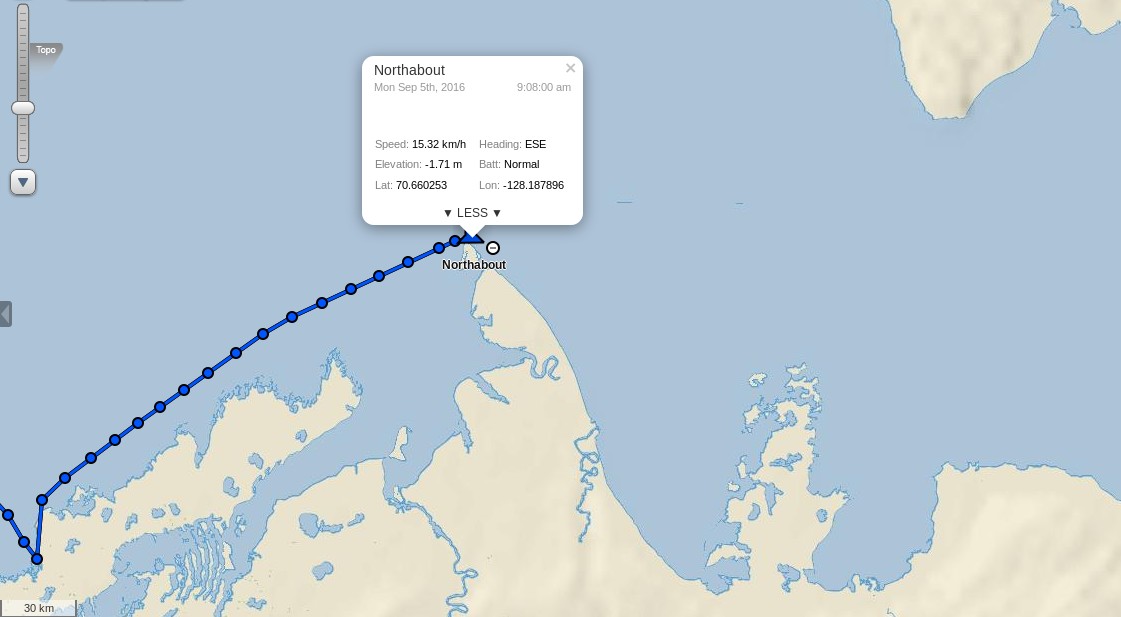
[Edit – September 5th]
Northabout has just rounded Cape Bathurst, the northernmost point of mainland Northwest Territories:
I wonder if her crew will take a close look at the nearby Smoking Hills?
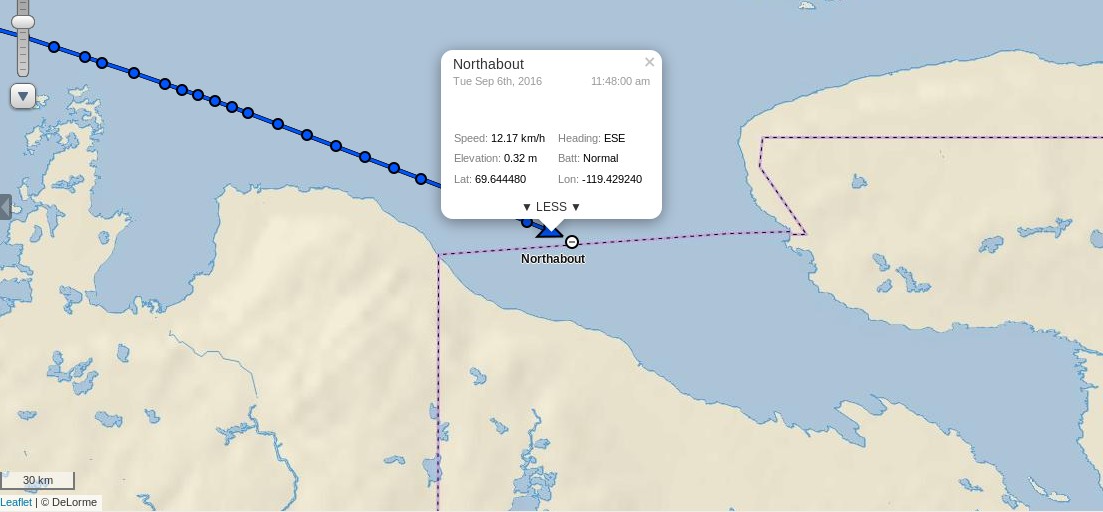
[Edit – September 6th]
Northabout gave the Smoking Hills a miss and headed strait for Cape Parry. She has already crossed the Amundsen Gulf and is heading into the Dolphin & Union Strait:
In light of the lack of ice and in the spirit of saving time we’ve decided not to stop in Cambridge Bay or Pond Inlet and go straight on to Upernavik in Greenland before doing our crew change. Looking at the ice maps at the moment it seems we’ll be able to get through with little or no trouble, though this is almost bound to change, if it stays that way we’ll reach Upernavik in about fourteen days. I’m looking forward to it!
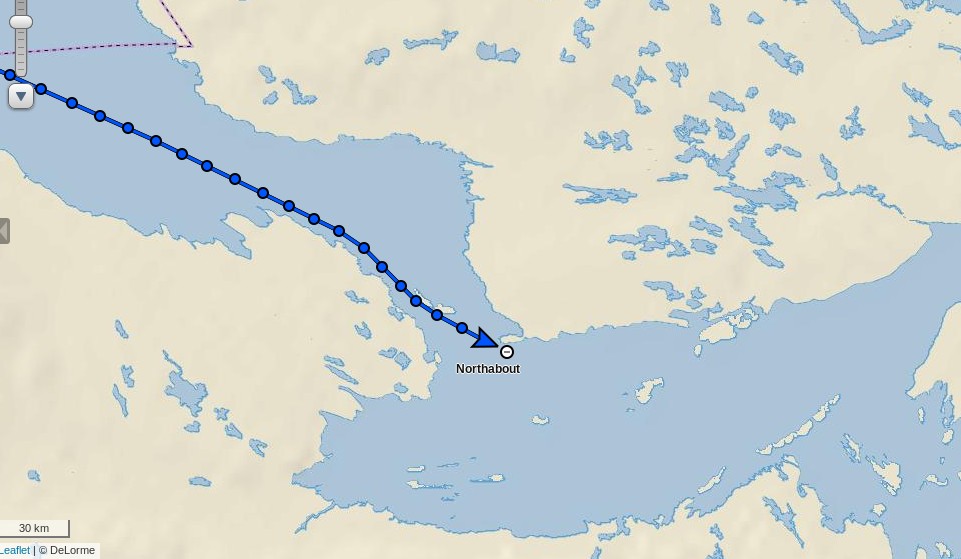
This morning Northabout is rapidly approaching the western entrance to Bellot Strait:
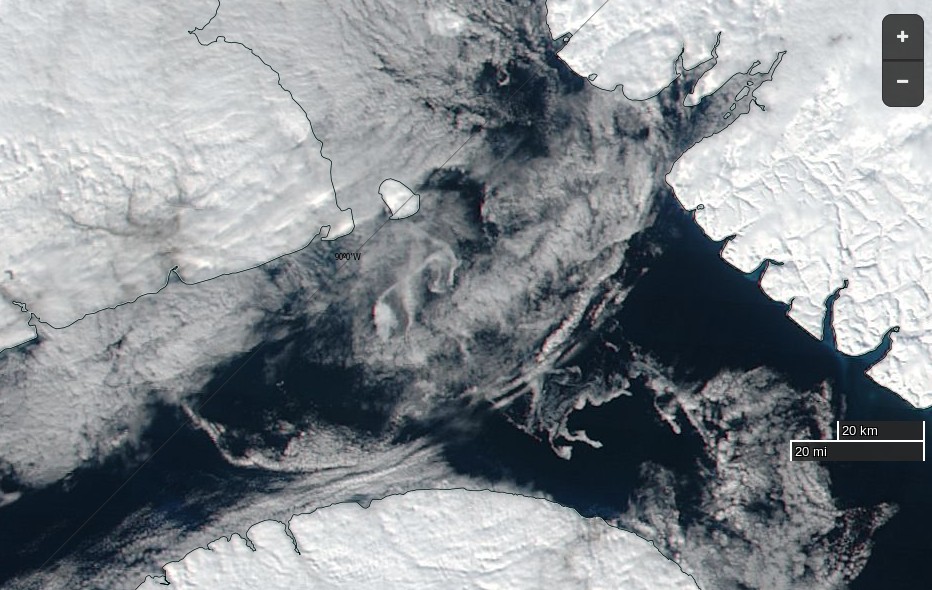
Their stated intentions are to head past Pond Inlet and across Baffin Bay to Upernavik in Greenland. Assuming they initially follow the same route as Crystal Serenity they will soon to need to pick their way past some bergy bits in Prince Regent Inlet before negotiating some currently “wispy” areas of sea ice as they enter Lancaster Sound. Here is the current Canadian Ice Service chart for the area:
plus a rather cloudy “visual” image:
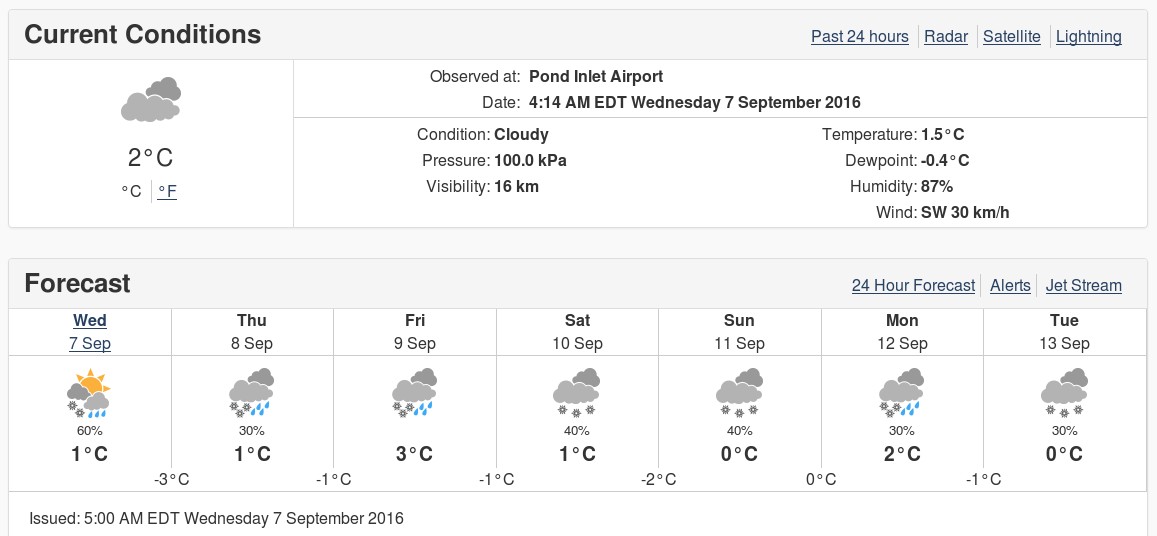
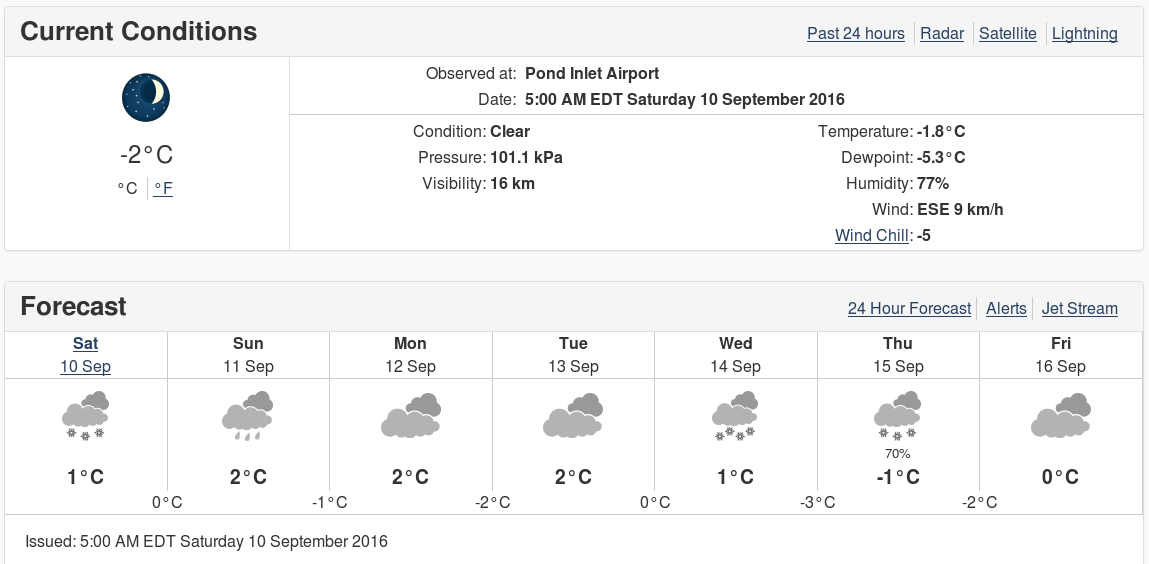
The current weather forecast for Pond Inlet doesn’t suggest the parts of the Northwest Passage still on Northabout’s route are going to start refreezing just yet:
Currently there is an obvious passage past the existing ice, but that may of course have changed by the time Northabout gets there.
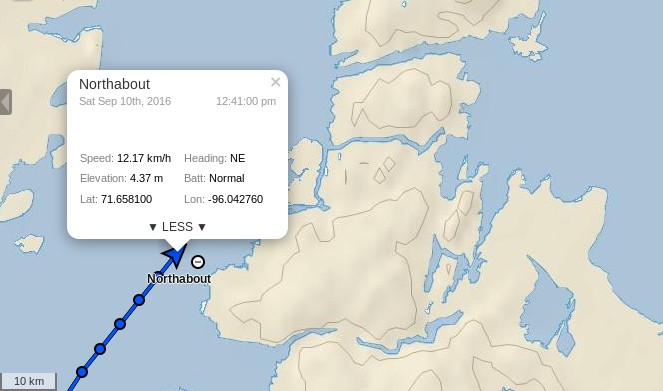
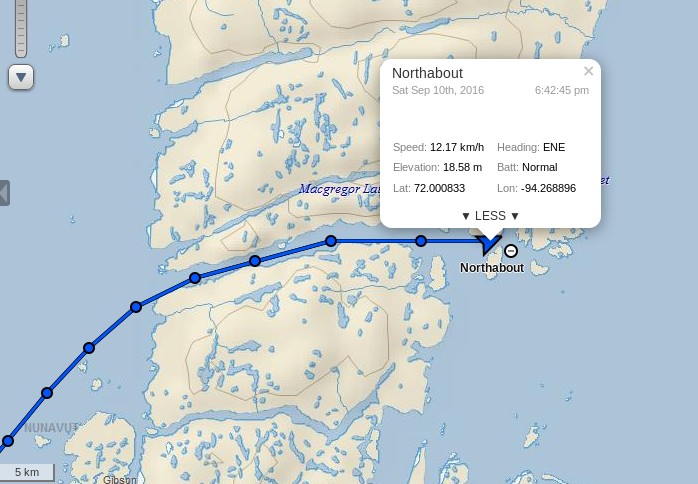
[Edit – September 10th PM]
Northabout has just emerged safely from the eastern end of Bellot Strait:
I wonder if her crew will stop to make a new entry in the visitors book at Fort Ross?
[Edit – September 11th]
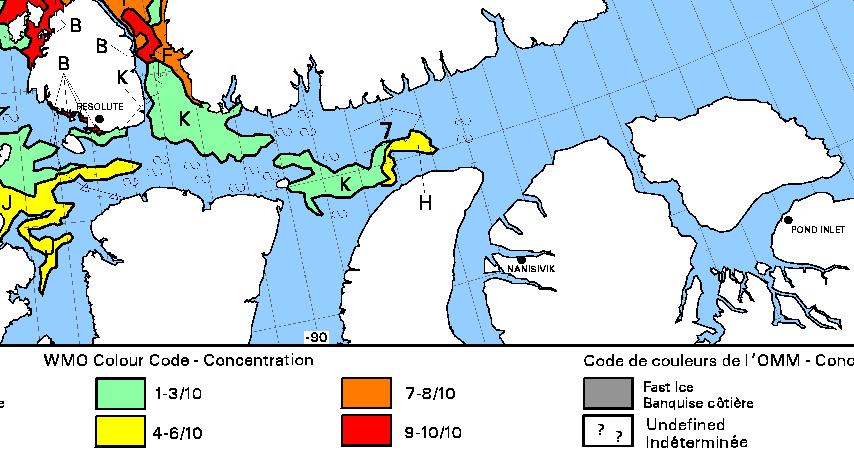
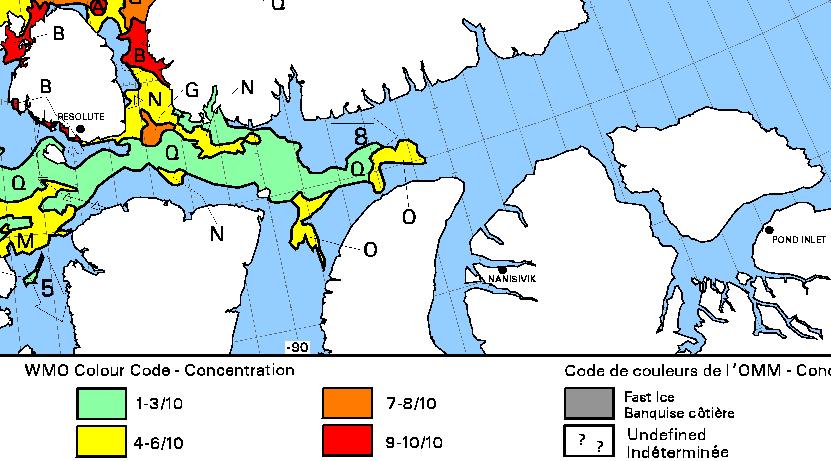
Here’s the latest CIS ice chart:
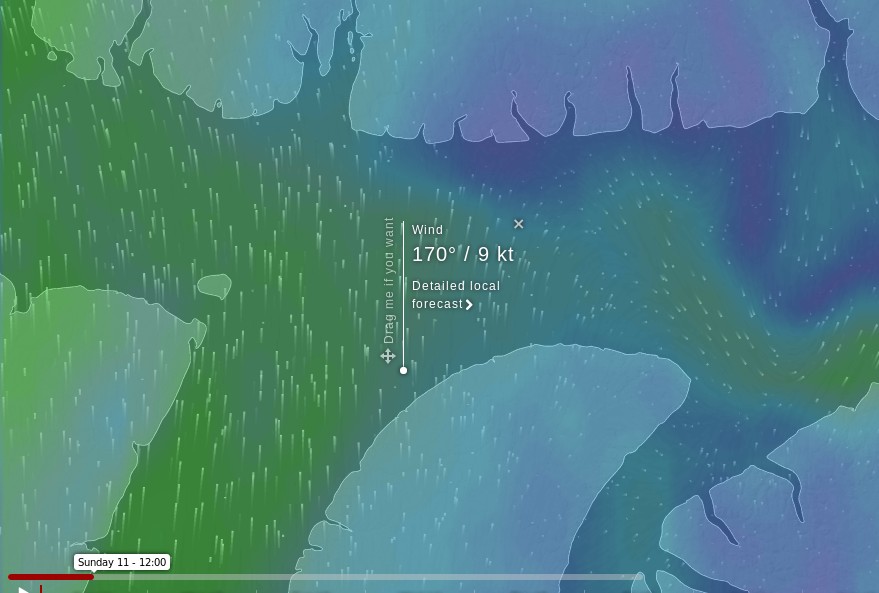
The gap between the coast and the yellow area of 4-6/10 concentration ice has closed considerably, and there’s now a broad expanse of 1-3/10 ice which Northabout may be forced to try and wend her way through. A change in wind direction would come in very handy, and that’s just what the ECMWF forecast at Windyty is suggesting for Sunday 11th:
Just what the doctor ordered?
[Edit – September 11th PM]
Video shot from Northabout’s drone of her ice-free passage through Bellot Strait:
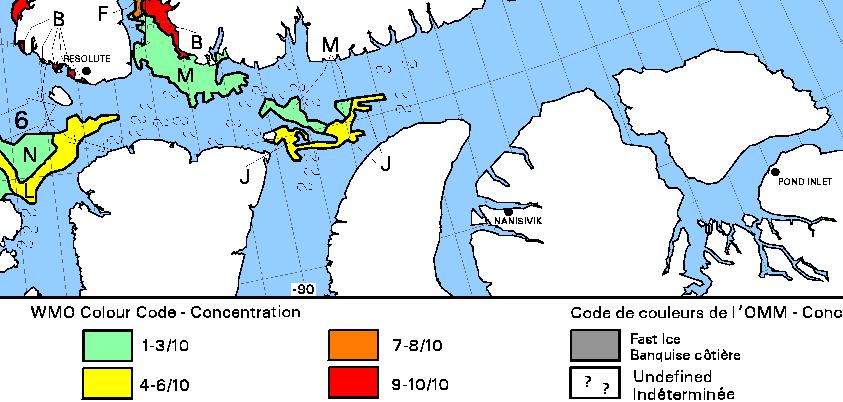
However the passage from Prince Regent Inlet into Lancaster Sound has not proved to be ice-free!
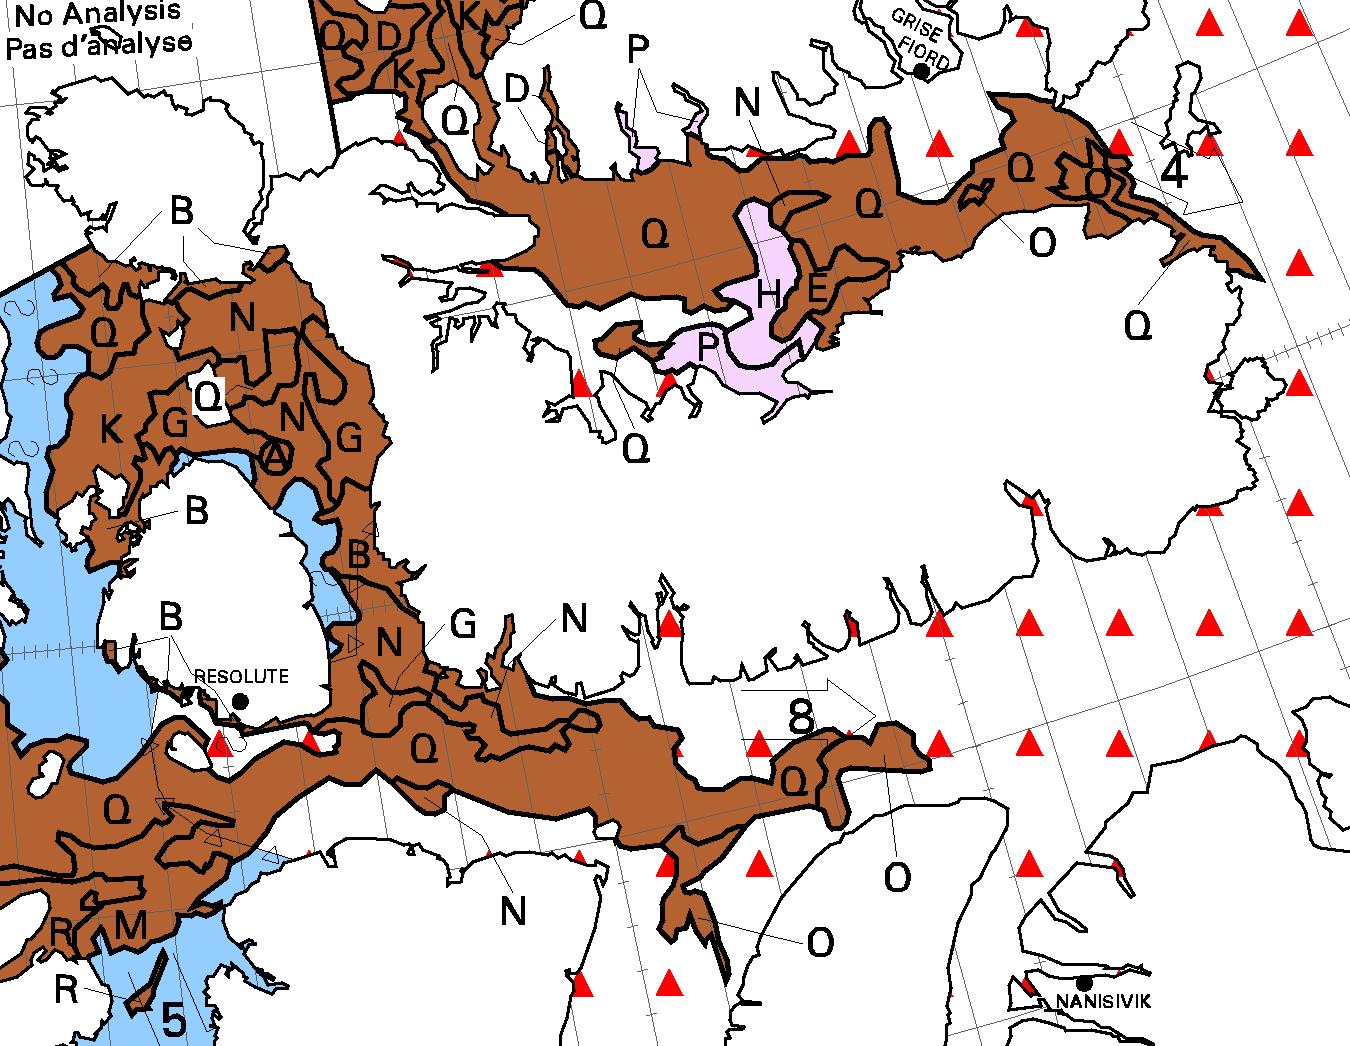
Northabout is obviously endeavouring to skirt around the eastern edge of the 4-6/10 old ice in her path:
Today’s CIS ice concentration chart suggests there isn’t much room to spare:
The stage of development chart does reveal some new ice, but it’s well to the north of Northabout’s route through Lancaster Sound to Pond Inlet:
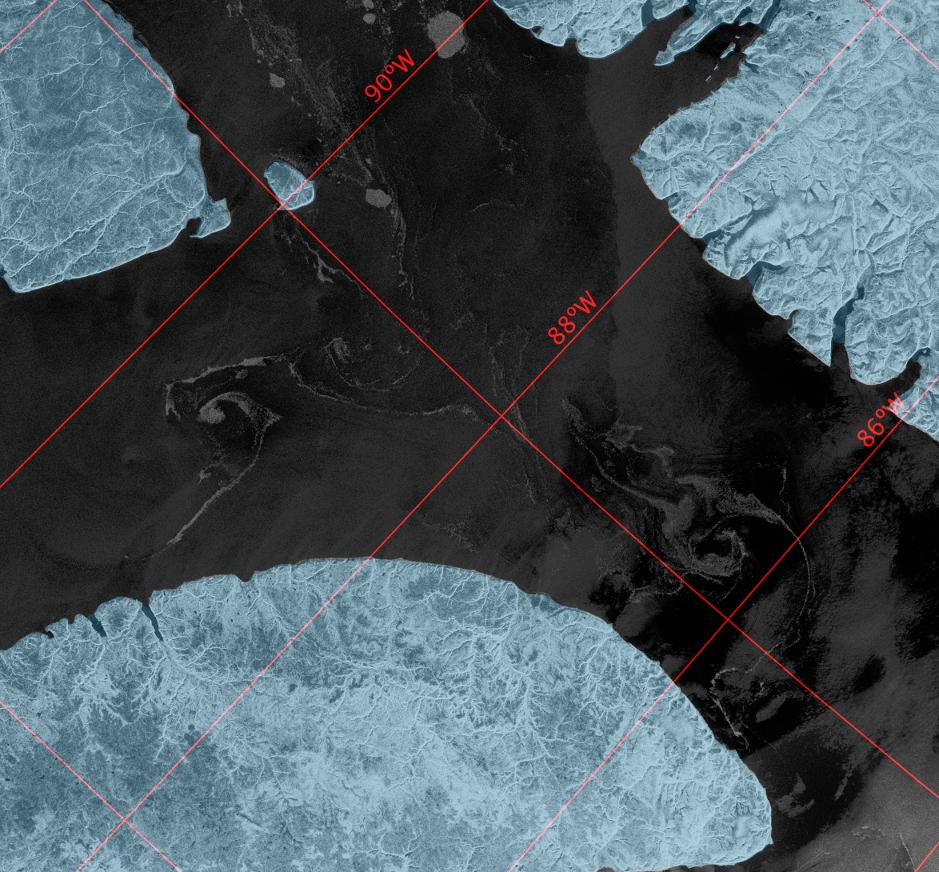
Somewhat belatedly, here’s a Sentinel 1A synthetic aperture radar image of the sea ice Northabout is squeezing past as we speak:
[Edit – September 12th]
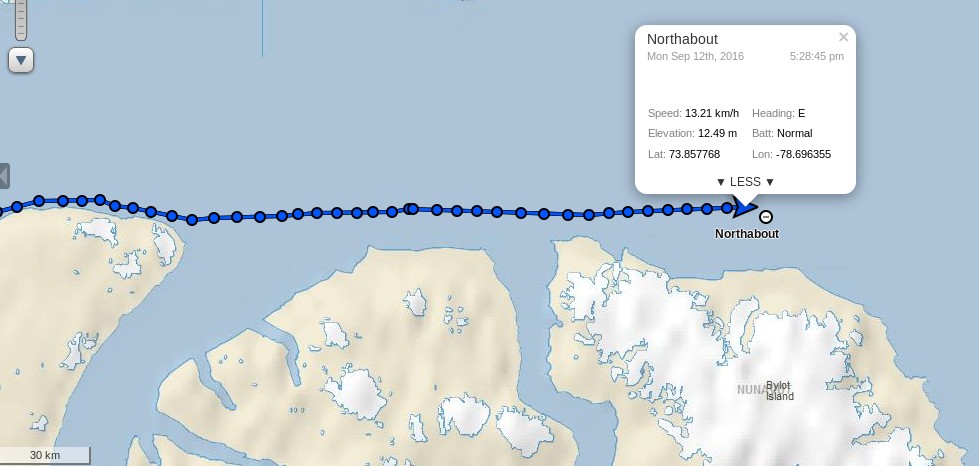
Northabout has emerged safely into Lancaster Sound, and is bypassing Pond Inlet in order to head strait across Baffin Bay:
Here are a couple of videos of some remnants of sea ice on her once again eastward travels:
There are several more on the Polar Ocean Challenge web site.
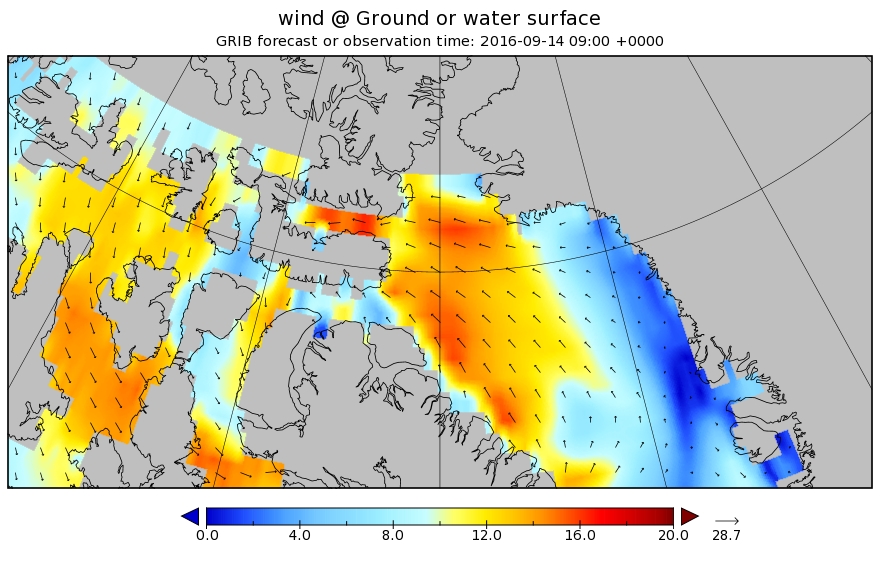
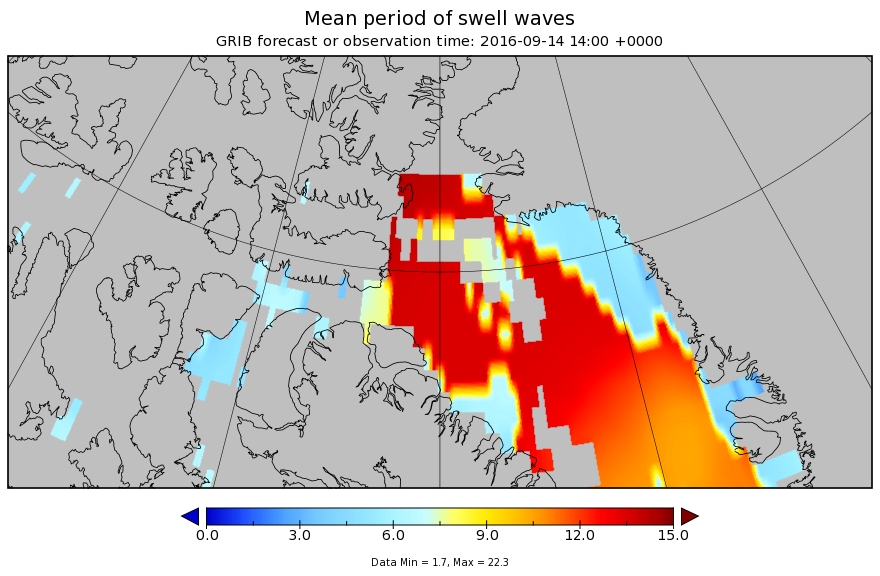
With all that ice now safely behind her Northabout has new dangers to face. Wind and waves! Let’s take a look at the WaveWatch III “surf forecast” for Baffin Bay over the next few days. A low pressure area is heading in Northabout’s direction from across the Canadian Arctic Archipelago. By Wednesday morning (UTC) the resultant wind field looks like this:
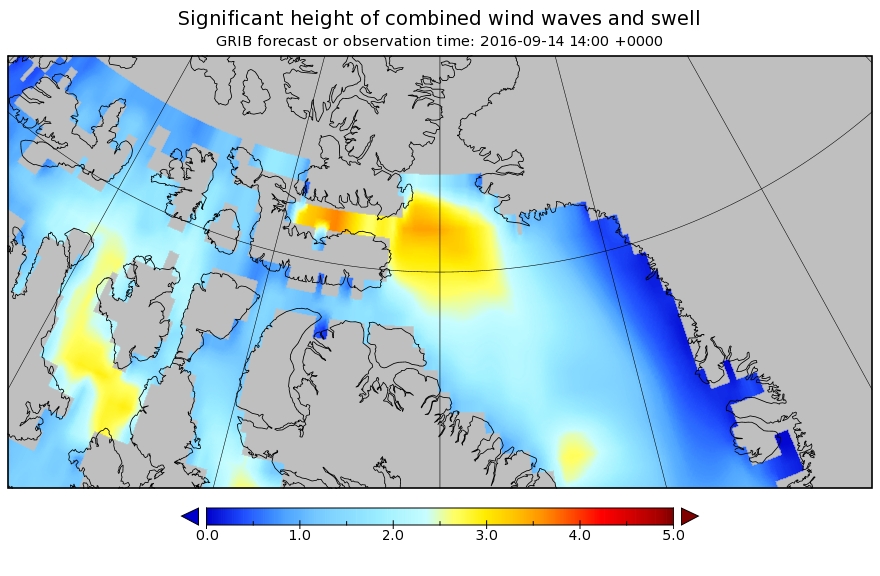
By Wednesday afternoon those winds of around 15 m/s will have produced waves in Baffin Bay that are forecast to have reached over 3 meters high:
and what’s more they won’t be just wind waves. A modest swell with a period of over 12 seconds is predicted too:
I’m sure the Polar Ocean Challenge team will be doing their level best to be safely on the opposite side of Baffin Bay by the time the worst of the weather arrives!
Thank you for your prompt reply, and my apologies for my slightly sluggish one. As you can tell from my details below I have a “day job” to attend to, and if you’ve clicked the links I sent in my original complaint you’ll realise I’ve also been very busy following up on some other allegedly inaccurate articles in the Daily Mail and a number of other Great British newspapers. See for example:
We hereby call on the Daily Mail to provide us with a fair opportunity to reply to this egregious inaccuracy and a number of others in the same article.
Despite your “I therefore cannot see that Clause 1(ii) of the Editors’ Code has been breached in any way.” below, and apart from your admittedly at least 1000% timescale error, the Guardian article linked to highlights a number of other gross inaccuracies in last week’s “Daily Mail Comment” concerning Arctic sea ice volume. I fail to see how “Putting the Arctic sea ice volume record straight” for the unfortunate readers of that editorial can be achieved without prominently displaying to your print readers the Arctic sea ice volume graph extracted from Rachel Tilling’s recent academic paper:
and in addition showing your online readers the “Arctic ice cube” video together with a link to it in print.
I shall have much more to say to you on that topic in the near future but I’m theoretically “on holiday” for a week from tomorrow, so it may well not arrive in your inbox until after my return.
Professor Peter Wadhams of Cambridge University has just written to the UK’s Independent Press Standards Organisation about recent articles that “ha[ve] substantially damaged my reputation for scientific integrity, and I believe that this was the deliberate intention”. Here is the text of his complaint.
The writer of this article, Ben Webster, phoned me up cold in my office at Cambridge University on Thursday 23 July, saying that he was writing a piece on the retreat of sea ice in the Arctic, and whether it was increasing or not. We discussed the scientific data, then he asked who else was working in this field in the UK, in order to contact them. I mentioned that there are not many others in this field, since three of the leading figures died within a short space of time in accidents in 2013. He asked for further details.
I asked that this be completely off the record because of (a) the sensibilities of relatives of the deceased (Prof Laxon’s partner was particularly upset by the subsequent publication),
(b) my own scientific reputation (I did not want to be made out to be a crazy person),
(c) the fact that these deaths were investigated and were very clearly simply an extraordinary coincidence.
He raised the question of whether they were murdered. I agreed that for a short time I thought that they were, since I had had the experience of being run off the road at the same time by a lorry, but that it was very clear afterwards that the three deaths were individually explainable accidents.
I did not make any of the statements enclosed in quotation marks by the reporter. Webster promised that this was in confidence and that if he wanted to use it he would contact me first. The next thing I saw was the article plastered over Saturday’s “Times”. He had clearly done some research in procuring photographs, but did not bother to contact me, and broke his promise of confidentiality.
The publication, subsequently picked up by the Sunday Telegraph and Mail on Sunday, has substantially damaged my reputation for scientific integrity, and I believe that this was the deliberate intention.
Here are our edited highlights of the story so far:
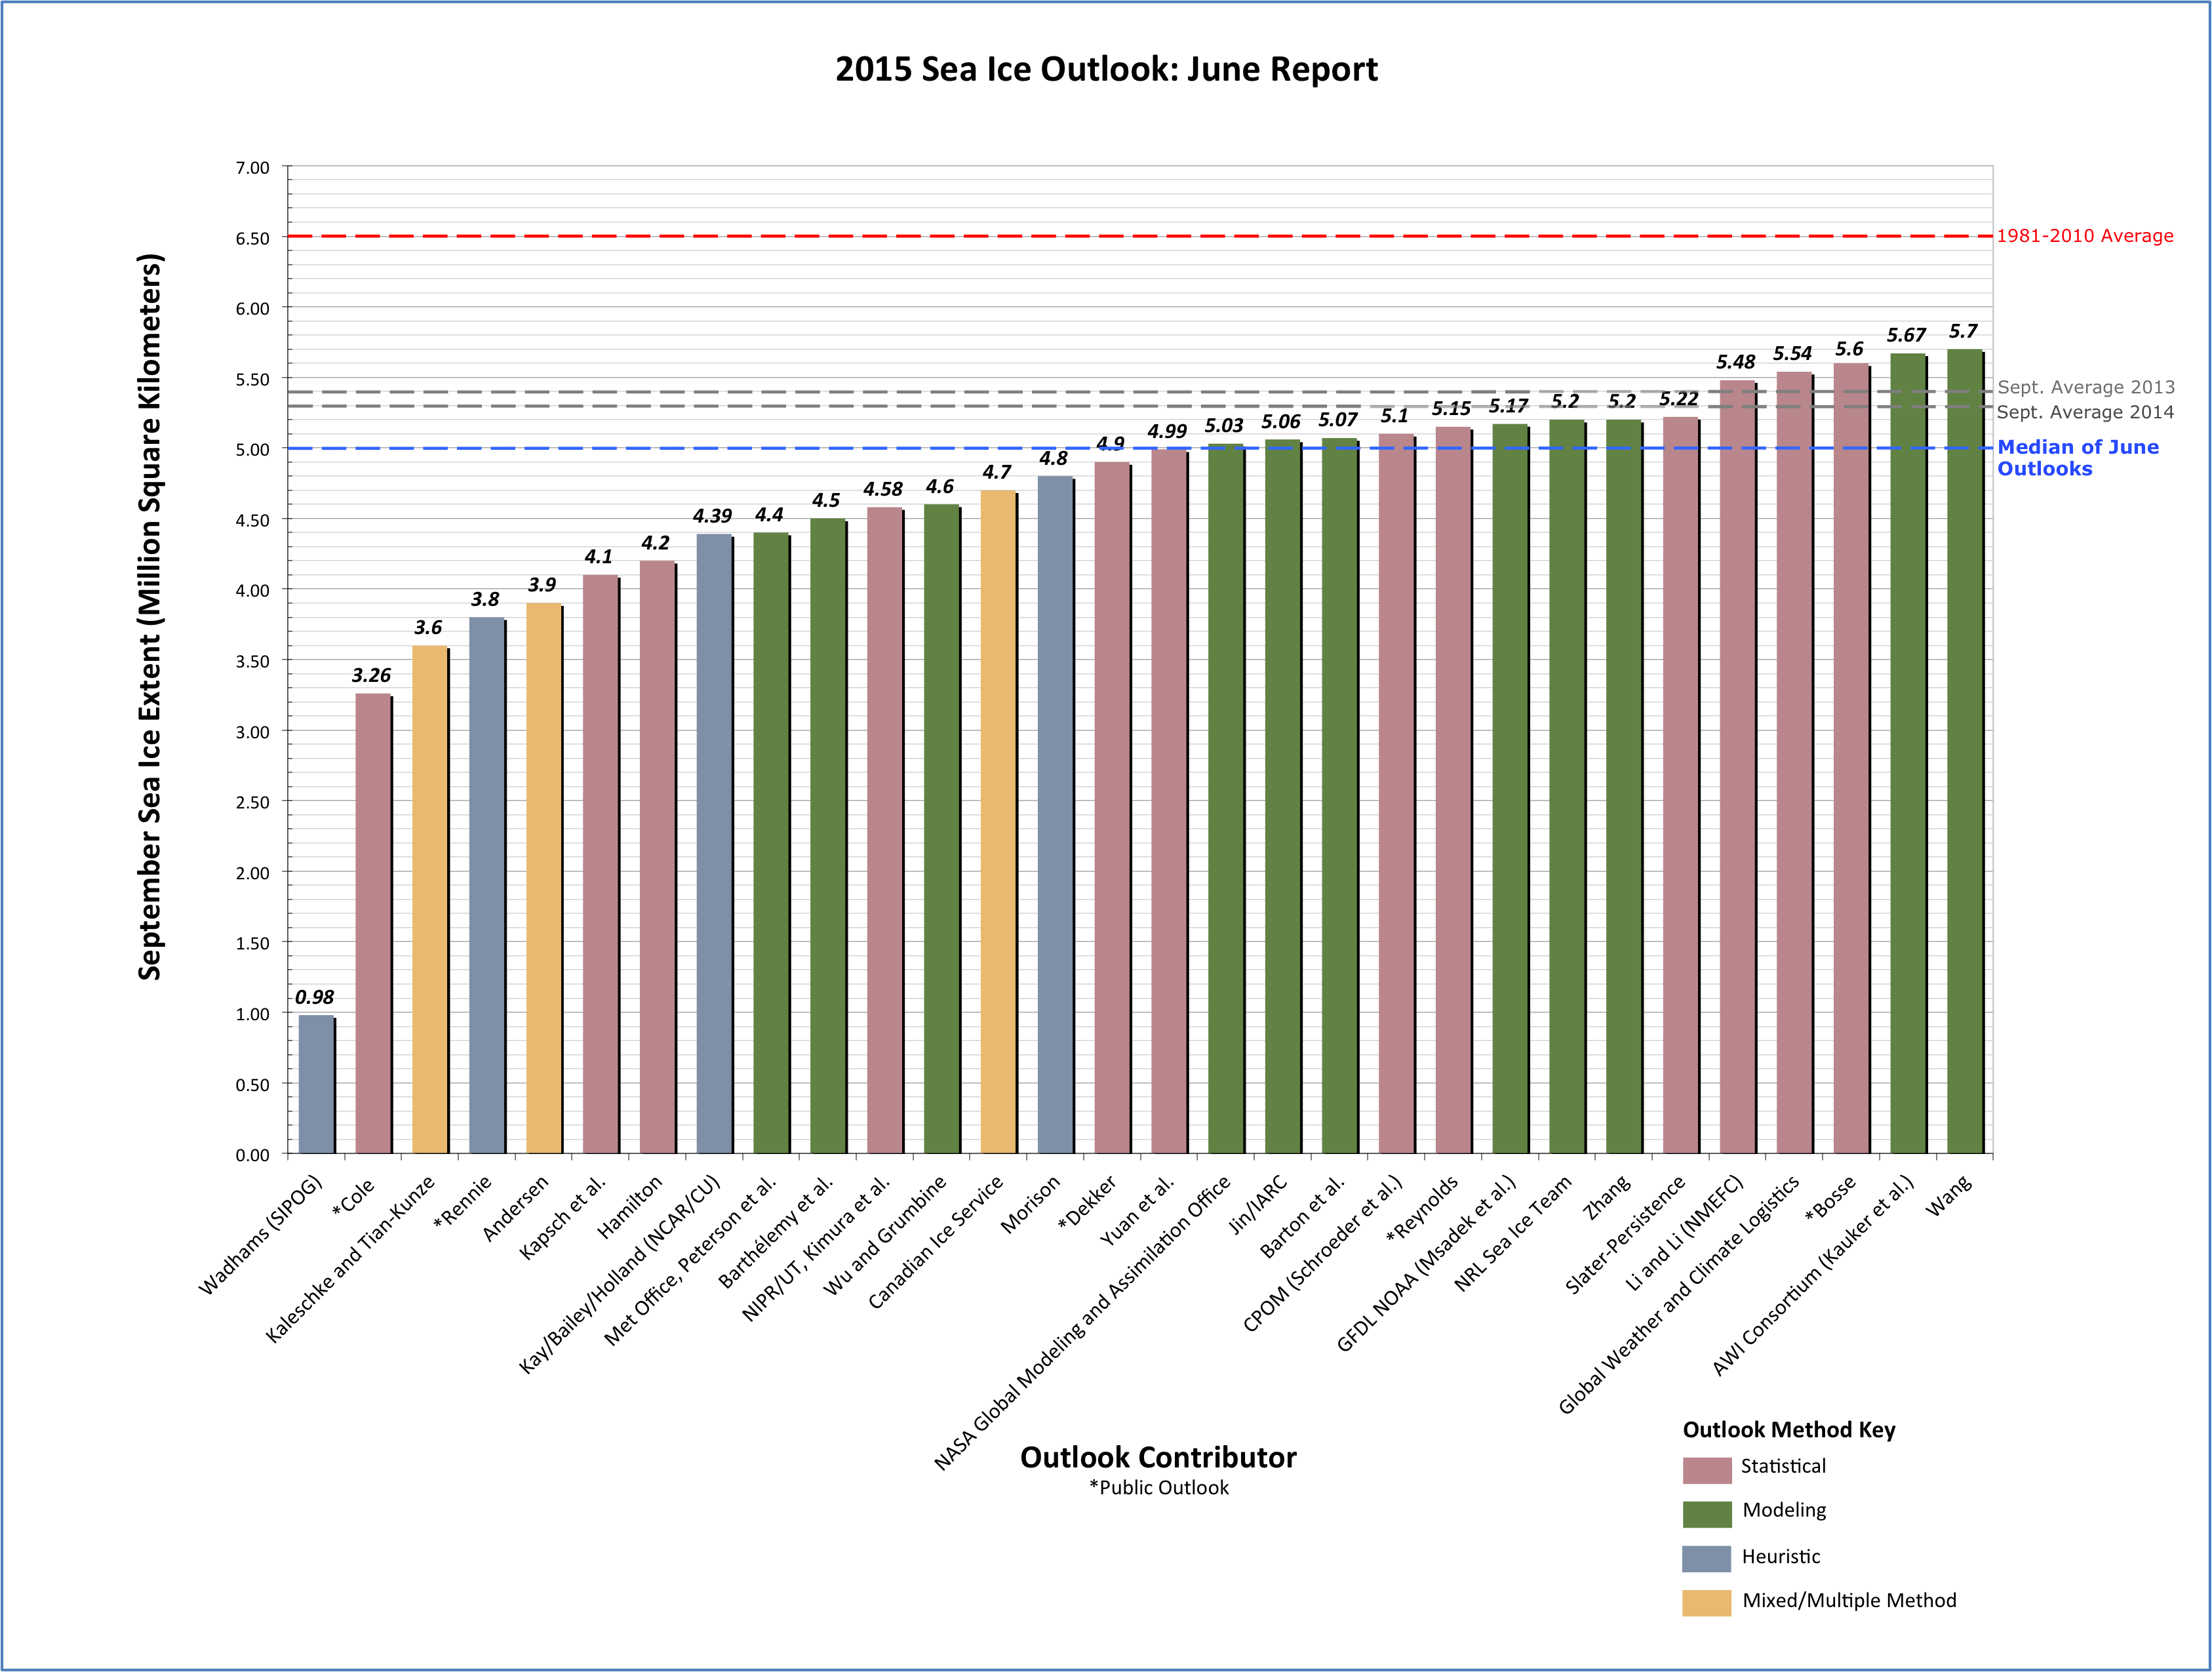
One eminent sea ice researcher certainly seems to think that time is indeed running out for the sea ice in the Arctic. First let’s take a look at the results of the first call for contributions of the 2015 melting season from the Sea Ice Prediction Network:
Note that in the bottom left hand corner of that graph there is a prediction of 0.98 million square kilometers labelled “Wadhams (SIPOG)”. The acronym refers to the Sea Ice and Polar Oceanography Group in the Department of Applied Mathematics and Theoretical Physics at the University of Cambridge, of which Prof. Peter Wadhams is the head. Before we get on to his explanation for what the SIPN refers to as “an extreme outlier” amongst all the other predictions, here’s a TEDx presentation given by Dr. David Barber, who is currently Associate Dean (Research) in the CHR Faculty of Environment, Earth and Resources at the University of Manitoba in Canada:
Here are what Dr. Barber refers to as the “seven surprising impacts” of declining Arctic sea ice:
Increasing coverage of young ice significantly changes atmospheric chemistry
More snow both preserves and destroys ice
Polar bear habitat can actually improve in some areas while deteriorating in others
Match-mismatch timing in the marine ecosystem increases vulnerability
Uncertainty as to whether the Arctic ocean will increase or decrease in overall productivity is a key unknown
Evidence that ice hazards are actually increasing while the world marshals to increase development of Arctic resources
Evidence that our recent cold winters are actually linked to our warming Arctic.
However those bullet points from David’s closing summary don’t actually mention the part of his presentation that most interested me. Listen carefully at 7:40 when he says that:
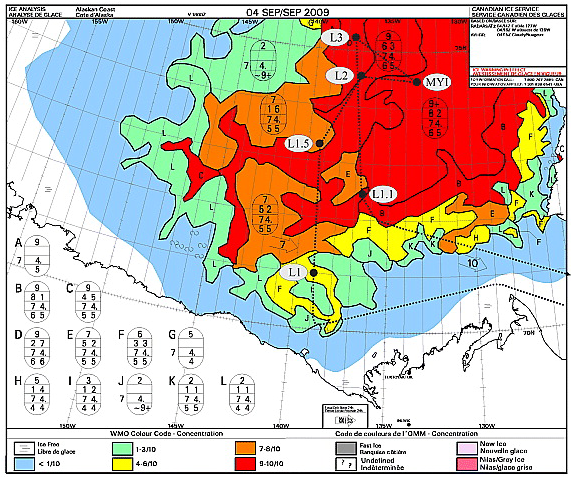
In 2009 we had our icebreaker down here and we went up this line that you see right here in this figure.
Here’s the relevant passage from the paper rather than the TEDx video:
We departed from station L1 heading north towards station L1.5, expecting to enter MY sea ice cover at about 71°20′N, 139°00′W based on remotely sensed information (Orange polygon in the figure). The Canadian Ice Service (CIS) ice chart (which relies extensively on Radarsat-1 data) for 4 September 2009 indicated the ship track would range from 7 to 9 tenths coverage and this ice would consist of partial concentrations of 5 tenths to 7 tenths old ice and from 2 to 3 tenths thick first year ice.
In situ observations of the sea ice conditions however showed that the ice we were traversing was not MY or thick FY, nor was it 7 to 9 tenths concentration, but rather it was a mixture of a few small MY ice floes (1 tenth coverage) interspersed in a cover dominated by small (10–100 m) rounded floes of heavily decayed first year sea ice (4 tenths). These floes were overlain by a thin layer of new ice (7 tenth) where freeboard was negative and thin ice growing between remnant pieces when the ice had a positive freeboard. Likewise, some new ice covered open water areas between floes.
This is the “rotten sea ice” David refers to in the video, about which he says:
It was so rotten in fact that the ship that we had does 13.5 knots in open water, and we were able to traverse that ice at 13 knots, yet the satellites all thought that this was very thick multi-year sea ice, because that’s what it had always traditionally been.
This information is obviously very interesting of course, but even more interesting (to me at least) is a subsequent paper by Dr. Barber about the same voyage of the Canadian Research Icebreaker Amundsen, published in 2012 and entitled “Fracture of summer perennial sea ice by ocean swell as a result of Arctic storms“. Here’s a pertinent extract:
We progressed through the heavily decayed ice region into a transitional region containing a mix of decayed old and FY sea ice floes, and finally into thick late summer MY pack ice. Using the onboard helicopter to survey the area, we identified a vast MY floe (10 km diameter), to which we intended to moor the ship, and conduct our typical science operations. The ice in this area was much thicker than the heavily decayed FY ice we that we had encountered the previous day to the west. Our helicopter EMI system recorded overall thicknesses of sea ice around station MYI (e.g., mean = 2.0 m, max = 10 m).
As ice teams initially prepared to deploy to the ice, we noticed the appearance of a swell from the ships helicopter deck. Laser data collected during the helicopter EMI survey at station MYI indicated a swell period of 13.5 s, and a wavelength ranging from 200–300 m. Laser data were collected while the helicopter hovered over a large MY ice floe. These data were augmented with three-dimensional dynamic ship positioning data, which revealed approximate ship heave amplitude of 0.4 m, also with a period of 13.5 s. The swell caused the vast MY ice floe nearest the Amundsen to ride up one side of the swell and fracture as it crested the wave peak, creating smaller ice floes of width approximately one half of the wavelength of the swell. In a matter of minutes from the initial onset of swell propagation, all large MY ice floes in the region were fractured in this manner, yielding a new distribution of smaller MY ice floes ranging from 100–150 m in diameter. A helicopter-borne video system recorded this event in still photographs along its flight track which were later combined to create a series of photo mosaics.
On 09 September 2009, we conducted a longitudinal helicopter EMI survey at 72.5 N, and determined the limit of the swell penetration into the pack ice at 72.526 N 134.51 W, a penetration of 350 km. Furthermore, the rotted FY ice margin was heavily fractured, with small floe sizes ranging from 20–50 m in diameter.
Moving on from Manitoba to Cambridge, Peter Wadhams has recently recorded an interview for The University of Earth, which describes itself as “an entertaining educational reality television series”. Here it is:
So what is “the reality” of the situation in the Arctic? Prof. Wadhams doesn’t explain his “extreme outlier” 2015 prediction in detail in the interview, but he does identify three potentially significant problems:
The “minor thing, in a way” of several feet of global sea level rise this century due to melting of the Greenland ice sheet
A sudden increase in the rate of “global warming” due to Arctic albedo feedback, which leads to
The exposure of the methane hydrate bearing continental shelves off Siberia to increasing water temperatures as the sea ice above them melts. “It’s a massive risk, if you do a risk analysis”
Peter also highlights the same concerns as Barber et al. 2012, often referred to in the literature as “waves-in-ice“. I highly recommend watching both videos from cover to cover. However if you’re in a rush then at least skip to 28:30 minutes where he points out that on his cruise around the Arctic this coming September:
We’re looking at one particular thing, which may not be the most important thing, but the retreat of the sea ice in summer is going much faster than computer models predict, and we think that one factor there is the fact that as the sea ice retreats it opens up this huge area of open water in the Arctic Ocean which then becomes like an ocean, with lots of waves and storms and swell, and the waves themselves break the remaining ice up and cause it to retreat faster so that there’s a kind of collaborative effect there that the remaining ice is vanishing faster because of so much open water producing wave action.
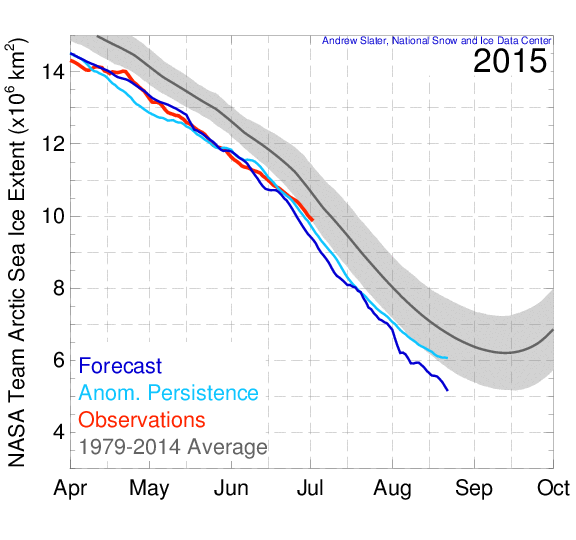
Getting back to the current situation in the 2015 melting season, here’s what the University of Hamburg’s AMSR2 sea ice concentration map currently reveals:
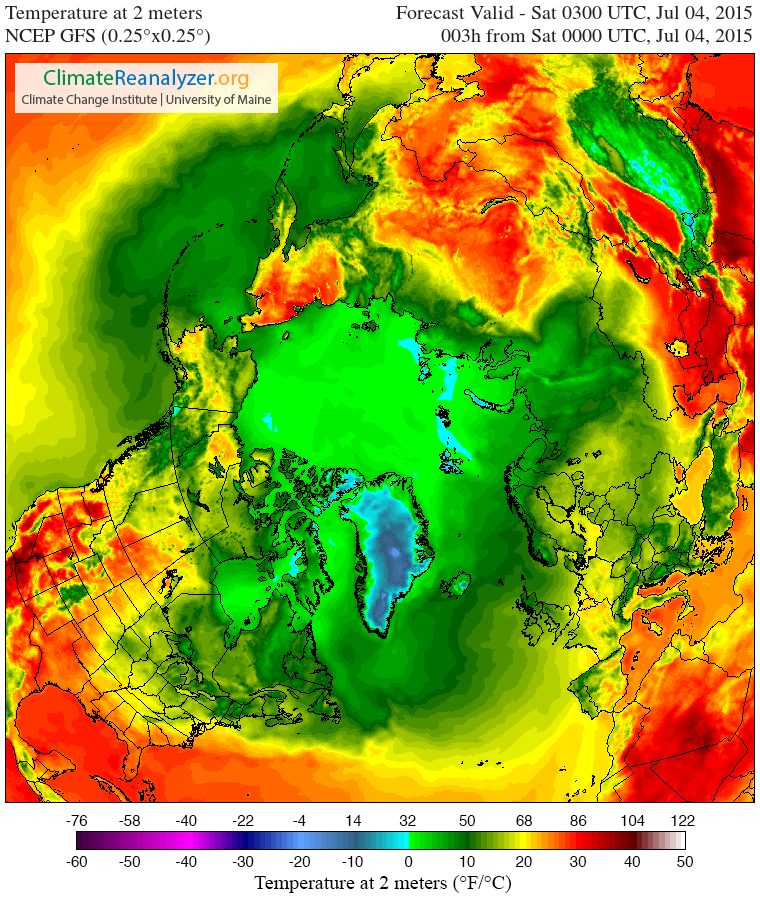
Both suggest to me that although the rate of decline in the area of Arctic sea ice is not currently abnormal for post 2007 years, it may well become so in another month or so, when the extent curve “normally” starts to flatten out. Possibly even sooner than that, because here is the current GFS 2 metre temperature map for the Arctic:
and temperatures, particularly on the Pacific side of the Arctic, are forecast to get warmer still over the next few days.
Watch this space and we’ll keep you posted, but in the meantime here’s a final thought from Peter Wadhams:
Our children have a future only if we take action now.
[Edit – July 6th 2015]
In a personal communication Prof. Wadhams informs me that:
This year I’m going out in September in the “Sikuliaq” (University of Alaska) to do some more specific wave-ice interaction experiments [in the Beaufort Sea Marginal Ice Zone], assuming there is any ice to experiment on.
[/Edit]
This website uses cookies to improve your experience. We'll assume you're ok with this, but you can opt-out if you wish. Cookie settingsACCEPT
Privacy & Cookies Policy
Privacy Overview
This website uses cookies to improve your experience while you navigate through the website. Out of these, the cookies that are categorized as necessary are stored on your browser as they are essential for the working of basic functionalities of the website. We also use third-party cookies that help us analyze and understand how you use this website. These cookies will be stored in your browser only with your consent. You also have the option to opt-out of these cookies. But opting out of some of these cookies may affect your browsing experience.
Necessary cookies are absolutely essential for the website to function properly. This category only includes cookies that ensures basic functionalities and security features of the website. These cookies do not store any personal information.
Any cookies that may not be particularly necessary for the website to function and is used specifically to collect user personal data via analytics, ads, other embedded contents are termed as non-necessary cookies. It is mandatory to procure user consent prior to running these cookies on your website.