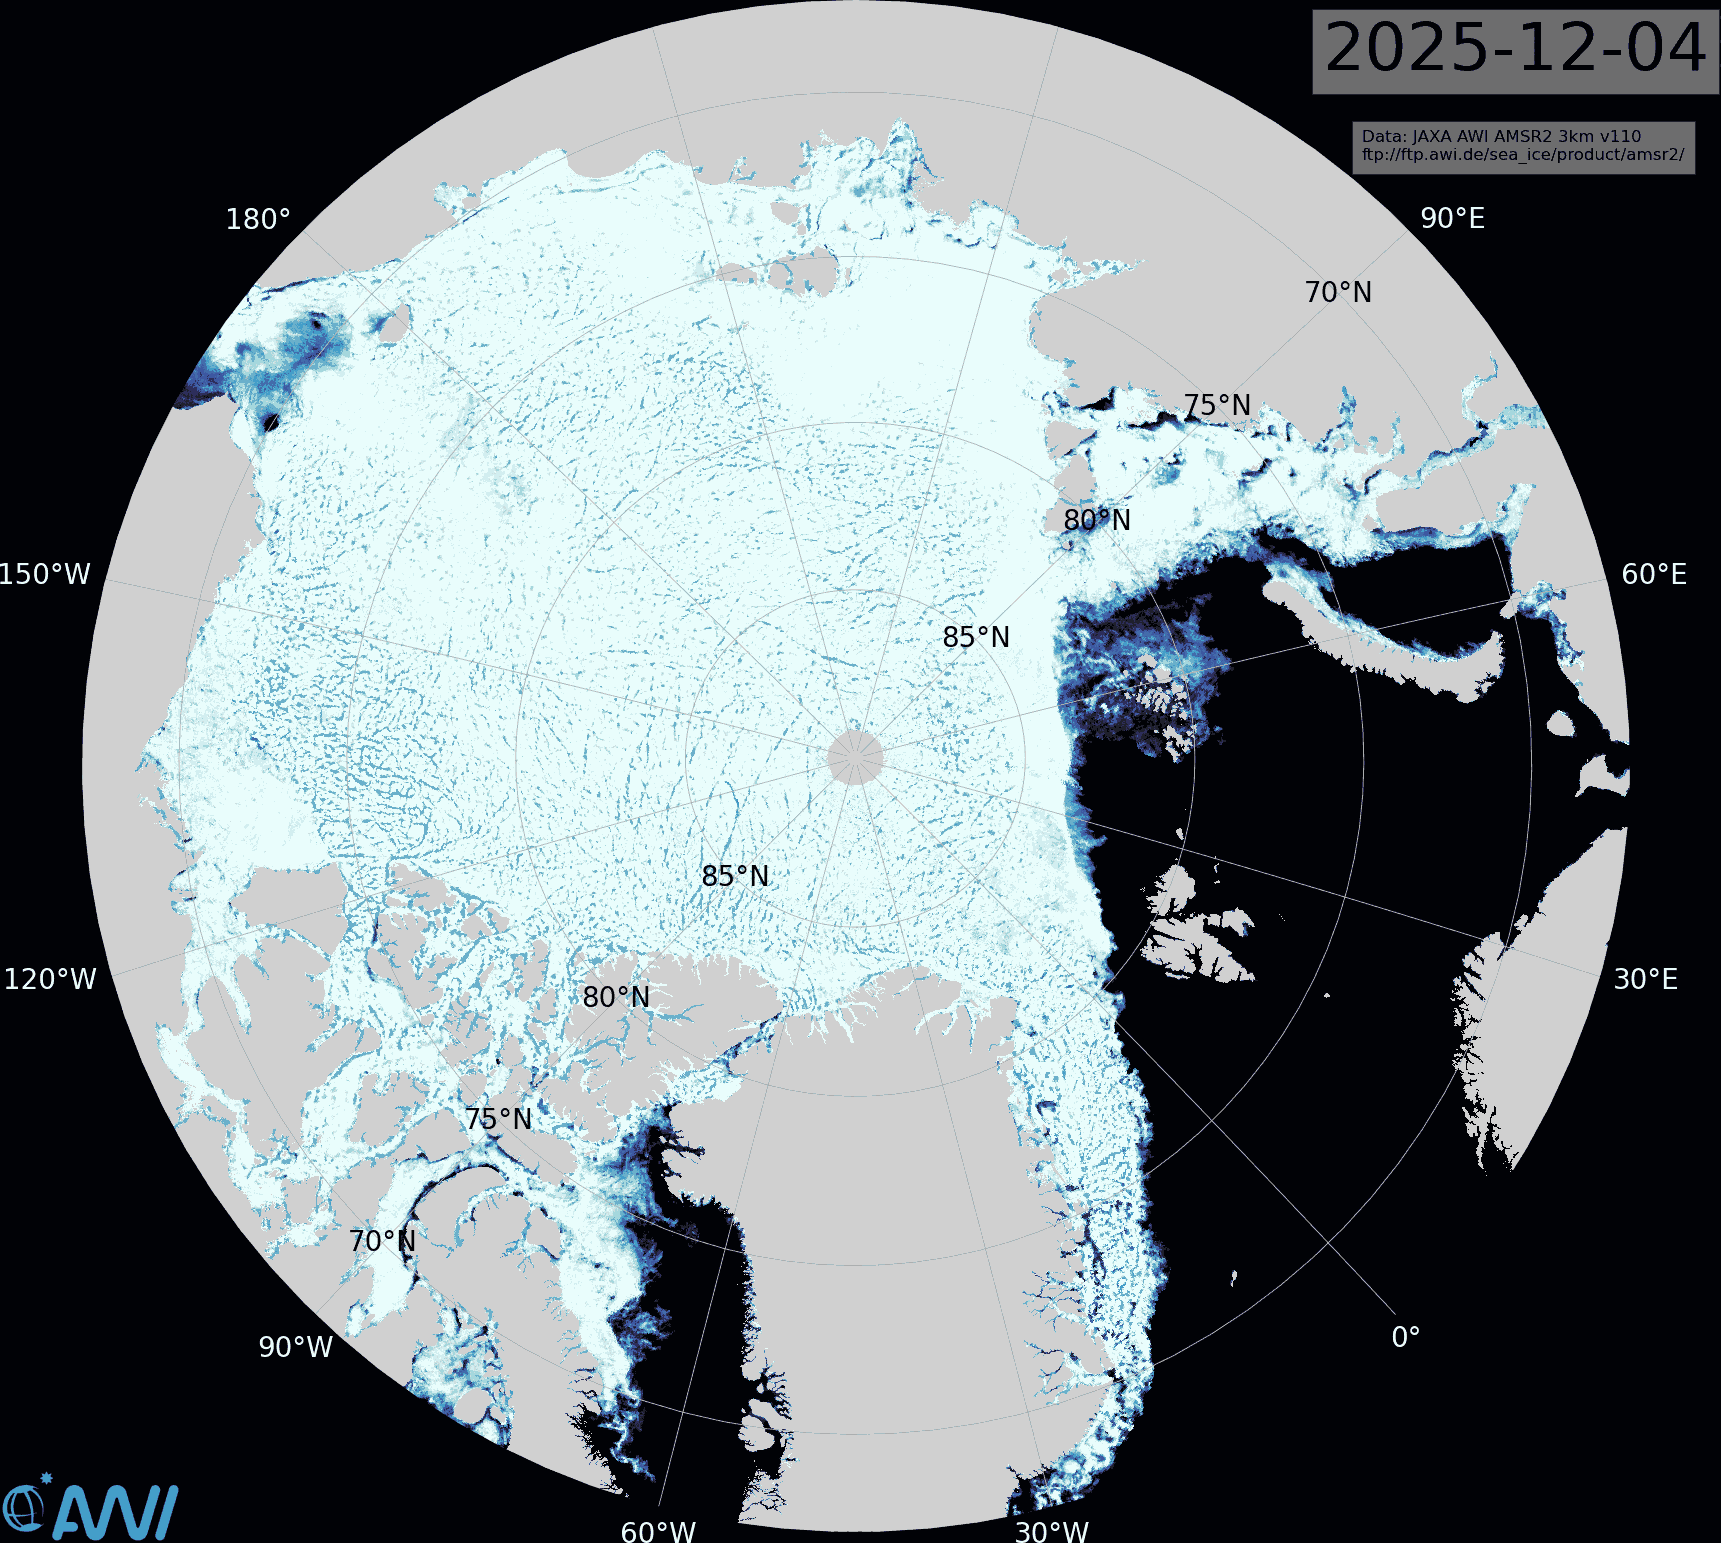
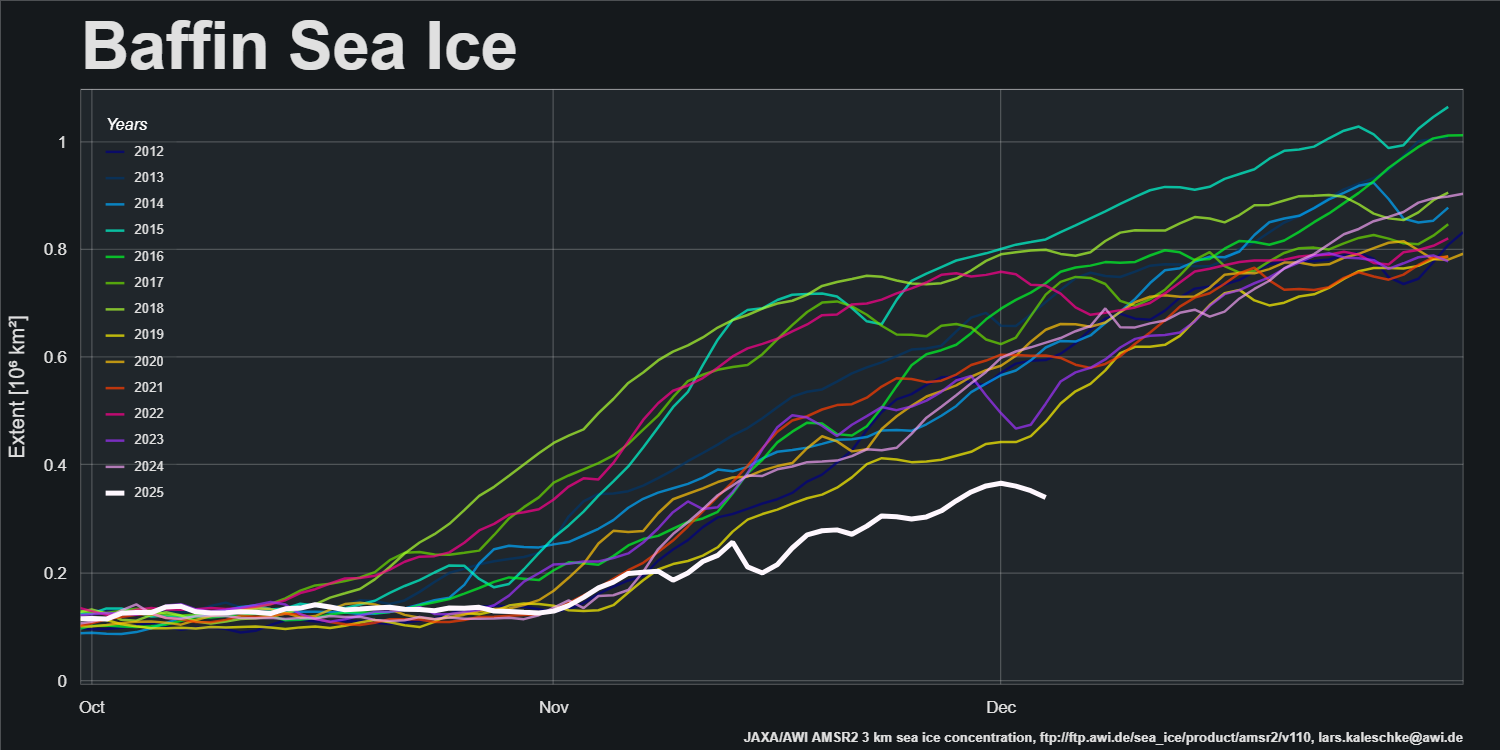
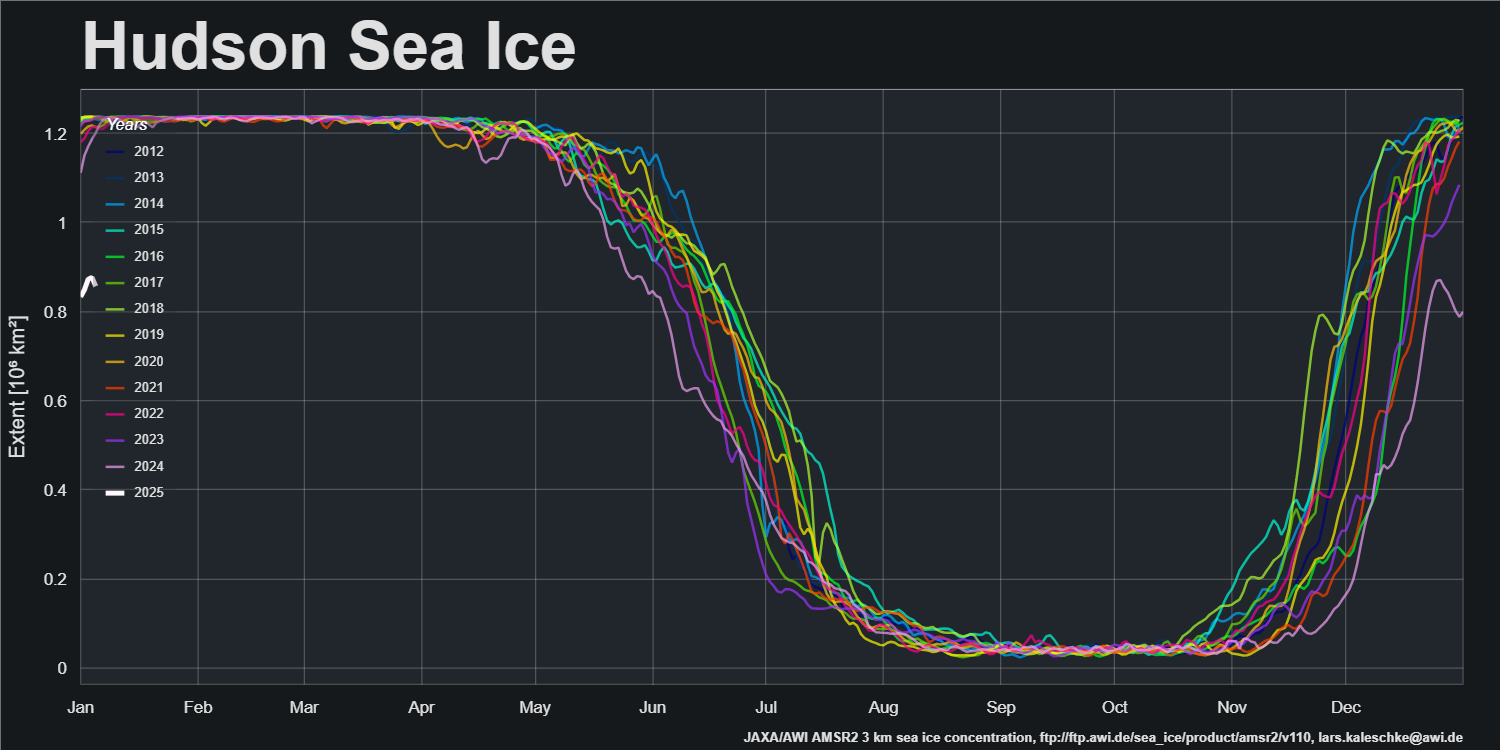
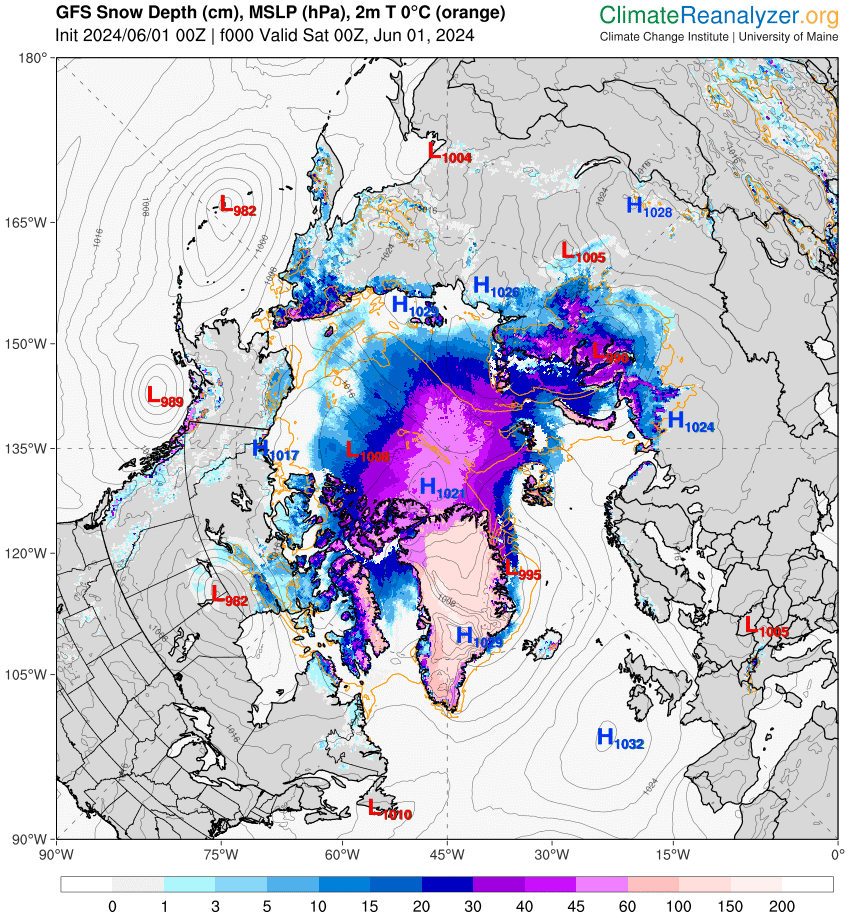
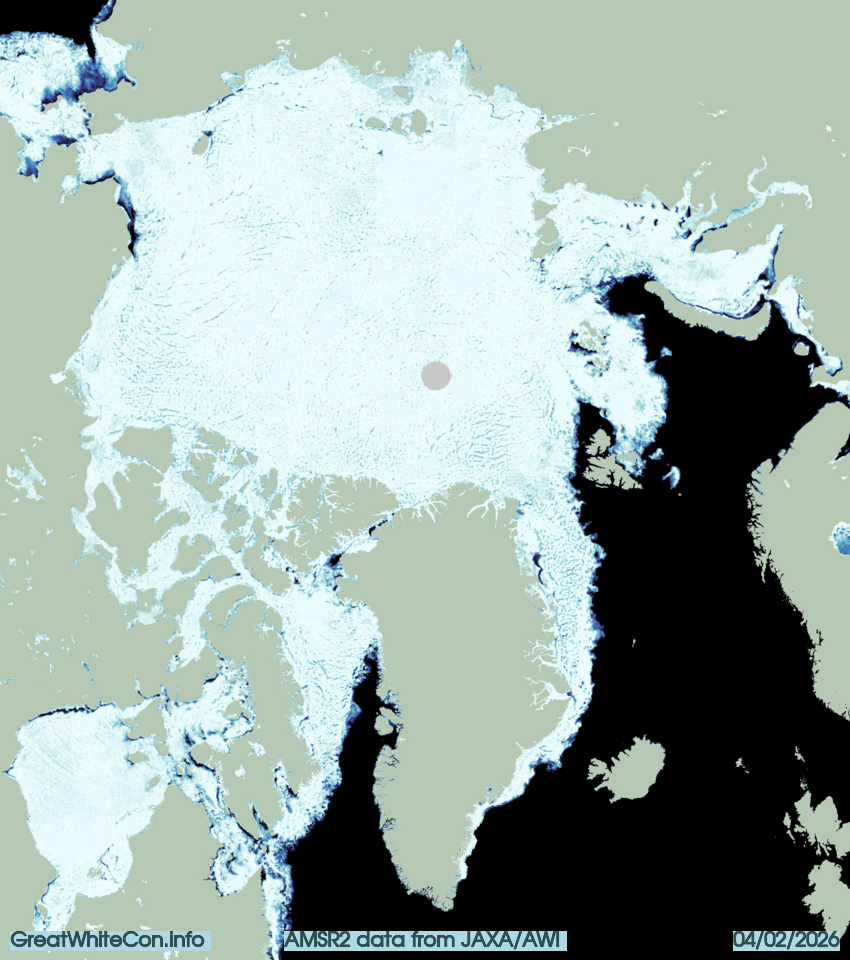
Hudson Bay has fully frozen over during January. However, there is still open water north of Svalbard and in the North Water Polynya. It’s even possible to go swimming in the Nares Strait according to the latest AMSR2 concentration map from the Alfred Wegener Institute:
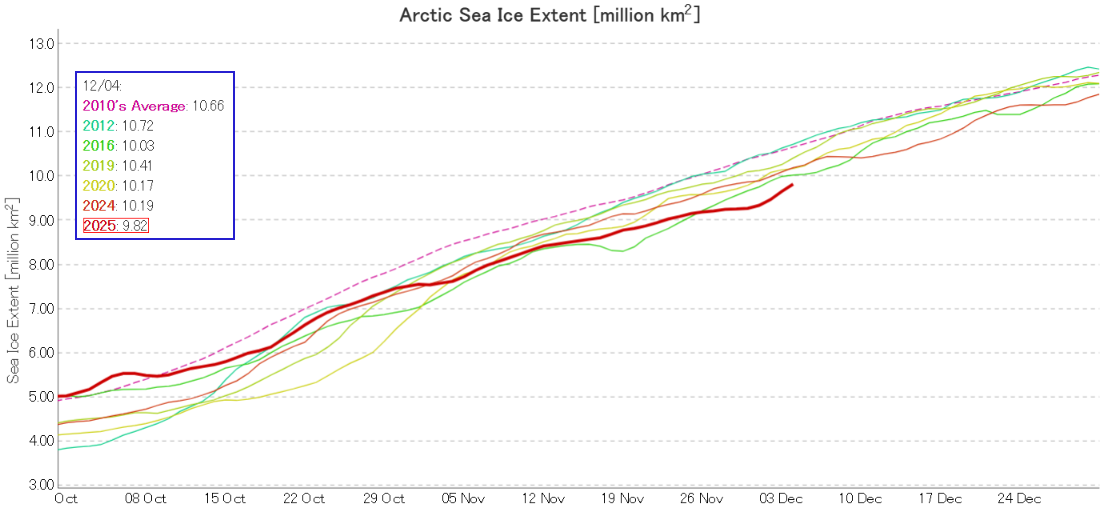
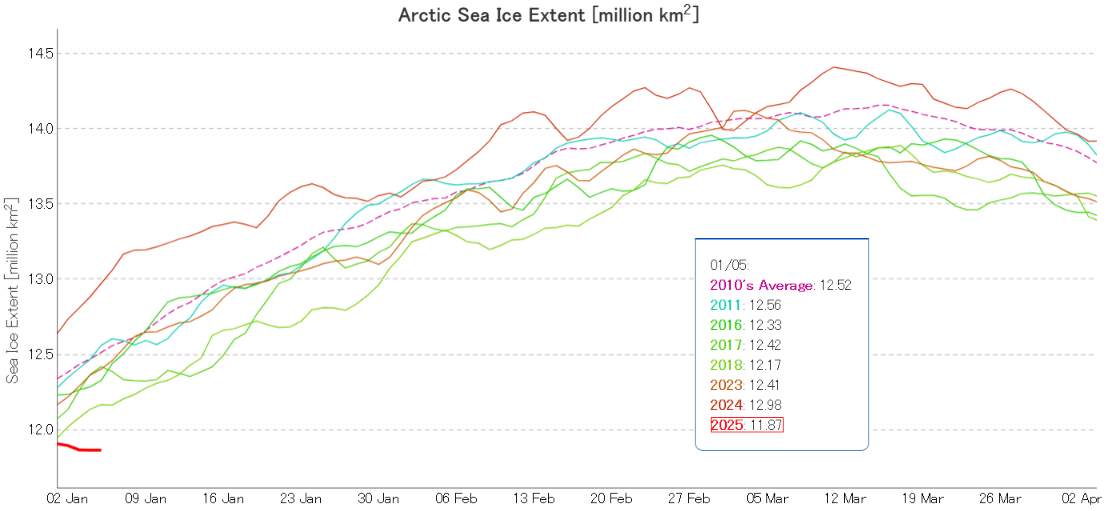
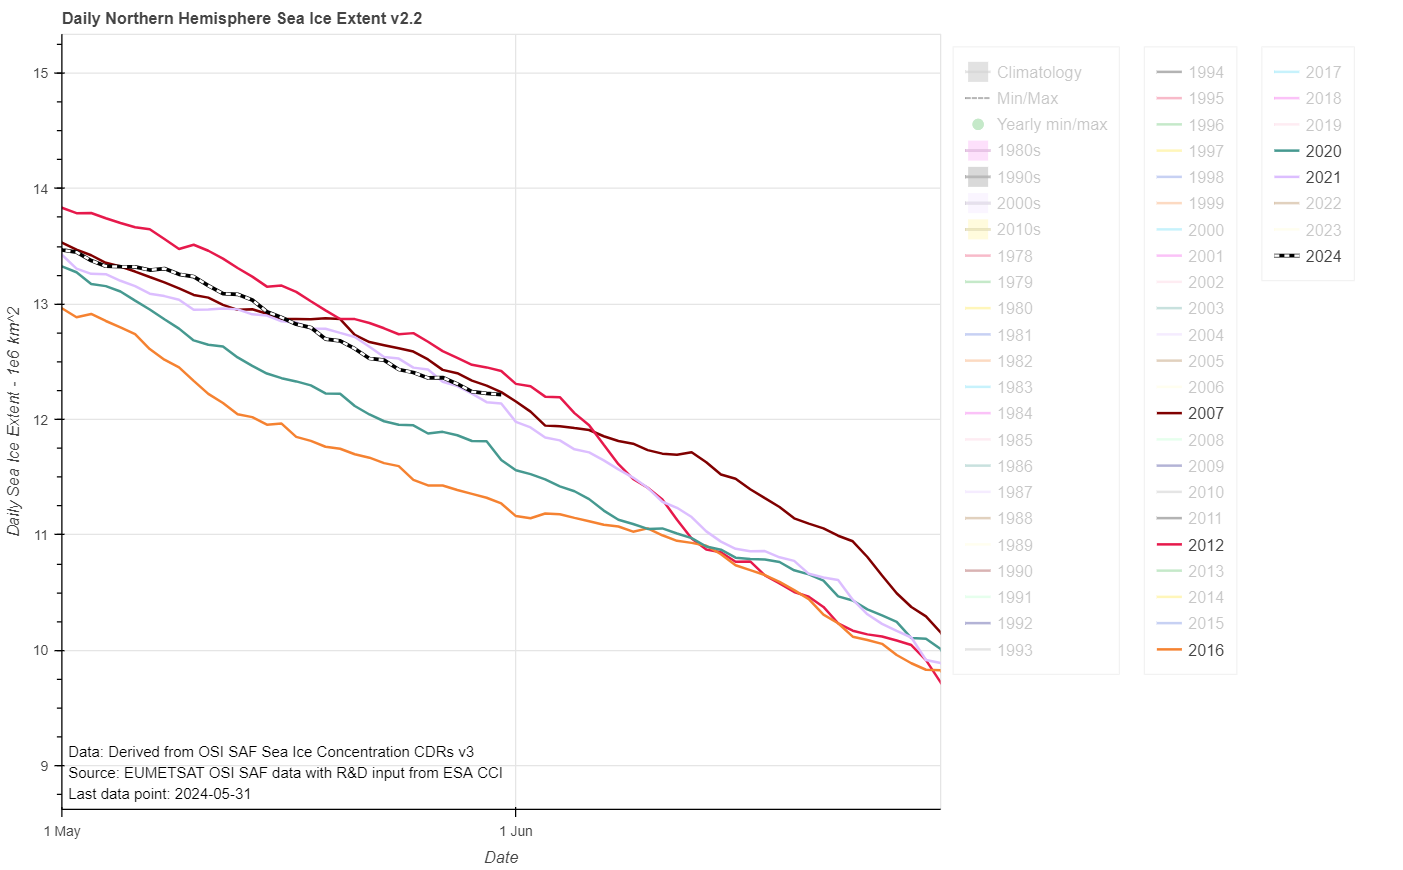
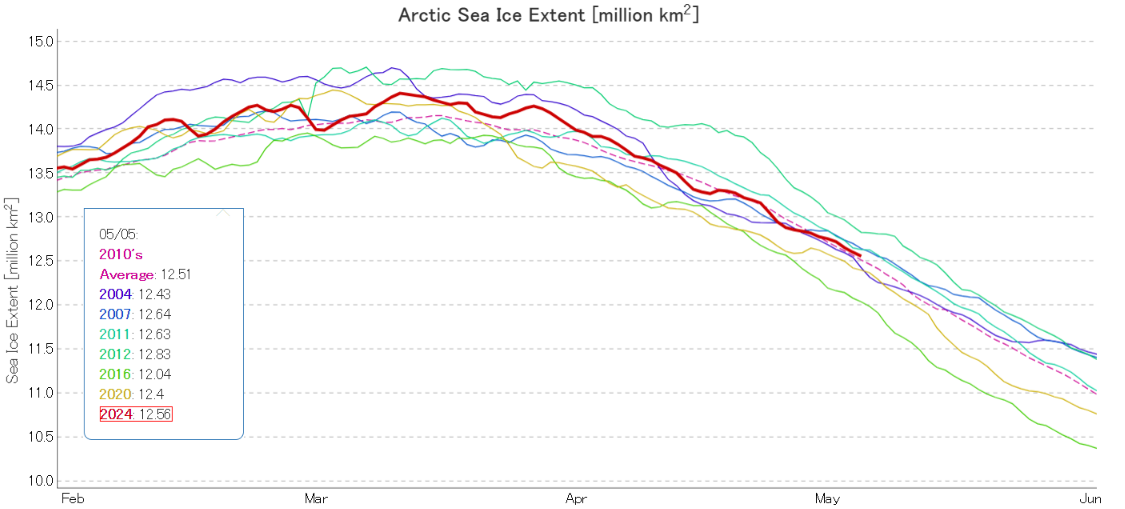
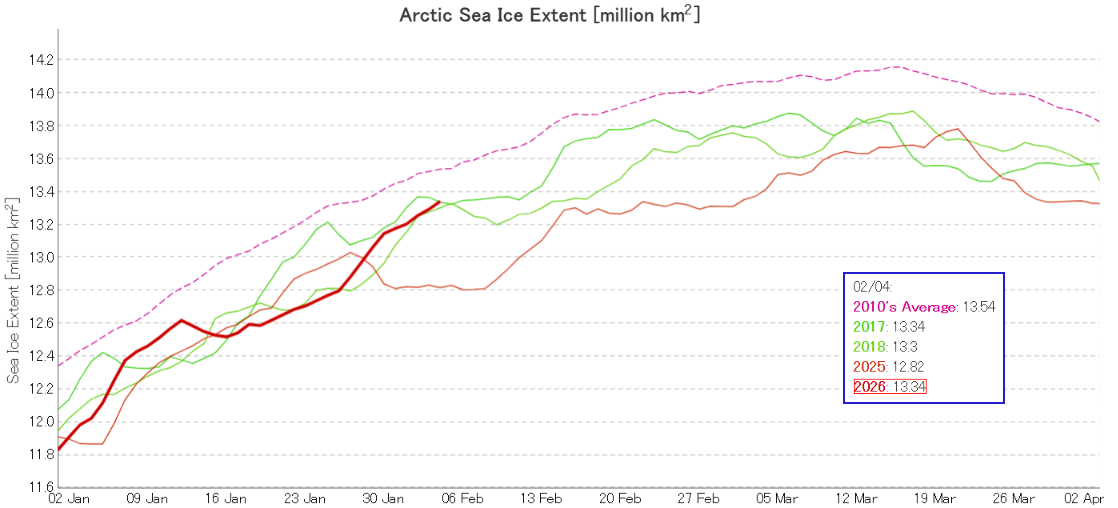
JAXA extent is currently 3rd lowest for the date, in a “statistical tie” with 2017:
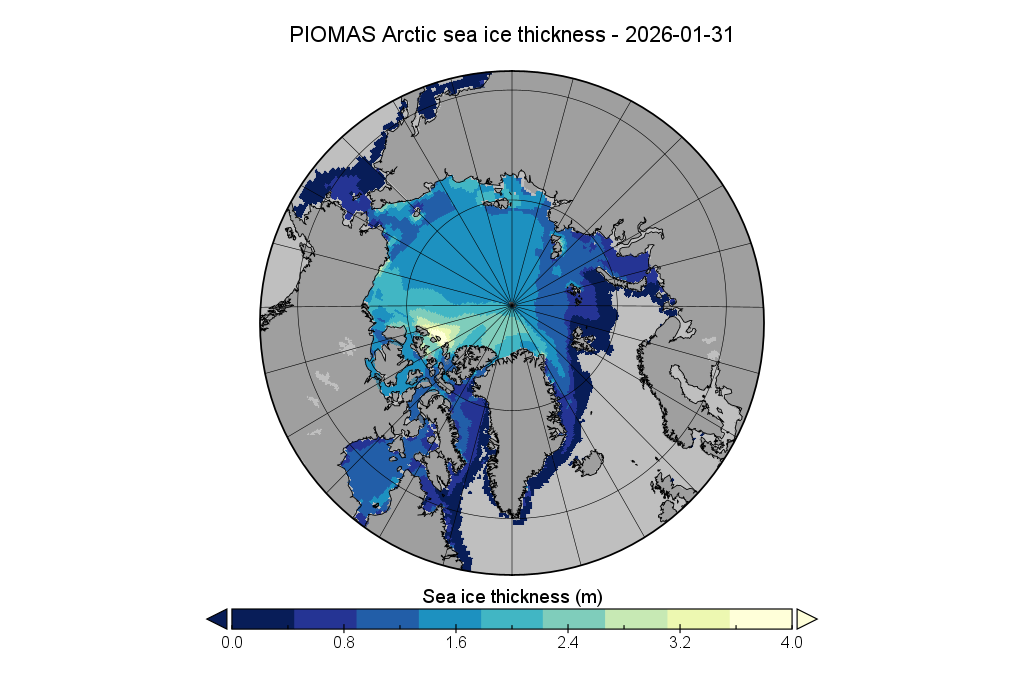
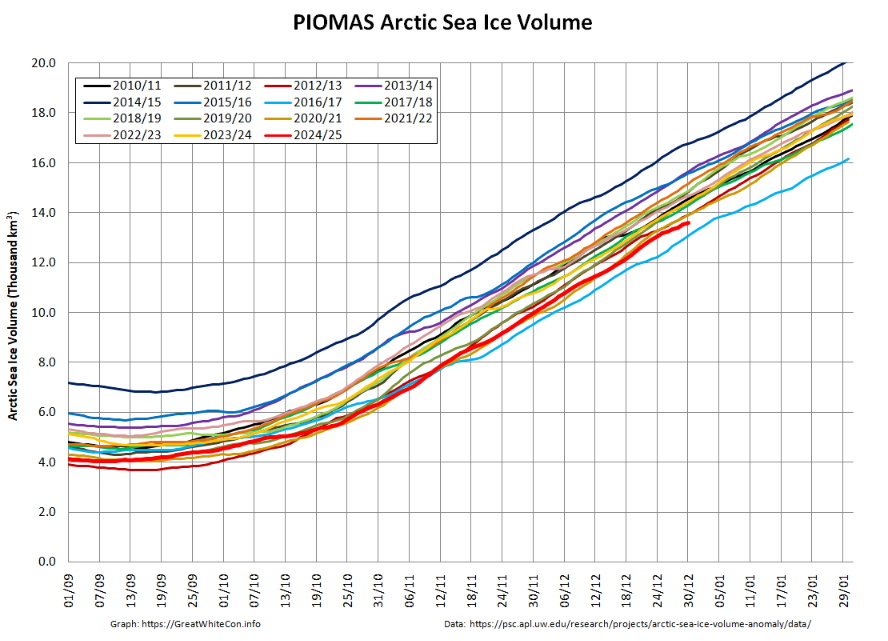
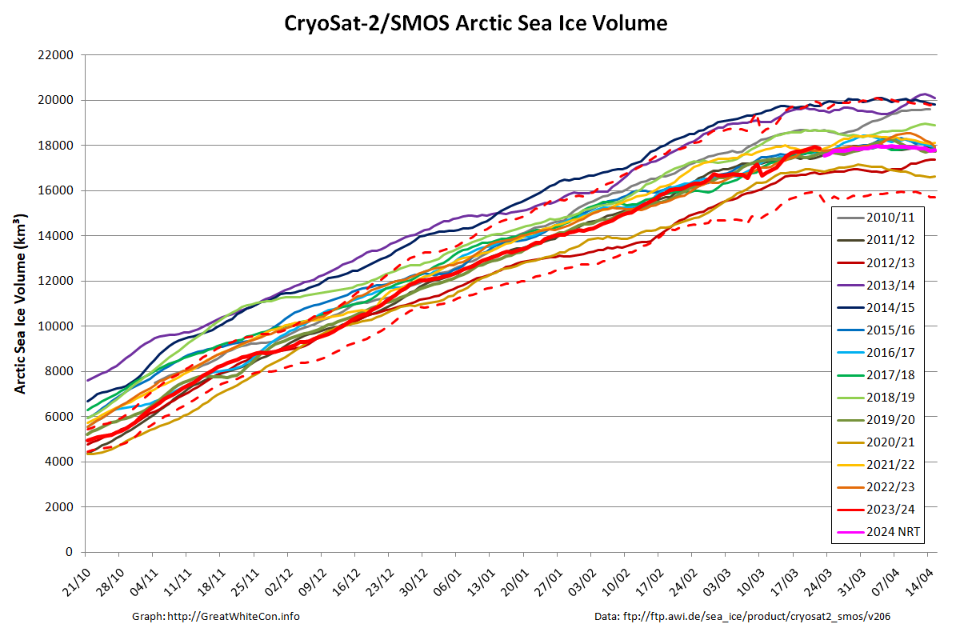
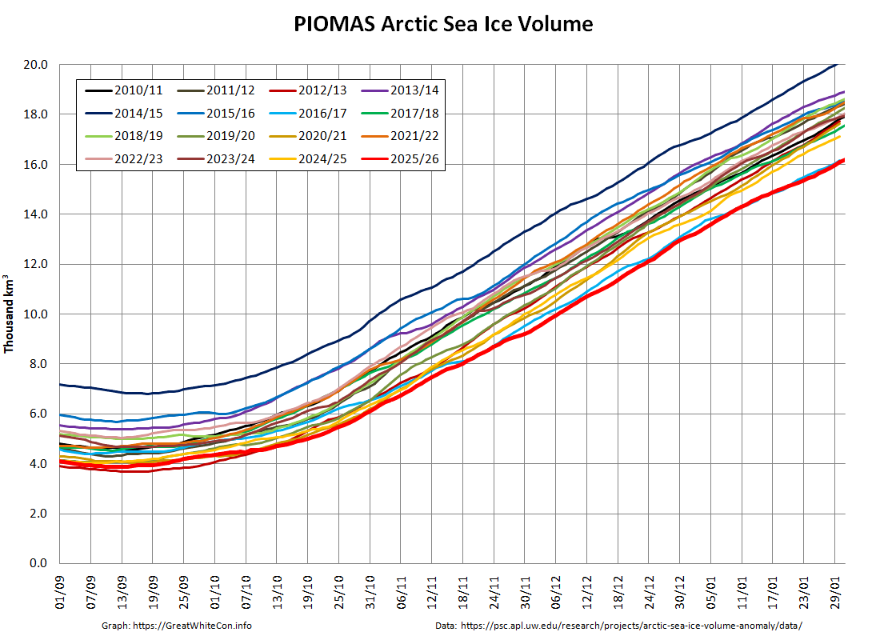
Looking at the third dimension next, PIOMAS volume was second lowest for the date by a whisker at the end of January:
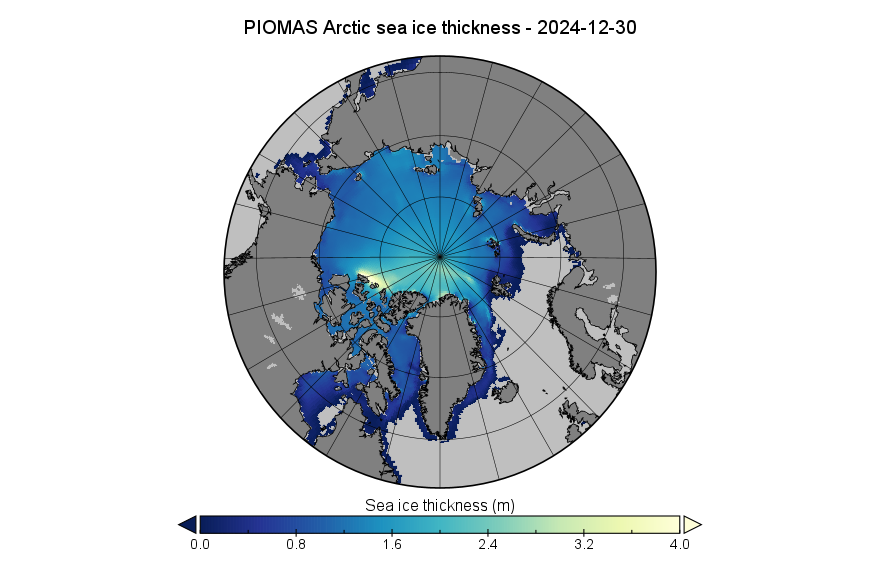
Here’s the associated sea ice thickness map: