We’ll come on to the Arctic in a moment, but at more temperate latitudes I am proud to announce that my Cornish alter ego has been officially outed as an “environmental campaigner” by the BBC. Moving pictures of yours truly, discussing drought rather than sea ice, are available via BBC iPlayer until around 18:30 this evening, possibly to UK residents only.
[Stop Press! A shorter version of Kirk England’s report on two potential desalination plants in Cornwall (also including my 15 seconds of fame!) is available here until around 22:30 this evening ]
Alternatively we have recorded our own moving pictures of this momentous event:
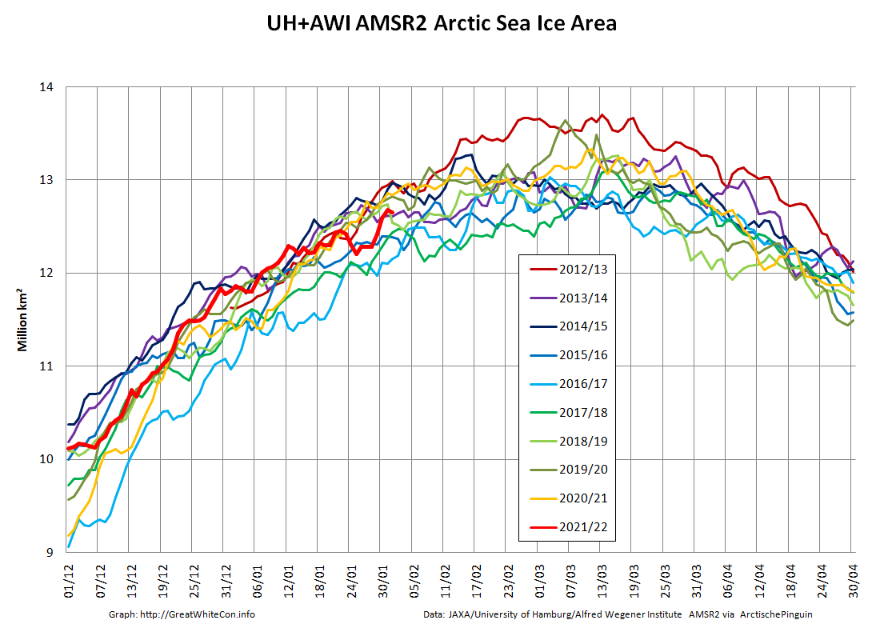
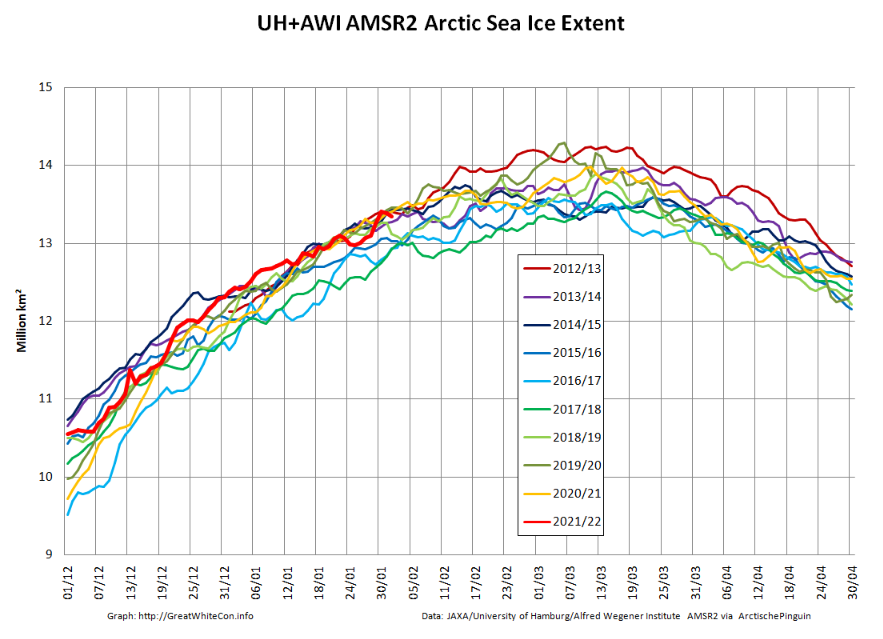
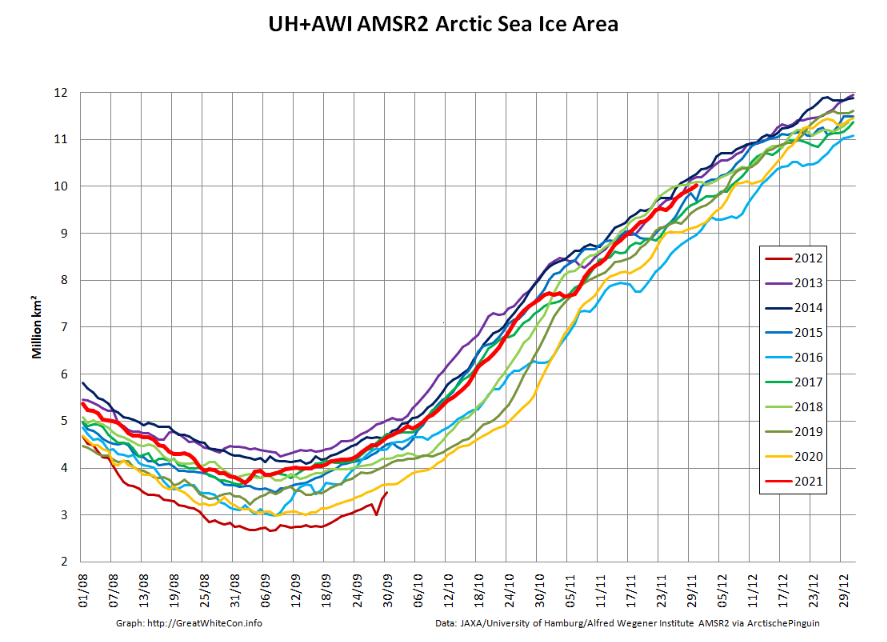
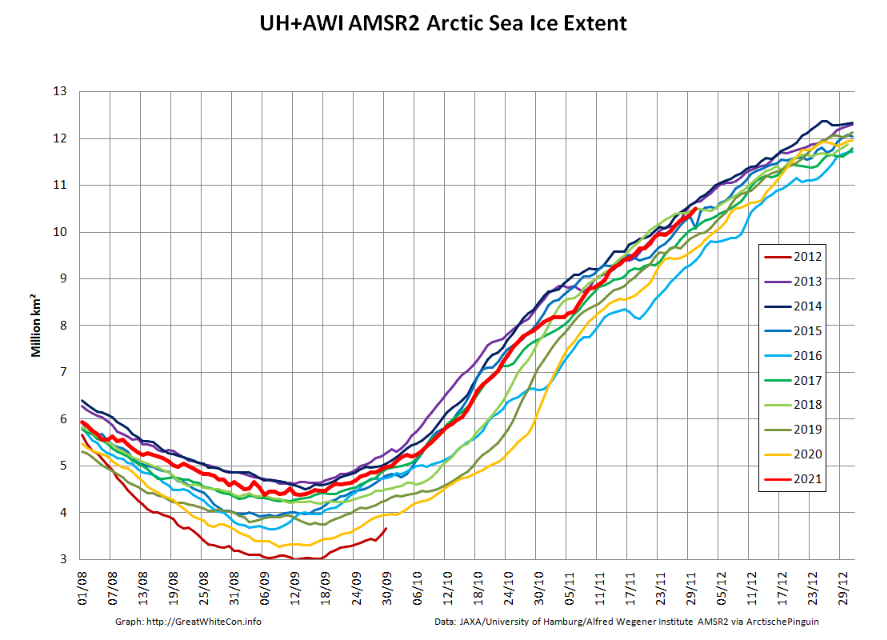
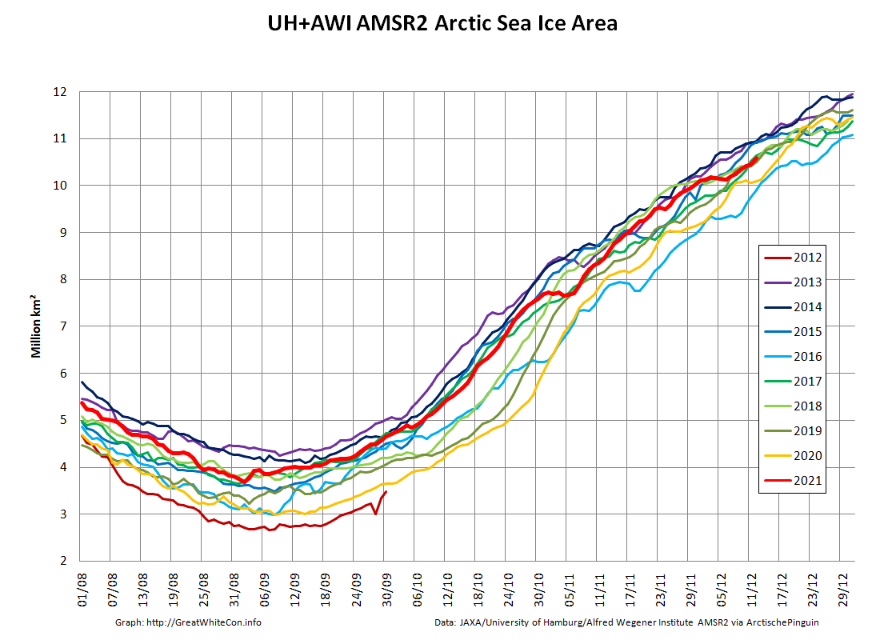
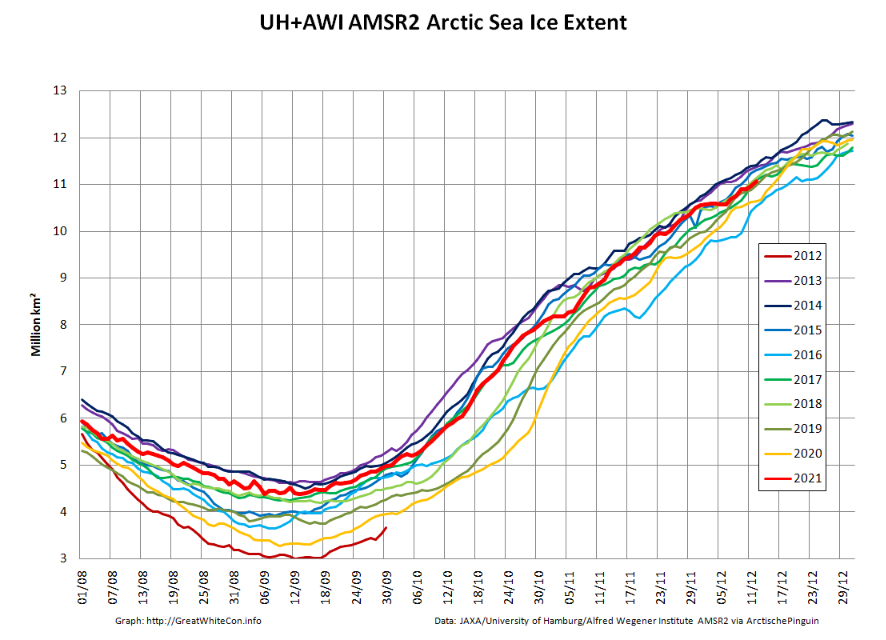
Following the “Great Arctic Winter Cyclone” towards the end of January, here are the latest high resolution AMSR2 area and extent graphs:
The sudden reduction in sea ice area due to the cyclone is very apparent, as is the subsequent refreeze of the affected area. Here’s an animation of AMSR2 concentration revealing more detail:
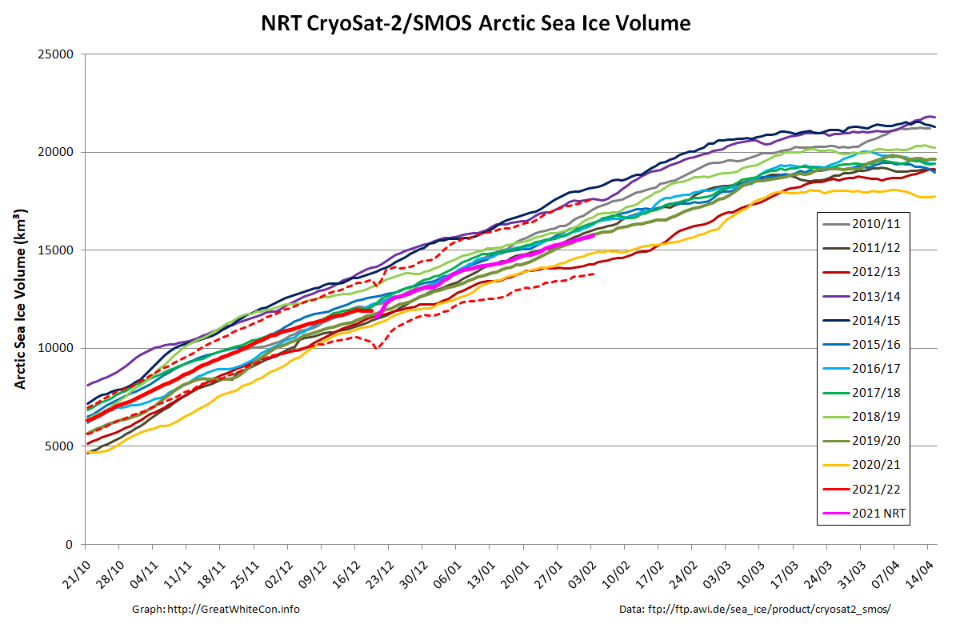
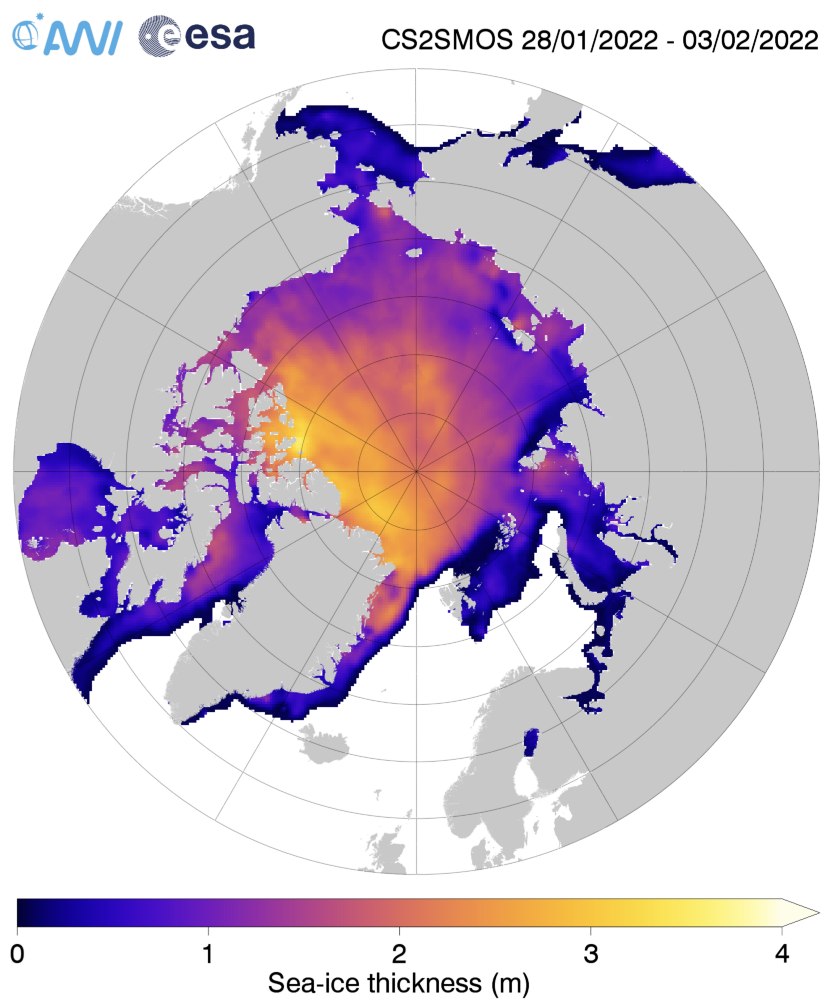
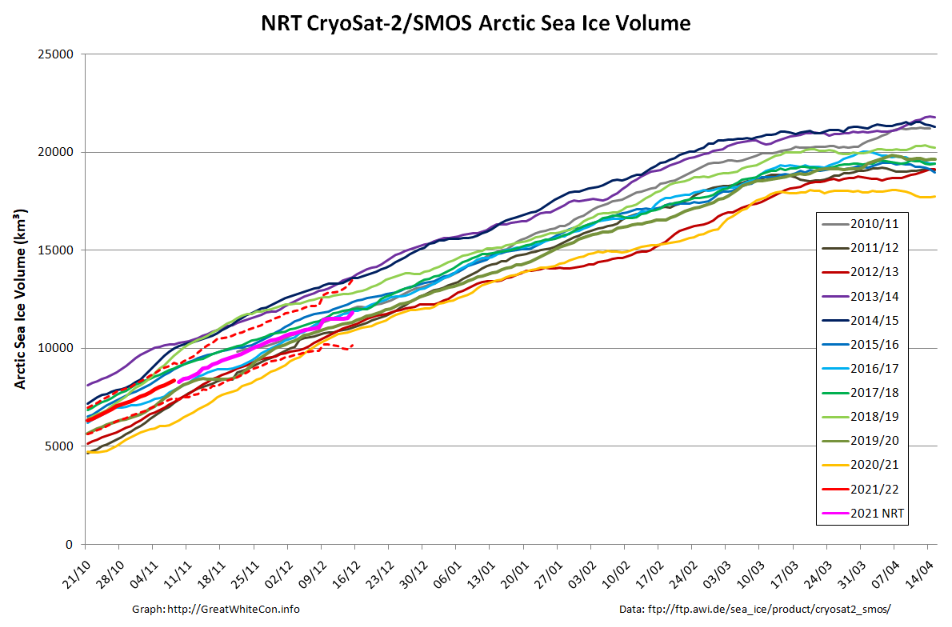
Here too is the latest AWI CryoSat-2/SMOS Arctic sea ice volume graph:
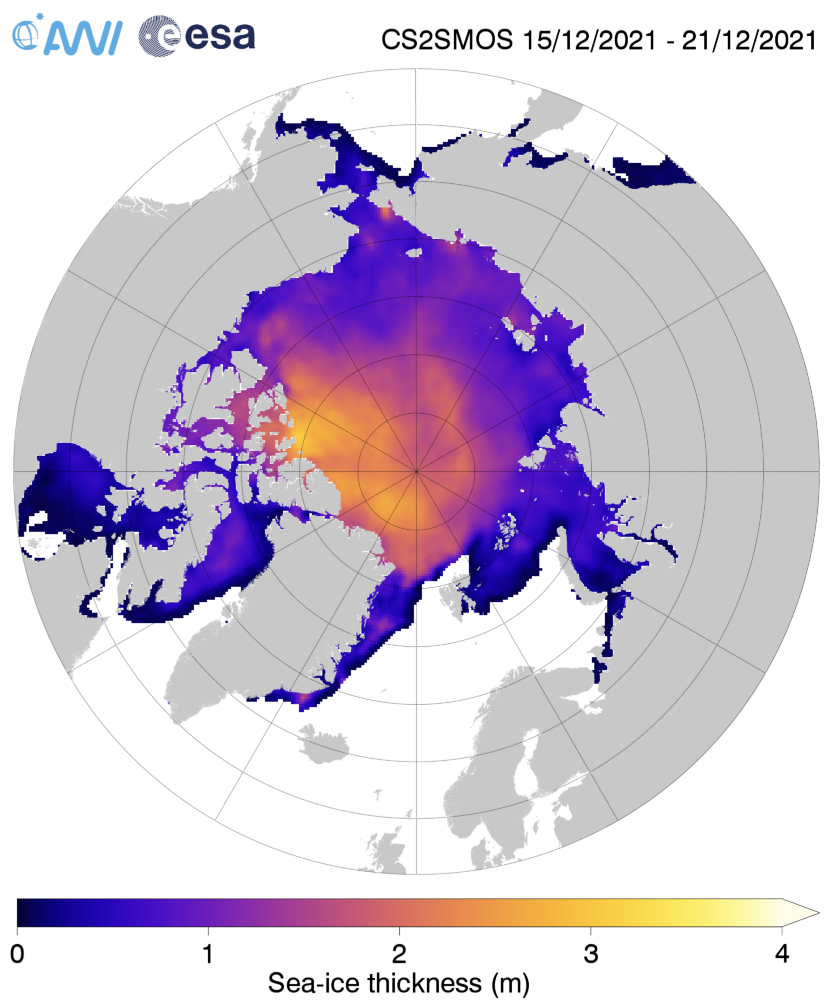
It doesn’t reveal a similar “blip” towards the end of January, suggesting that reduction in area was due to compaction rather than melt. The current AWI thickness map shows the freshly formed ice north east of Svalbard is still very thin:
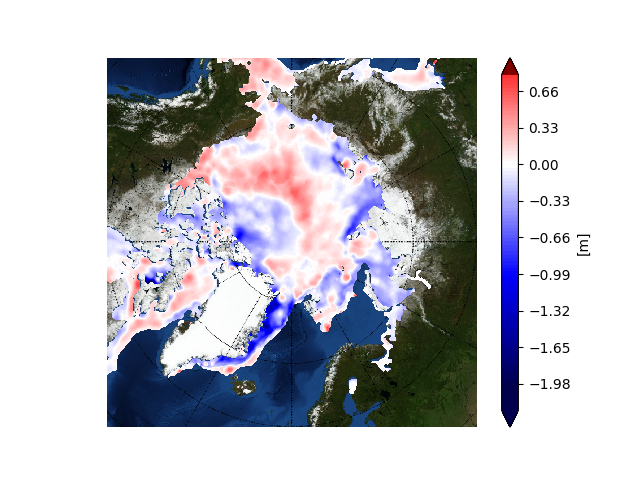
The latest thickness anomaly map from the Finnish Meteorological Institute shows that the ice which was exported from the Central Arctic via the Fram Strait is nevertheless still anomalously thin, although there is now an area of thicker ice north of Greenland:
Christmas is coming. Santa’s secret summer swimming pool has frozen over. The time has come for a new monthly Arctic update.
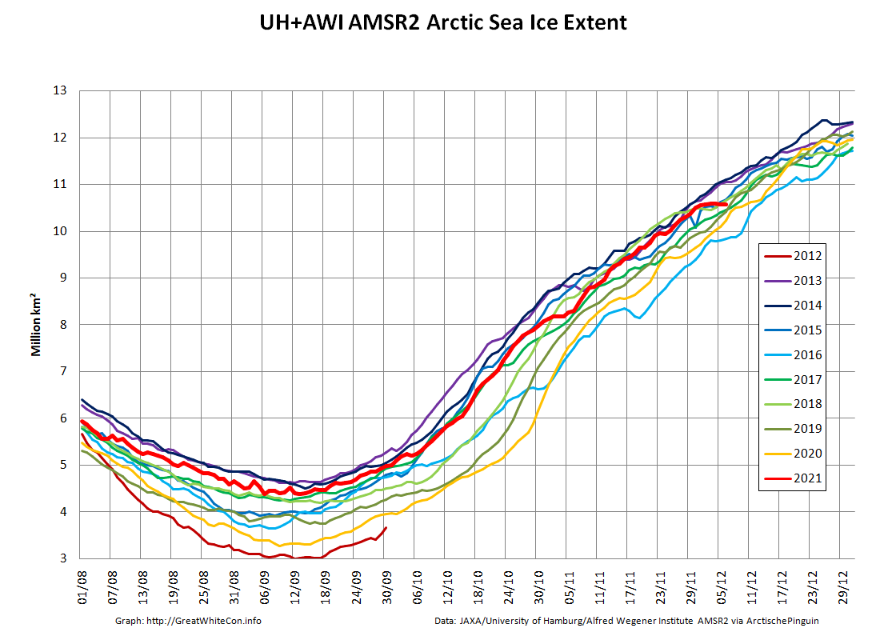
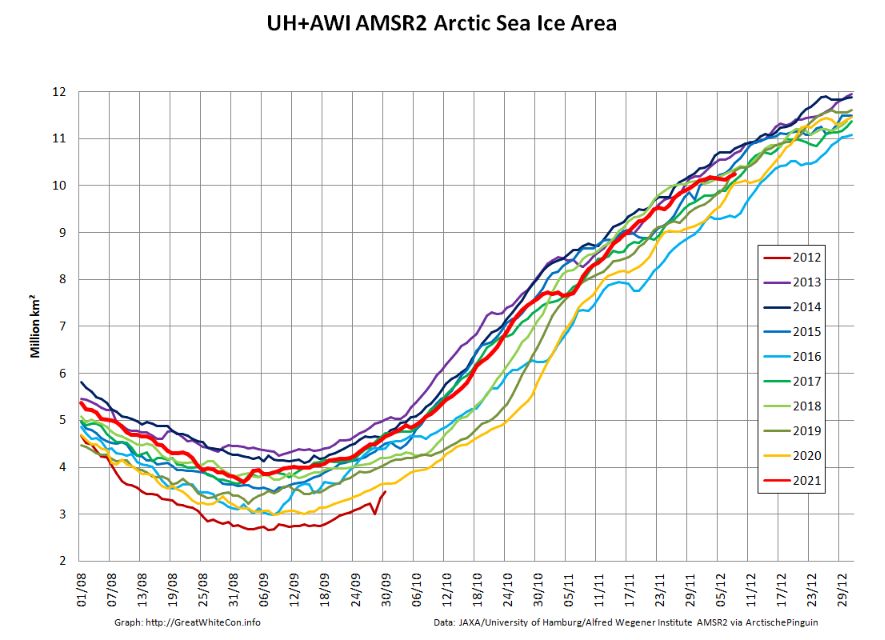
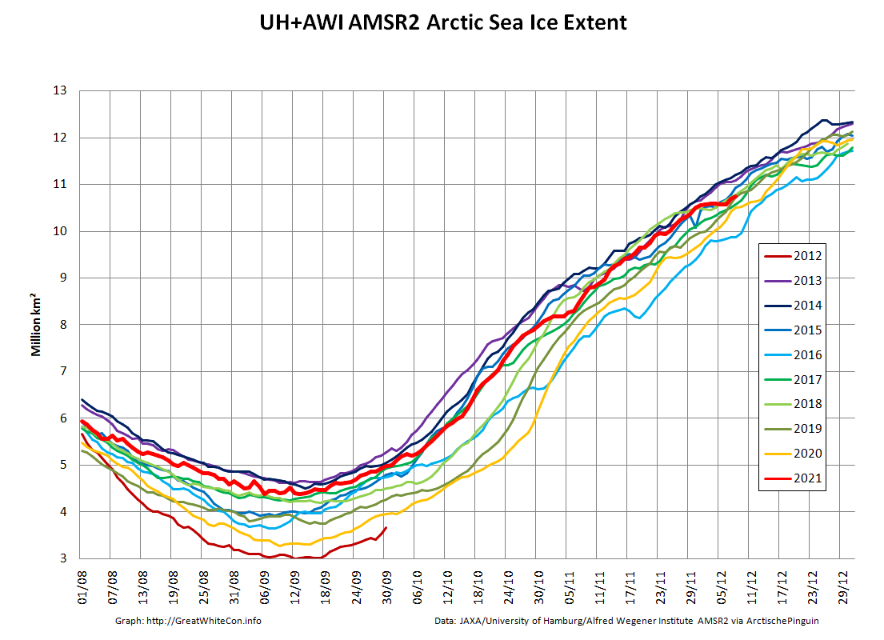
The JAXA/ADS/ViSHOP web site is undergoing maintenance for a week, so let’s start the festive season with a look at high resolution AMSR2 area and extent:
After a brief hiatus in early November both metrics are once again tracking within, but near the upper bound of the last 10 years.
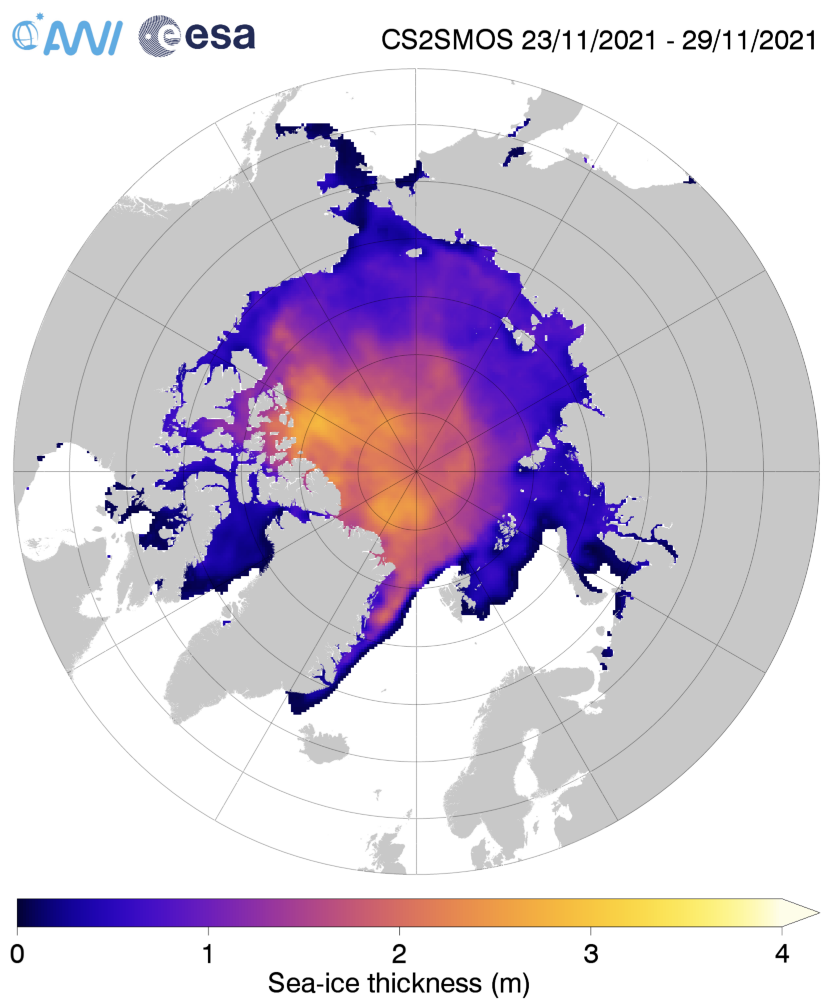
Next let’s take a look at the latest AWI CryoSat-2/SMOS thickness map:
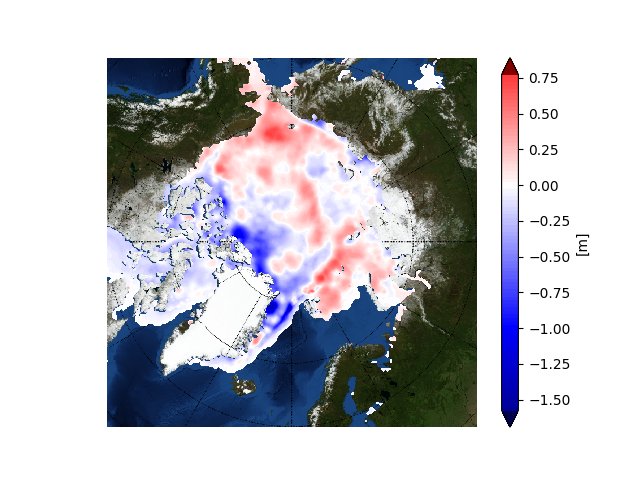
together with the anomaly map from the Finnish Meteorological Institute:
Still thinner than usual in the so called “last ice area” north of Greenland and Ellesmere Island, and thicker than usual on the Siberian side of the Arctic, particularly in the Chukchi Sea.
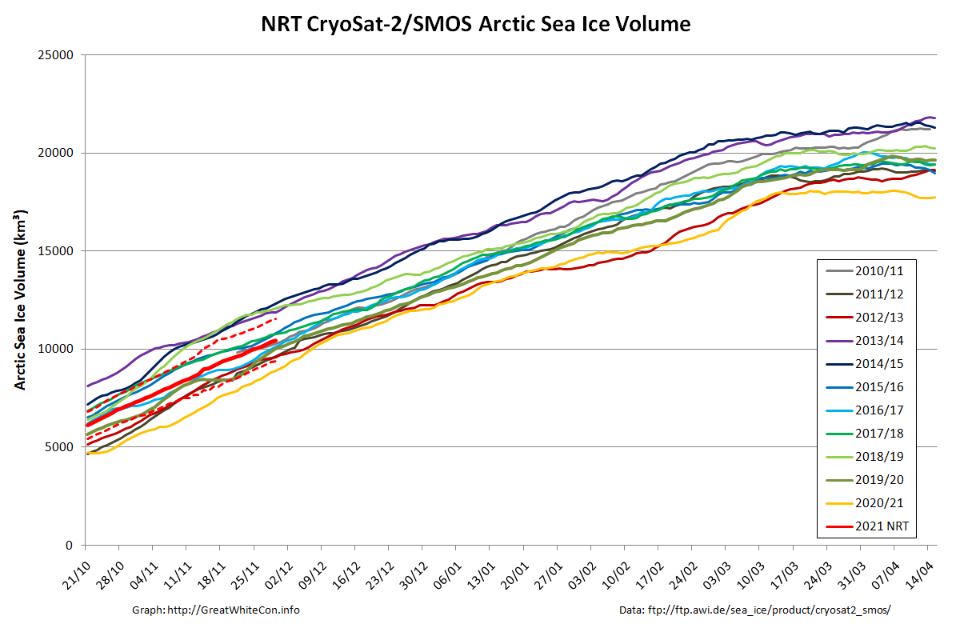
Finally, for the moment at least, here’s the latest CryoSat-2/SMOS volume graph:
Unlike the previous metrics, this particular one is close to the middle of the pack.
Sea ice extent increased at a faster than average pace through November and by the end of the month, extent was just within the interdecile range. Extent was above average in the Bering Sea, but Hudson Bay remained unusually ice free through the month.
The November 2021 monthly average extent was 9.77 million square kilometers (3.77 million square miles), which ranked tenth lowest in the satellite record. The 2021 extent was 930,000 million square kilometers (359,000 million square miles) below the 1981 to 2010 long-term average. Extent was higher than average in the Bering Sea, but is extremely low in Hudson Bay.
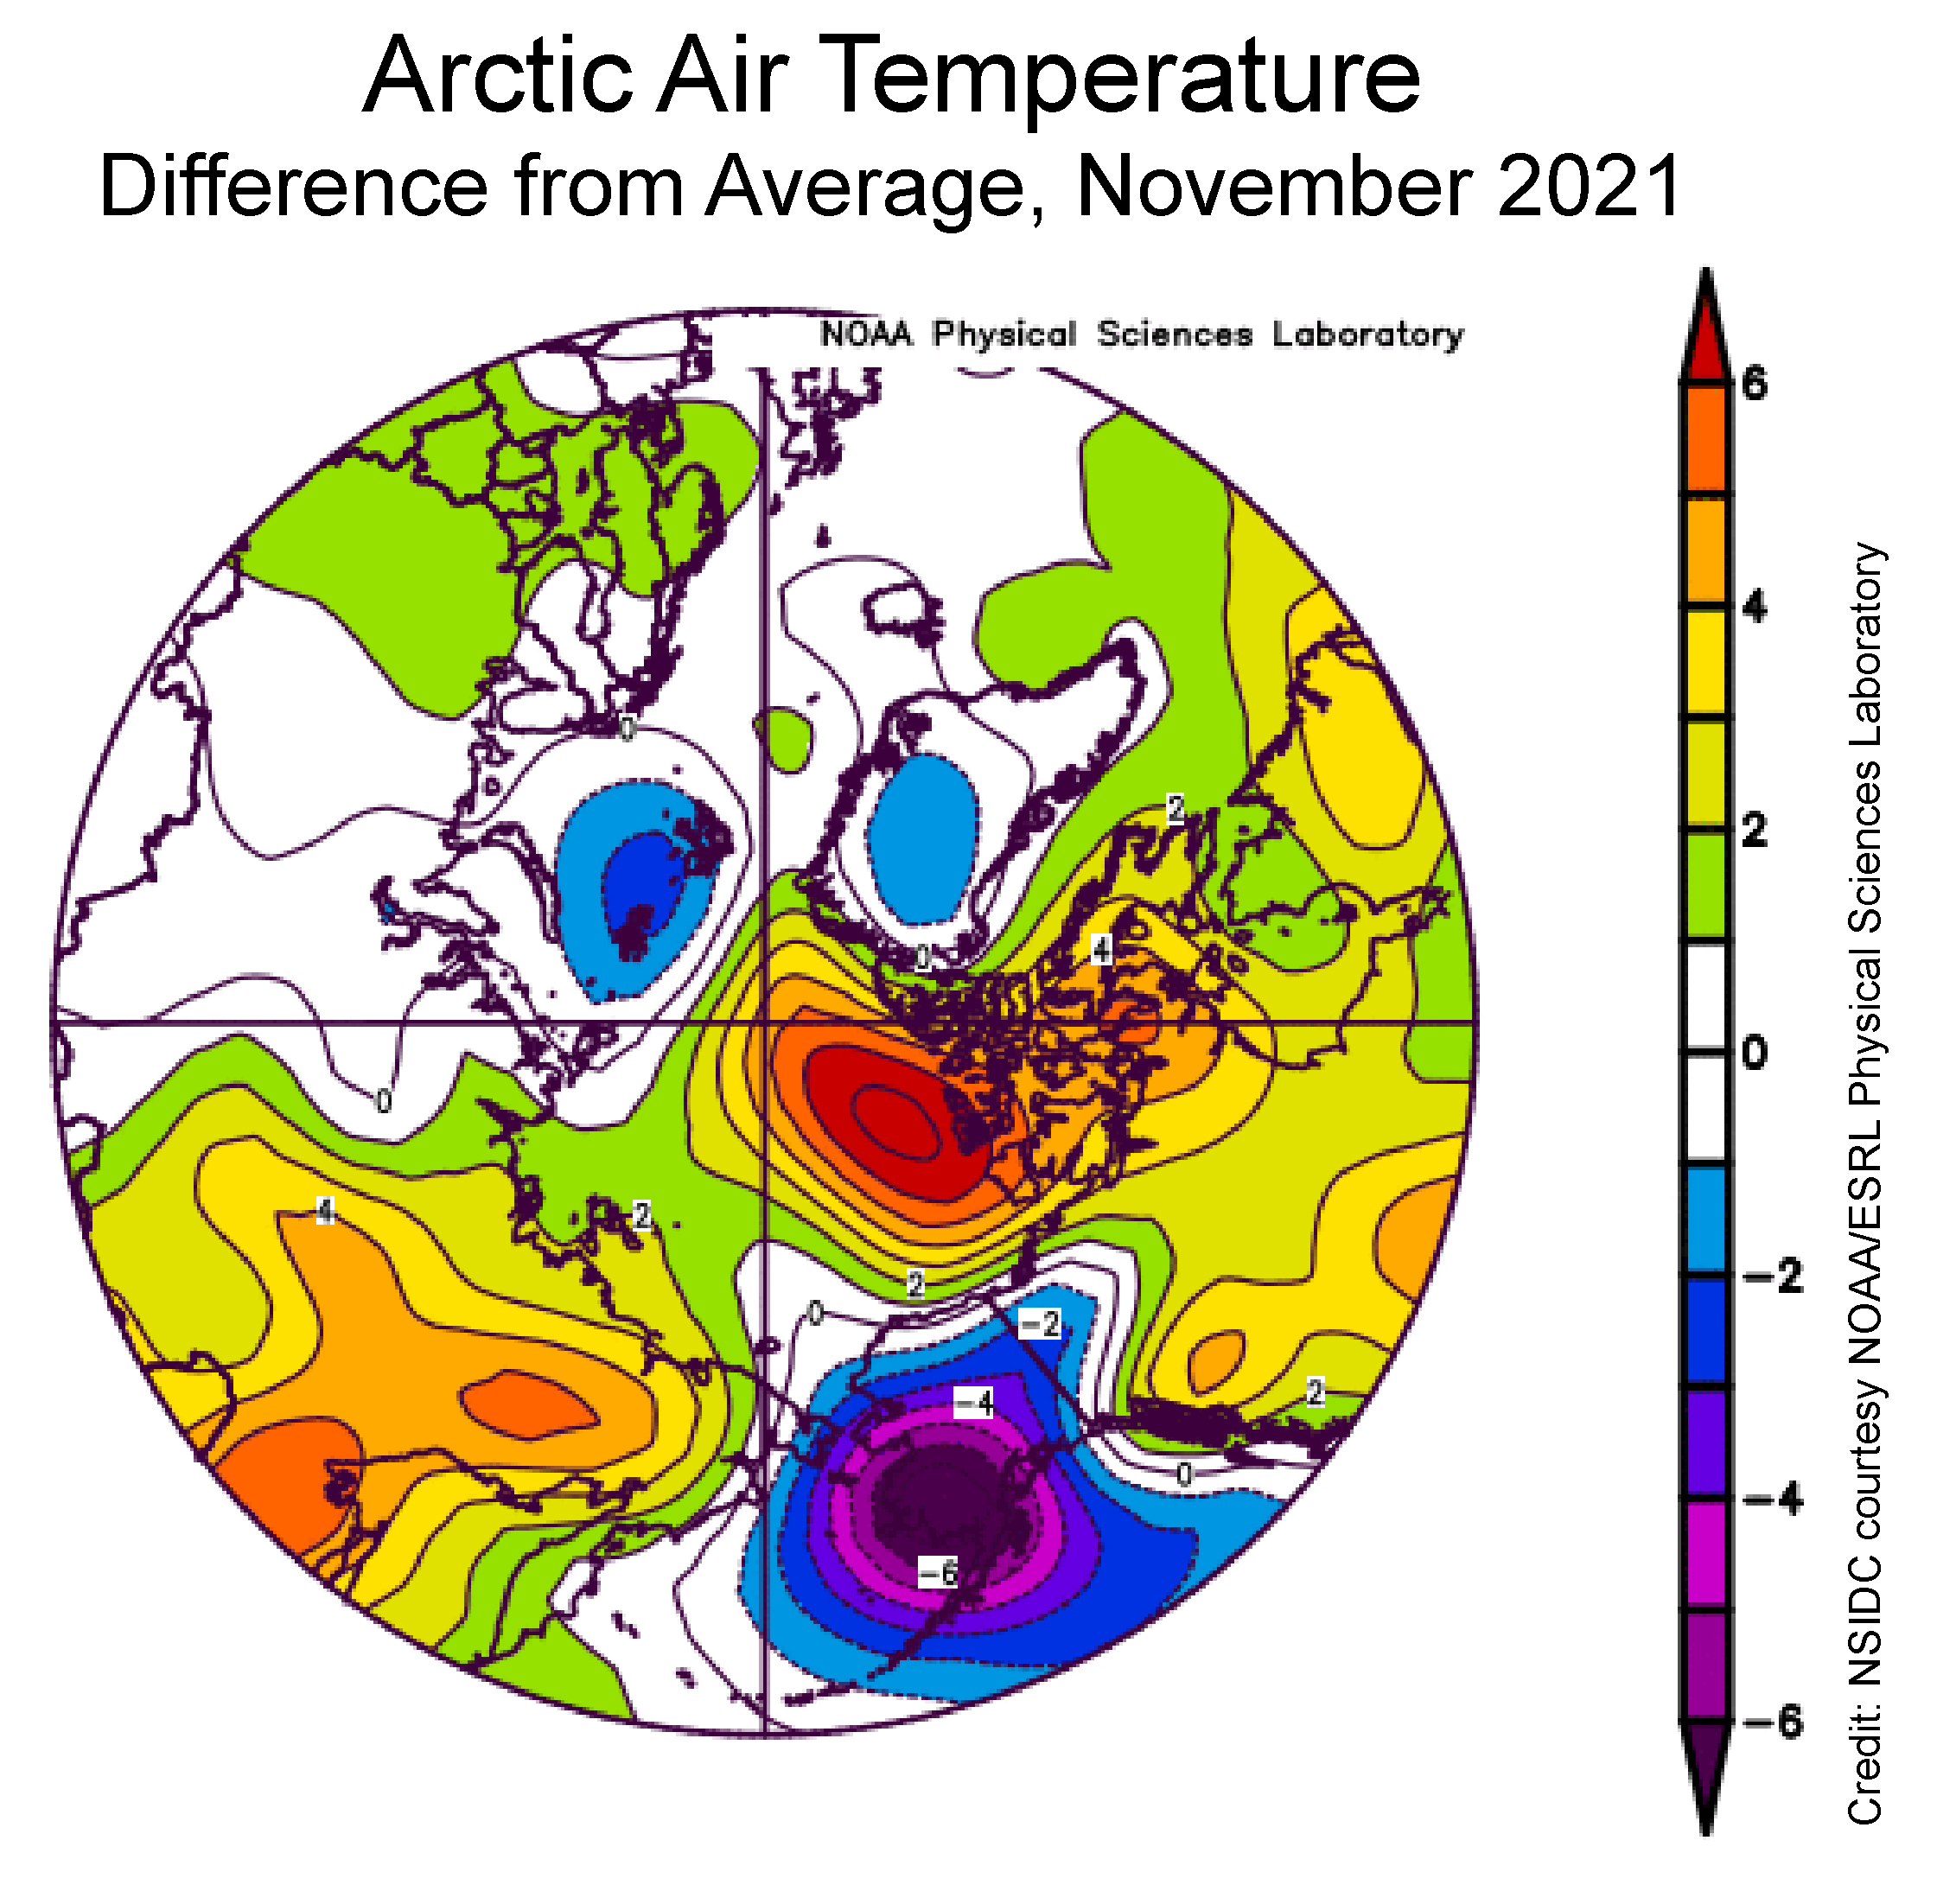
Air temperatures at the 925 millibar level (about 2,500 feet above the surface) were well above average north of the Canadian Archipelago, by as much as 6 degrees Celsius. Conversely, temperatures over southwest Alaska and the eastern sector of the Bering Sea were as much as 6 degrees Celsius below average:
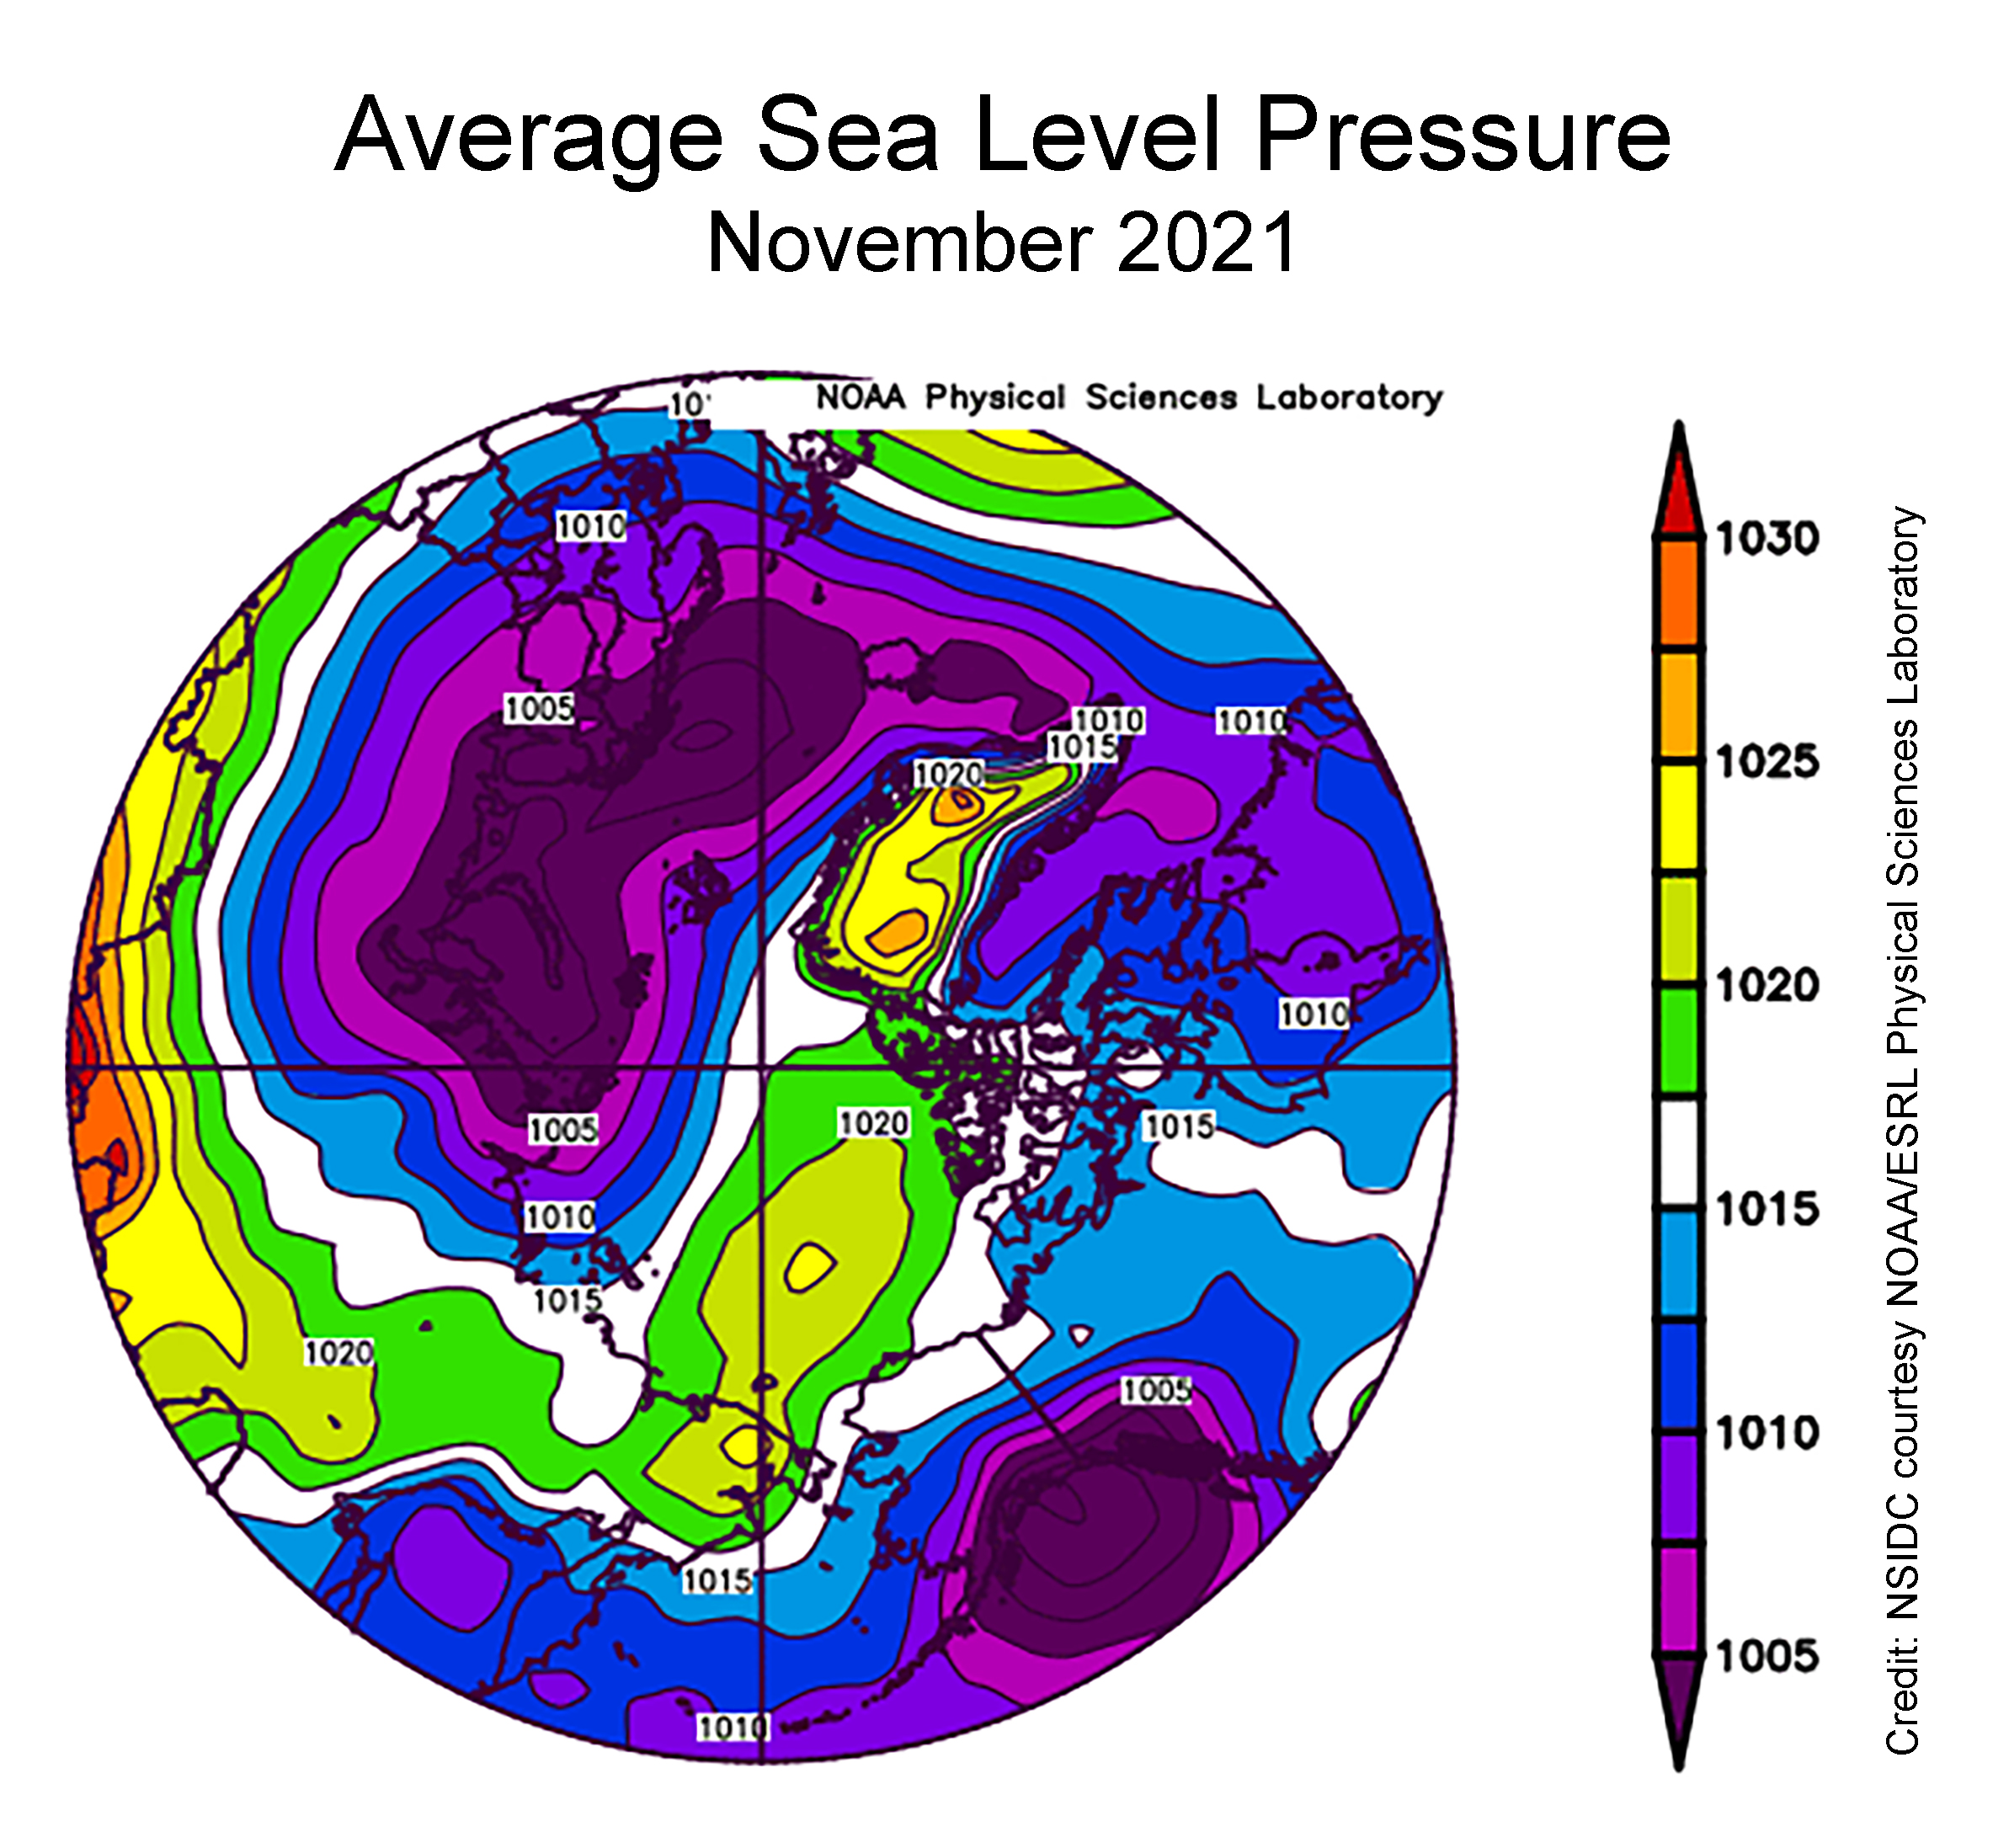
The sea level pressure pattern for November featured widespread low pressure over the Atlantic side of the Arctic and extending into the Barents and Kara Seas, paired with a moderately strong Beaufort Sea High. Strong low pressure over the Gulf of Alaska resulted in a circulation pattern in the eastern Bering Sea that brought cold air from the north. This pattern was favorable for sea ice growth, and can explain the above average ice extent in the region:
[Edit – December 7th]
Since the start of December high resolution AMSR2 extent has been flatlining:
Sea ice area has even declined slightly over the past few days:
Here too is an animation created by Uniquorn on the Arctic Sea Ice Forum using AWI ASMR2 data to reveal ice movement through the Nares Strait during December:
[Edit – December 9th]
The JAXA/ADS/ViSHOP web site is down again, so let’s take another look at high resolution AMSR2 area and extent:
It seems that the “brief hiatus” is over, and extent is now in a “statistical tie” with 2018/19 at 4th lowest for the date amongst recent year.
[Edit – December 13th]
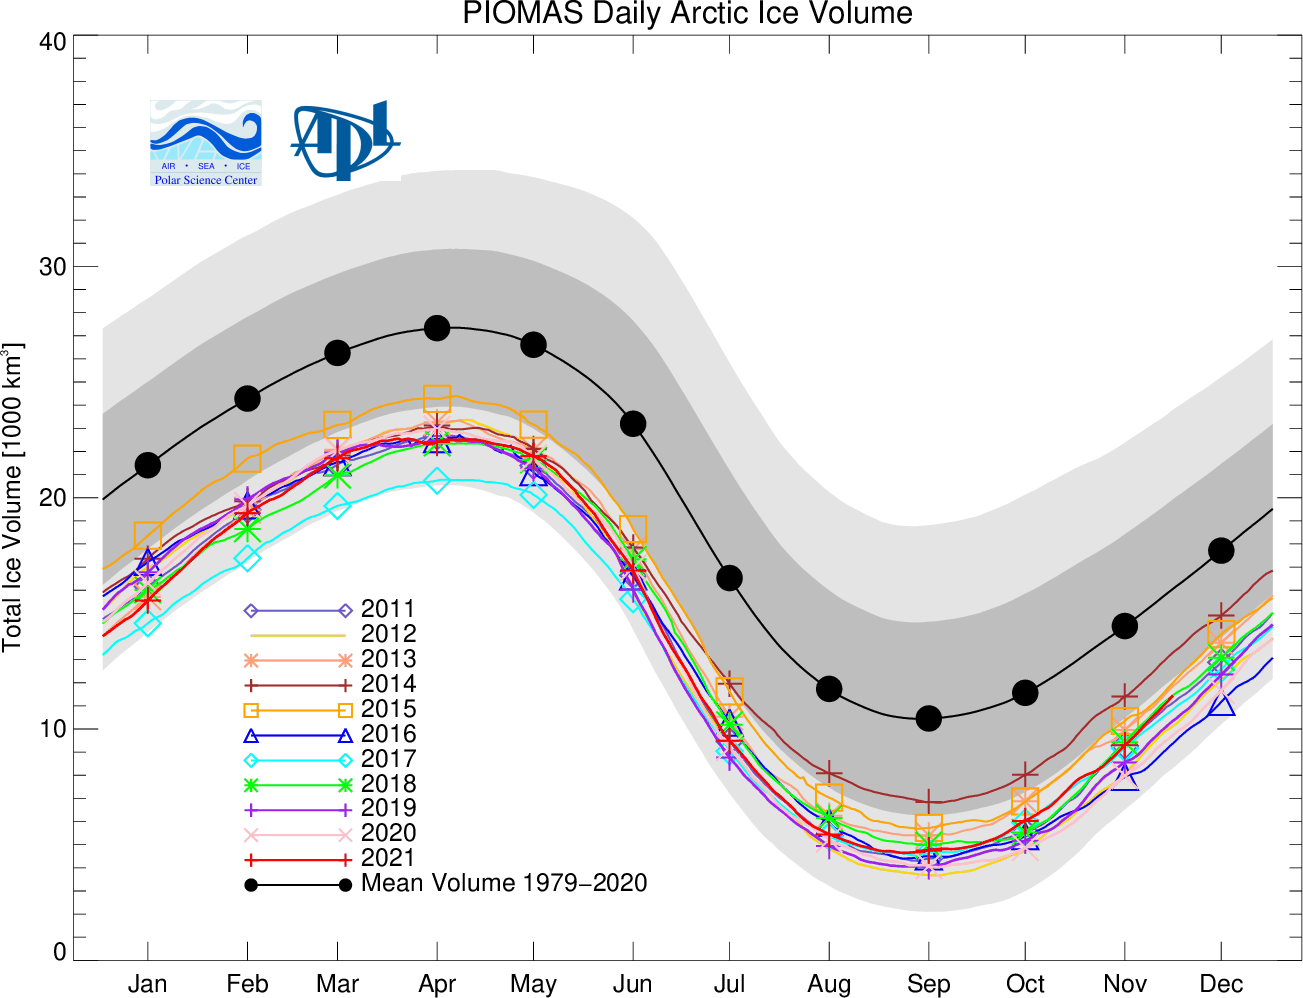
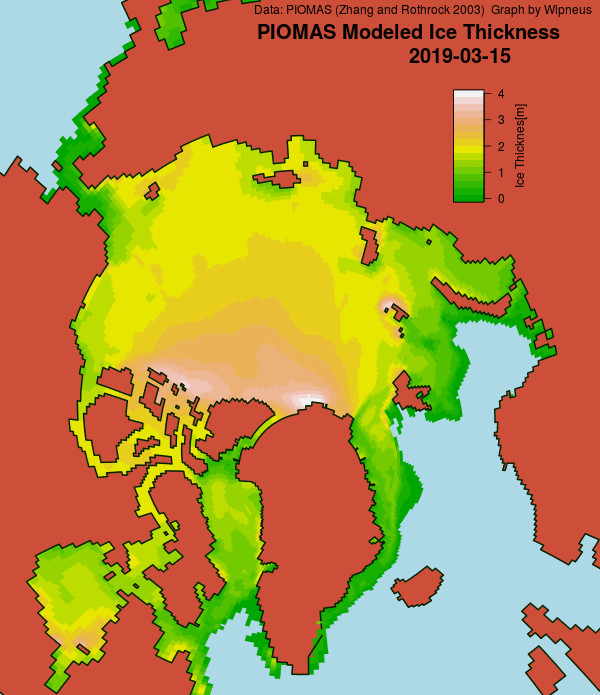
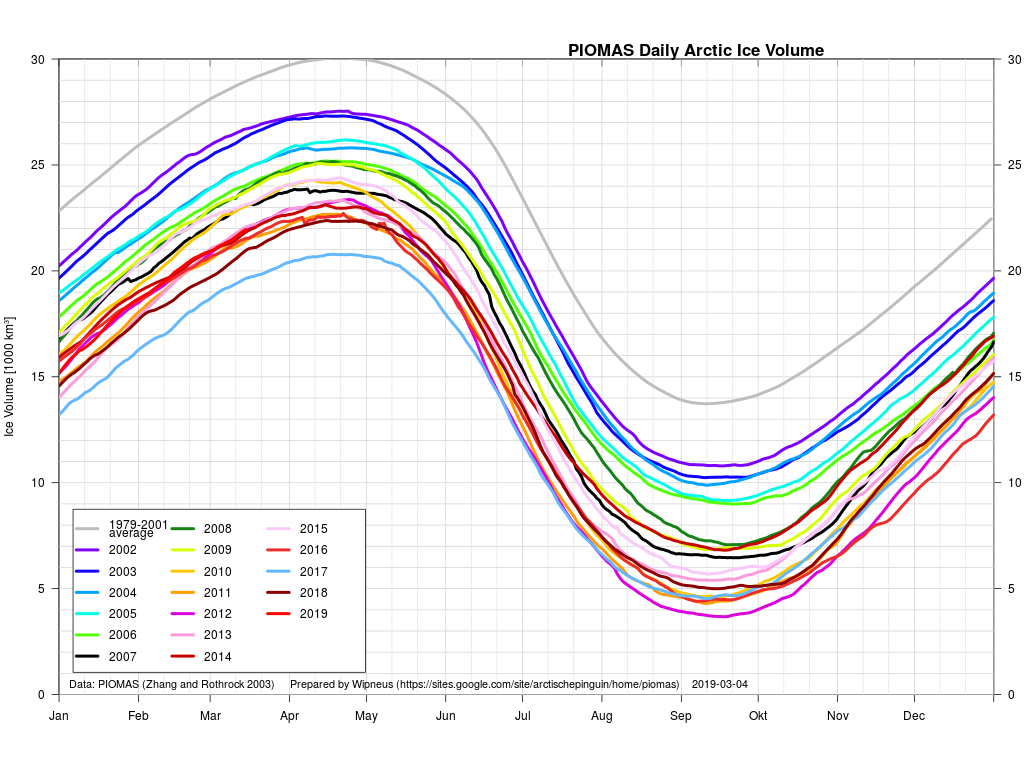
The PIOMAS Arctic sea ice volume data for November 2021 has been released:
Average Arctic sea ice volume in November 2021 was 7,830 km3. This value is the 7th lowest on record for November, about 1600 km3 above the record set in 2016. Monthly ice volume was 61% below the maximum in 1979 and 45% below the mean value for 1979-2020. Average November 2021 ice volume was about one sigma above the 1979-2020 trend line. October saw relative rapid ice growth for recent years bringing the mean ice thickness (above 15 cm thickness) above the recent low values:
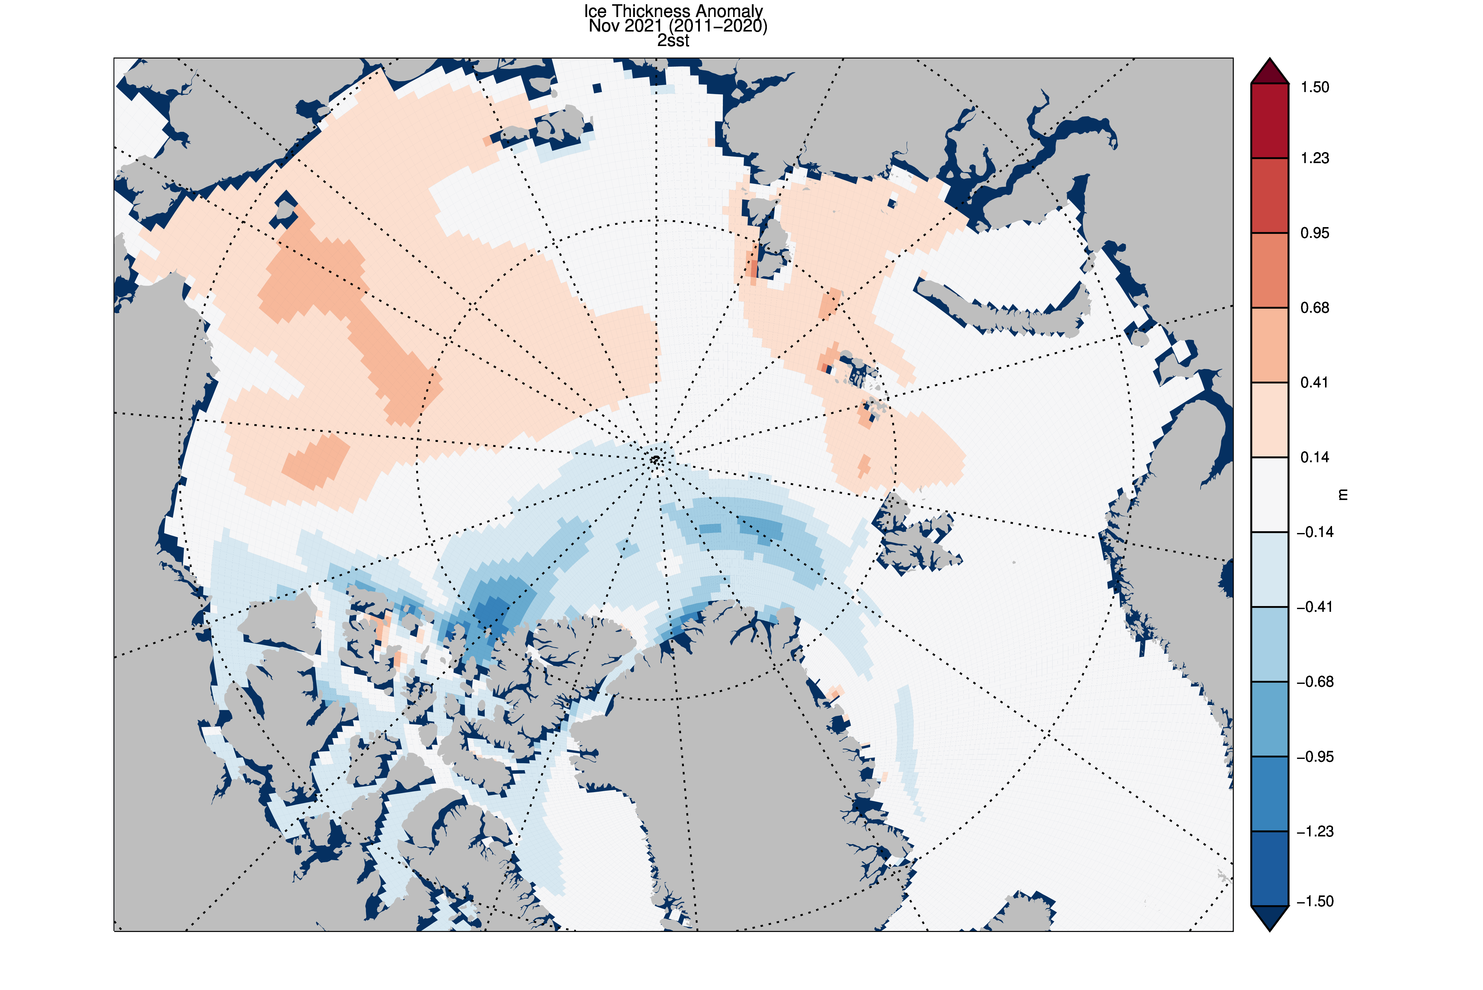
The ice thickness anomaly map for November 2021 relative to 2011-2020 continues to show anomalies divided into positive and a negative halves with areas of positive anomalies increasing since the two prior months. Negative anomalies stretching from North of Greenland and along the Canadian Archipelago across the Eastern Arctic into the Barents Sea. Areas North of Greenland again feature very low ice thickness as in prior years (see our recent paper). Positive anomalies are notable in the Beaufort and Chukchi seas due to advection of thicker older ice into the areas during the previous winter (See recent paper on this). The Alaskan summer has also been relatively cold contributing to unusually thick ice in this area:
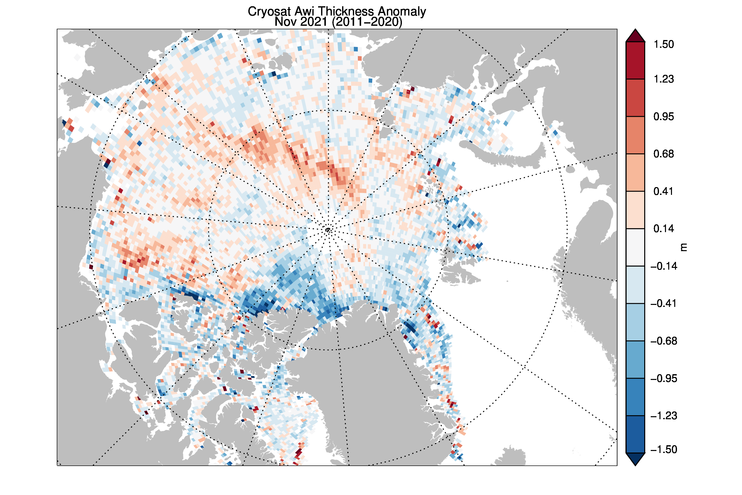
CryoSat-2 ice thickness shows a similar picture sea ice thickness anomalies but with the maxima slightly displaced which maybe due to temporal sampling of the composite:
The JAXA web site is still down, so here’s another set of high resolution AMSR2 graphs:
[Edit – December 14th]
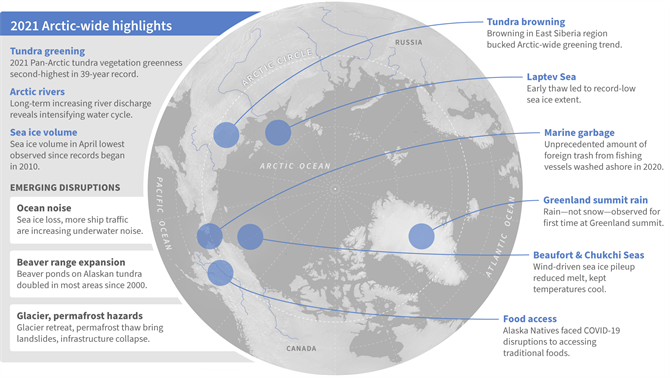
NOAA have just released their 2021 Arctic Report Card. Here’s the introductory video:
“Everybody knows [the Arctic] is a canary when it comes to climate change,” says Peter Jacobs, a climate scientist at NASA’s Goddard Space Flight Center, who presented the work on 13 December at a meeting of the American Geophysical Union. “Yet we’re misreporting it by a factor of two. Which is just bananas.”
Jacob’s co-authors include researchers who oversee several influential global temperature records, and they noted the faster Arctic warming as they prepared to release the global temperature average for 2020. NASA’s internal peer reviewer challenged the higher figure, suggesting the scientific literature didn’t support it. But the researchers have found the four times ratio holds in record sets from both NASA (3.9) and the United Kingdom’s Met Office (4.1), and they hope to soon include the Berkeley Earth record. (Their work also has company: In July, a team at the Finnish Meteorological Institute posted a preprint also arguing for the four times figure.)
The researchers found Arctic warming has been underestimated for a couple of reasons. One is climate scientists’ tendency to chop each hemisphere into thirds and label the area above 60°N as the “Arctic”—an area that would include, for example, most of Scandinavia. But the true definition of the Arctic is defined by Earth’s tilt. And, as has been known for centuries, the Arctic Circle is a line starting at 66.6°N. When researchers lump in the lower latitudes, “you’re diluting the amount of Arctic warming you’re getting,” Jacobs says. “That is not a trivial thing.”
The other difference is the choice of time periods over which the warming rate is calculated. Jacobs and his colleagues focused on the past 30 years, when a linear warming trend emerged for the Arctic. Analyses that look at longer term trends see less divergence between the Arctic and the world.
[Edit – December 23rd]
Here is the latest CryoSat-2/SMOS volume graph, now including some reanalysed data which seems to have come in slightly higher than the earlier “near real time” numbers:
Plus the AWI thickness map:
Further discussion of the divergence between volume and extent continues in the new New Year 2022 thread:
Since the FMI make the gridded data available as well as that visualisation, here’s a closer look at the Bering/Chukchi area:
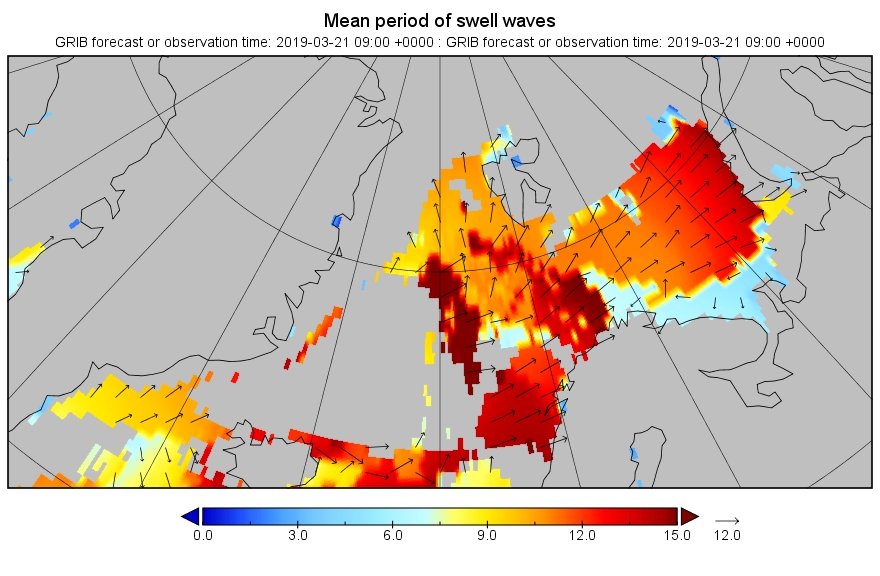
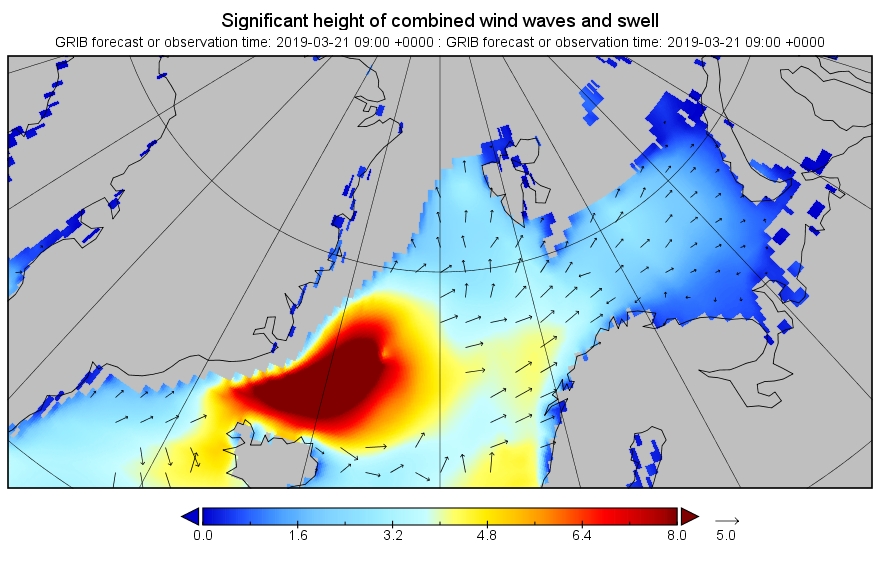
There’s an awful lot of thin ice in the region ripe for rapid melting now that the sun is shining down for a rapidly increasing number of hours per day. Over on the other side of the North Pole there’s also some significant swell forecast to hit the Atlantic edge of the Arctic ice pack. Here’s the current WaveWatch III forecast for 09:00 UTC tomorrow morning:
Finally, for the moment at least, here are the current Arctic wide high resolution AMSR2 sea ice area and extent graphs:
[Edit – March 22nd]
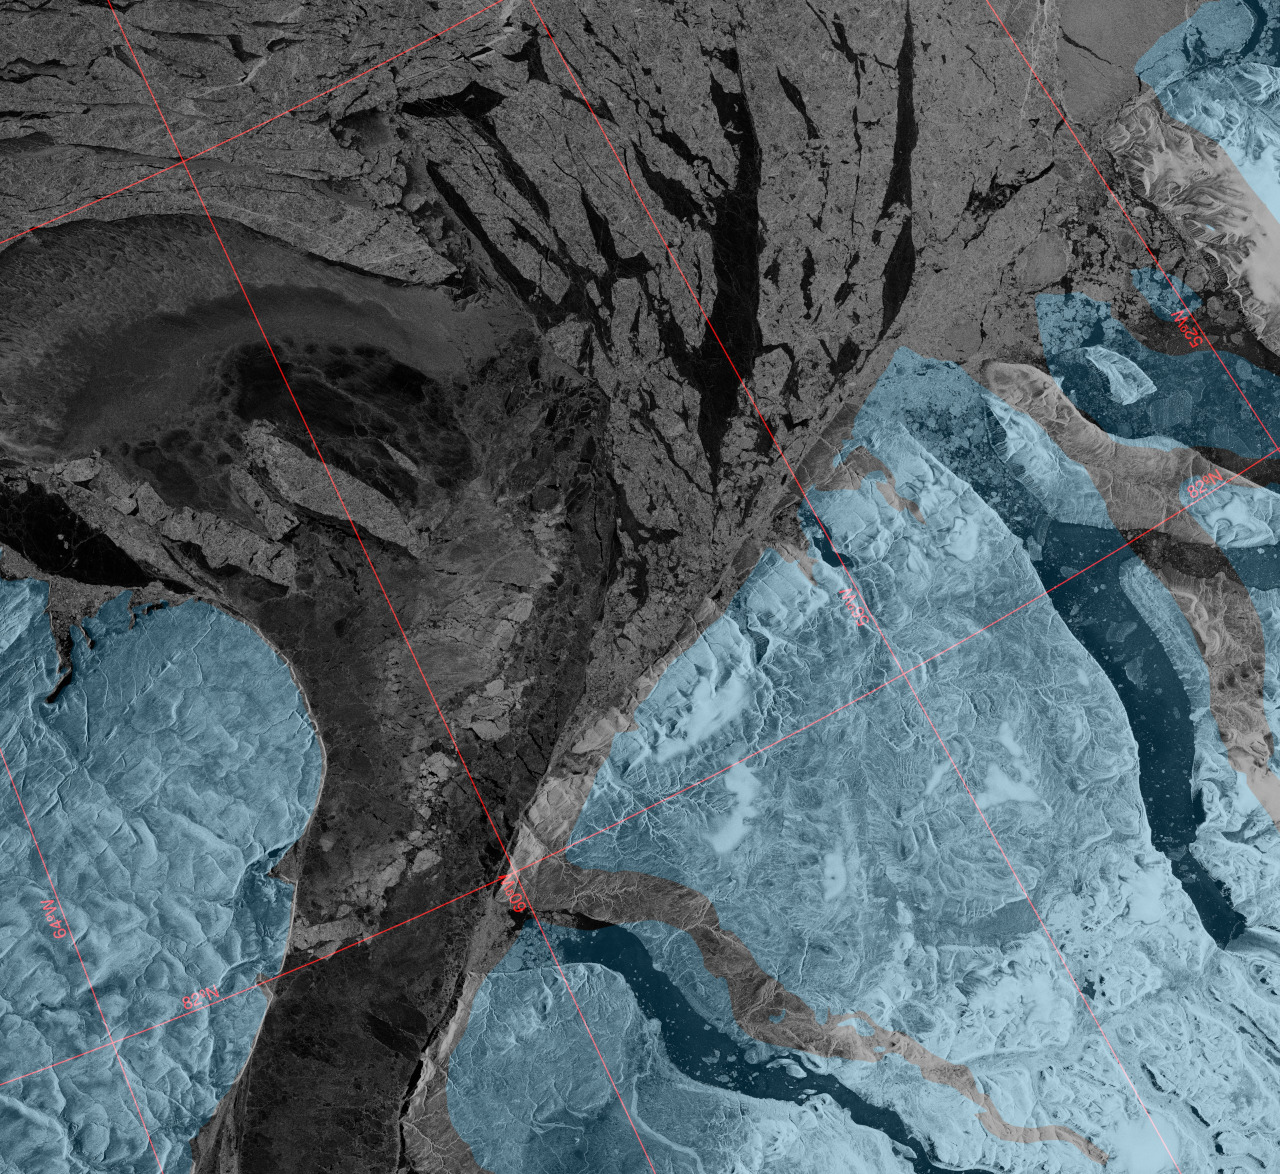
This Sentinel 1 SAR image of the Lincoln Sea from PolarView suggests that the northern arch of the Nares Strait is breaking up once again:
It is therefore conceivable that sea ice in the Lincoln Sea will continue to break up and flow south through the Nares Strait for the entire 2018/2019 winter.
[Edit – March 23rd]
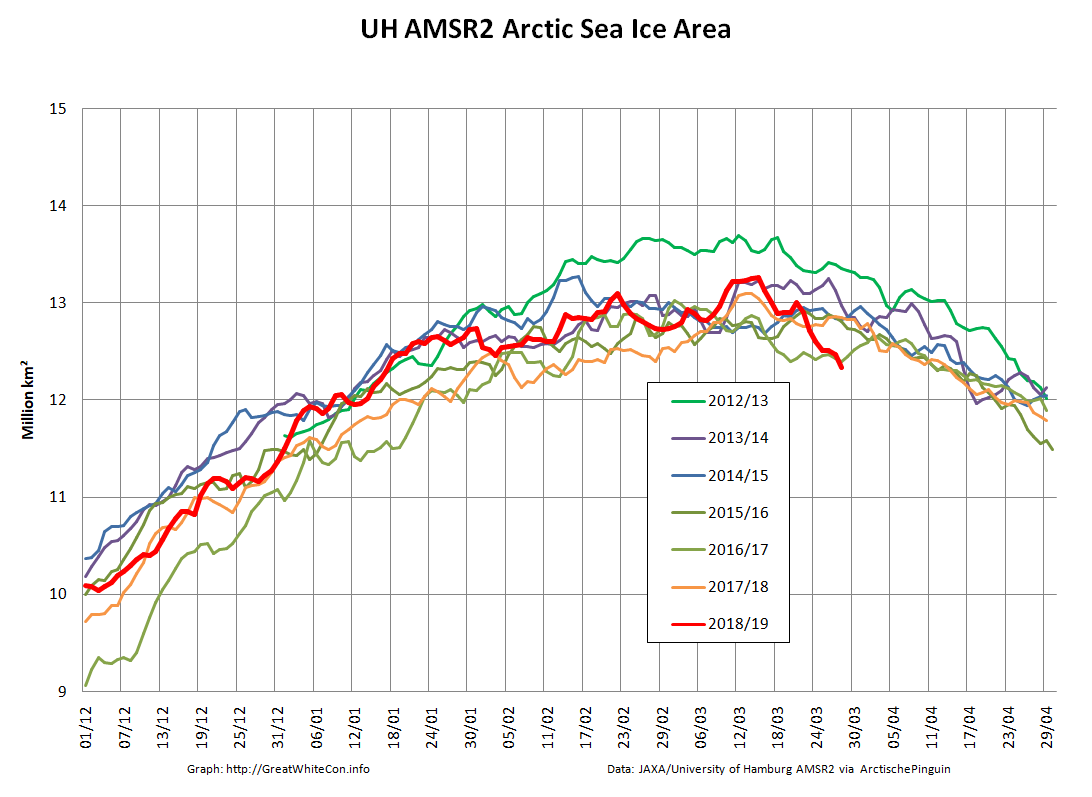
Bering Sea ice area has “rebounded” over the last few days:
and taken the Arctic wide metrics with it:
Here’s the latest Sentinel 1 SAR image of the Lincoln Sea and northern Nares Strait:
[Edit – March 24th]
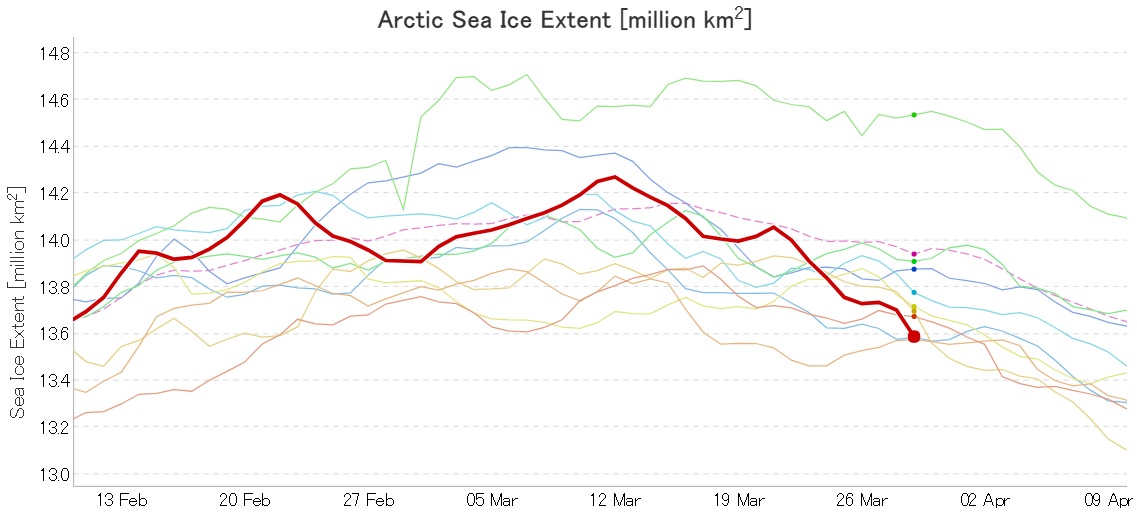
The “rebound” has reversed:
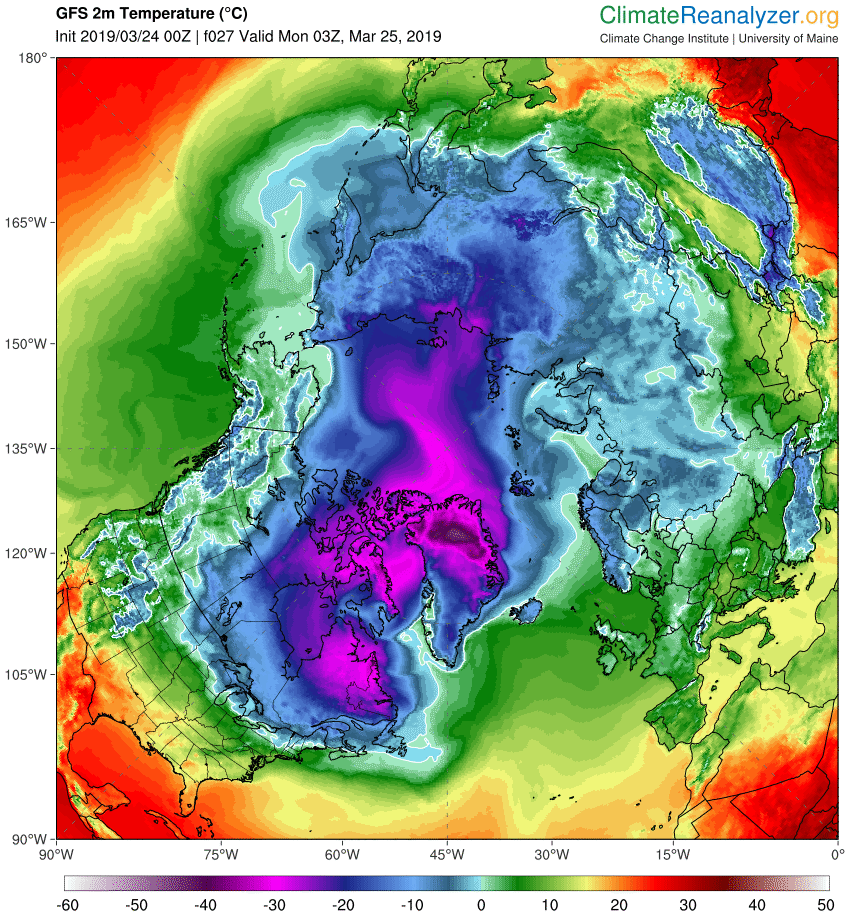
With temperatures above freezing point across the Bering and Chukchi Sea forecast for tomorrow morning expect the decline in Arctic sea ice extent to accelerate:
[Edit – March 25th]
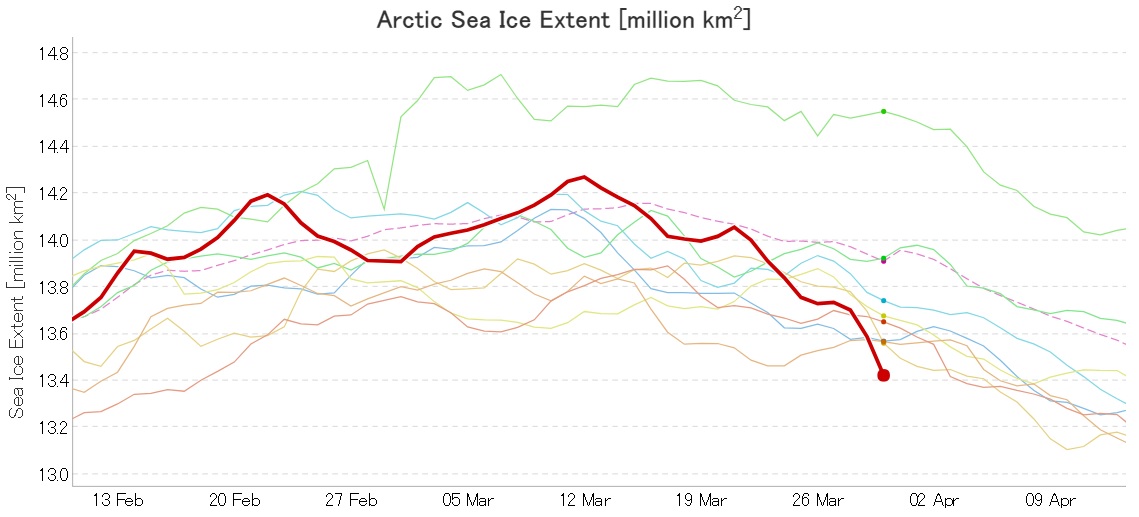
There was a 162k decline in high resolution extent yesterday:
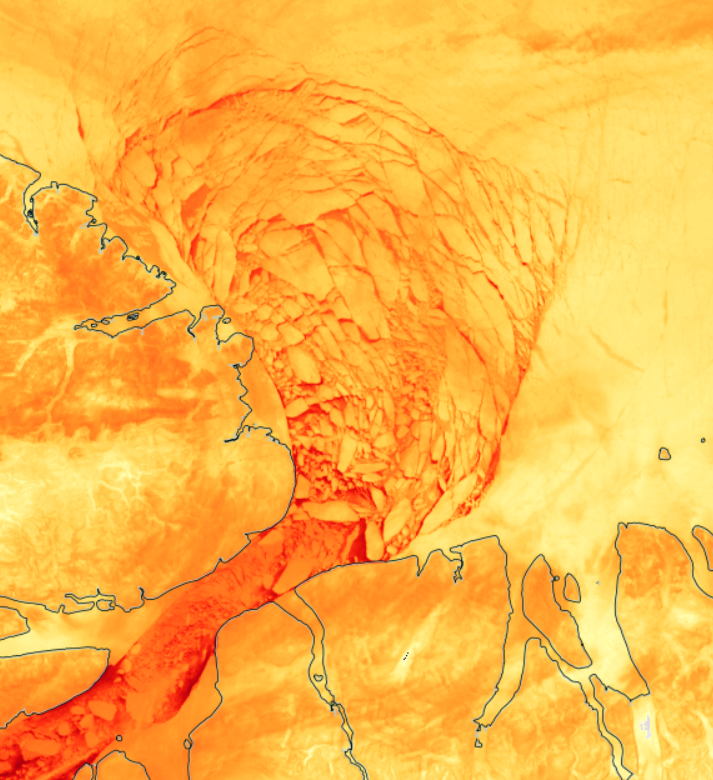
Here also is the current state of the thick sea ice exiting the Lincoln Sea via the Nares Strait:
[Edit – March 27th]
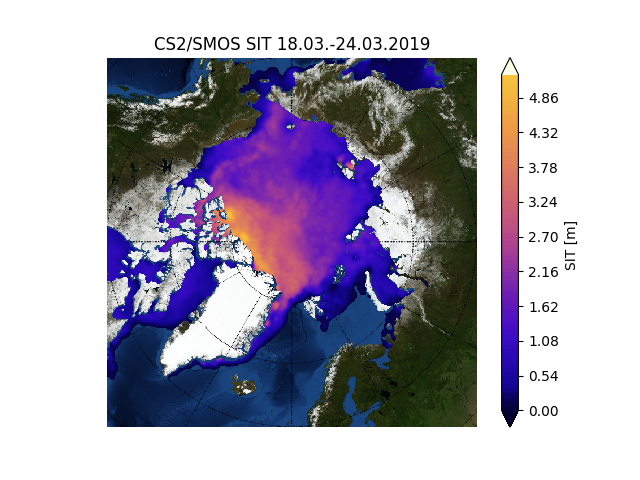
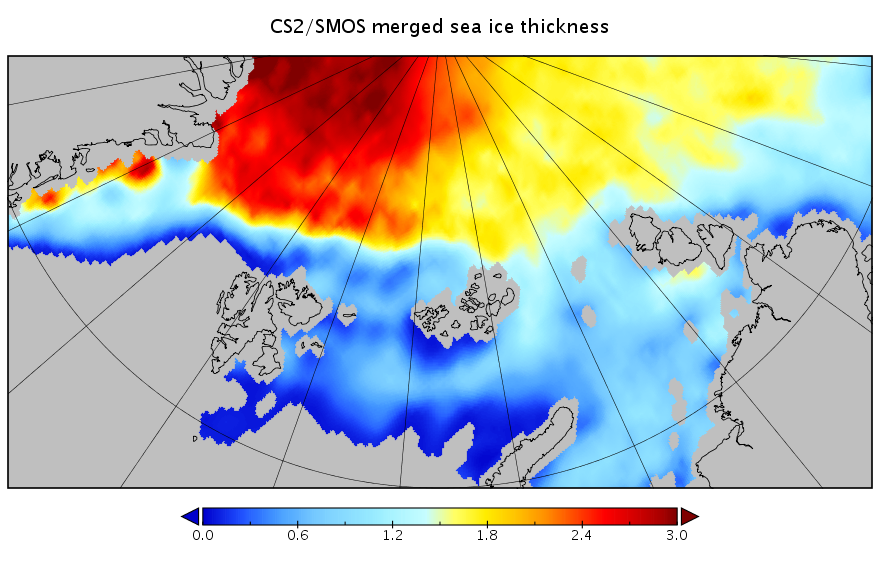
Here’s another week’s merged CryoSat-2/SMOS thickness data from the Finnish Meteorological Institute:
[Edit – March 30th]
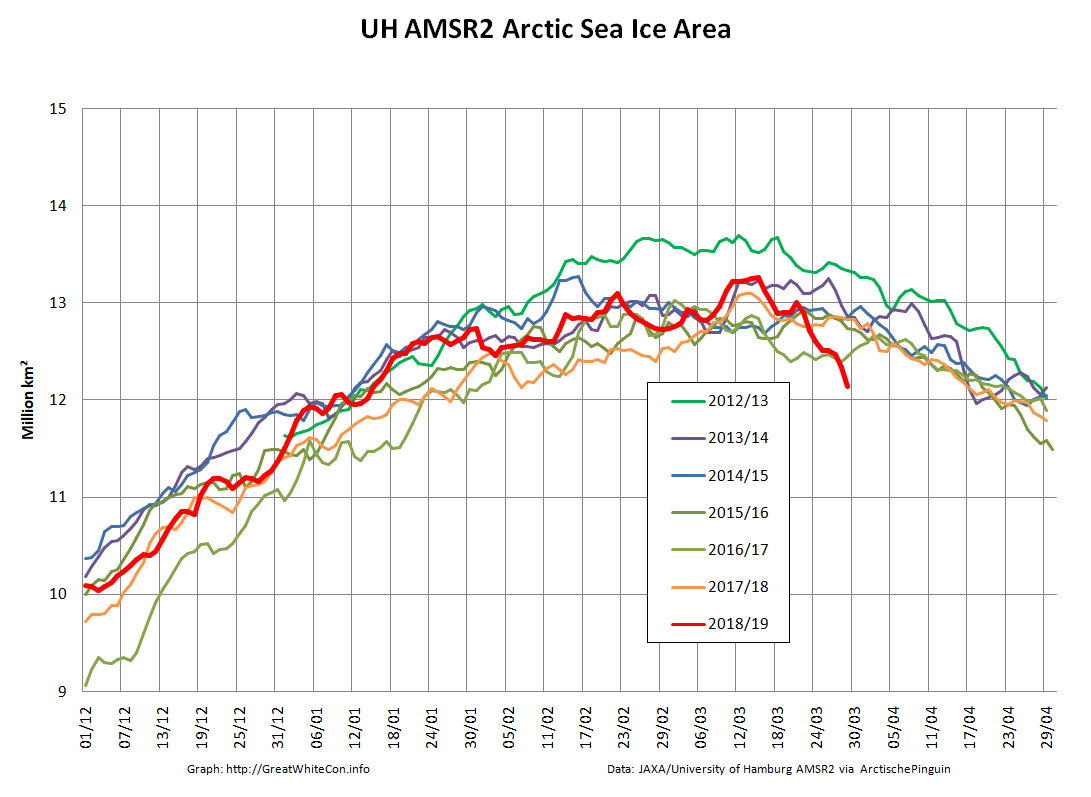
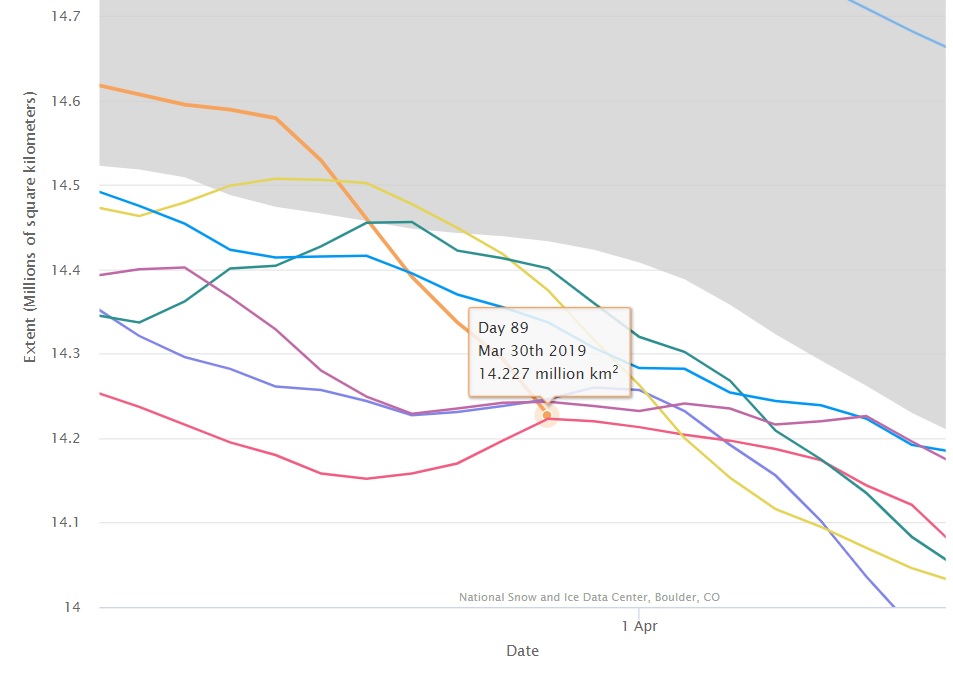
We’re still waiting for Wipneus’ Raspberry Pi to crunch the high resolution AMSR2 numbers, but here’s the latest from JAXA:
2019 currently in 3rd place by a whisker.
P.S. The high resolution AMSR2 numbers are out:
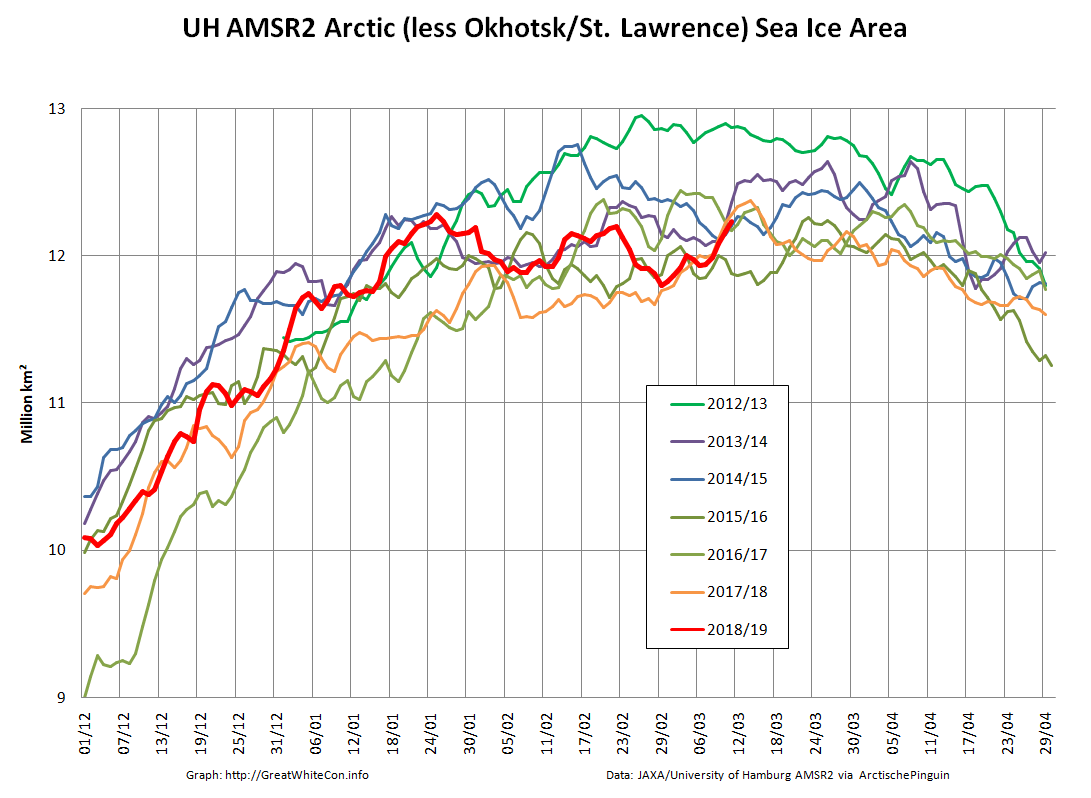
Area is certainly lowest for the date in the AMSR2 era. Extent will almost certainly achieve that status tomorrow. Excluding the two most peripheral seas reveals perhaps an even more worrying picture?
[Edit – March 31th]
Arctic sea ice coverage is now firmly in the “lowest extent for the date in the satellite record” category, whichever metric you care to choose:
The NSIDC 5 day average is in a “statistical tie” for first place with 2017:
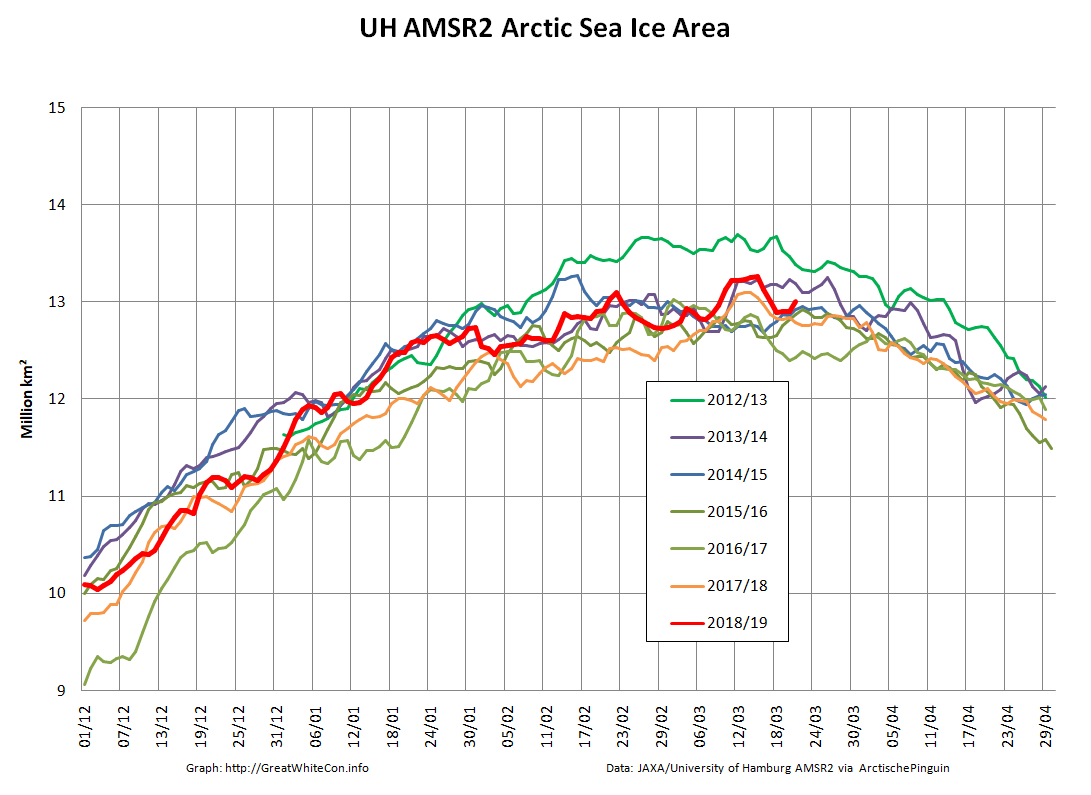
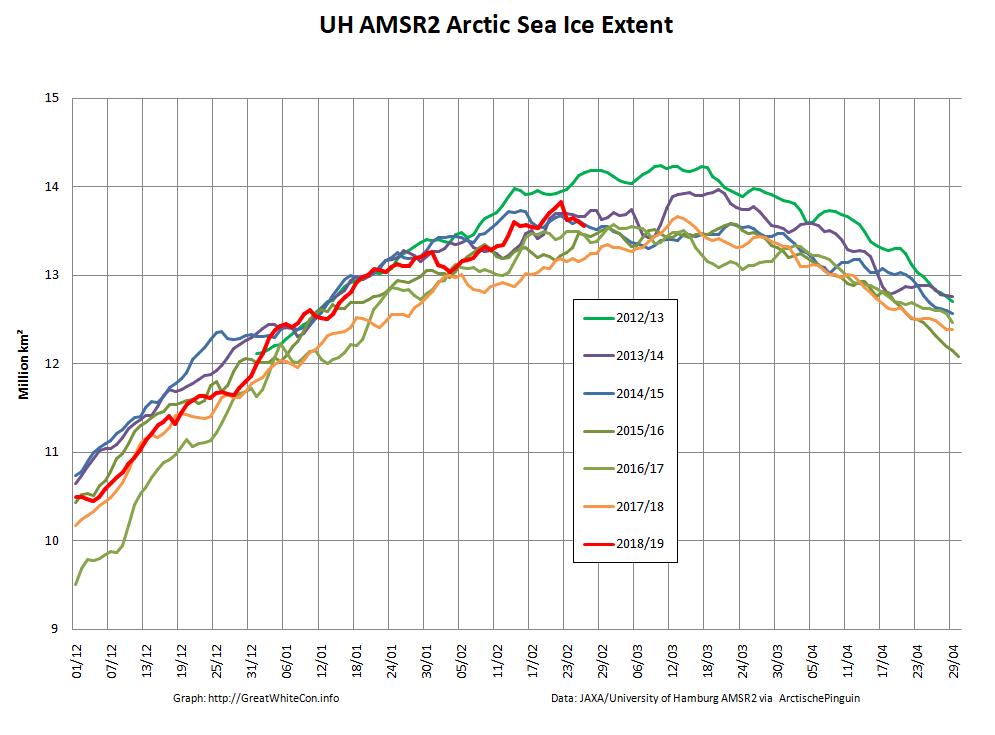
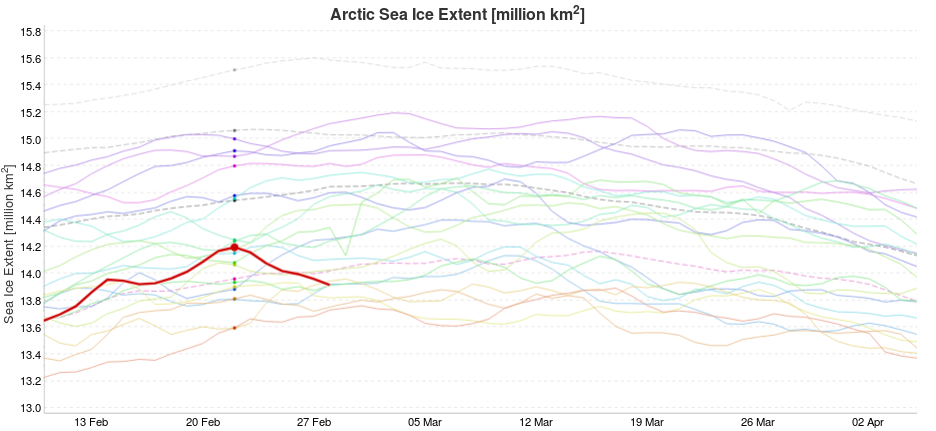
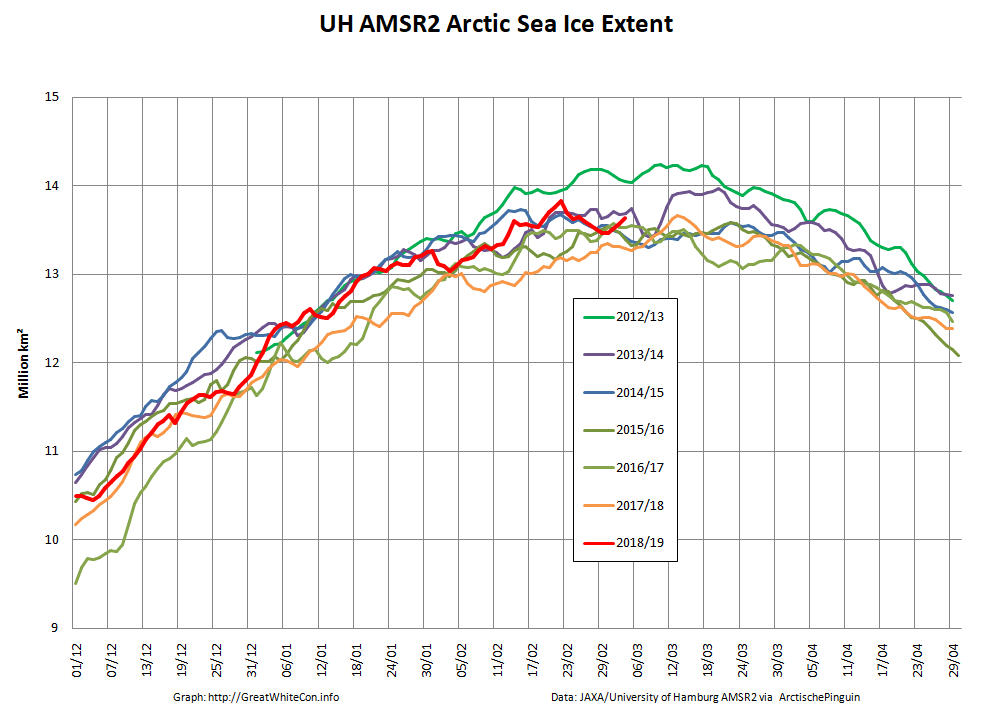
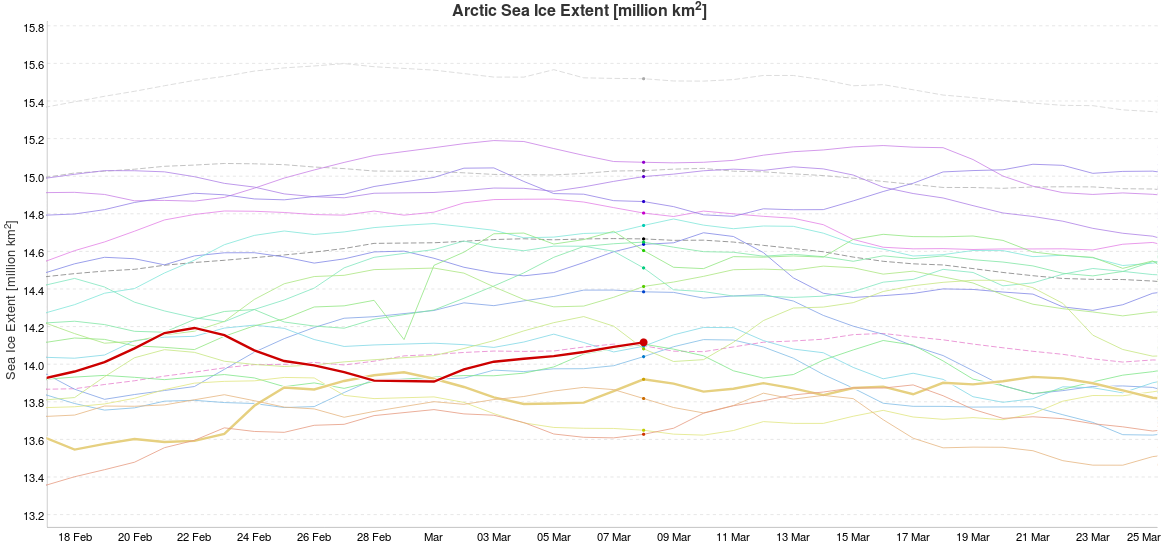
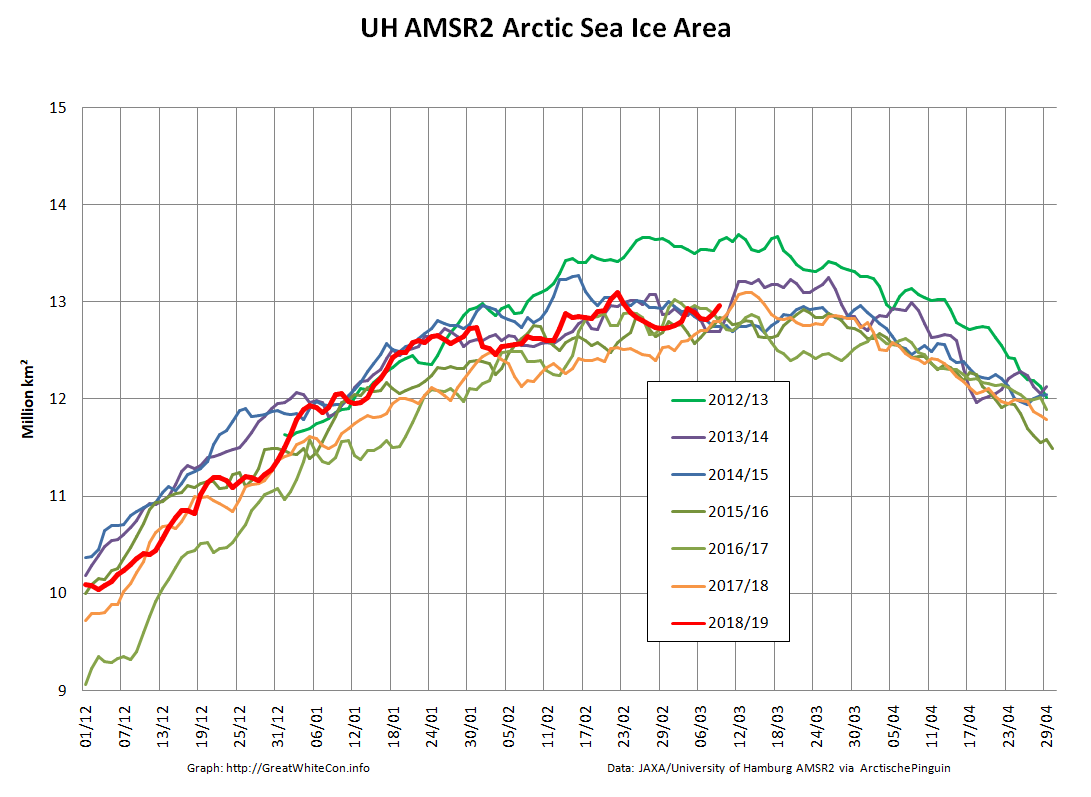
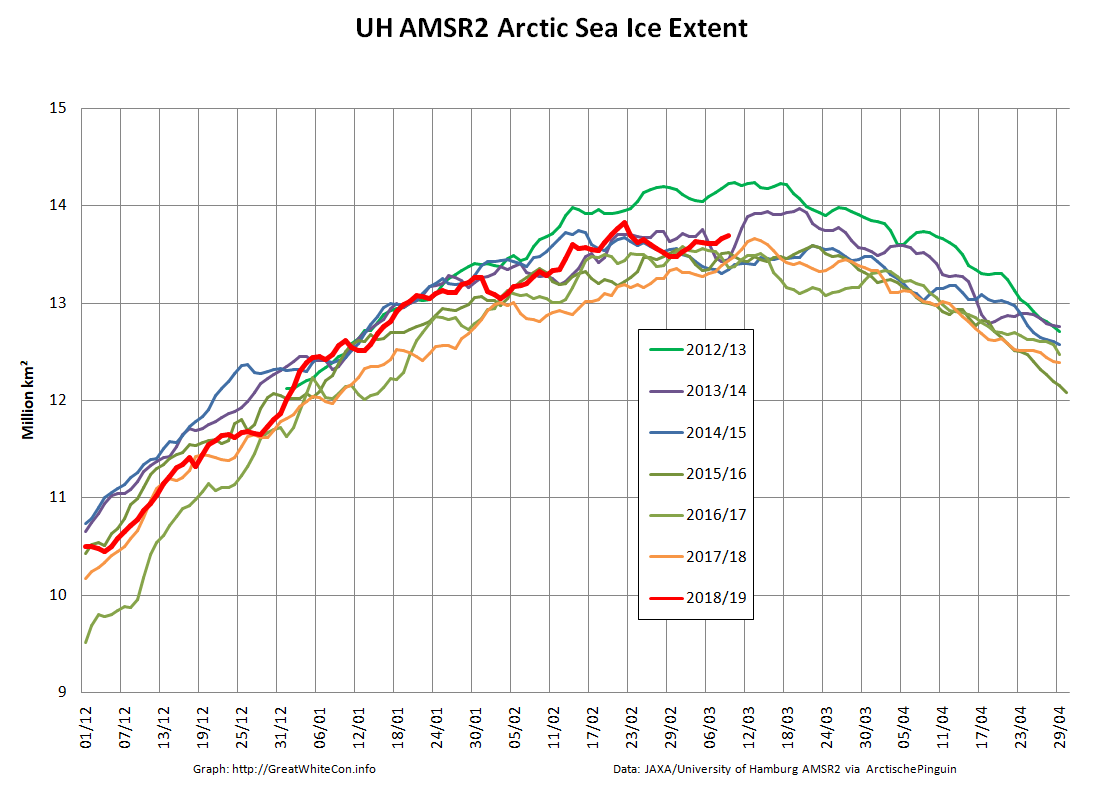
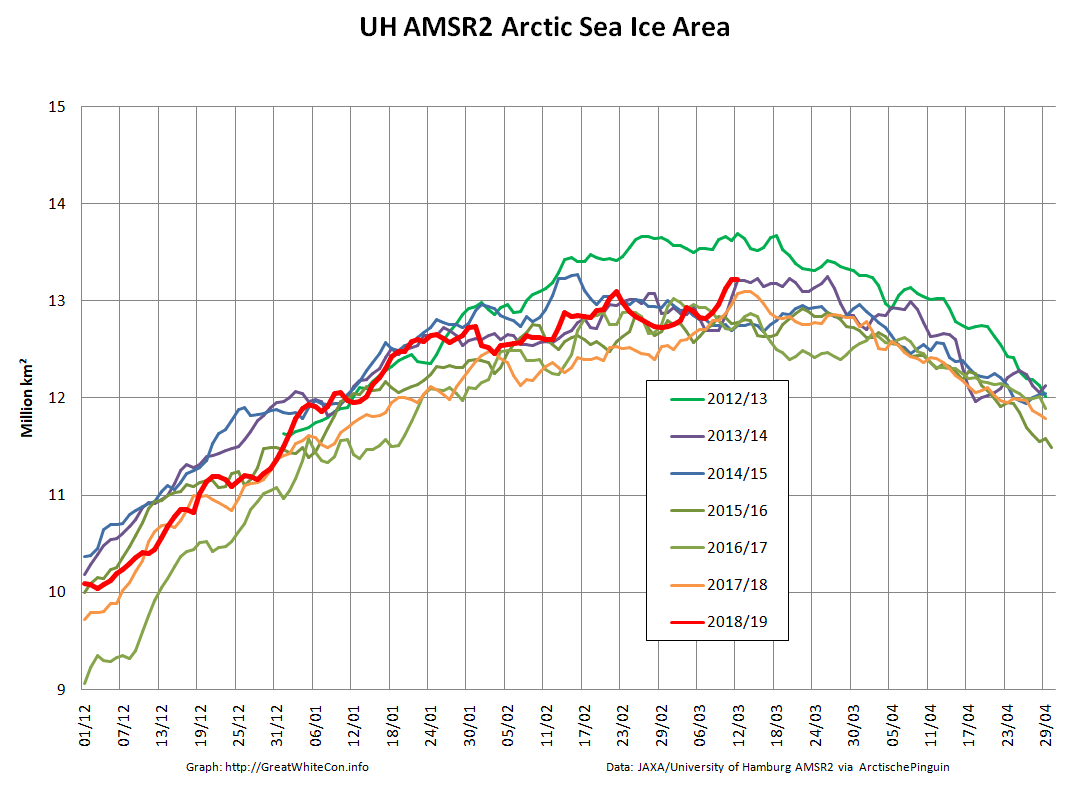
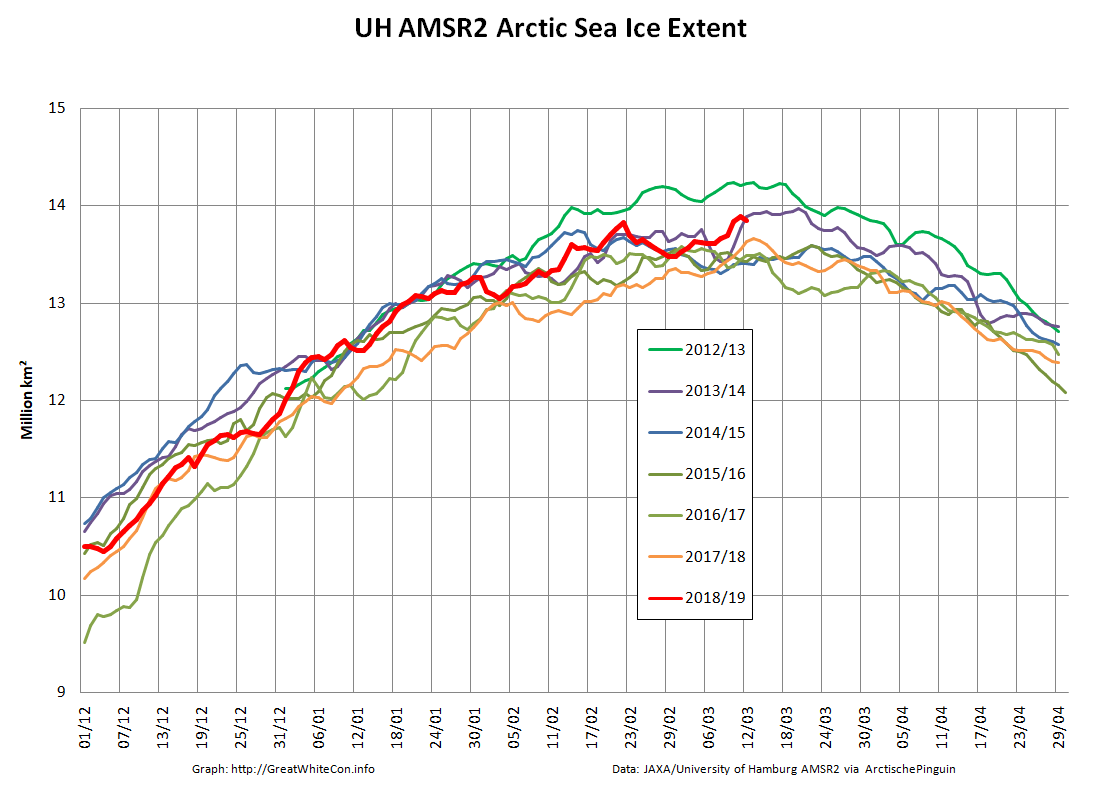
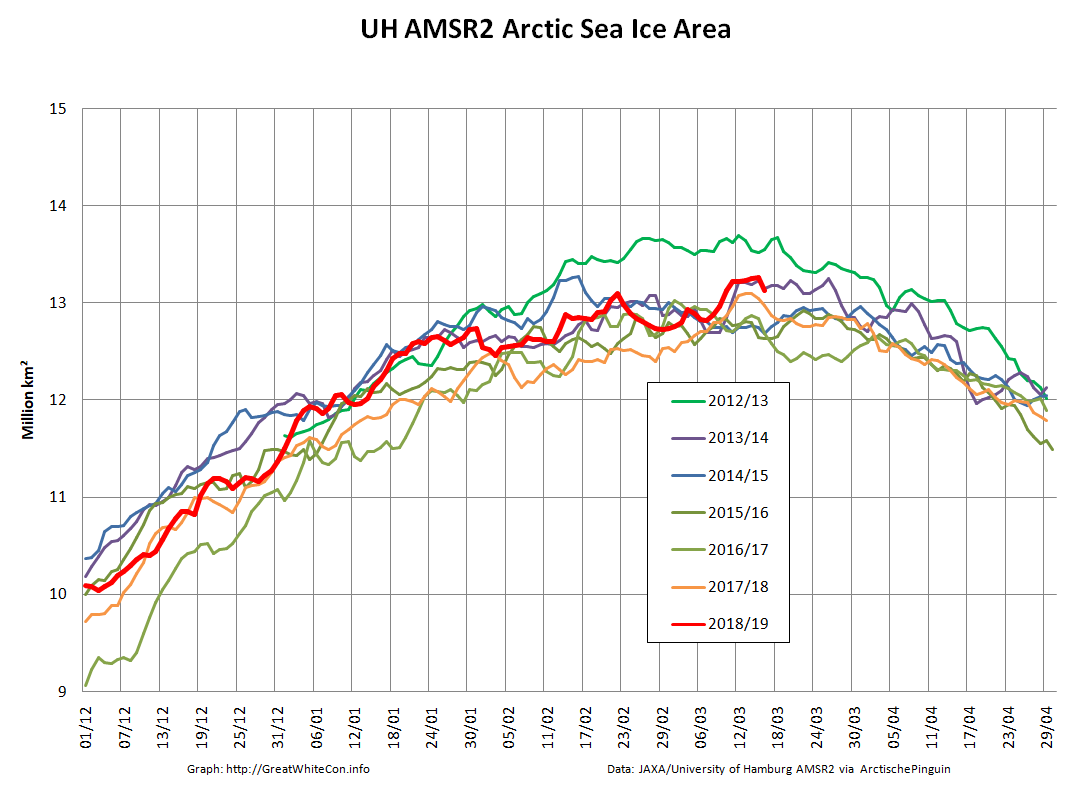
March 2019 has arrived, which in recent years has proved to be by far the likeliest month to contain the maximum extent of Arctic sea ice for the year. To begin with, here’s our favourite high resolution extent graph calculated by “Wipneus” from University of Hamburg/JAXA AMSR2 data:
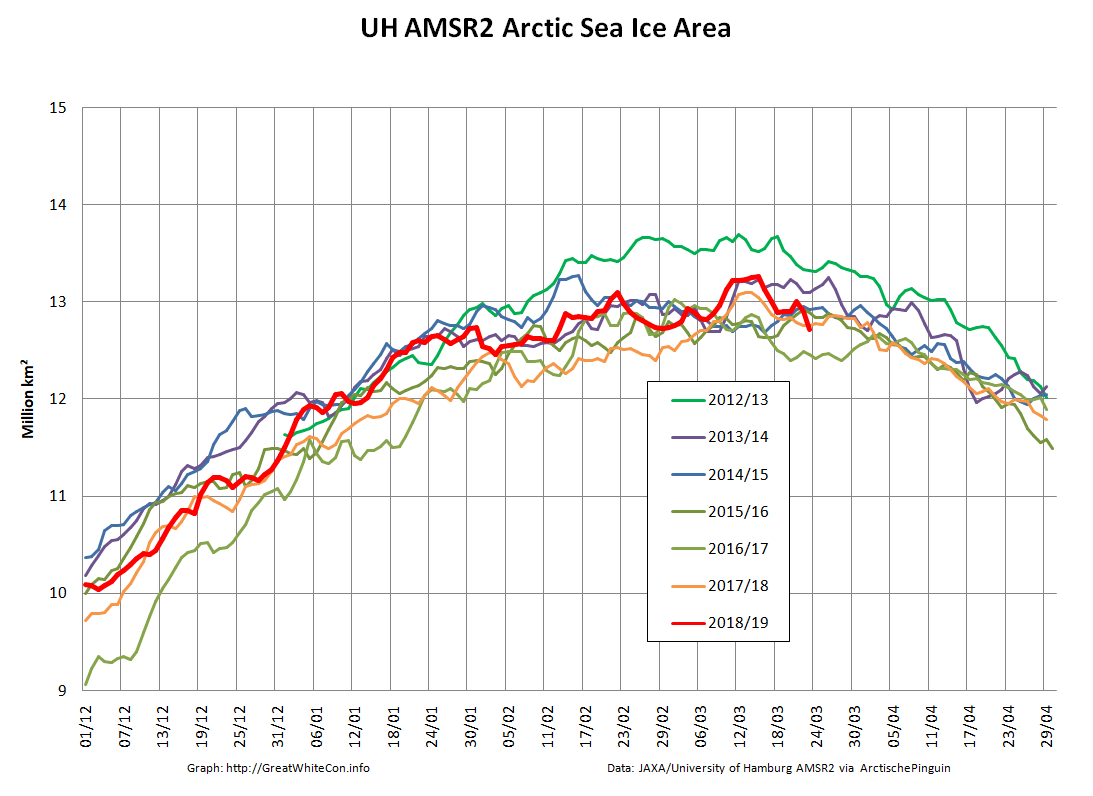
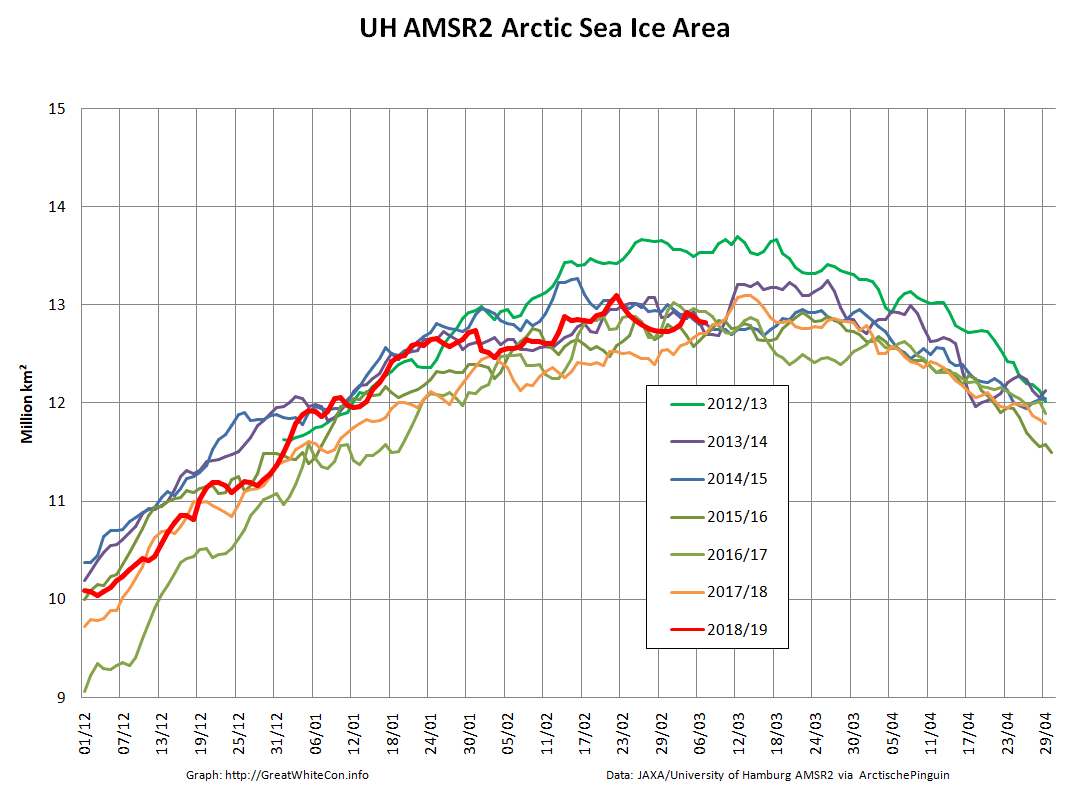
Hopefully you can plainly see the pronounced sharp peak towards the end of February 2019? The current maximum Arctic sea ice extent for 2019 is 13.83 million square kilometers on February 22nd. Here’s Arctic sea ice area for good measure:
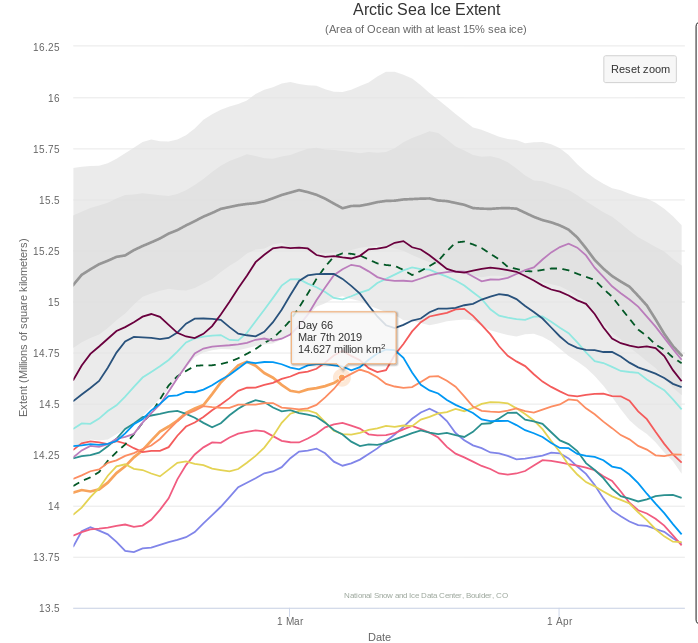
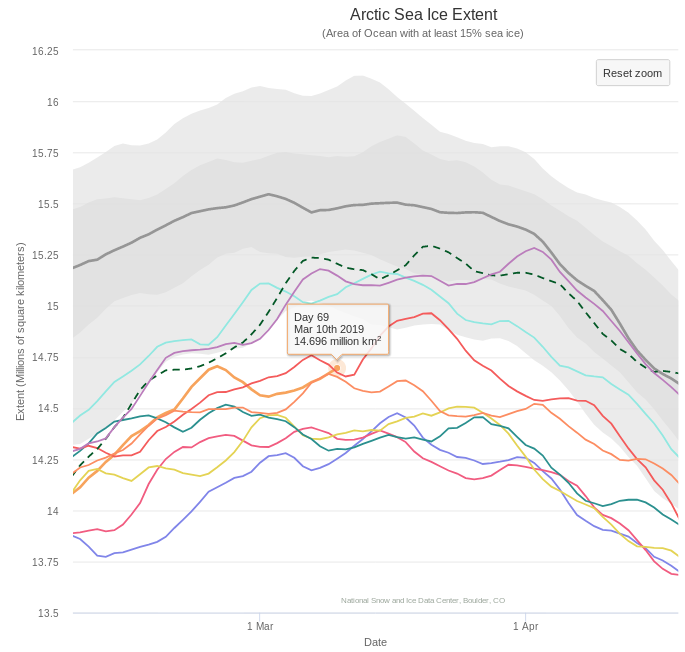
The current maximum area for 2019 is 13.10 million square kilometers, also on February 22nd. Here too is the NSIDC’s 5 day averaged extent:
This reveals a current maximum extent for 2019 of 14.705 million square kilometers on February 24th.
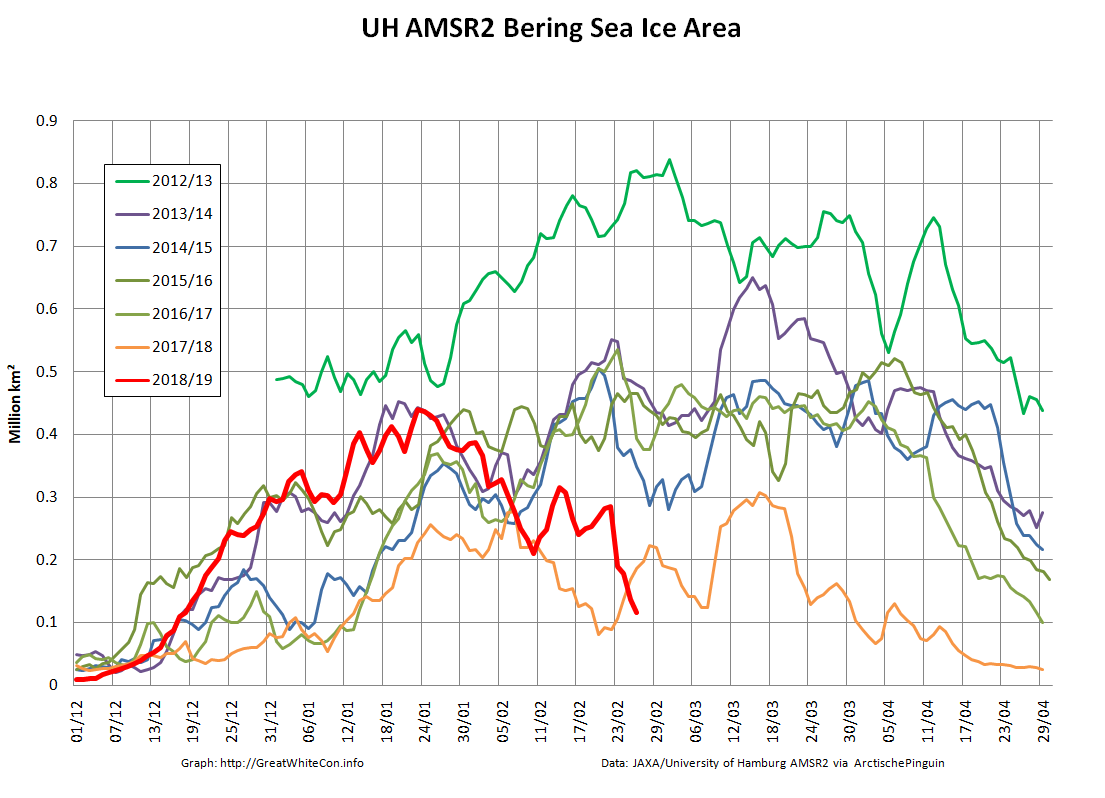
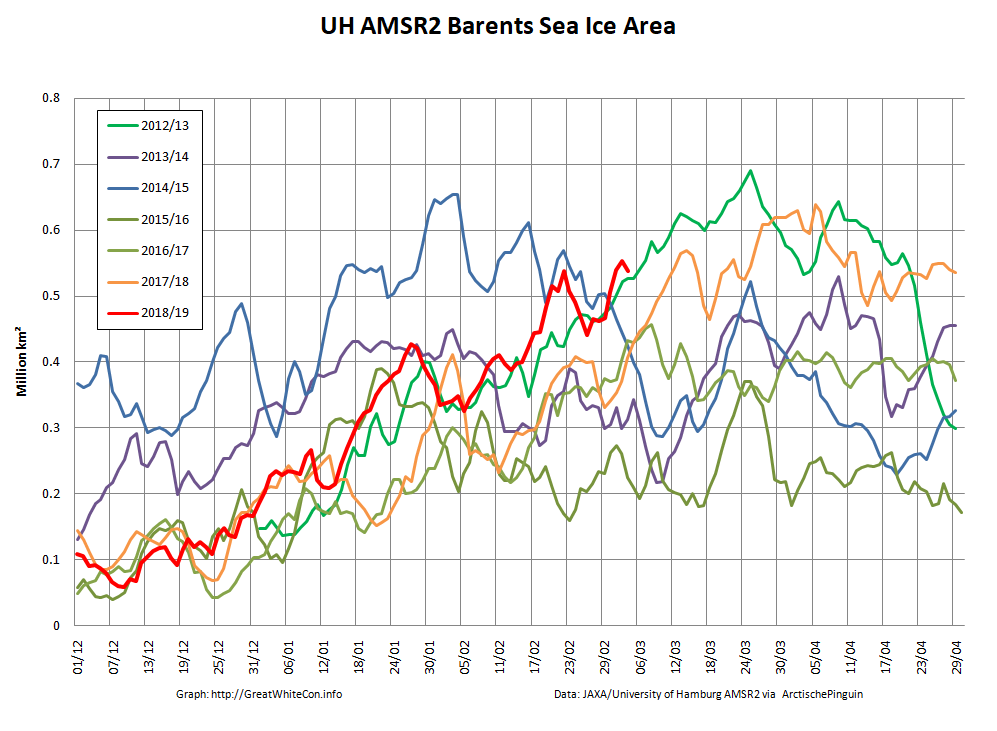
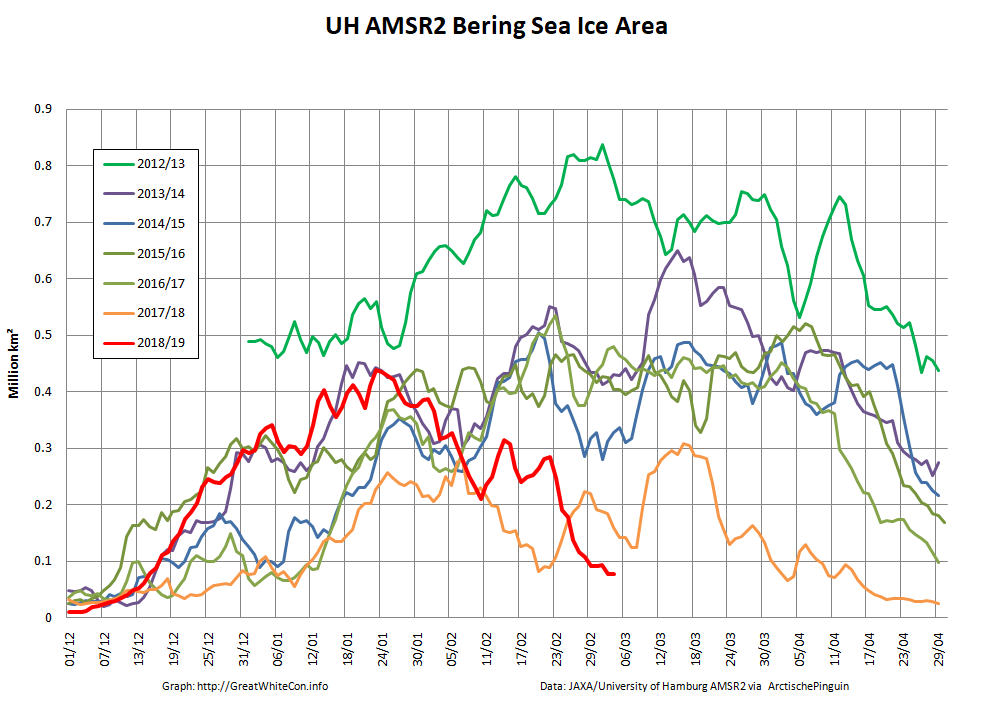
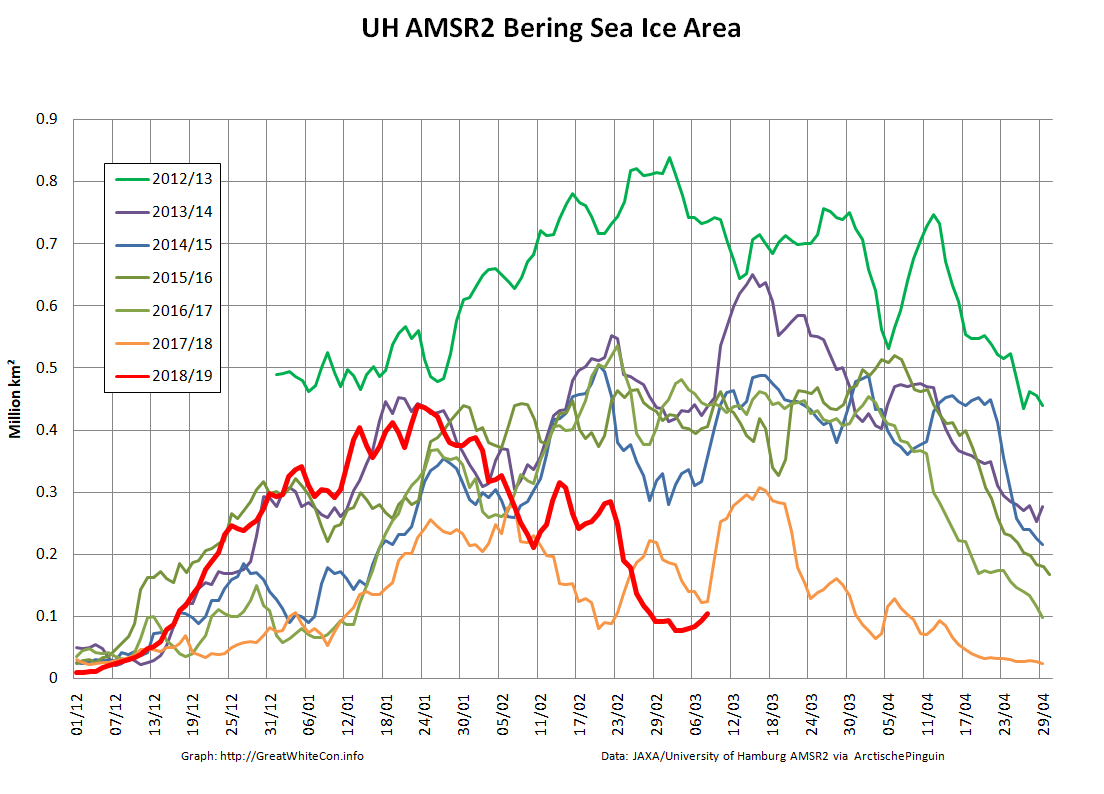
At this juncture you may well be wondering what the cause of that sudden sharp peak might be? Here’s your starter for ten:
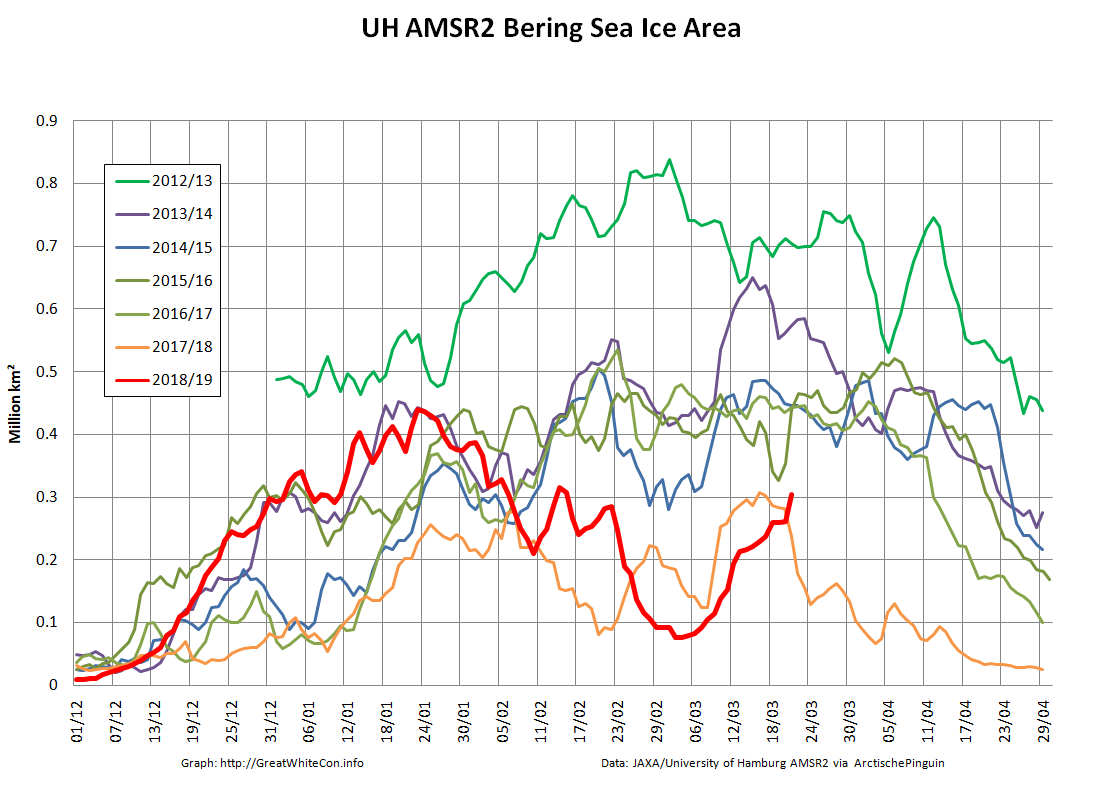
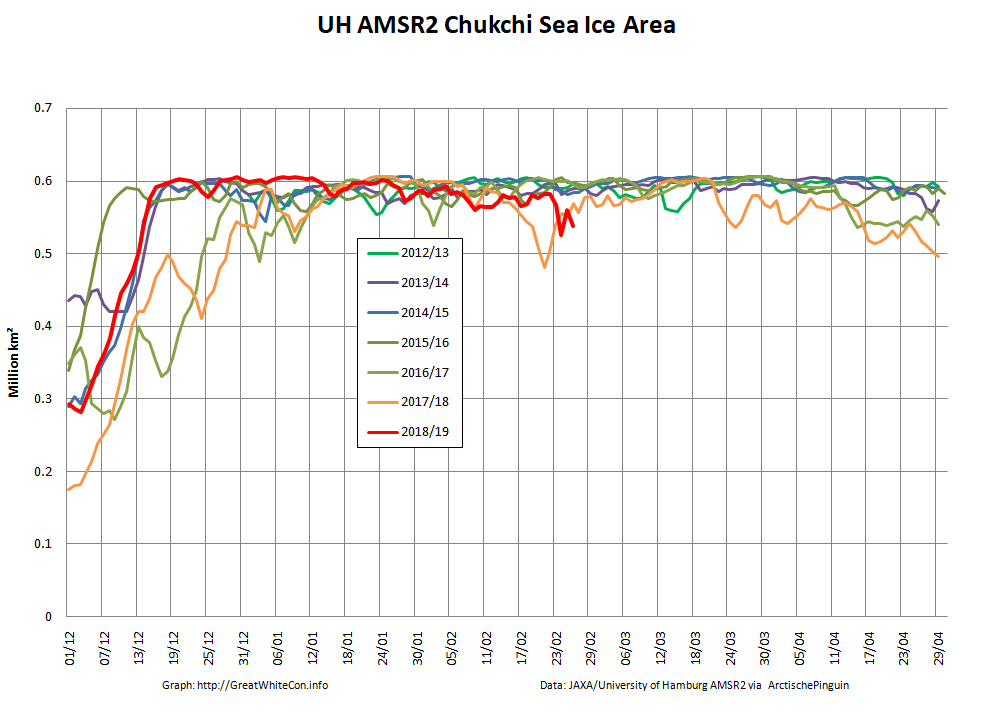
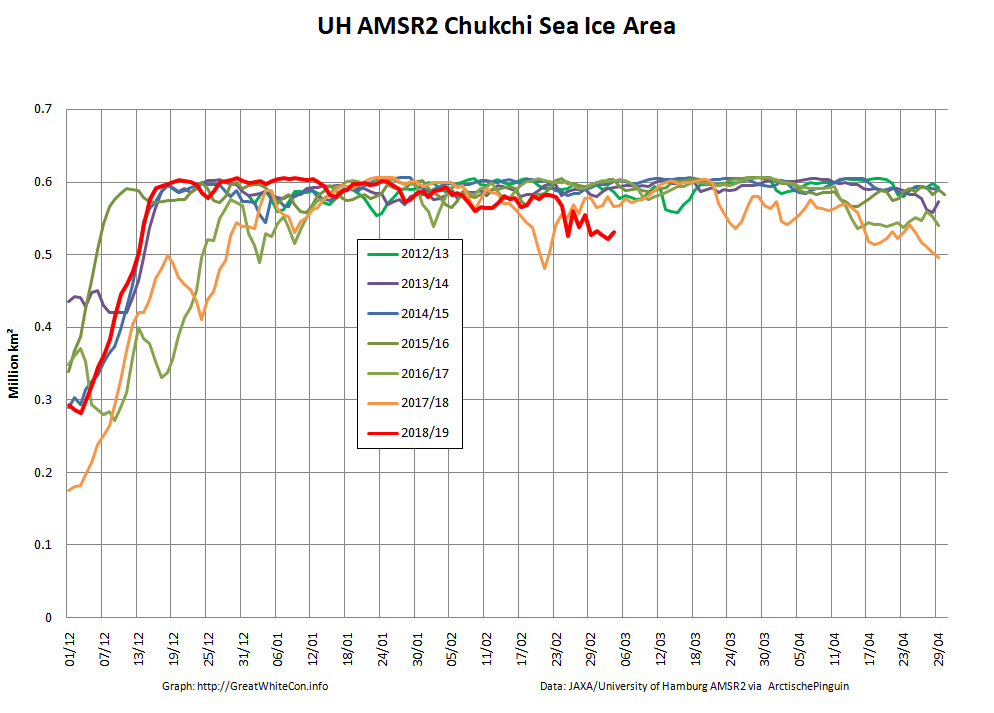
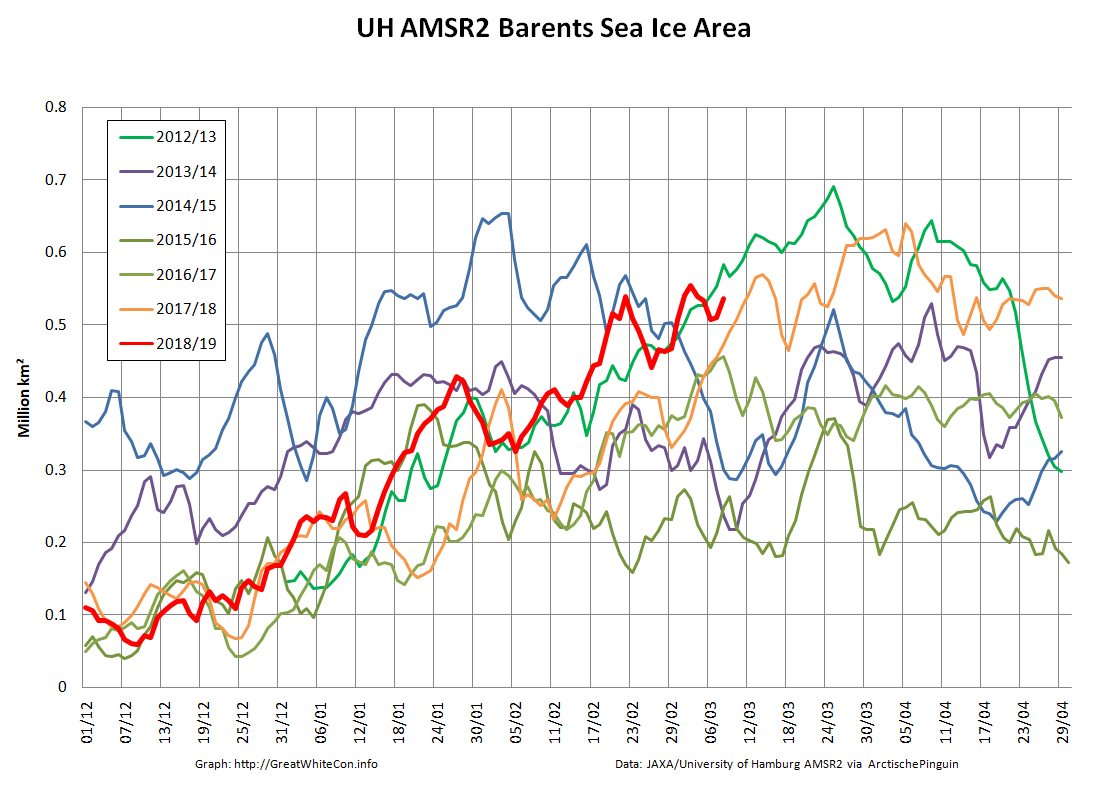
Whilst overall Arctic sea ice area is unremarkable for the current decade, sea ice area in the Bering Sea is remarkable low for the time of year! What’s more much like last year the Chukchi Sea is not currently full to overflowing with sea ice, and is also lowest for the date in the AMSR2 satellite records:
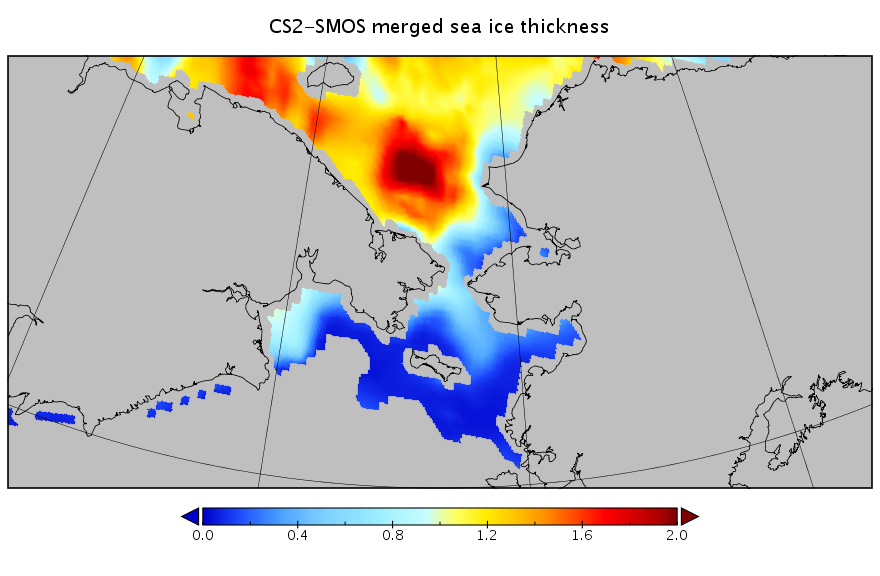
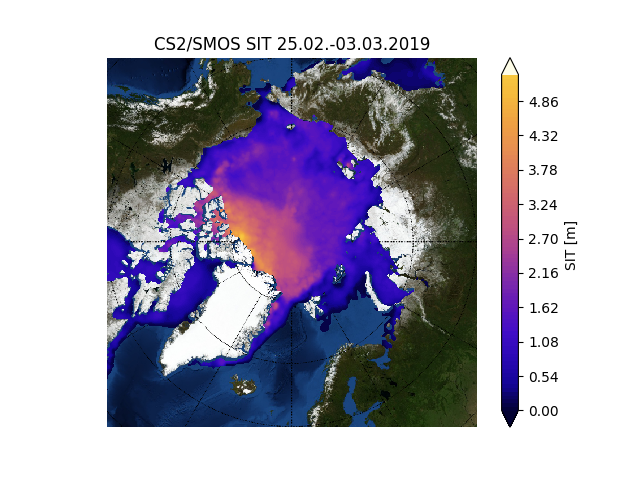
I’ve also been experimenting with the new gridded CryoSat-2/SMOS thickness data from the Finnish Meteorological Institute, which reveals this:
That’s a weekly overview dated February 24th, but it does perhaps explain how such a large area of sea ice could melt so swiftly?
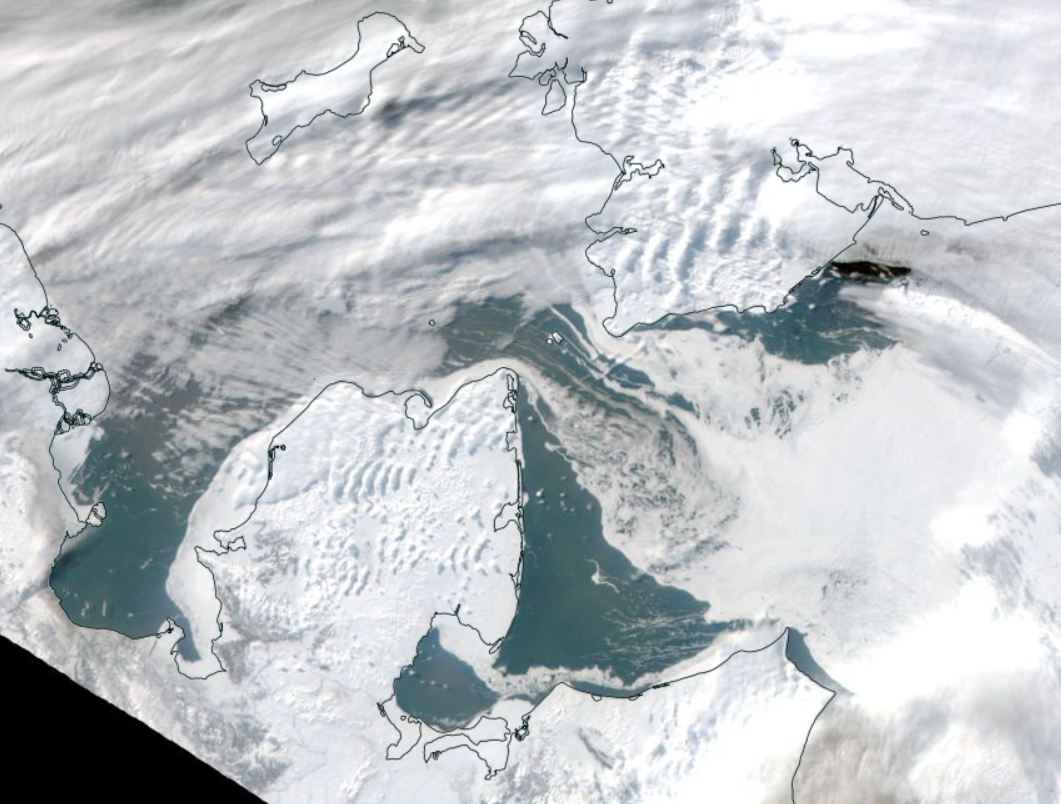
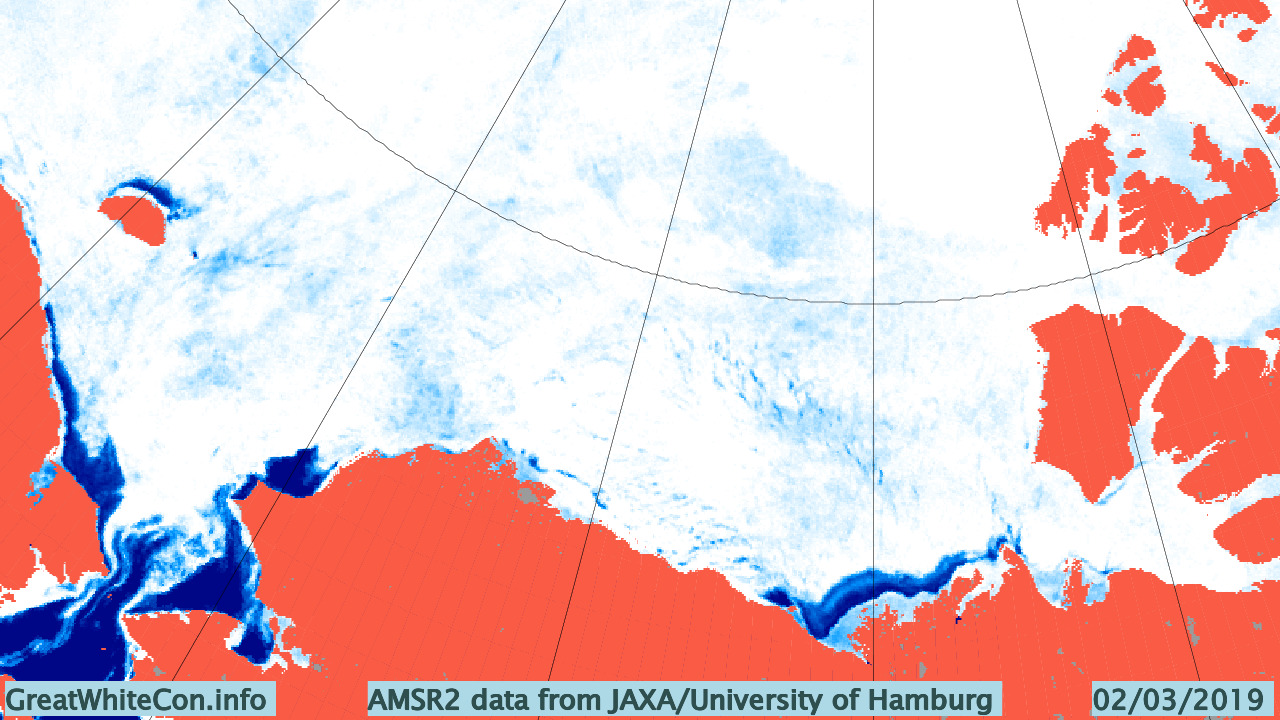
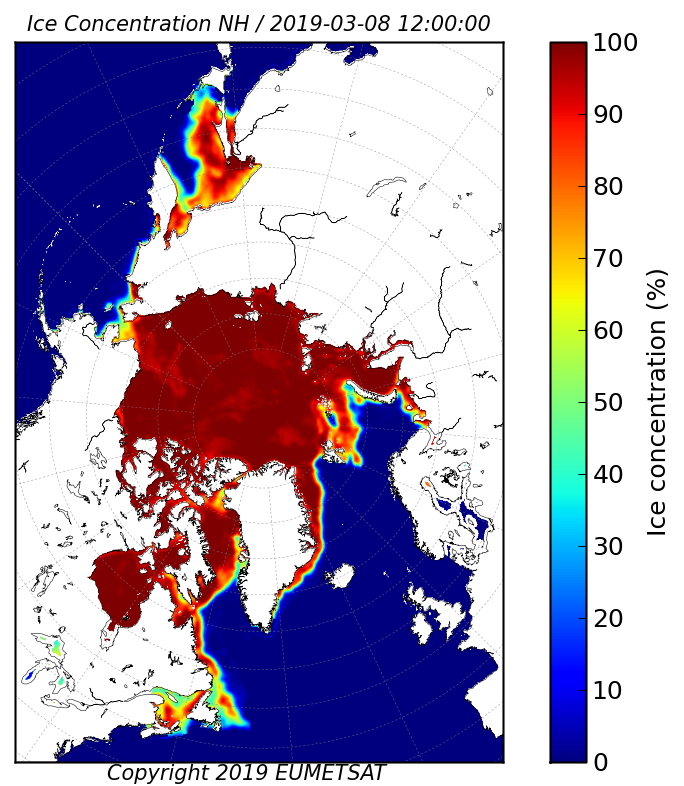
As luck would have it the skies are reasonably clear over the Bering Strait this morning (UTC). Here’s Terra’s view from on high of the current situation:
In addition, here is the underlying sea ice concentration data from the OSI-SAF:
Since Michael is also asserting that there currently exists “the greatest February Arctic sea ice extent (according to DMI) in your blog’s history”, here’s Arctic sea ice area excluding the extremely peripheral Okhotsk and St. Lawrence regions:
P.S. Wipneus’ Pi has processed the AMSR2 data now, and area shows another, more modest, decline today:
Both area and extent are still moving inexorably upwards:
The late February maximum still holds, on the high resolution numbers at least. The JAXA/VISHOP web site is down at the moment, so we’ll have to wait for an update to that particular metric, as well as a post weekend update to the NSIDC’s Charctic chart.
P.S. Jaxa is still down this afternoon, but here’s the latest from the NSIDC:
[Edit – March 13th]
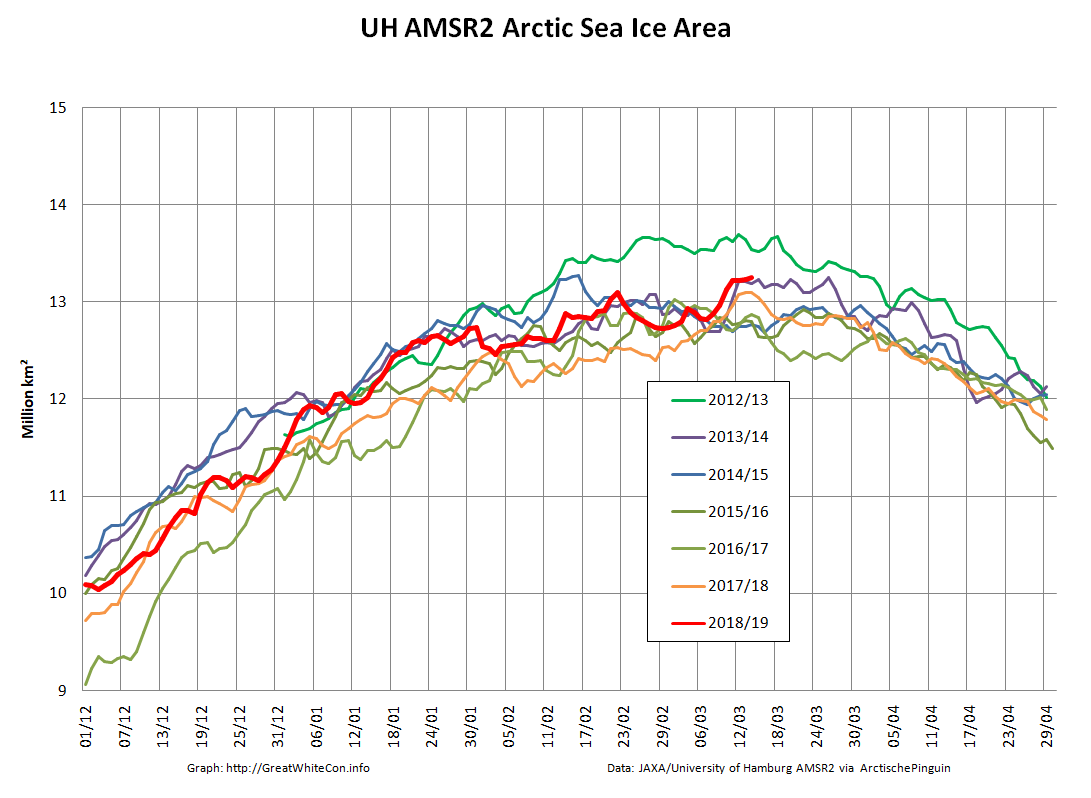
Arctic wide area and extent have blasted past their respective late February maxima:
However Arctic sea ice area excluding the Okhotsk and St. Lawrence peripheral regions has still not exceeded the maximum formed on January 25th:
[Edit – March 14th]
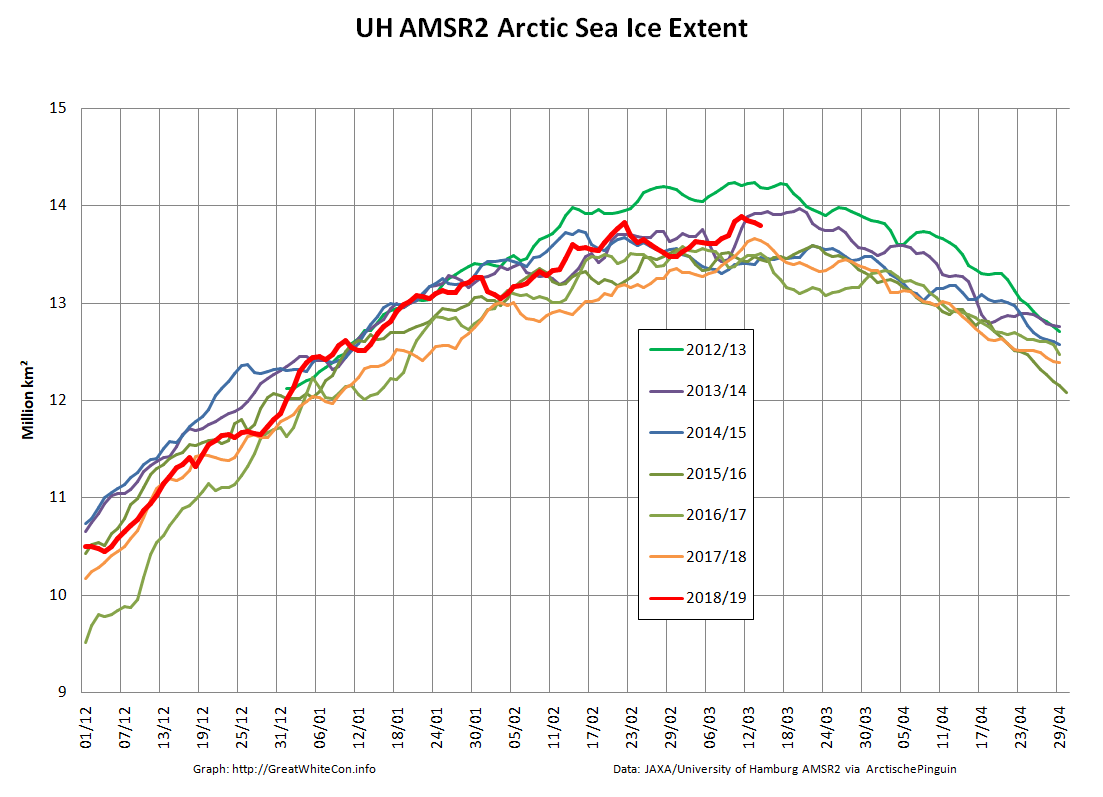
This morning’s data reveal the first decline in extent for several days:
The (extremely!) tentative new maximum Arctic sea ice extent for 2019 is 13.89 million square kilometers on March 12th.
[Edit – March 15th]
JAXA is back!
UH AMSR2 confirms that extent is still declining:
[Edit – March 16th]
Arctic sea ice extent continues to decline, whilst area is still flatlining:
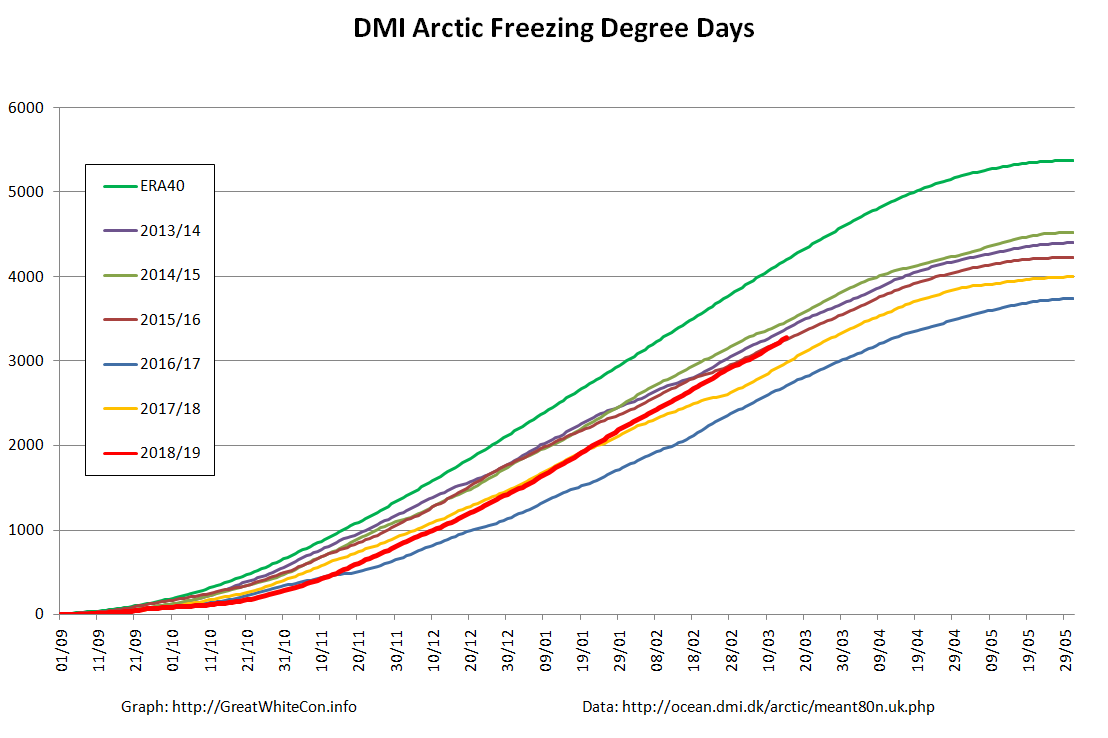
Meanwhile a look at freezing degree days based on the DMI’s dubiously weighted data for north of 80 degrees reveals the story of the freezing season. A historically warm start, but now back in amongst the pack of the 2010s:
[Edit – March 17th]
It looks as though there’ll be no going back from this. Arctic sea ice area is finally following extent’s decline in no uncertain terms:
Barring exceedingly unforeseen circumstances after this year’s “double top” that leaves the 2019 Arctic sea ice maximum extent numbers as follows:
UH/Wipneus AMSR2 – 13.89 million square kilometers on March 12th
JAXA/VISHOP AMSR2 – 14.27 million square kilometers on March 12th
NSIDC 5 day SSMIS – 14.78 million square kilometers on March 13th
[Edit – March 19th]
Arctic sea ice area has fallen off the proverbial cliff over the last few days. There can now be no doubt that the 2019 maximum extent has been reached:
That being the case, all other Arctic sea ice discussion for the month of March can now take place over at:
On March 13, 2019, Arctic sea ice likely reached its maximum extent for the year, at 14.78 million square kilometers (5.71 million square miles), the seventh lowest in the 40-year satellite record, tying with 2007. This year’s maximum extent is 860,000 square kilometers (332,000 square miles) below the 1981 to 2010 average maximum of 15.64 million square kilometers (6.04 million square miles) and 370,000 square kilometers (143,000 square miles) above the lowest maximum of 14.41 million square kilometers (5.56 million square miles) set on March 7, 2017. Prior to 2019, the four lowest maximum extents occurred from 2015 to 2018.
The date of the maximum this year, March 13, was very close to the 1981 to 2010 median date of March 12.
Please note this is a preliminary announcement of the sea ice maximum. At the beginning of April, NSIDC scientists will release a full analysis of winter conditions in the Arctic, along with monthly data for March.
This website uses cookies to improve your experience. We'll assume you're ok with this, but you can opt-out if you wish. Cookie settingsACCEPT
Privacy & Cookies Policy
Privacy Overview
This website uses cookies to improve your experience while you navigate through the website. Out of these, the cookies that are categorized as necessary are stored on your browser as they are essential for the working of basic functionalities of the website. We also use third-party cookies that help us analyze and understand how you use this website. These cookies will be stored in your browser only with your consent. You also have the option to opt-out of these cookies. But opting out of some of these cookies may affect your browsing experience.
Necessary cookies are absolutely essential for the website to function properly. This category only includes cookies that ensures basic functionalities and security features of the website. These cookies do not store any personal information.
Any cookies that may not be particularly necessary for the website to function and is used specifically to collect user personal data via analytics, ads, other embedded contents are termed as non-necessary cookies. It is mandatory to procure user consent prior to running these cookies on your website.