Tag Archives: DMI

The Danish Meteorological Institute

Global Sea Ice Extent at Lowest *Ever Level

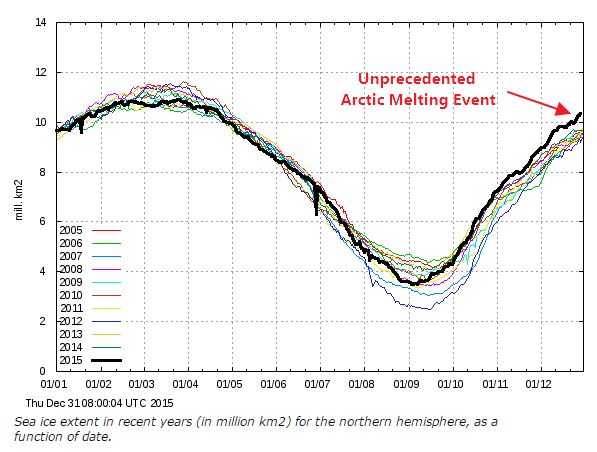
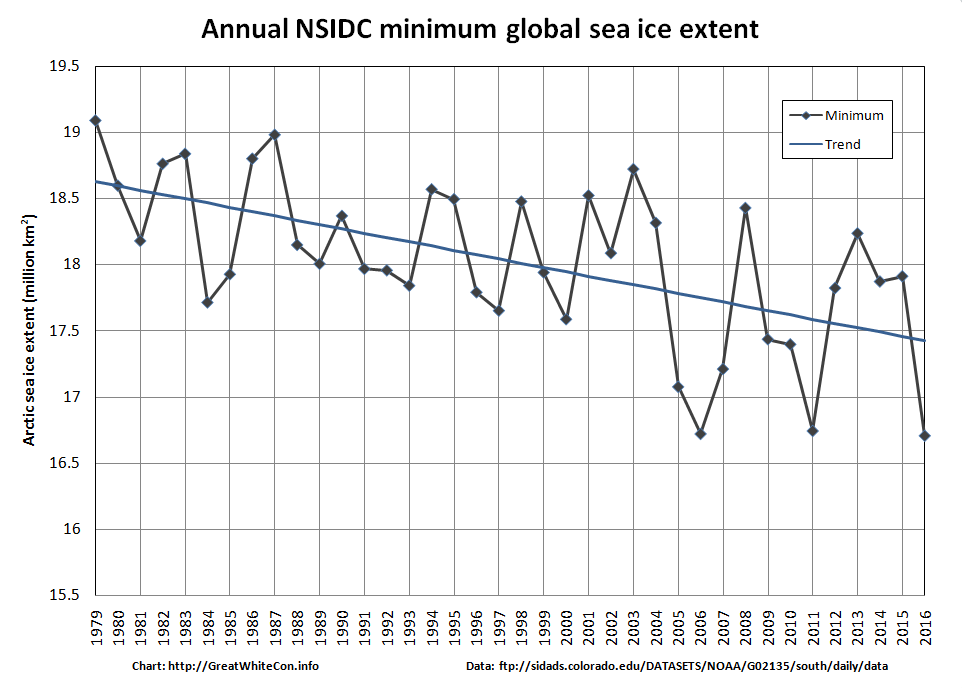
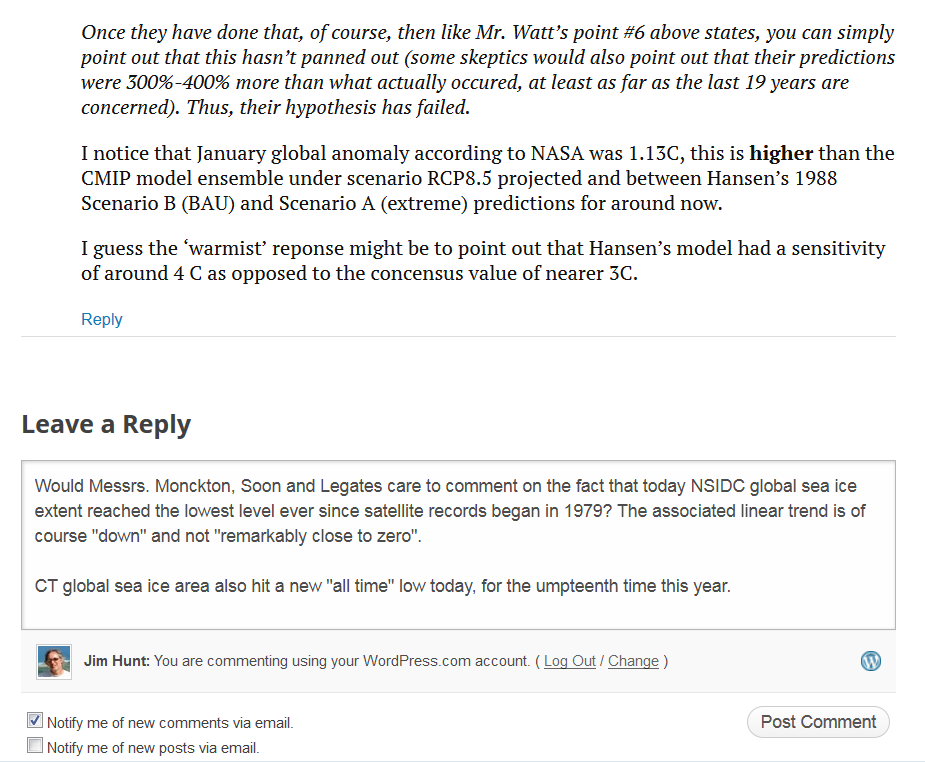
A few days ago we reported that the Cryosphere Today global sea ice area metric had fallen to the “lowest *ever” level since their records began in 1979. CT area just fell to yet another all time low once again. Today we are able to bring you the news that NSIDC global sea ice extent also achieved “lowest *ever” status today, at 16.707 million square kilometers. Here’s the graph to prove it:

Global-Extent-2016-02-18

As we discussed when global sea ice area reached its all time low level:

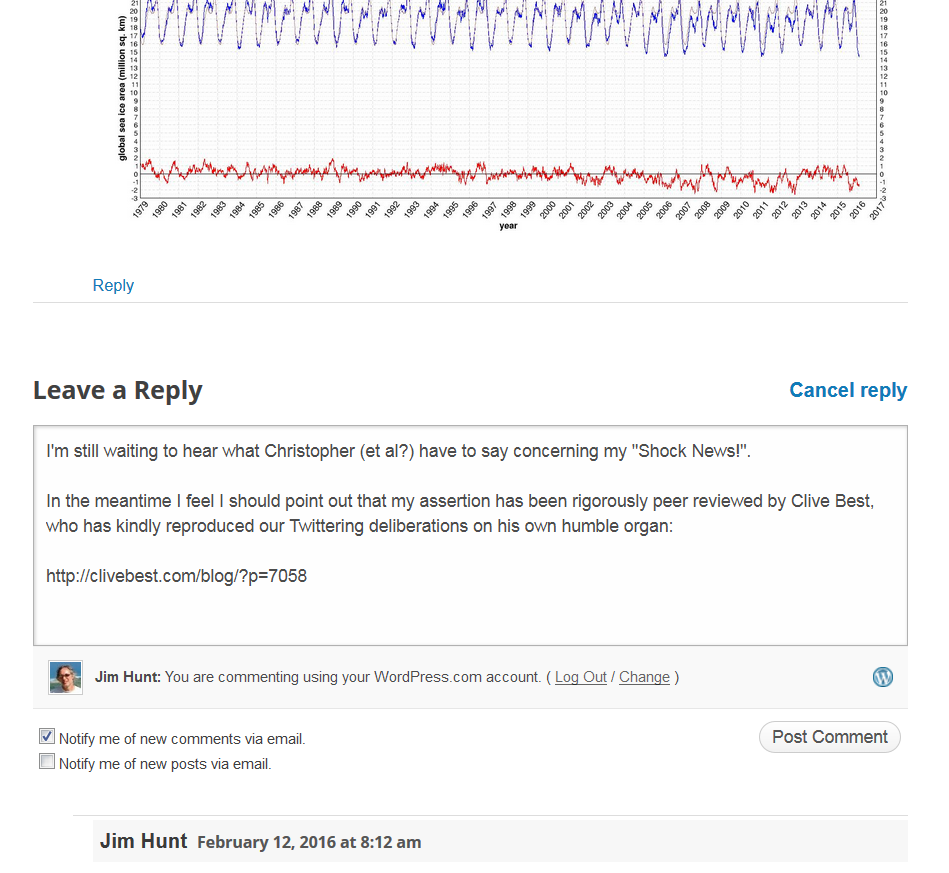
This measure doesn’t tell us all that much about the health of either Arctic or Antarctic regions, if only because the seasons move in opposite directions (nevertheless, the global sea ice trend is down). It’s just an interesting statistical factoid.

Rest assured that nonetheless we will attempt to bring this “statistical factoid” to the attention of those who have been merrily claiming for the past few years that “the trend on the daily observations of global sea-ice extent by the satellites since 1979 is remarkably close to zero.”

To begin with, let’s see when (if?) this comment sees the cold light of day shall we?

2016-02-18_1911-WUWT

[Edit – 08:30 UTC February 19th 2016]

The comment shown above has now seen the light of day, whereas a number of others have not. Here’s the rest of the assorted conversations, so far:

Them:

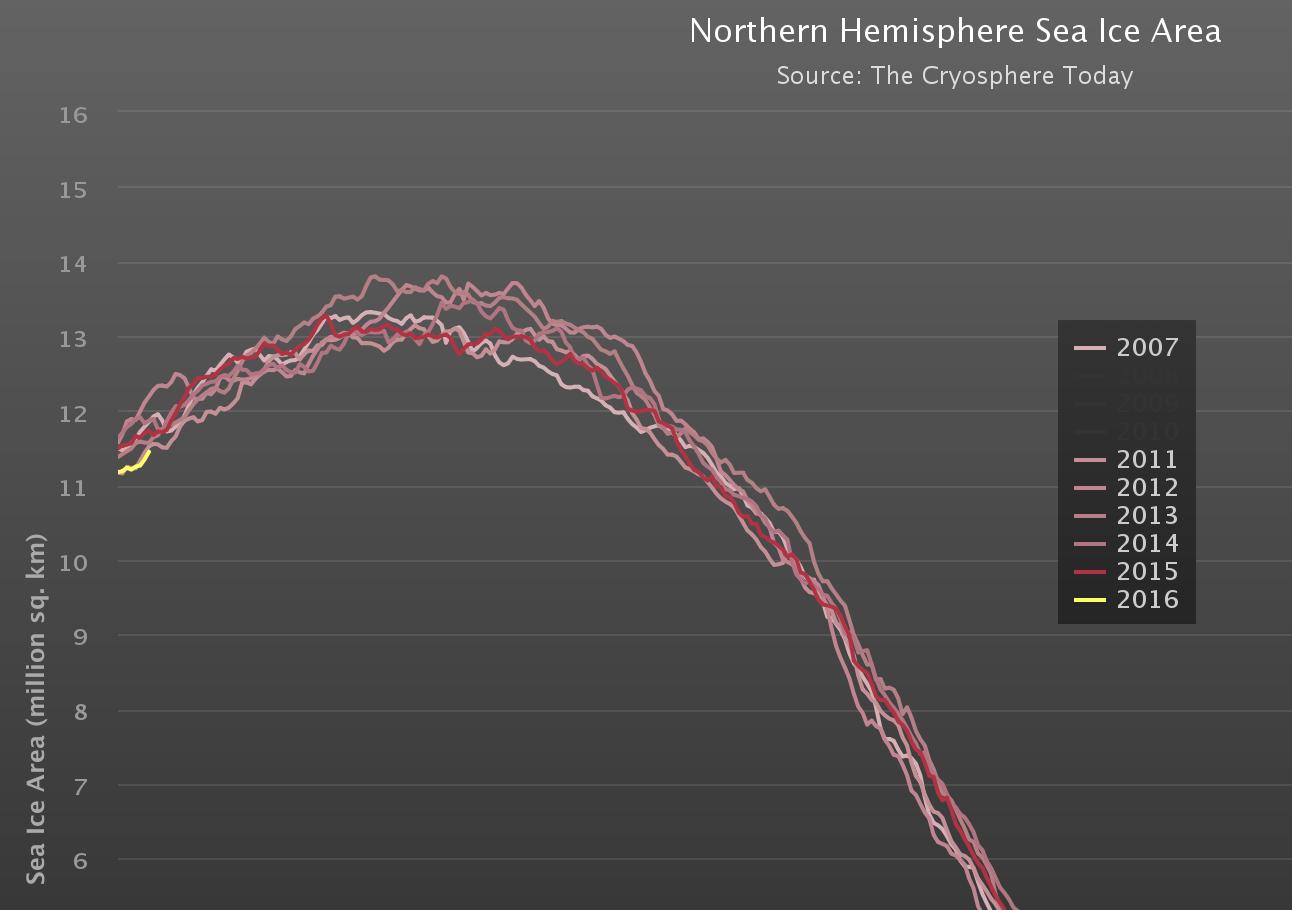
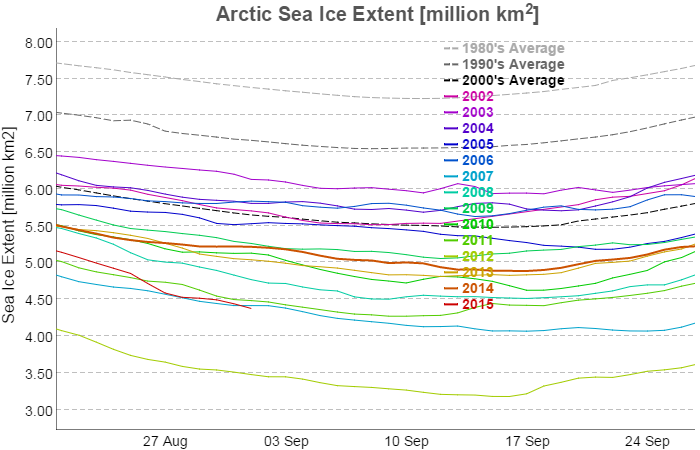
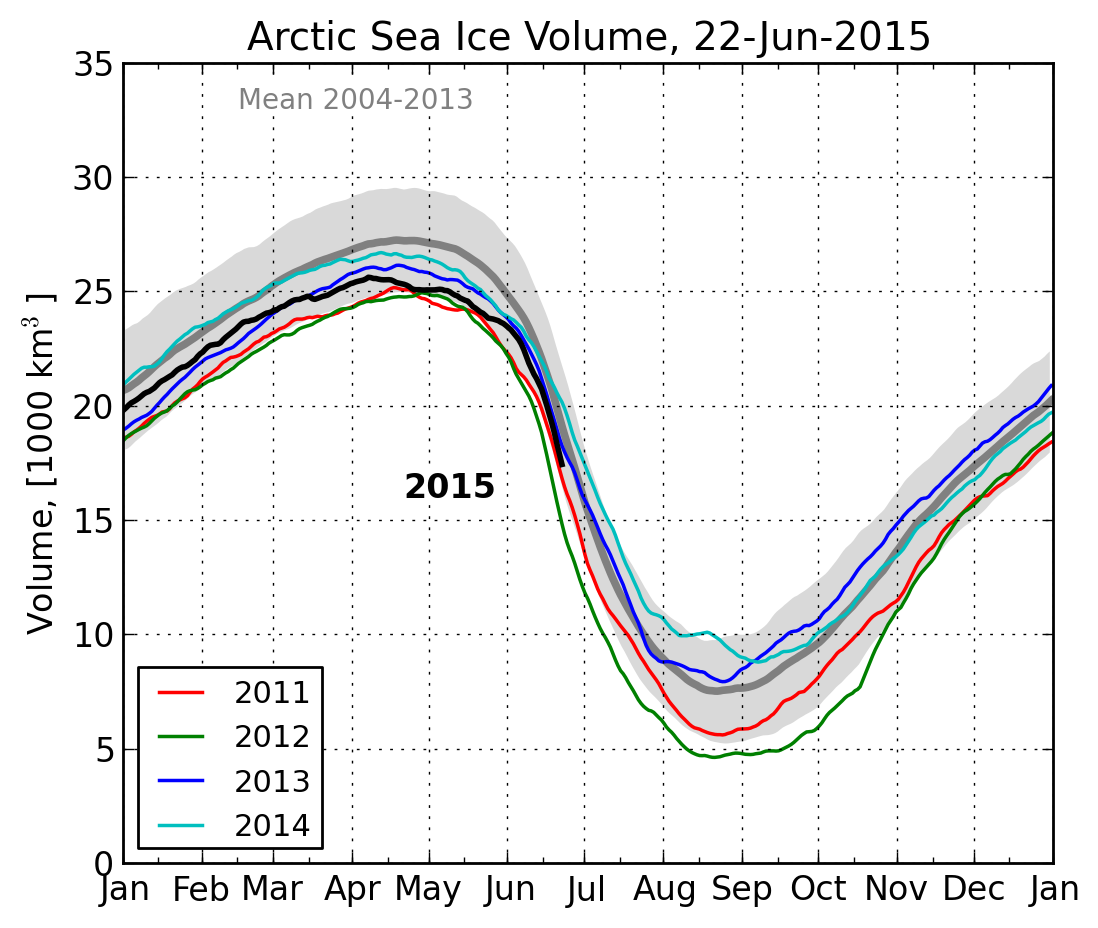
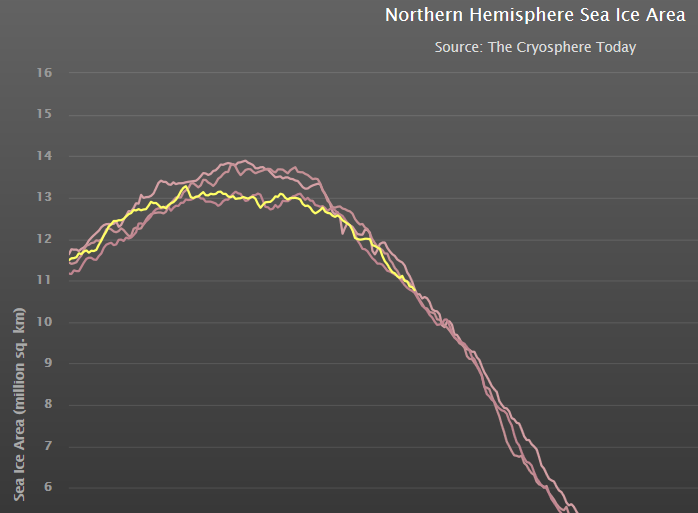
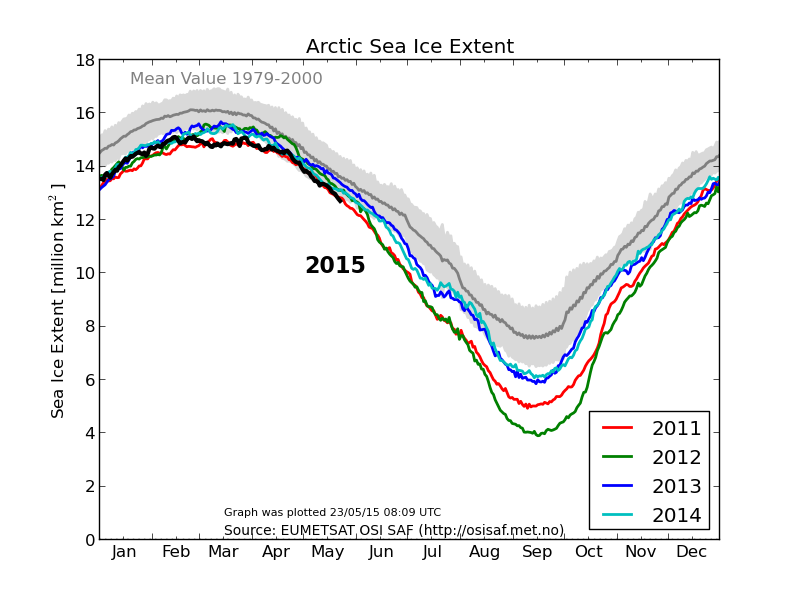
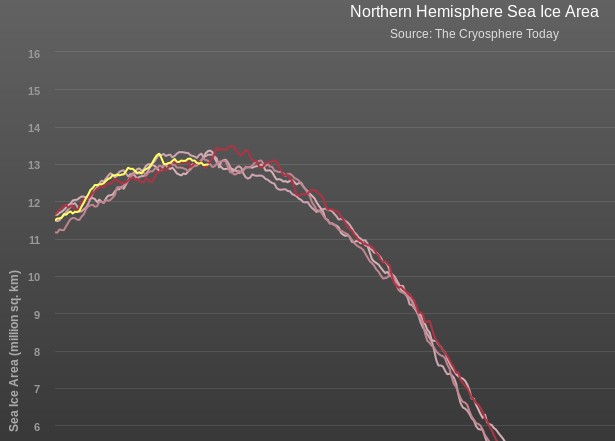
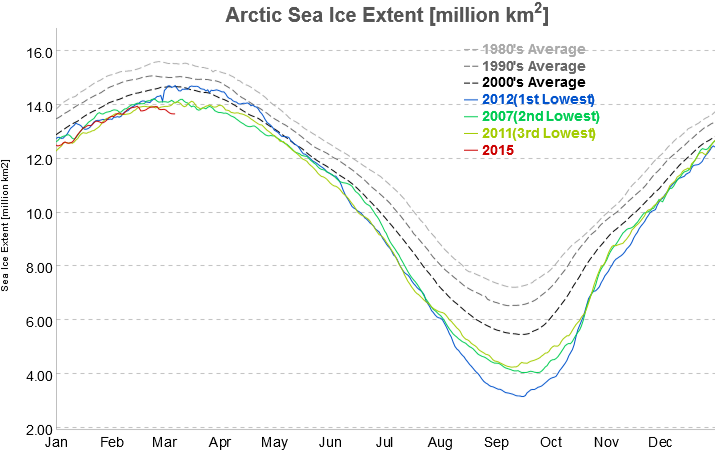
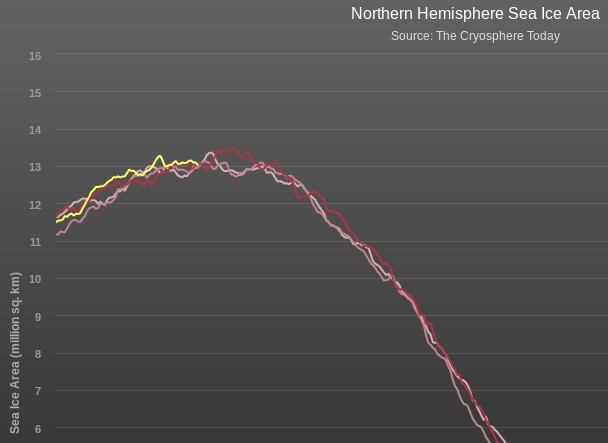
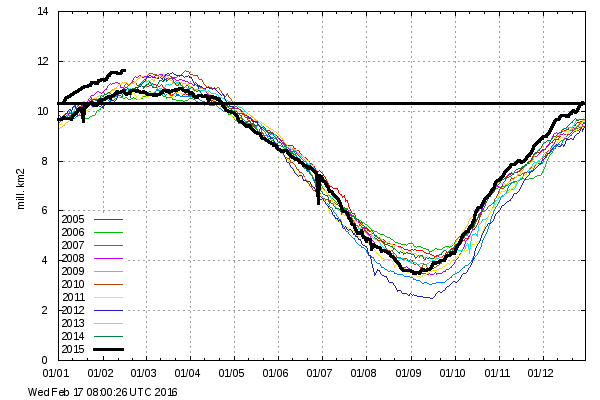
I prefer this chart:

DMI_extent-30_20160217

That’s at 30%, which eliminates most of the wind-blown bergs. It measures the thicker ice cover, so it’s a more accurate representation.

You can see 2016 starting to move up after a strong 2015 finish.


Us:

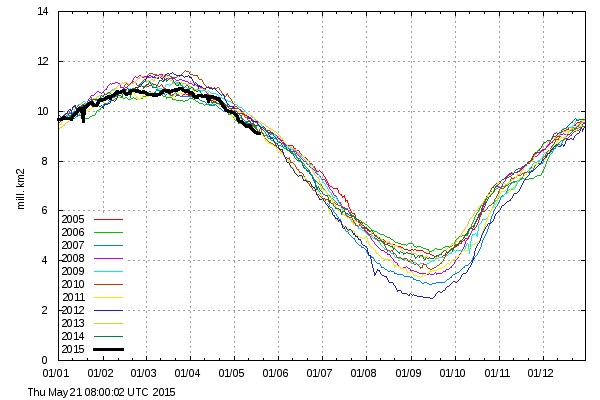
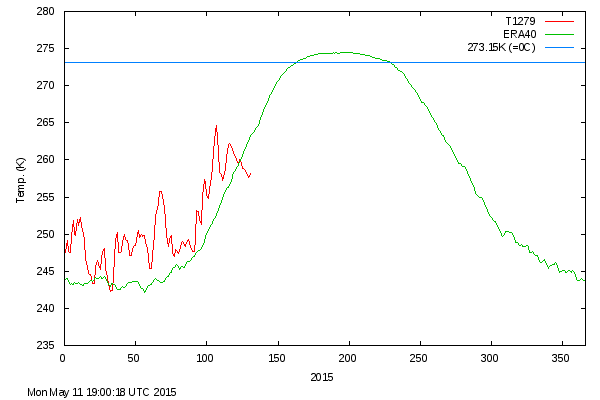
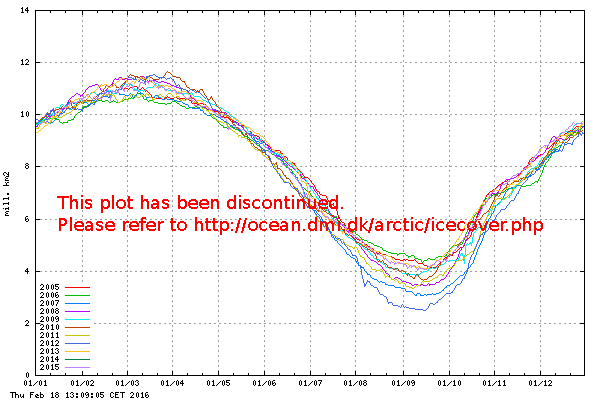
This one is currently still invisible over there:

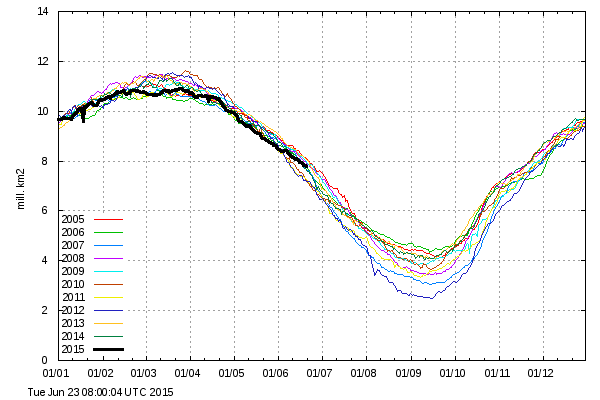
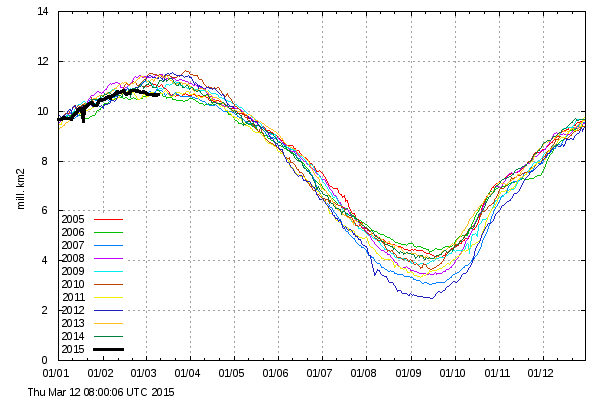
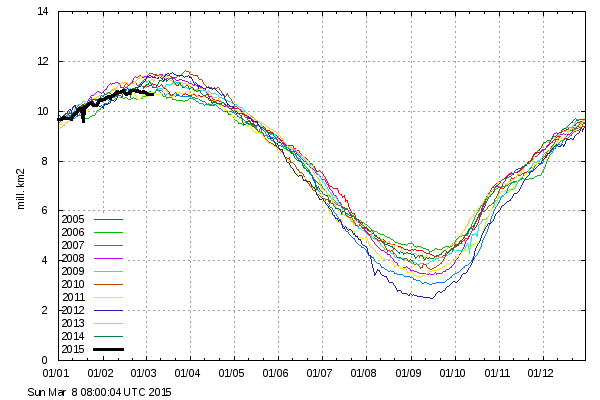
That’s the one which the Danish Meteorological Institute no longer even mention on their website because it’s been deprecated and unsupported for so long:

http://ocean.dmi.dk/arctic/icecover.uk.php

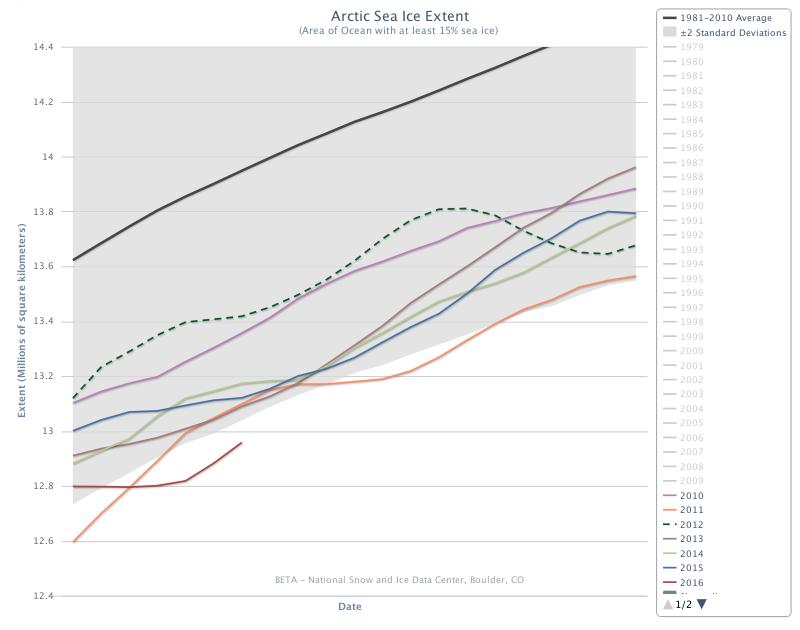
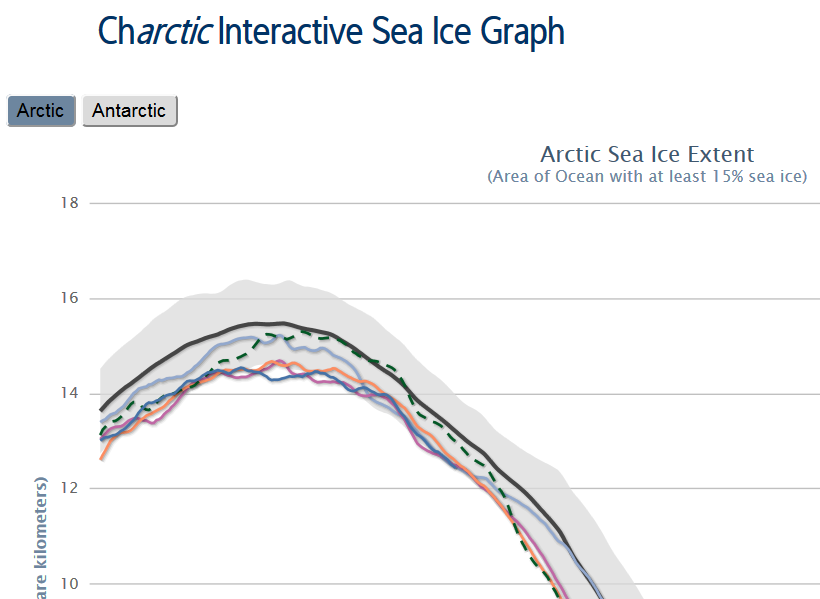
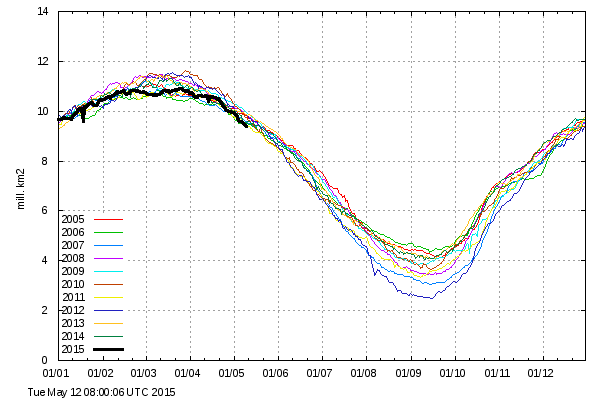
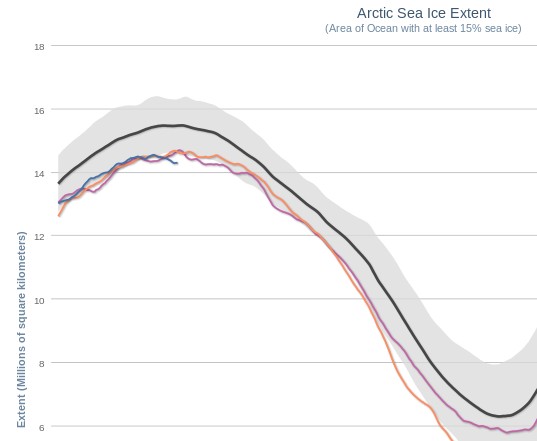
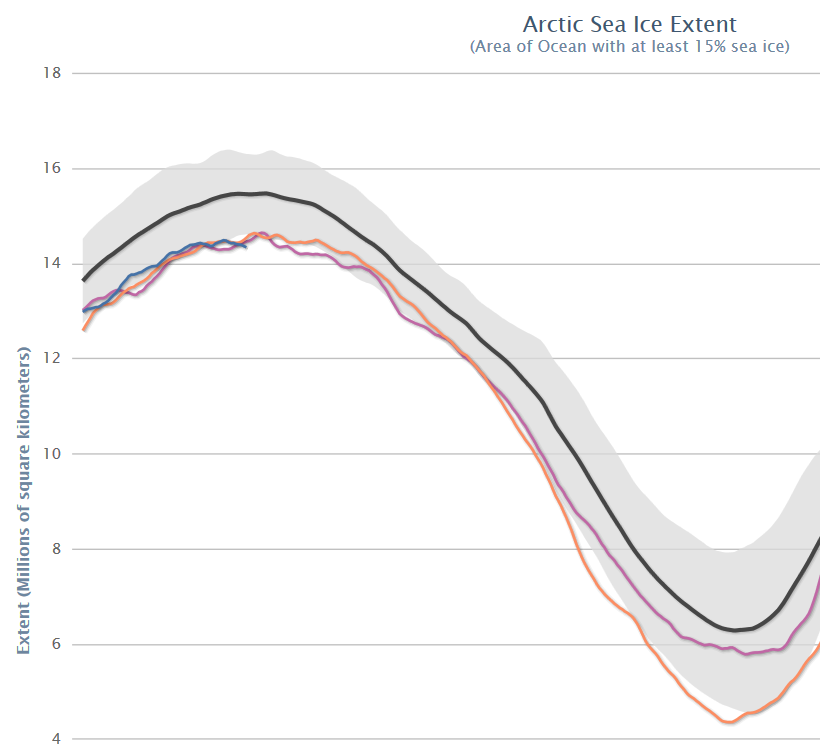
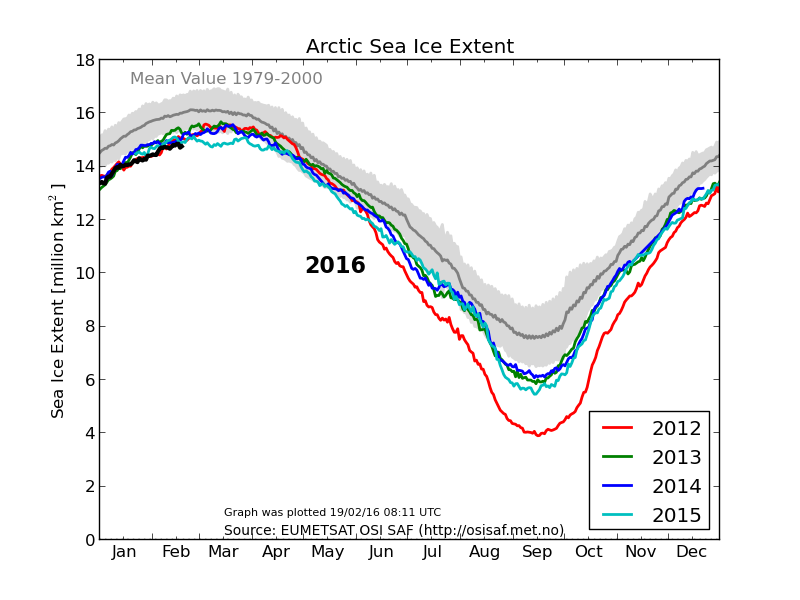
Here’s the graph (of Arctic sea ice extent only) which they currently recommend, which shows broadly the same thing as the NSIDC’s version:

DMI_icecover_20160219

Can we get back to GLOBAL sea ice area/extent now?

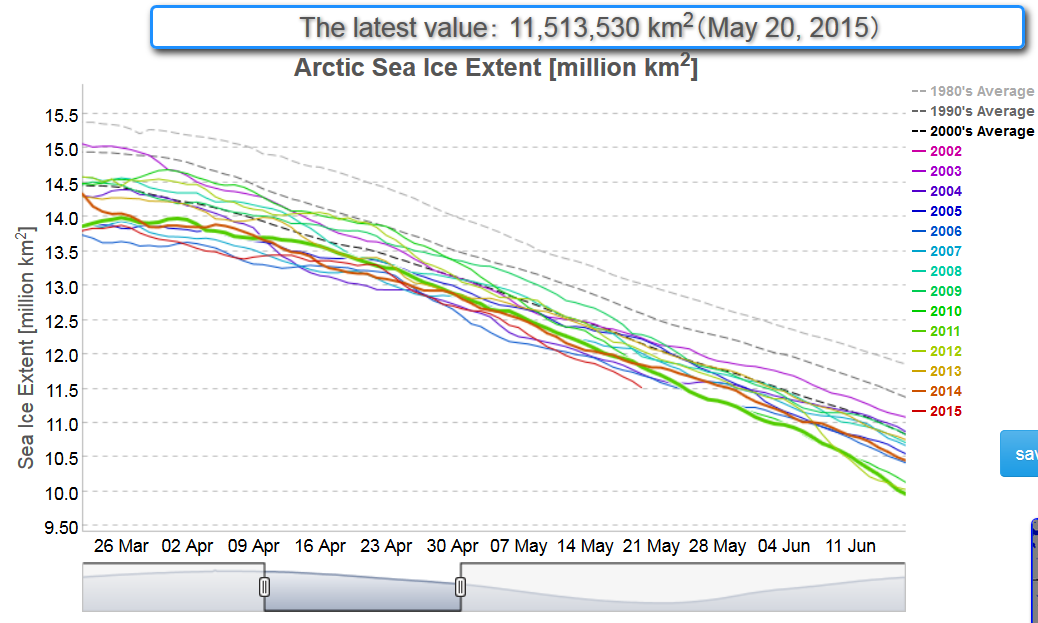
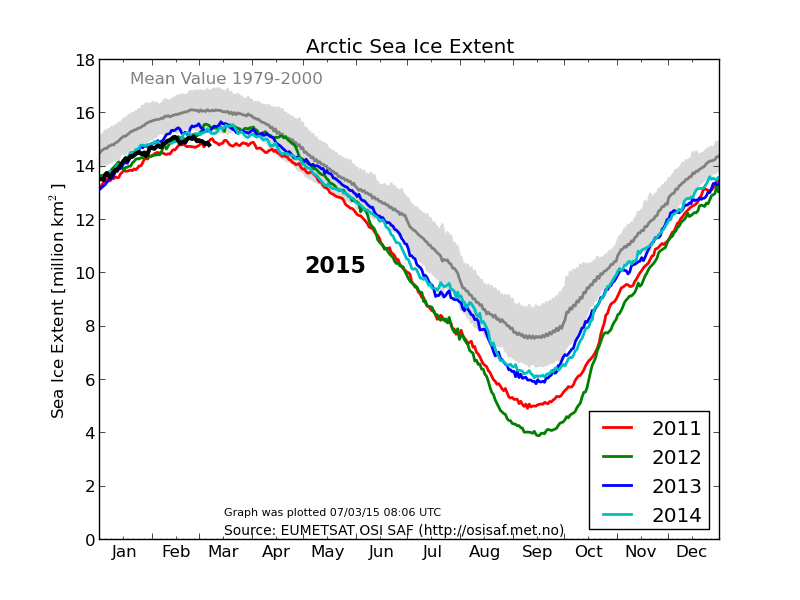
I didn’t want to use up my limited allocation of links over at WUWT, but here is what the Arctic sea ice chart that WUWT mods (and “Steve Goddard“) prefer currently looks like:

DMI_extent-30_20160218

Maybe that’s why the WUWT moderator in question felt compelled to display Wednesday’s chart instead of Thursday’s?


Them:

[I don’t think any of [Monckton, Soon or Legates] with bother with your off-topic question. as said earlier, your entire m.o. is to launch a taunt, and it doesn’t merit a response since this isn’t any particularly noteworthy event. -mod]


Us:

This one is currently still invisible too:

Have you got something against Clive Best? Both my comments that link to our conversation about global area/extent are still invisible.

The “lowest EVAH!!” value of Christopher Monkton’s favourite sea ice metric doesn’t merit a response from him? On an article subtitled “killer questions that expose how wrong and ideologically driven they are”? Surely you jest?

Quoting from the ice cool Snow White:

On January 19th 2016 the Watts Up With That blog published an article by one “Christopher Monckton of Brenchley” entitled “20 false representations in one 10-minute video“. The 15th “false representation” read as follows:

That Arctic sea ice is declining, though Antarctic sea ice has been on a rising trend and reached a satellite-era record in early 2015, and though the decline in Arctic sea ice is chiefly only in a few late-summer weeks and is a small fraction of the seasonal variation in sea-ice extent, so that neither the extent nor the trend of global sea ice (from the University of Illinois) shows much change throughout the satellite era.

Where is the Good Lord when you need him? Where is Willie Soon for that matter?


Here are my other comments that have yet to catch the eagle eyes of the Watts Up With That band of merry moderators:

2016-02-18_1951-WUWT

2016-02-15_1800-WUWT

2016-02-12_2353-WUWT


* Since satellite records began

More Heat Heading for the North Pole

We speculated a few days ago about whether the “Son of Storm Frank” might have battered Britain by now, and be sending a 10 meter swell past Svalbard towards the Arctic sea ice edge. That’s not quite how things have worked out in practice however! We haven’t had another named storm affecting the United Kingdom directly, but we have received a series of long distance swells from a sequence of hurricane force storms further out in the North Atlantic. I even managed to test my Arctic surfing equipment by personally partaking in the swell generated by Hurricane Alex!

Moving from the water into the air, here’s the Danish Meteorological Institute’s forecast for Greenland tomorrow:

Greenland-20160123+24h

If you’re at all familiar with isobars you’ll note yet another storm off Southern Greenland and that comparatively warm, moist air will be heading up the east coast of Greenland towards the Fram Strait, albeit not at the speeds generated by Storm Frank! As a consequence here is Climate Reanalyzer’s surface temperature anomaly map for first thing tomorrow:

CCI-AnomT-20160123+24h

and here is how it looks by Wednesday lunchtime:

CCI-AnomT-20160123+108h

As you can see, the ultimate effect of the recent hurricane force storms in both the Atlantic and the Pacific is to attack the Arctic with warm, moist air from both sides. Whilst we wait to see exactly how this much shorter term forecast pans out, particularly at the North Pole itself, the DMI’s graph of temperatures in the central Arctic has burst back into life after a “brief hiatus” in the New Year. Here’s how it looks at the moment:

DMI-T80N-20160123

New Year 2016 Arctic Meltdown Update

On January 1st 2016 the 15% concentration threshold daily Arctic sea ice extent metric reported by the United States National Snow and Ice Data Centre reached the lowest ever level for the first day of any year since their satellite derived records began in 1979. A couple of days later the more familiar 5 day trailing averaged extent also reached the lowest ever level for the date:

Charctic-20160107

Cryosphere Today have been somewhat sluggish about updating their records of Arctic sea ice area, but have at long last revealed that their metric is now also at the lowest ever level for the date:

CT-NH-20160107

Meanwhile Great White Con commenter “Just A Thought” states that:

I find it hard, with what I do have access to, to see why everyone is so worried that the Arctic is melting.

He or she has evidently only had access to the propaganda perpetrated by Tony Heller (AKA “Steve Goddard”) on his so called “Real Climate Science” blog. Mr. Heller’s latest Arctic pronouncement on December 31st 2015 is entitled “Arctic Meltdown Update” and claims that:

Experts say that a terrifying storm melted the North Pole yesterday. This unprecedented melting event has caused Arctic ice to reach its highest December extent in over a decade.

justifying that comment with the following graph of his beloved (albeit deprecated) 30% concentration threshold DMI extent metric:

DMI-30-2015-12-31-

Here’s a video revealing the effect of the recent “terrifying storm” on the sea ice on the North Atlantic side of the Arctic:

As you can see the ice at the North Pole didn’t melt away. However the ice edge did retreat in the immediate aftermath of what is referred to here in the United Kingdom as “Storm Frank“. Frank led to lots of flooding in the North of the nation, and also to some strong winds inside the Arctic Circle:

WW3Wind-20151230-1400

Those winds, travelling over a long stretch of open ocean, produced some pretty significant waves, speeding in the direction of the sea ice edge:

WWIII-20151231-0000

Meanwhile temperatures near the North Pole did briefly rise above the freezing point of sea ice in the middle of the Arctic winter. Here’s the Danish Meteorological Institute’s view of the air temperatures in the central Arctic:

meanT_20151231

and here is NOAA’s temperature anomaly reanalysis for December 30th 2015:
NOAA-anomT_20151230

Personally I reckon the 25 m/s winds and resulting 10 meter waves had more effect on the sea ice metrics than the 25 °C above normal air temperatures, but your mileage may of course vary, especially if your pseudonym is “Steve Goddard”!

The 2015 Arctic Sea Ice Minimum Extent

We’ve now entered the month of September, the month in which Arctic sea ice extent and area reach their annual minimum levels, historically at least. To set the scene, here’s the extent graph from the Japan Aerospace Exploration Agency (JAXA) for September 1st, based on data from the AMSR2 sensor on board their SHIZUKU satellite.:

IJIS-sep01

As you can see, the 2015 curve has just dropped below 2007 and is now at the second lowest level for the date in JAXA’s records. As the month progresses we’ll be taking a look at a variety of other metrics as they start to report their numbers for September.

To set the scene, here’s the University of Hamburg’s map of Arctic sea ice concentration for September 1st, again based on AMSR2 data:

Arc_20150901_res3.125

Here’s a video showing how that map has changed over the last two months:


Notice in particular the effect of the recent Arctic cyclone on the sea ice in the lower left quadrant. Note also our comment that:

[There is] a large potential fetch across the East Siberian, Chukchi and Beaufort Seas should any further cyclones occur in the area over the next few weeks. The conditions now exist for an even more damaging swell to be generated before the 2015 minimum Arctic sea ice extent is reached.

By now you may be wondering if we have a prediction to make? Well, we predict it still all depends on the weather! However here’s how the “probabilistic” 50 day ahead prediction from Andrew Slater of the NSIDC looks at the moment: SlaterExtent-20150831

If I were a betting man I’d say that the red line will ultimately put in a lower low than the dark blue one.

Finally, for the moment at least, take a look at the GFS surface level pressure forecast for later today, courtesy of MeteoCiel:

Can you see the 1000 hPa central pressure low spinning over the Laptev Sea? It’s currently not very deep, and it’s not over the East Siberian Sea either, but watch that space along with us as we wait to discover where and when the assorted Arctic sea ice metrics reach their minima for 2015.

[Edit – September 3rd 2015]

The latest edition of the US National Snow and Ice Data Center’s Arctic Sea Ice News has just been published. In the section on the imminent minimum they show this graph:

and say that:

Starting with the ice extent observed on August 31 and then applying 2006 loss rates, the slowest rate in recent years, results in the highest extrapolated minimum for 2015 of 4.50 million square kilometers (1.74 million square miles), and a September monthly average extent of 4.59 million square kilometers (1.77 million square miles). The lowest daily minimum comes from using the 2010 pace, yielding an estimated 4.12 million square kilometers (1.67 million square miles) for the daily minimum, and a September monthly average extent of 4.33 million square kilometers (1.67 million square miles).

Using an average rate of ice loss from the most recent ten years gives a one-day minimum extent of 4.38 ± 0.11 million square kilometers (1.79 million square miles), and a September monthly average of 4.49 ± 0.09. As of August 31, the 5-day running daily average extent is 4.72 million square kilometers. If no further retreat occurred, 2015 would already be the sixth lowest daily ice extent in the satellite record.

The forecast places the upcoming daily sea ice minimum between third and fourth lowest, with fourth more likely. There is still a possibility that 2015 extent will be lower than 4.3 million square kilometers, the third lowest sea ice extent, surpassing the 2011 sea ice extent minimum, and a small chance of surpassing 2007, resulting in the second-lowest daily minimum. This assumes that we continue to have sea ice loss rates at least as fast as those of 2010. This was indeed the case for the final ten days of August 2015.

Somewhere between 2nd and 6th then! We felt compelled to enquire on Twitter:

Does a Lie Told Often Enough Become the Truth?

This morning “Steven Goddard” quotes Lenin and Hitler with apparent approval. In an article entitled “Today’s Featured Climate Criminals – The Guardian” he closes with the following quotations:

“A lie told often enough becomes the truth”
– Vladimir Lenin

“The most brilliant propagandist technique will yield no success unless one fundamental principle is borne in mind constantly and with unflagging attention. It must confine itself to a few points and repeat them over and over. Here, as so often in this world, persistence is the first and most important requirement for success”
– Adolf Hitler

The few points about the Arctic that Tony Heller repeats over and over look like this today:

The Guardian reports that Arctic ice is melting “faster and earlier”

Arctic ice melting faster and earlier as scientists demand action | Environment | The Guardian

Arctic sea ice is melting very slowly, and is nearing a mid-summer high for the past decade.

unRealScience-DMI-20150623

Ocean and Ice Services | Danmarks Meteorologiske Institut

Arctic sea ice looked like this on June 20 – nothing like the fake picture in their May 5 article.

unRealScience-Ice-20150623

The Greenland melt season started more than a month late, and has seen below normal melt every day this year.

unRealScience-Grelyenland-20150623

Greenland Ice Sheet Surface Mass Budget: DMI

The Guardian report cited by Steve/Tony does in actual fact date from May 5th 2015. For an up to date alternative viewpoint see for example:

DMI Arctic sea ice volume on June 22nd 2015

NASA Worldview “true-color” image of broken ice north of the East Siberian Sea on June 22nd 2015, derived from bands 1, 4 and 3 of the MODIS sensor on the Aqua satellite
NSIDC Greenland melt area graph on June 21st 2015

Arctic Sea Ice Fails To Track 2005/2006

The pseudonymous “Steve Goddard” proudly proclaims this morning that “Arctic Sea Ice Continues To Track 2005/2006“. Tony Heller states:

Experts say that the Arctic is in a “death spiral” – but for the past two years it has been tracking 2005/2006 – the years with the two highest summer extents of the past decade.
unReal_DMI-may-21-04-26

For the past four years, summer melt season temperatures in the Arctic have been well below normal.
unReal-DMI-T2_20150520

No matter how many times experts lie about it, the Arctic is not melting down.

The Arctic, of course, has other ideas and continues to fail to conform to the narrative over at (un)Real Science. Today the NSIDC 5 day average extent Arctic sea ice extent is in actual fact at the lowest level for the time of year since their records began:
2015-05-20_Charctic
In view of “Steve”/Tony’s headline you may find it surprising that so is his much beloved DMI 30% threshold extent extent metric (displayed in full):
DMI-30-20150521
and so is the JAXA 15% extent extent:
JAXA-20150520
Holding out by the merest whisker (for the moment) is the Cryosphere Today area metric, which is nonetheless lower than on the same day in both 2005 and 2006:
2015-139-CTArea
Quod Erat Demonstrandum?


[Edit – May 23rd 2015]

After being used by a polar bear to inspect its feet, the webcam trained on ice mass balance buoy 2015A is now pointing in the right direction again. It reveals that the Arctic is in fact “melting down” even as “Steve”/Tony maintains that it isn’t:

2015A-cam-20150523-2

As if further proof were needed, the DMI 15% threshold extent graph extent is also now clearly lower than previous years at this time:

DMI-15-20150523

The New Normal In The Arctic

The latest headline on the so called “Real Science” blog reads as follows:

The New Normal In The Arctic – Cold Summers

According to “Steven Goddard”:

For the third year in a row, near-polar temperatures have dropped below normal in May.

meant_20150511

Both of the last two years, temperatures stayed below normal for the entire melt season.

The below normal summer temperatures are keeping the ice from melting, and have led to a large expansion in the amount of thick multi-year ice.

However the Arctic is unfortunately failing to cooperate with that narrative. Today we are unhappy to report that Tony Heller‘s favourite Arctic sea ice metric, the Danish Meteorological Institute 30% threshold extent, is at the lowest level ever for the date since their records began:

DMI-30_20150512

What is more, so is the JAXA 15% extent metric:

2015-05-12_JAXA

As if that wasn’t enough to be going on with, some big holes have already appeared in the middle of the supposedly multi-meter thick, multi-year sea ice in the Beaufort Sea, well away from the open water already warming up off the Mackenzie Delta:

NASA Worldview “true-color” image of The Beaufort Sea on May 11th, derived from bands 1, 4 and 3 of the MODIS sensor on the Aqua satellite

Some Statistics for the 2015 Economist Arctic Summit

Professor Jason Box was good enough to add some expert commentary to our recent story about a large calving of the Jakobshavn Glacier last month. Consequently we have just watched his presentation to the 2015 Economist Arctic Summit at the Hotel Bristol in Oslo with much interest. Here are our edited highlights from the conference’s Twitter feed:


Here are some relevant Arctic sea ice metrics. We will continue to update them as the latest figures arrive throughout the rest of today:

IJIS/JAXA daily extent: 13,648,280 km² – Lowest ever level for the date in records going back to 2003

vishop_sic_20150311
 

DMI “30%” daily extent: 10,676,900 km² – Lowest ever level for the date in records going back to 2005

DMI-30-icecover_20150312
 

NSIDC daily extent: 14,330,000 km² – Lowest ever level for the date
NSIDC 5 day average extent: 14,280,000 km² – Lowest ever level for the date in records going back to 1979
Charctic-201503011Crop
 

Cryosphere Today daily area: 12,984,410 km² – Lowest ever level for the date in records going back to 1979
CTArea-2015-Day69

Arctic Sea Ice Area Lowest Ever (For the Date!)

As we reported on February 18th, some of the Arctic sea ice extent metrics reached the lowest levels for the date in their respective histories quite some time ago. Today though, we’re looking at a full house. The daily NSIDC and IJIS extent numbers have both been at all time lows for the date for quite some time now. Here’s how the NSIDC 5 day average extent looks at the moment:

2015-03-06_NSIDC

and here’s the IJIS/JAXA daily extent:

vishop_sic_extent-20150307

Meanwhile a series of storms in the North Atlantic have been bringing large surf to the shores of the Western United Kingdom, and battering the edge of the sea ice in the Greenland and Barents Seas. Here’s how GFS looks currently, as visualised by MeteoCiel:

gfsnh-20150308-6

In addition this has  resulted in warm air from further south being funnelled into the high Arctic, so much so that the surface temperature anomalies currently look like this:

CCI-AnomT-20150308+003

whilst the temperatures 2 metres above the surface of the Arctic look like this:

CCI-Temp2m-20150308+003

If you look closely you’ll see that air temperatures 2 metres above the North Pole are currently similar to those around the shores of the Great Lakes of North America.  As a result of all this atmospheric activity today we bring you news that both the Danish Meteorological Institute “new” 15% extent:

DMI-15-icecover_20150307

and “old” 30% metrics:

DMI-30-icecover_20150308

have now joined the club.

The Cryosphere Today area metric has been holding out against the trend in sea ice extent for weeks, but we can confidently predict that when their next update is released it too will also reveal the lowest ever Arctic sea ice area for the 65th day of the year, in records going back to 1979. Here’s how their graph looks currently:

CTArea-2015-Day64


Shock News – Massive Calving of Jakobshavn Isbræ

Jakobshavn Isbræ is a glacier in Western Greenland made (more?) famous by James Balog in his “Chasing Ice” movie. Here’s the “official video”:

which claims that it:

Captures [the] largest glacier calving ever filmed. On May 28, 2008, Adam LeWinter and Director Jeff Orlowski filmed a historic breakup at the Ilulissat Glacier in Western Greenland.

Depending on which languages you prefer to mix and match “Ilulissat Glacier” is another name for the self same glacier. So is “Sermeq Kujalleq”. Now comes news that something similar has just happened, albeit captured only by satellites in the twilight of the Arctic “spring”. Over on the Arctic Sea Ice Forum Espen Olsen posted late last night (UTC):

Believe it or not! Massive calving seen at the southern branch of Jakobshavn Isbræ

together with this animation created using images from the Landsat 8 Operational Land Imager:

Jakobshavn-feb12-feb19-2015-2

We’ve just grabbed this Sentinel-1A synthetic aperture radar image from February 15th 2015 via Polarview, which appears to suggest that the calving took place before 20:38 UTC on that date:

S1A_Jakobshavn_20150215T203828

Here’s a Sentinel-1A image via “nukefix” at the Arctic Sea Ice Forum, which confirms that the calving took place on or before February 16th:

subset_0_of_S1A_IW_GRDH_1SSH_20150216T095944_20150216T100009_004647_005BB8_B43C_Calib_EC_Sigma0_HH_db

This is a before/after animation from “A-Team” on the Arctic Sea Ice Forum, using 15m resolution Landsat images:

Jakobshavn-anim

Finally, for the moment at least, Espen Olsen provides an illustration of the retreat of the calving face of Jakobshavn Isbræ since 1851:

Jakobshavn-calving1851-2014

This most recent event does not bring the calving face further east than the position in summer 2014. However the sun’s rays are only just returning to that part of the planet, and the next one may well do so.

[Edit – 24/02/2015]

We’ve phoned DMI and NSIDC as well, but Jason Box who is a Professor at the Geological Survey of Denmark and Greenland has been the first to respond with an opinion about how unusual this event is:

It’s an interesting finding. In the attached prepared by Karina Hansen you will see a light yellow polygon illustrating the end of melt season 2014 ice. Jakobshavn front position retreated from the Feb 2014 (pink line) and Feb 2015 (green line) positions. The Feb 2014 and Feb 2015 positions are roughly the same with 2014 Feb being further retreated than Feb 2015:

Jaki_2015

A cautious response: even if this calving were abnormal, we will likely see an advance in the next weeks that will fill the void. Why?

A) This glacier flows fast, and

B) Now with less flow resistance there will likely be an acceleration making the void filling happen even faster.

Here are annual end of melt season area changes measured by PROMICE.org. These are being updated. I will ask Karina Hansen today to update for 2014 and 2015. We could have that result in a few hours.

1999/00 -2.750
2000/01 -2.473
2001/02 -16.357
2002/03 -45.617
2003/04 -21.235
2004/05 -10.015
2005/06 -4.151
2006/07 -3.830
2007/08 -3.202
2008/09 -2.174
2009/10 -8.725
2010/11 -6.693
2011/12 -13.743
2012/13 -2.826

In context of the ongoing retreat, I would speculate that this retreat could make further retreat more likely because the acceleration from B) would cause ‘dynamic thinning’ that through a positive feedback would reduce glacier bed friction facilitating further thinning and acceleration. This feedback is an amplifier and not runaway but being activated would precondition Jakobshavn glacier for further retreat.

[Edit – 01/03/2015]

Espen Olsen suggests on the Arctic Sea Ice Forum:

Watch the speed of Jakobshavn over 9 days:

Jak-20150228