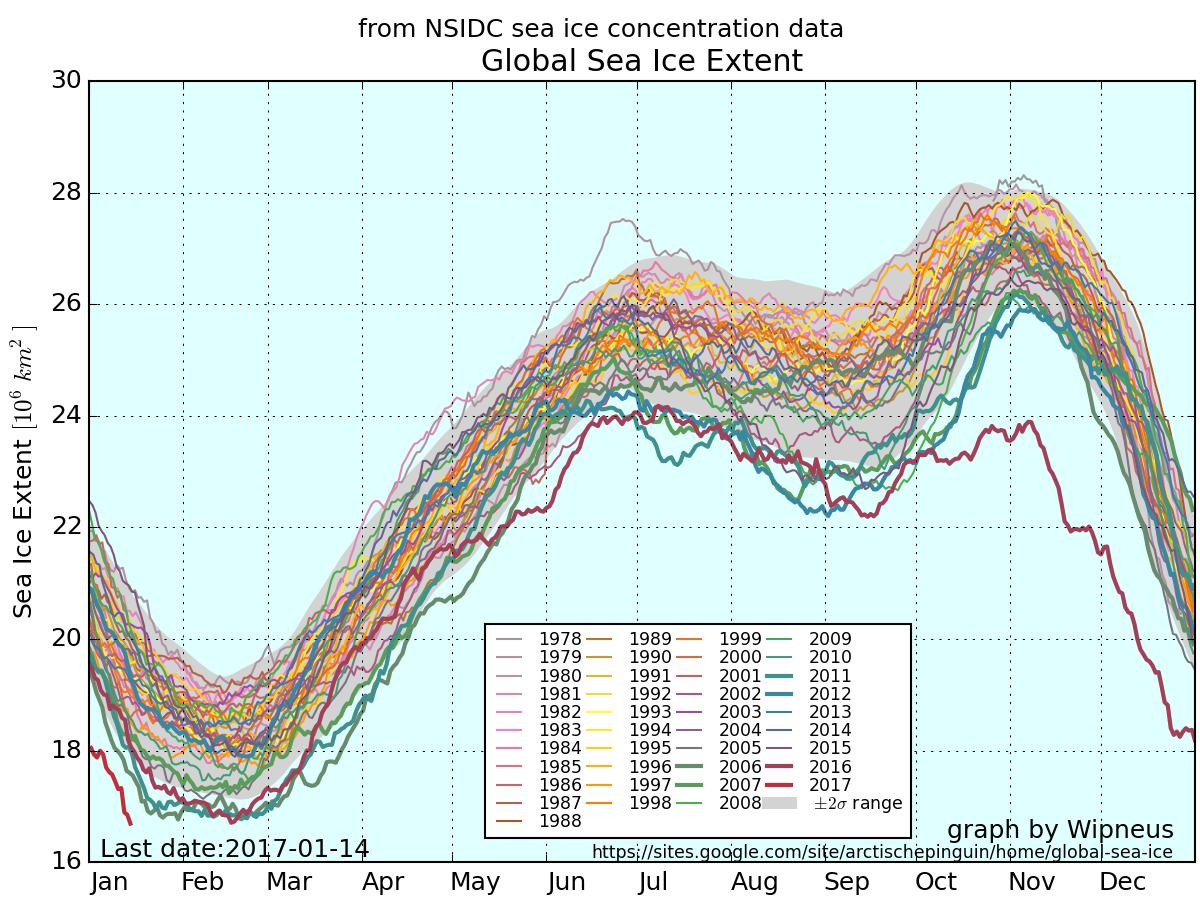
Here once again is the up to date version of Wipneus’ graphic graphic, this time of global sea ice extent:
As you can see, global sea ice extent has just reached the lowest ever level in the National Snow and Ice Data Center’s satellite records going back to 1979. It was over a month later when the previous record was broken in February 2016, so there is plenty of time for the metric to fall further.
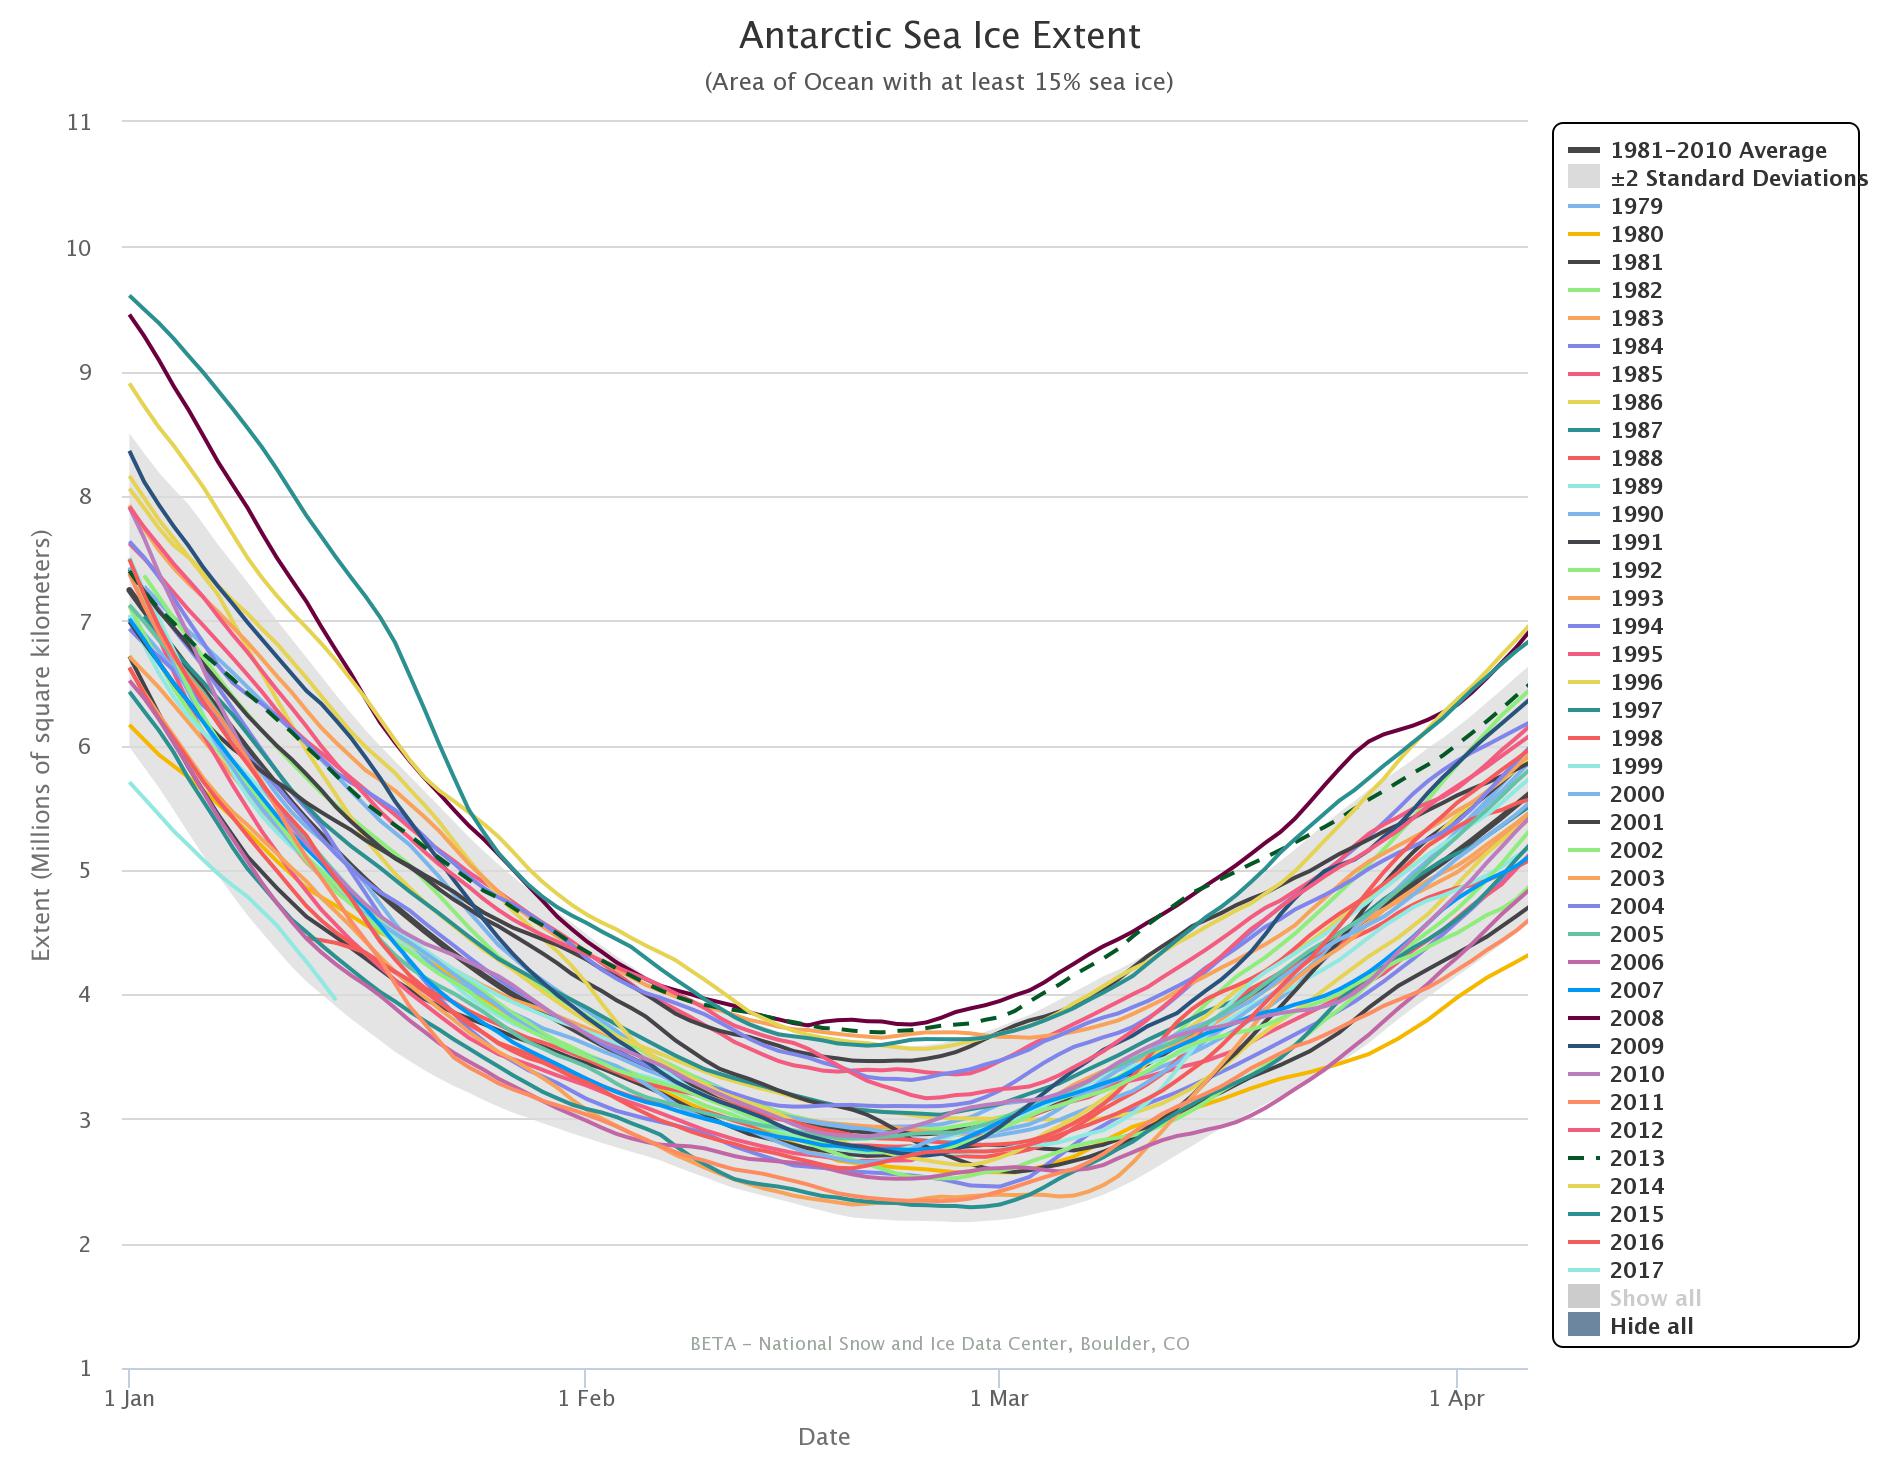
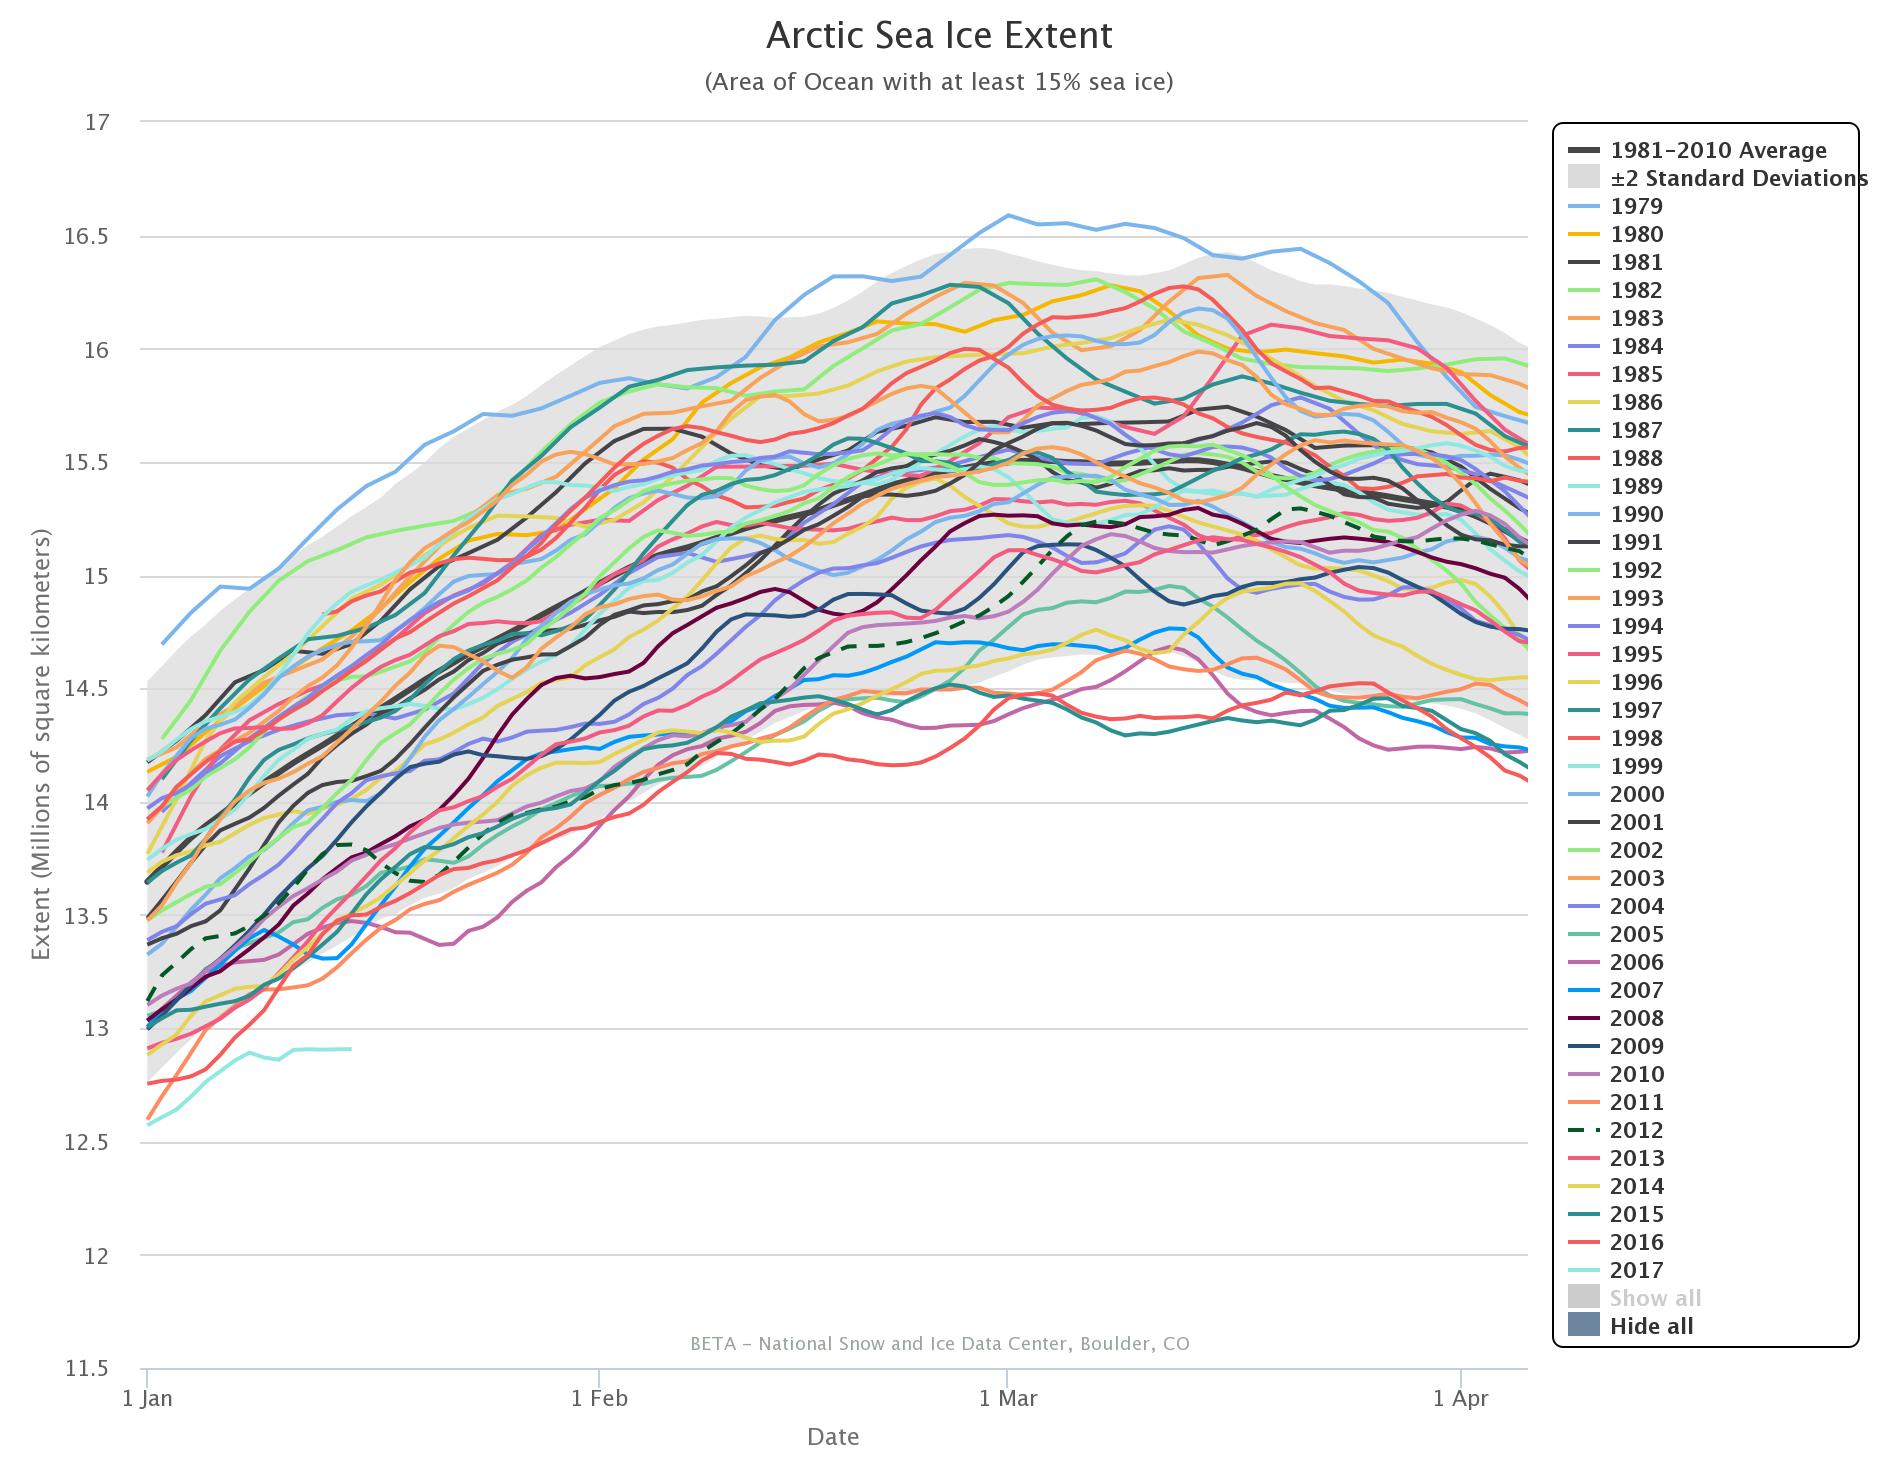
The 2017 curves in the NSIDC’s own extent graphs are coloured in a pale shade of blue. Even so they’re easy to pick out since both Antarctic and Arctic extent are at the lowest level for the date in NSIDC’s records by a considerable margin:
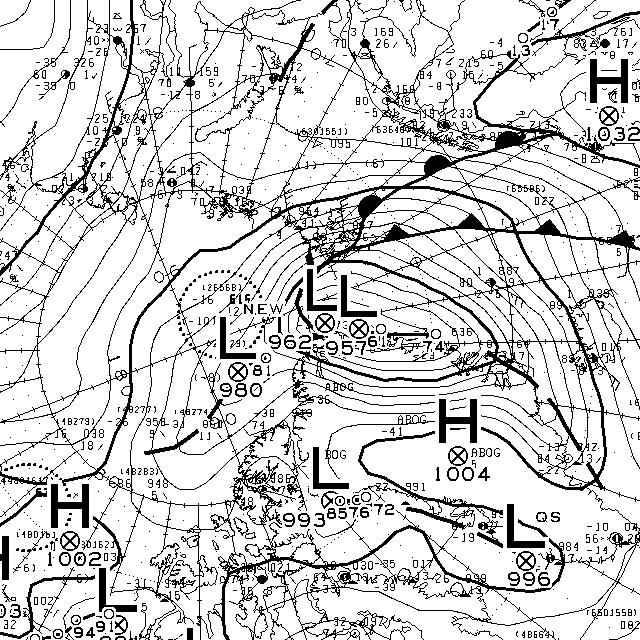
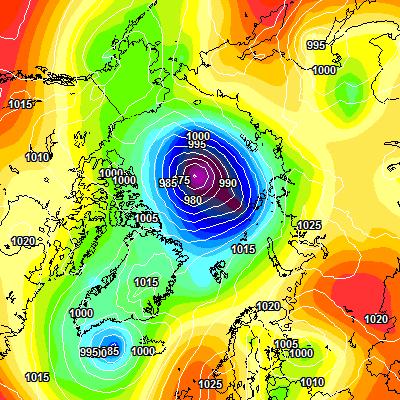
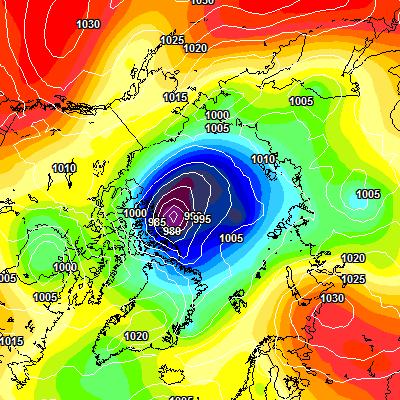
Antarctic sea ice extent is still falling, and the Arctic has been flatlining for several days now and more trouble is heading its way. Another Fram Strait cyclone is brewing, and this time around the storm’s minimum central pressure is already down to 957 hPa according to Environment Canada:
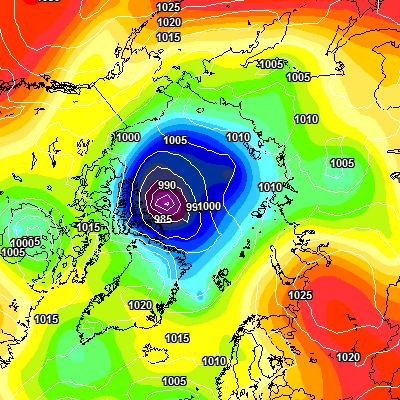
According to the current forecasts it will continue to spin over the central Arctic for several more days, driving export of sea ice via the Fram Strait:
We first mentioned the cruise ship Crystal Serenity in our initial musings about prospects for the Northwest Passage in 2016. Since then the sea ice has melted on a variety of the “southern” routes through the Northwest Passage, and the Crystal Serenity has now set sail for the Arctic. Amongst the over 1000 passengers there is even a blogger:
We’re thrilled to have travel journalist Katie Jackson “joining the crew” for this voyage. Katie, an acclaimed writer and avid traveler, will be providing dispatches from the ship…or tundra, or zodiac, to help all of you indulge your wanderlust.
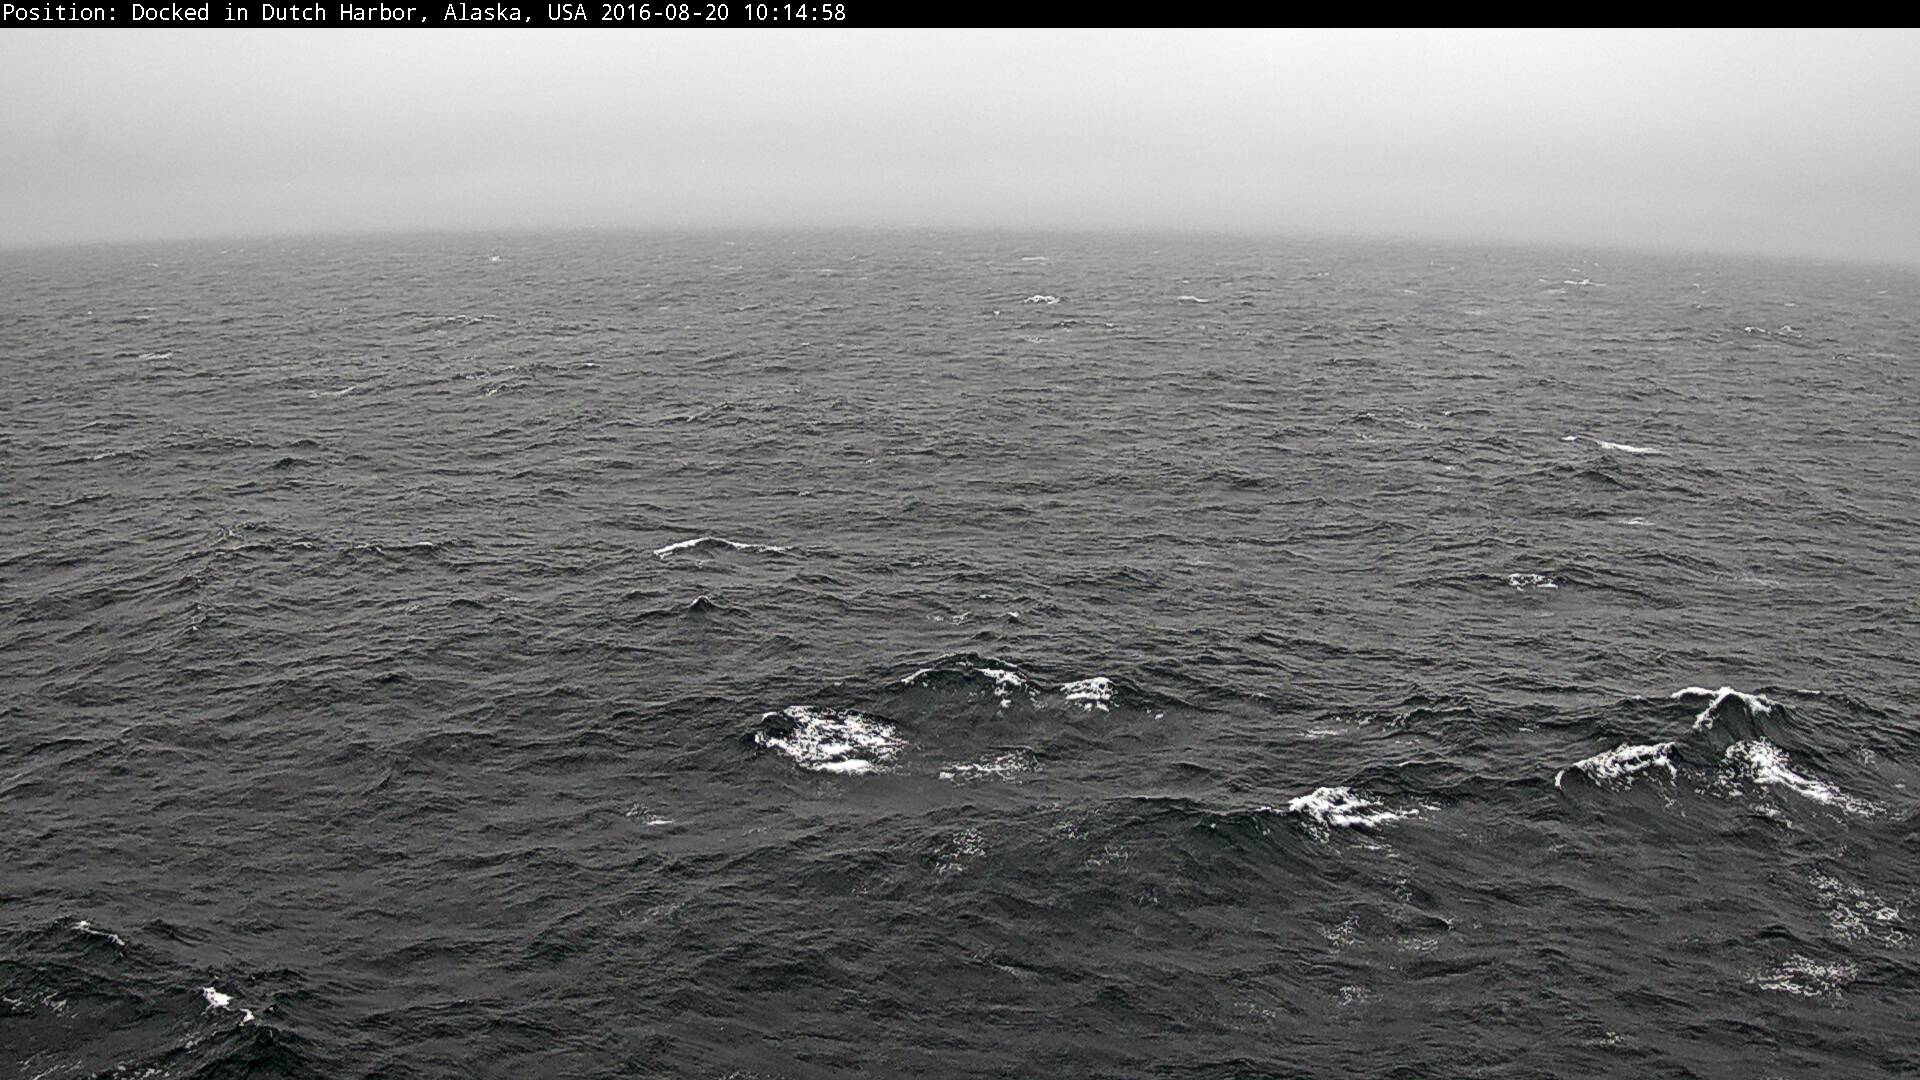
The Crystal Serenity is equipped with a number of webcams. Here’s the current view from one as the Crystal Serenity is en route to Nome Alaska:
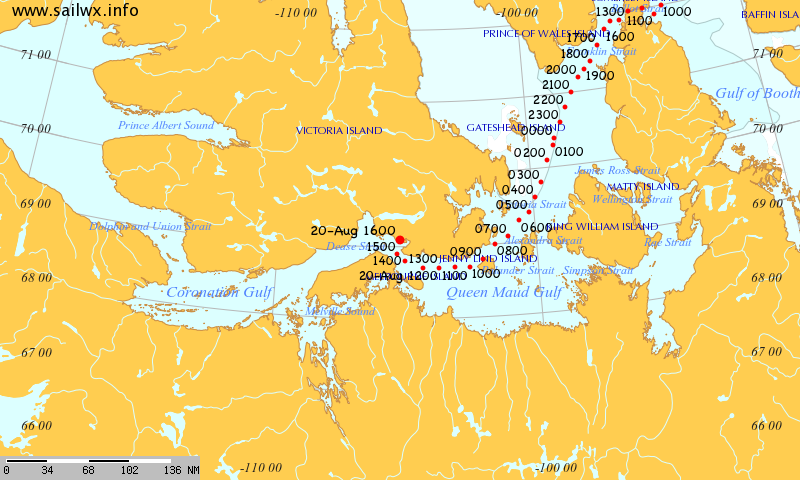
It looks a bit breezy up there at the moment, but nothing to trouble the 68,000 ton Crystal Serenity. However Crystal Cruises do seem to be anticipating some potential problems. Accompanying the Crystal Serenity will be the British Antarctic Survey icebreaker Ernest Shackleton, which is already making its way through the Northwest Passage from the direction of the Atlantic Ocean:
The RRS Ernest Shackleton, operated by British Antarctic Survey, is an ICE 05 classed icebreaker (exceeding the more common 1A Super class) that will provide operational support to Crystal Serenity, including ice breaking assistance should the need arise and carry additional safety and adventure equipment.
The RRS Ernest Shackleton will carry two helicopters for real-time ice reconnaissance, emergency support and flightseeing activities. In addition to its robust ice navigation and communications equipment, the RRS Ernest Shackleton will have on board supplemental damage control equipment, oil pollution containment equipment, and survival rations for emergency use.
Hopefully none of that emergency equipment will need deploying over the next two weeks or so, but that is far from certain. Listen to what Admiral Charles Michel, Vice Commandant of the United States Coast Guard, had to say in testimony before the House Subcommittee on Coast Guard and Maritime Transportation in answer to questions from Congresswoman Janice Hahn:
I don’t want to underestimate the challenges of that area. There is almost no logistics up there. For example if we needed to get another helicopter up there they’re only bringing a very small helicopter with them. If we needed to get a big helicopter up there it’s estimated it would take between 15 and 20 hours, if the weather’s good, in order to get that up there. Fixed wing aviation may be available, but even there you’ve got very limited landing areas, very environmentally sensitive areas, things change up there dramatically even during the summer. The weather is an incredible challenge, so this is not an easy category for a voyage.
If you’re interested in US Arctic policy in general you may wish to watch the whole 2+ hours of the hearing instead. In which case, here it is!
[Edit – August 23rd]
Crystal Serenity is now inside the Arctic Circle, and rapidly approaching her first potential problem:
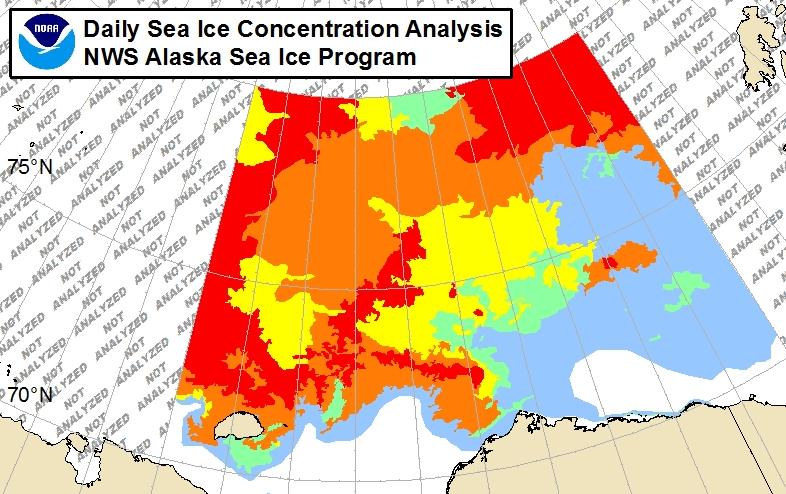
Here is the latest National Weather Service ice chart for Alaskan waters:
It shows 1-3 tenths coverage all the way to shore at Point Barrow. What’s more with the Great Arctic Cyclone still raging the current US Navy forecast is for continuing onshore ice drift:
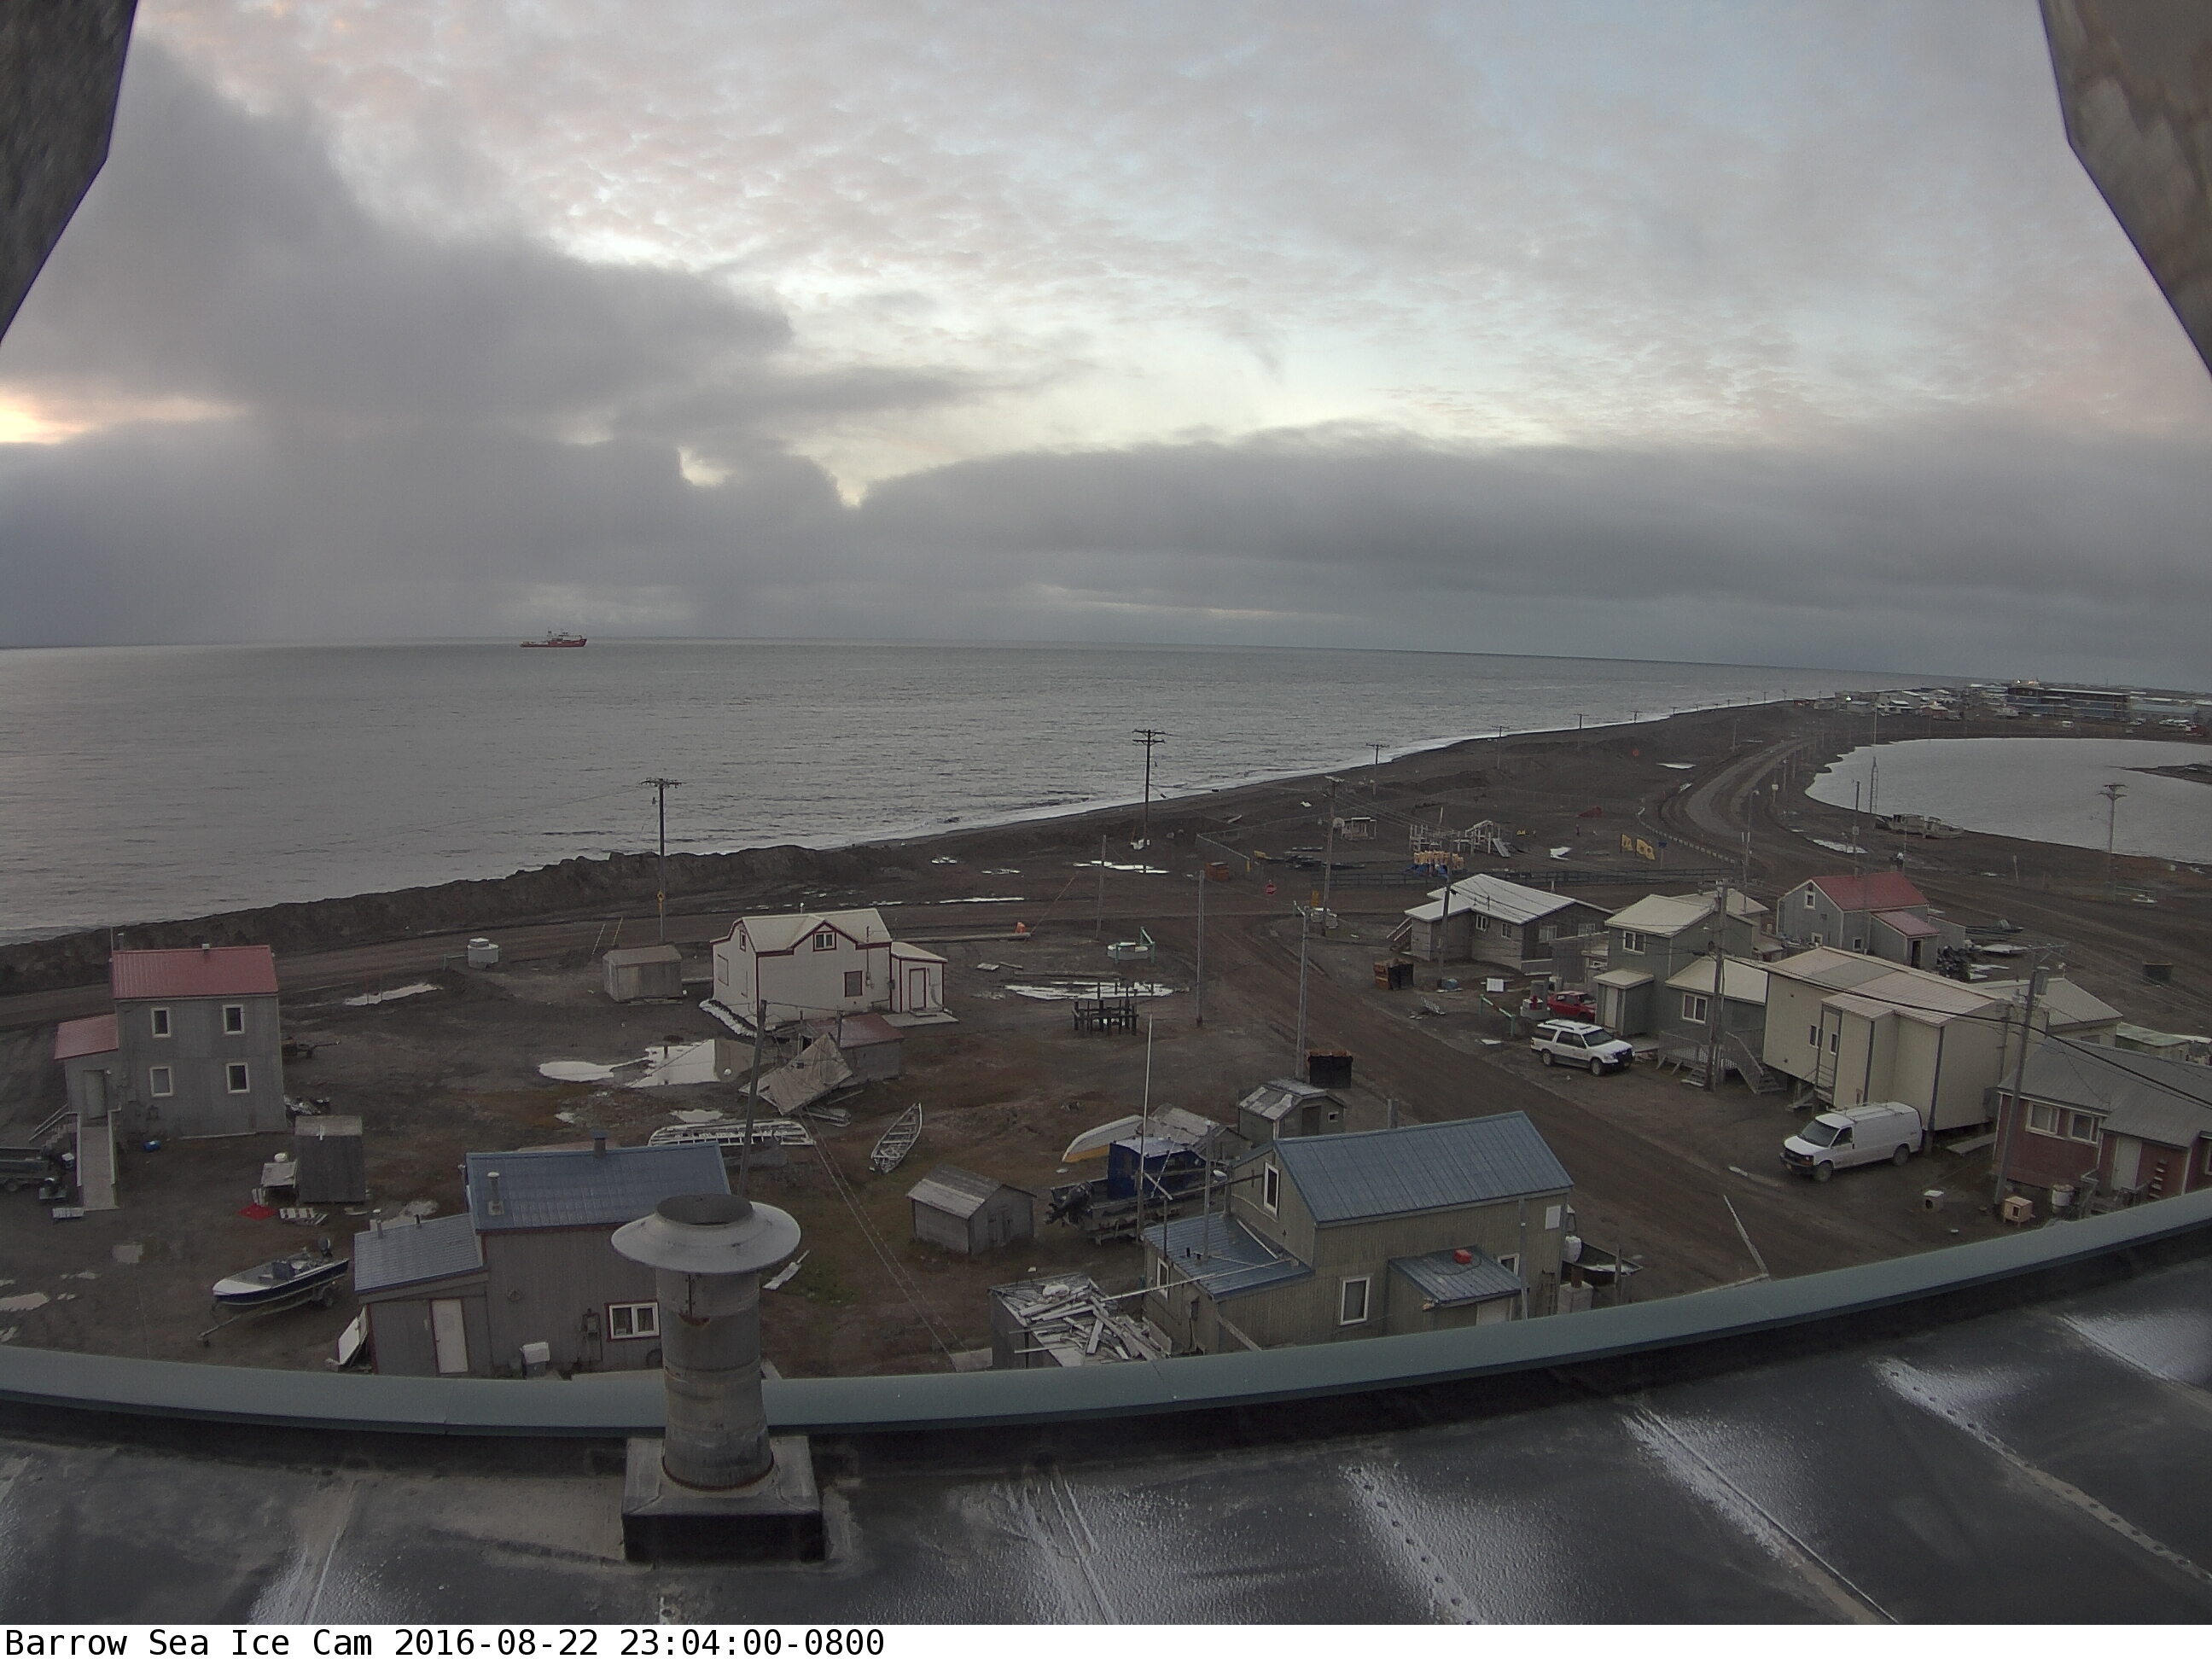
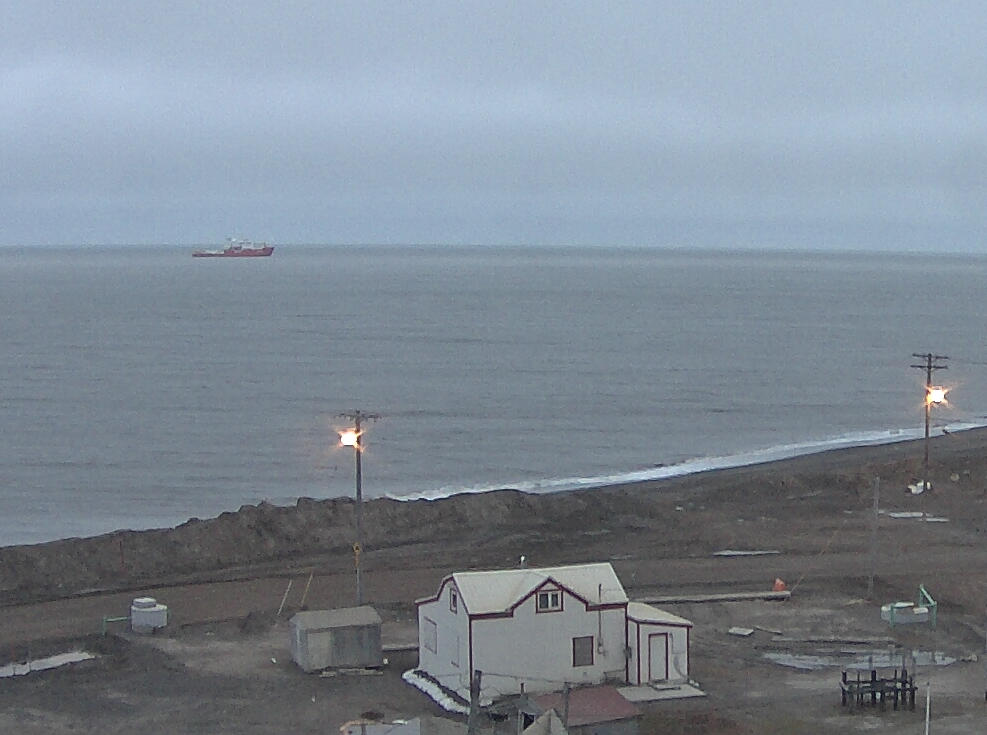
Maybe that’s why there seems to be an icebreaker patiently waiting offshore at Barrow as we speak?
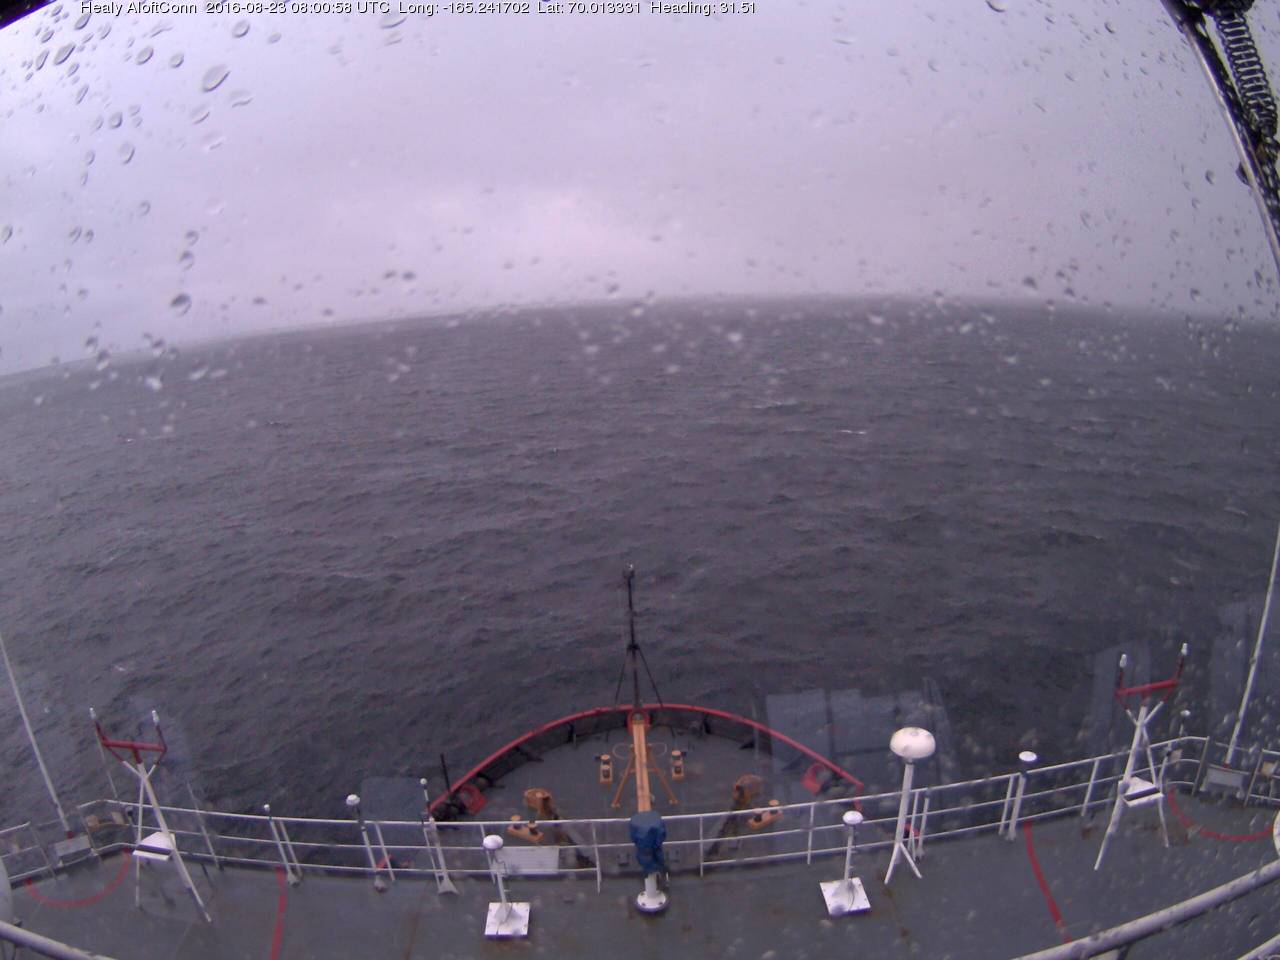
As luck would have it USCGC Healy is in the vicinity too, albeit slightly south of Barrow. The weather in the Chukchi Sea doesn’t look too good at the moment:
[Edit – August 24rd]
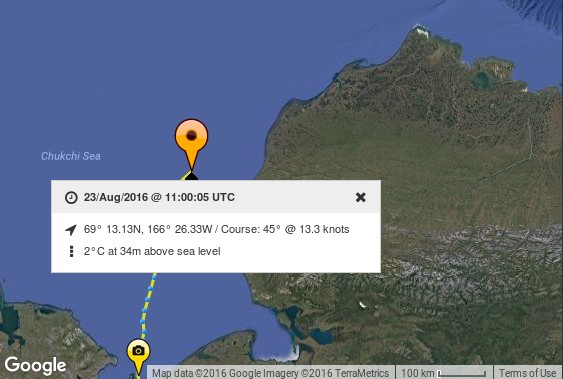
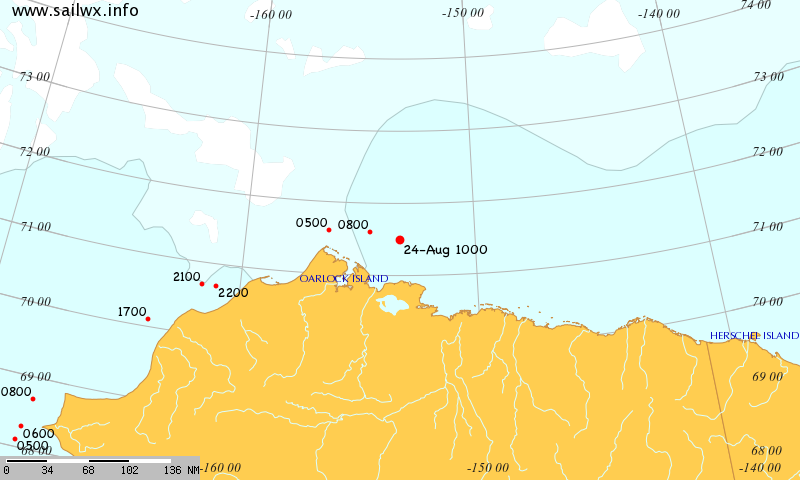
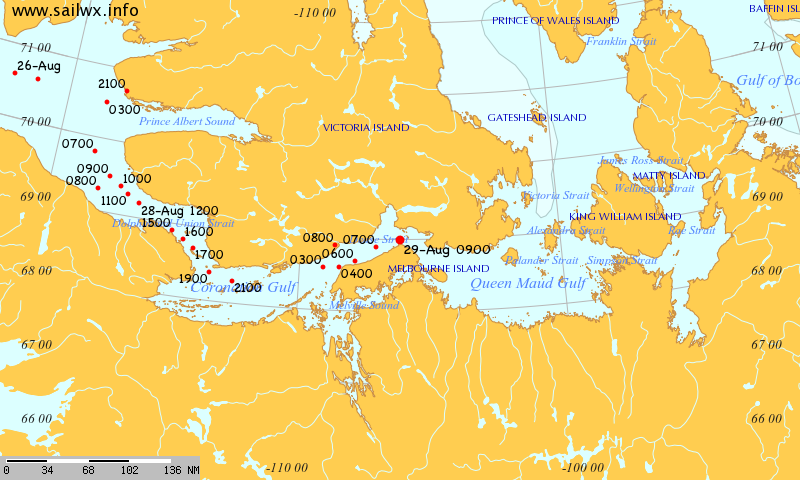
Crystal Serenity has rounded Point Barrow, apparently without incident. Here’s her tracking map from SailWX:
Apparently icebreaker assistance was not required since the ship anchored off Barrow, which looks a lot like the Korean icebreaker Araon, seems not to have moved:
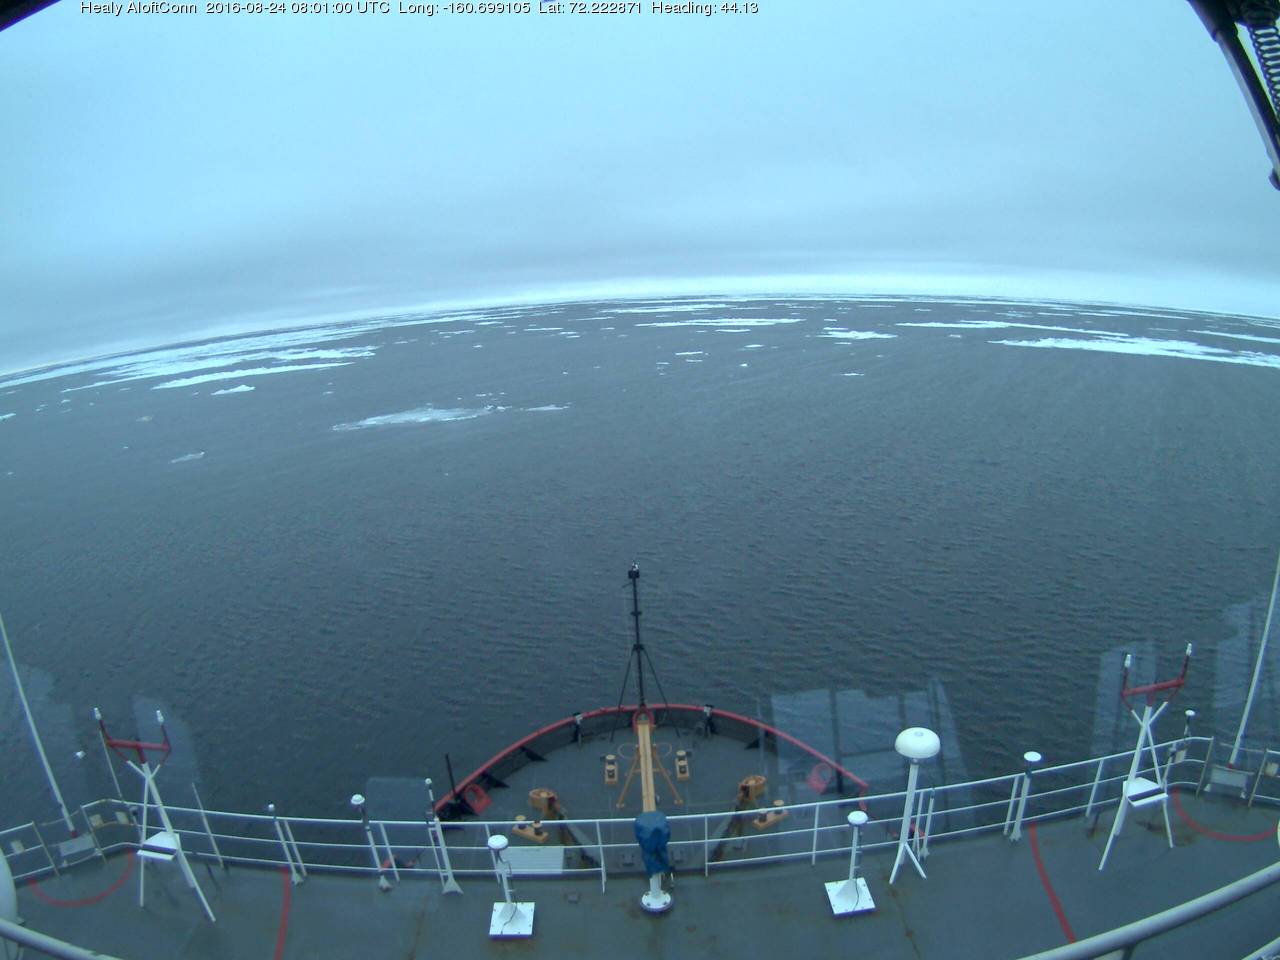
Rather disappointingly the Crystal Serenity’s webcams seem to update infrequently and have yet to reveal any sea ice. The Healy aloftcon camera, however, recorded this image from 72 degrees north:
[Edit – August 27th]
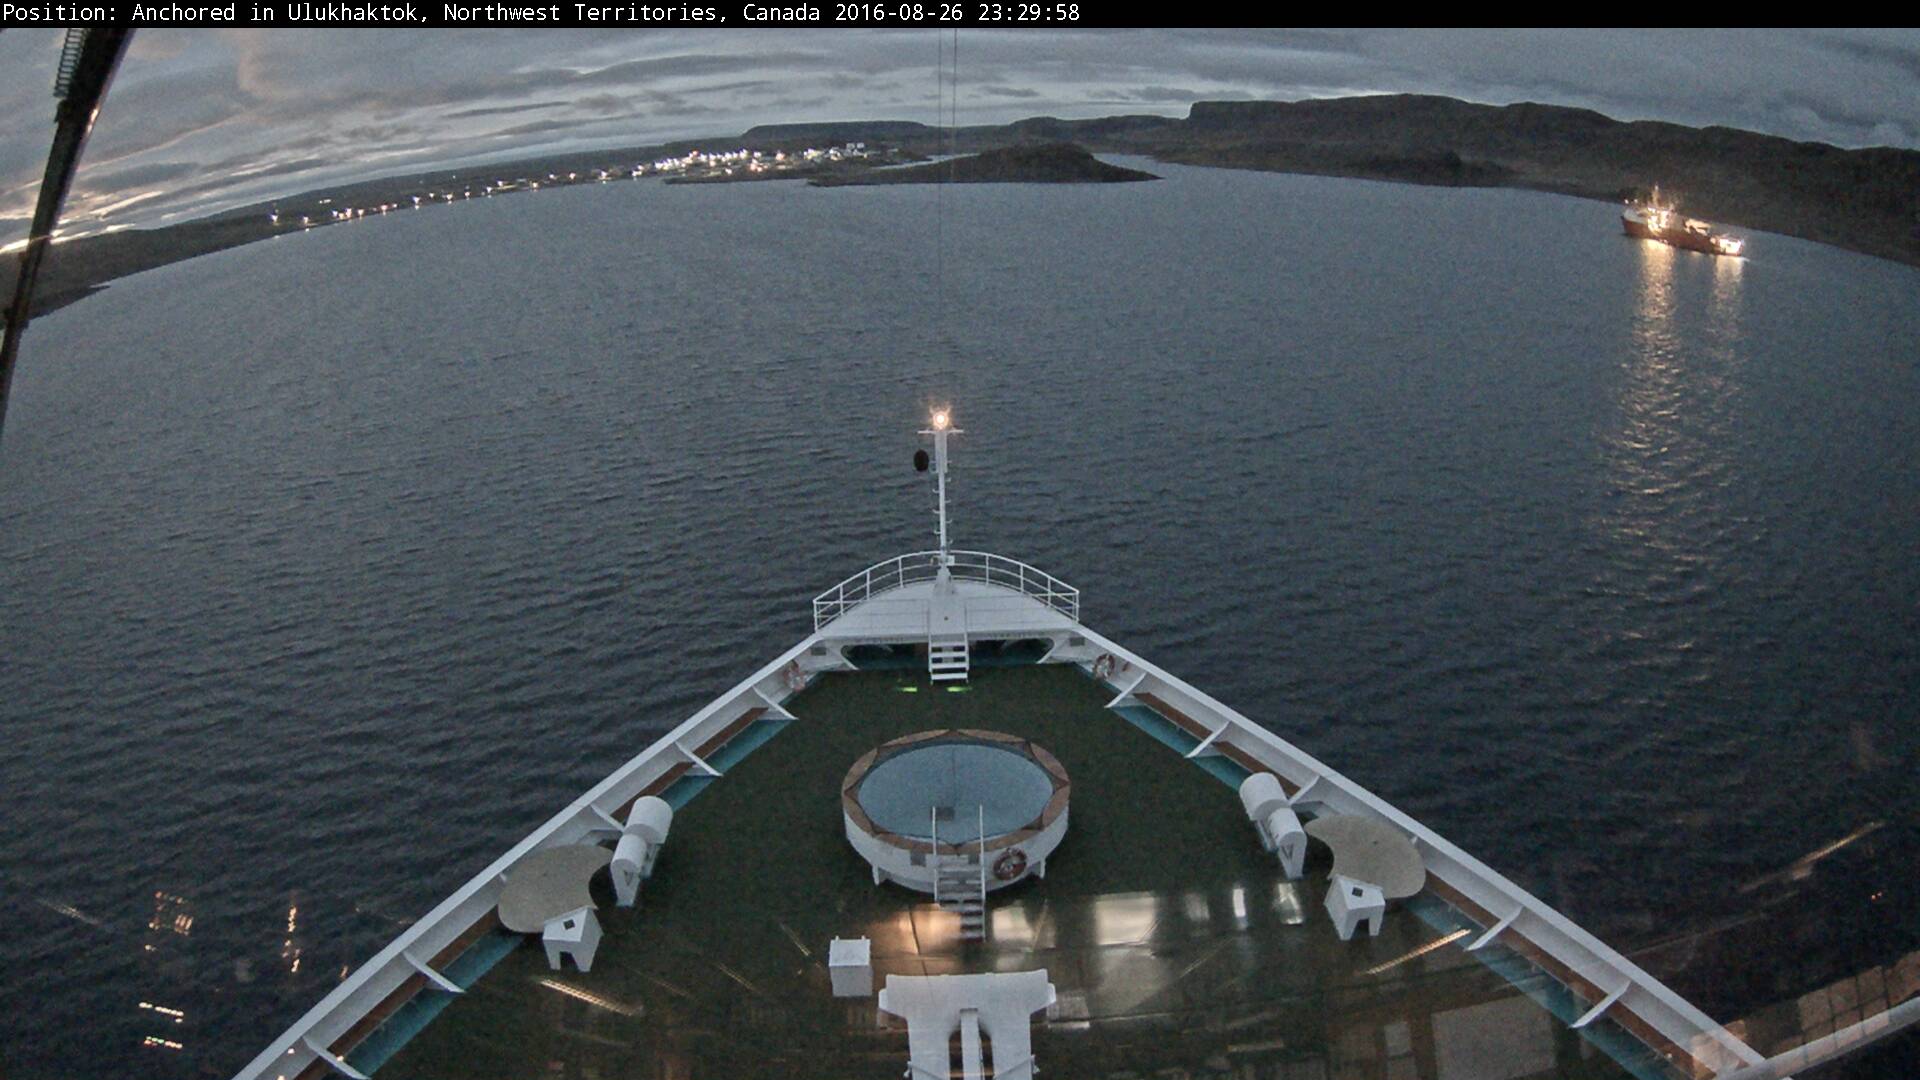
Crystal Serenity has reached Ulukhaktok on the west coast Victoria Island, and met up with the Ernest Shackleton:
It doesn’t look as though any ice breaking will be required in the near future!
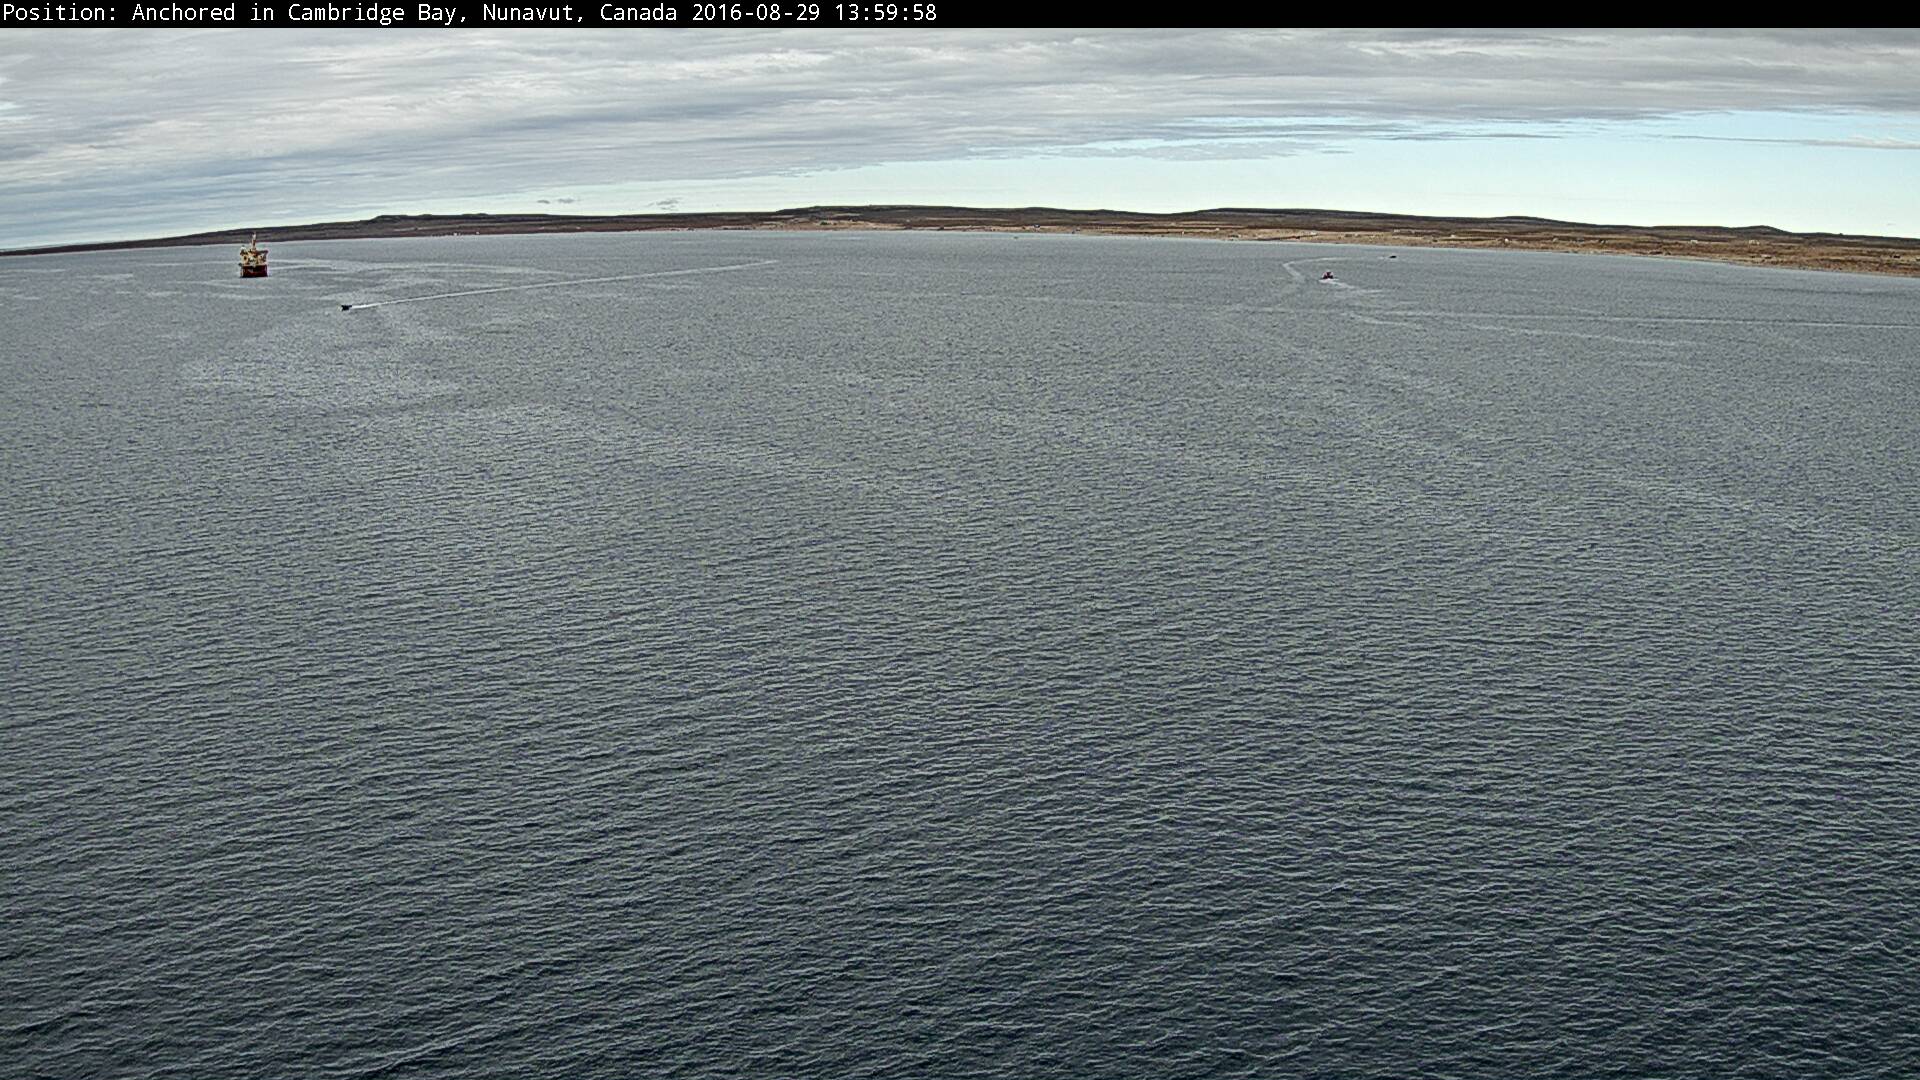
[Edit – August 29th]
Crystal Serenity and Ernest Shackleton are both now in Cambridge Bay:
There is no ice to be seen!
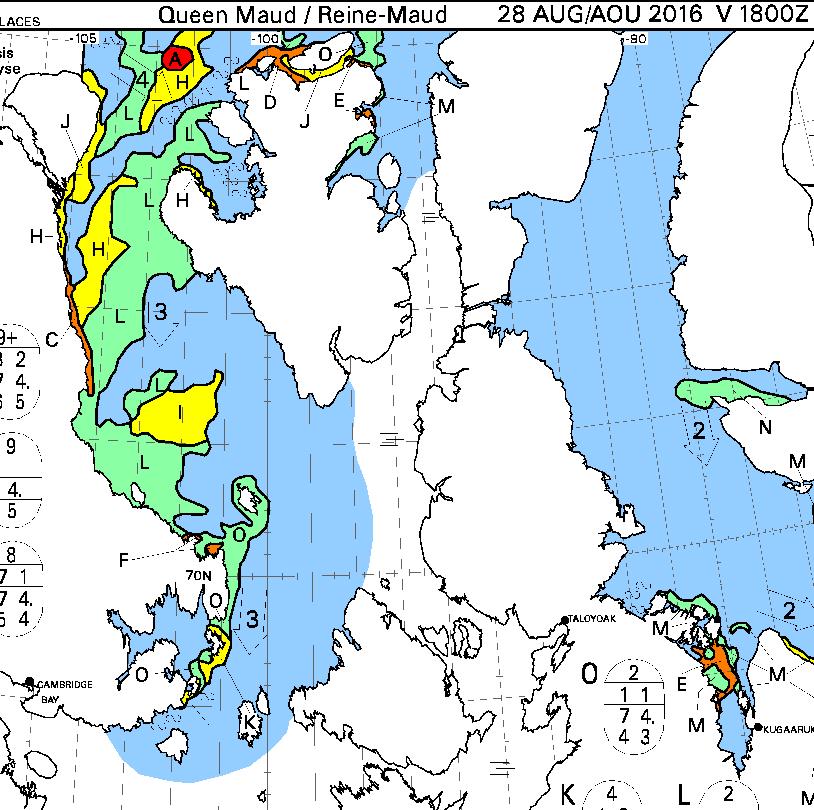
The next stage of Crystal Serenity’s itinerary involves “Cruising Peel Sound or The Bellot Strait”. I wonder which option she’ll take?
The early morning paid off quickly with our first Polar bear sighting! And what an experience it was. This apex predator patrolled calmly on an ice floe, and put on quite a show stretching, scanning and keeping watch for any potential prey.
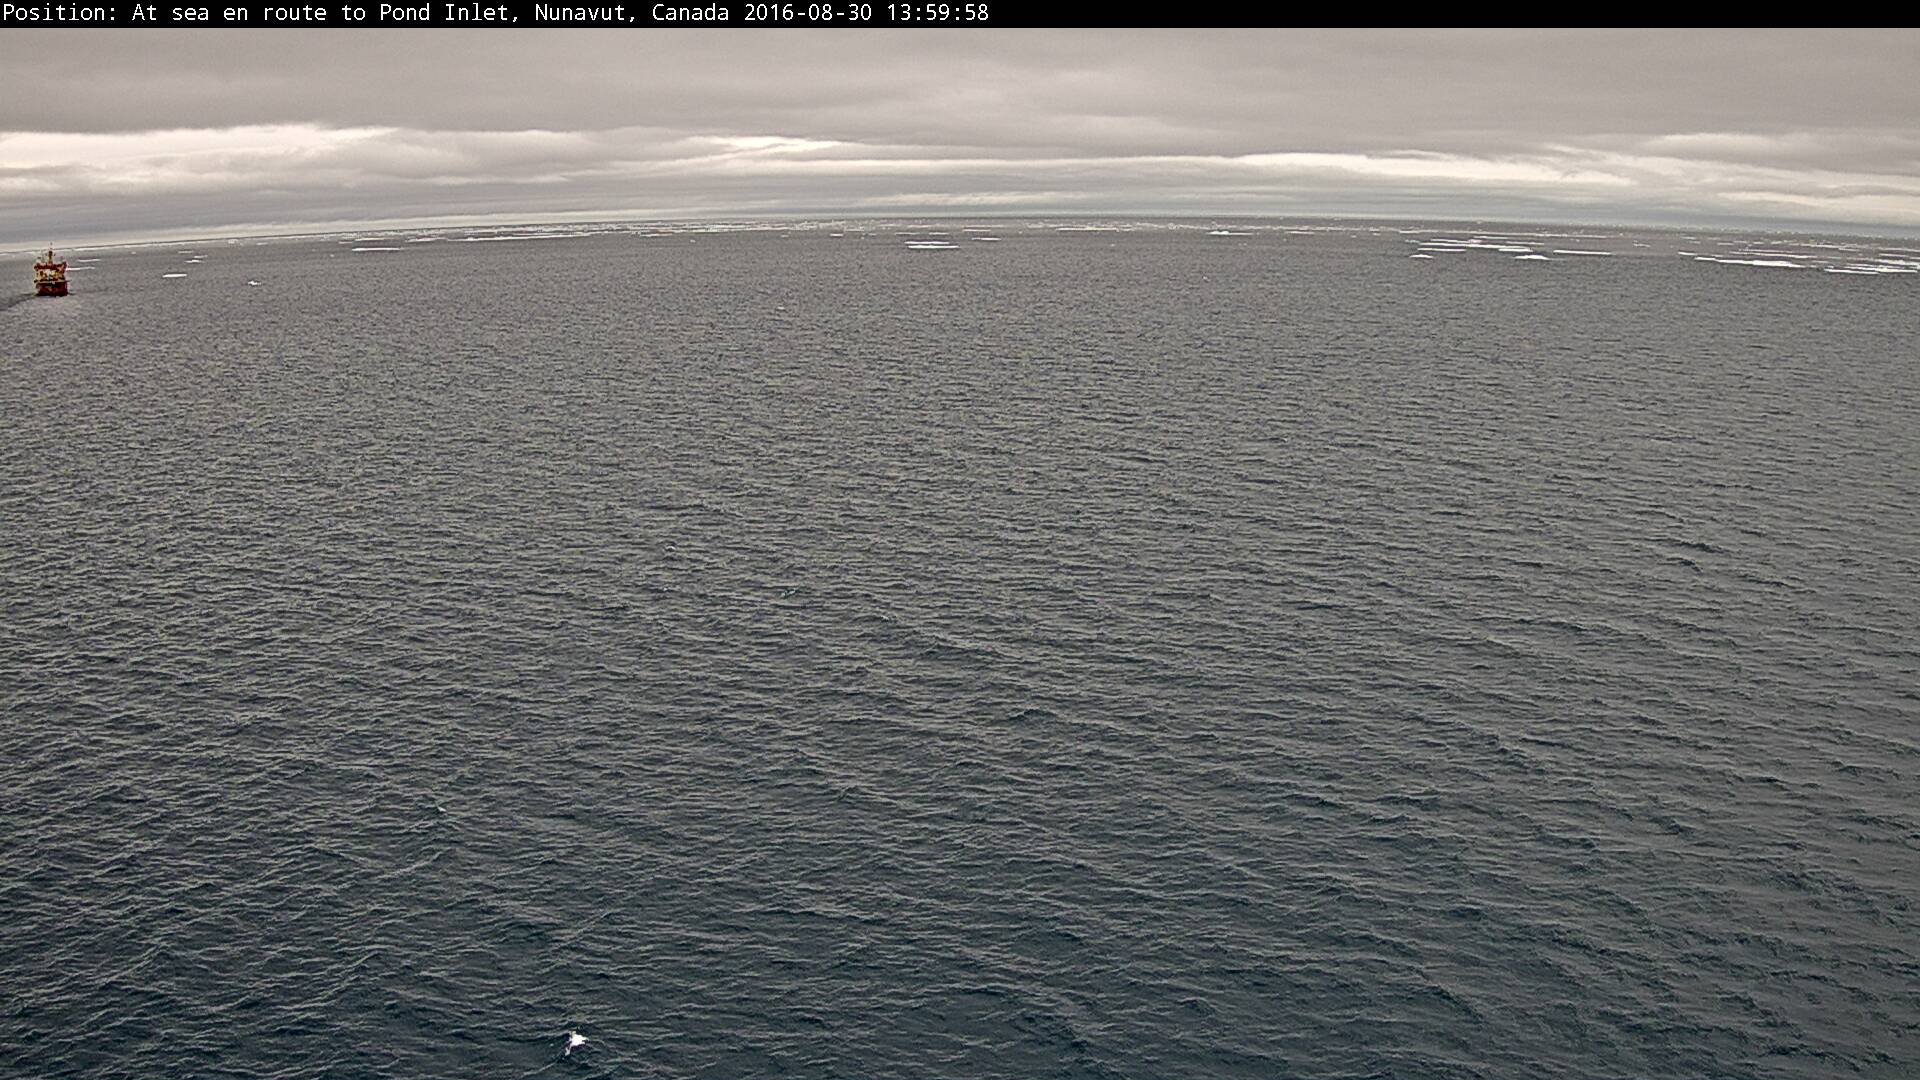
[Edit – August 31st]
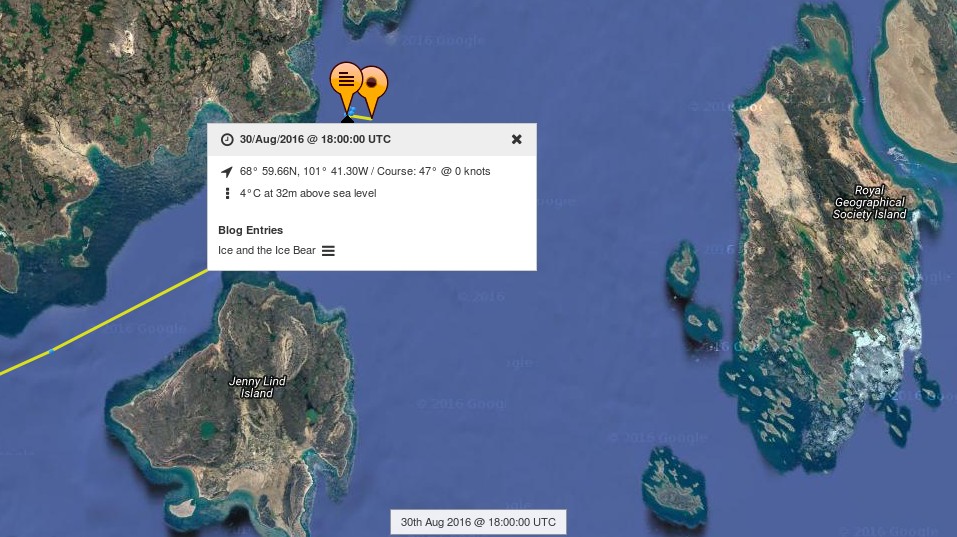
Crystal Serenity has evidently decided to cut through Bellot Strait:
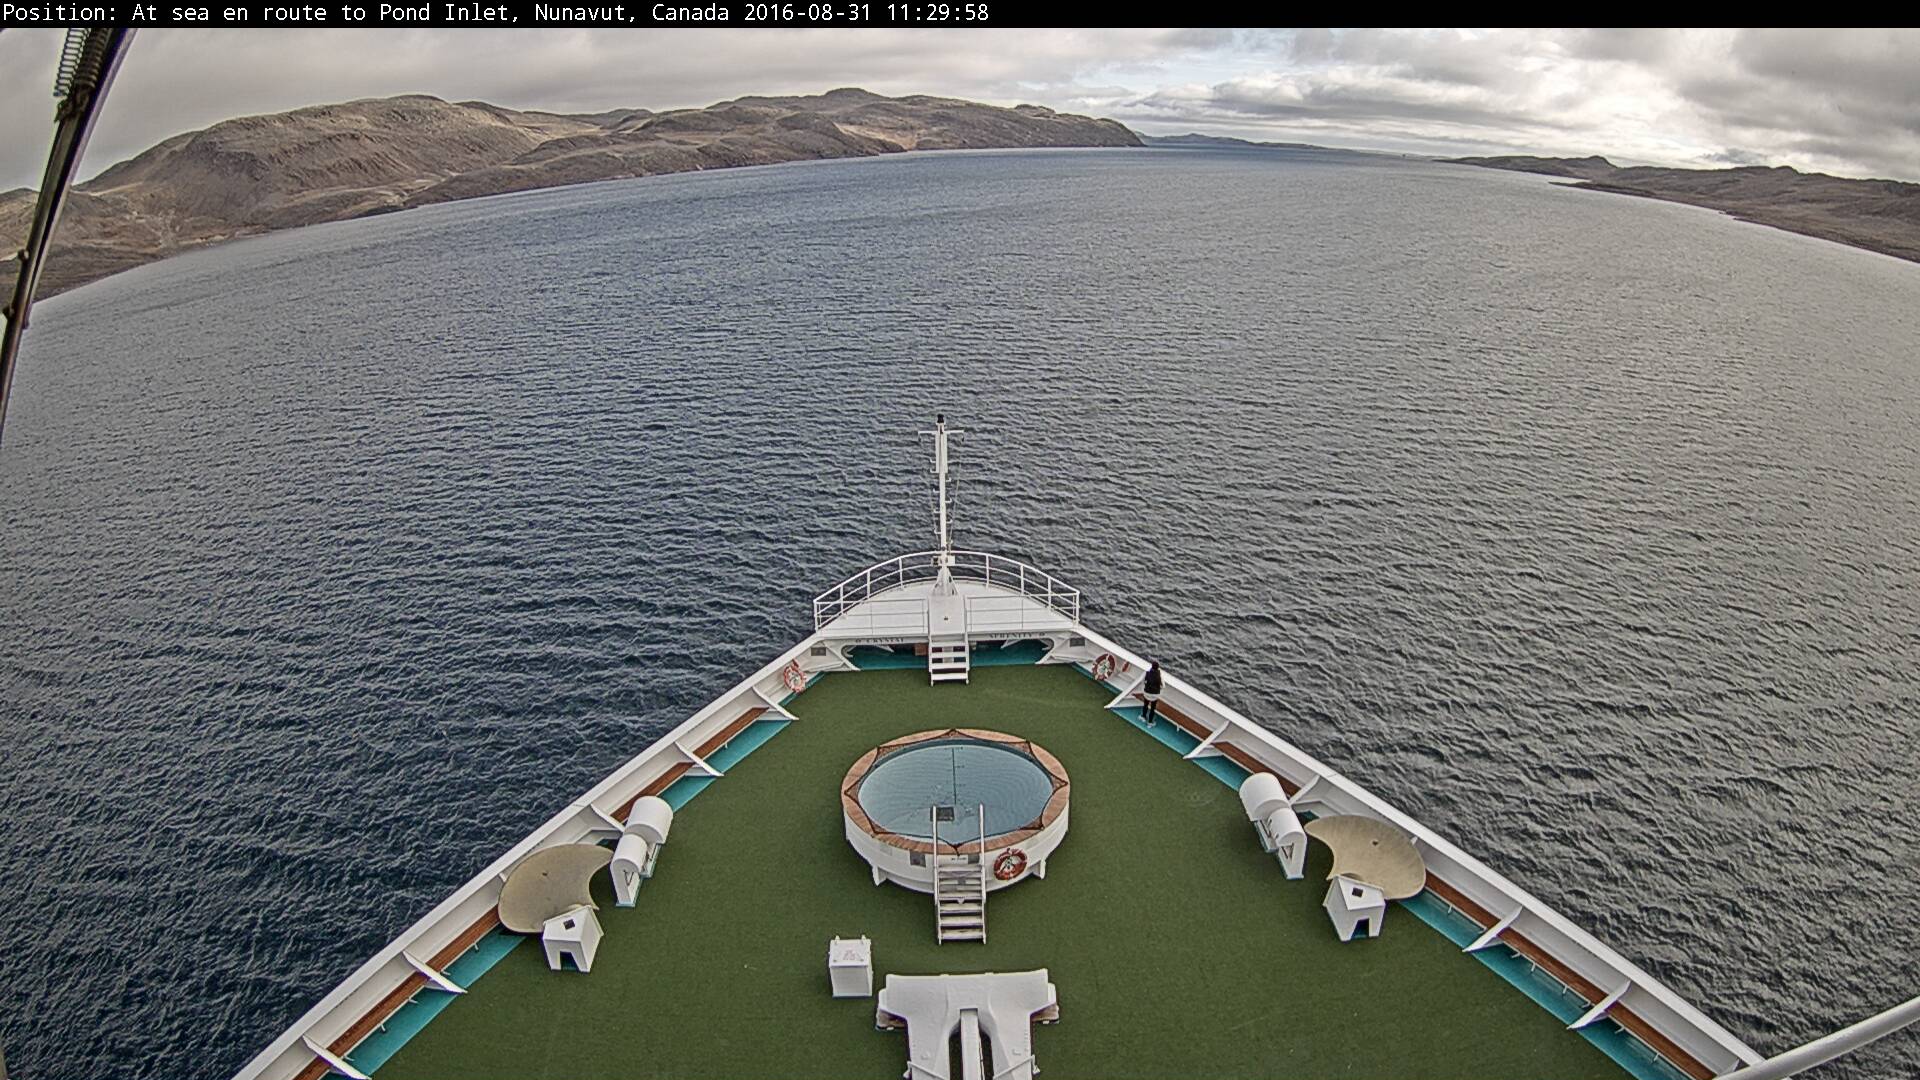
Here’s the view from the bridge:
No sea ice to be seen!
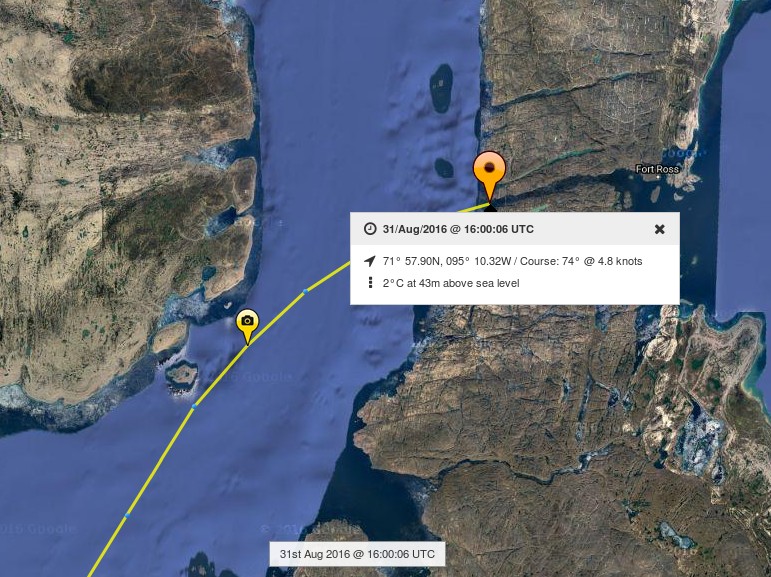
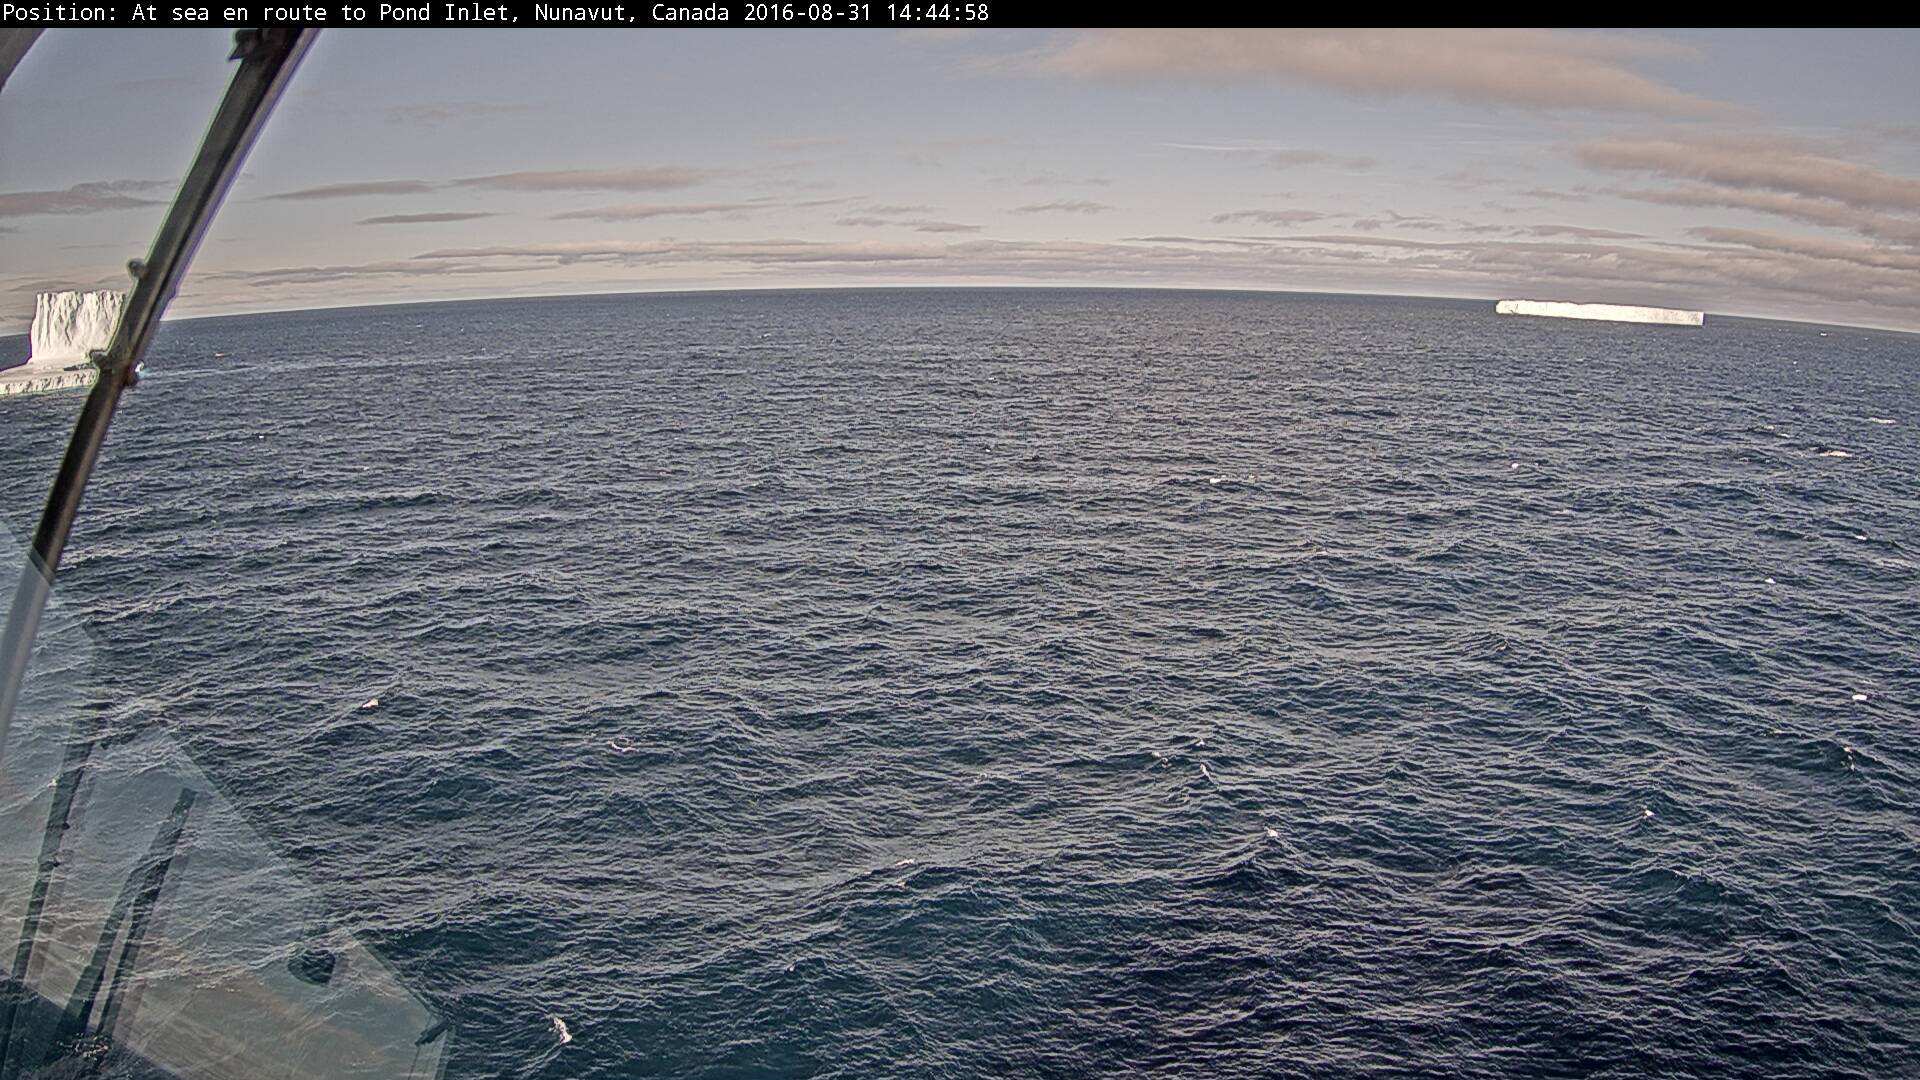
P.S. Having emerged from the eastern end of Bellot Strait some bergy bits could be seen in the Gulf of Boothia:
[Edit – September 2nd]
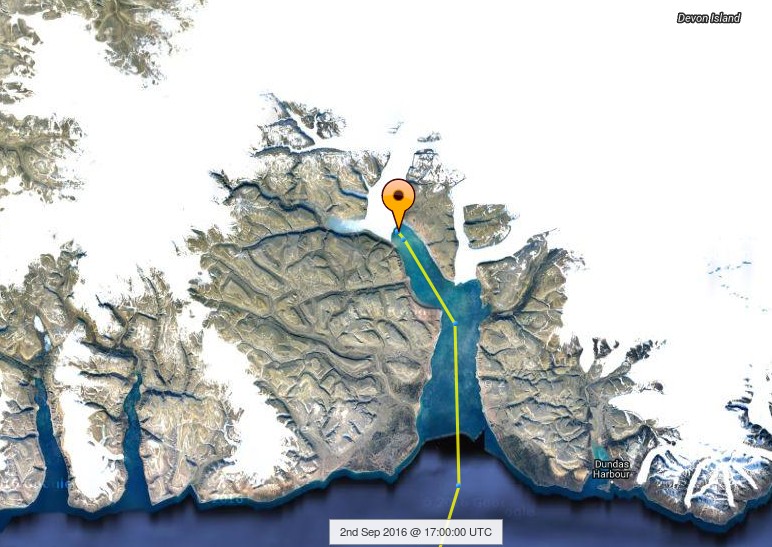
Crystal Serenity has been taking a good long look at a glacier today:
Judging by her tracking map it’s the North Croker Bay Glacier on Devon Island:
I wonder if that’s where those bergy bits came from?
A storm is brewing in the Arctic. A big one! The crew of the yacht Northabout are currently sailing along the western shore of the Laptev Sea and reported earlier today that:
The sea is calm. Tomorrow a gale 8. But this moment is perfect.
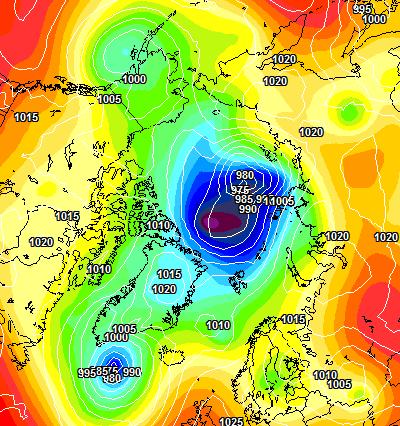
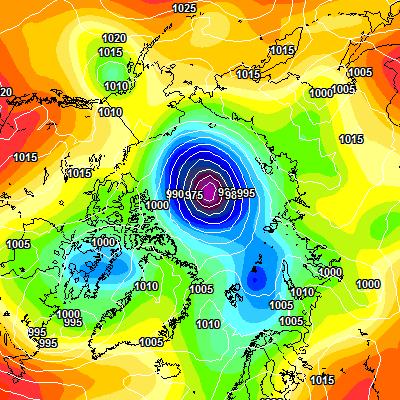
That perfect moment will not last long. Here is the current ECMWF forecast for midnight tomorrow:
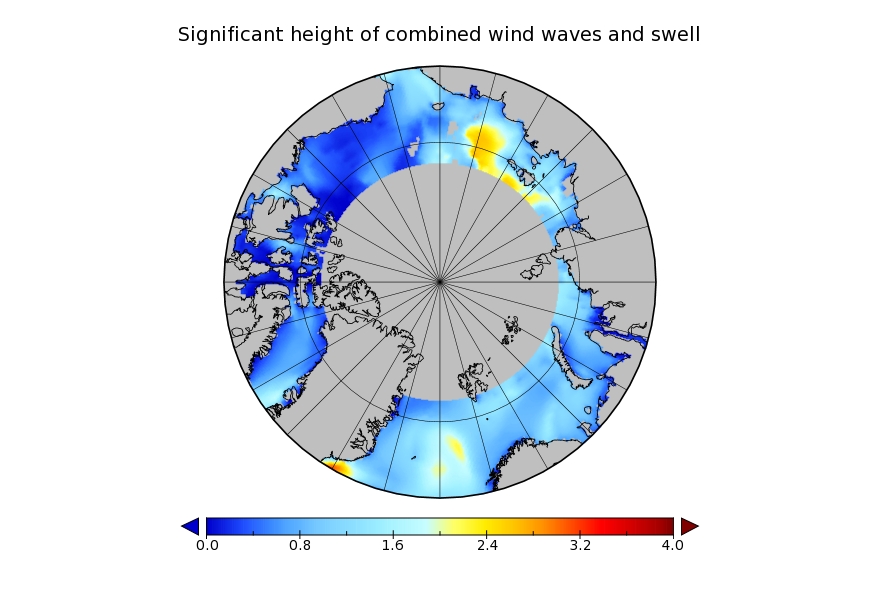
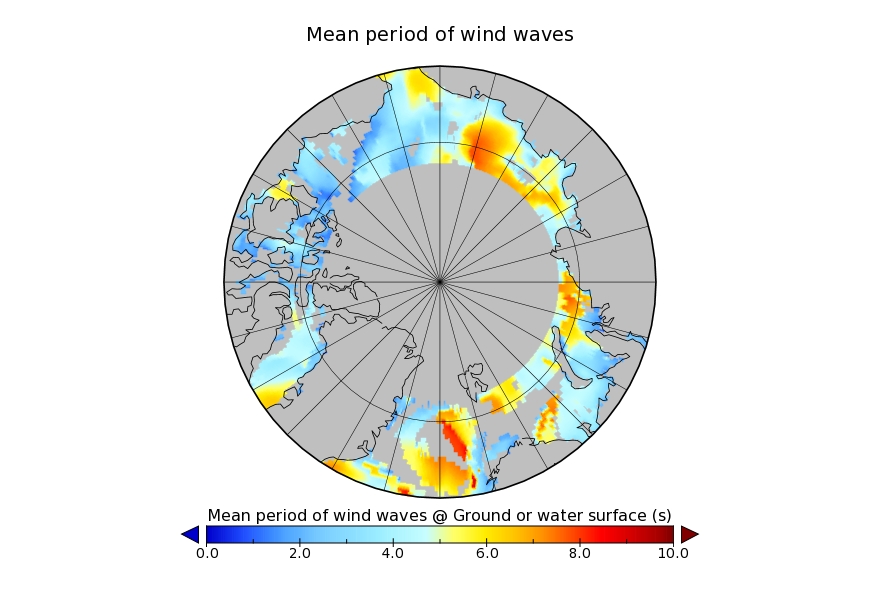
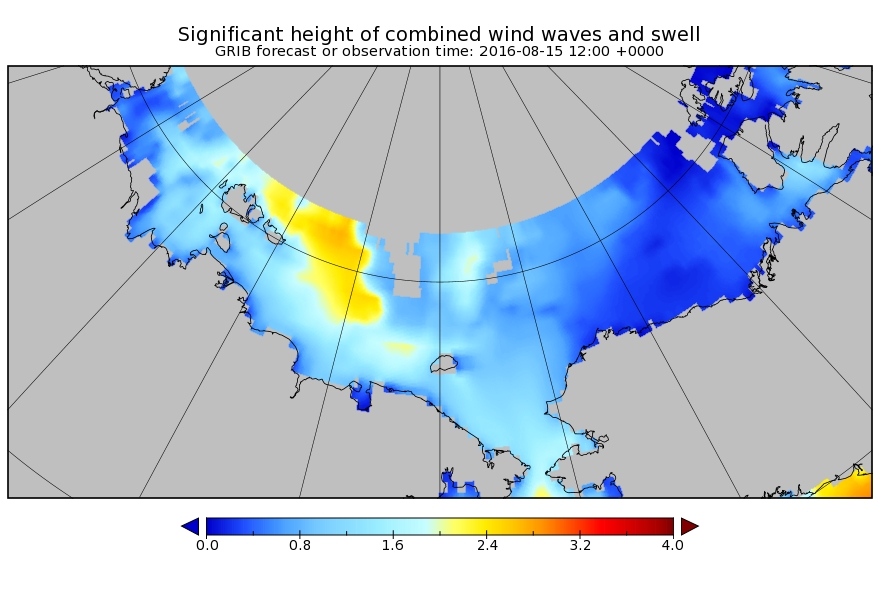
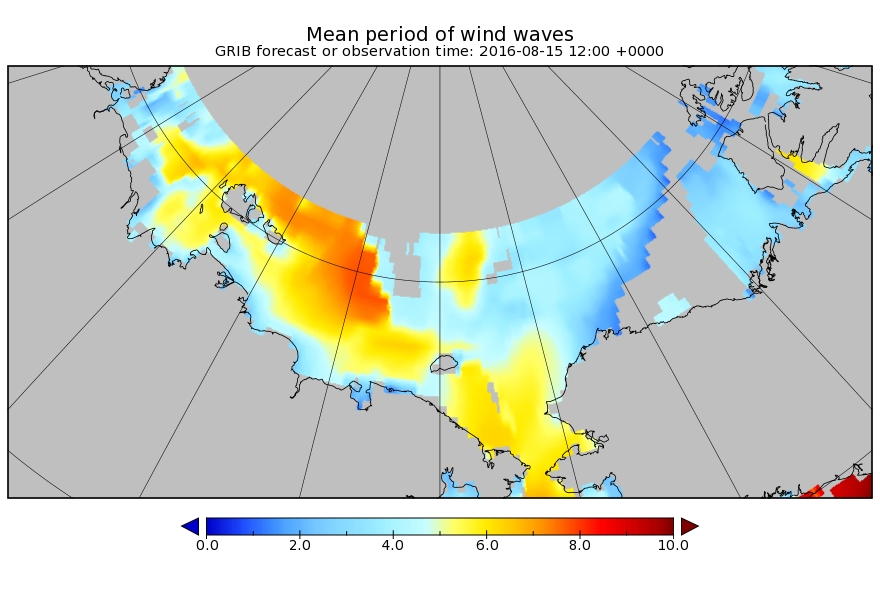
and here is the current Arctic surf forecast for 06:00 UTC on Monday:
A 975 hPa low pressure system will be creating 3 meter waves with a period of around 8 seconds heading across the East Siberian Sea in the direction of the ice edge. By midnight on Monday the cyclone is forecast to have deepened to a central pressure below 970 hPa:
All of this is rather reminiscent of the “Great Arctic Cyclone” in the summer of 2012, which looked like this on August 7th:
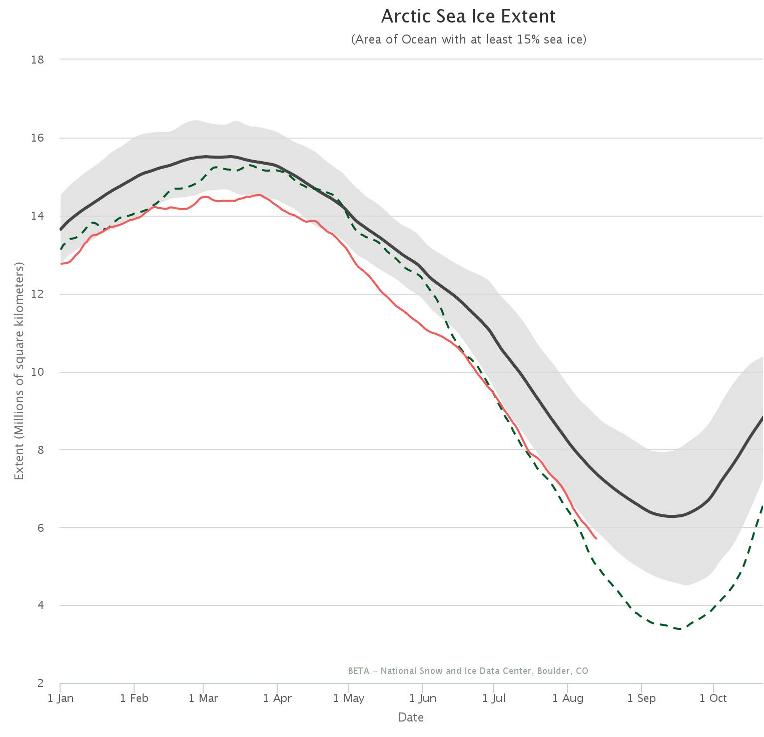
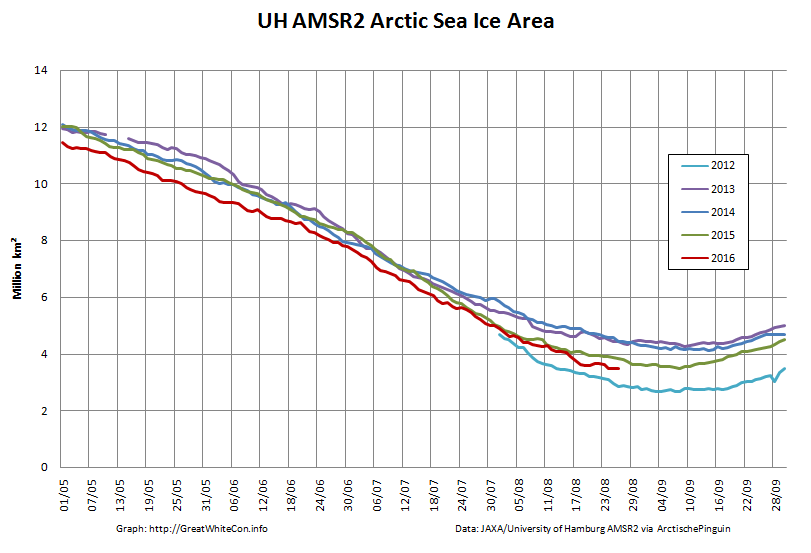
and which ultimately led to the lowest Arctic sea ice extent in the satellite record. Using the National Snow and Ice Data Center’s numbers that was 3.41 million square kilometers on September 16th 2012. Here’s the NSIDC’s current graph comparing 2012 with this year:
I wonder what the minimum for 2016 will be, and on what date?
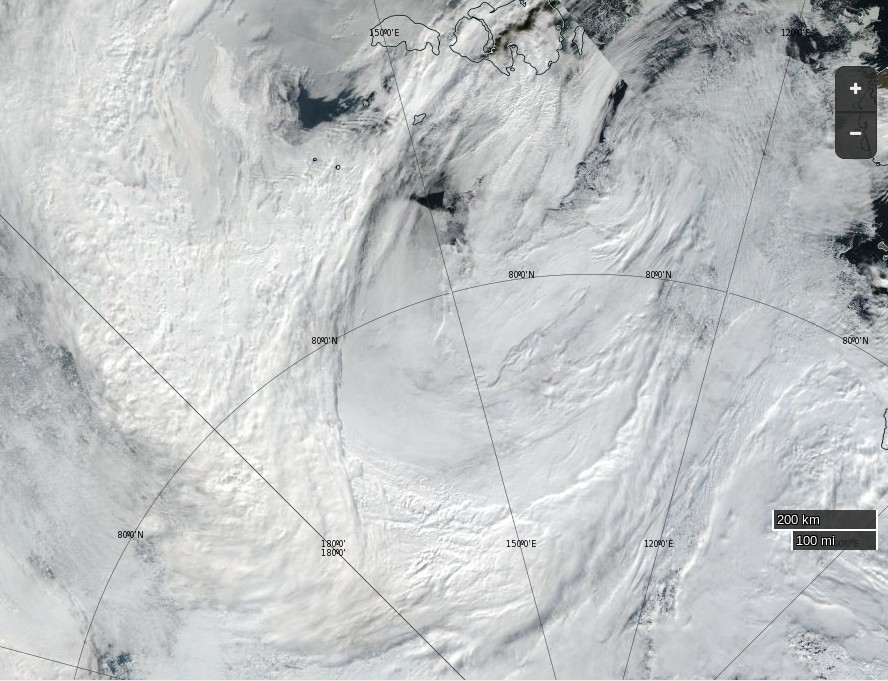
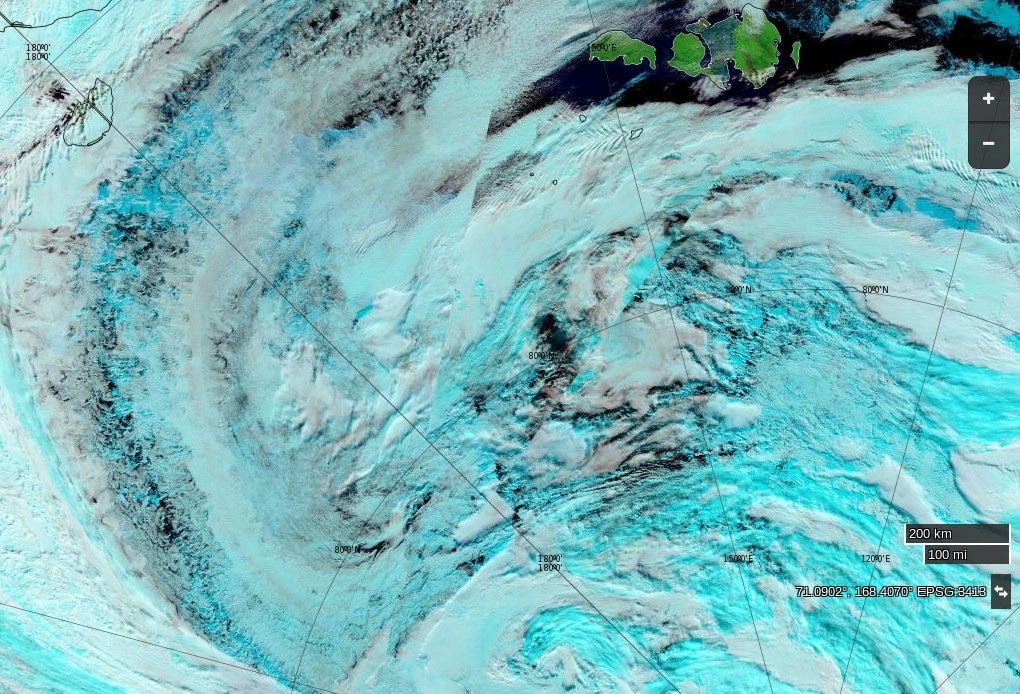
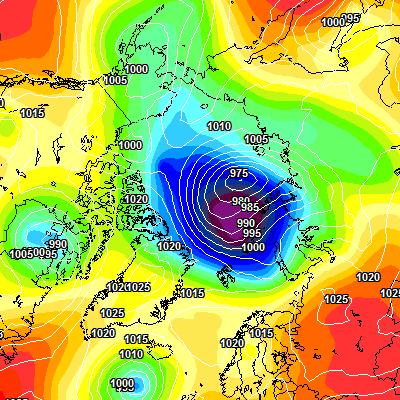
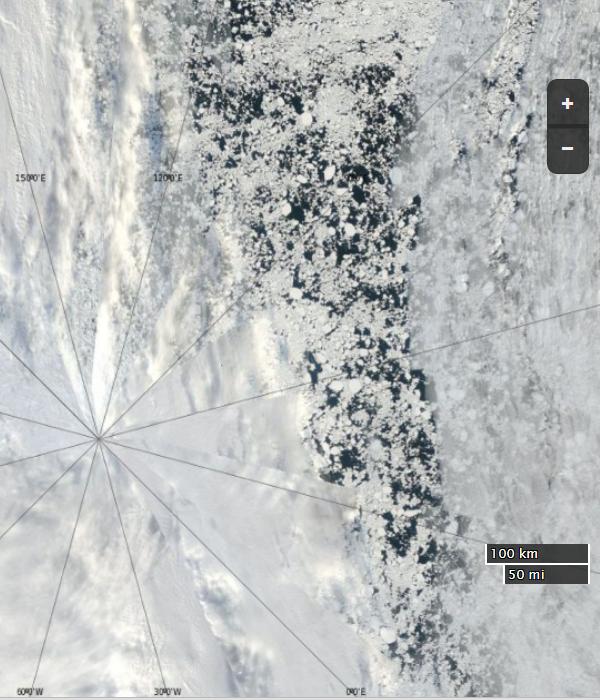
Here’s how the Great Arctic Cyclone of 2016 looks from on high this morning:
NASA Worldview “true-color” image of the ‘Great Arctic Cyclone’ on August 15th 2016, derived from the VIIRS sensor on the Suomi satellite
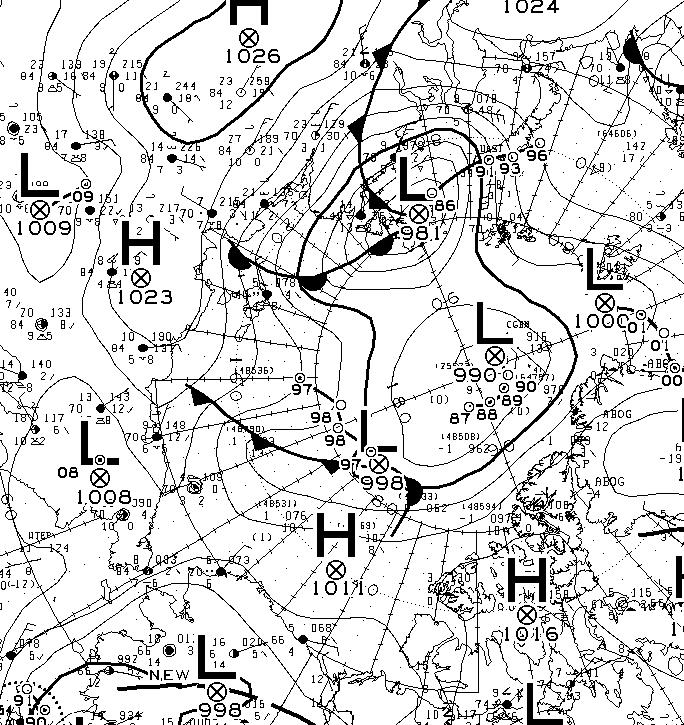
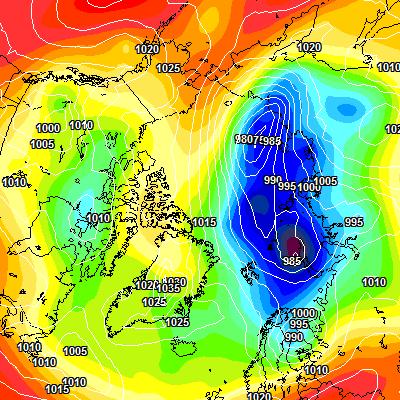
The latest synopsis from Environment Canada shows that the central pressure of the cyclone is now down to 974 hPa:
The WaveWatch III forecast for noon today UTC confirms the forecast of two days ago:
P.S. The Canadian 0600Z synopsis has the cyclone’s SLP down to 971 hPa:
[Edit – August 16th]
This morning the cyclone’s SLP is down to 969 hPa:
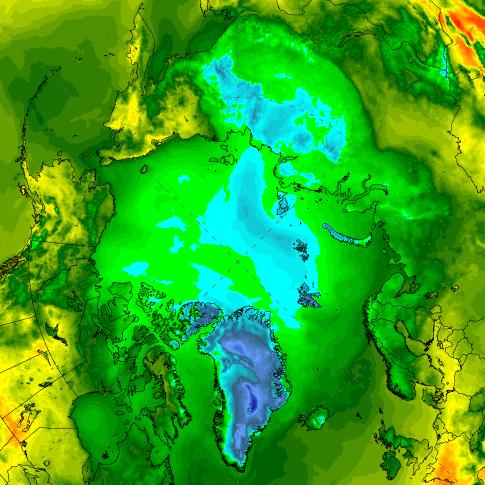
and the clouds over the Central Arctic are parting:
NASA Worldview “false-color” image of the Arctic Basin on August 16th 2016, derived from the MODIS sensor on the Terra satellite
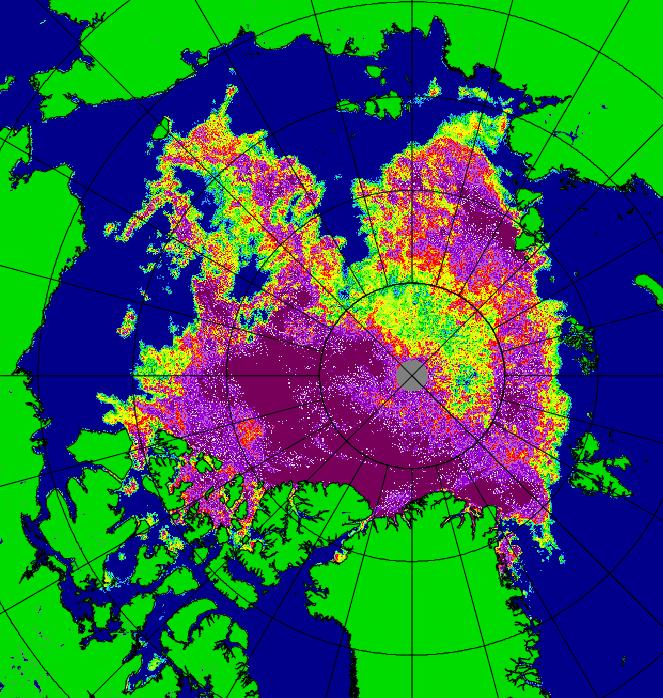
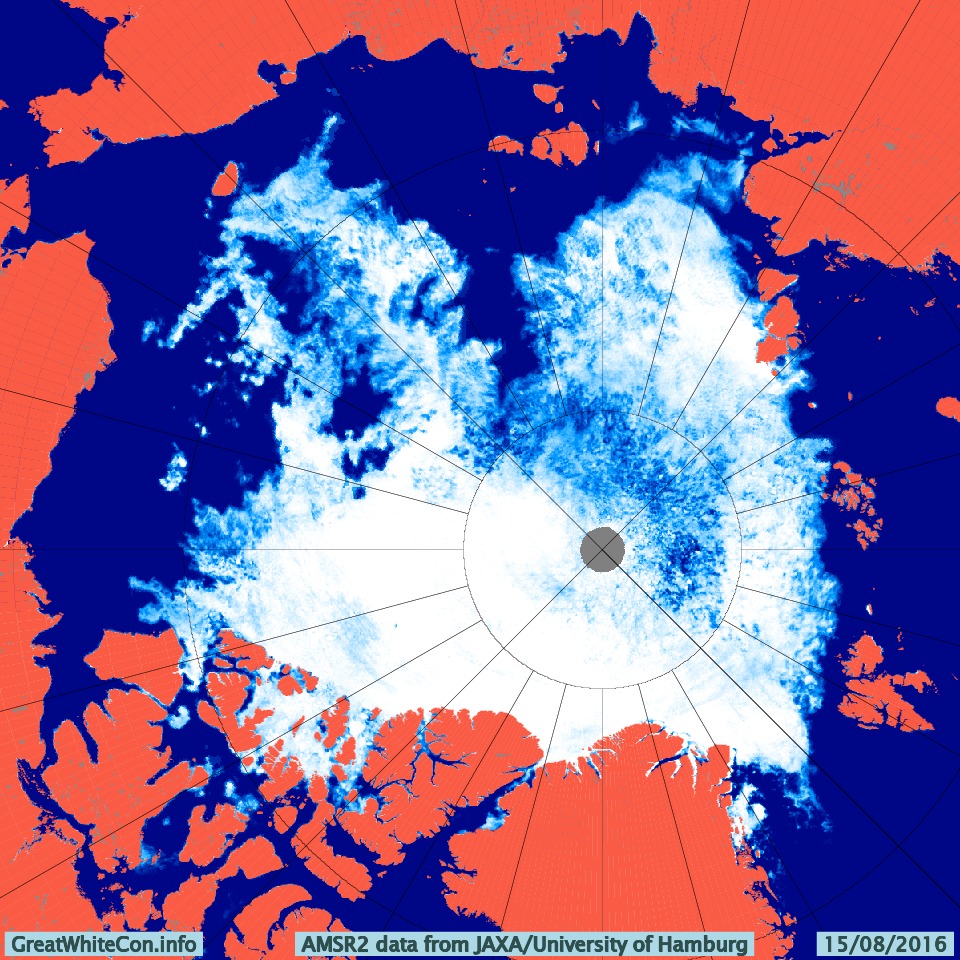
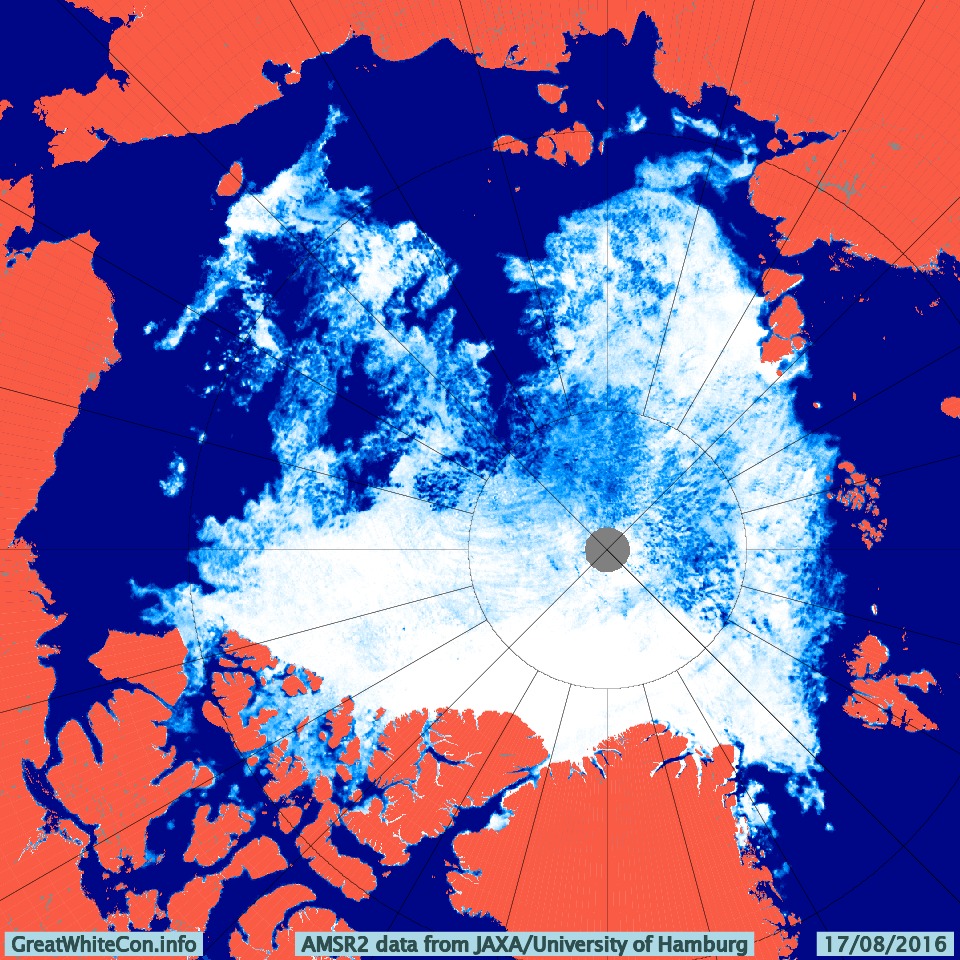
Our favourite method of seeing through the clouds using the AMSR2 maps from the University of Hamburg doesn’t seem to working at the moment, so here’s one from the University of Bremen instead:
The cyclone central pressure is now up to 983 hPa, and some indications of the effect it has had on the sea ice in the Arctic are being revealed:
[Edit – August 19th]
According to Environment Canada the cyclone’s central pressure rose to 985 hPa earlier today:
However the 987 hPa low near the Canadian Arctic Archipelago is currently forecast to deepen below 980 hPa over the next 24 hours. Here’s the ECMWF forecast for first thing tomorrow morning:
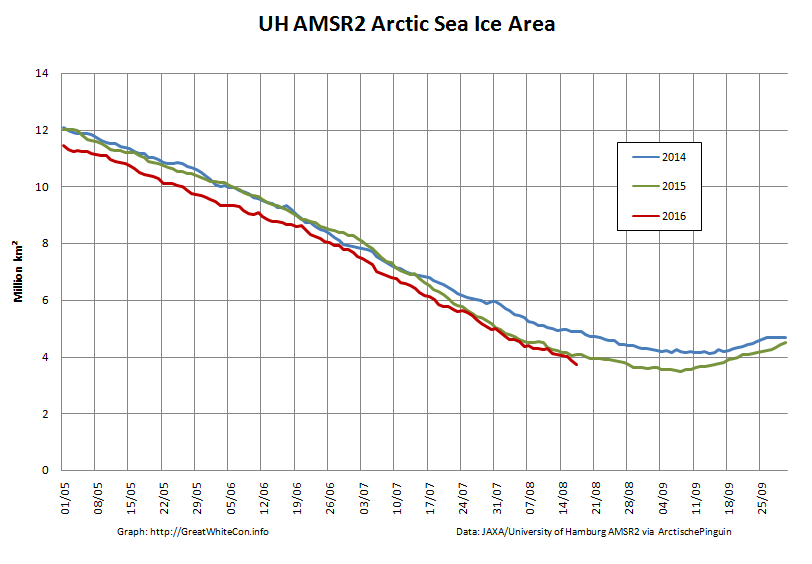
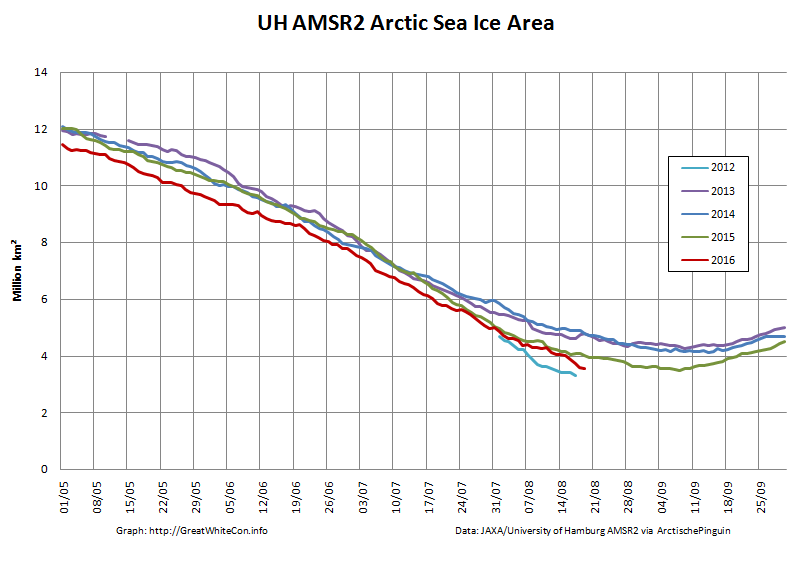
The high resolution AMSR2 Arctic sea ice area has reduced by another 133.5 thousand square kilometers since yesterday. A similar drop tomorrow will take us below the 2015 minimum.
[Edit – August 19th PM]
The MSLP of the rejuvenated cyclone had dropped to 976 hPa by 12:00 UTC today:
The ECMWF forecast for lunchtime tomorrow is for something similar:
[Edit – August 20th]
The current incarnation of the cyclone bottomed out at 971 hPa near the Canadian Arctic Archipelago:
The 72 hour forecast from ECMWF for the next phase of GAC 2016 is beginning to enter the realms of plausibility. Here’s what it reveals:
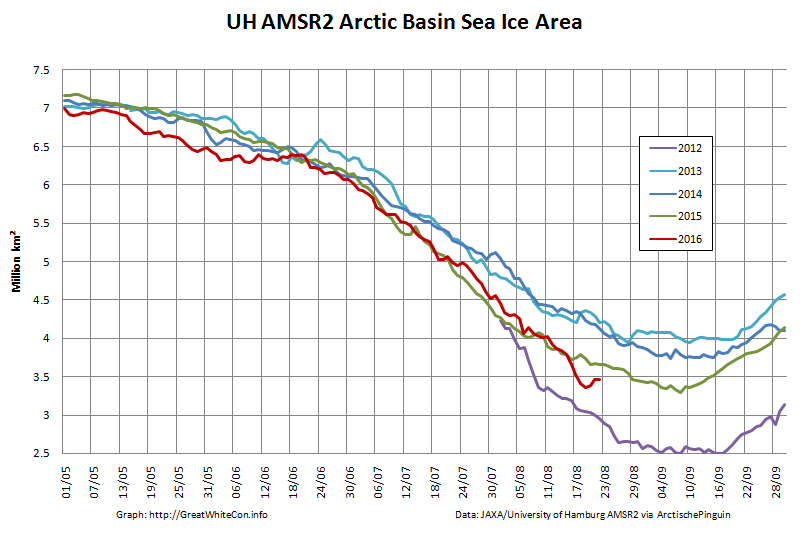
The University of Hamburg have been processing more AMSR2 data from 2012. You can argue until the cows come home about which is the best metric to peruse at this time of year, but try this one for size:
That’s the high resolution AMSR2 sea ice area for the Arctic Basin, comprising the CAB plus Beaufort, Chukchi, East Siberian and Laptev Seas.
[Edit – August 25th]
There’s a bit of a gap in the clouds over the Central Arctic today:
NASA Worldview “true-color” image of the Central Arctic Basin on August 25th 2016, derived from the MODIS sensor on the Terra satellite
This is merely the calm before the next storm. Here is the current ECMWF forecast for Saturday lunchtime (UTC):
Low pressure on the Siberian side of the Arctic and high pressure on the Canadian side producing an impressive dipole with lots of sea ice “drift” towards the Atlantic:
[Edit – August 27th]
Saturday morning has arrived, and so has the predicted storm. As the centre of the cyclone crossed the coast of the East Siberian Sea its central pressure had fallen to 967 hPa, whilst the high pressure over Alaska had risen to 1028 hPa:
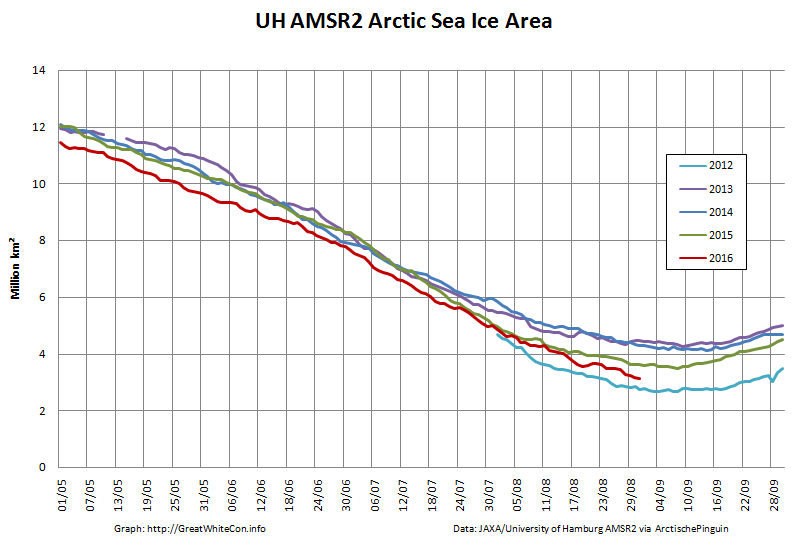
The effect of the earlier bursts of high wind is apparent in the high resolution AMSR2 sea ice area graph:
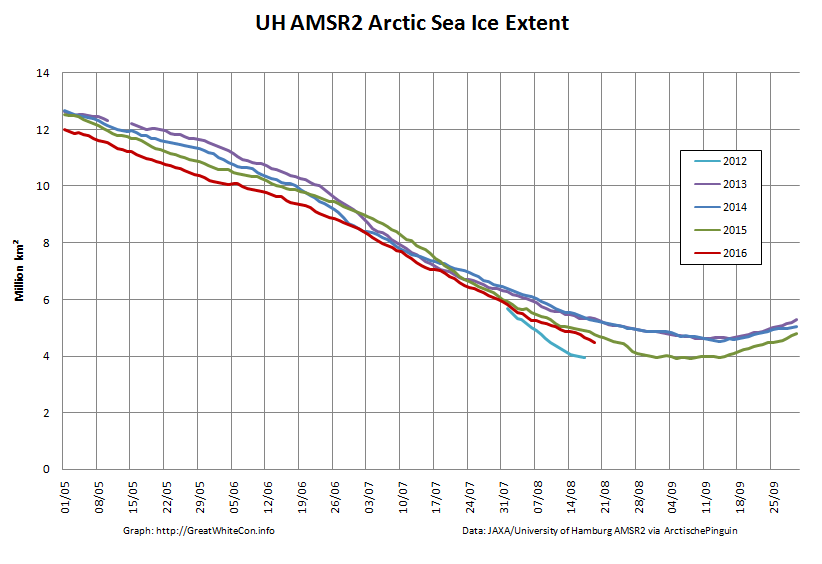
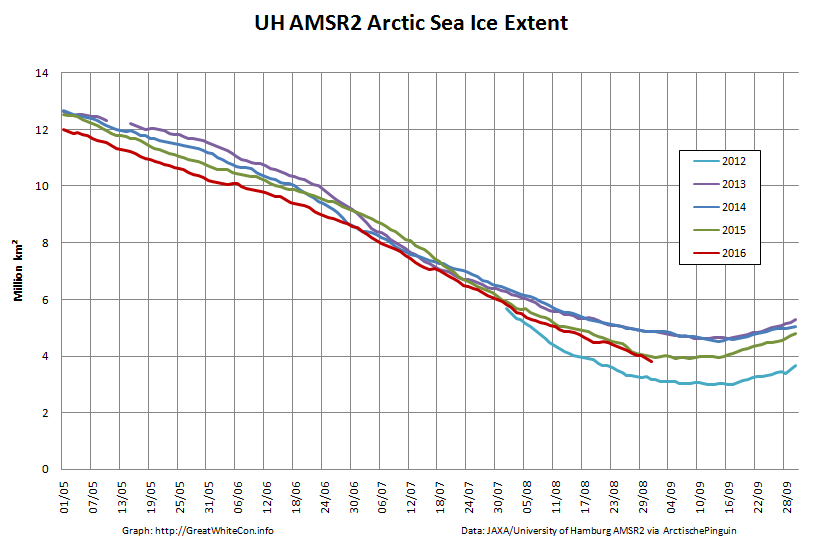
However they are not as apparent in the corresponding extent graph:
[Edit – August 28th]
As the centre of the cyclone heads for the North Pole the isobars are tightening across the last refuge of multi-year sea ice north of the Canadian Arctic Archipelago and Greenland:
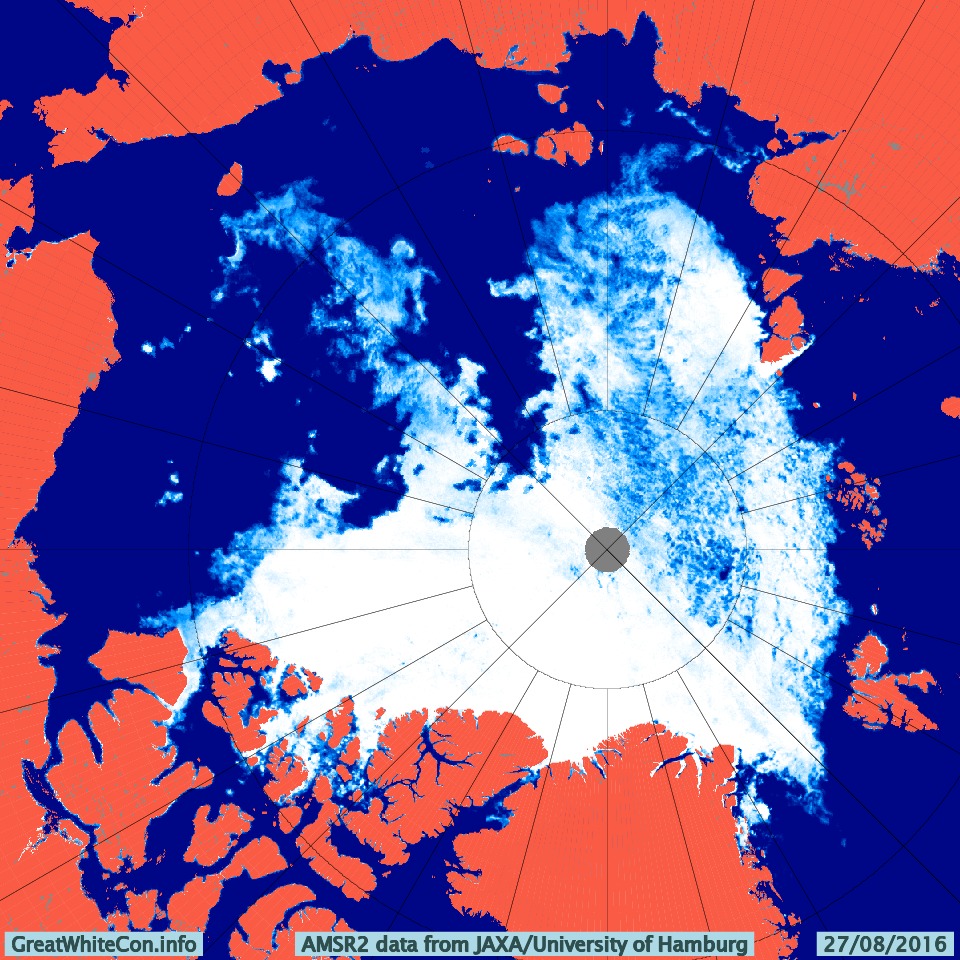
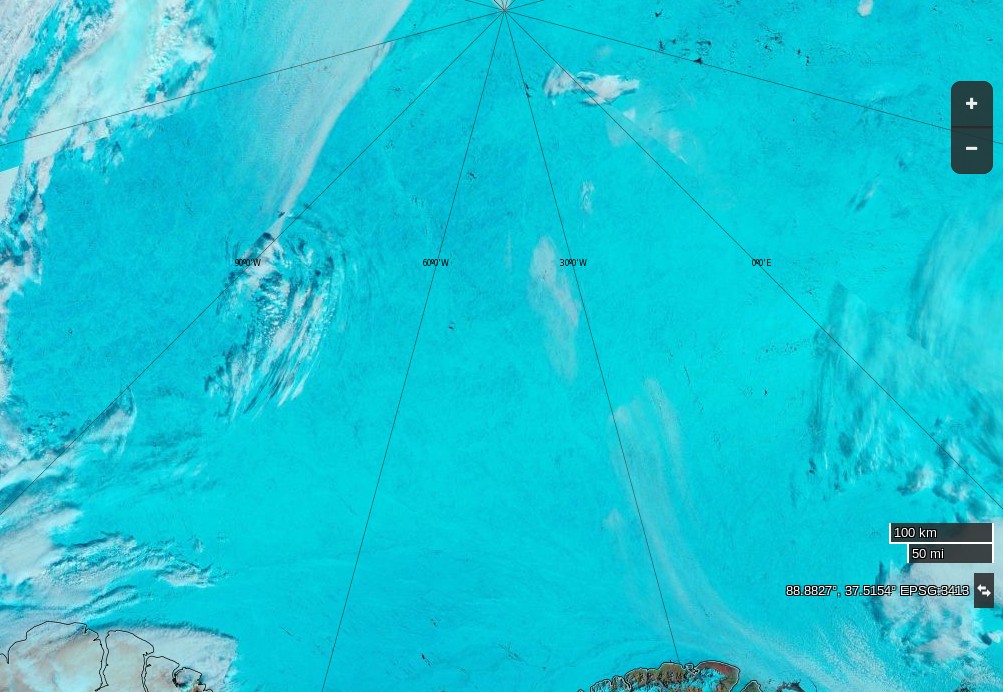
The area north of the East Siberian Sea that was predicted to bear the brunt of the wind and waves overnight is still covered in cloud. However the latest AMSR2 update from the University of Hamburg suggests that open water now stretches as far as 86 degrees north:
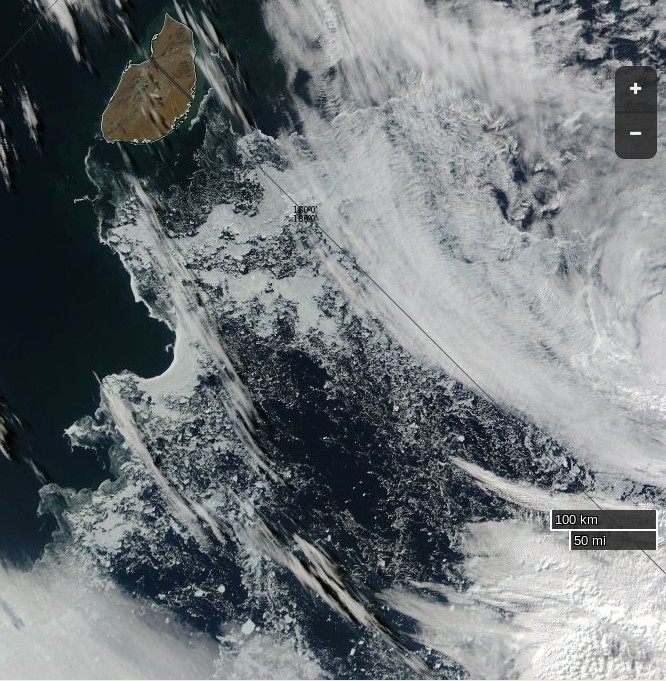
The skies over the northern Chukchi Sea have cleared to reveal this:
NASA Worldview “true-color” image of the northern Chukchi Sea on August 28th 2016, derived from the MODIS sensor on the Aqua satellite
[Edit – August 29th]
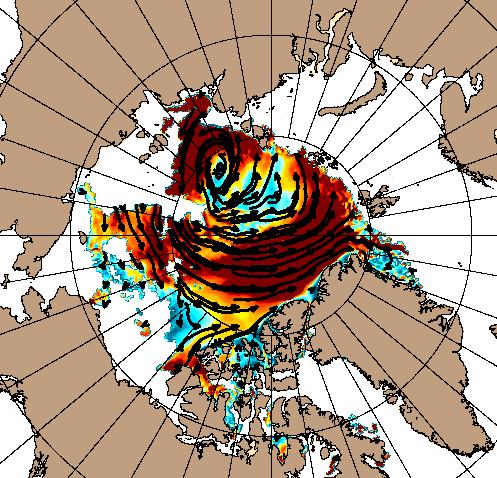
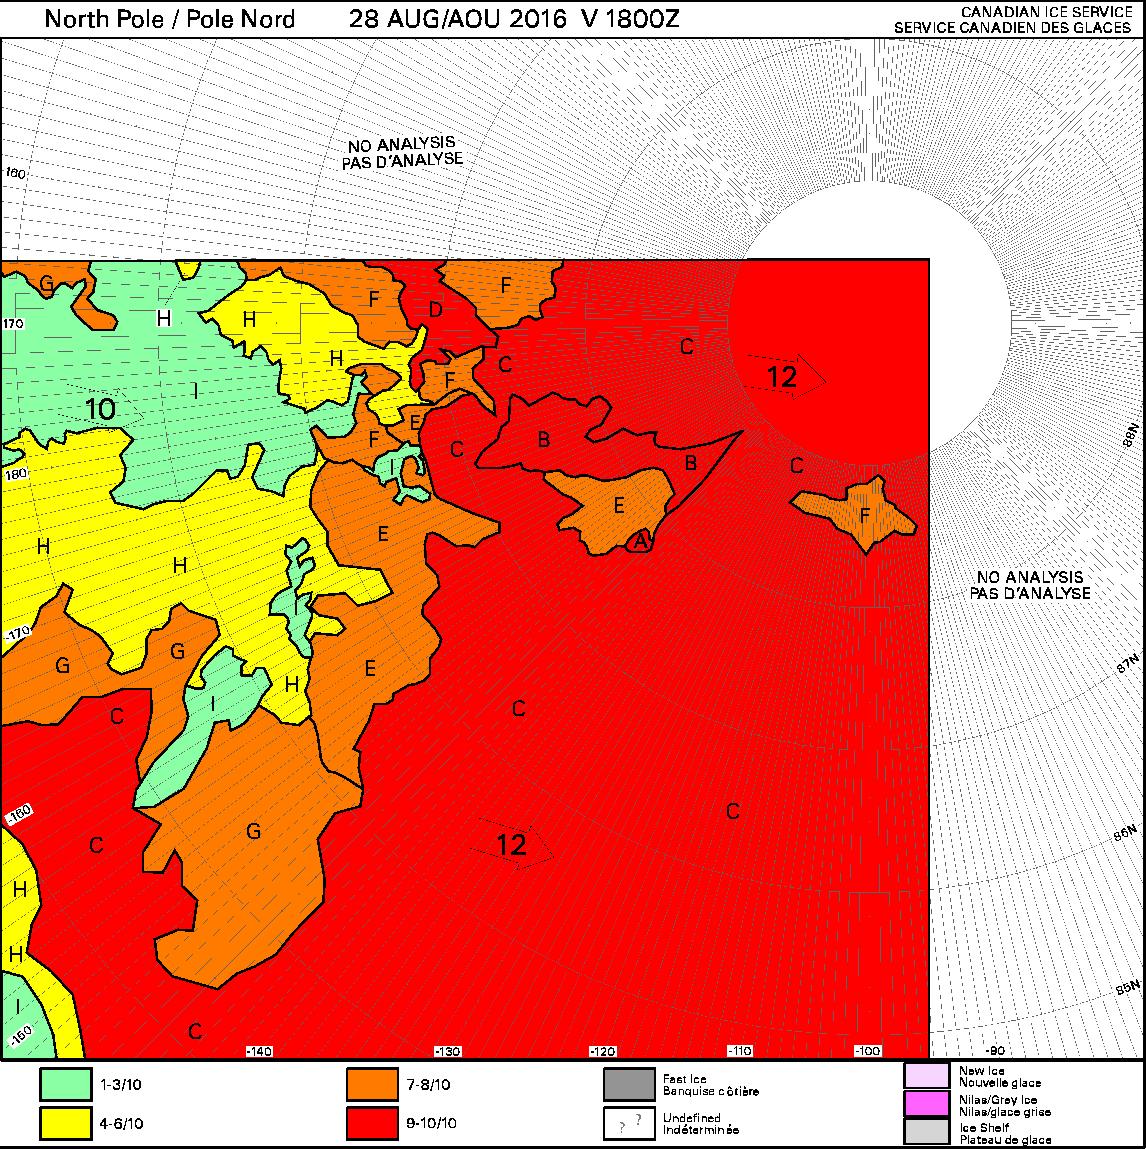
Some of the effects of the recent high winds can be judged by this Canadian Ice Service chart of ice concentration near the North Pole:
[Edit – September 1st]
Arctic sea ice area continues to fall quickly for the time of year:
The recent dipole has finally caused some compaction of the scattered sea ice. Hence the high resolution AMSR2 extent is following suit and is now below last year’s minimum:
In the spirit of providing some spurious “balance” to the contentious Arctic sea ice “debate” our quote for today comes fairly fresh from the Arctic Sea Ice Forum:
idk how people are confusing the gaping fissures that span from Siberia to Canada with melt ponds but it seems like half the people here have blinders on to what is ongoing.
I know HYCOM gets a lot of flak but instead of projecting out, let’s look at the last five days.
[Superfluous image redacted]
The ice has clearly broken completely in two now, and the recent ~970mb low did a major whomping to the ice in the “cleavage” between what’s stuck against Siberia and the main CAB.
Intriguingly this was in response to an informed comment on June 23rd to the effect that:
As we have seen recently, these large area drops in the middle of the pack do not mean the ice is gone, just that its top is wet/ponded. In a couple of days some of these drops might be reversed. Of course the ice has suffered in the meantime, but still it’s risky to simply extrapolate these numbers.
Even more intriguingly our headline for today is remarkably like the inverse of a phrase in a Mail on Sunday article that led us to create this site in the first place!
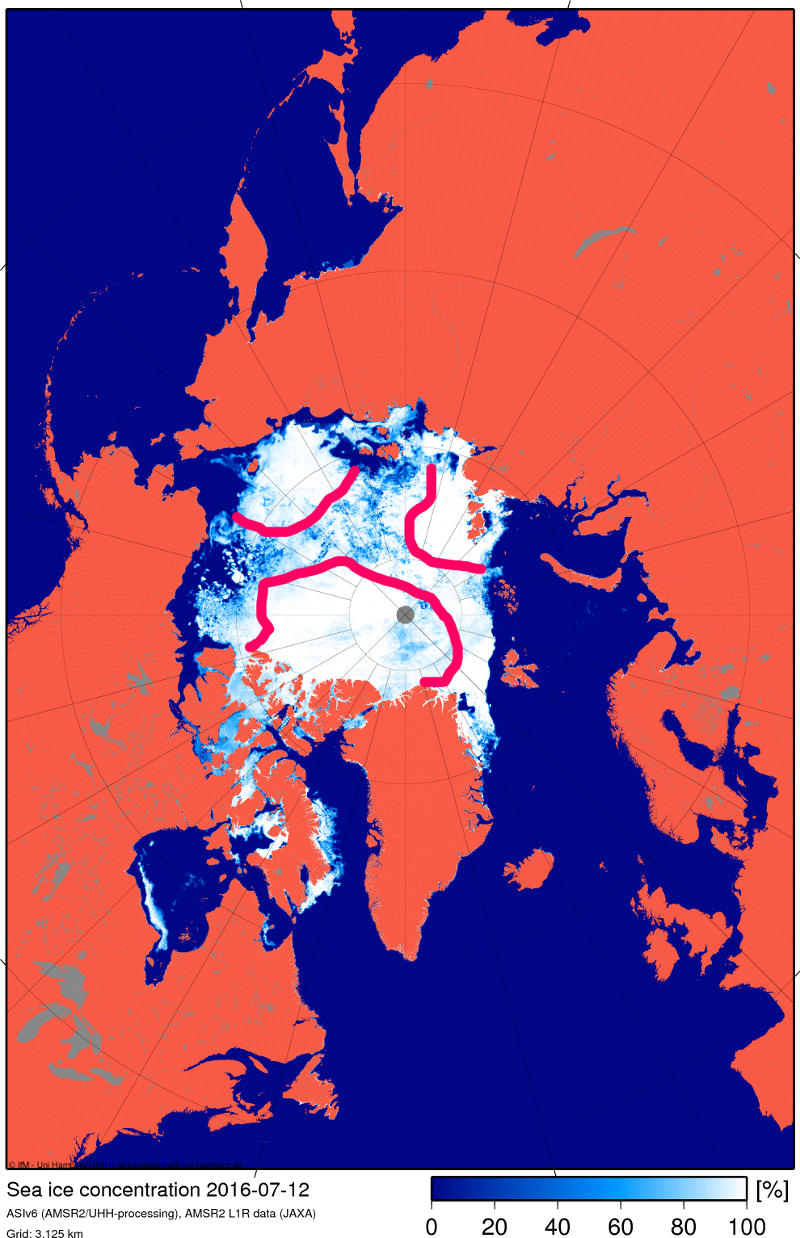
Nearly three weeks have passed since those “gaping fissures that span from Siberia to Canada” were announced, and you may well (like me) be wondering how they have been coming along? In partial answer to that question here is our very latest video based on the University of Hamburg’s AMSR2 concentration visualisations:
In my own humble opinion this doesn’t really count as a “gaping fissure” but MODIS imagery does now show a fair bit of open water between Siberia and the North Pole:
A “gaping fissure” between the Pole and Canada (and/or Greenland) is however conspicuous only by its absence:
NASA Worldview “false-color” image of the Central Arctic Basin on July 11th 2016, derived from the MODIS sensor on the Aqua satellite
I do think that I can spot some melt ponds in the area at the moment though. How about you?
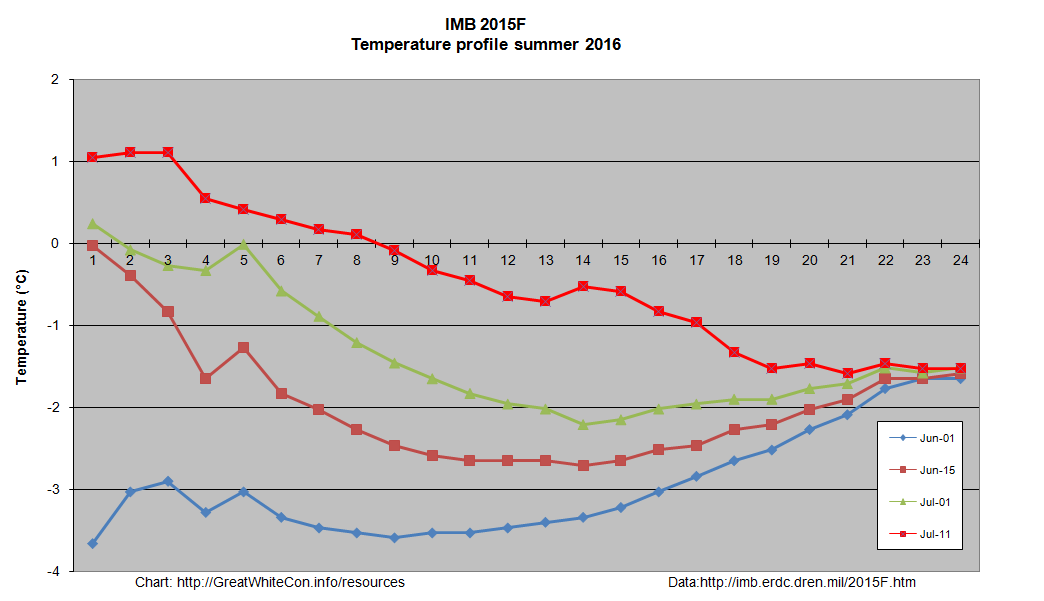
The one CRREL/ERDC ice mass balance buoy still reporting reveals that both surface and bottom melting have started at around 83 degrees north:
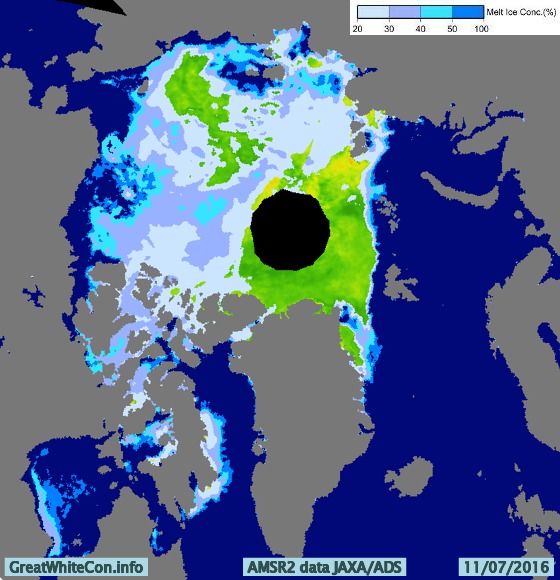
The 2016 multi-year ice melting season has evidently now begun, and the floe upon which buoy 2015F is sitting still has ~1.9 metres of melting to go. It’s not beyond the bounds of possibilty that a “gaping fissure” from the Atlantic to the Pacific will ultimately emerge this year. However based on the evidence thus far I’ll be extremely surprised if there is one “from Siberia to Canada”, unless of course you count the Chukchi & Beaufort Seas. That route is already open to intrepid Arctic seafarers, as can be seen at the bottom of the animation above and on the current JAXA/ADS Arctic sea ice surface melt map:
I have taken lots of flack I will stand by my prediction that we are heading for sub-1M KM2 come September (or early October).
Structurally [the ice] has actually now broken into three pieces, one is attached to the islands N of Siberia/NE of Svalbard, one is near Wrangel/ESS, and the “bulk” is pushed against the CAA/Greenland.
The lower concentrations in CAB are clearly open water and not melt ponds.
I felt compelled to explain to (presumably) him that:
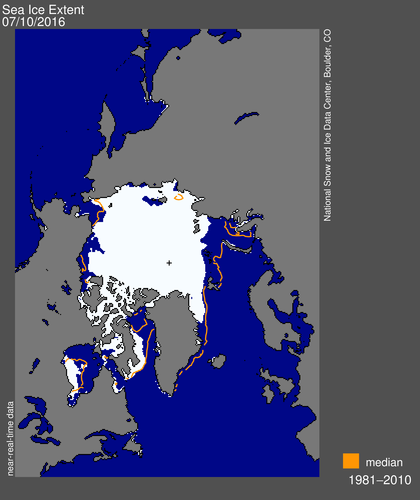
Here’s the NSIDC’s view of those “gaping fissures” of yours:
Despite some faults I think both ARC and GLB are onto the truth. Satellite grabs over the past few days show failure on all three fronts (ATL, PAC, and the Russian side especially), but the Russian side doesn’t present as a solid front (nor does the Beaufort melt), and the leads keep getting absorbed into the slush of the main pack (which is why the ‘slush’ keeps expanding, and why most of the CAB has now evolved into this state). The only solid regions of ice are those bordering the steaming ATL waters as well as some remnants north of the CAA (no coincidence the latter was chosen as ‘evidence’).
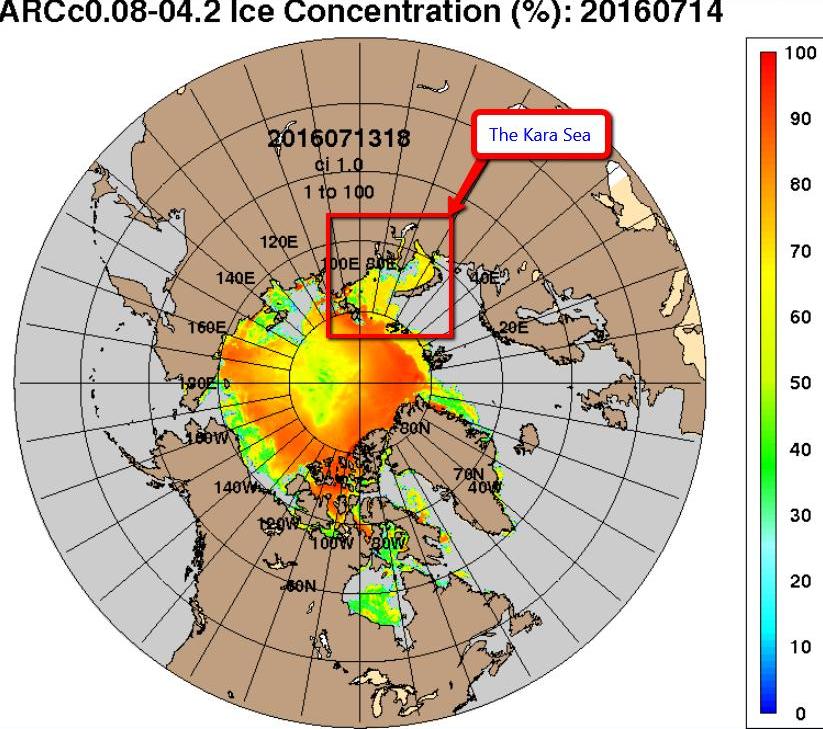
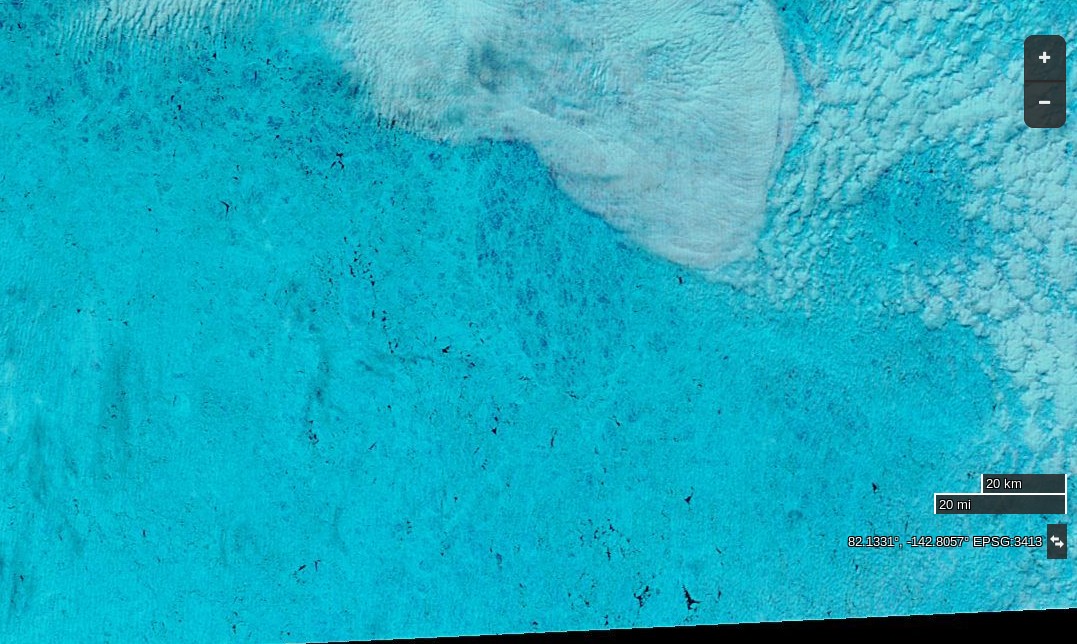
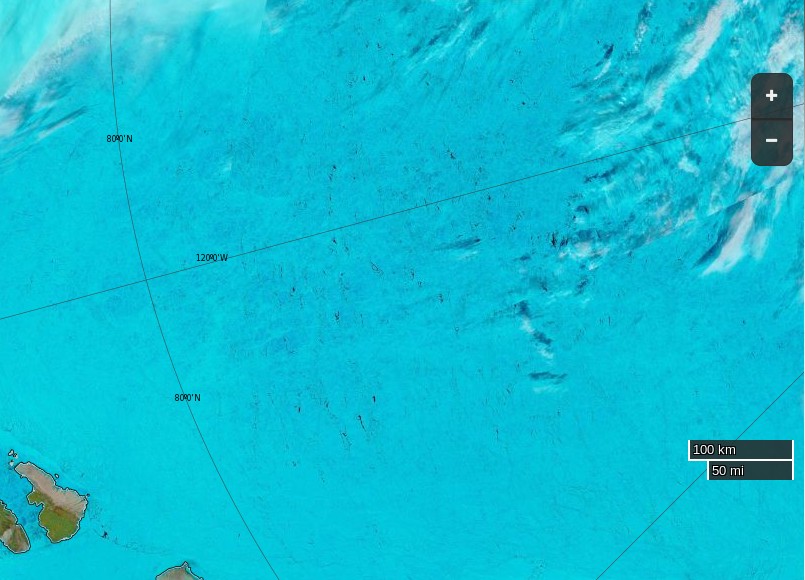
Yesterday the Kara Sea didn’t suddenly become covered in sea ice, and today the area of the Central Arctic Basin around 82 N, 135 W looks like this to the MODIS instrument on board the Terra Satellite:
NASA Worldview “false-color” image of the Central Arctic Basin on July 15th 2016, derived from the MODIS sensor on the Terra satellite
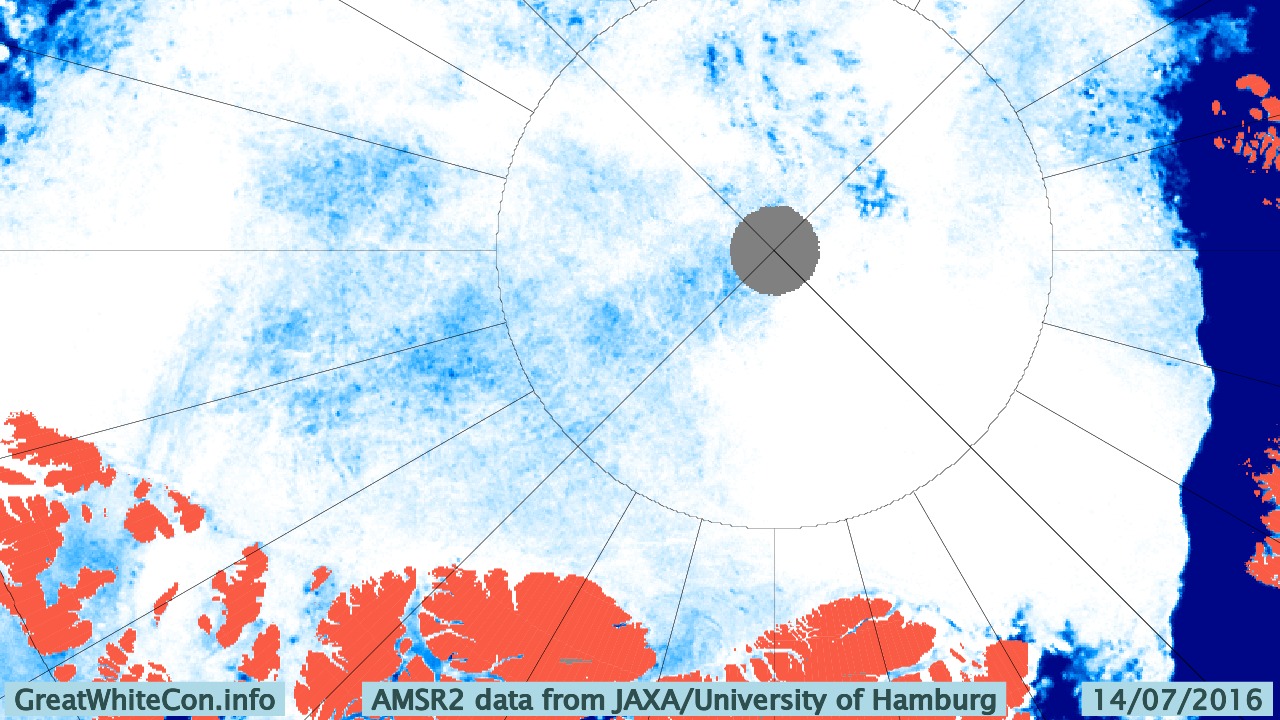
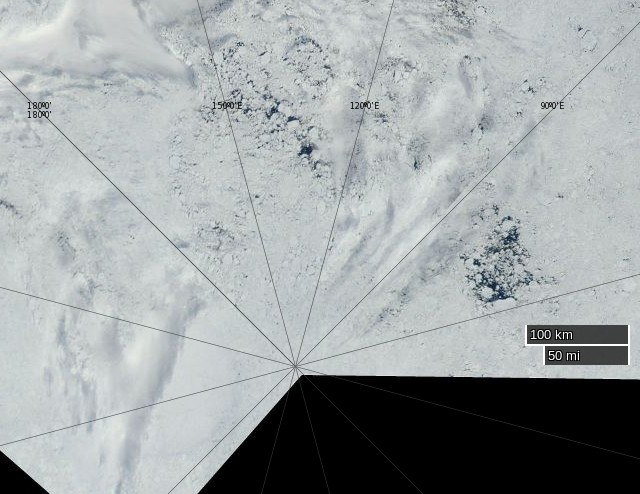
and like this to the University of Hamburg’s ARTIST sea ice concentration algorithm:
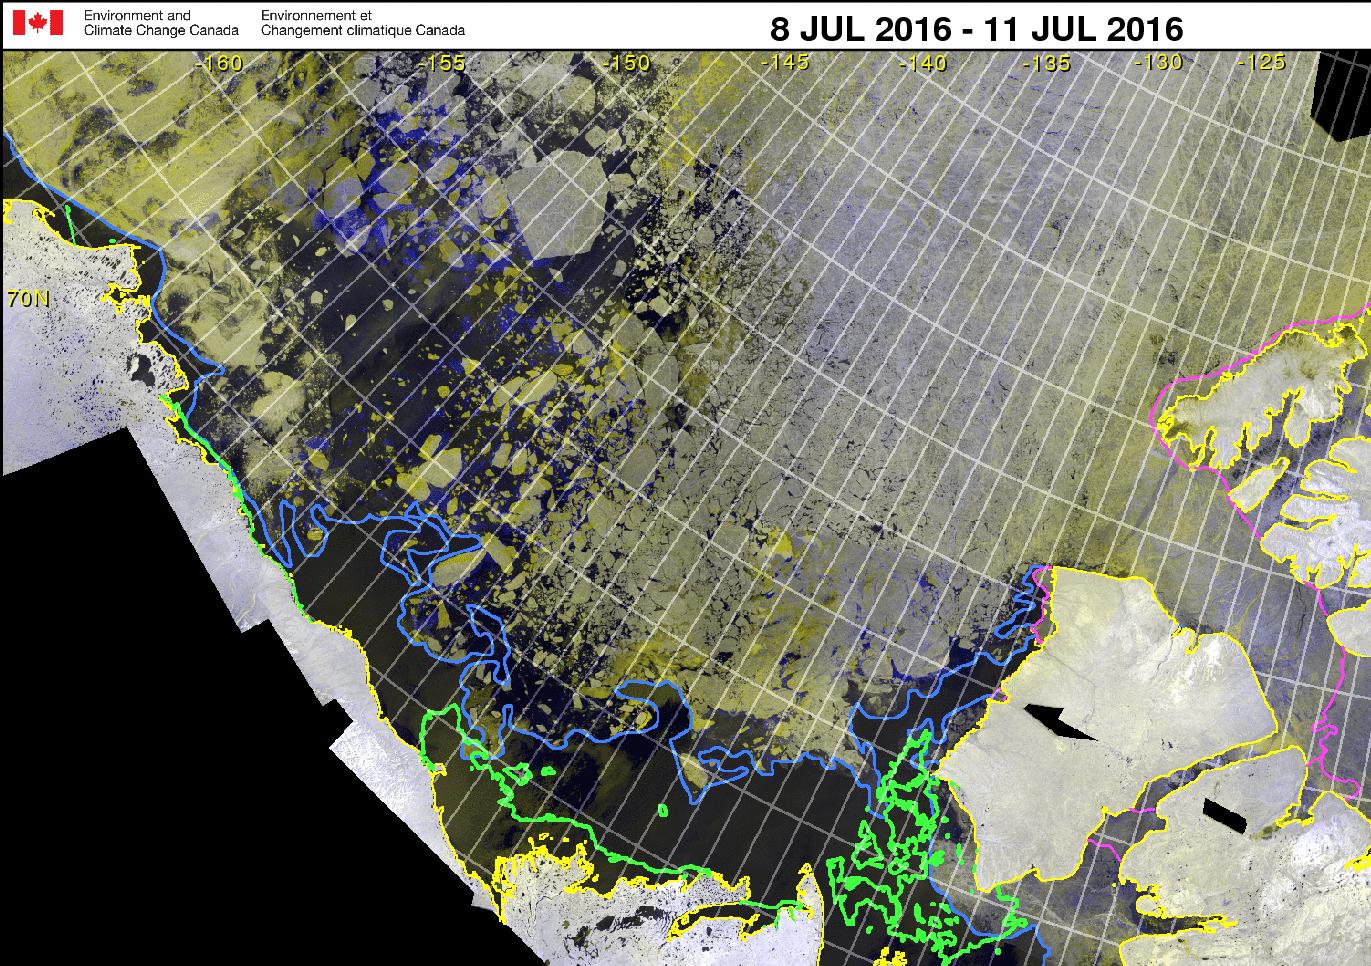
whilst here’s the latest Canadian Ice Service RadarSat mosaic for the Western Arctic:
Canadian Ice Service Western Arctic RadarSat mosaic for 8-11 July 2016
Current Buoy Data (07/15/2016):
Pos: 82.89 N, 137.34 W
Air Temp: -0.76 C
Air Pres: 1011.16 mb
Ice thickness : 185 cm
[Edit July 16th 2016]
The Arctic Sea Ice Forum management have banished “Flack Jacket” to the sin bin for a month.
I’m fed up with the personal insults because a model that has a history of errors is showing something spectacular that no other data source does. Come back in a month if you still feel like it.
Meanwhile in answer to my enquiry on the HYCOM support forum Alan Wallcraft tells me:
We now use the National Ice Center’s IMS sea ice extent product in our assimiltion, see http://www.natice.noaa.gov/ims/. This is manually produced every day, and generally avoids the artifacts and deficiencies of satellite sea ice concentrations. However yesterdays IMS fields were not good, and that is where the spurious sea ice came from. Today’s IMS field is good, and we may rerun the 2016/07/13-18Z nowcast/forecast to clear this up.
After a brief “pause” ACNFS is back in action, and here is its latest Arctic sea ice concentration “nowcast”:
Yesterday the skies were clear once again over the corner of the Arctic where buoy 2015F is located:
NASA Worldview “false-color” image of the Central Arctic Basin on July 15th 2016, derived from the MODIS sensor on the Aqua satellite
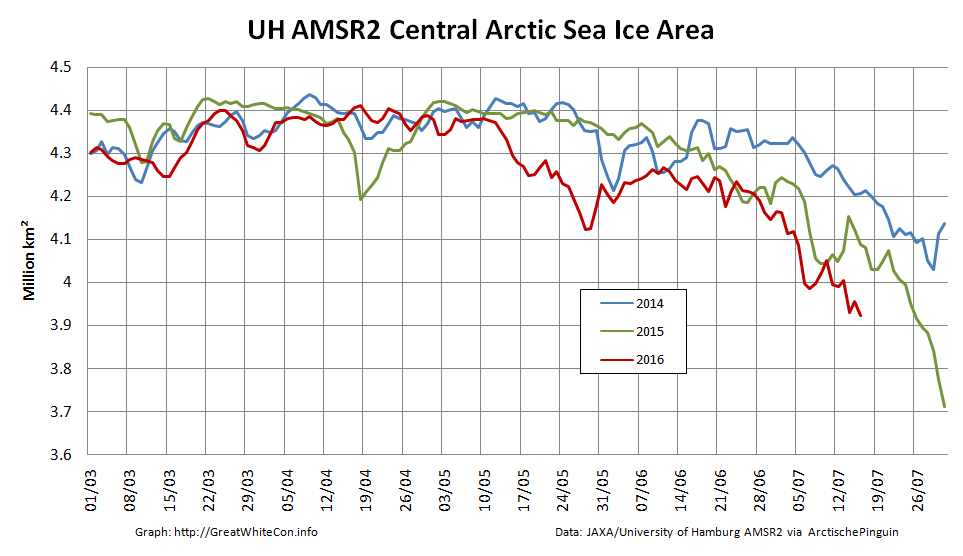
Here’s how the sea ice area in the Central Arctic Basin has been faring recently:
[Edit July 19th 2016]
Here’s an early image of the North Pole from the Aqua satellite this morning, recorded for posterity in case it changes later:
NASA Worldview “true-color” image of the North Pole at 09:00 UTC on July 19th 2016, derived from the MODIS sensor on the Aqua satellite
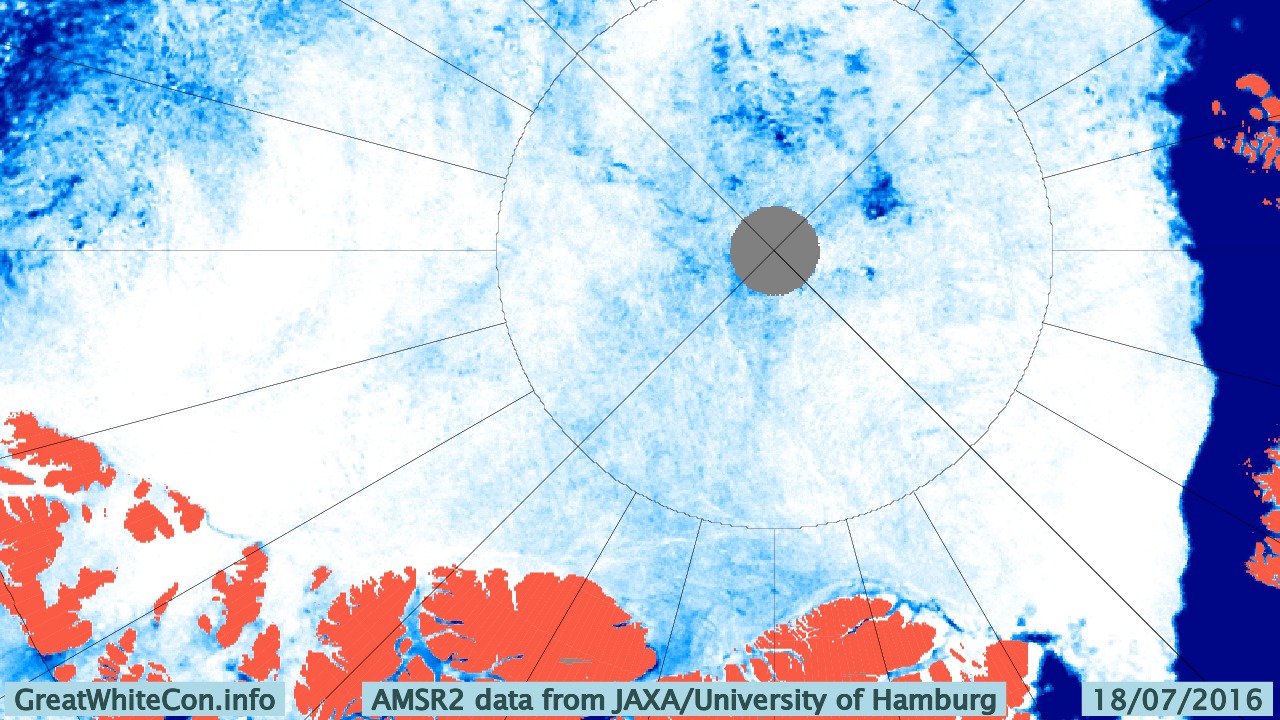
and as the recent Arctic storm heads towards the Canadian Arctic Archipelago here’s the latest Hamburg AMSR2 concentration map:
I attach the ACNFS plot you referenced and the corresponding plot from our next global real-time system (GOFS 3.1), which will likely replace our current global analysis (and ACNFS) once NAVGEM 1.4 is operational (it is running here with NAVGEM 1.3, like ACNFS). They assimilate the same observations, but ACNFS only does so near the ice edge while GOFS 3.1 assimilates sea ice concentration everywhere (but with higher error bounds in the ice interior). The reason for ACNFS only assimilating near the edge is in part due to that being the most important area for navigation but also because SSMI satelite ice concentrations tend to “over saturate” in the summer. We switched GOFS 3.1 to “believe” the observations because they are generally better in recent years.
The two are quite different in the interior of the sea ice and GOFS 3.1 is certainly better there. We did not see the low concentrations near the North Pole in ACNFS this time last year, so something has happened to make the free running model produce low concentrations this summer. We are looking into it.
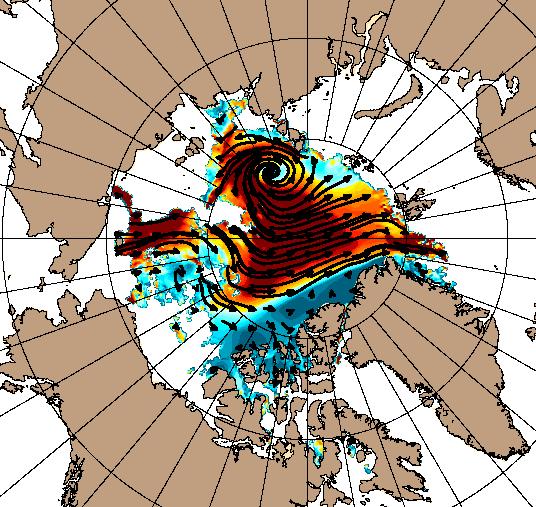
According to the US National Snow and Ice Data Center, the Beaufort Gyre is:
A clockwise circulation (looking from above the North Pole) in the Beaufort Sea, north of Alaska. This circulation results from an average high-pressure system that spawns winds over the region.
Such a high pressure system has been in place over the Arctic Ocean for a few days now, and the effect of the clockwise circulation on the sea ice in the Beaufort Sea is already evident in these recent satellite images:
NASA Worldview “true-color” image of the Beaufort Sea on April 9th 2016, derived from the MODIS sensor on the Terra satelliteNASA Worldview “false-color” image of the Beaufort Sea on April 12th 2016, derived from the MODIS sensor on the Terra satellite
as well as in this animation of sea ice movement since February:
The high pressure is forecast to continue for several more days. Here’s the GFS forecast for April 20th, courtesy of MeteoCiel:
Northern Hemisphere surface pressure forecast for April 20th 2016
which shows a large system with a central pressure of 1040 hPa still sitting over the Northern Beaufort Sea. Next here’s an animation from the US Navy which forecasts ice thickness until April 19th:
April 13th 2016 ACNFS Beaufort Sea thickness forecast until April 19th
Note in particular the large area of open water forecast to be produced in the Chukchi sea off Barrow, Alaska by the end of the period. The continuing clockwise winds have already started reducing the area of sea ice in the Beaufort Sea at an unusually early date:
Amongst other things we’ll be keeping a close eye on the ice area in the Chukchi Sea over the next few days. The sun is already starting to bathe that area of our planet with its rays, and open ocean soaks up that heat much more readily than bright white ice.
[Edit – 16/04/2016]
Here’s an animation of the effect on sea ice of the Beaufort Gyre in overdrive from Neven at the Arctic Sea Ice Blog:
Notice how towards the end of the animation another huge part of the ice pack, north of the Canadian Arctic Archipelago is pulled into the Gyre. This is mostly multi-year ice.
Once again our title for today is inspired by the indefatigable “Steven Goddard”. His latest Arctic themed article on his so called “Real Science” blog is entitled “Trouble Looming For Arctic Alarmists“, and he’s following his usual formula of showing an image or two interspersed with unrelated text. Here’s Tony’s textual take on things, interspersed with our graphic retorts:
Arctic sea ice coverage is nearly identical to 20 years ago:
Arctic sea ice is the thickest it has been in a decade.
According to PIOMAS it’s thin in the Beaufort, and most other areas too!
As we summarised matters for “Steve”/Tony’s loyal readership:
The Gish Gallop continues! Just for the record:
Arctic sea ice coverage is currently NOT nearly identical to 20 years ago
Arctic sea ice is currently NOT following almost the exact trajectory of 2006
Arctic sea ice is currently NOT the thickest it has been in a decade in Ron’s beloved Beaufort/Chukchi/East Siberian Seas (BCE for short)
Renowned Arctic sea ice expert “Steve Goddard” predicted last year that.”The minimum this summer will likely be close to the 2006 minimum, which was the highest minimum of the past decade”. That’s not how things eventually turned out!
This website uses cookies to improve your experience. We'll assume you're ok with this, but you can opt-out if you wish. Cookie settingsACCEPT
Privacy & Cookies Policy
Privacy Overview
This website uses cookies to improve your experience while you navigate through the website. Out of these, the cookies that are categorized as necessary are stored on your browser as they are essential for the working of basic functionalities of the website. We also use third-party cookies that help us analyze and understand how you use this website. These cookies will be stored in your browser only with your consent. You also have the option to opt-out of these cookies. But opting out of some of these cookies may affect your browsing experience.
Necessary cookies are absolutely essential for the website to function properly. This category only includes cookies that ensures basic functionalities and security features of the website. These cookies do not store any personal information.
Any cookies that may not be particularly necessary for the website to function and is used specifically to collect user personal data via analytics, ads, other embedded contents are termed as non-necessary cookies. It is mandatory to procure user consent prior to running these cookies on your website.