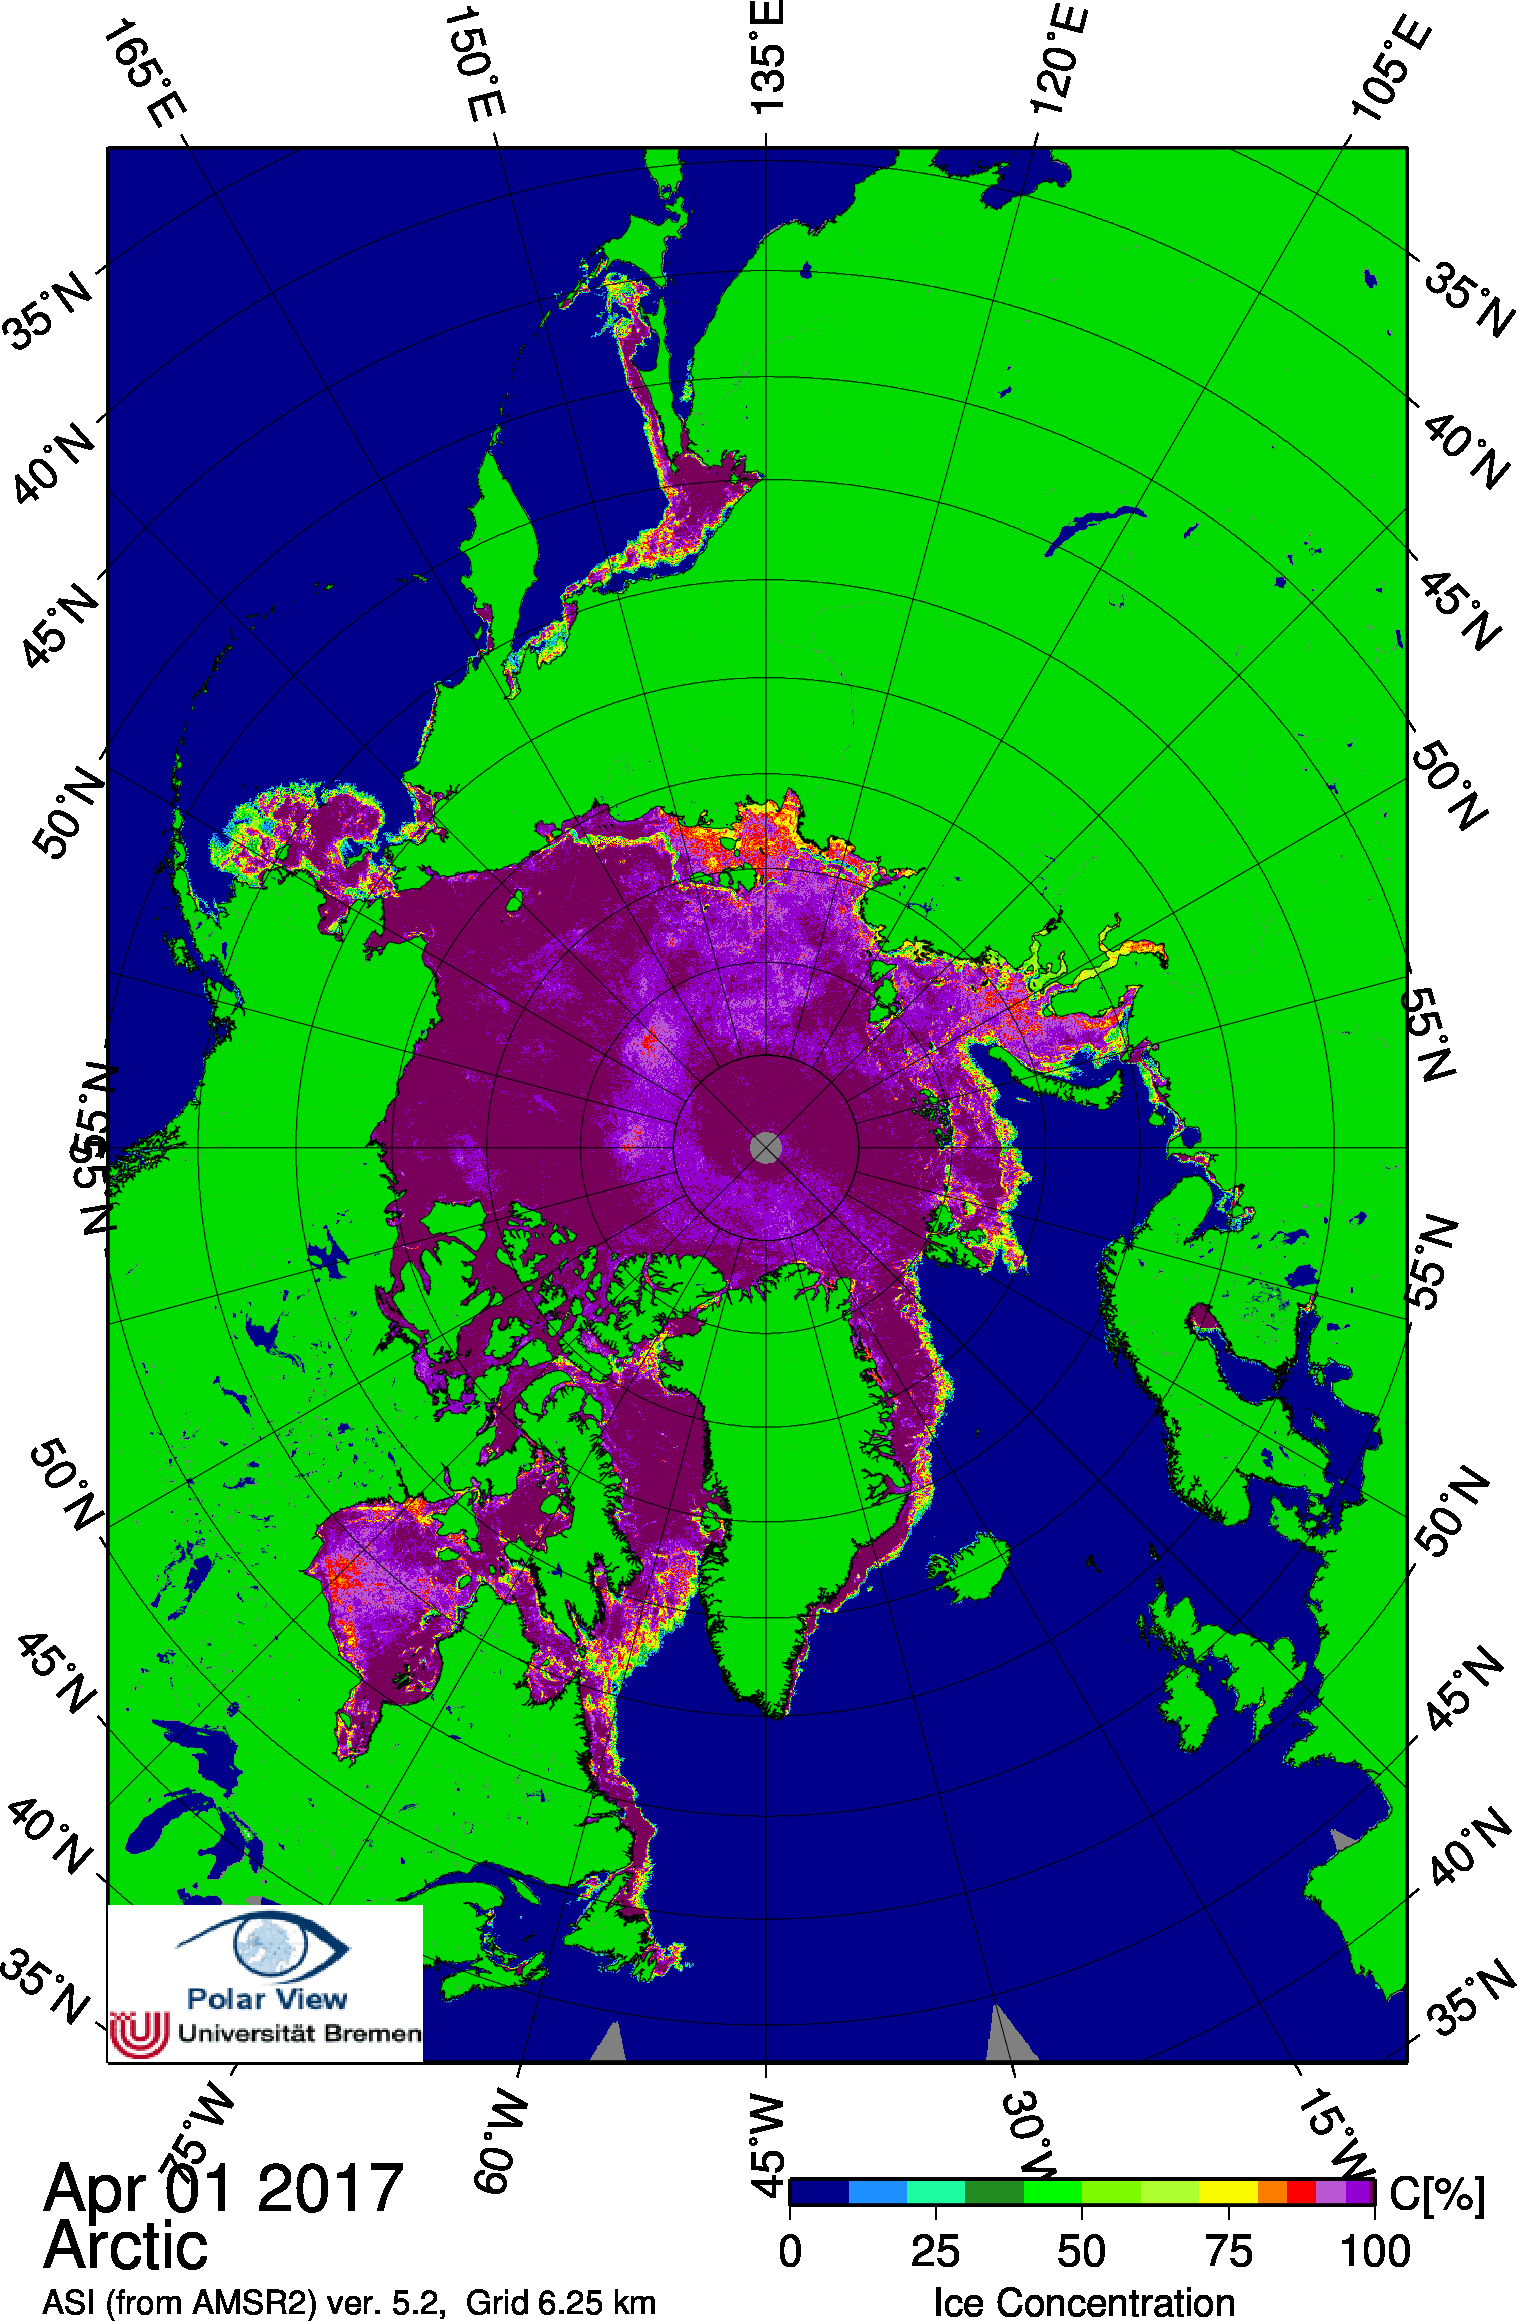
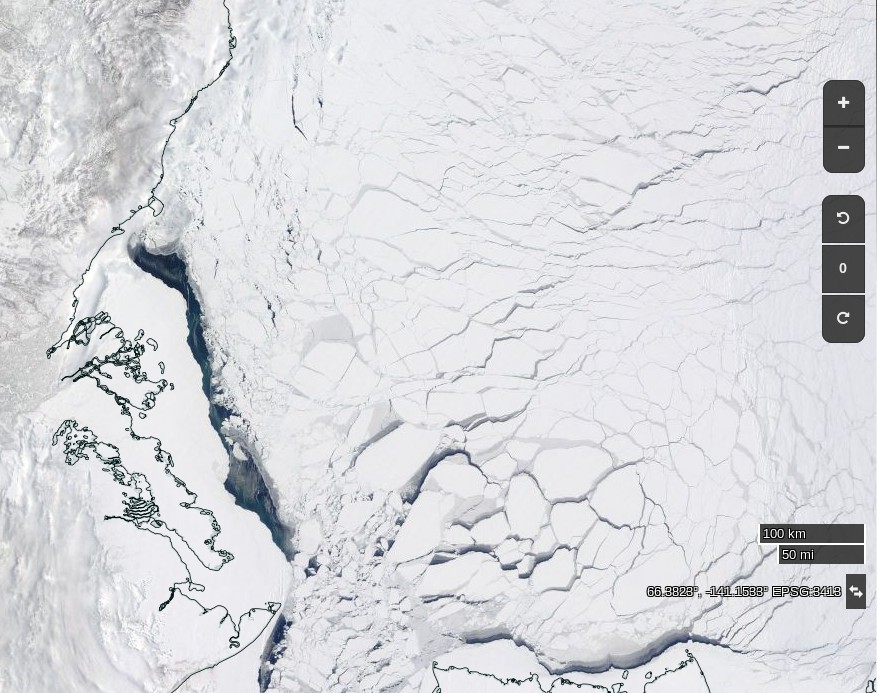
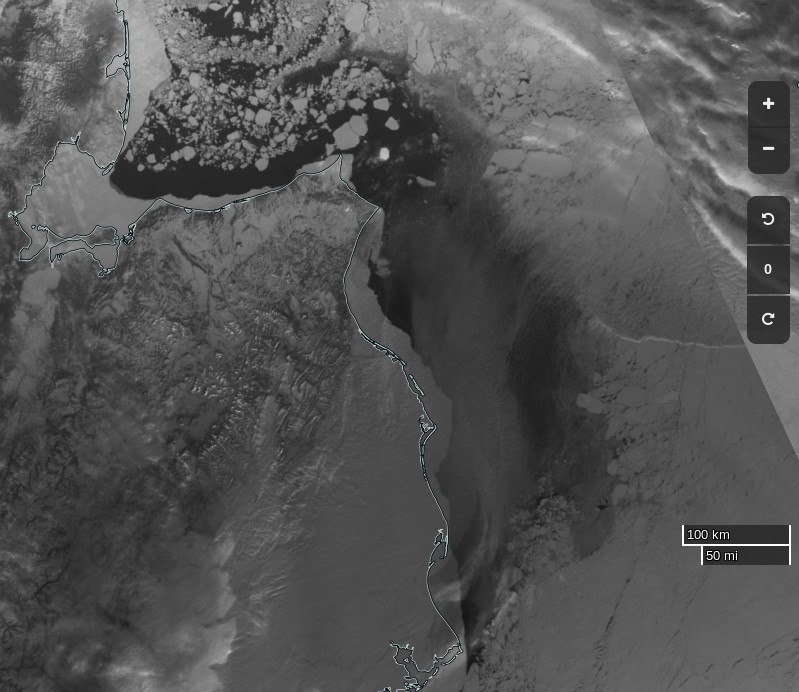
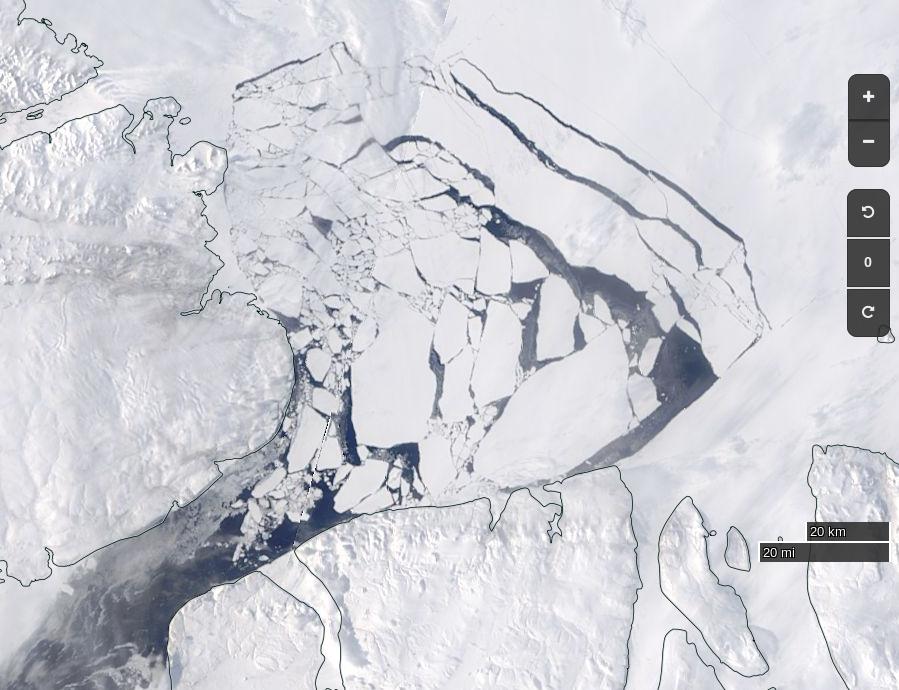
Before we got on to the more usual Arctic metrics let’s bear in mind that the beginning of May is the time when the ice on the mighty Mackenzie River begins to break up, ultimately sending a surge of (comparatively!) warm water rushing into the Beaufort Sea. The patches of open water visible in the Beaufort Sea off the Mackenzie Delta in early April refroze, but have recently opened up once again:
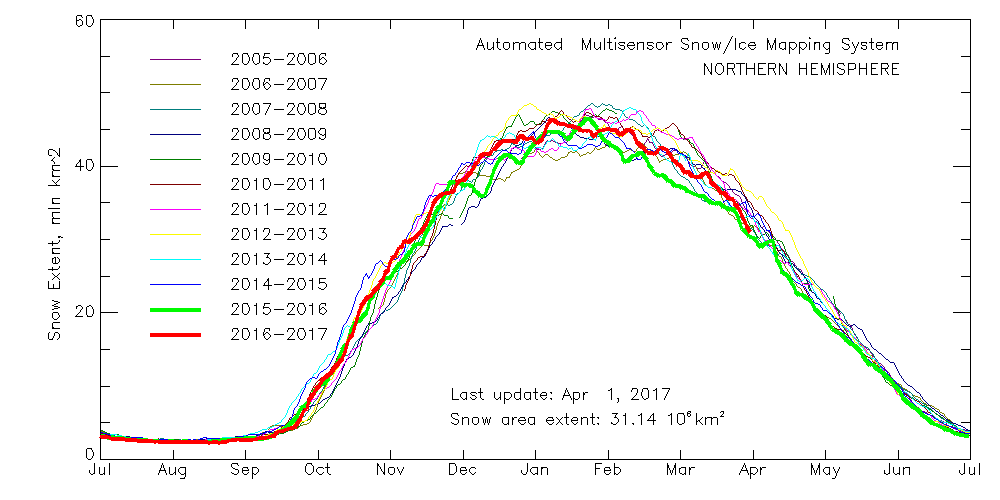
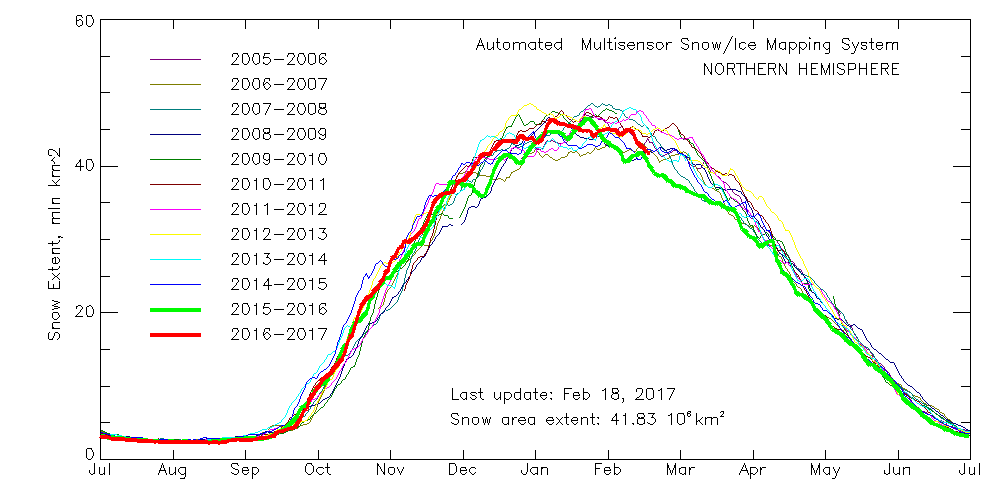
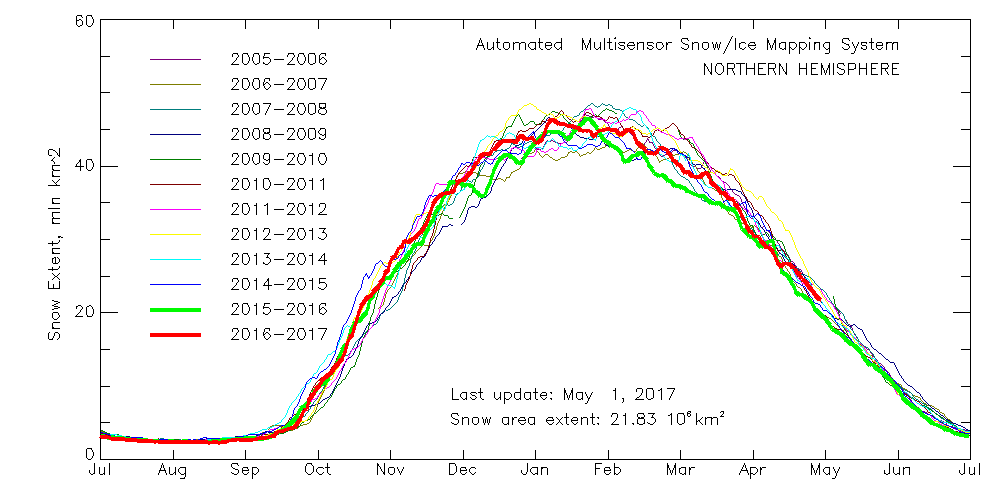
Meanwhile Northern Hemisphere snow cover is falling fast, albeit still above last year’s levels:
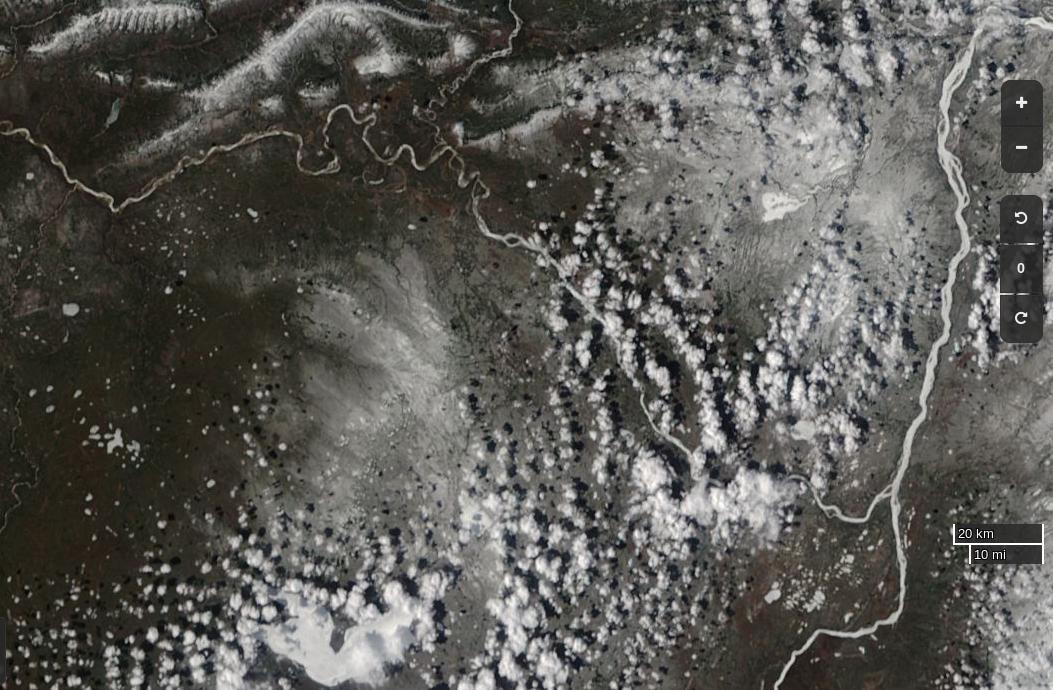
Here’s the current view of the Liard River in northern Canada, with the Mackenzie River running bottom to top on the right hand side:
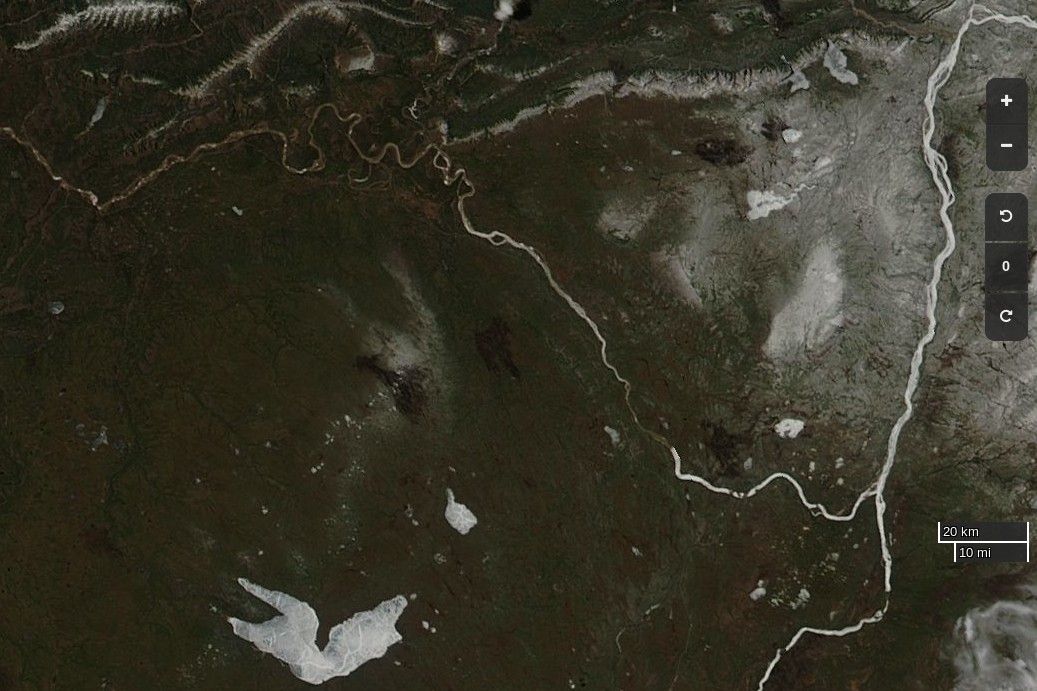
The break-up of the Liard leads the Mackenzie, and taking a look at last year’s view of the same area it’s apparent that this year there’s somewhat more snow on the ground, and that this years Mackenzie break-up will therefore be a few days later than last year:
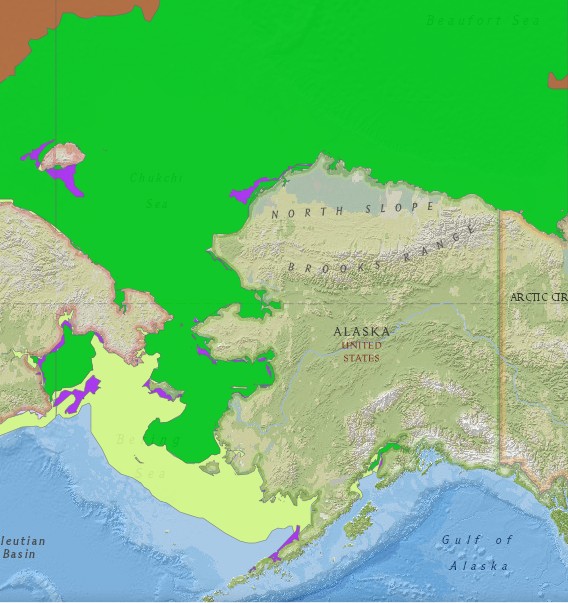
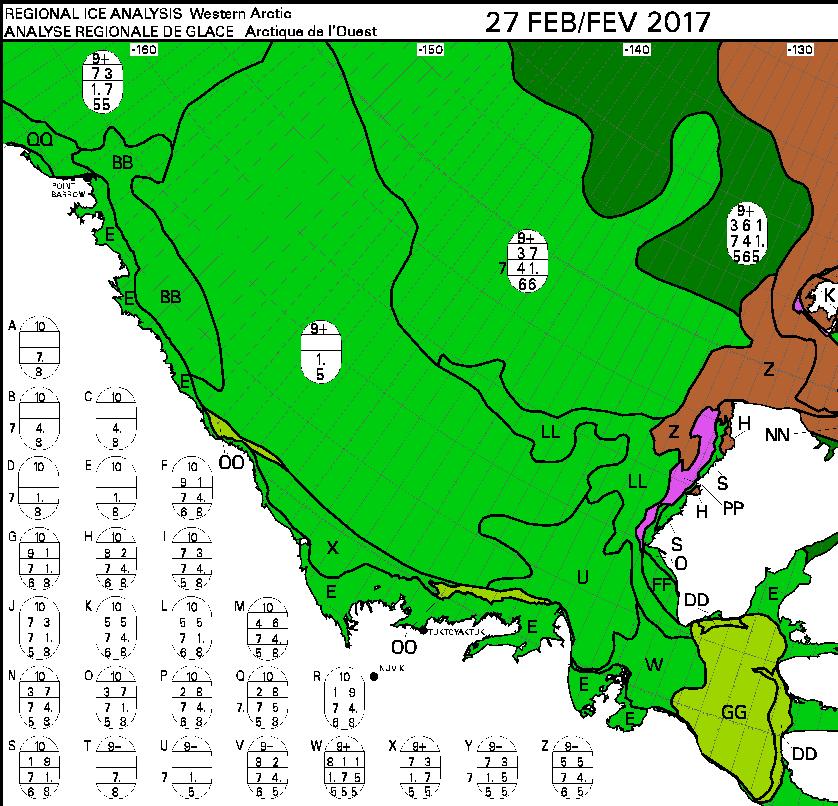
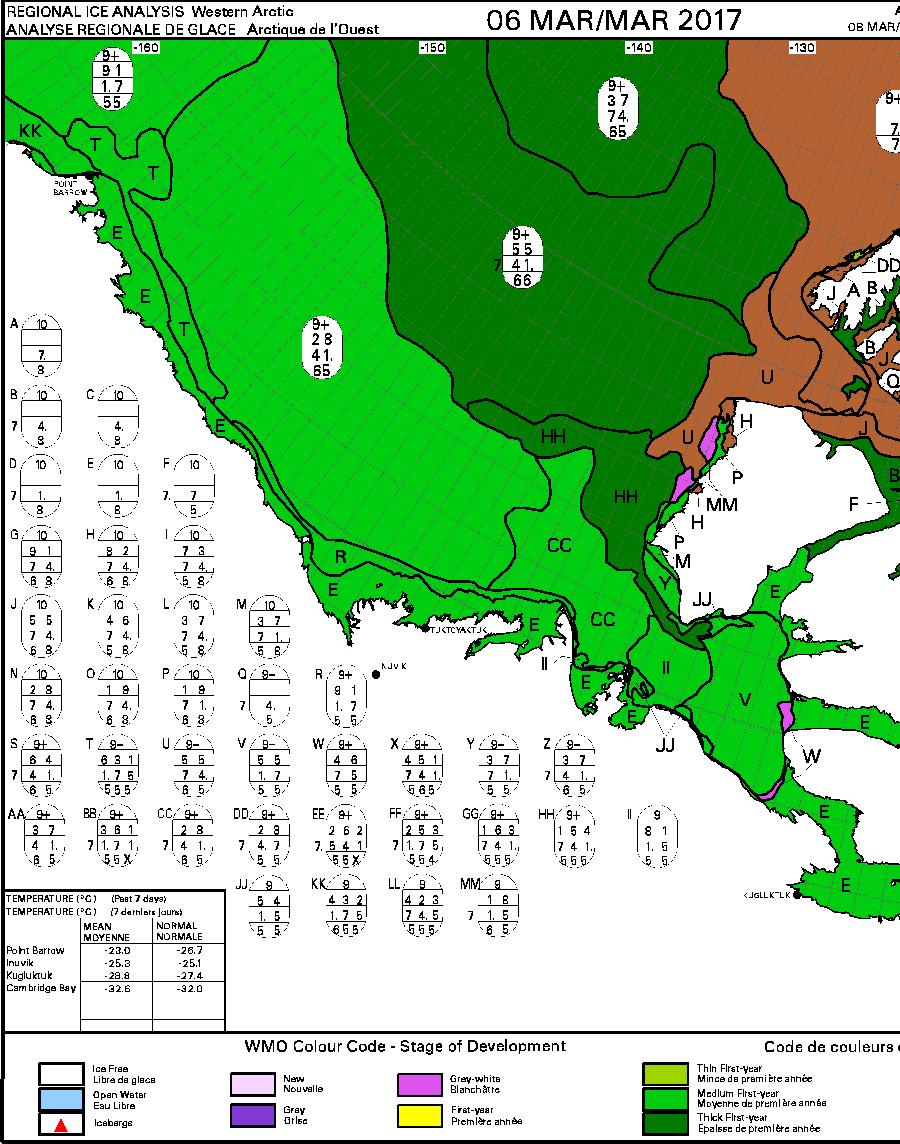
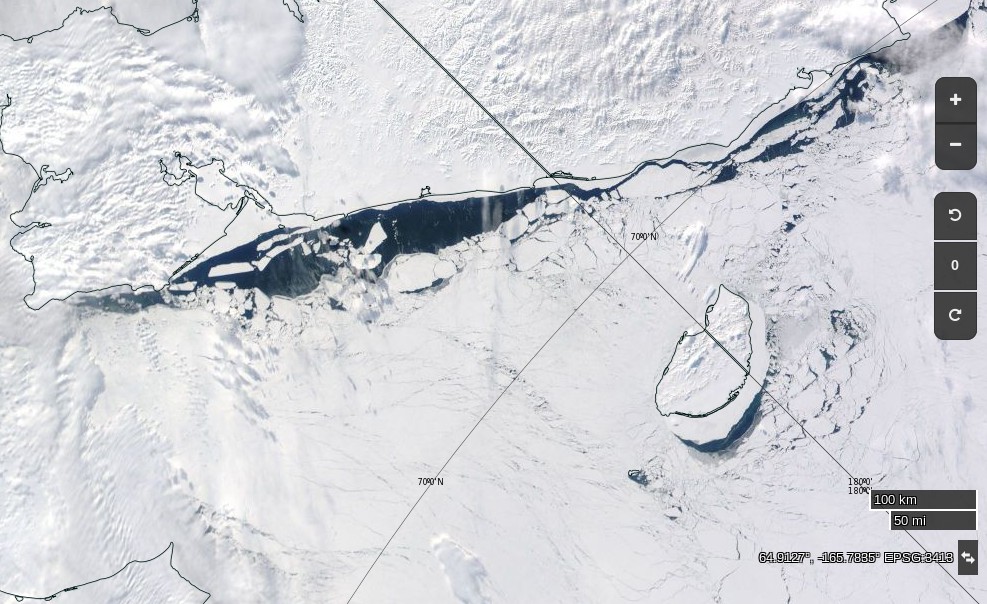
Whilst early melt in the Beaufort Sea is currently behind last year, the reverse is most certainly the case next door in the Chukchi Sea. The skies are rather cloudy there at the moment, but using the Suomi NPP day/night band to peer through the gloom reveals this:
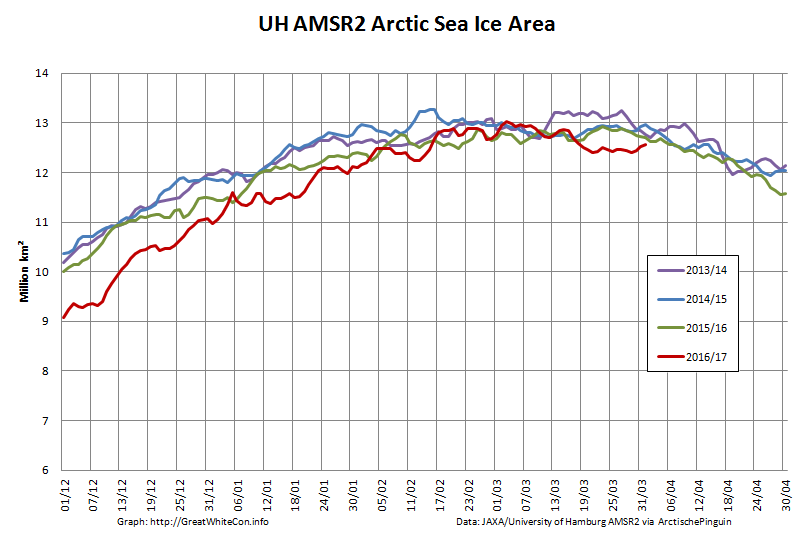
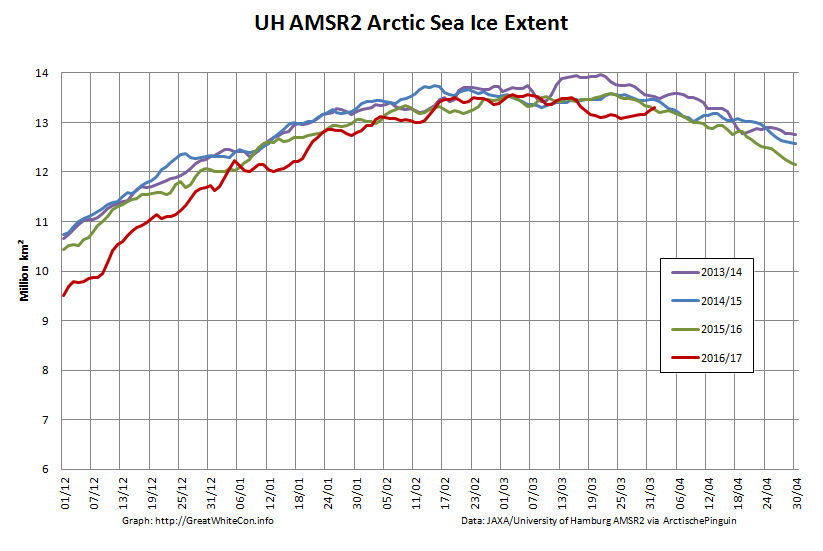
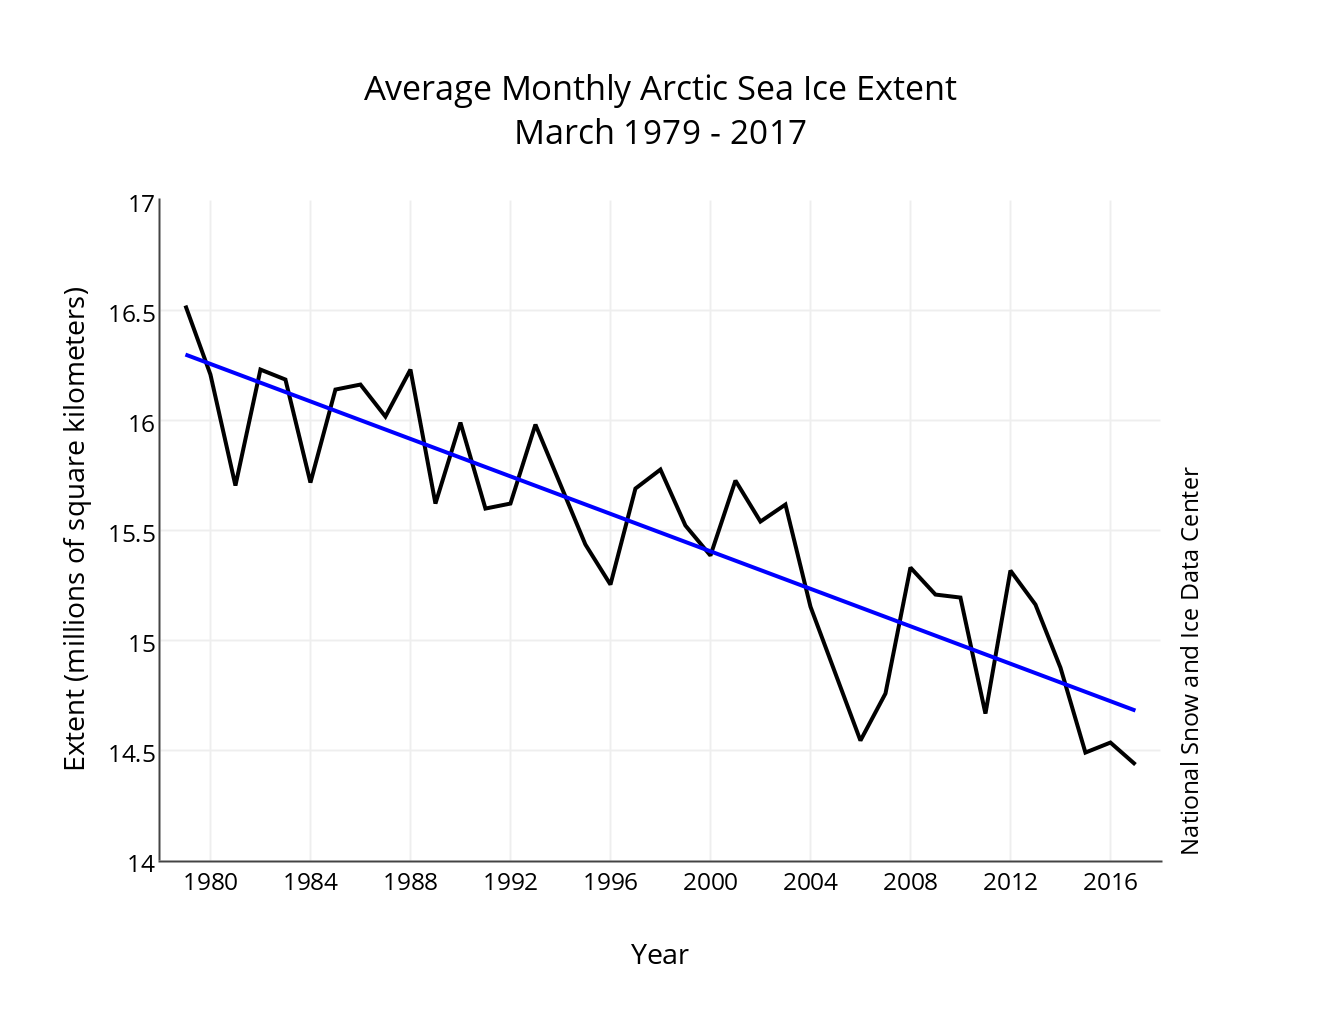
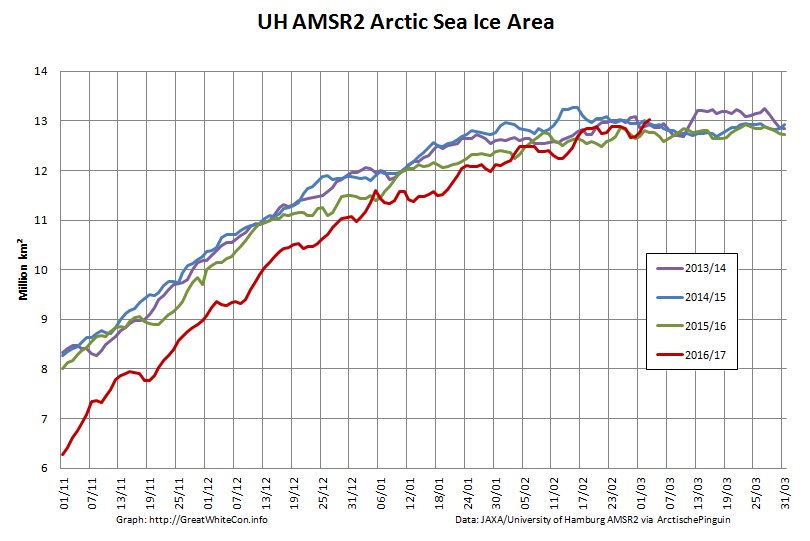
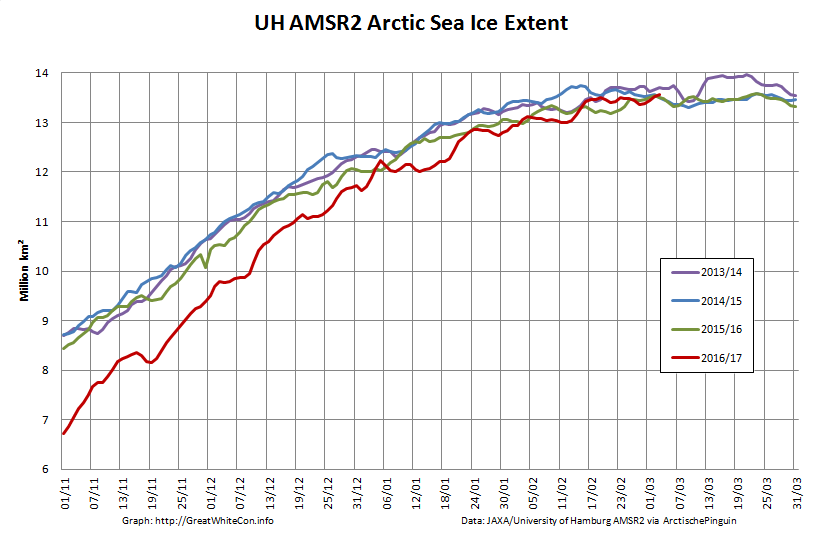
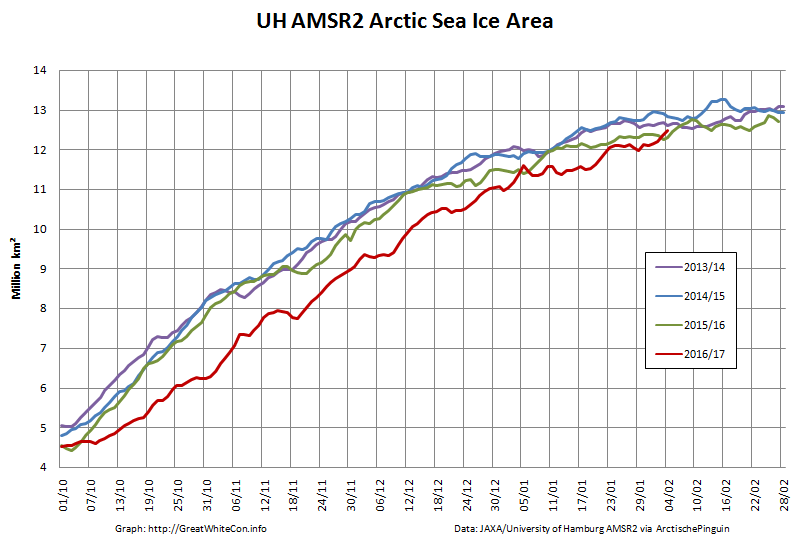
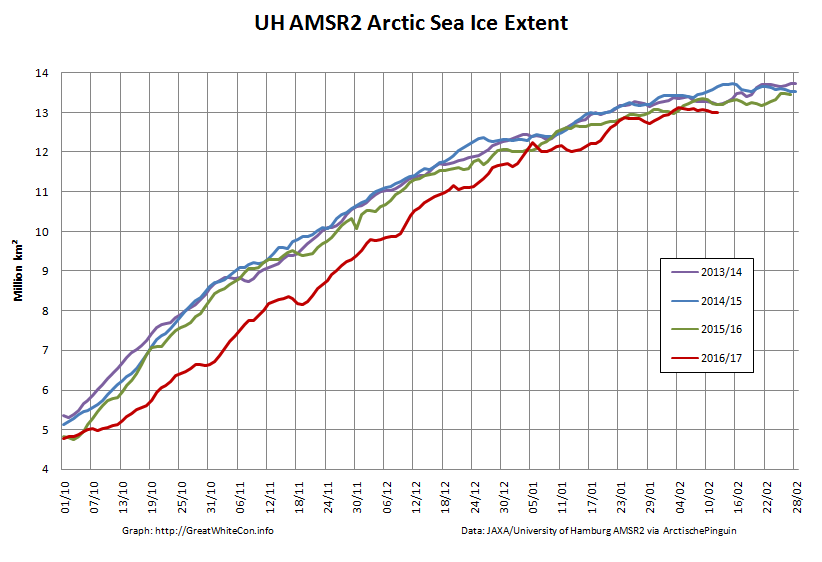
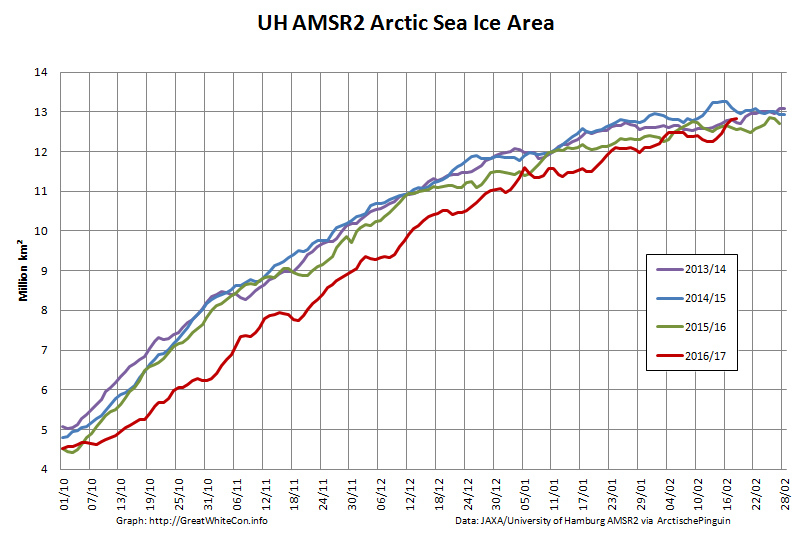
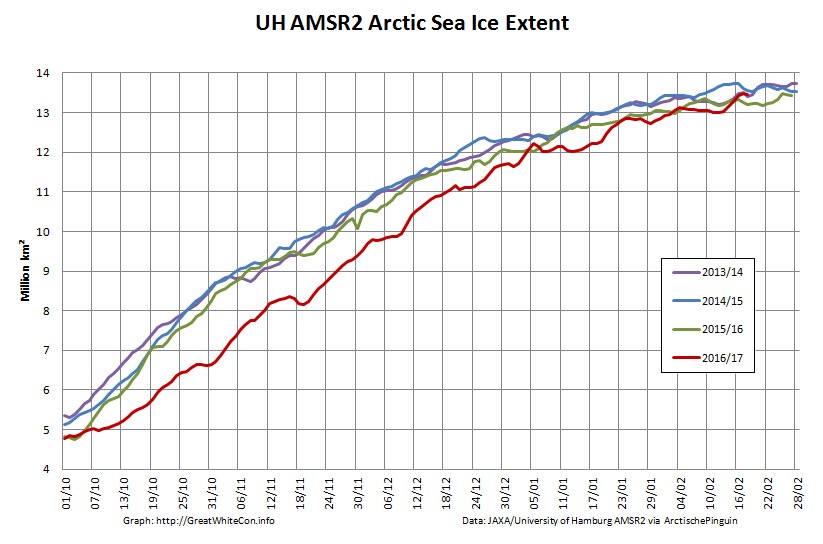
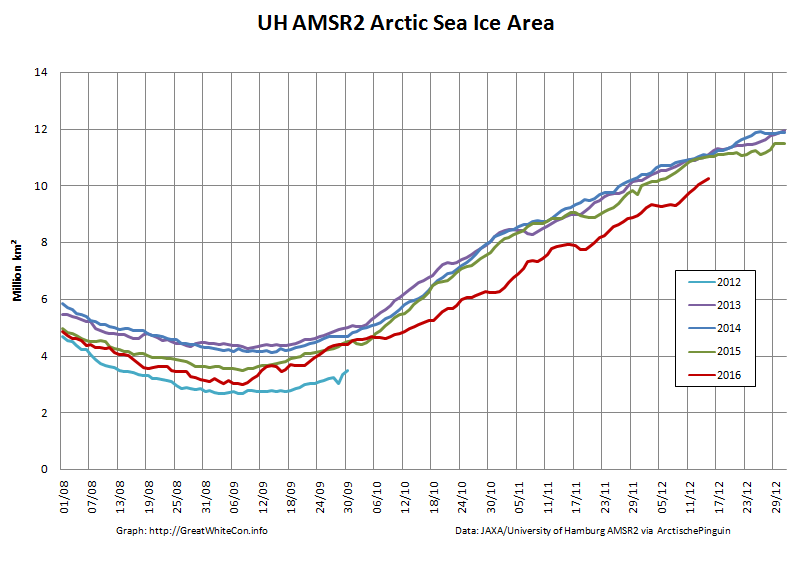
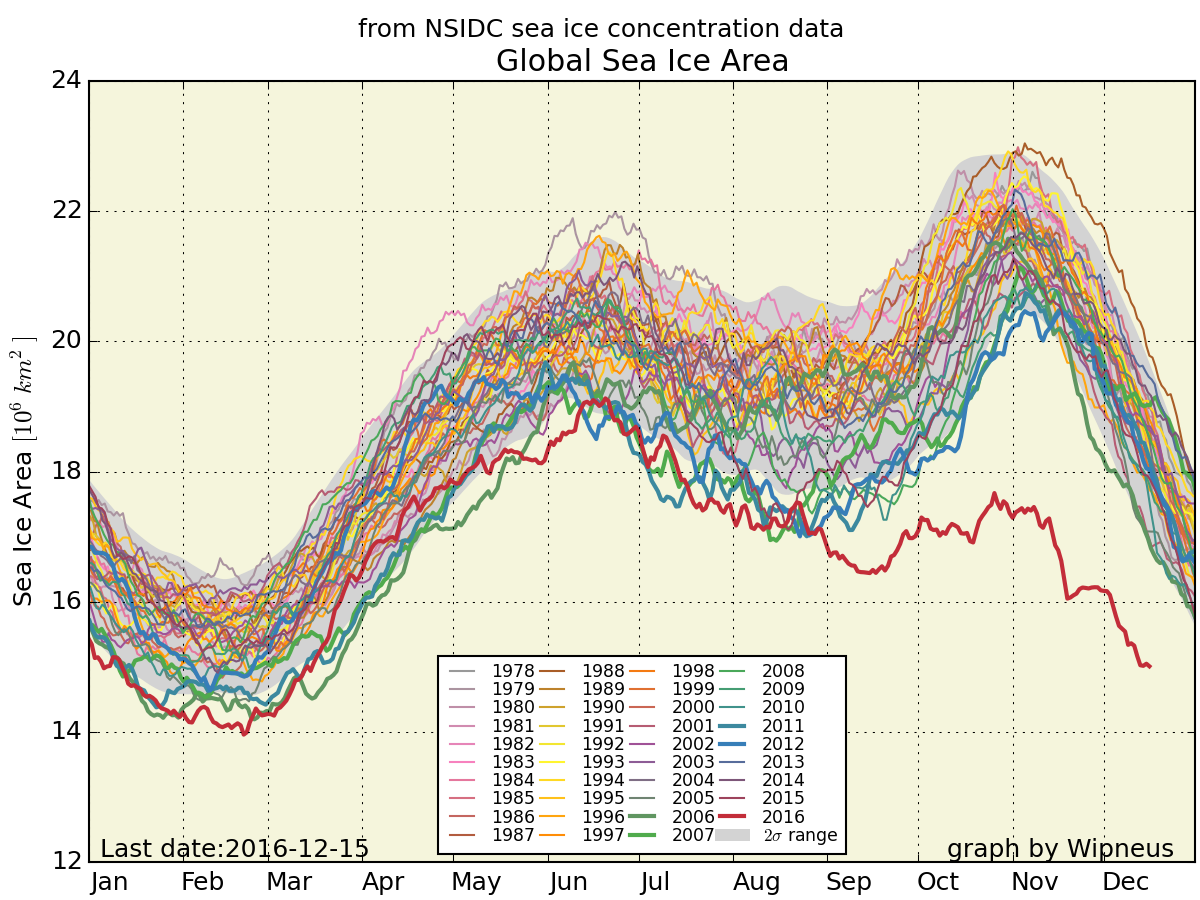
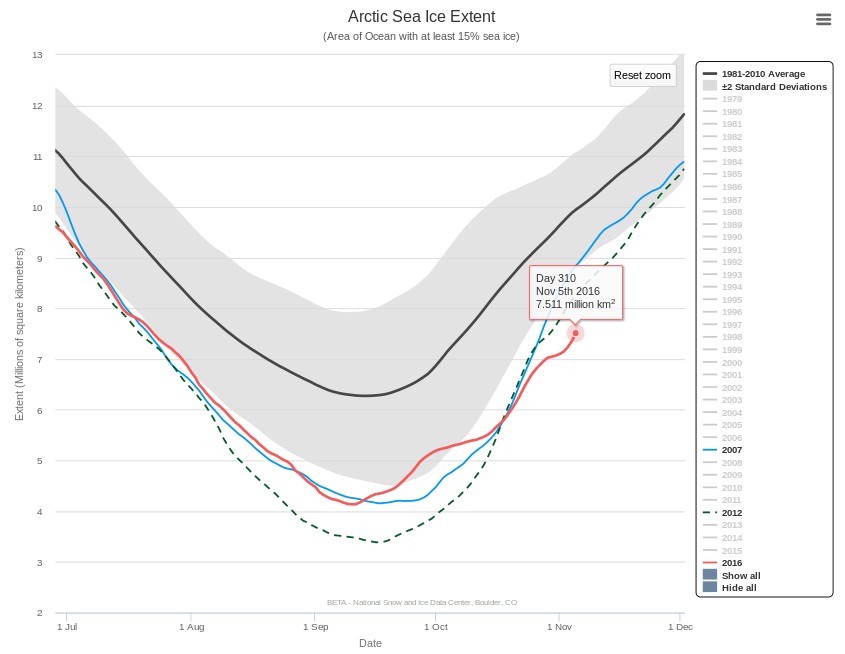
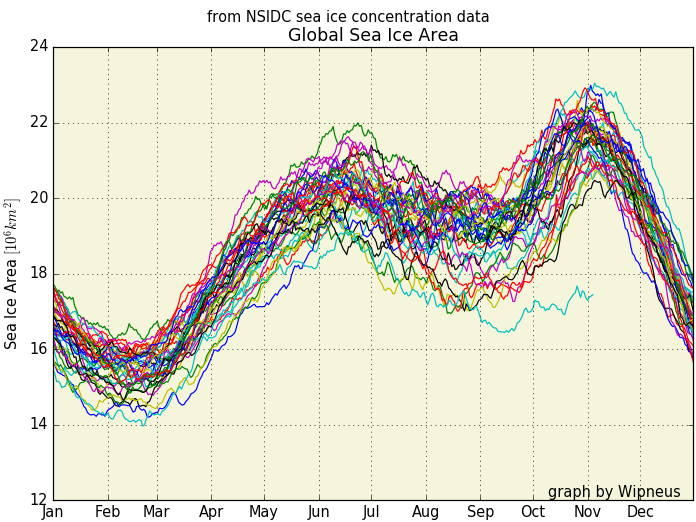
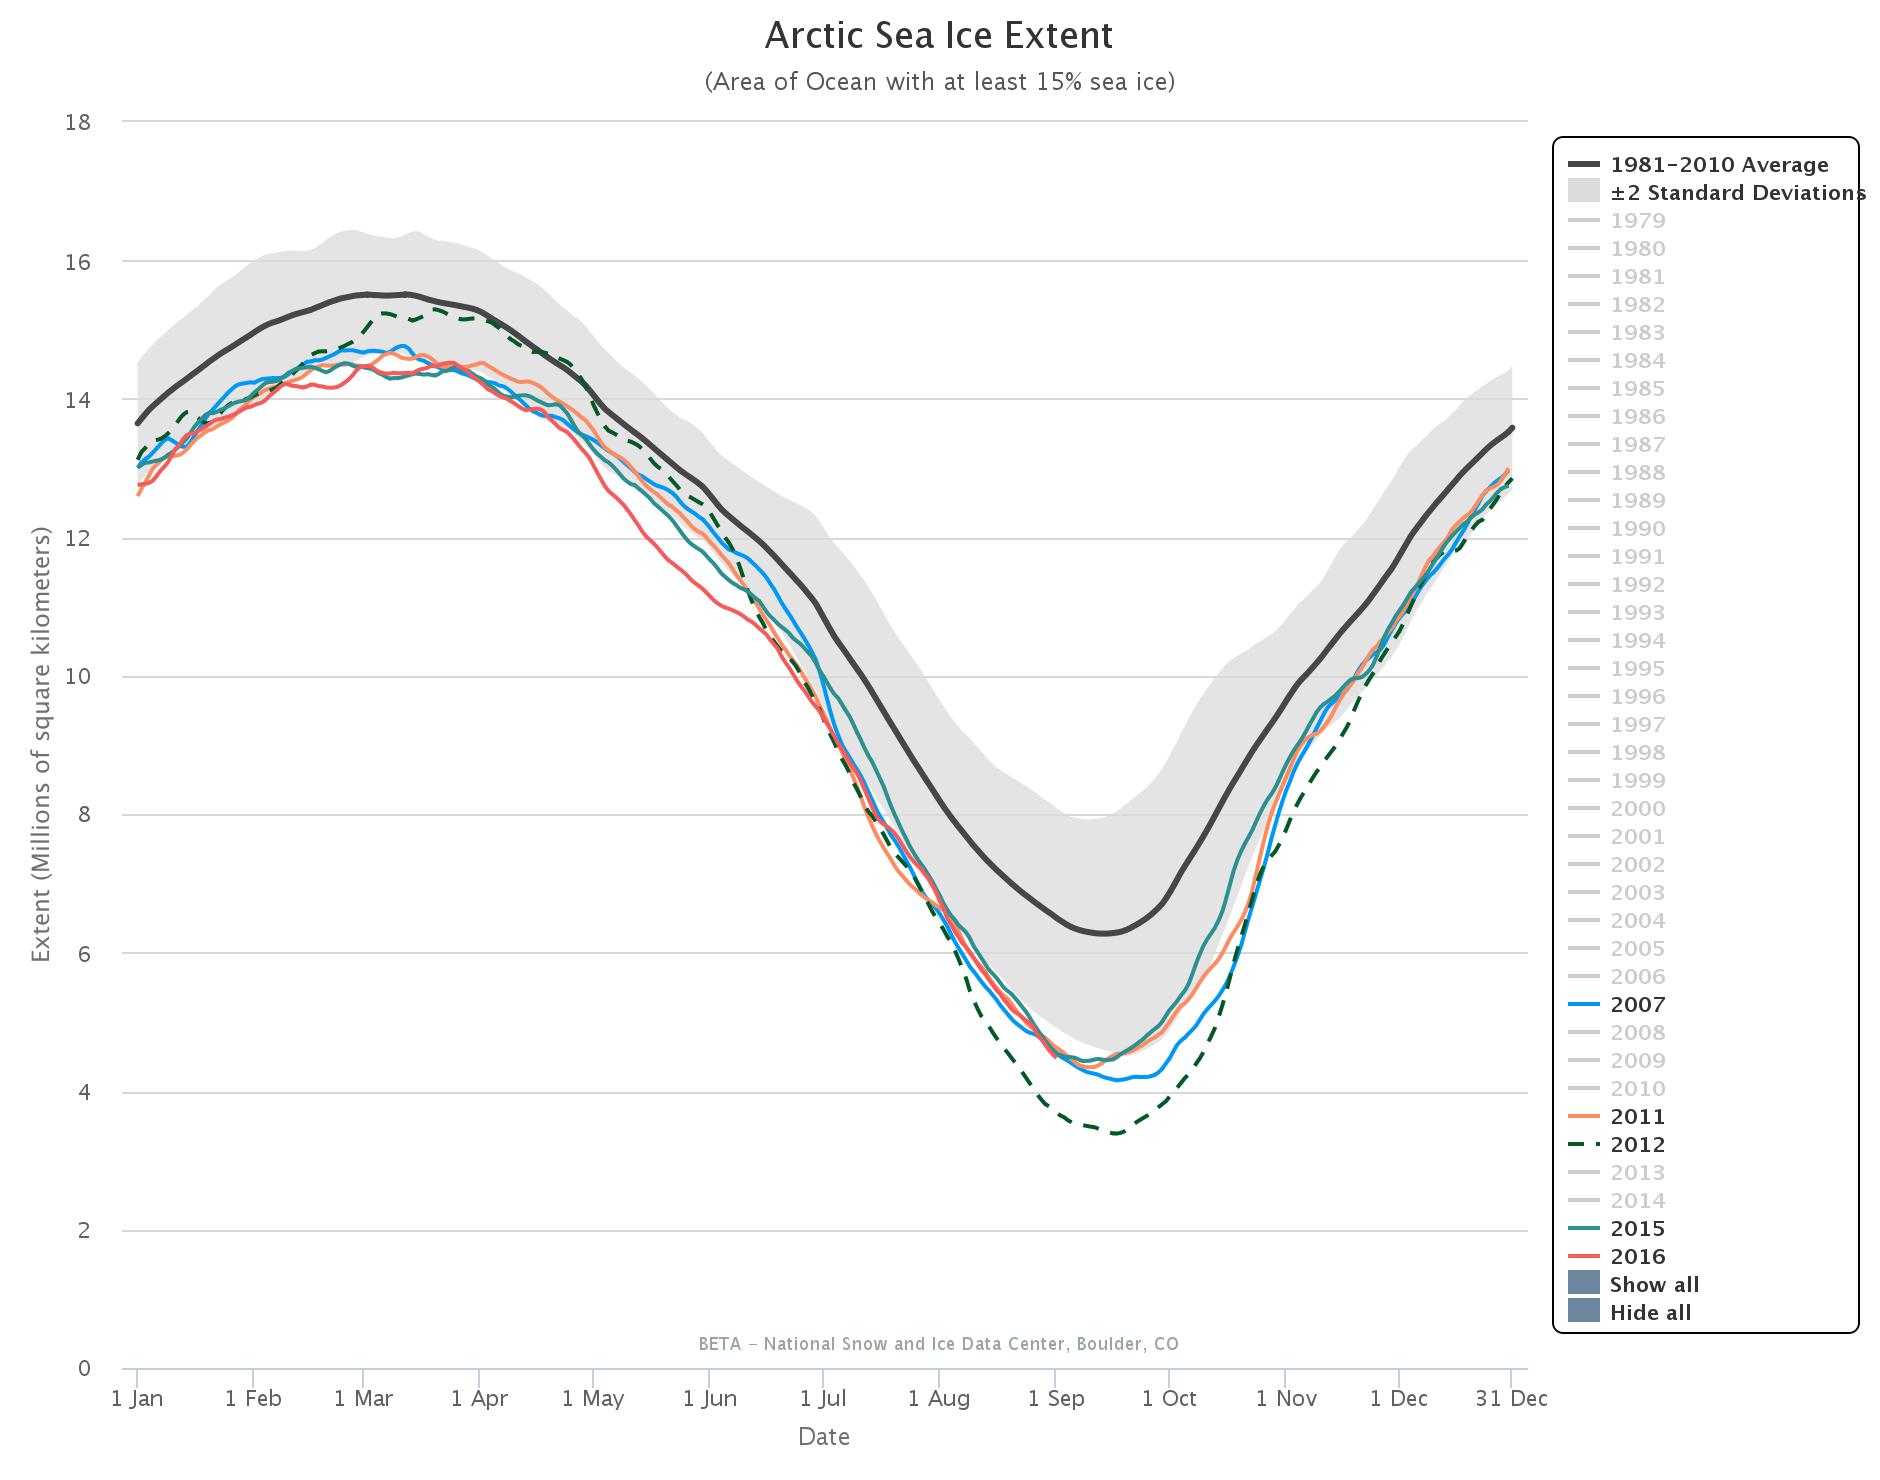
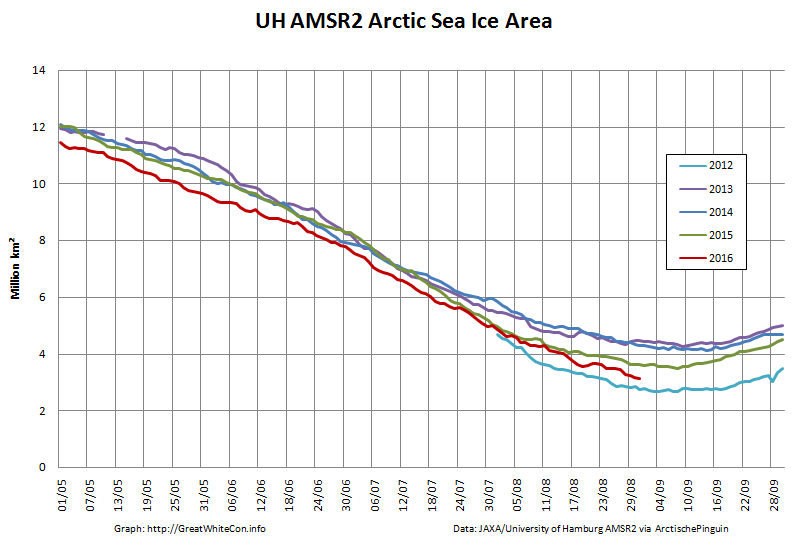
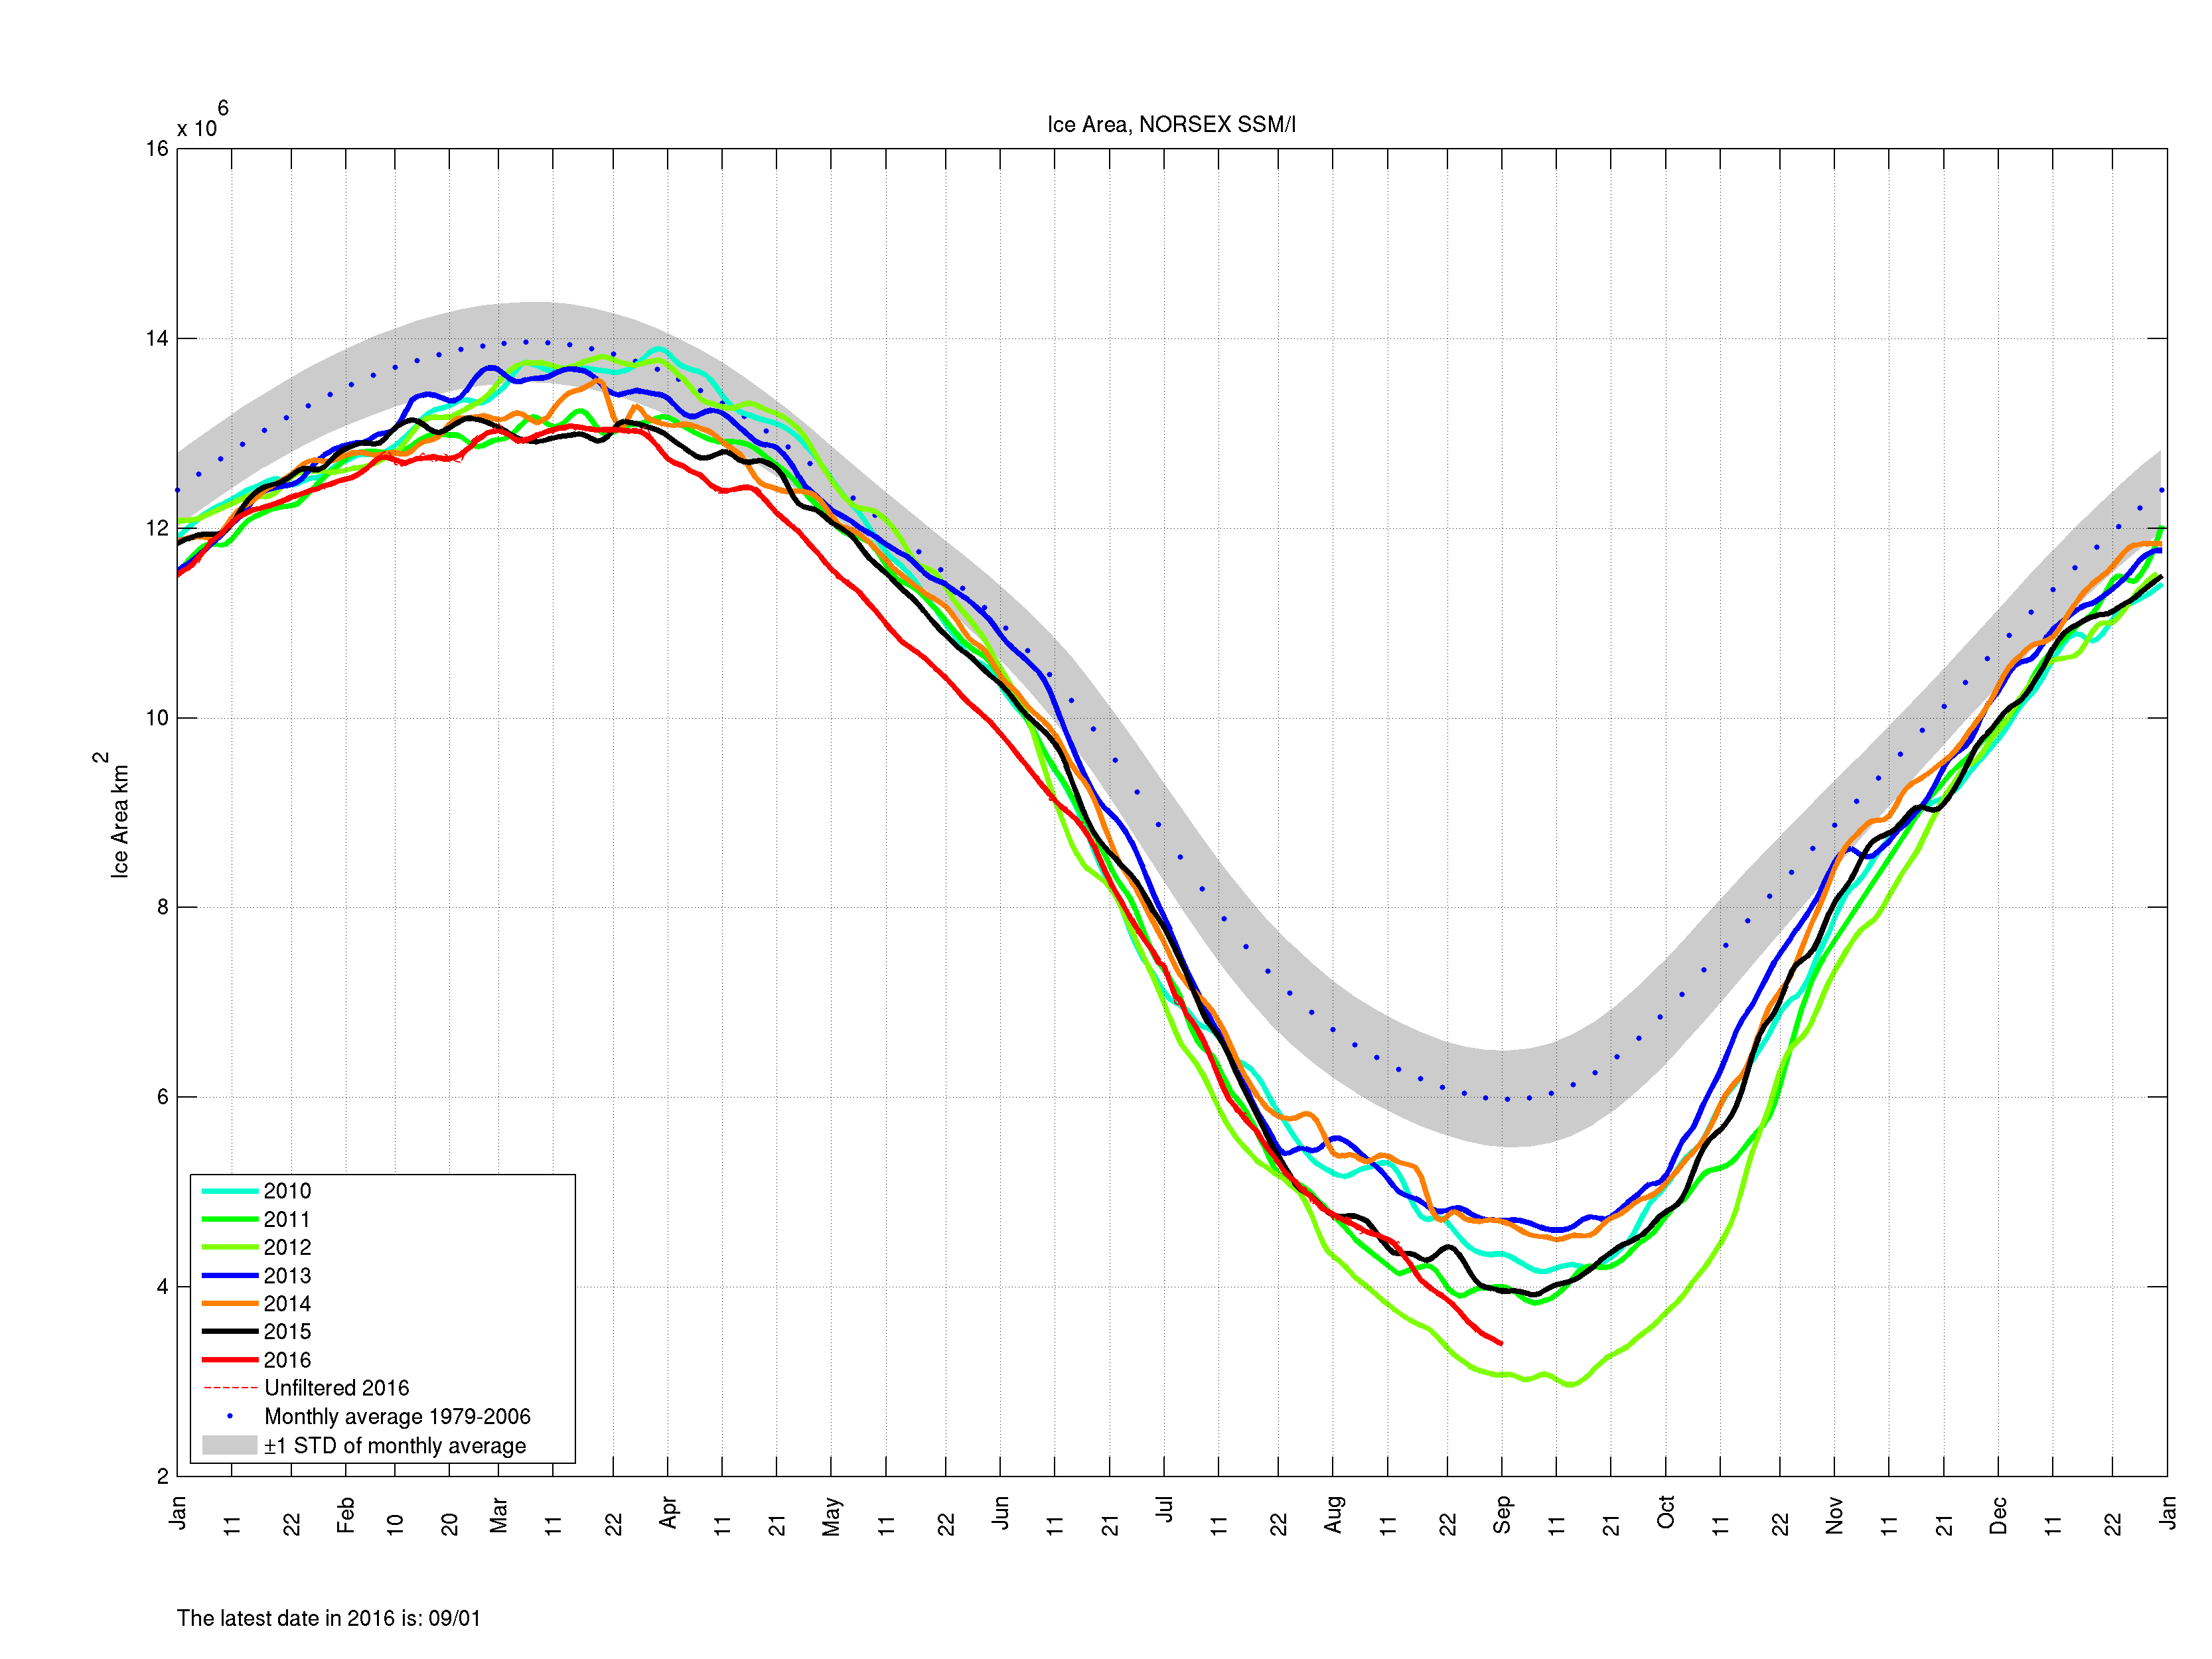
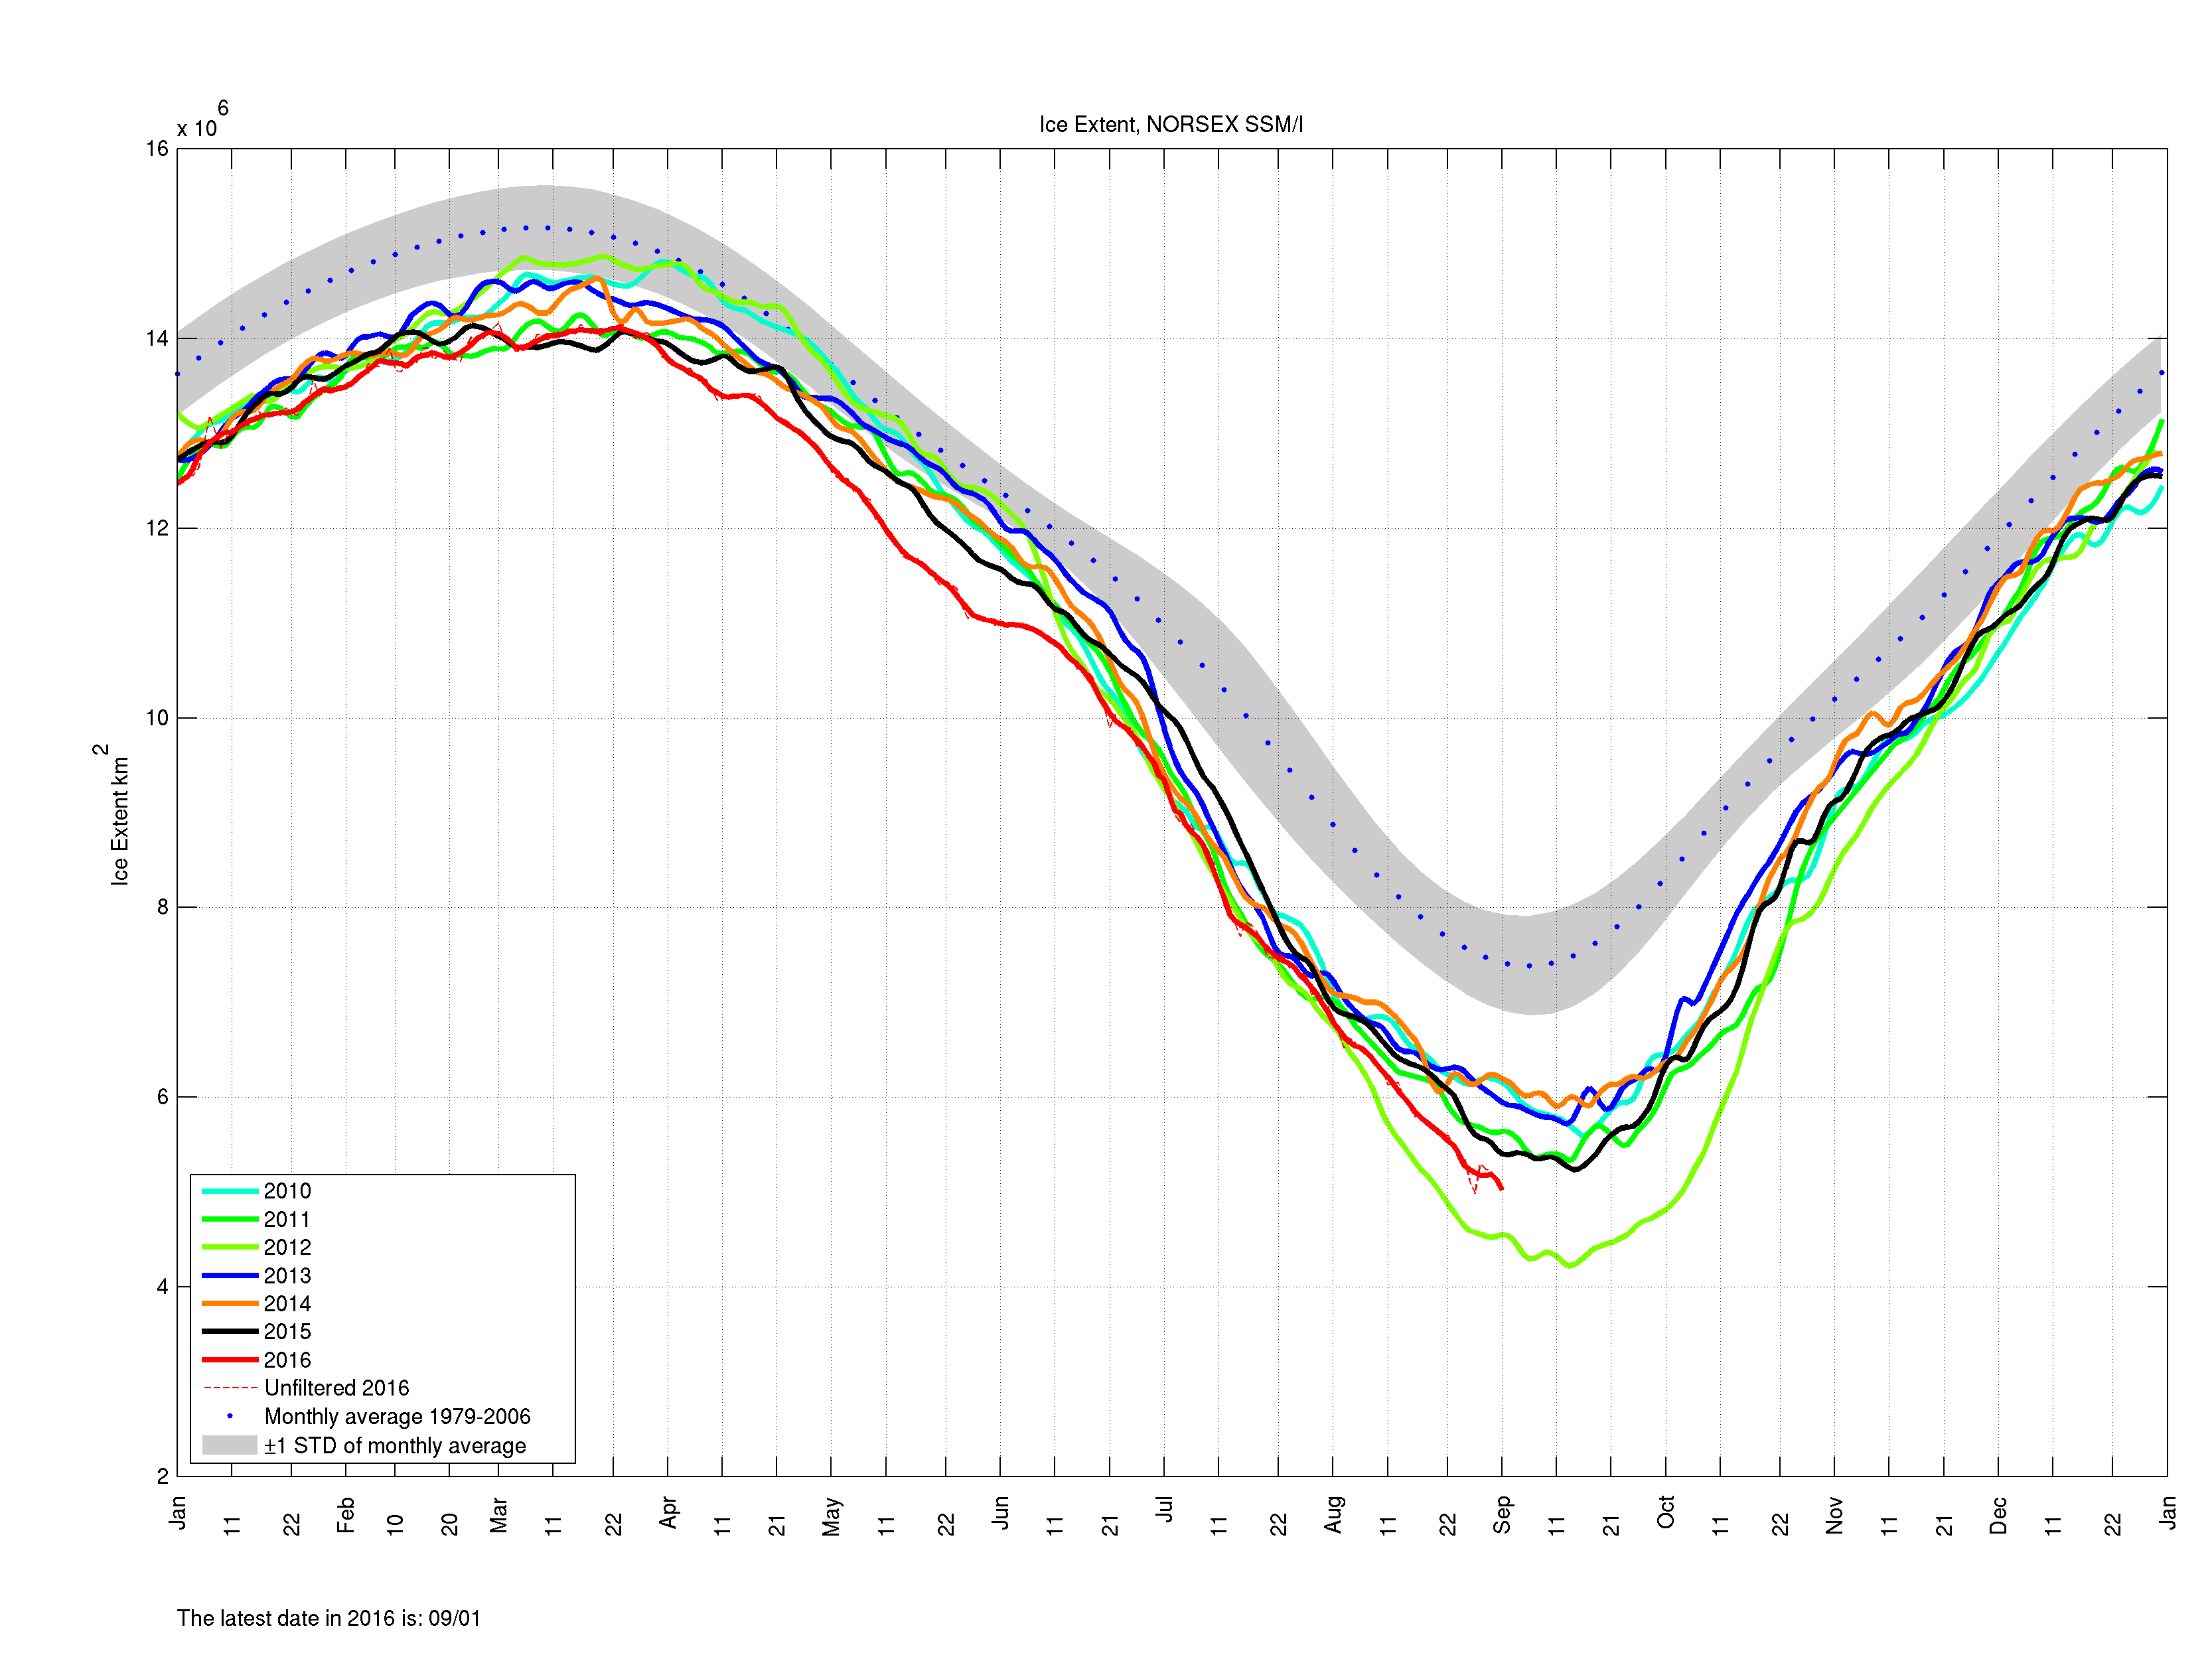
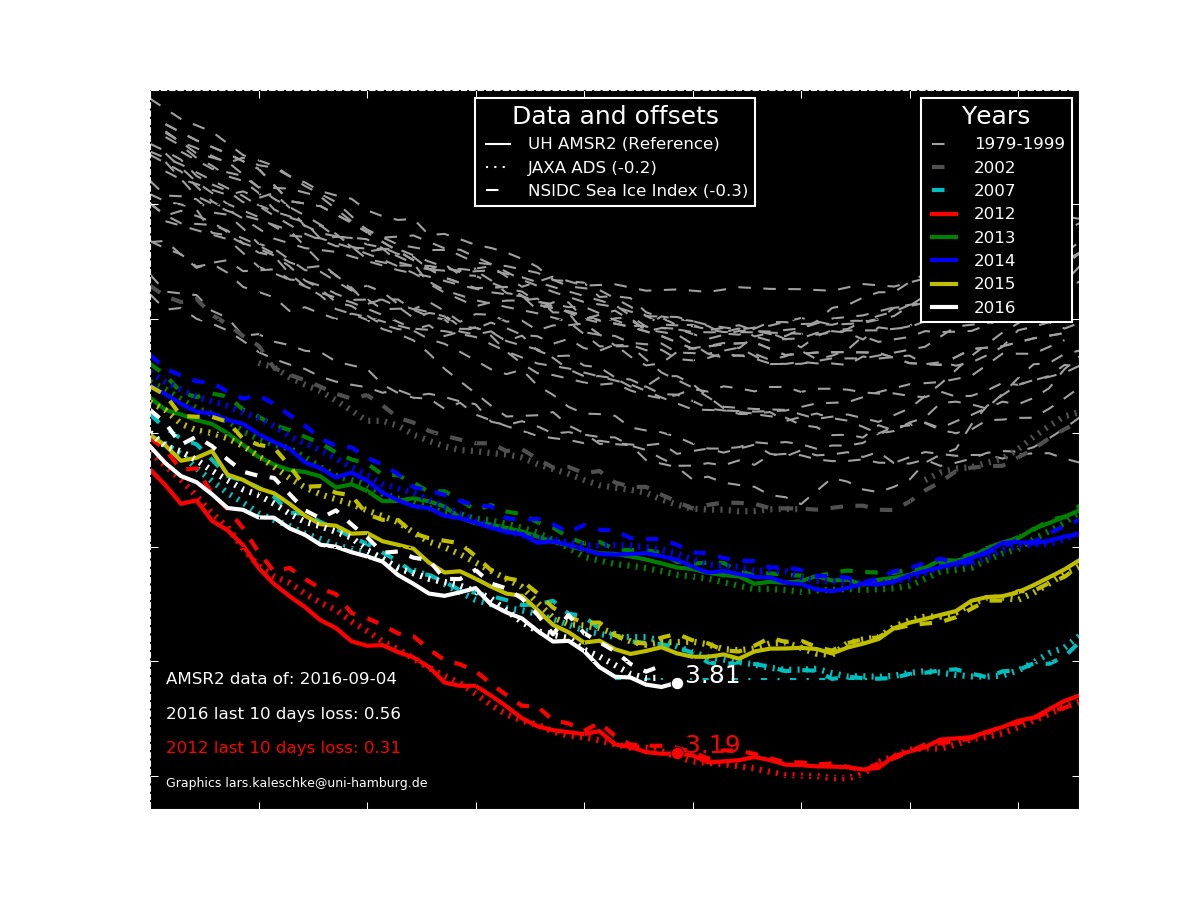
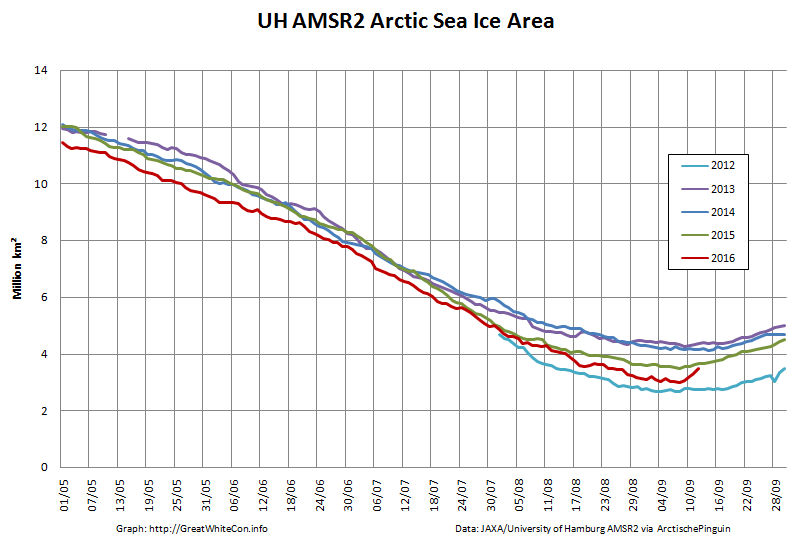
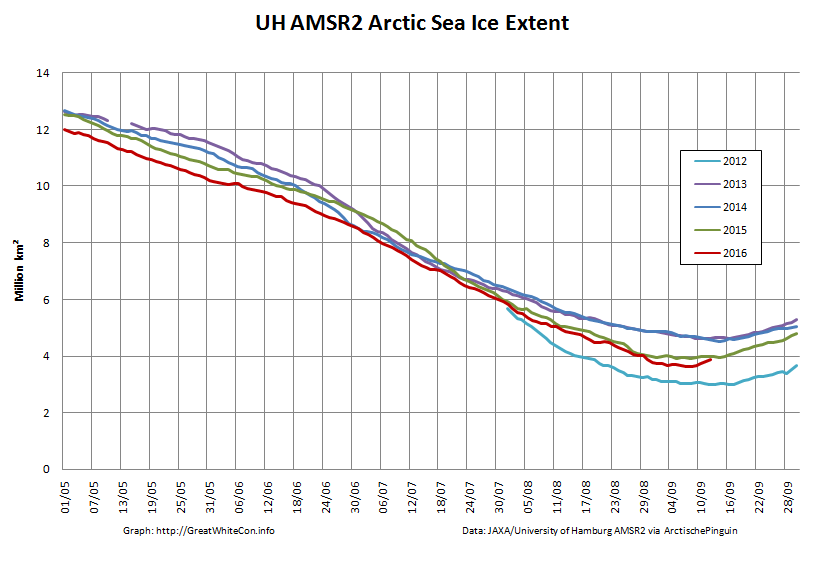
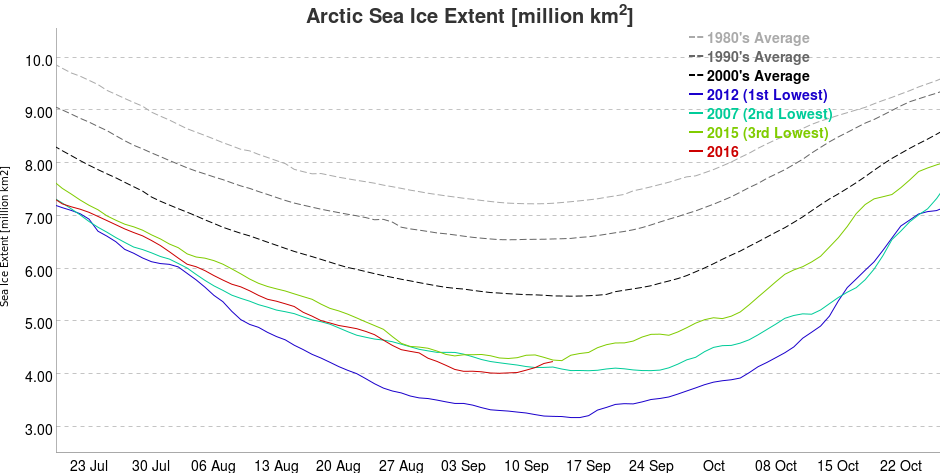
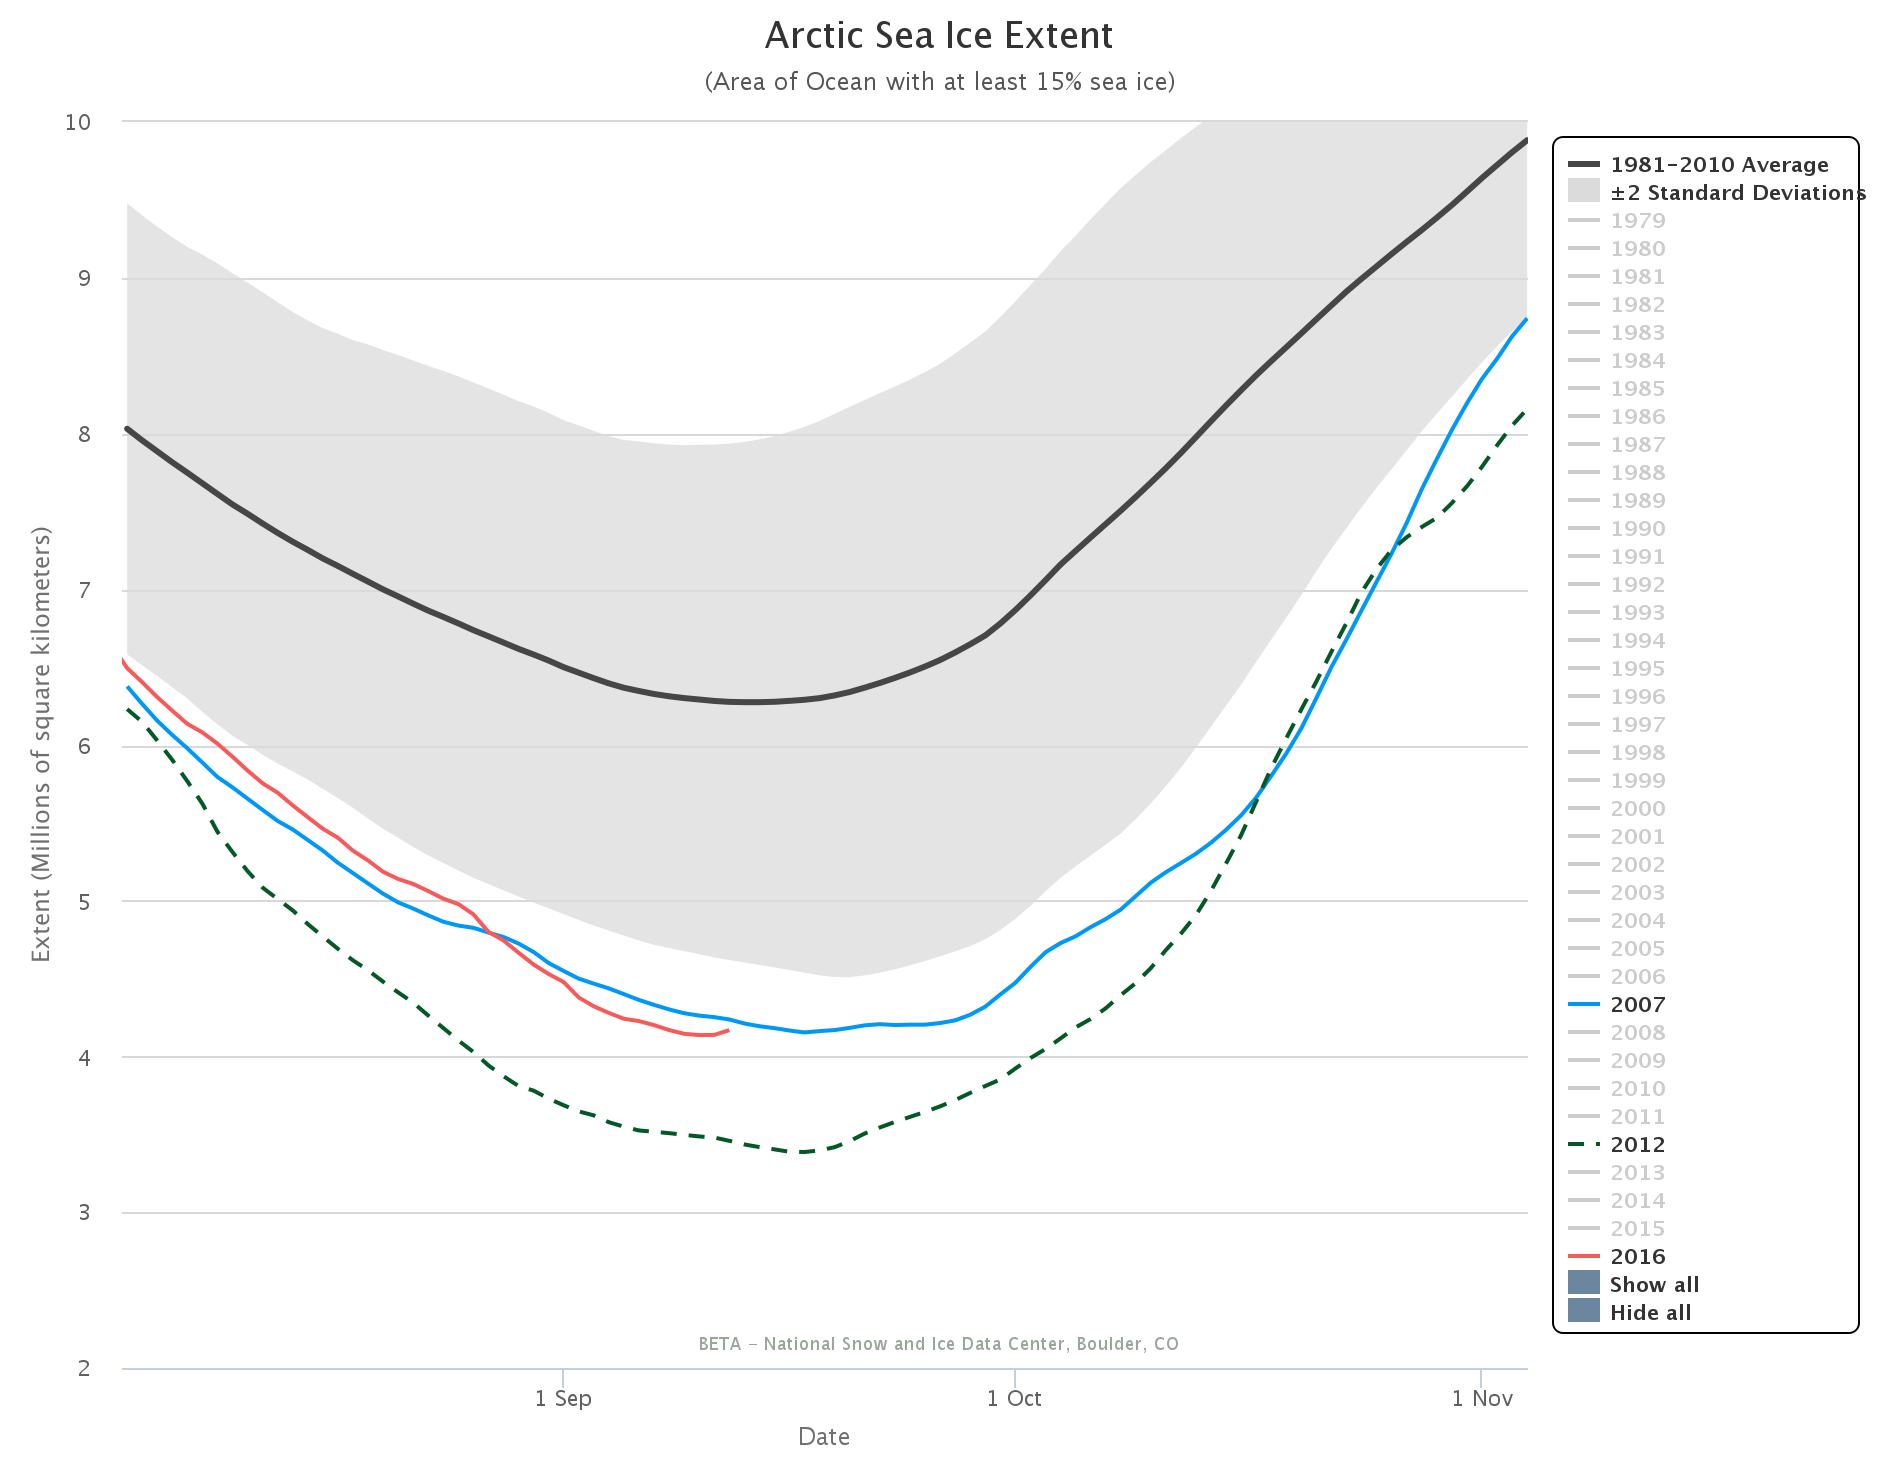
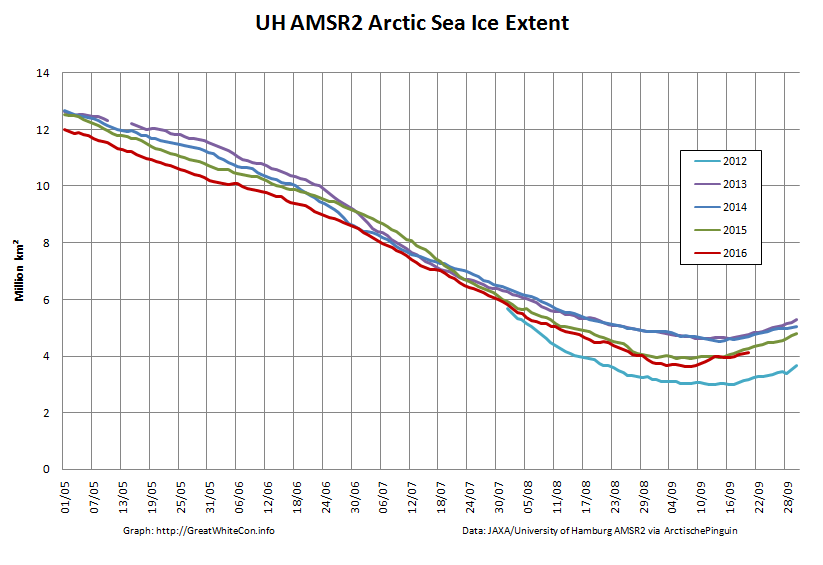
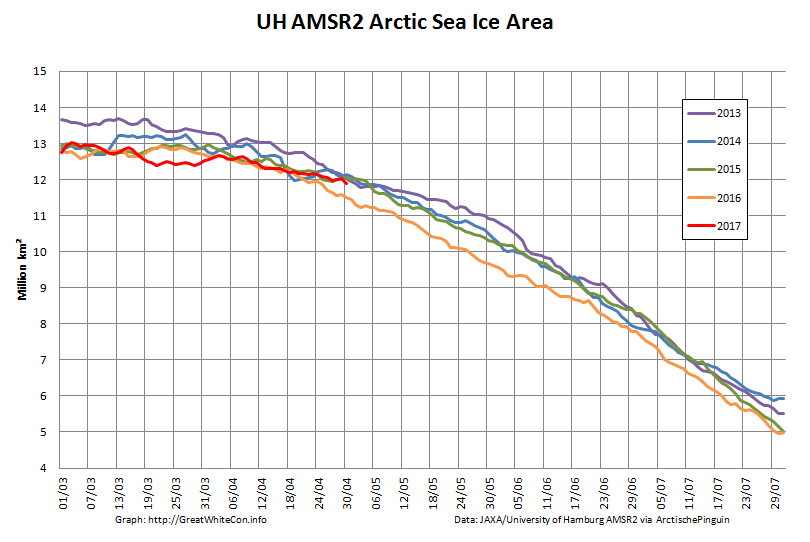
Whilst sea coverage on the Pacific periphery has continued to fall, extent on the Atlantic side has not been following suit. Hence overall Arctic sea ice area is no longer lowest in the satellite record:
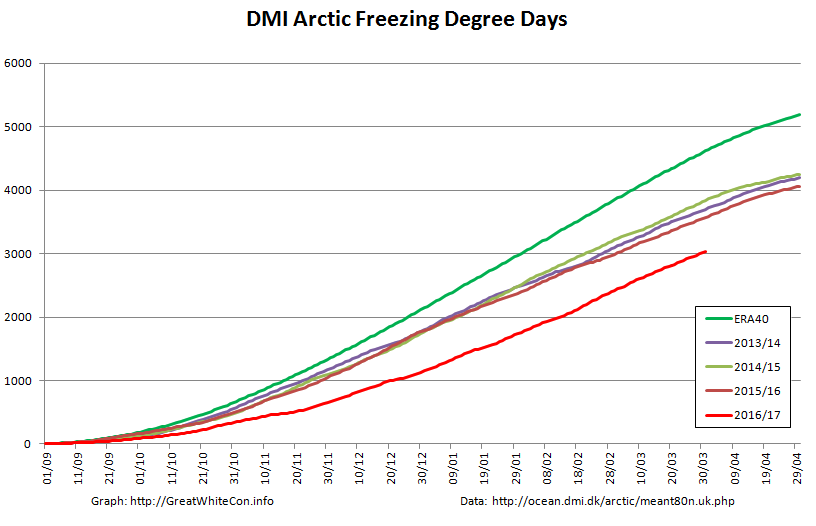
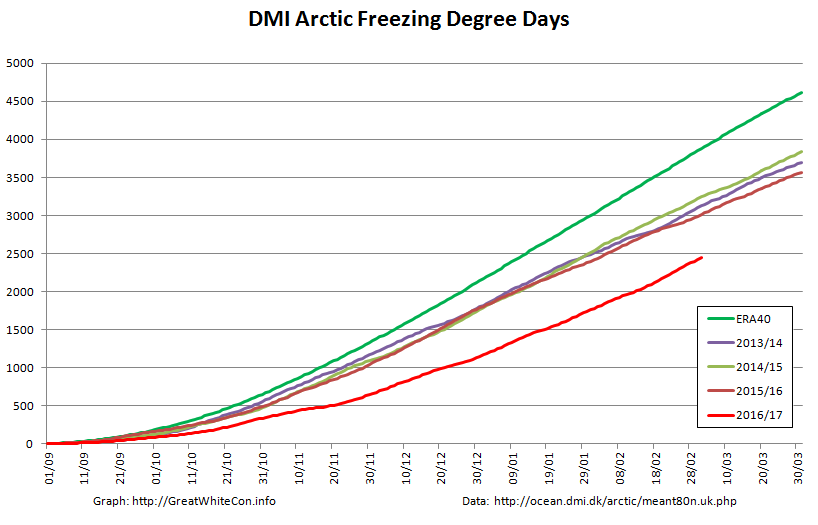
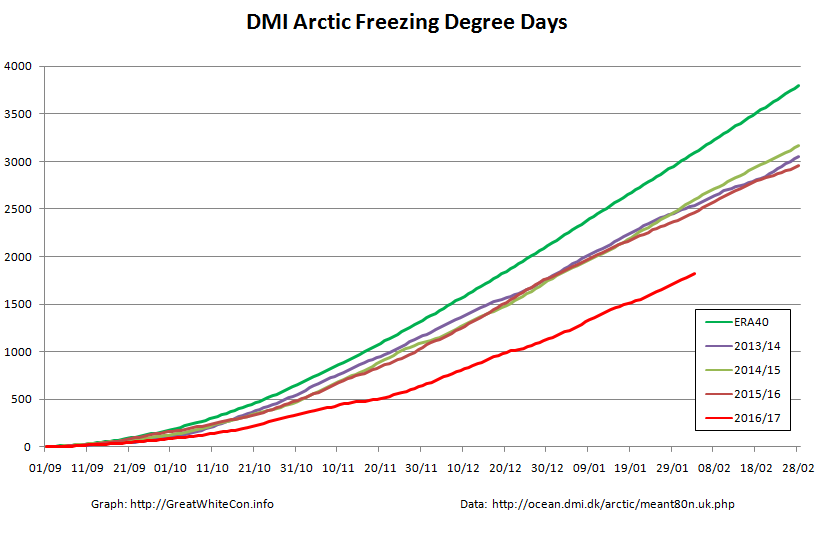
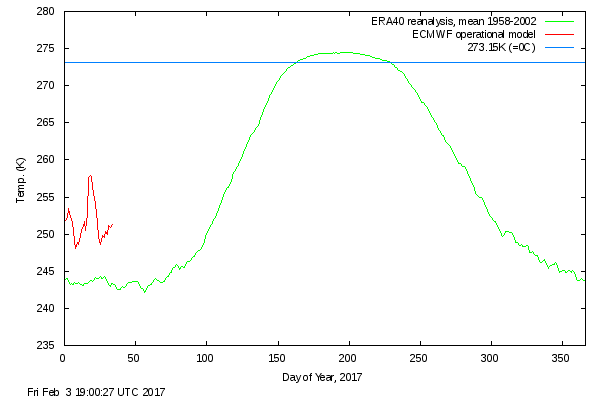
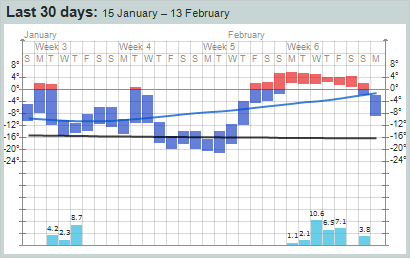
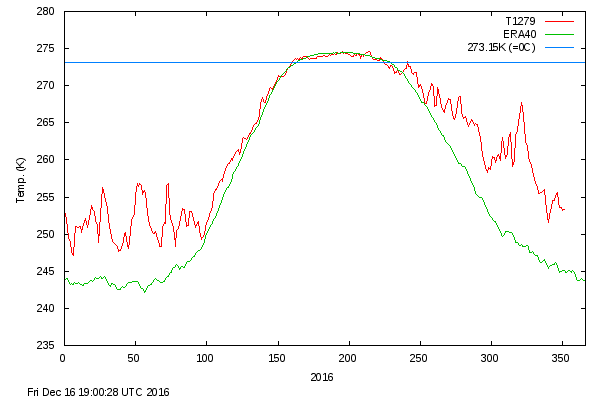
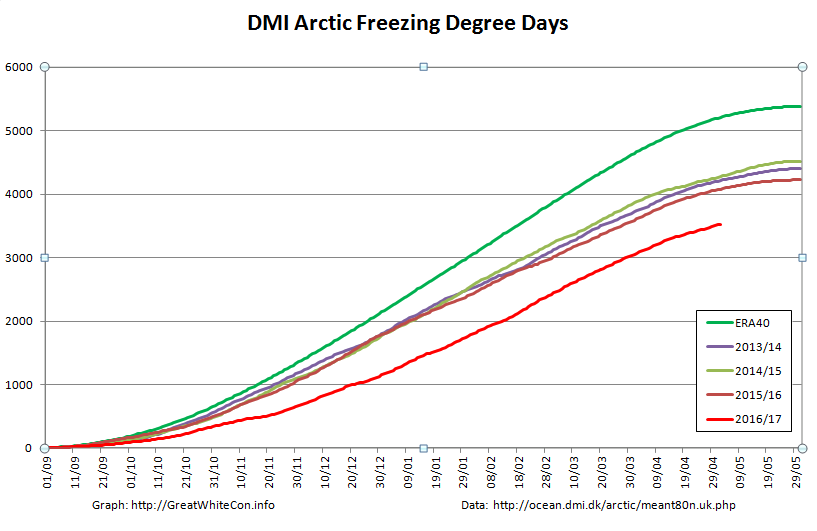
Finally, until the new PIOMAS numbers are released at least, here’s how DMI freezing degree days look at the moment:
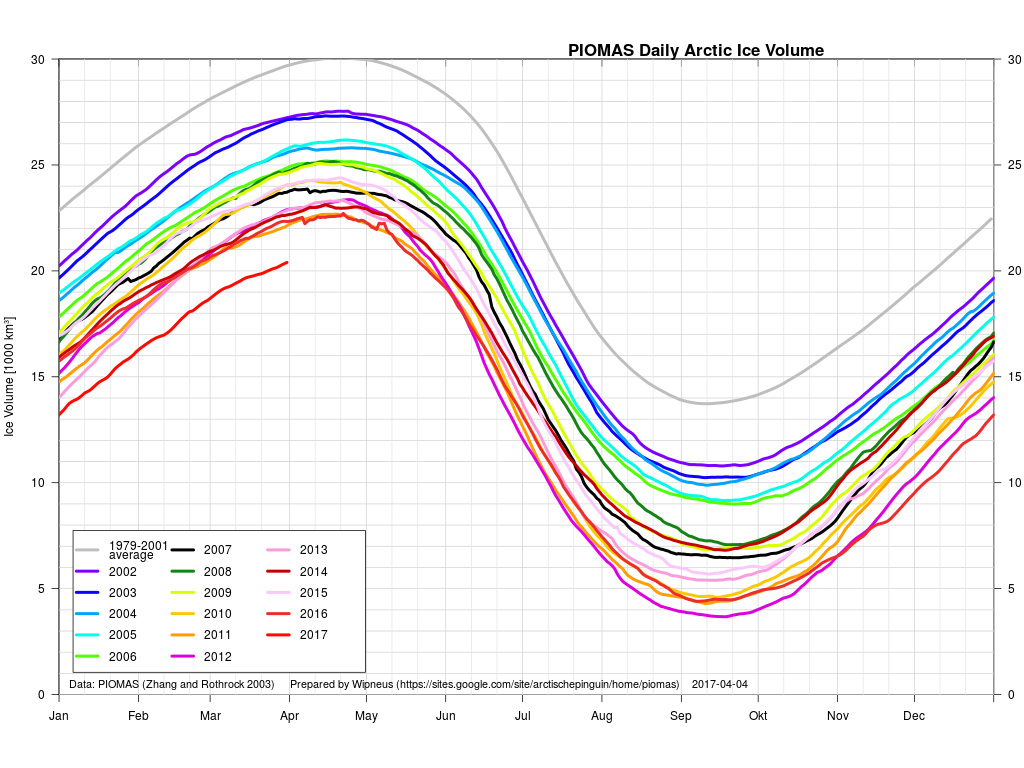
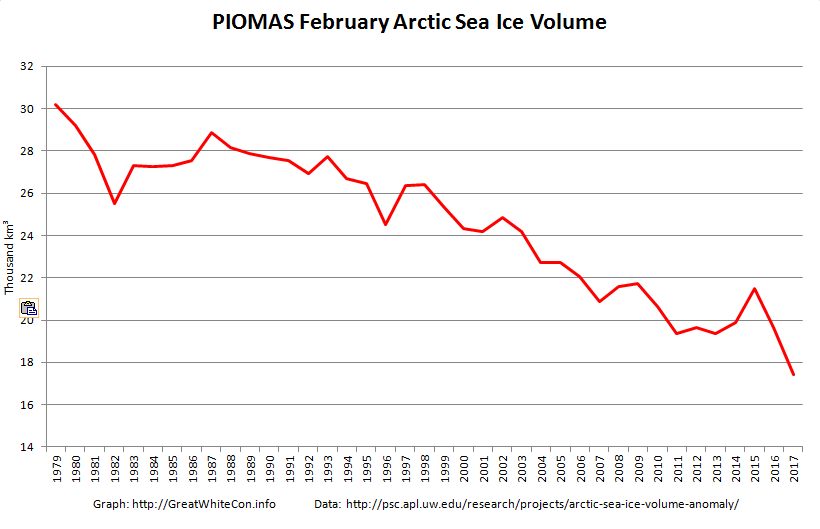
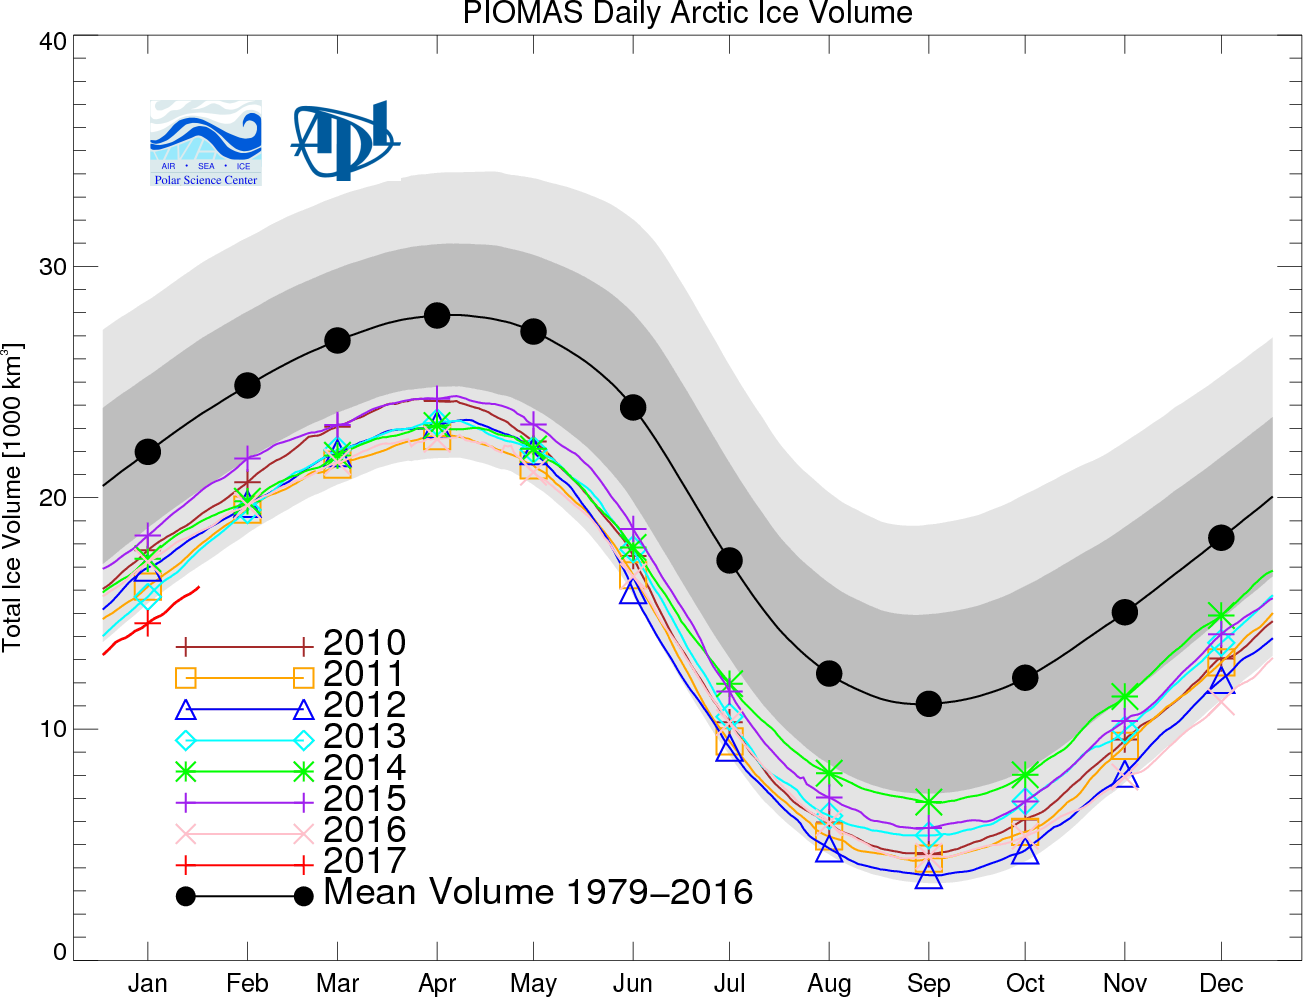
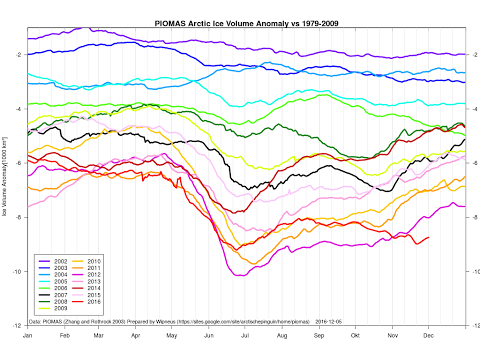
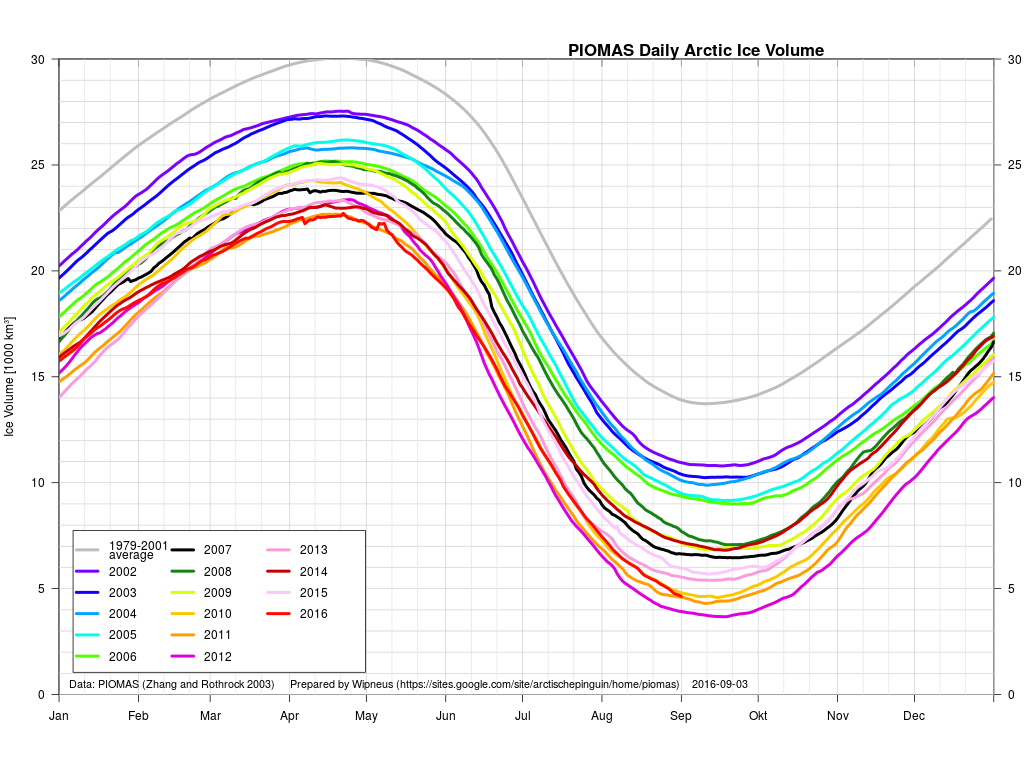
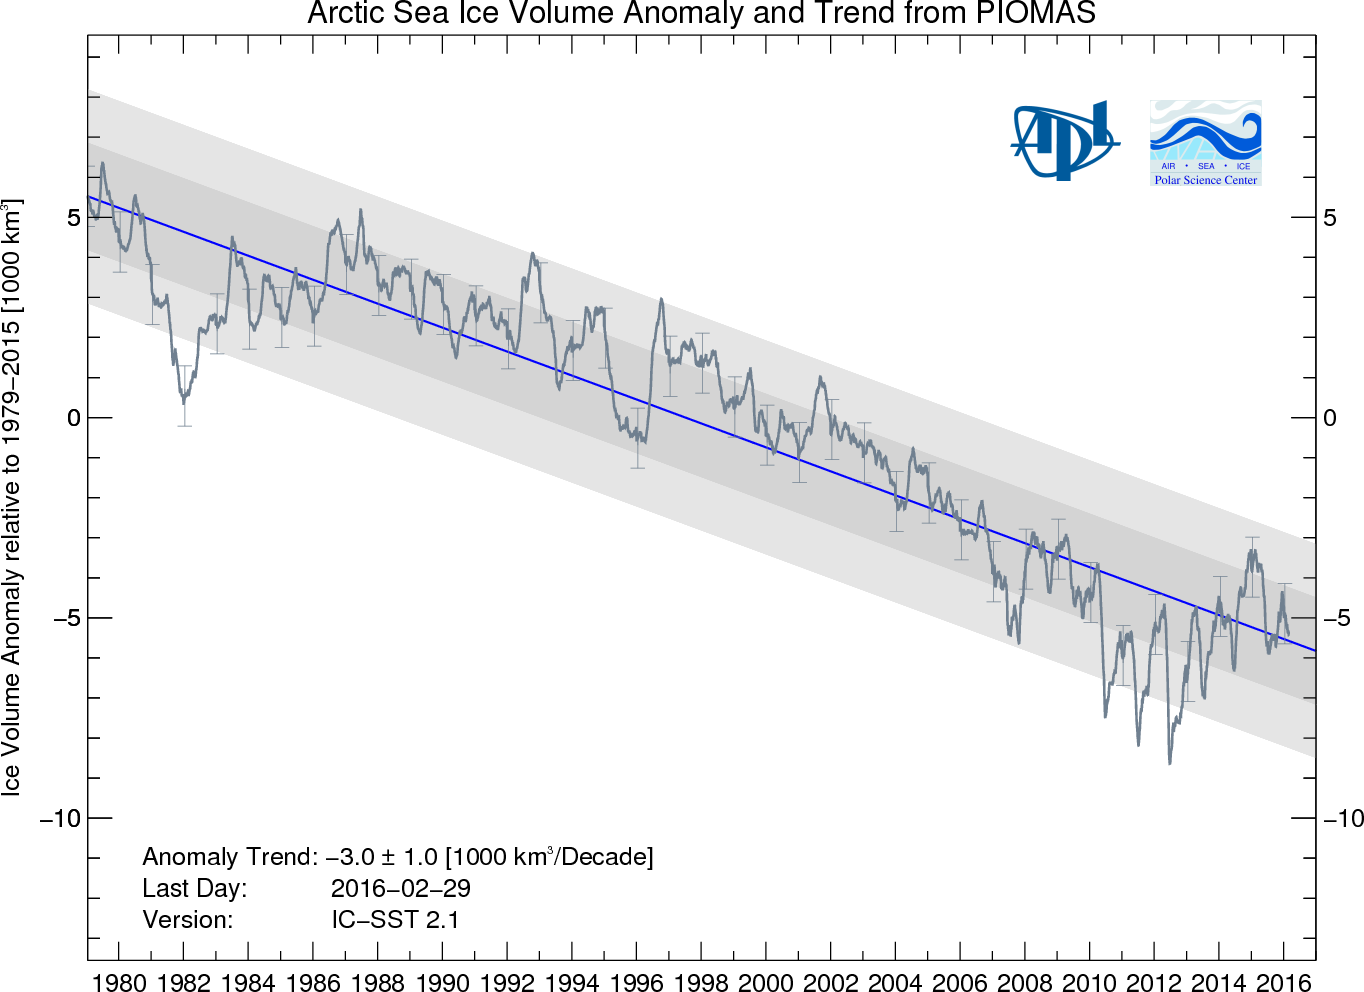
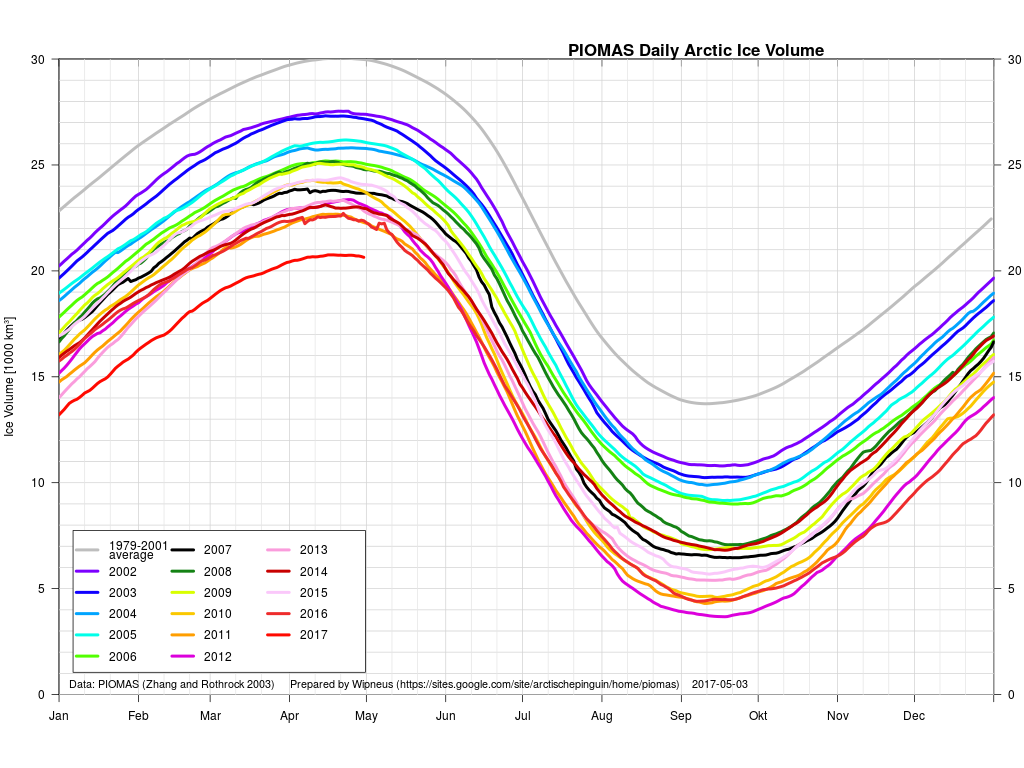
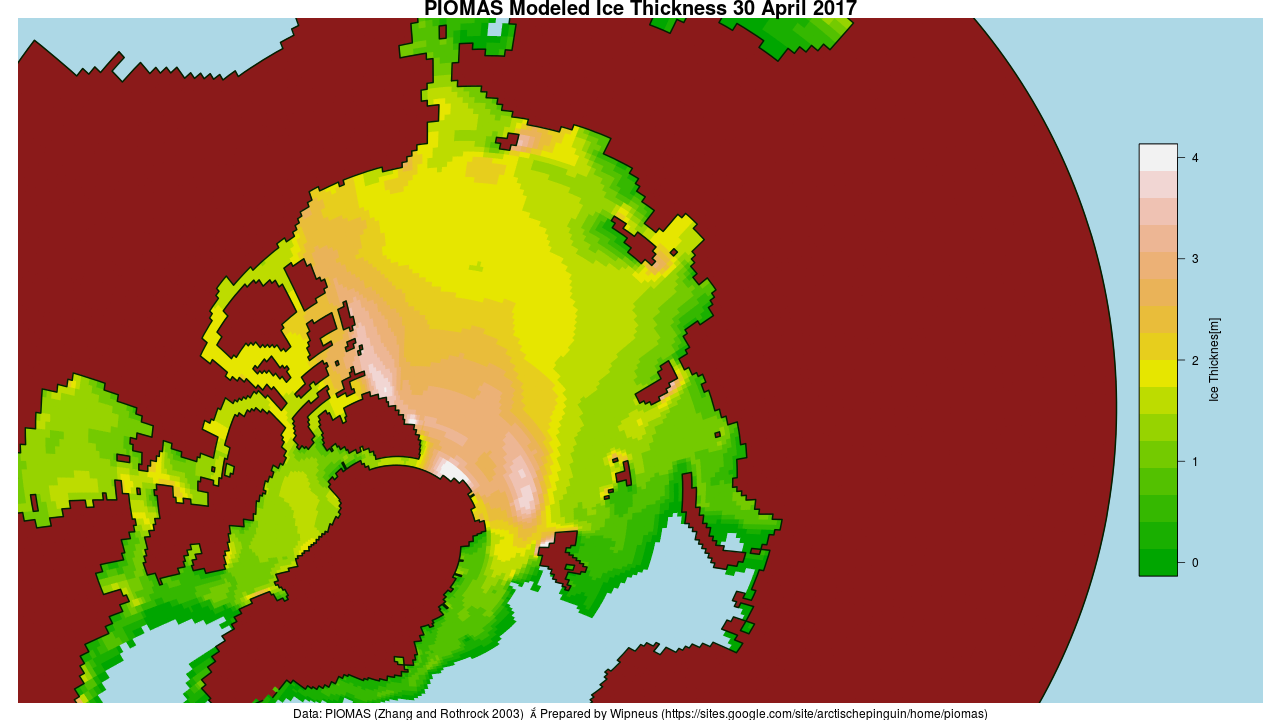
The April PIOMAS numbers have been published: Arctic sea ice volume is yet again by far the lowest on record:
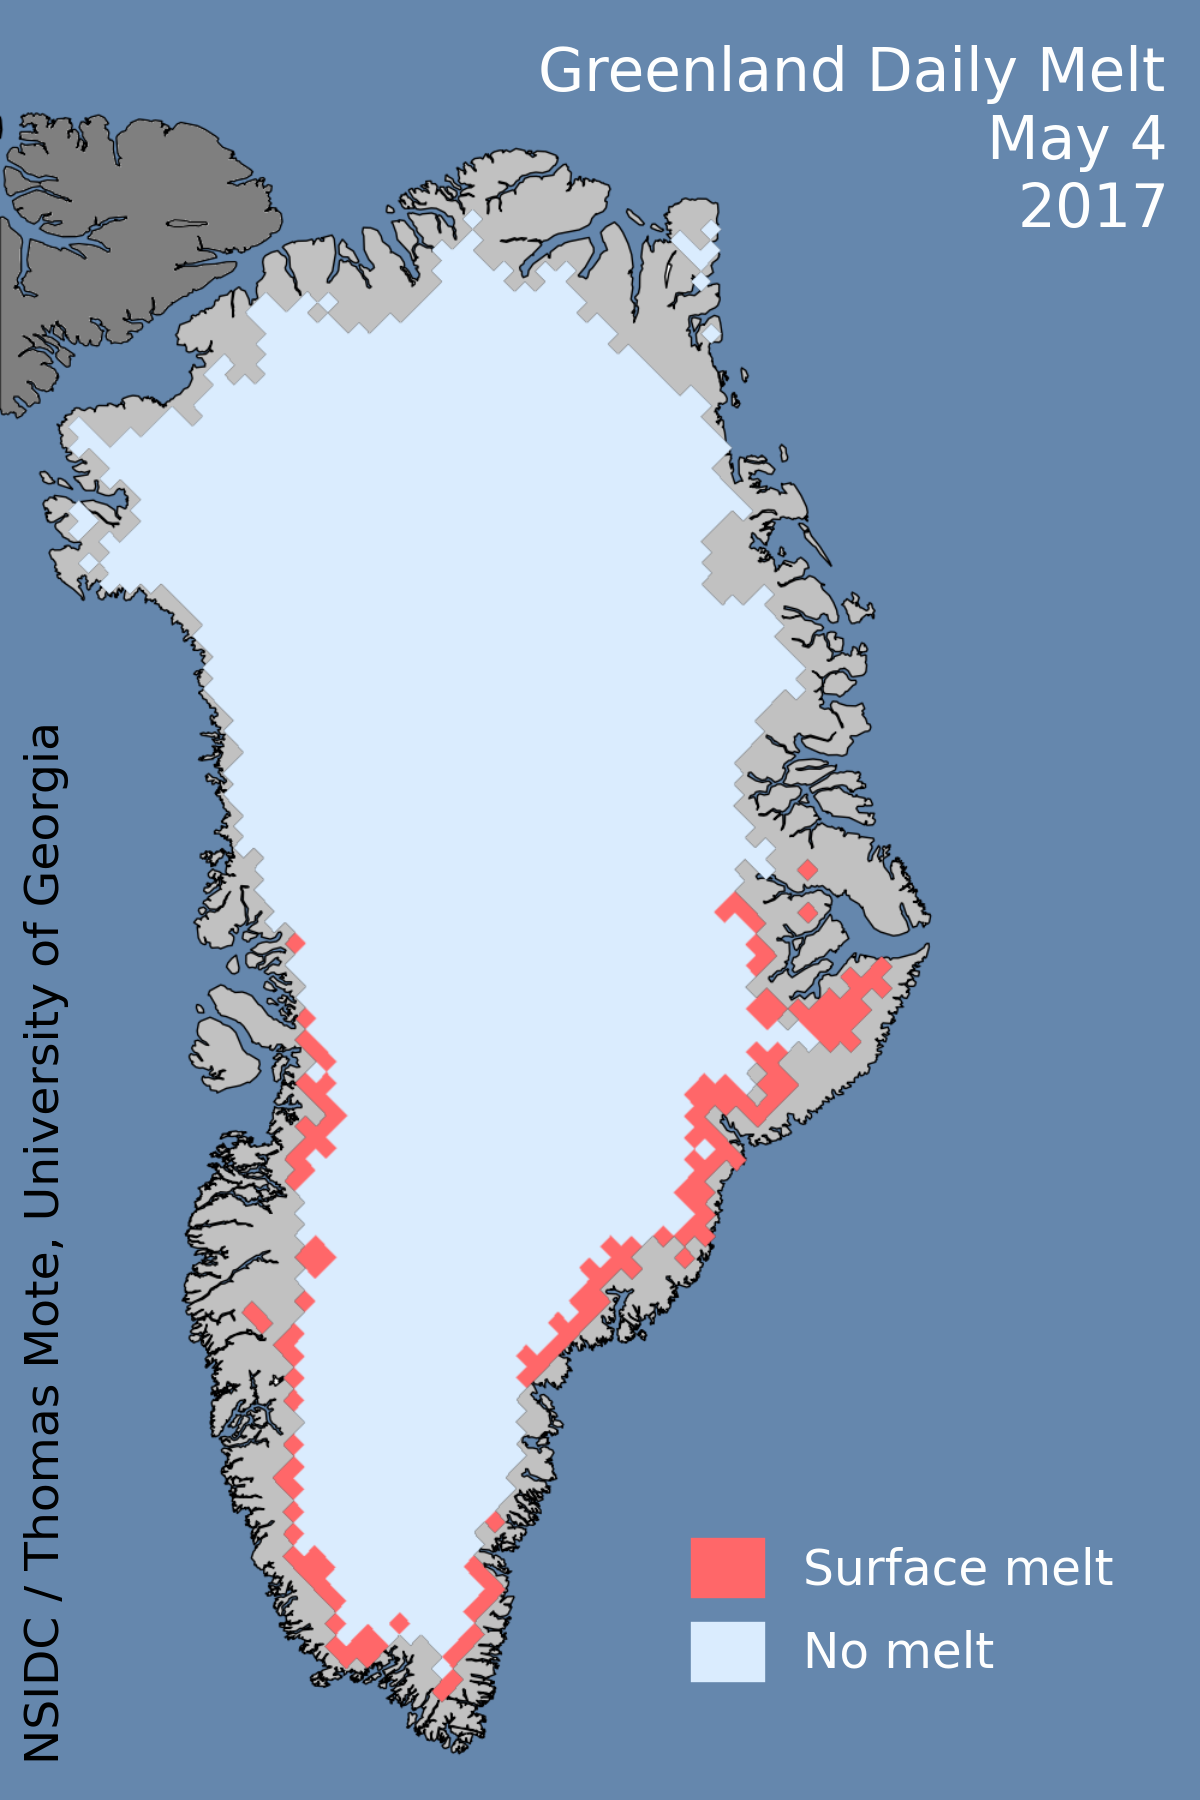
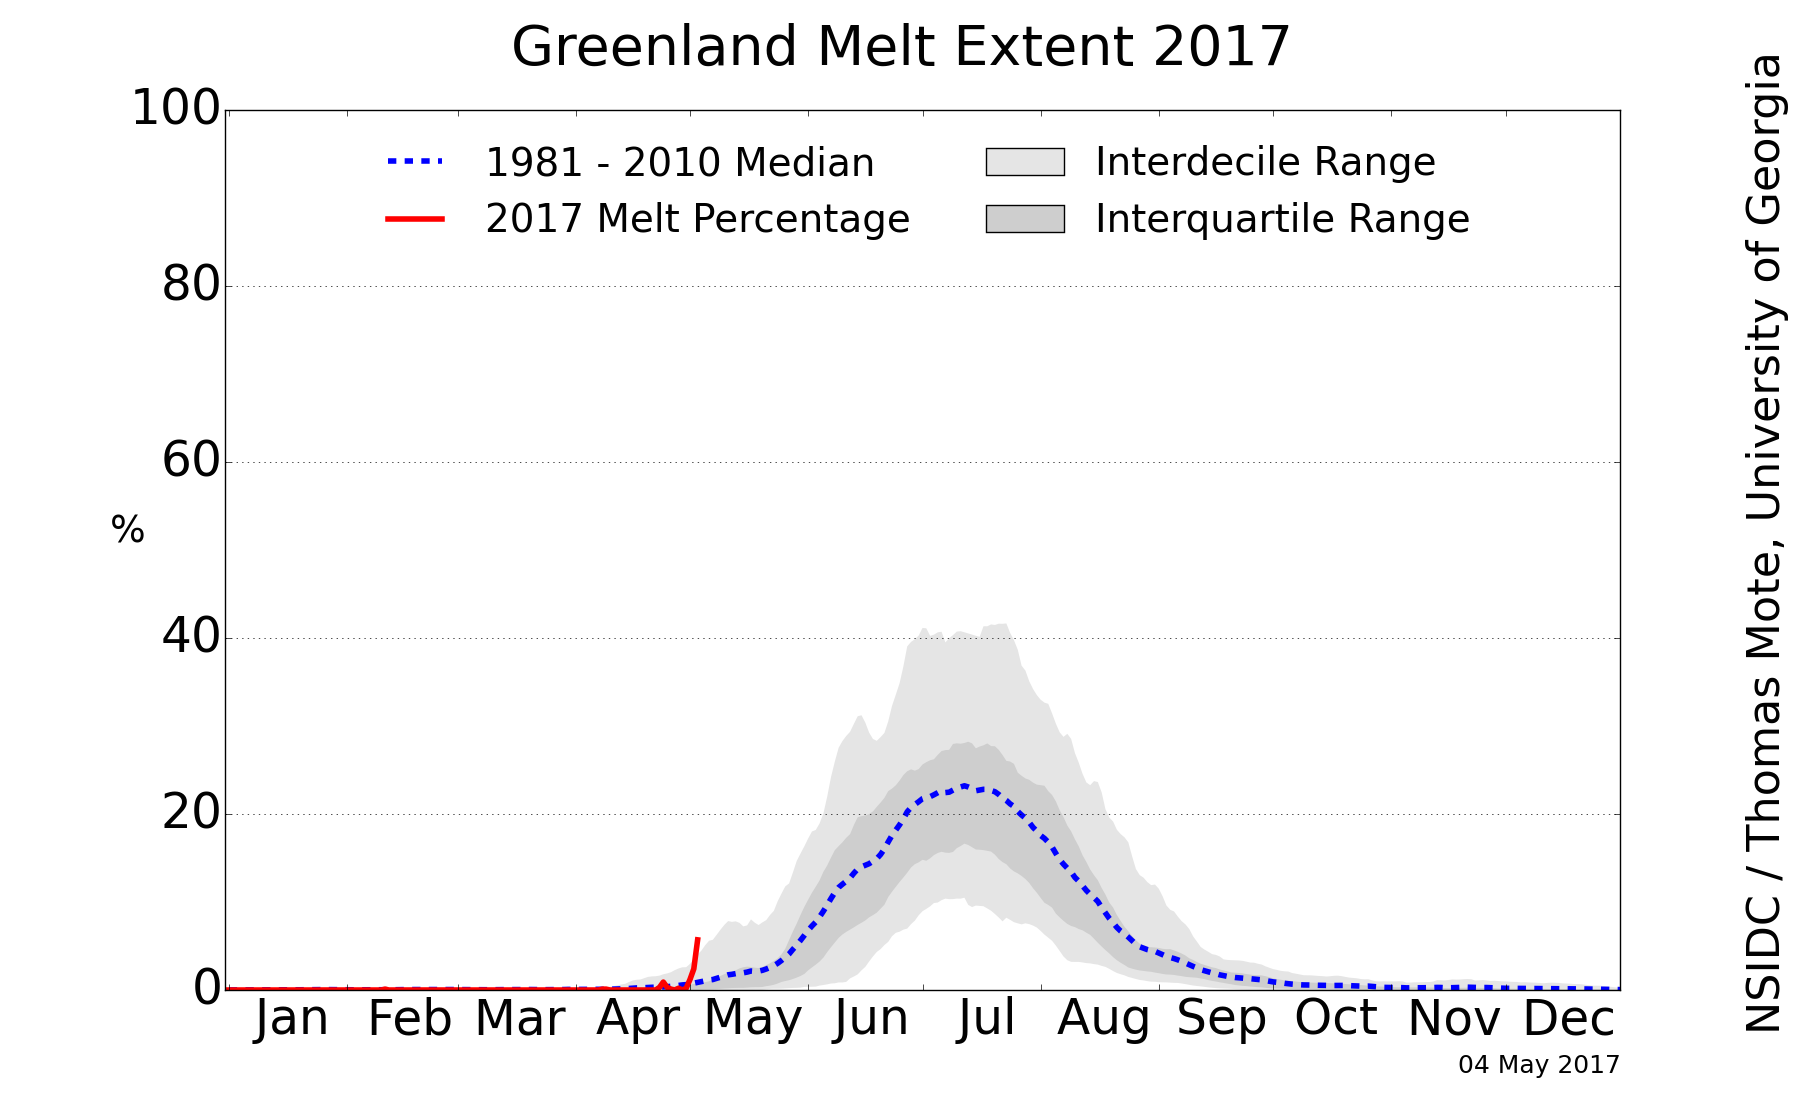
Greenland ice sheet surface melt has started early this year:
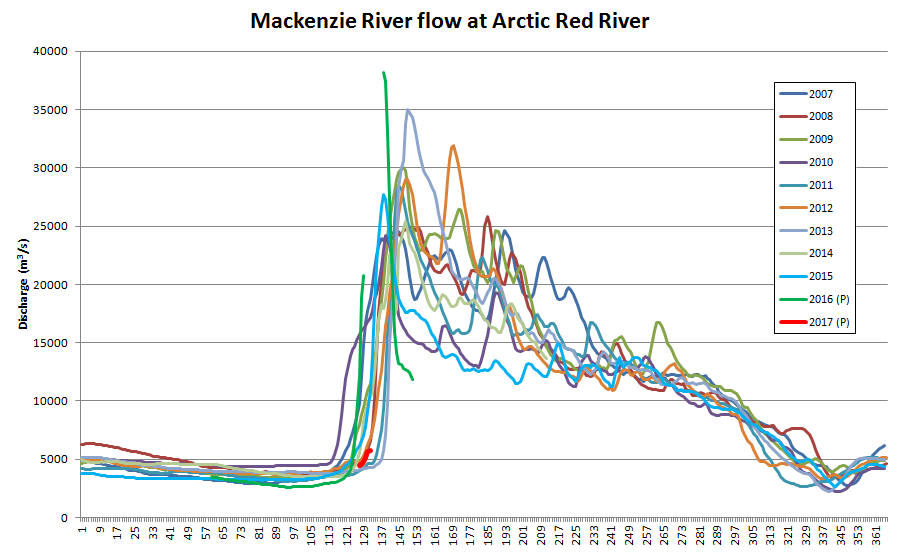
The ice break-up of the Mackenzie River is now visible as increased flow at the junction with Arctic Red River just south of the delta:
Meanwhile the sea ice in the Lincoln Sea north the Nares Strait is coming apart at the seams:
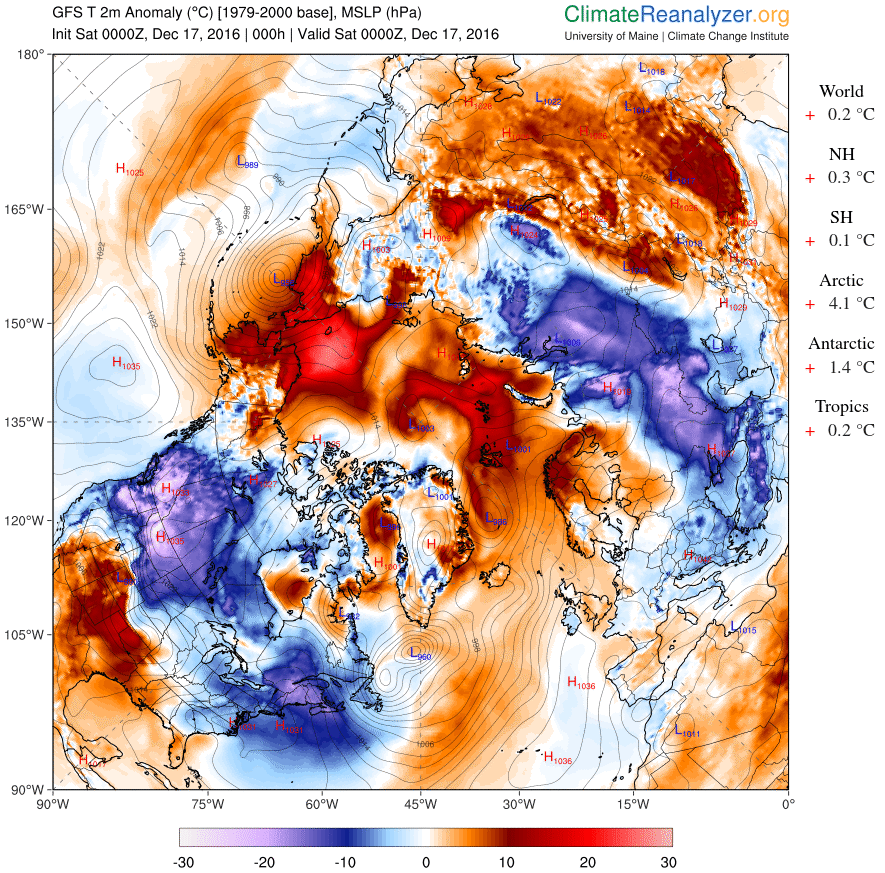
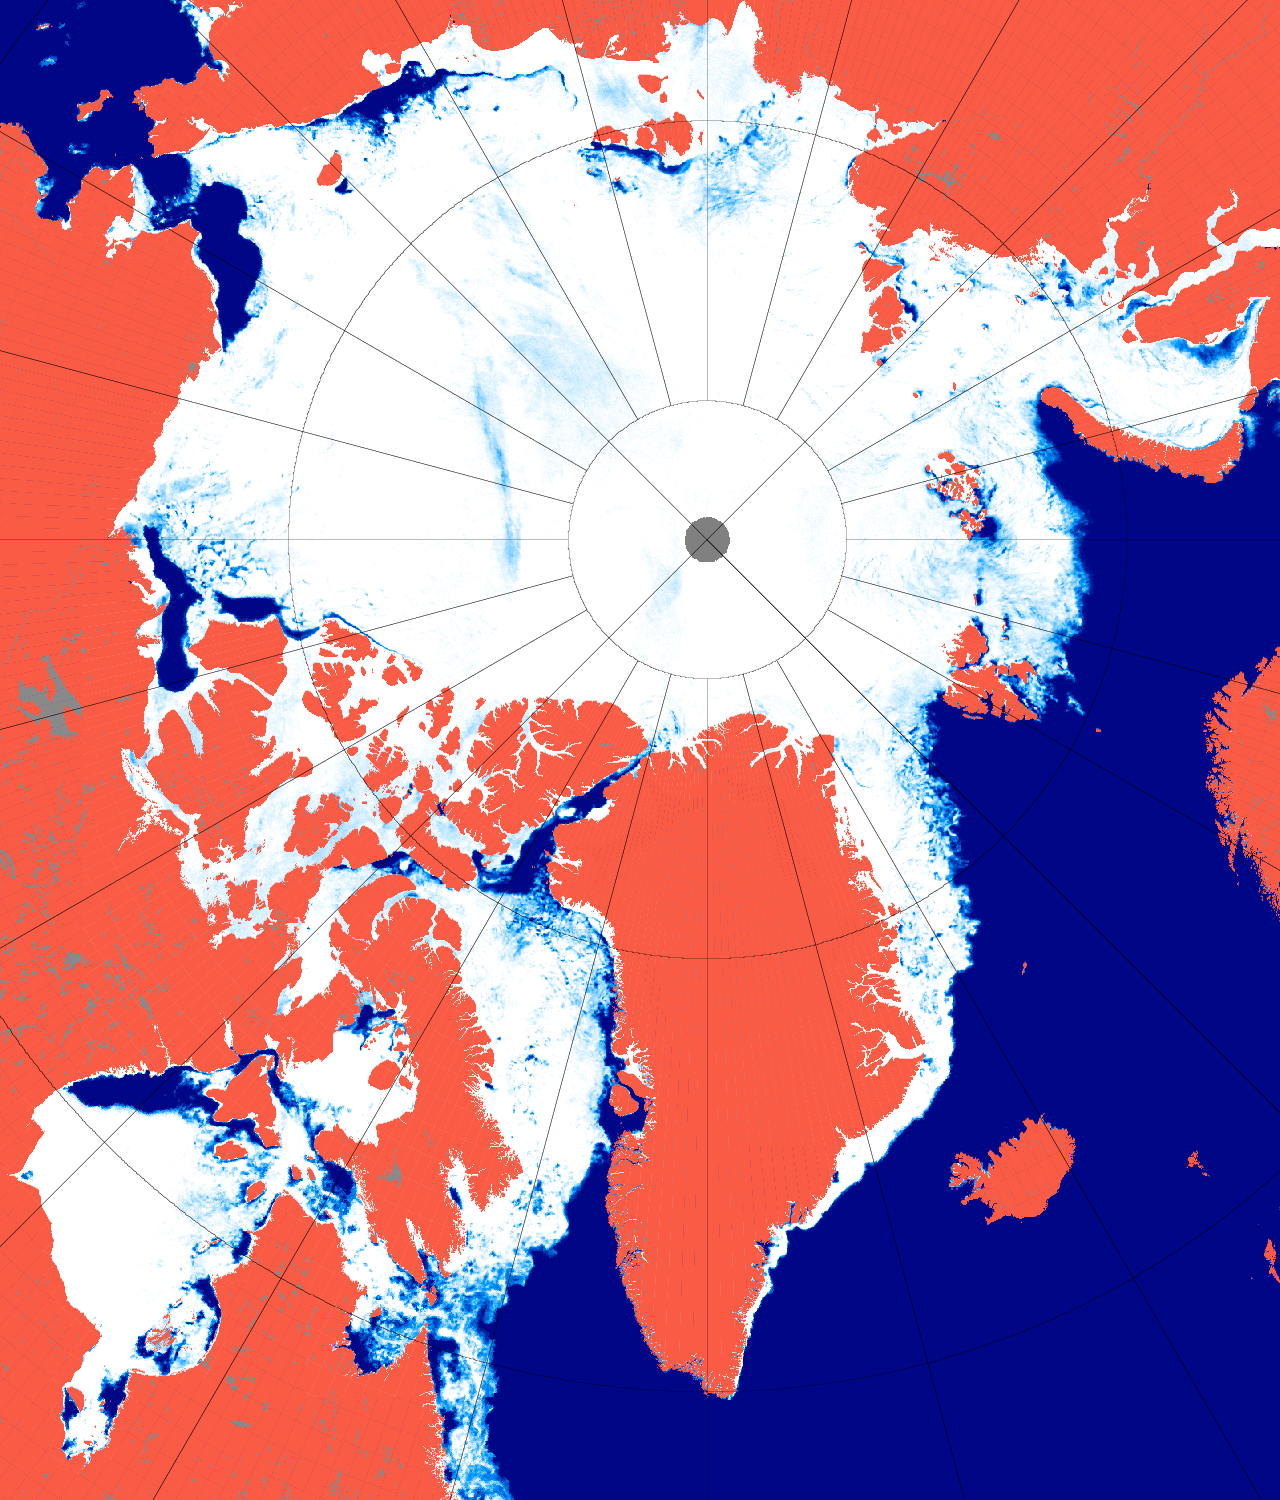
May seems to be shaping up as month of two halves, both spatially and temporally. Here’s an overview of the current state of play:
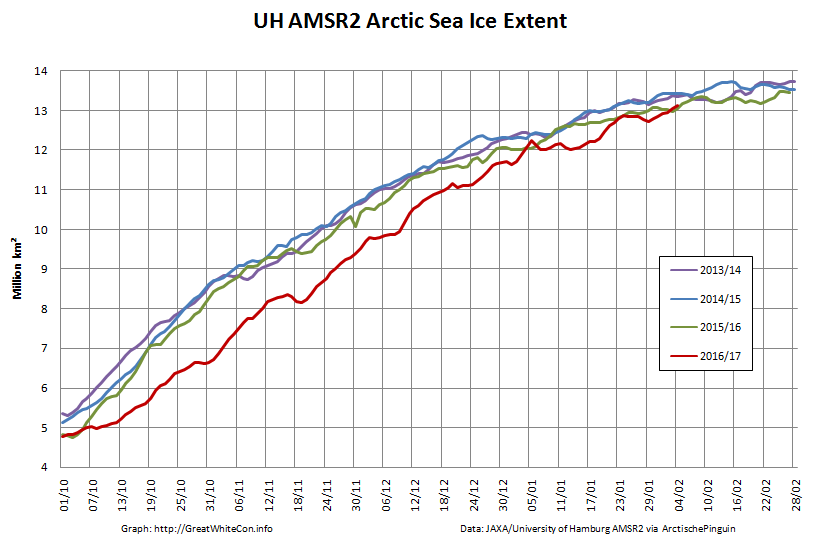
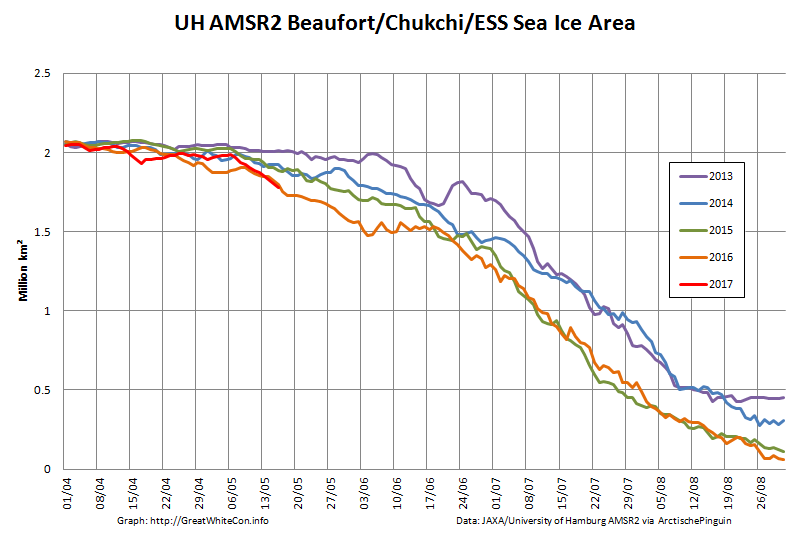
On the Pacific side of the Arctic sea ice area has been declining rapidly courtesy of the expanding areas of open water visible in the Beaufort, Chukchi and East Siberian Seas. It’s currently tracking below other recent years:
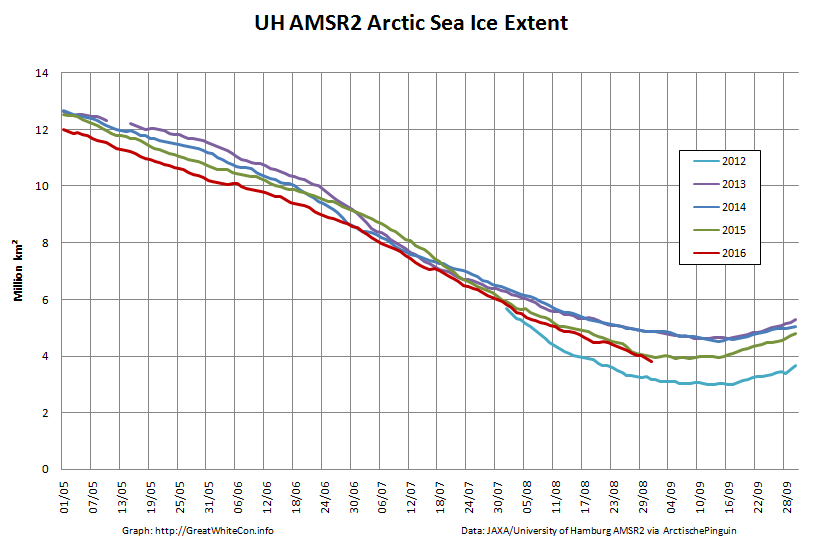
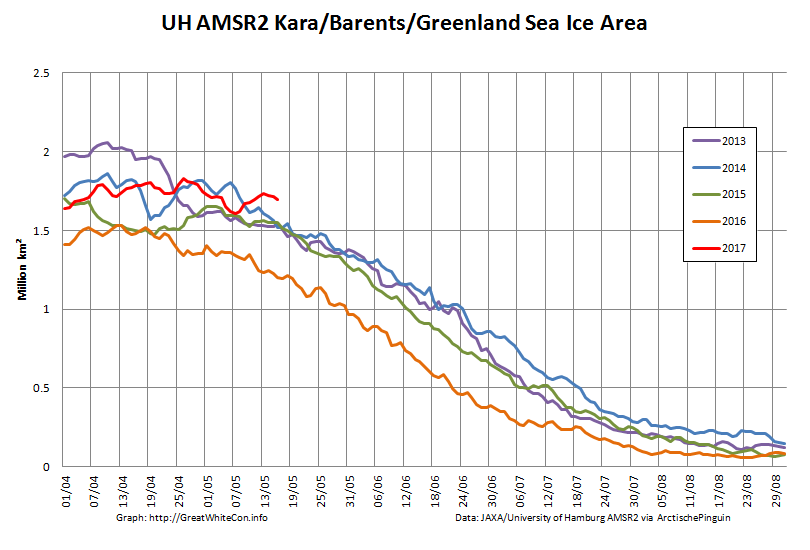
However over on the Atlantic side area has been flatlining, and is currently above other recent years:
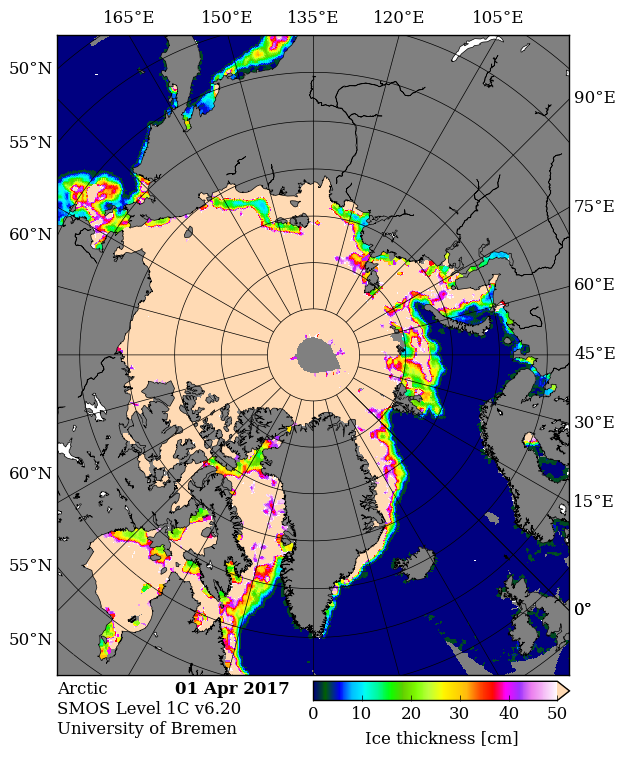
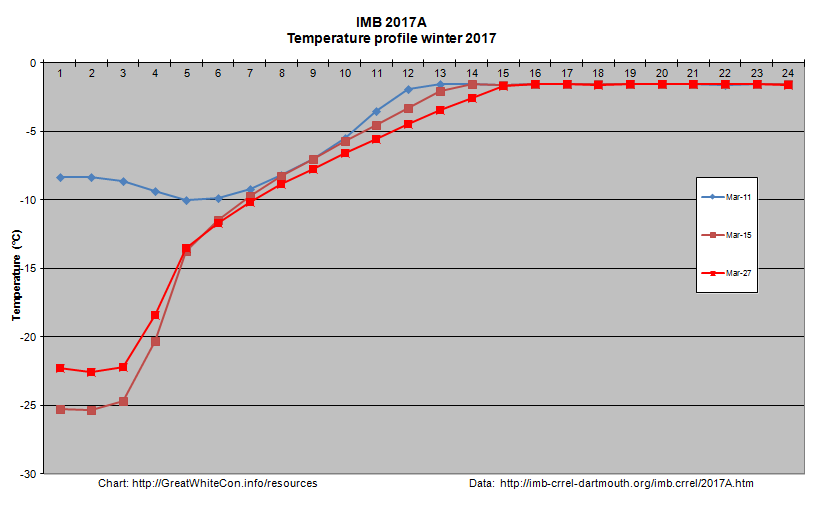
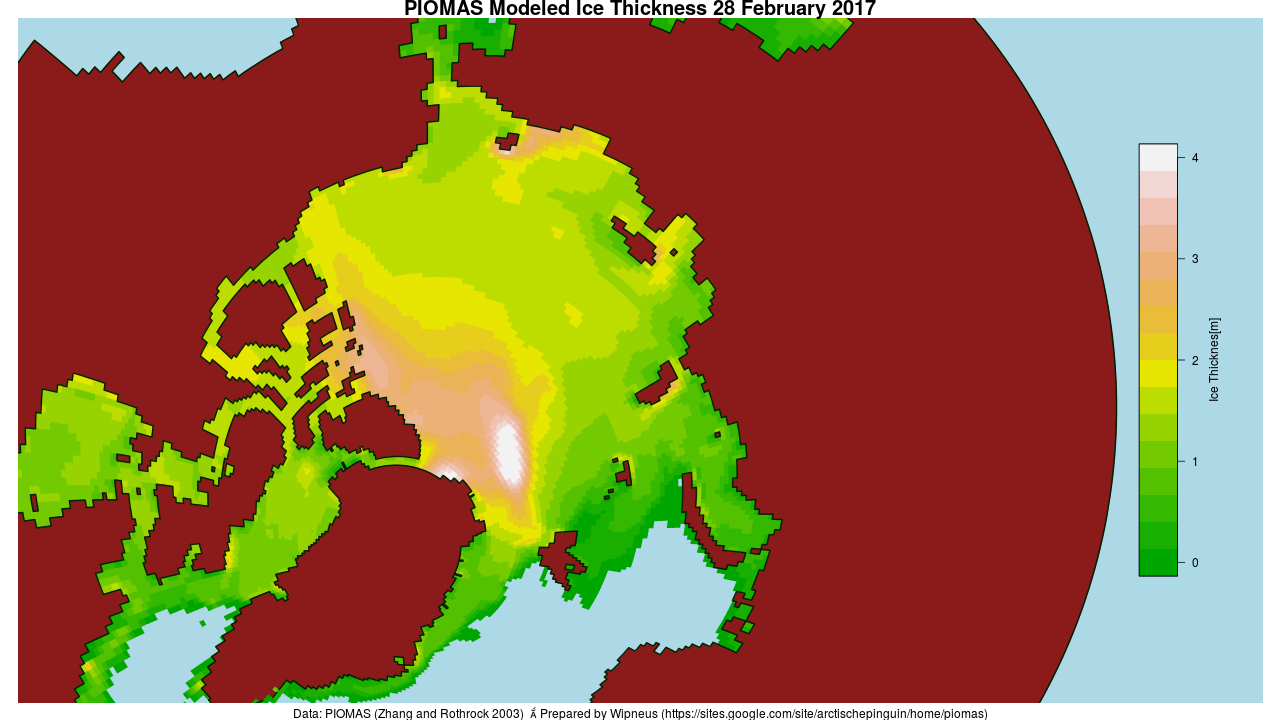
Ice mass balance buoy 2017A is now located near the boundary between the Beaufort and Chukchi Seas and as the melting season in that vicinity rapidly approaches it reveals that thermodynamic thickening has thus far achieved a mere 119 cm: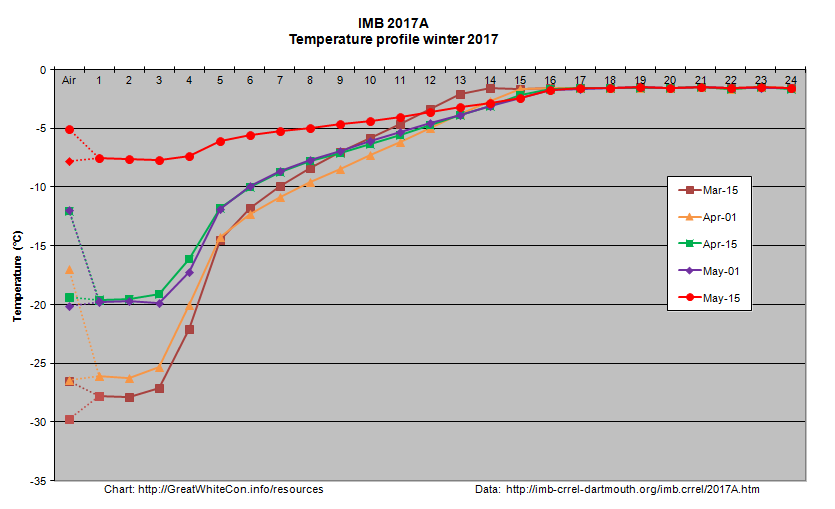
Arctic wide sea ice area has recently started to decline at an increasing rate:

During the second half of the month it will be interesting to see whether the forecast high temperatures produce significant melt ponding. If so it’s conceivable that 2017 area could drop below 2016 again by the beginning of June. There already signs of surface melt at places as far apart as Franklin Bay, Chaunskaya Bay and even the Great Bear Lake!
Watch this space!
References
Muhammad, P., Duguay, C., and Kang, K.-K.: Monitoring ice break-up on the Mackenzie River using MODIS data, The Cryosphere, 10, 569-584, doi:10.5194/tc-10-569-2016, 2016.
Rood S. B., Kaluthota S., Philipsen L. J., Rood N. J., and Zanewich K. P. (2017) Increasing discharge from the Mackenzie River system to the Arctic Ocean, Hydrol. Process., 31, 150–160. doi: 10.1002/hyp.10986.
Kwok, R., L. Toudal Pedersen, P. Gudmandsen, and S. S. Pang (2010), Large sea ice outflow into the Nares Strait in 2007, Geophys. Res. Lett., 37, L03502, doi:10.1029/2009GL041872.