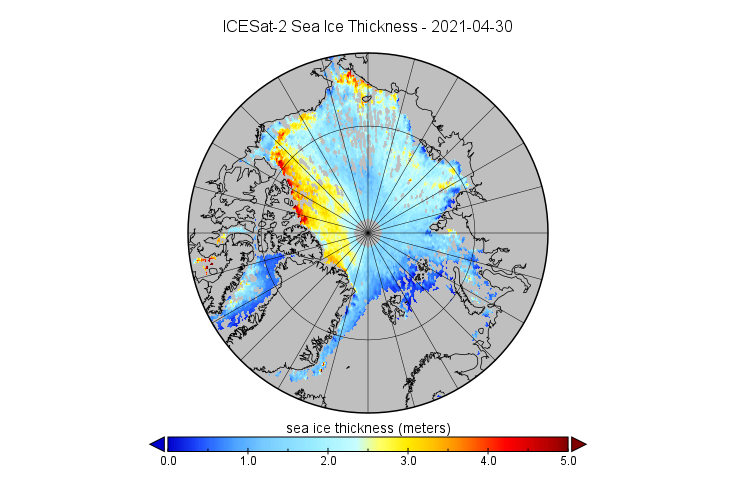
We reported on the first ICESat-2 sea ice thickness data to be released back in May. We are now very pleased to be able to reveal that the data up to April 2021 is now available for download from the NSIDC web site. Here’s a visualisation of April’s data:
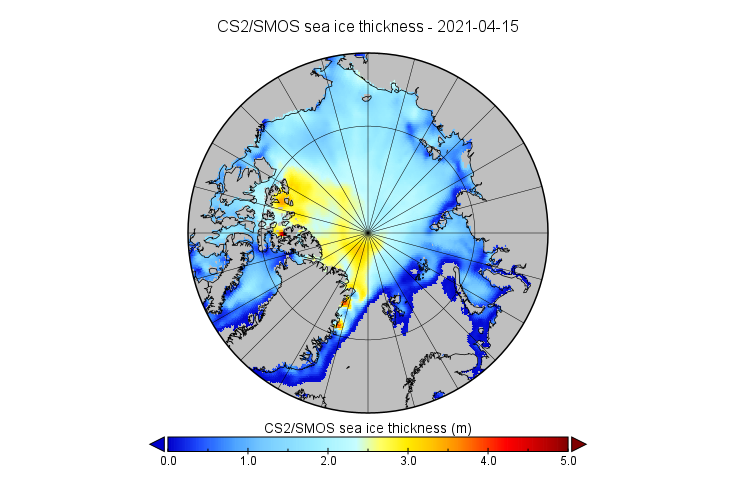
For comparison purposes here’s the CryoSat-2/SMOS equivalent:
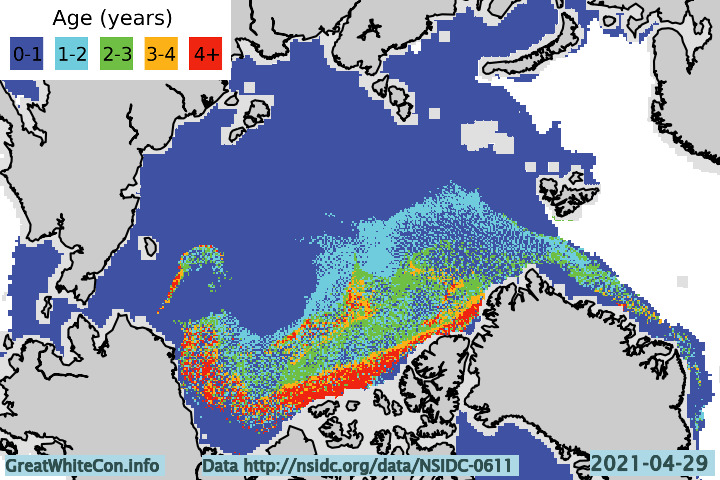
ICESat-2 looks to have captured the arm of thicker ice extending across the Beaufort Sea suggested by sea ice age data better than CryoSat-2:
However thickness data is totally absent where leads are absent, in land-fast ice for example. It seems that near real time ICESat-2 processing isn’t available as yet, but we await the release of the data for October with barely bated breath!
This month has begun with a couple of CryoSat-2 related papers. First we have one that I unexpectedly I found out about via Twitter:
I have a paper out today in which we recalculate sea-ice-thickness trends in the Arctic marginal seas using output of a new snow model rather than with the traditional climatology.
It's had some press coverage so I want to be clear about what it does(n't) say, uncertainties, etc https://t.co/KJQE9Uv1E5
Whilst we wait on those SnowModel-LG results does the CPOM’s new analysis offer any cause for comfort concerning sea ice thickness in 2021? I’m afraid not. Here’s an extract from the conclusions:
We found that interannual variability in average sea ice thickness of the marginal seas was increased by more than 50 % by accounting for variability in the snow cover. On a seasonal timescale we find that variability in the snow cover makes an increasing contribution to the total variability of inferred sea ice thickness, increasing from around 20 % in October to more than 70 % in April.
We also observed that the trends in SnowModel-LG data propagated through to the sea ice thickness time series, amplifying the decline in regions where it was already significant and introducing significant decline where it did not previously exist. This occurred in spite of the compensating effect of enhanced interannual variability.
Knowledge of sea-ice thickness and volume depends on freeboard observations from satellite altimeters and in turn on information of snow mass and sea-ice density required for the freeboard-to-thickness conversion. These parameters, especially sea-ice density, are usually based on climatologies constructed from in situ observations made in the 1980s and before while contemporary and representative measurements are lacking. Our aim with this paper is to derive updated sea-ice bulk density estimates suitable for the present Arctic sea-ice cover and a range of ice types to reduce uncertainties in sea-ice thickness remote sensing. Our sea-ice density measurements are based on over 3000 km of high-resolution collocated airborne sea-ice and snow thickness and freeboard measurements in 2017 and 2019.
Some slightly strange English in there, but interesting nonetheless and an complement to Robbie Mallett’s paper above.
In addition to the paper itself Stefan Hendricks has posted an explanatory thread on Twitter:
We therefore came up with a way to "measure" sea ice density with an aircraft: Observe #seaice thickness and snow depth as well as freeboard to see how far the ice surface is floating above sea-level. With that we can compute density of the ice layer. pic.twitter.com/7rkzn6UdXS
Main findings: The density values are higher than what we get with the climatology values, more so for multi-year sea ice than for first-year ice. Part of the explanation is that with the airborne data we also tried to get the bulk density of deformed ice that includes sea water.
We also found a robust relationship between ice freeboard and ice density. This will be useful for the freeboard to thickness conversion of satellite data.
If I’ve understood the 2 papers correctly Robbie’s change to estimated snow thickness implies less overall sea ice volume in CPOM’s future product, whereas Arttu’s change to estimated sea ice density implies increased sea ice volume in AWI’s version.
All in all I’m anticipating the summer 2021 high Arctic melting season with even greater trepidation than at the start of this month. Uncertainty is exceedingly unsettling!
AWI sea-ice physicists report on the first indications that the rising ocean heat is also slowing ice formation in the Laptev Sea, which also includes measurements of the ice floe from the one-year MOSAiC expedition in late summer 2020. In it, the researchers analyse the long-term data from their sea-ice thickness measuring programme in the Arctic, ‘IceBird’, and trace the origins of the unusually thin sea ice that they observed from the research aeroplane in the northern Fram Strait in summer 2016. At that time, the ice was just 100 centimetres thick, making it 30 percent thinner than in the previous year – a difference that the researchers were initially unable to explain. “To solve the puzzle, we first retraced the ice’s drift route with the help of satellite images. It originated in the Laptev Sea,” explains AWI sea-ice physicist Dr Jakob Belter. The experts then examined the weather along the route. However, the atmospheric data for the period 2014 to 2016 didn’t show any abnormalities.
That meant the answer had to lie in the ocean – and indeed: from January to May 2015, experts from the University of Alaska Fairbanks recorded unusually high temperatures in the waters north of the Laptev Sea. We now know that the heat rose from the depths with Atlantic water masses, and slowed the winter ice growth. “Using the satellite data, we were able to show that the thin ice that we sampled in Fram Strait in July 2016 had previously passed through this unusually warm area off the Russian continental shelf,” says Belter. Furthermore, the ocean heat wave must have been so extreme that its effects on the growth in sea-ice thickness couldn’t be compensated for during its drift across the Arctic Ocean.
The conclusions from the paper itself include:
Further investigations and measurements are required to monitor the development of Atlantification in the eastern marginal ice zones. But in order to strengthen our conclusion that Atlantification is able to precondition sea ice and that this preconditioning persists far beyond the eastern Arctic, additional uninterrupted SIT time series are vital along the pathways and at the exit gates of Arctic sea ice. The presented summer SIT time series at the end of the Transpolar Drift is an important effort to establish long-term and large-scale measurements of SIT, especially during the melt season. Airborne EM measurements of SIT during IceBird campaigns provide the necessary accuracy and areal coverage that is unmatched by any other non-satellite SIT measurement approach. Russian shipborne SIT measurements show significant differences to EM-based measurements, but their regularity and spatial consistency enable the depiction of regime shifts in SIT that are hardly resolved by the presented EM SIT time series. Obtaining SIT distributions over large areas and developing and continuing long-term SIT time series will provide unique input data for modelling efforts and ultimately will improve predictions of Arctic sea ice and its thickness in the future.
Getting back to the conclusion of the press release:
The two new studies highlight the importance of long-term datasets for sea-ice research in the Arctic. “If we are to understand the changes in the Arctic sea ice, long-term observations of ice thickness using satellites and aircraft are vital. Combined with modelling data they provide an overall picture that is sufficiently detailed to allow us to identify the key processes in the changing Arctic,” explains Jakob Belter.
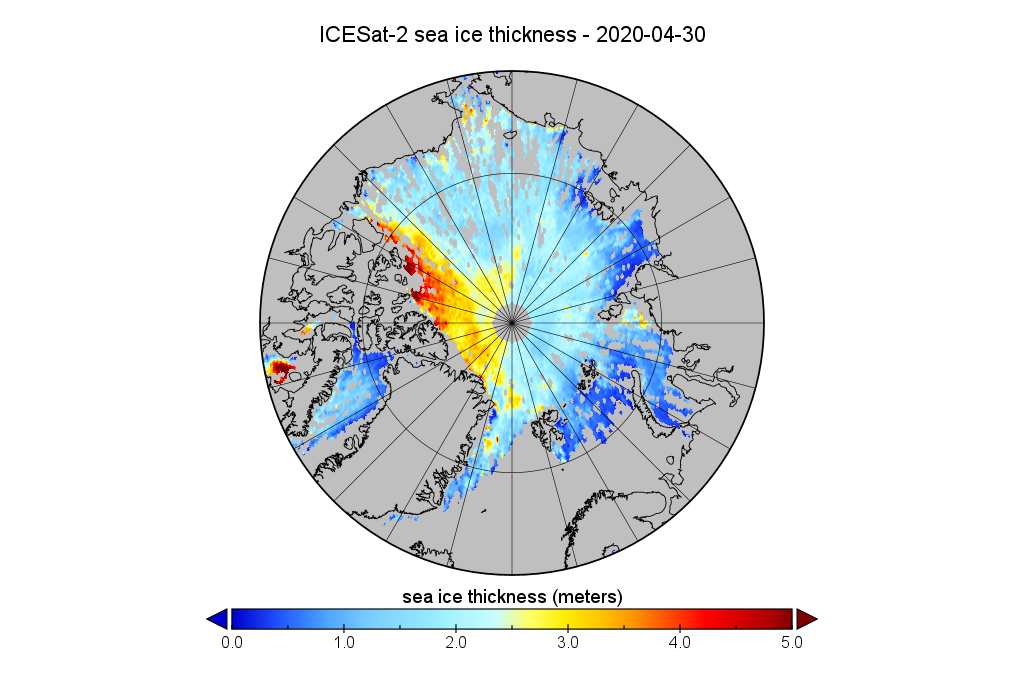
It’s been a long wait since NASA launched the ICESat-2 satellite in September 2018:
However some good news has arrived at long last! ICESat-2 level 4 monthly gridded Arctic sea ice thickness data is now available for download via the NSIDC:
Now for the bad news. Currently it’s only available from 1 November 2018 to 30 April 2020 . There also seems to be an absence of data in summer, just like CryoSat-2.
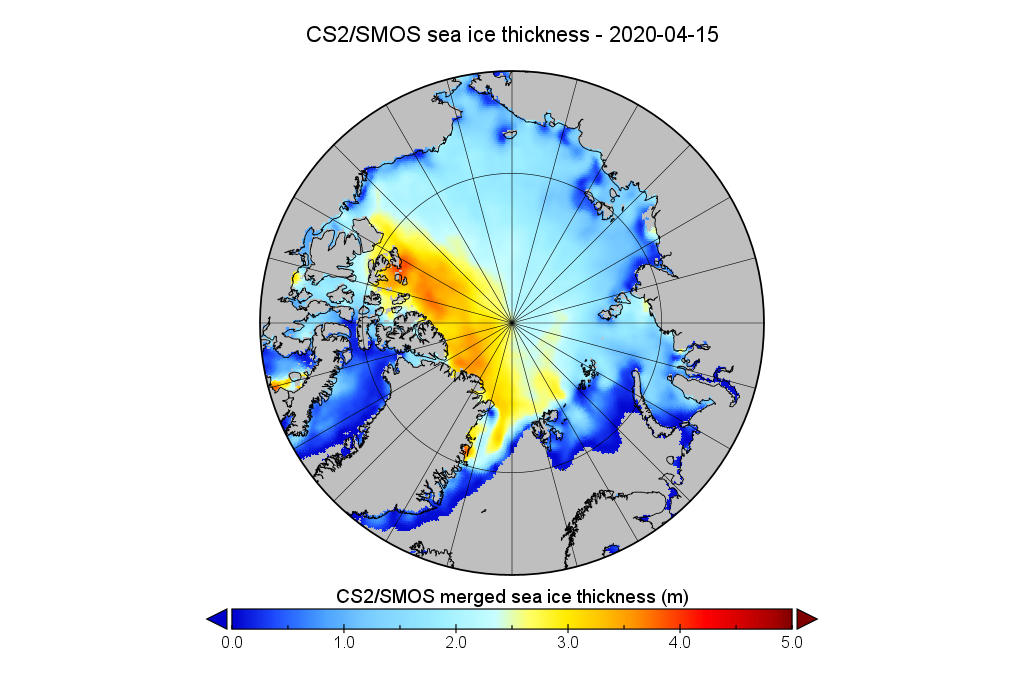
Here is my first visualisation of the most recent data, for April 2020:
Here is the equivalent from AWI’s CryoSat-2/SMOS gridded thickness product for comparison purposes:
In the absence of the usual mid month PIOMAS Arctic sea ice volume update I’m being moaned at by “angech” over on Judith Curry’s “Climate Etc.” blog:
Any ideas on why PIOMAS mid month update not out, other than not wanting to show a big recovery?
Unlike any of Judy’s denizens I checked out the comparatively new merged CryoSat-2 plus SMOS thickness maps from the Alfred Wegener Institute. “Measured” rather than “modelled” data must be a good thing surely?
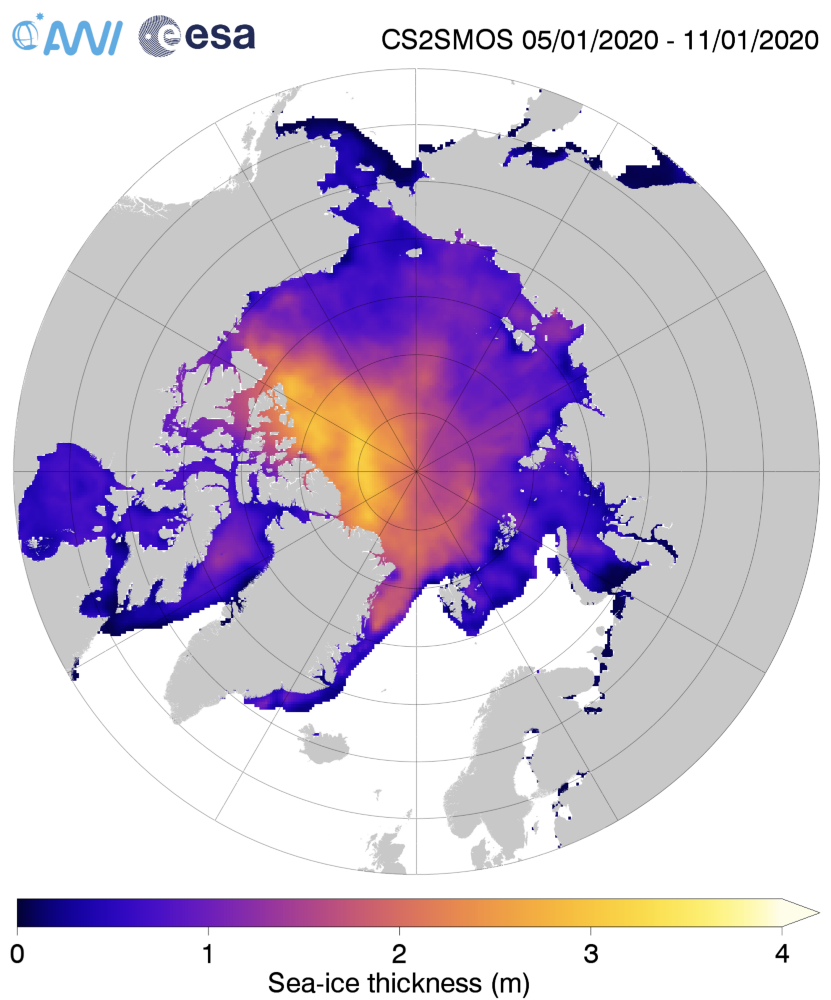
Just in case there’s some significant difference between the “reanalysis” and “operational” versions of that product, here is the AWI’s most recent reanalysed Arctic sea ice thickness map, for the week ending January 11th:
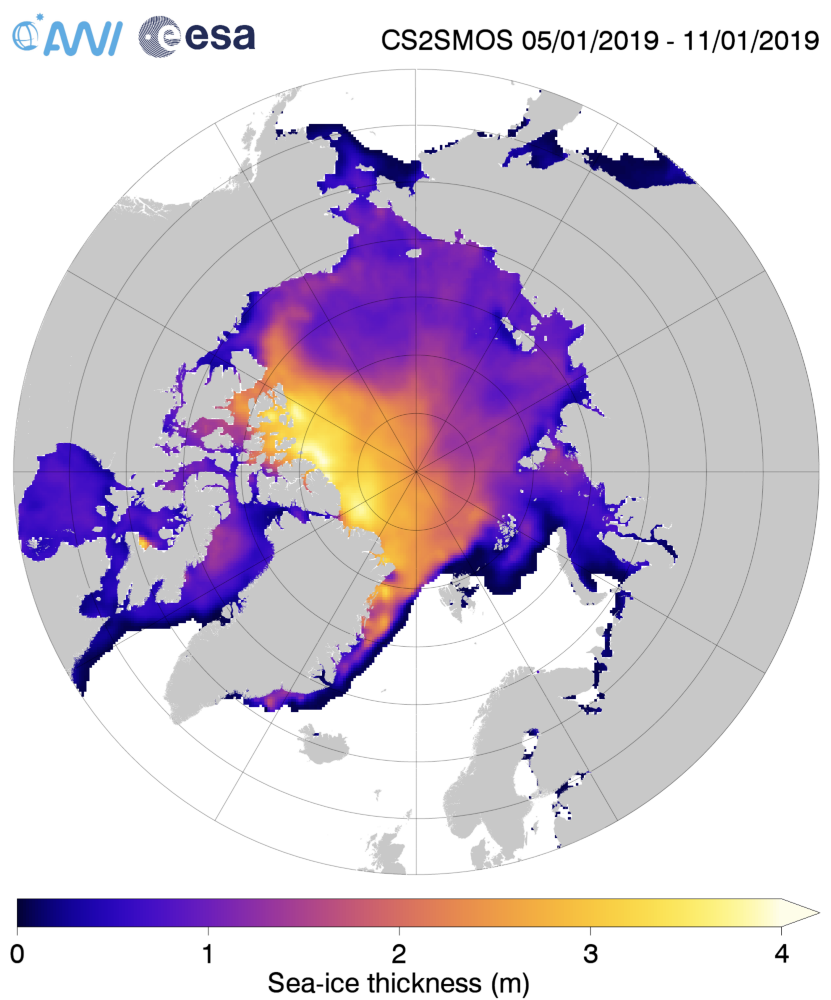
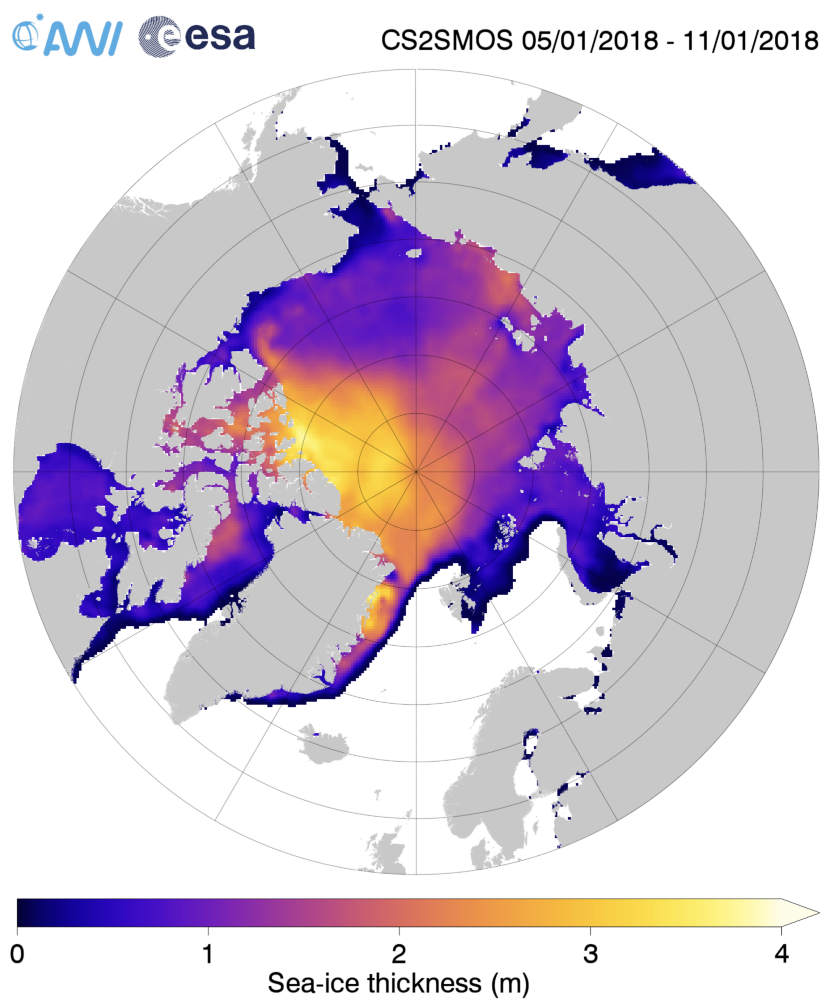
together with the same date from the previous two years:
Make sure to take a close look at the white areas north of Greenland and the Canadian Arctic Archipelago showing sea ice over 4 metres thick.
Over the winter of 2018/19 ASCAT revealed that there was a relentless movement of multi-year ice towards both the North Atlantic and the Beaufort Sea.
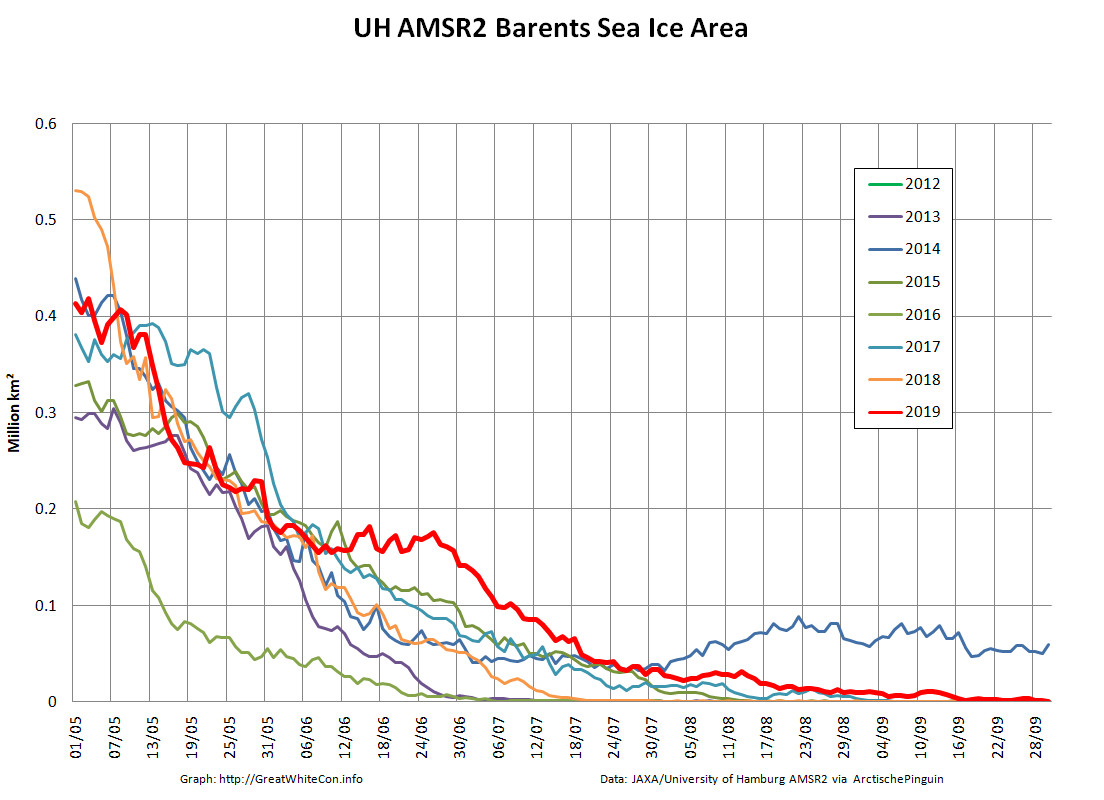
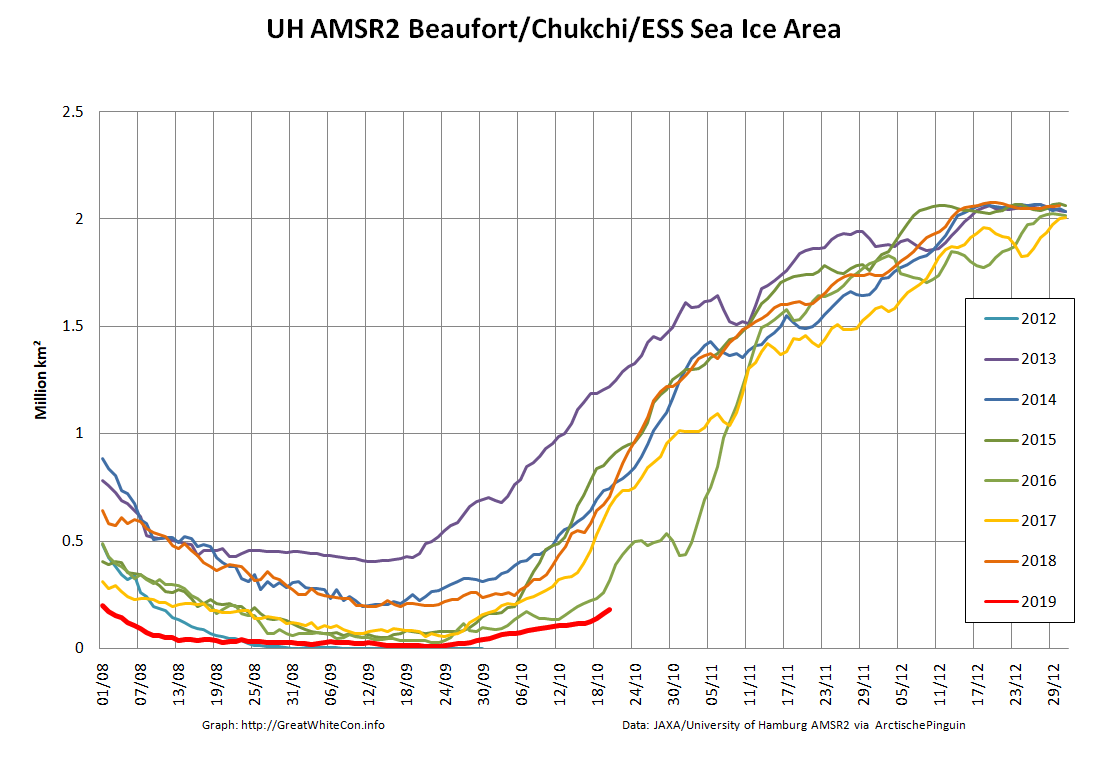
Not unexpectedly that meant that ice in the northern Barents Sea was slow to melt out in the summer of 2019:
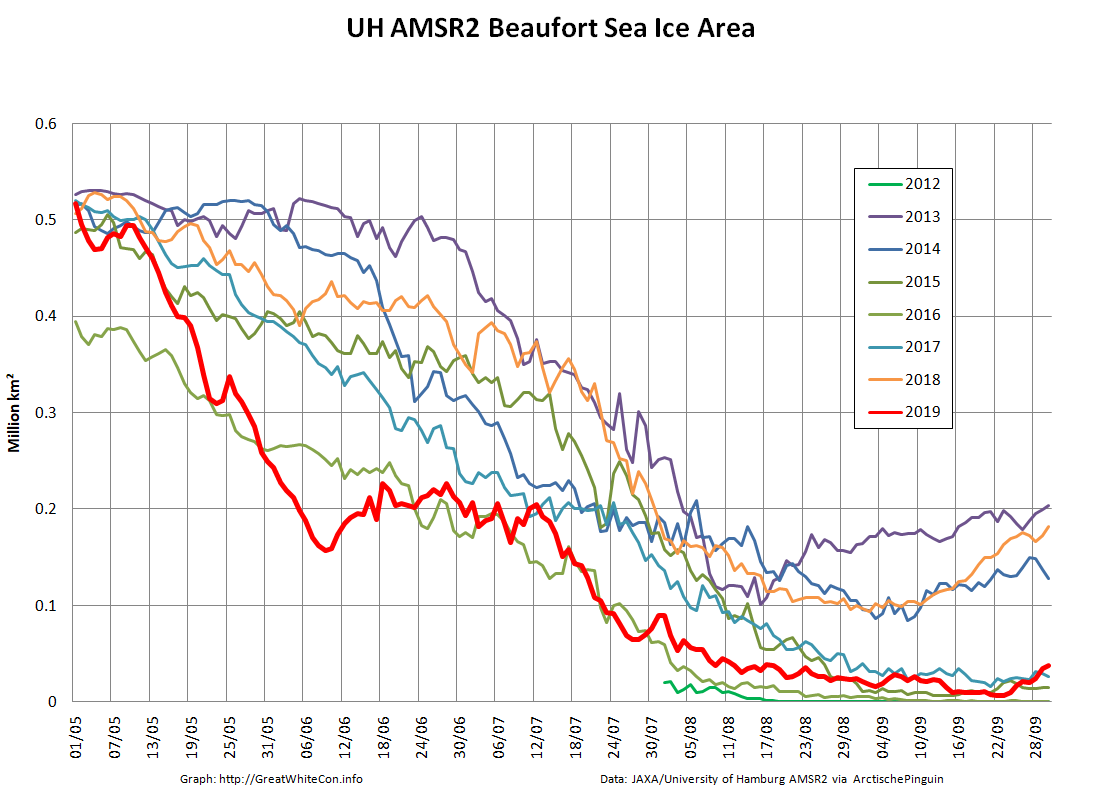
whilst after a fast start the melt in the Beaufort Sea also suffered a “brief hiatus” in June before ultimately melting out almost completely as well:
Perhaps a significant amount of the multi-year ice that survived the winter of 2018/19 has now simply melted away in warm water, to be replaced by much less robust first year ice in the area between the North Pole and the Siberian coast? It will be very interesting to see what the next PIOMAS update in early February reveals.
[Edit – February 4th]
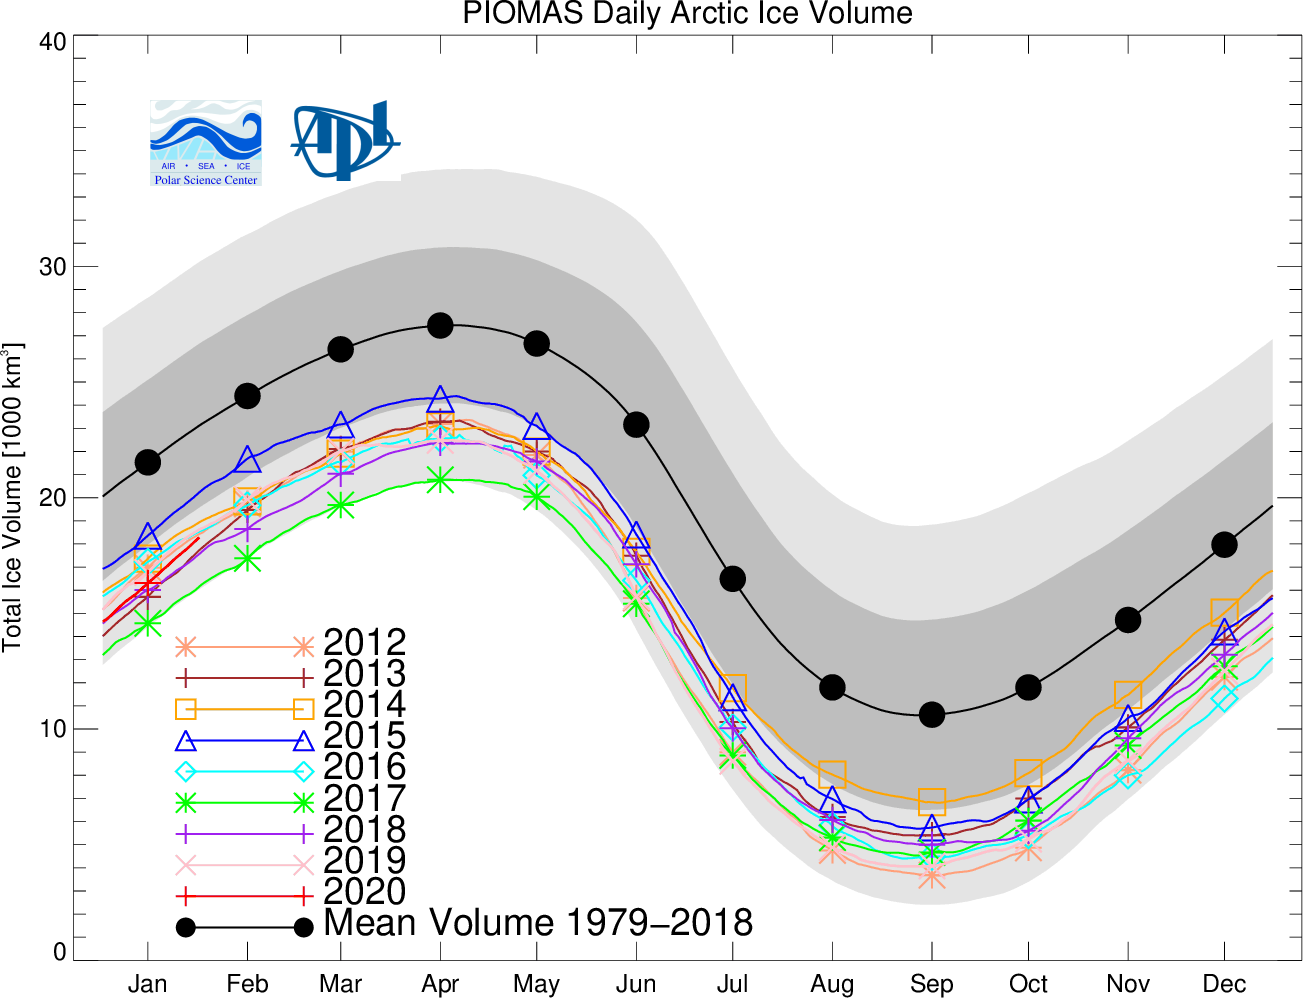
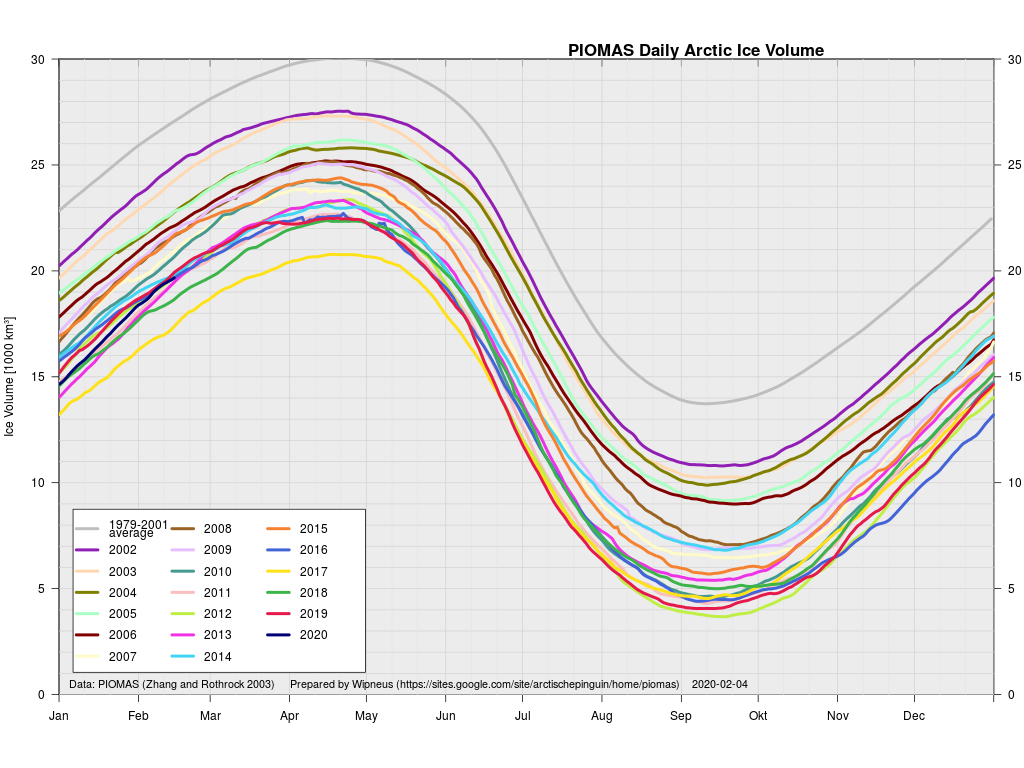
The next PIOMAS update referred to above has now arrived. Here’s the Polar Science Center’s graph:
Over on Climate Etc. angech is already exclaiming:
Strange it did go up a fair bit the old PIOMAS.
No publicity at the usual going down sites.
Actually it’s not at all strange, because thus far this winter the polar vortex has been remarkably well behaved. By and large cold air air has stayed in the Arctic. There hasn’t been much in the way of cold air intrusions into mid latitudes or warm air intrusions into the Arctic.
Hence it’s not at all surprising that the thickness of sea ice in the Arctic has been increasing slightly more quickly this winter than in other recent years. By way of some longer term context, here are the official Polar Science Center min/max trends:
[Edit – February 4th PM]
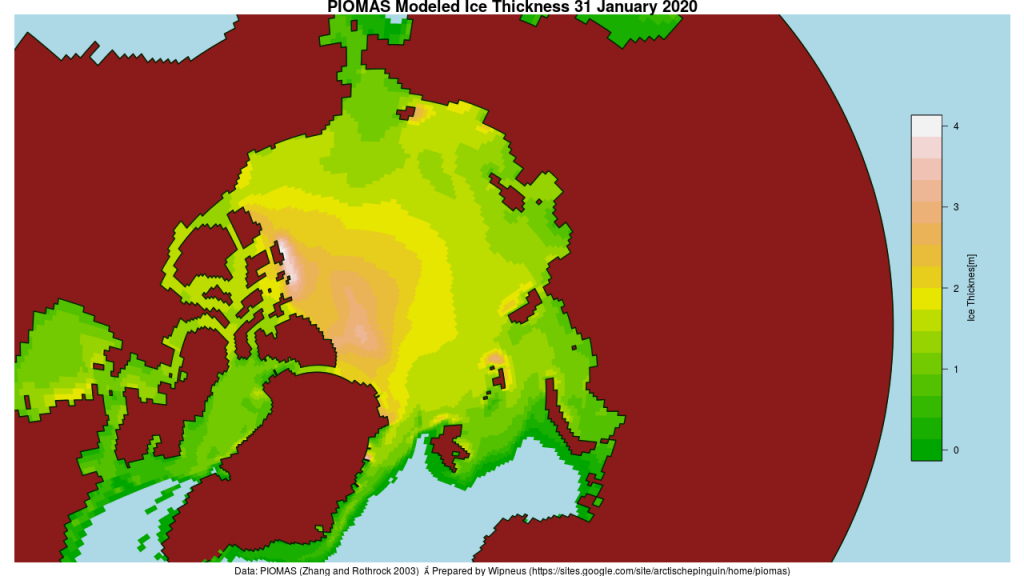
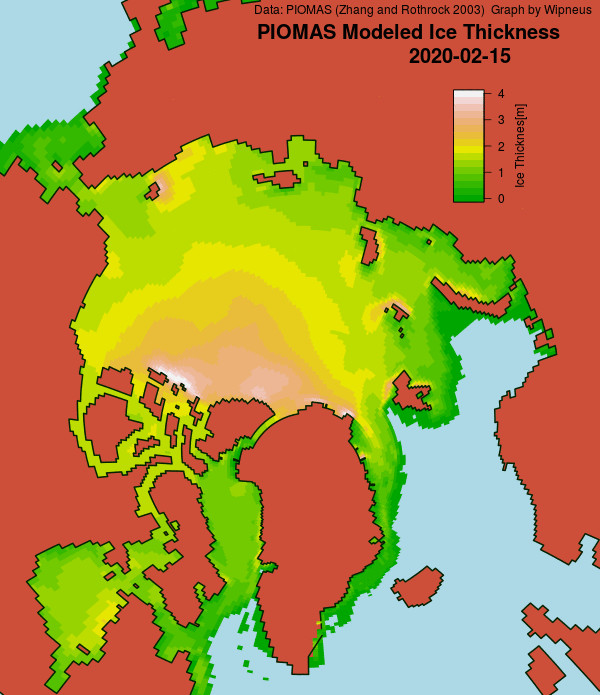
Wipneus has just released the January PIOMAS gridded thickness map. Here it is:
[Edit – February 5th]
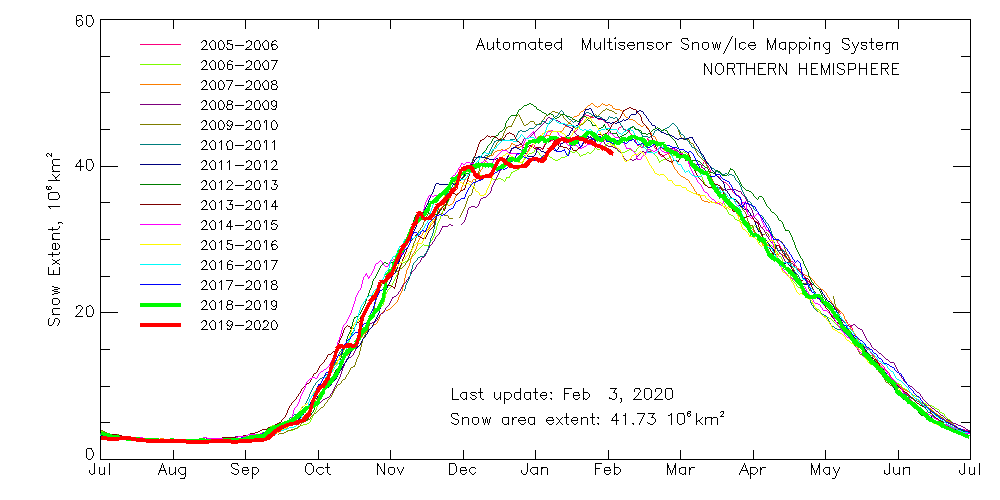
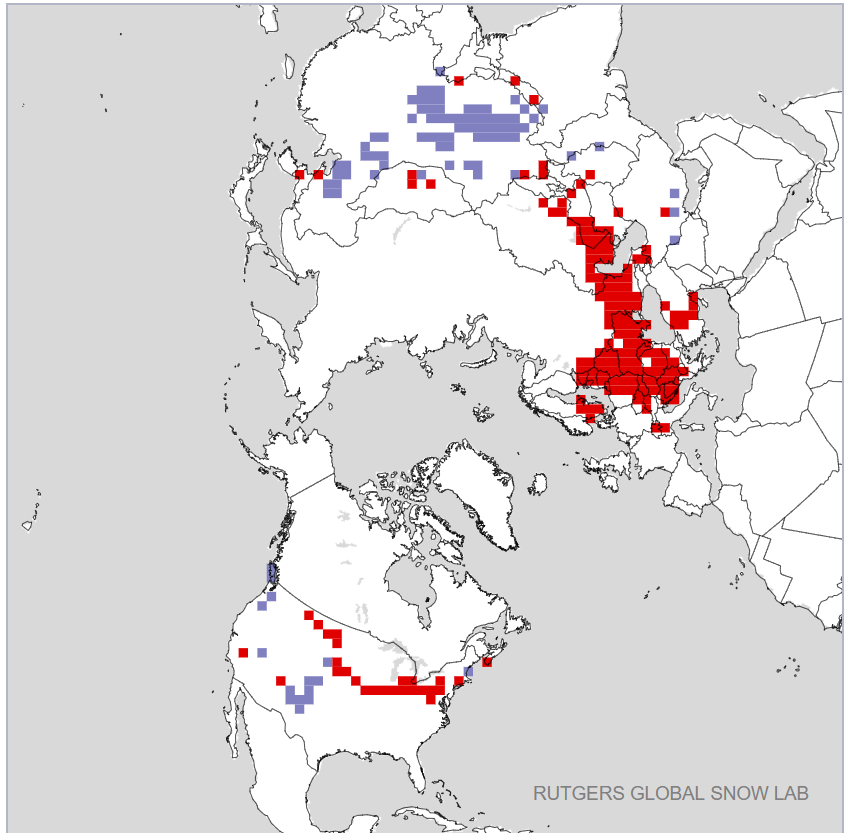
As is all too frequently the case, AdR and other commenters below get very excited about trivial increases in sea ice extent without considering snow extent. One side effect of the lack of cold air outbreaks into mid latitudes so far this winter currently looks like this:
[Edit – February 6th]
The AWI and PIOMAS sea ice thickness maps above look somewhat different at first glance. That being the case, I’ve written a program to crunch the AWI numbers. Here’s the result:
The source code plus raw and processed data can be accessed via the Arctic Sea Ice Forum:
Further support for my “polar vortex” theory, from Judah Cohen no less!
I think this plot best sums up the #winter for the Northern Hemisphere –#PolarVortex strength bouncing around from near (daily) record strong to normal all winter long. One more near record strong (PV) for latter half of February. Pretty much the nail in the coffin on this winter pic.twitter.com/OiSZw07VOF
I am forced to ponder once again why the CryoSat-2/SMOS thickness “measured” numbers just above seem to be more at variance with PIOMAS in 2020 than in previous years:
[Edit – February 22nd]
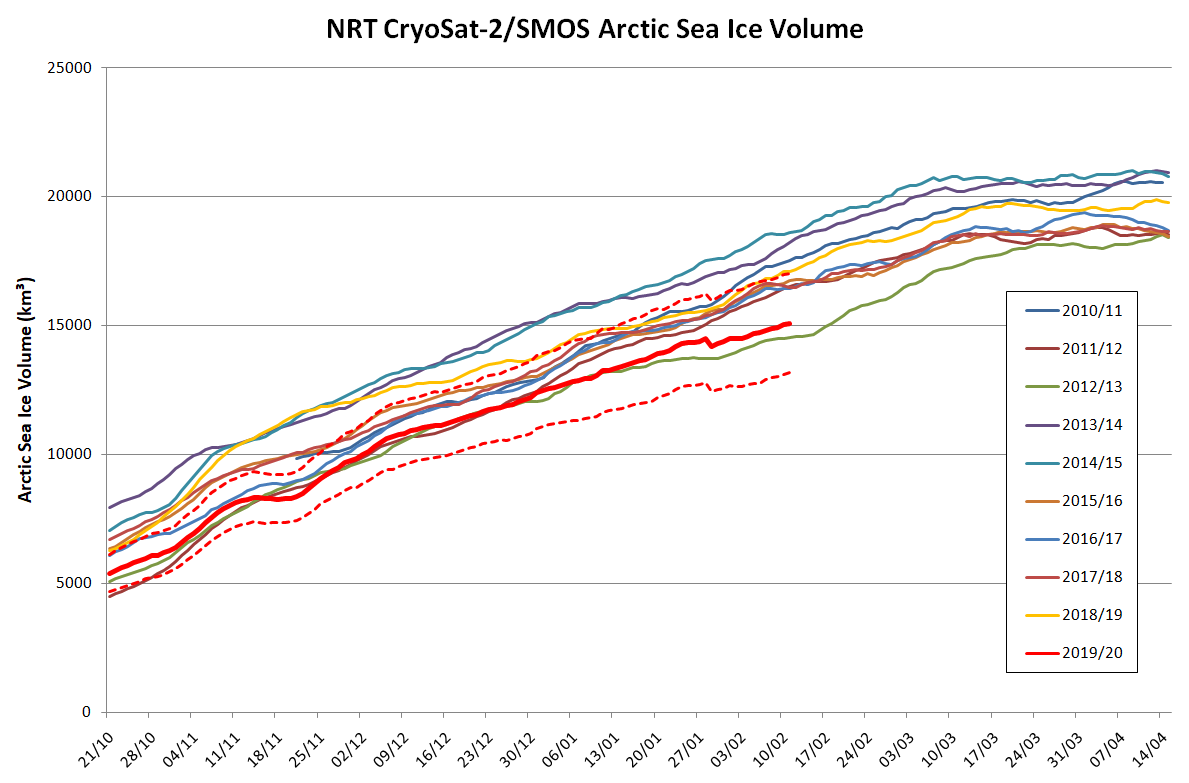
Here’s another weekly NRT volume update:
This time I’ve left off the NRT data from February 6th onwards, since the “issue” referred to above obviously hasn’t been solved yet. As an added bonus here’s a graph showing the trends (or lack thereof) on 3 dates during the October to April freezing season:
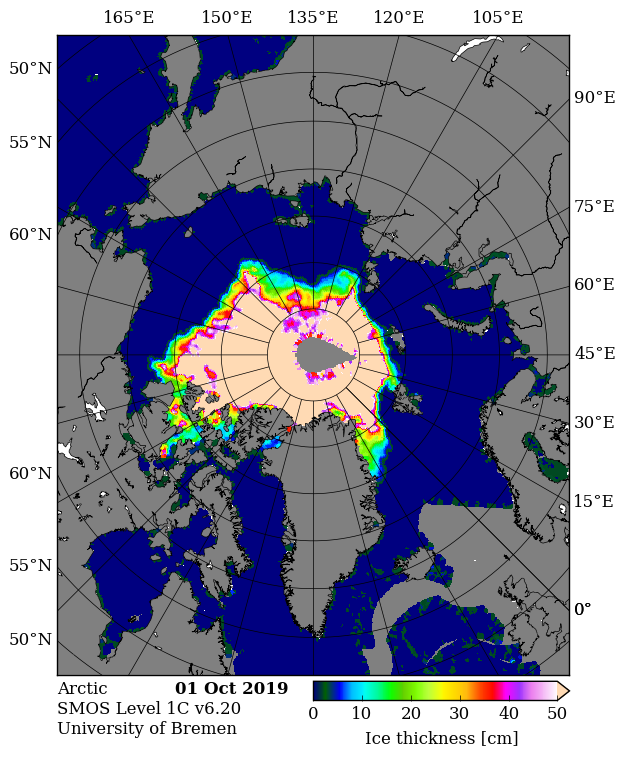
Whilst we await the PIOMAS volume numbers which generally arrive around the 5th of each month, and before we look at graphs of extent, with the refreeze well under way some “measured” thickness maps are coming back! Here’s the first SMOS map this autumn:
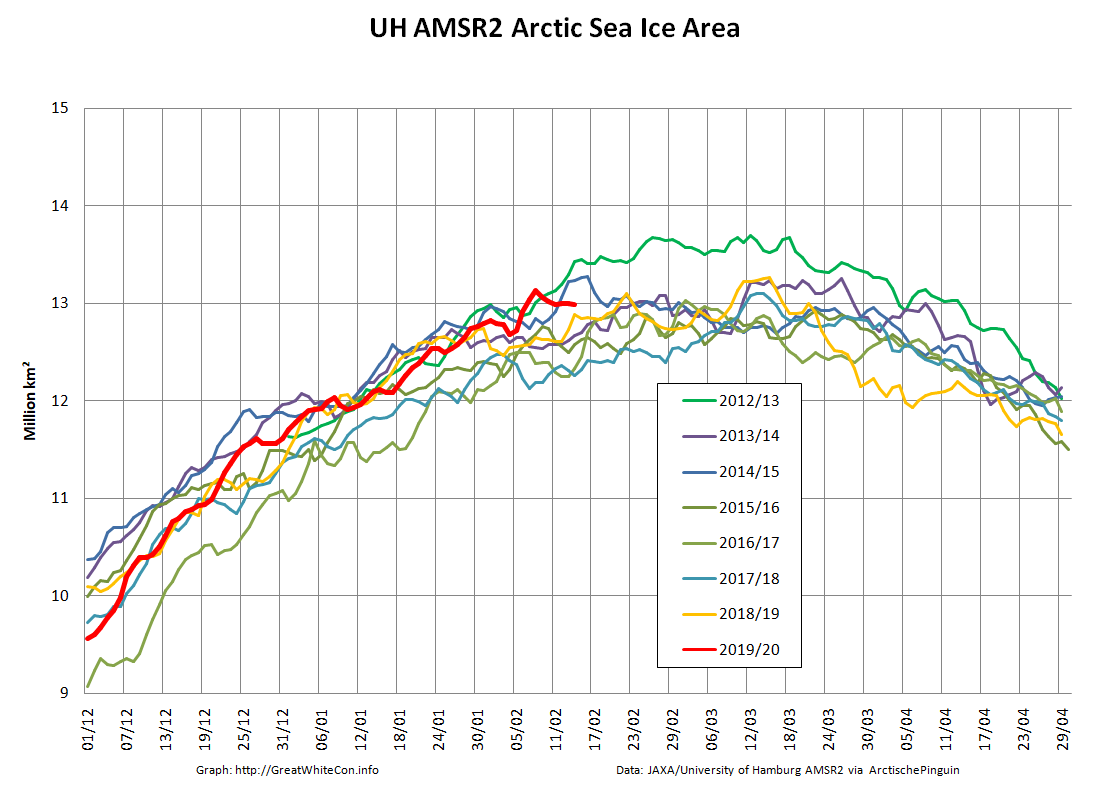
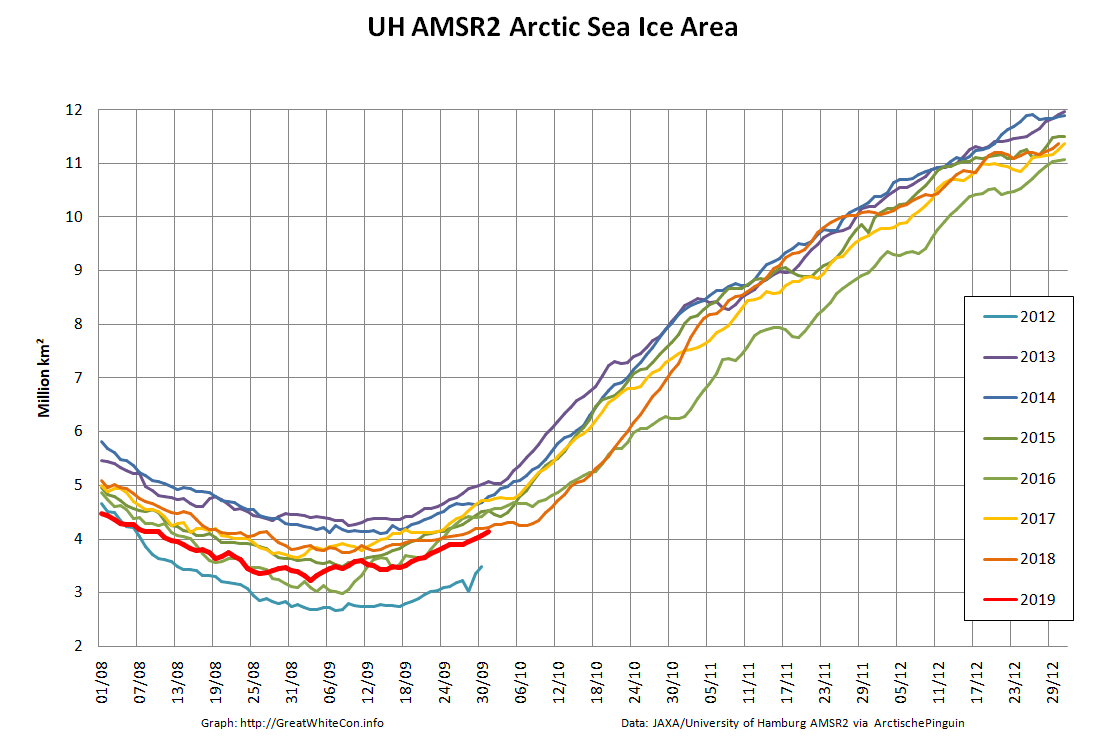
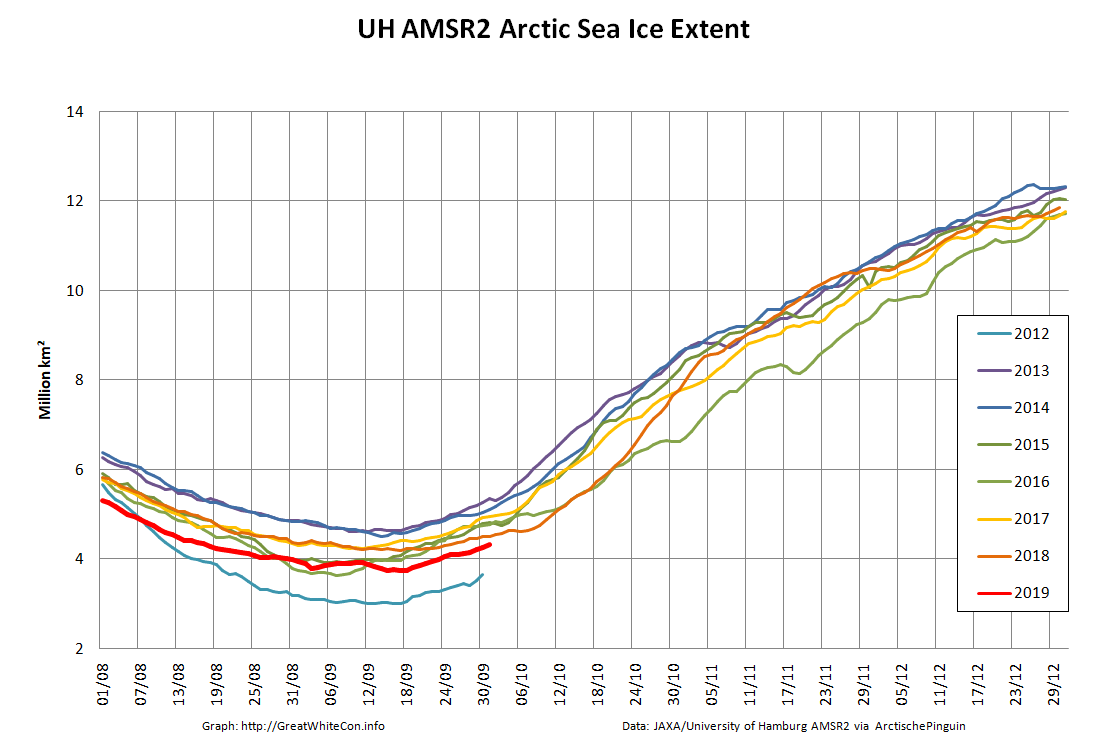
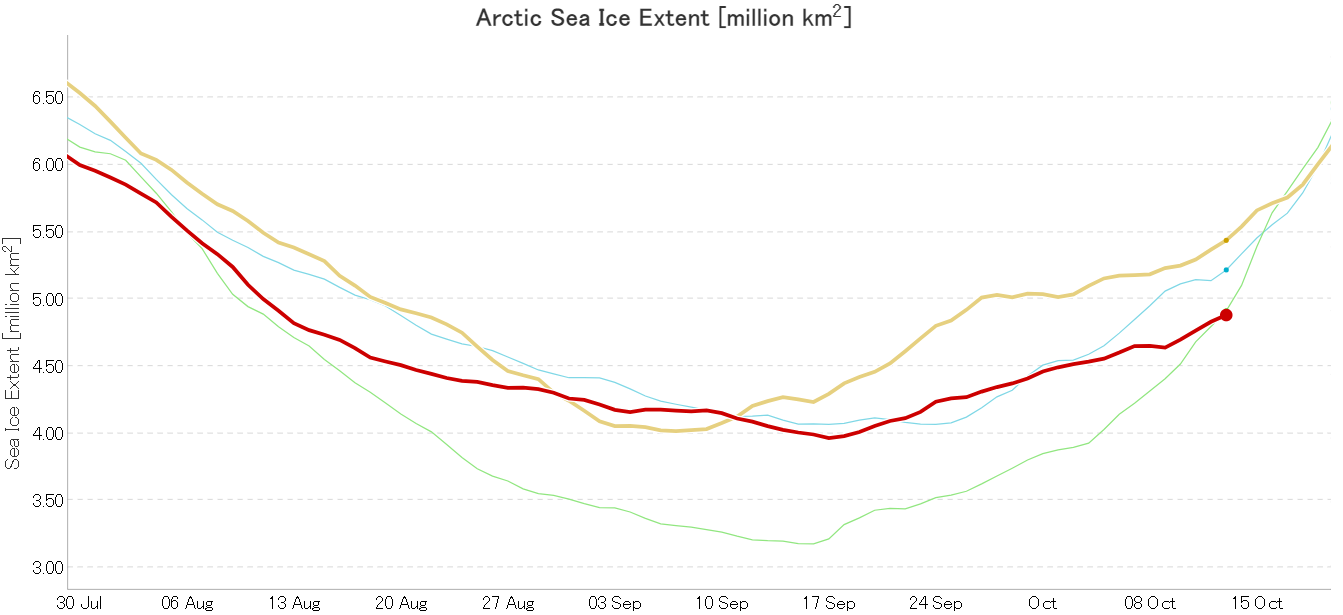
Then of course there’s our usual Arctic wide high resolution AMSR2 area and extent graphs:
They reveal both metrics currently still second lowest (in the brief AMSR2 record) after 2012. It looks as though that may well change soon, particularly area.
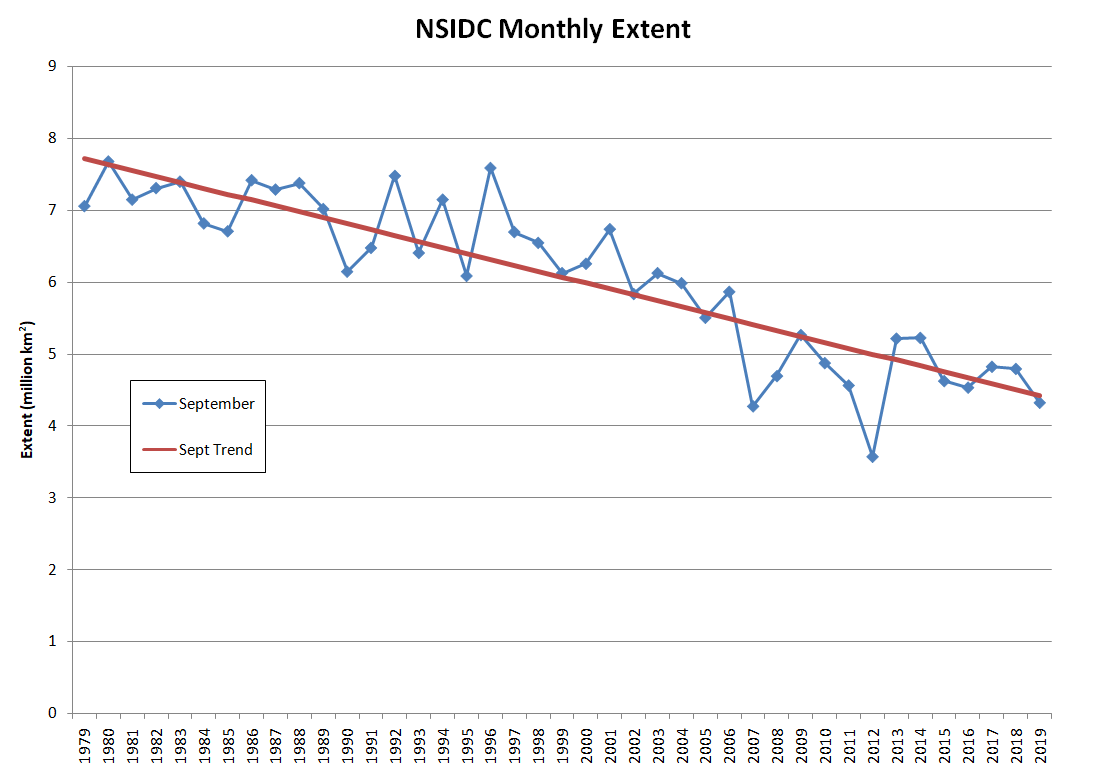
The near real time NSIDC monthly extent for September is 4.32 million km². Here’s the graph:
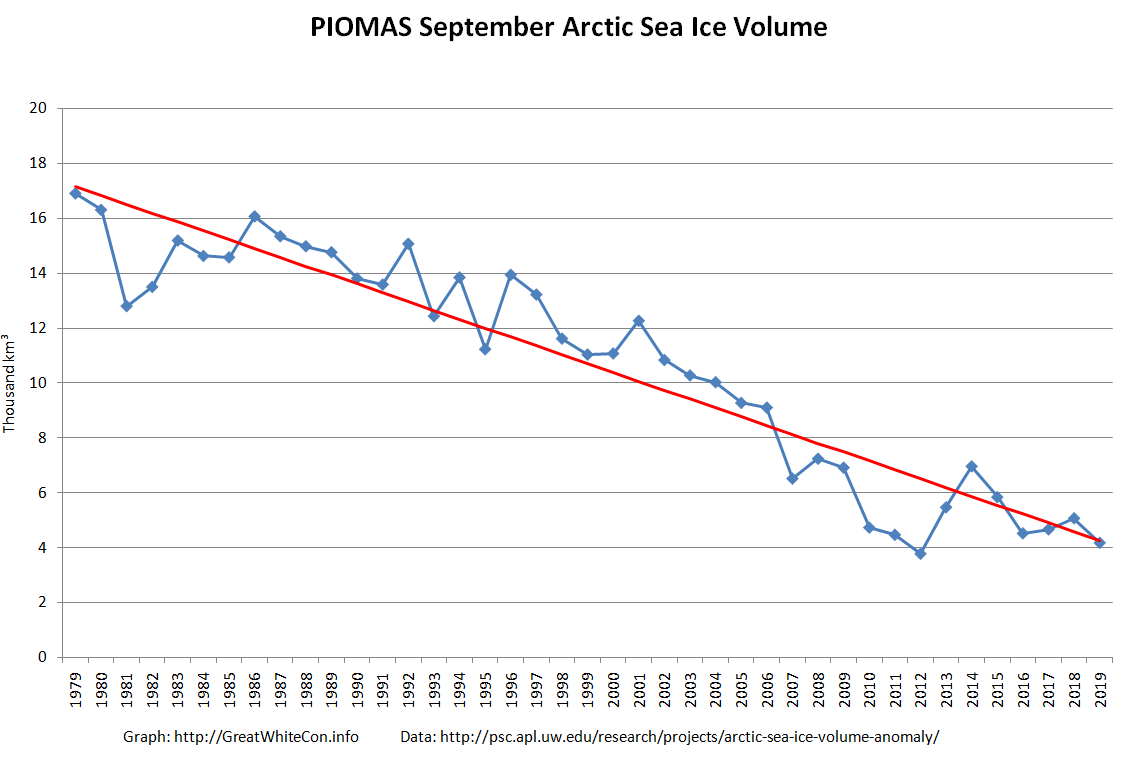
We’re eagerly awaiting the first ice mass balance buoy “near real time” data, but for now the 2019 PIOMAS minimum volume is expected to be revealed real soon now, so:
[Edit – October 5th]
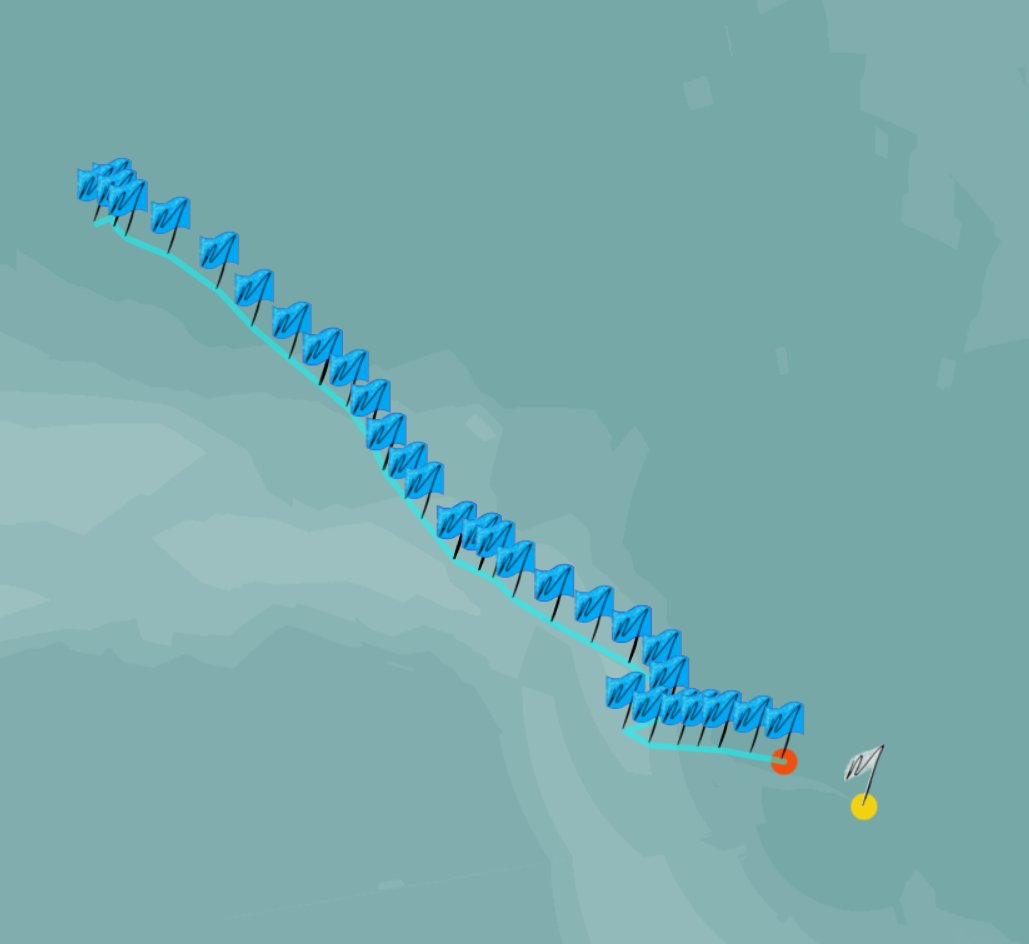
As previously perfectly predicted, the PIOMAS numbers have arrived over at the ASIF. Here’s the thickness map for the end of September:
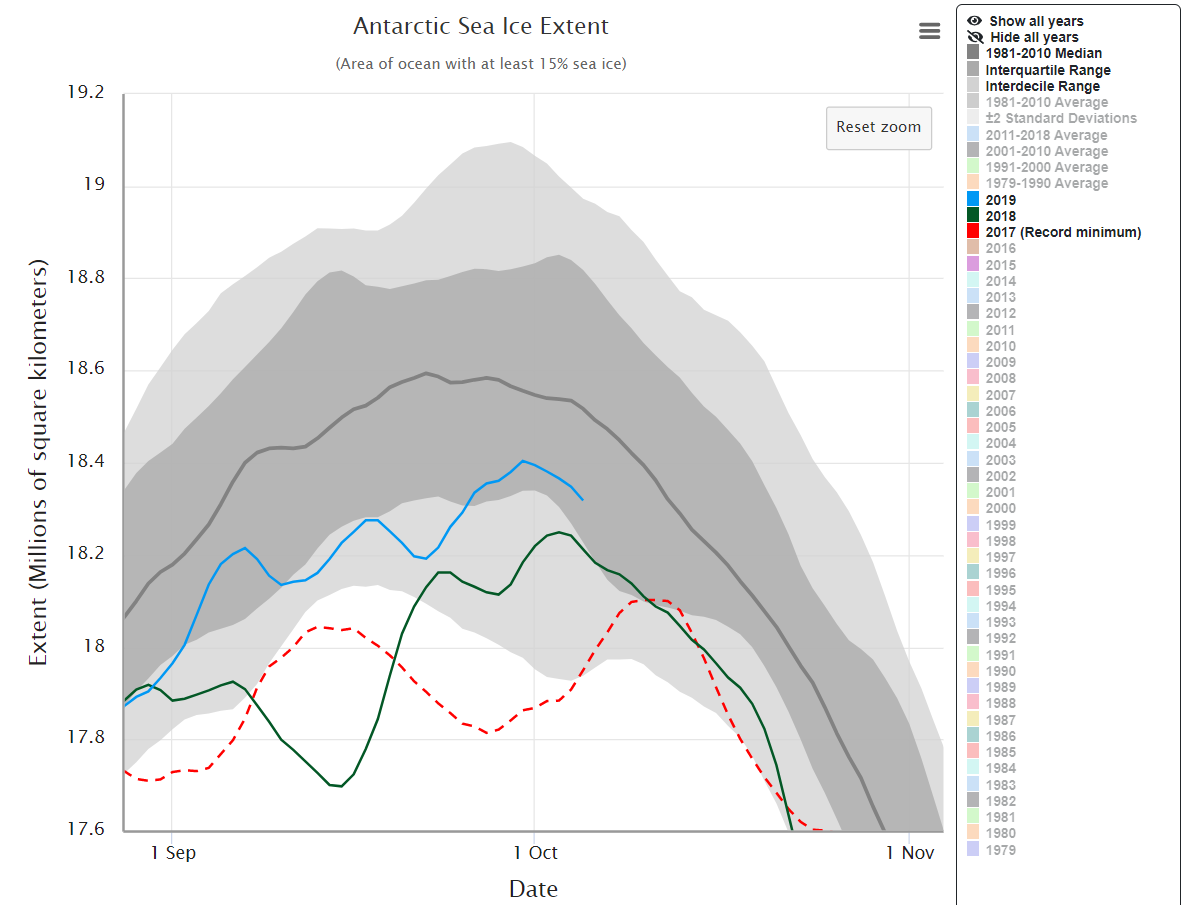
A marginally off topic excursion down under. The NSIDC 5 day average Antarctic sea extent looks to have peaked at 18.40 million km² on September 30th:
[Edit – October 7th]
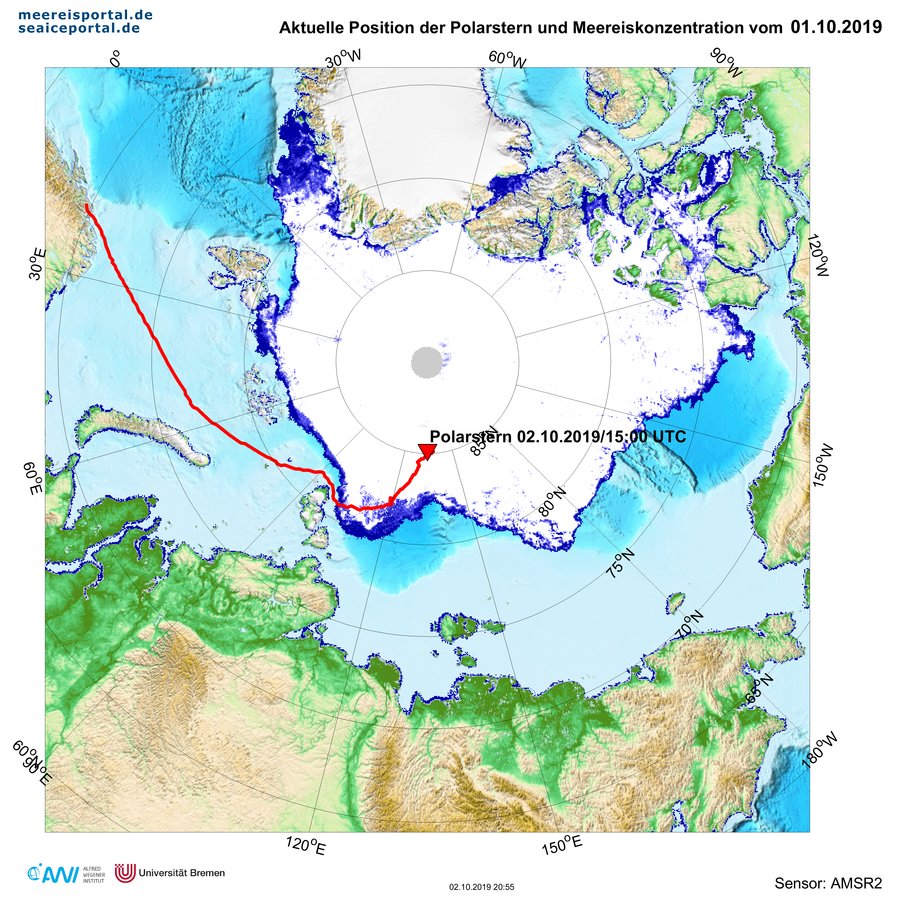
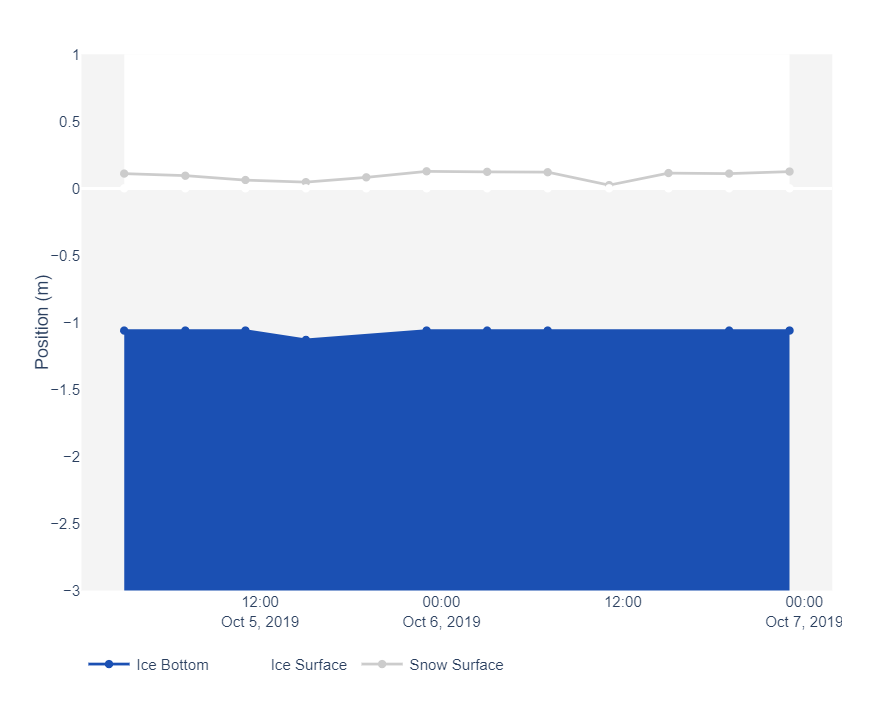
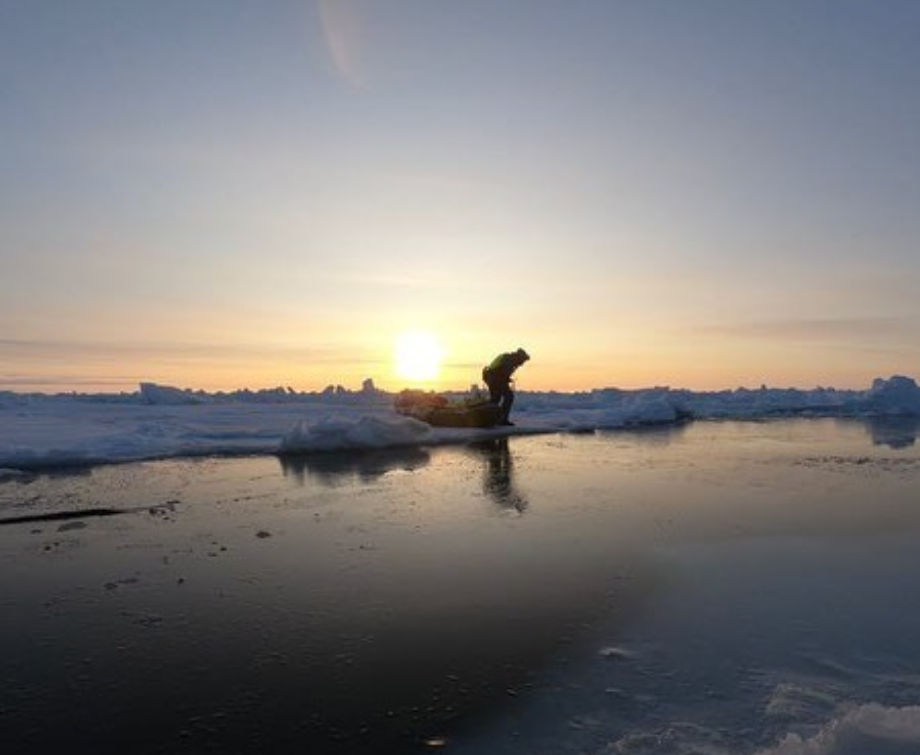
The first of the MOSAiC Expedition’s Ice Mass Balance buoys has been installed, presumably on the ice floe Polarstern is moored to. It reveals sea ice that is currently just over 1 meter thick with a sprinkling of snow on top:
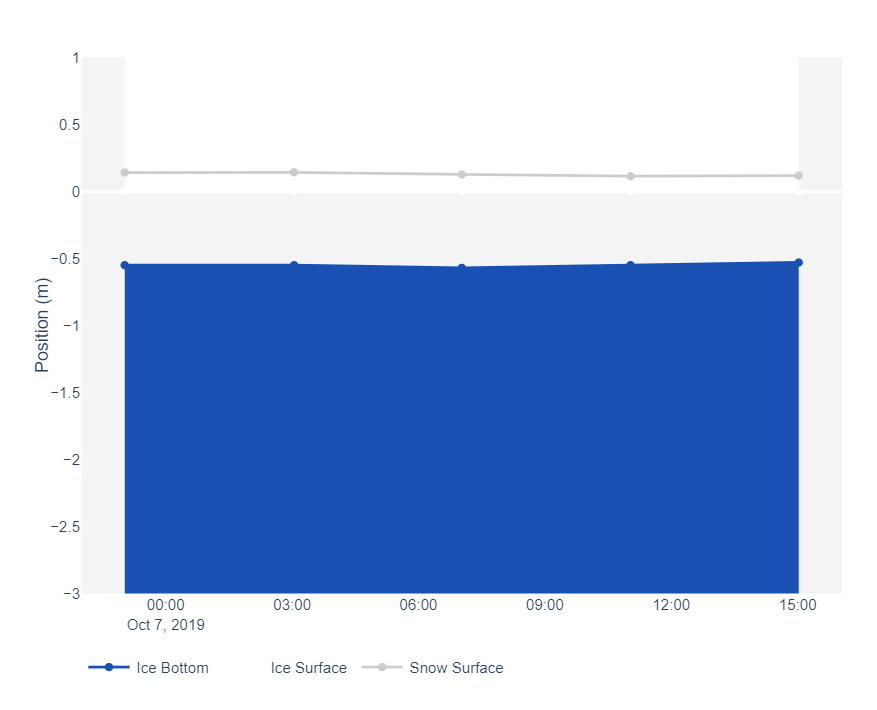
P.S MOSAiC IMB buoy #3 has gone live today too:
There’s currently only 0.5 meters of ice under this one.
[Edit – October 9th]
Here’s the latest annual PIOMAS “ice cube” animation from Andy Lee Robinson:
[Edit – October 10th]
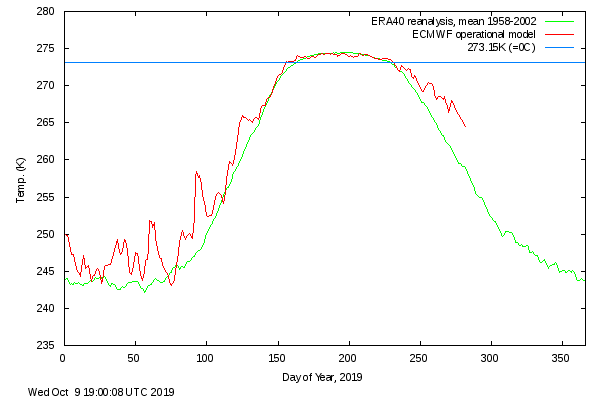
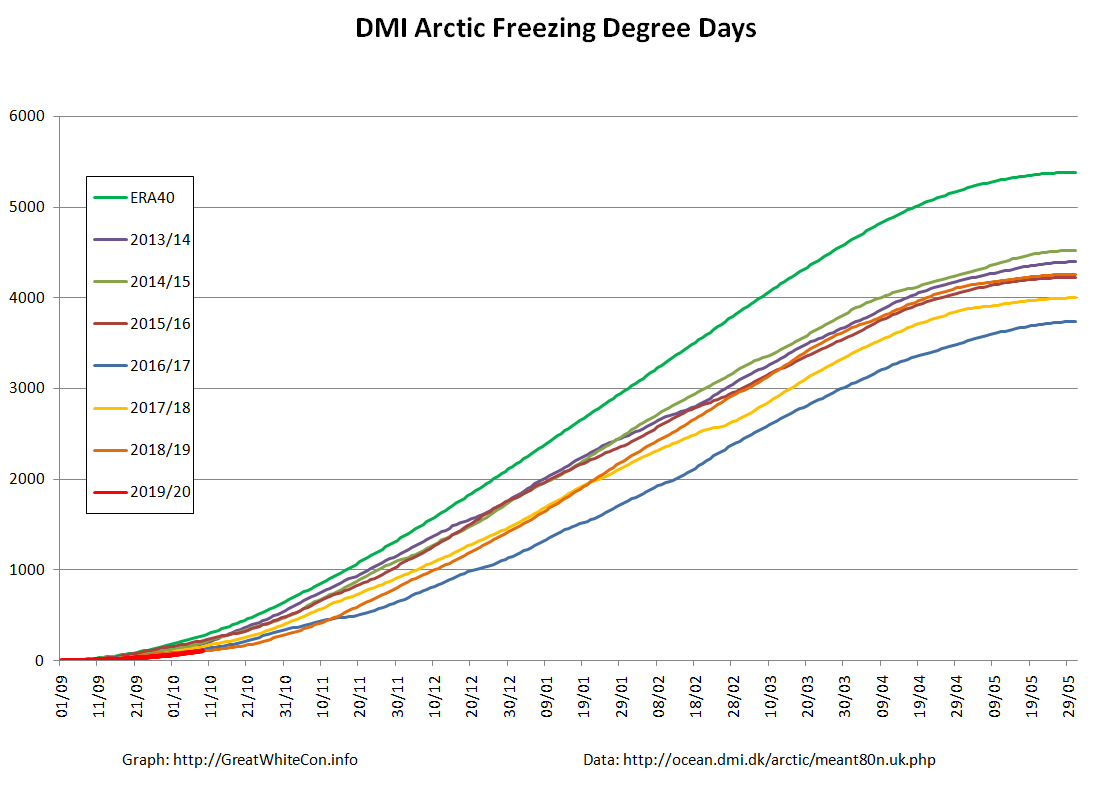
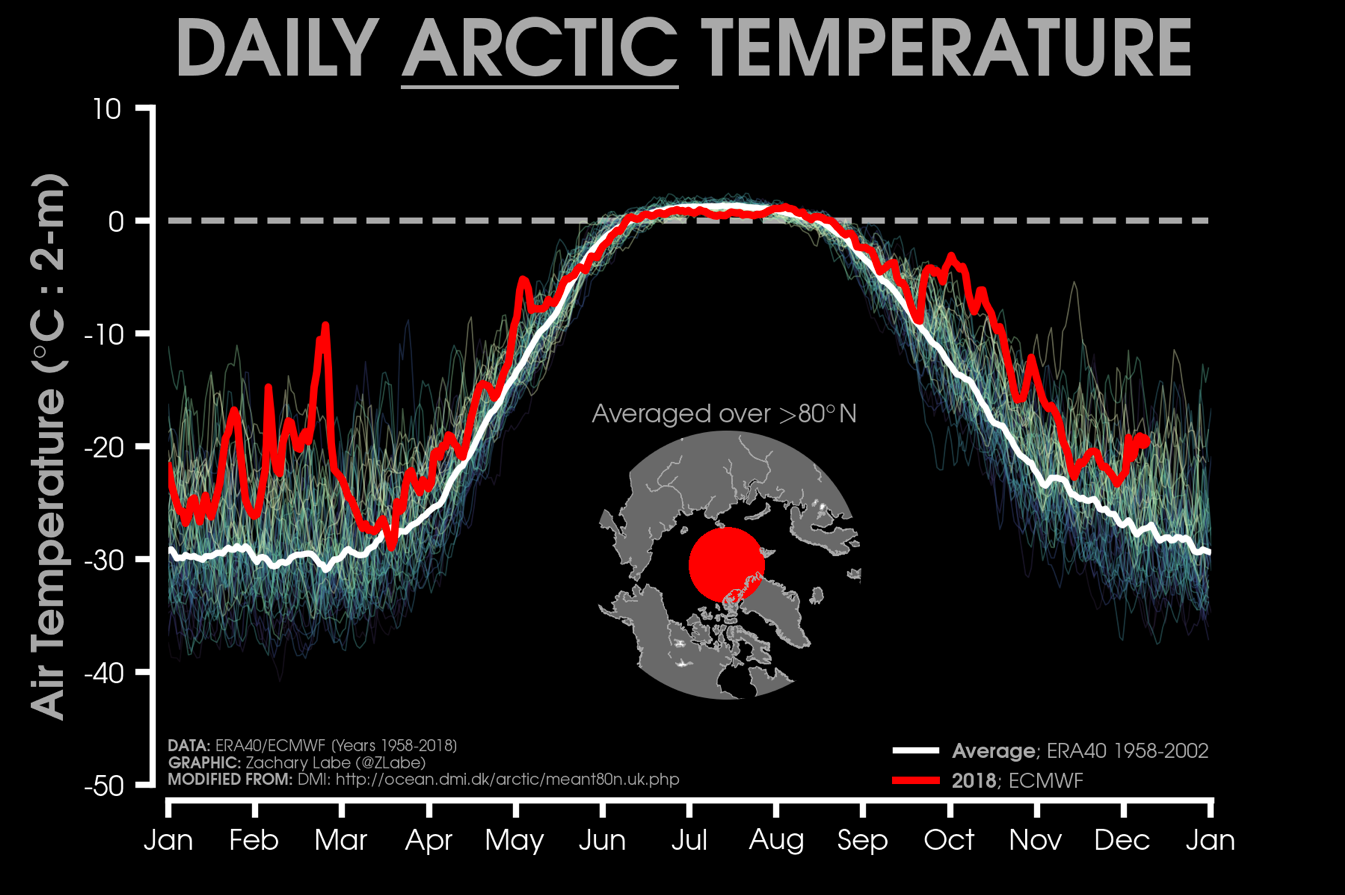
Here’s the latest DMI “high Arctic” temperature graph:
Needless to say that means the DMI Freezing Degrees Days graph is tracking the lowest readings in the DMI’s records:
[Edit – October 11th]
MOSAiC IMB buoy #2 has now been installed and is beaming back data:
The sea ice at this location is decidedly on the thin side at present. A mere 20 cm or thereabouts!
[Edit – October 12th]
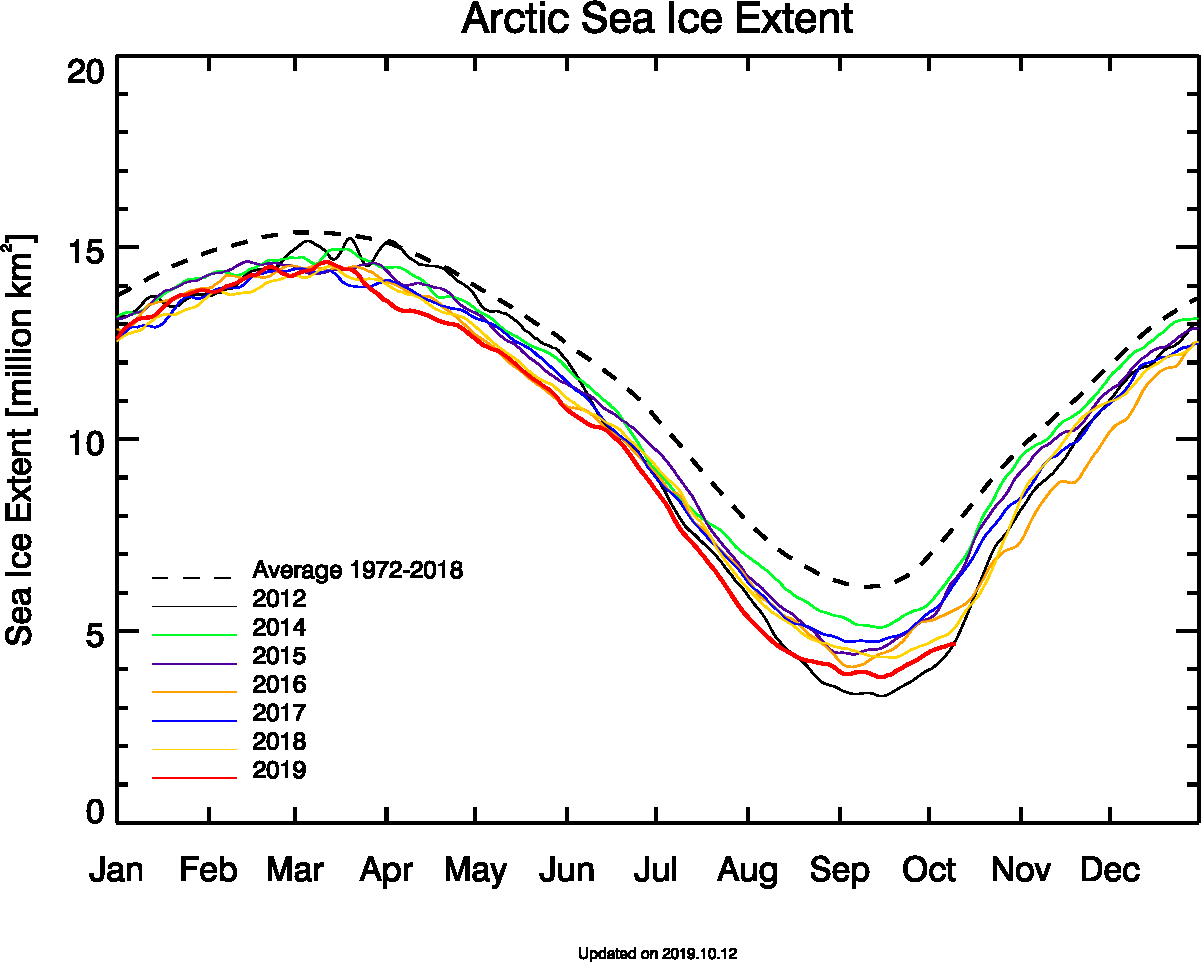
The JAXA ViSHOP web site is down at the moment, so by way of a change here is the University of Bremen’s AMSR2 based extent graph instead:
2019 Arctic sea ice is extent is now once again “lowest for the date” (since AMSRx satellite records began).
[Edit – October 14th]
The JAXA/ADS/ViSHOP web site is back online after being down over the weekend, presumably due to the effects of Typhoon Hagibis:
Sure enough the Japanese flavour of AMSR2 based extent is also now “lowest for the date”.
Mike and Borge’s current position was reported yesterday as: 89°35′51″N 140°30′32″E
[Edit – October 15th]
The latest SMOS Arctic sea ice “thinness” map shows sea ice starting to form on the shores of the Laptev Sea:
[Edit – October 16th]
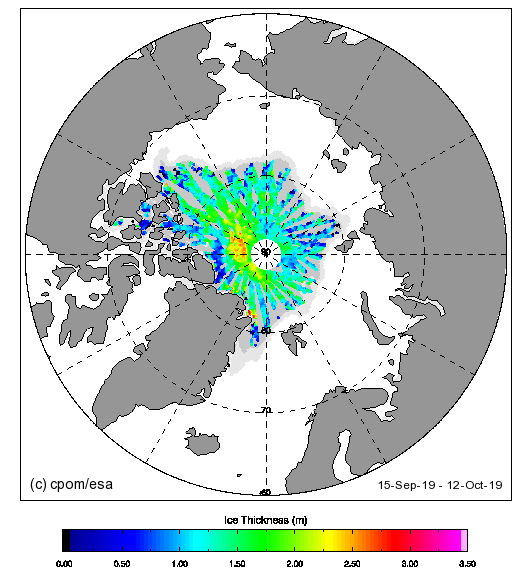
The Centre for Polar Observation and Monitoring (CPOM) have just published the first CryoSat-2 Arctic sea ice thickness map of the 2019/20 freezing season:
Note in particular the dark blue area north of the Canadian Arctic Archipelago.
[Edit – October 20th]
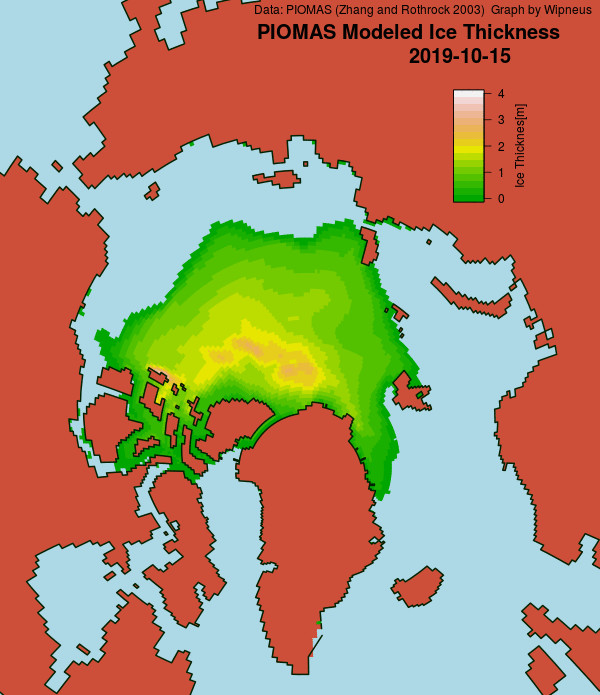
Wipneus has just crunched the October mid month PIOMAS numbers. Here are the results. Not only the modelled Arctic sea ice thickness map:
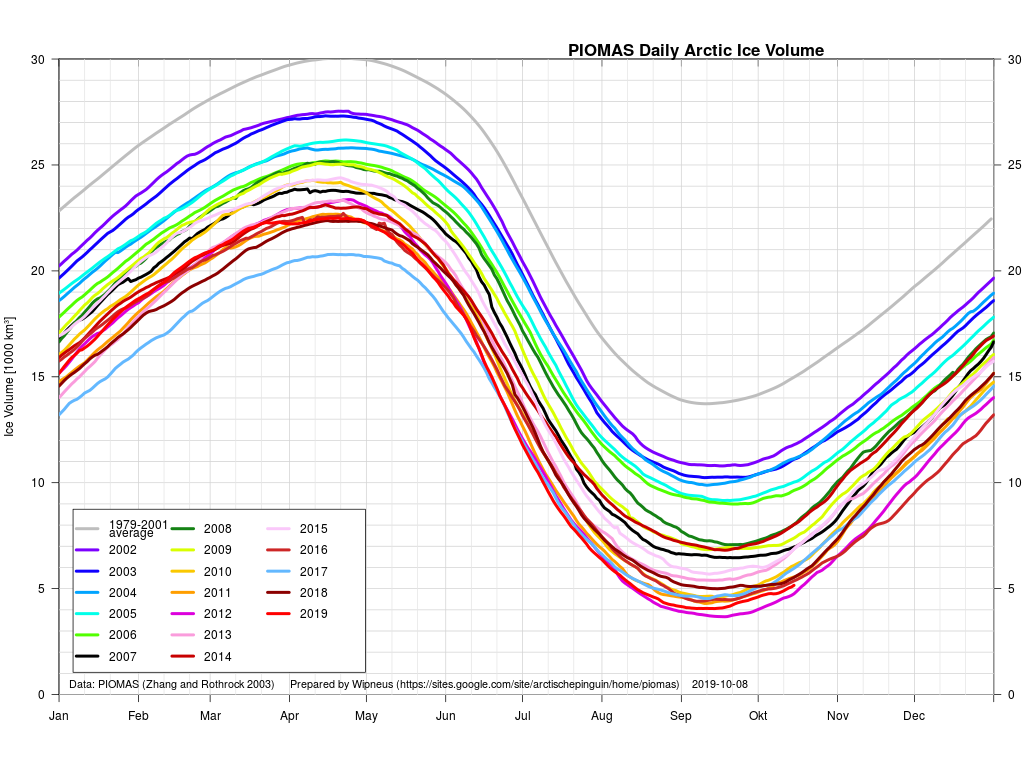
but also the Arctic sea ice volume graph:
[Edit – October 21st]
Over on Twitter Judah Cohen suggests that:
Maybe I will discuss more in the next blog but the #Arctic sea ice growth season on the North Pacific side of the Arctic is just nuts, like it is drunk! Looks unprecedented to me. This needs to be watched through the #winter. Already had 2 unprecedented winters in the Bering sea pic.twitter.com/sAVoZXgNAX
I have been trying to bring the implications of this to the attention of the denizens of Judith Curry’s “Climate Etc.” blog, thus far with remarkably little success! This is the gist of my argument:
“Summer solar heat absorption by the surface waters has increased fivefold over the same time period, chiefly because of reduced sea ice coverage.”
“The effects of an efficient local ice-albedo feedback are thus not confined to the surface ocean/sea ice heat budget but, in addition, lead to increased heat accumulation in the ocean interior that has consequences far beyond the summer season.”
“In the coming years, however, excess Beaufort Gyre halocline heat will give rise to enhanced upward heat fluxes year-round, creating compound effects on the system by slowing winter sea ice growth.”
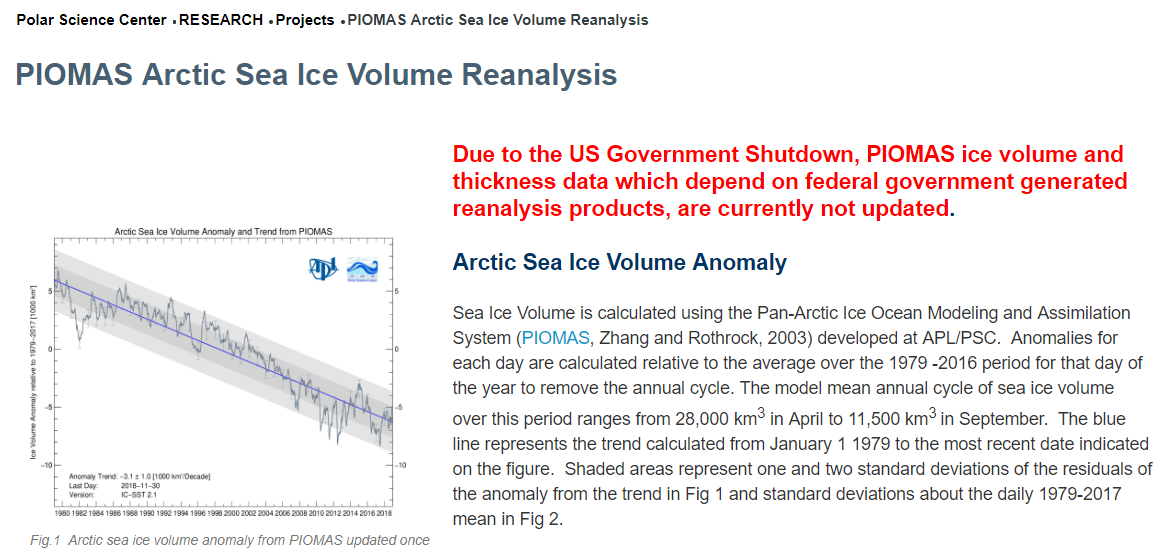
We generally write our periodic reports on the state of Arctic sea ice around the time the PIOMAS volume numbers are published. It seems as though we’ll have a long wait for that to happen at the moment though. According to The Economist today:
America’s government shutdown has become the longest in history. Hundreds of thousands of federal workers remain either stuck at home or forced to work without pay. To reopen the government President Donald Trump is demanding $5.7bn for his border wall. Nancy Pelosi, who presides over the most polarised House of Representatives in recent memory, does not want to give it to him.
Due to the US Government Shutdown, PIOMAS ice volume and thickness data which depend on federal government generated reanalysis products, are currently not updated.
Instead of PIOMAS, let’s start instead with the January 2019 edition of the National Snow and Ice Data Center’s Arctic Sea Ice News:
As 2018 came to a close, Arctic sea ice extent was tracking at its third lowest level in the satellite record, while sea ice in the Antarctic remained at historic lows. Slightly faster growth in the first few days of the new year, mostly in the Pacific sea ice areas, has the daily sea ice extent at fifth lowest as of this post.
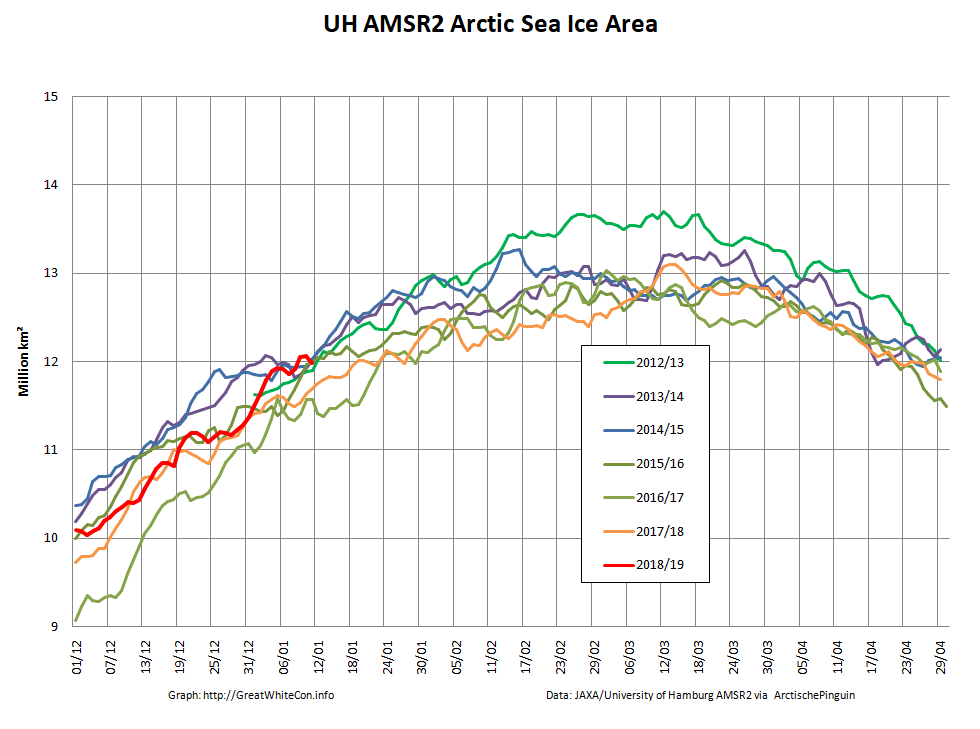
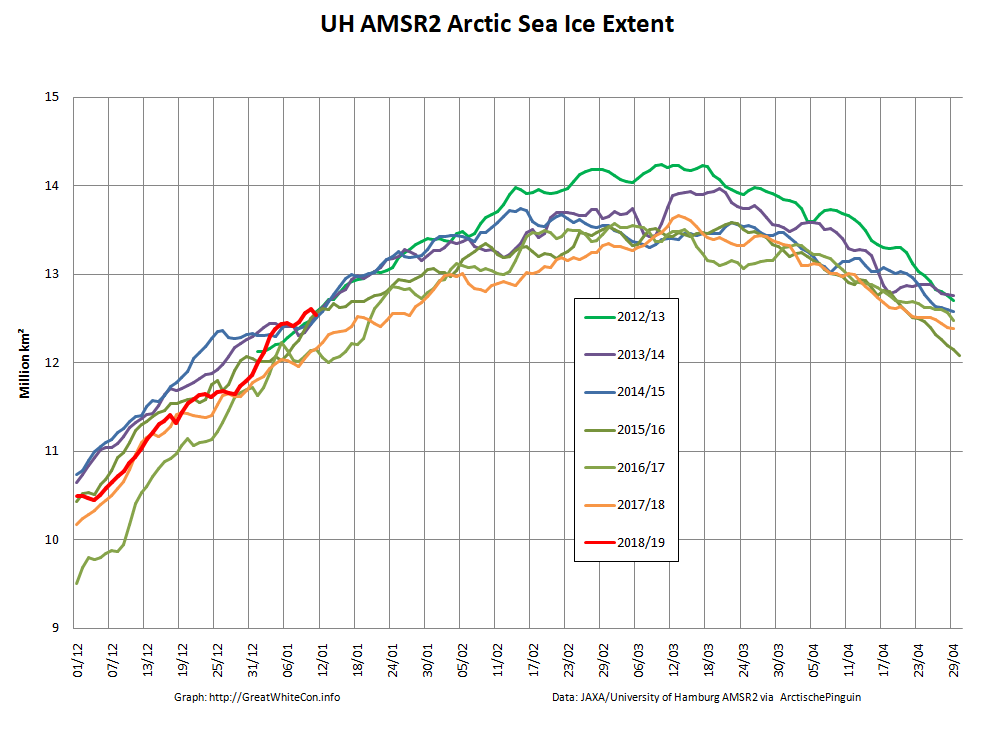
Now let’s take a look at our favourite high resolution AMSR2 area and extent metrics:
You can see that towards the end of December Arctic sea ice extent was verging on lowest for the date, since when it has risen quickly to reach highest for the date in the brief AMSR2 records a few days ago.
The NSIDC also mention the US Government shutdown:
Unfortunately, as a result of the partial government shutdown, we are unable to access the National Oceanic and Atmospheric Administration (NOAA) pages to retrieve information on atmospheric air temperatures and sea level pressure patterns. Instead, we turn to daily (2 meters above the surface) mean air temperatures north of 80 degrees North from the European Centre for Medium-Range Weather Forecasts (ECMWF) operational model. This analysis shows that air temperatures remained above the 1958 to 2002 average for all of December.
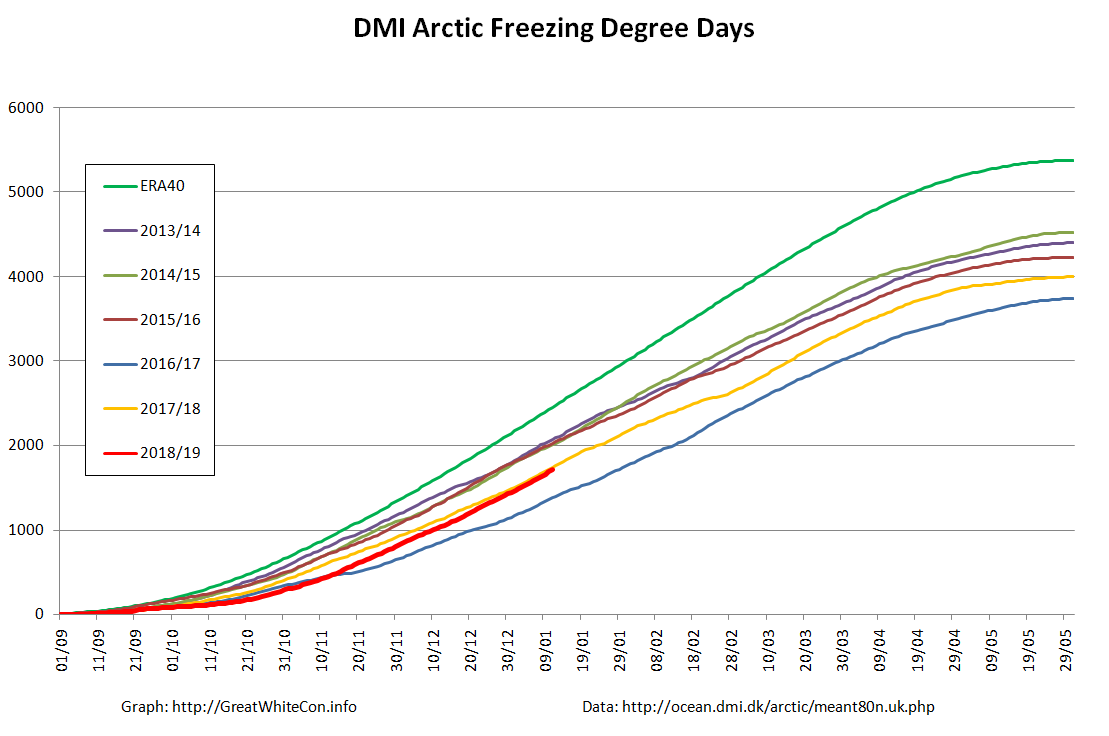
That brings us on to our Arctic freezing degree days graph, based on DMI data:
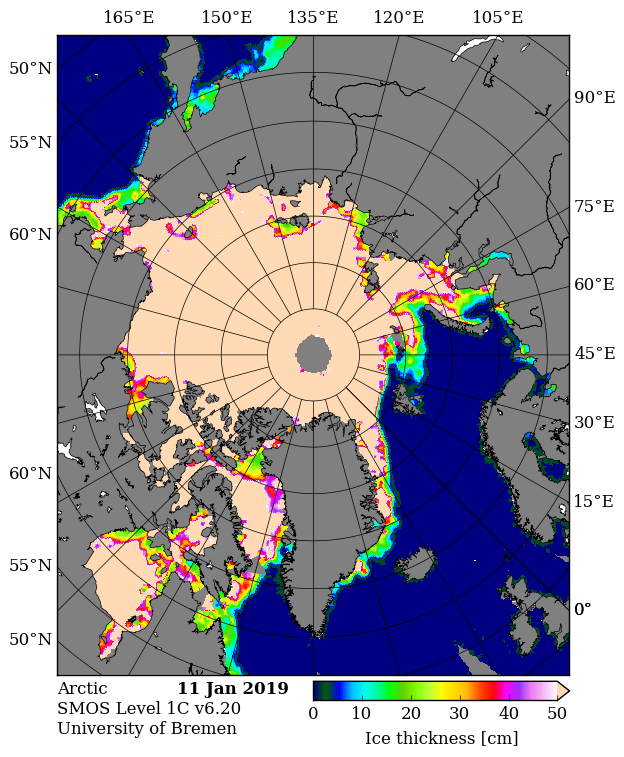
After a very slow start to the freezing season the FDD numbers are now vying for second place with last year, behind the astonishingly warm winter of 2016/17. In the absence of the PIOMAS volume numbers we can at least take a look at sea ice thickness. Here’s CryoSat-2:
All those sources seem to be agreed that large areas of both the Barents and Kara Seas are currently covered by young thin ice. Finally, for the moment at least, let’s take a look at some extracts from the NSIDC’s review of 2018:
January 2018 began the year with record low sea ice extents for the Arctic as a whole.
The seasonal maximum, reached on March 17, 2018, was the second lowest in the satellite record. While low extent persisted through April and May, sea ice loss during early summer was unremarkable despite above average 925 hPa air temperatures over the Arctic Ocean and Eurasia.
Air temperatures over the Arctic Ocean in July were below average, followed by above average temperatures in August. In fact, on average, August temperatures were higher than July temperatures in 2018. This is highly unusual in the Arctic and something not seen in at least 40 years.
The September 2018 seasonal minimum extent ended up slightly above the long-term linear trend line, tying with 2008 for the sixth lowest in the satellite record. After the minimum, the ocean was slow to freeze up, and October sea ice extent ended up as the third lowest. However, ice growth was very rapid in November, such that November 2018 extent approached the interquartile range of the 1981 to 2010 median. Nevertheless, large amounts of open water remained in the Barents and Chukchi Seas. By the end of December, ice conditions in the Chukchi Sea were back to average, while extent remained unusually low in the Barents Sea.
Coverage of old ice (greater than 4 years old) over the Arctic continued to decline. Such old ice covers only 5 percent of the area it used to in 1980s.
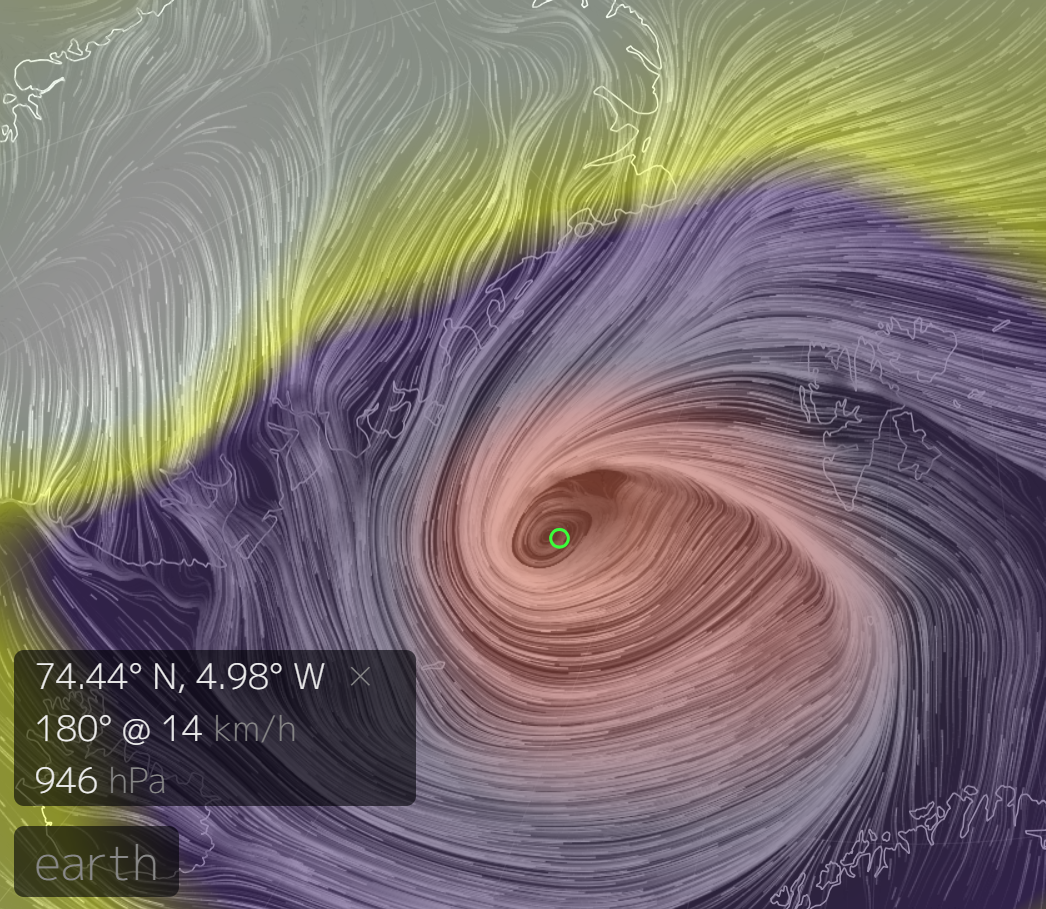
[Edit – January 13th]
Arctic sea ice area and extent have both been falling over the last few days, possibly as a result of the recent cyclone which created strong northerly winds in the Fram Strait. This is from Earth at 09:00 UTC on January 10th, showing a MSLP of 946 hPa:
Here’s what used to be referred to as JAXA extent:
In certain quarters it is being claimed in slightly strange English that:
The British Navy takes part in ICEX exercises that take place every two years and last for several weeks. Royal Navy submarine HMS Trenchant broke through the Arctic ice about seven days ago to join two US submarines for the exercise. At the same time, US submarines Hartford and Connecticut were stuck in the Arctic ice as they were training an attack on Russia. According to the legend of the exercises, the US submarines were supposed to surface and strike conditional targets in Russia, but the thick ice prevented them from fulfilling the scenario of the exercise.
Royal Navy submarine HMS Trenchant has broken through the metre-thick ice of the Arctic Ocean to join two US boats on major exercise.
Ice Exercise 18 (ICEX) is a series of demanding trials in the frigid climate of the Arctic Circle, designed to test submariners’ skills in operating under the Arctic ice cap.
HMS Trenchant joins US submarines USS Connecticut and USS Hartford for the drills, co-ordinated by the US Navy’s Arctic Submarine Laboratory.
This combined team of military staff and scientists run the testing schedule from an ice camp established on an ice floe in the Arctic Ocean, north of Alaska.
Here is a video recording of HMS Trenchant getting “stuck in the Arctic ice”:
https://youtu.be/3EF3_plp8NQ
Here are some US Navy videos that reveal exactly how USS Connecticut and USS Hartford also became “stuck in the Arctic ice”:
Ice Camp Skate is a temporary ice camp that was established on a sheet of ice in the Arctic Ocean, known as an ice floe. Skate will serve as a temporary command center for conducting submarine operations, including under-ice navigation and torpedo exercises. The camp consists of shelters, a command center, and infrastructure to safely house and support more than 50 personnel at any one time.
The camp gets its namesake from USS Skate, the first submarine to surface through open water surrounded by ice in 1958, and the first submarine to surface through the Arctic ice at the North Pole in March 1959. Since the success of Skate’s surfacing, Arctic operations have been a crucial part of the missions conducted by nuclear submarines.
For more than 70 years, submarines have conducted under-ice operations in the Arctic regions in support of interfleet transit, training, cooperative allied engagements and routine operations.
The U.S. submarine force has completed more than 27 Arctic exercises.
[Edit – April 10th]
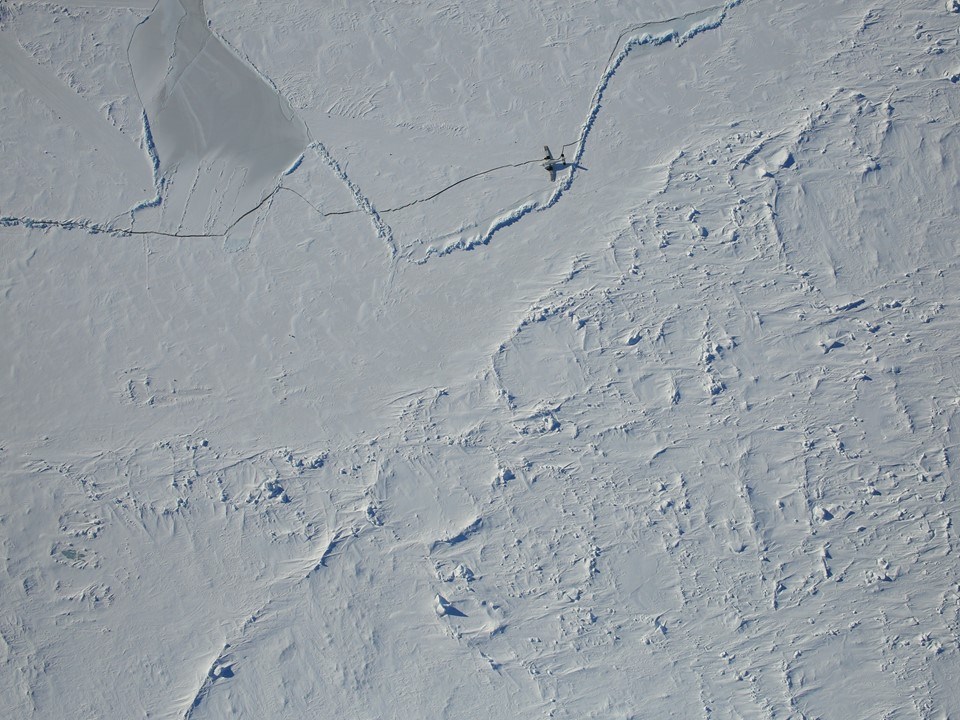
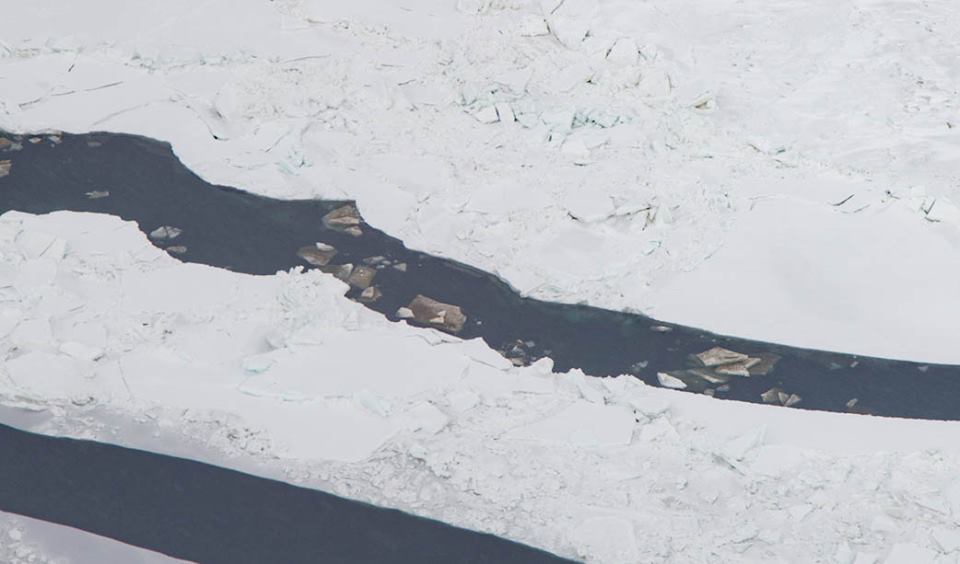
NASA’s Operation IceBridge have released some images of the now abandoned ICEX 2018 site on their Facebook page. They include a damaged and apparently abandoned Twin Otter aircraft:
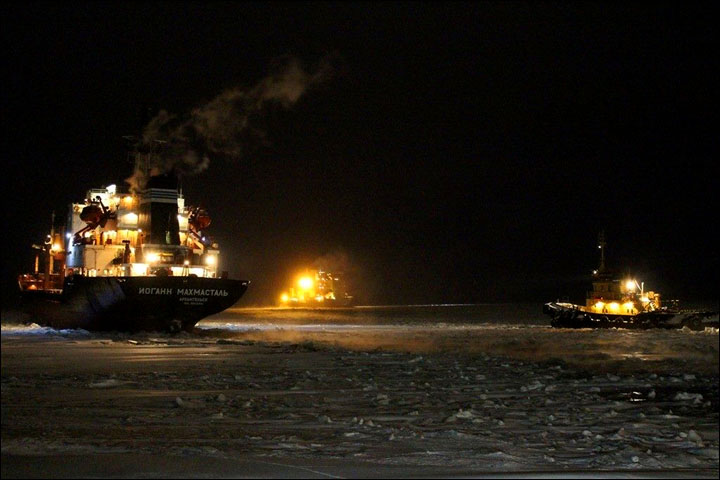
Yesterday I found myself in conversation with Nigel and “Steve” on Twitter about NOAA’s recent report on Arctic temperatures and the seemingly unrelated topic of Russian icebreakers. Apparently Nigel has been perusing “Steve’s” recent railing against NOAA’s “Red Hot Arctic” in 2016 on his “Deplorable Client Science” blog. Here’s how my conversation with Nigel went:
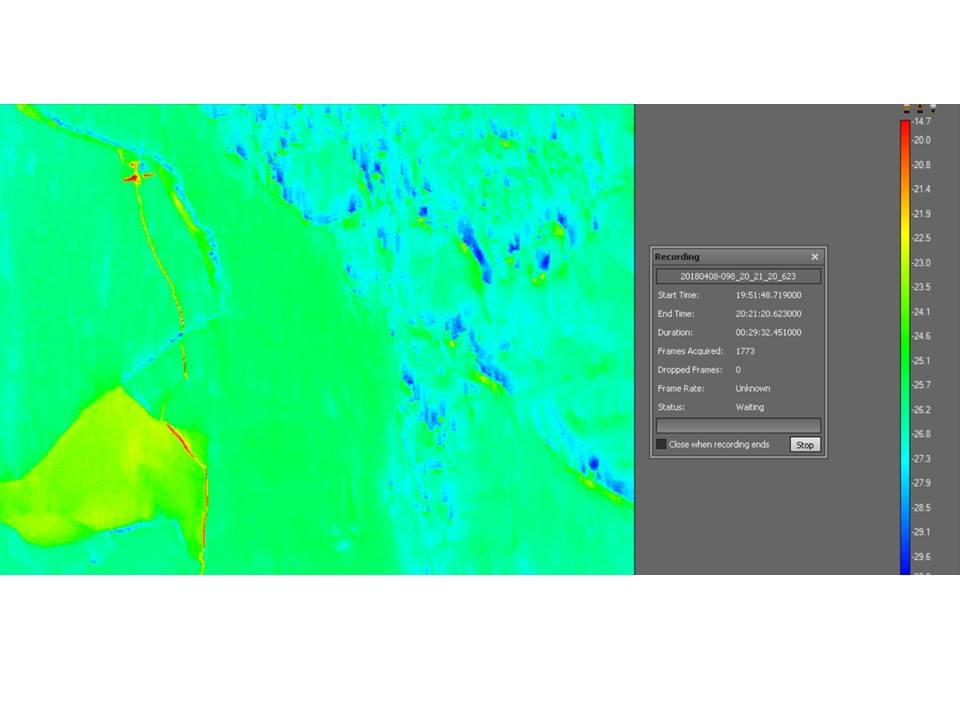
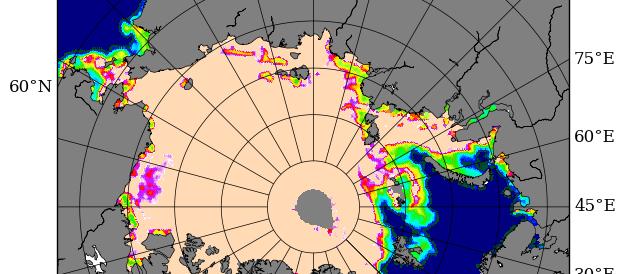
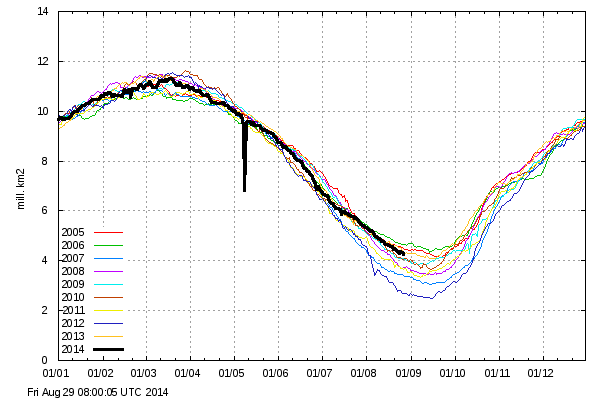
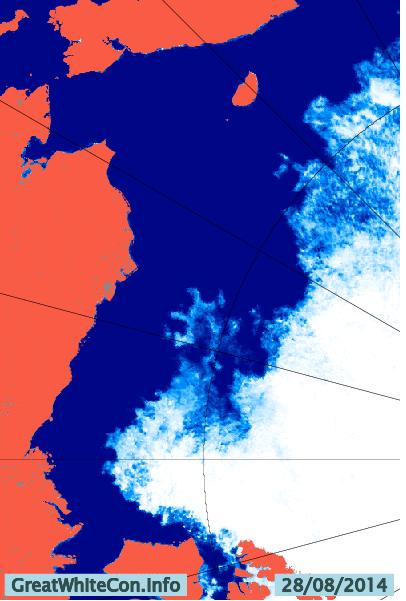
It appears that Nigel believes that an image like this:
is far more relevant than an image like this:
when it comes to determining the thickness of “the ice up in the north of Russia”!
Then of course there was my “conversation” with “Steve” after he butted in on my “debate” with Nigel. It went like this:
Just like Nigel, “Steve” still hasn’t got around to commenting on my map of Arctic sea thickness or explaining the significance of 2 Russian icebreakers NOT stuck in the East Siberian Sea.
The Journal of Alternative Facts article guidelines insist on peer review by politicians, so I’ve invited a few local, national and international politicians to comment on my draft paper:
CryoSat-2 has burst back into life after its summer break. Here is what it reveals about Arctic sea ice thickness at the moment:
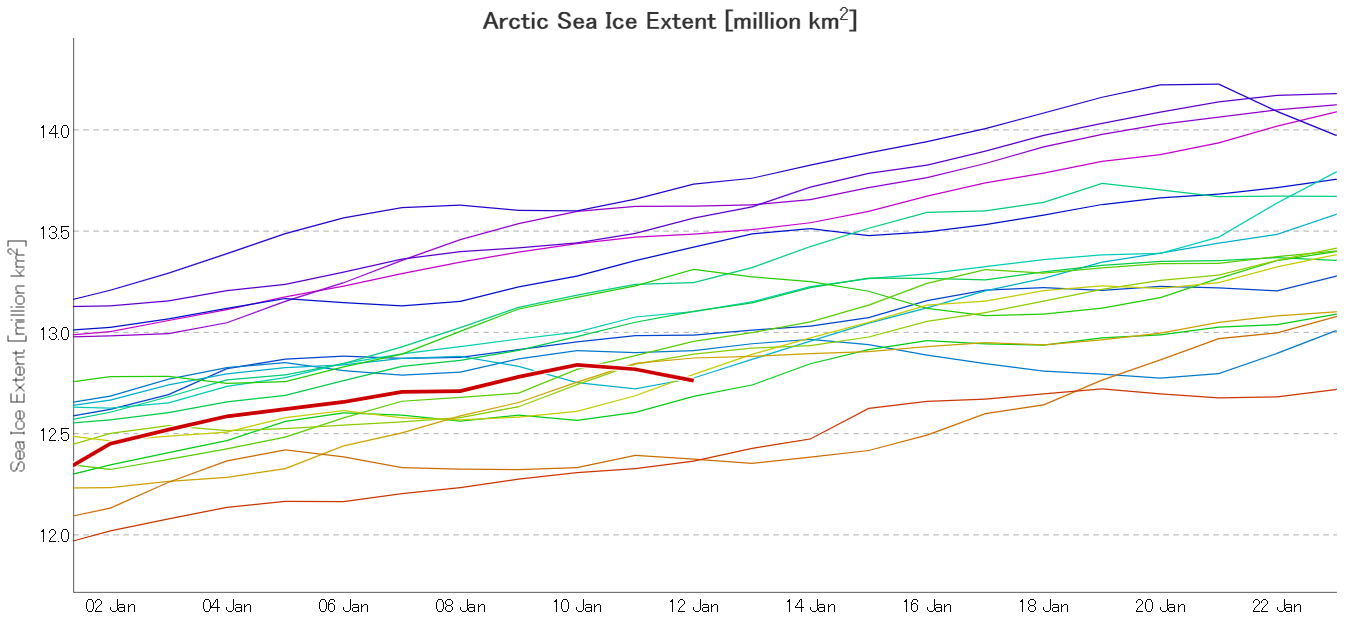
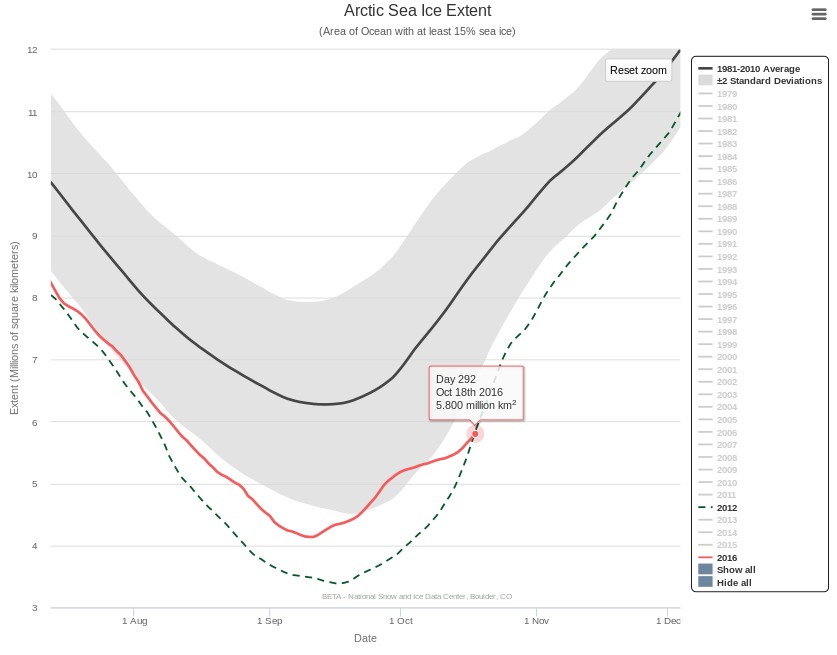
Perhaps not entirely coincidentally, the NSIDC 5 day average Arctic sea ice extent is once again less than on the same day of 2012, the year of the “record melt”:
Needless to say we are unimpressed by the following explanation:
Them:
The Danish Meteorological Institute shows a 63% increase in Arctic sea ice extent since the same date in 2012, and an increase of 76% since the 2012 summer minimum. Current extent is 4.4 million km², up from 2.7 million km² on August 28, 2012.
My methodology is similar numerically to DMI’s, I used maps from the Japan Aerospace Exploration Agency to generate the map below. Green shows ice gain since the same date in 2012, and red shows ice loss. My calculation shows a 64% increase in ice, almost identical to the calculations from DMI.
A favorite comment from alarmists is “the increase in ice extent is meaningless, because the ice is getting thinner“
They have it exactly backwards. The reason why ice extent is up, is because the ice is thicker.
Mind you I’m not the one proudly proclaiming “ice extent is up, because the ice is thicker.”. Steve/Tony is, but for some strange reason he provides visualisations of extent and age but not thickness!
Them:
Lets put it another way. Age of the ice is a proxy for ice thickness. But, if you don’t believe in proxies, just tell us.
Us:
Les – If you believe in proxies then PIOMAS Arctic sea ice volume for April 2014 was less than April 2012.
If instead you prefer the evidence of your own eyes then perhaps you can explain where all that red stuff in the Beaufort Sea in Steve/Tony’s animation has gone?
If “older, thicker ice is moving towards Alaska” then it looks like it’s melting there, not “accumulating”.
Them:
Mr. Hunt’s evidence…..
“NRL does not warrant or represent this INFORMATION is fit for any particular purpose,”
Us:
Anything/Gail/Sophie – Do you have any idea what this is?
Them:
Here’s a quick summary for people who aren’t following.
SG makes a post comparing 2012 and 2014. Jim argues with SG’s claim of thicker ice by comparing 2013 extent to 2014. When that gets called out, he shows the same silly 2014 plot that has no 2012 plot to compare to…still no valid comparison. After some back-and-forths and tangents, he brings up PIOMAS. When asked to compare thickness in PIOMAS 2012/2014, he avoids the question (twice).
Is there a single metric out there showing 2014 to be worse than 2012?
– Scott
Us:
Here’s a quick summary for you Scott:
Where’s all the “older, thicker ice in the western Arctic” that SG keeps referring to hiding?
Them:
Nice image, Jim. You have chosen a metric. So that’s half the story. Where’s the 2012 equivalent of that image so we can see if SG is wrong about 2014 vs 2012?
-Scott
Us:
Thank you for your kind words Scott.
I haven’t “chosen a metric”. I have nonetheless already shown you one comparison with 2013, using TH’s very own “metric”. To complete the story, and at the risk of repeating myself once again, perhaps you can explain where all the “older, thicker ice accumulating on the Pacific side” that TH keeps referring to is hiding?
Them:
We’ll keep you Posted!
This website uses cookies to improve your experience. We'll assume you're ok with this, but you can opt-out if you wish. Cookie settingsACCEPT
Privacy & Cookies Policy
Privacy Overview
This website uses cookies to improve your experience while you navigate through the website. Out of these, the cookies that are categorized as necessary are stored on your browser as they are essential for the working of basic functionalities of the website. We also use third-party cookies that help us analyze and understand how you use this website. These cookies will be stored in your browser only with your consent. You also have the option to opt-out of these cookies. But opting out of some of these cookies may affect your browsing experience.
Necessary cookies are absolutely essential for the website to function properly. This category only includes cookies that ensures basic functionalities and security features of the website. These cookies do not store any personal information.
Any cookies that may not be particularly necessary for the website to function and is used specifically to collect user personal data via analytics, ads, other embedded contents are termed as non-necessary cookies. It is mandatory to procure user consent prior to running these cookies on your website.


