Category Archives: Concentration

Melt Pond May 2019

A couple of years ago I was asked to provide “a handful of things [you] will be keeping an eye on over the next few months to judge how ‘good’ or ‘bad’ the melt is going?”

My answer was, and remains:

5 fingers worth to start with? Not necessarily in order of time or importance!

1. How soon melt ponds and/or open water hang around in the Beaufort Sea this year. Things started very early [in 2016]:

https://GreatWhiteCon.info/2016/04/the-beaufort-gyre-goes-into-overdrive/

2. Ditto the Bering Strait and Chukchi Sea

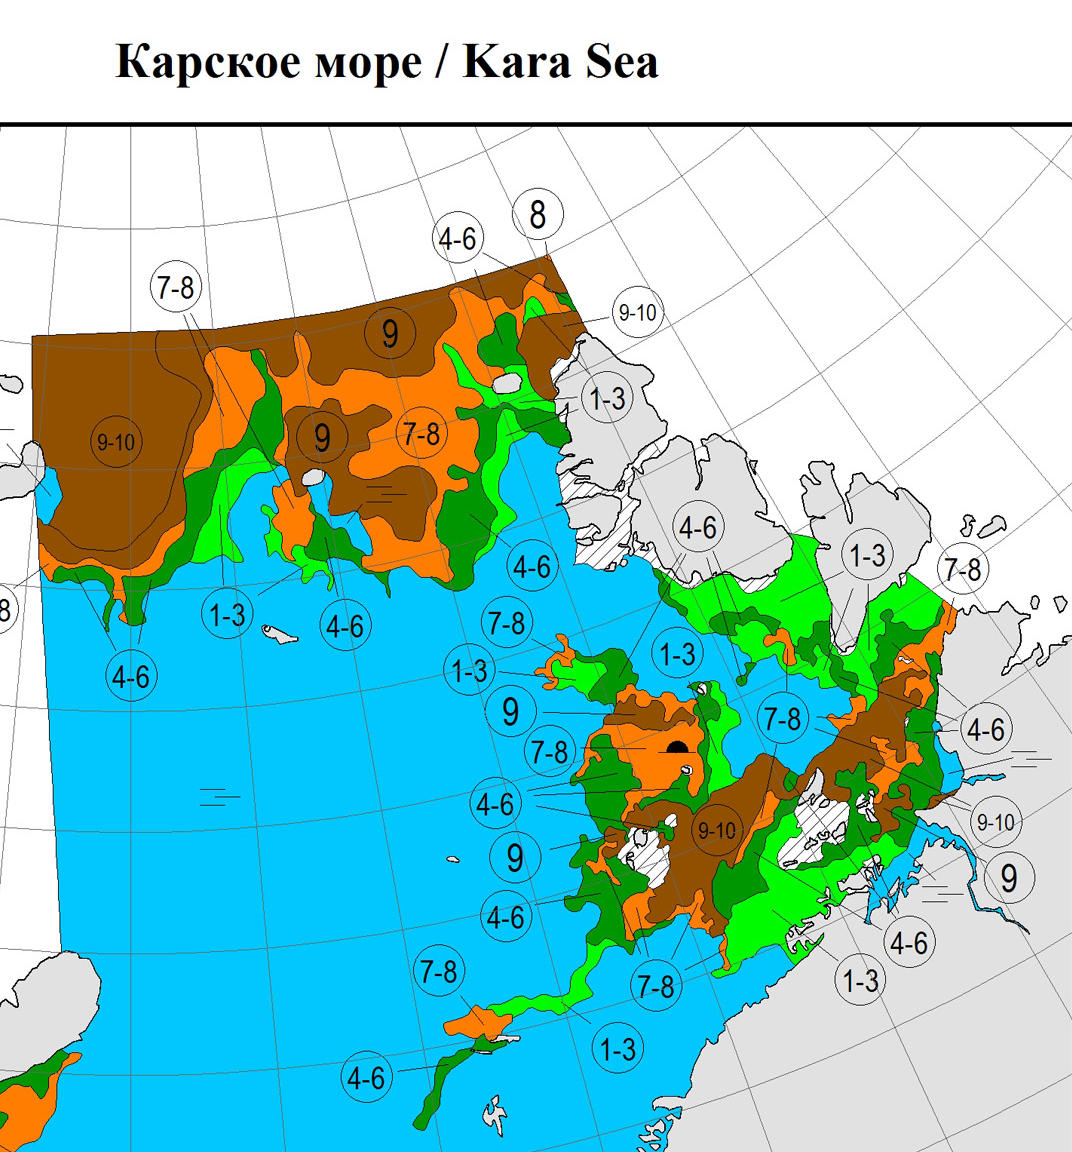
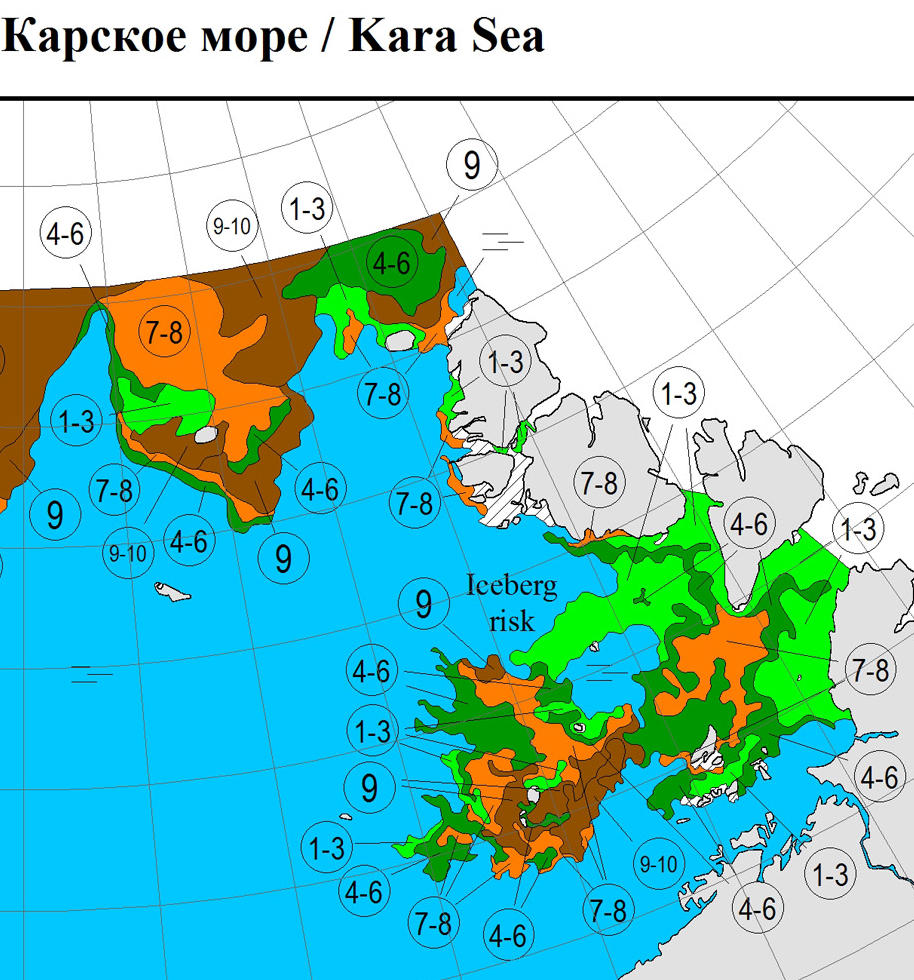
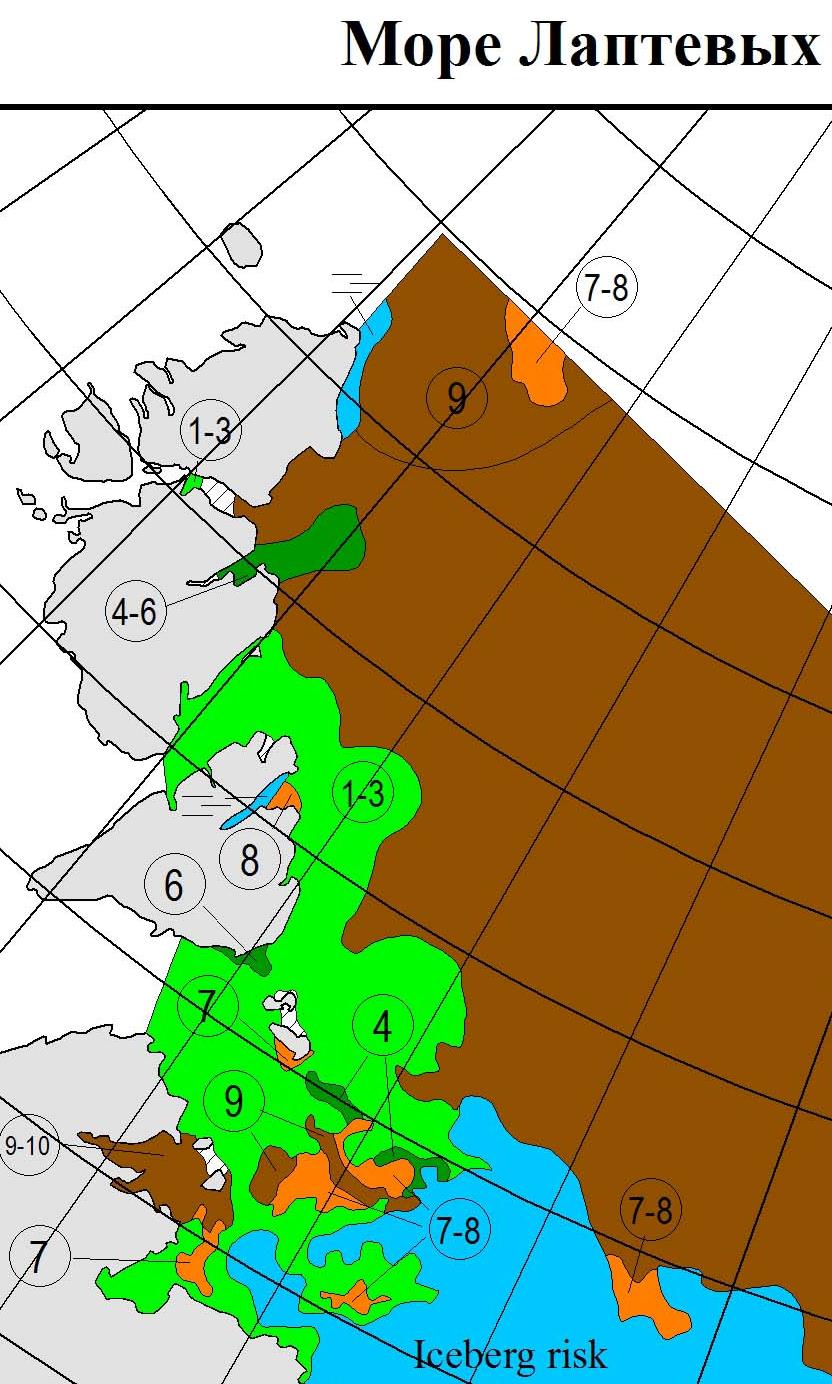
3. Ditto the Laptev and East Siberian Seas

4. How many (and how deep, warm, wet) spring cyclones spin around the Arctic Ocean

5. How the snow melt progresses across Canada, Alaska and Siberia

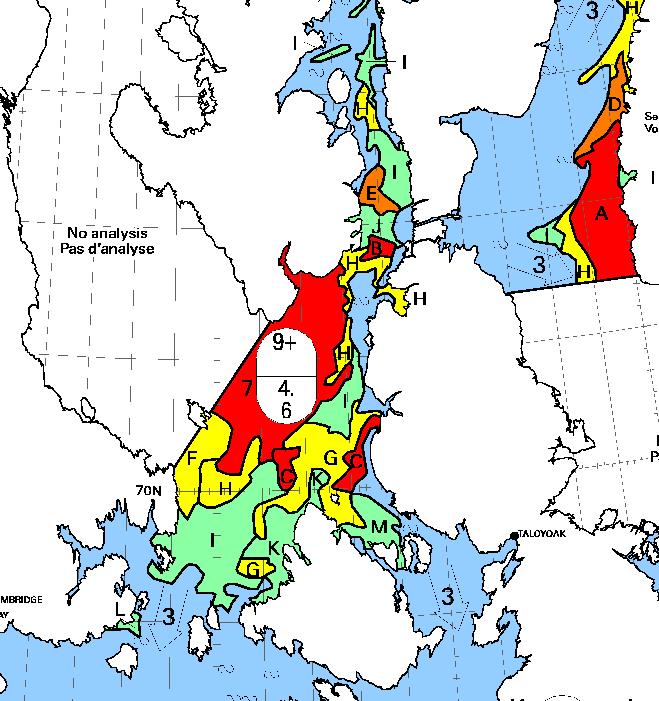
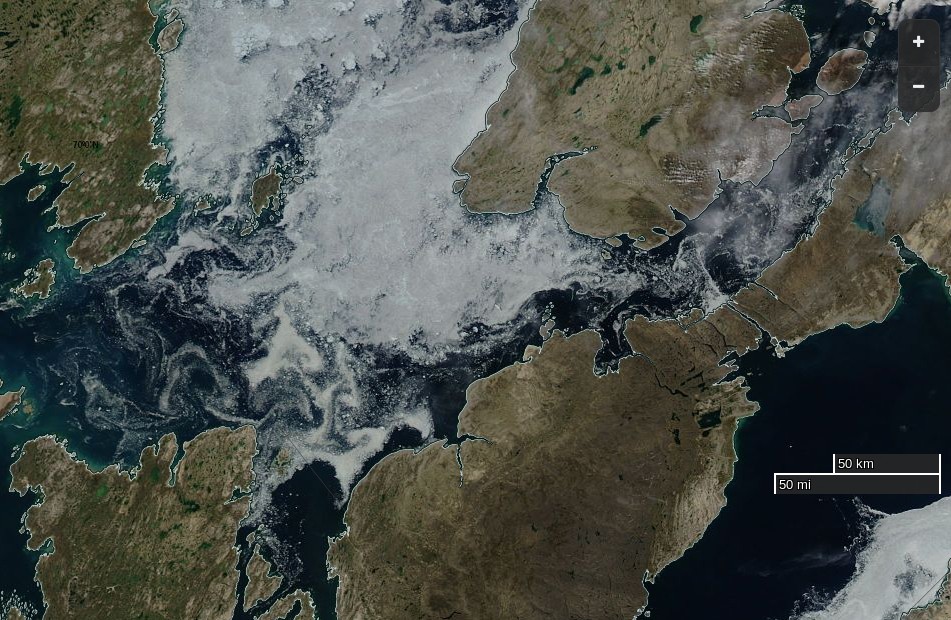
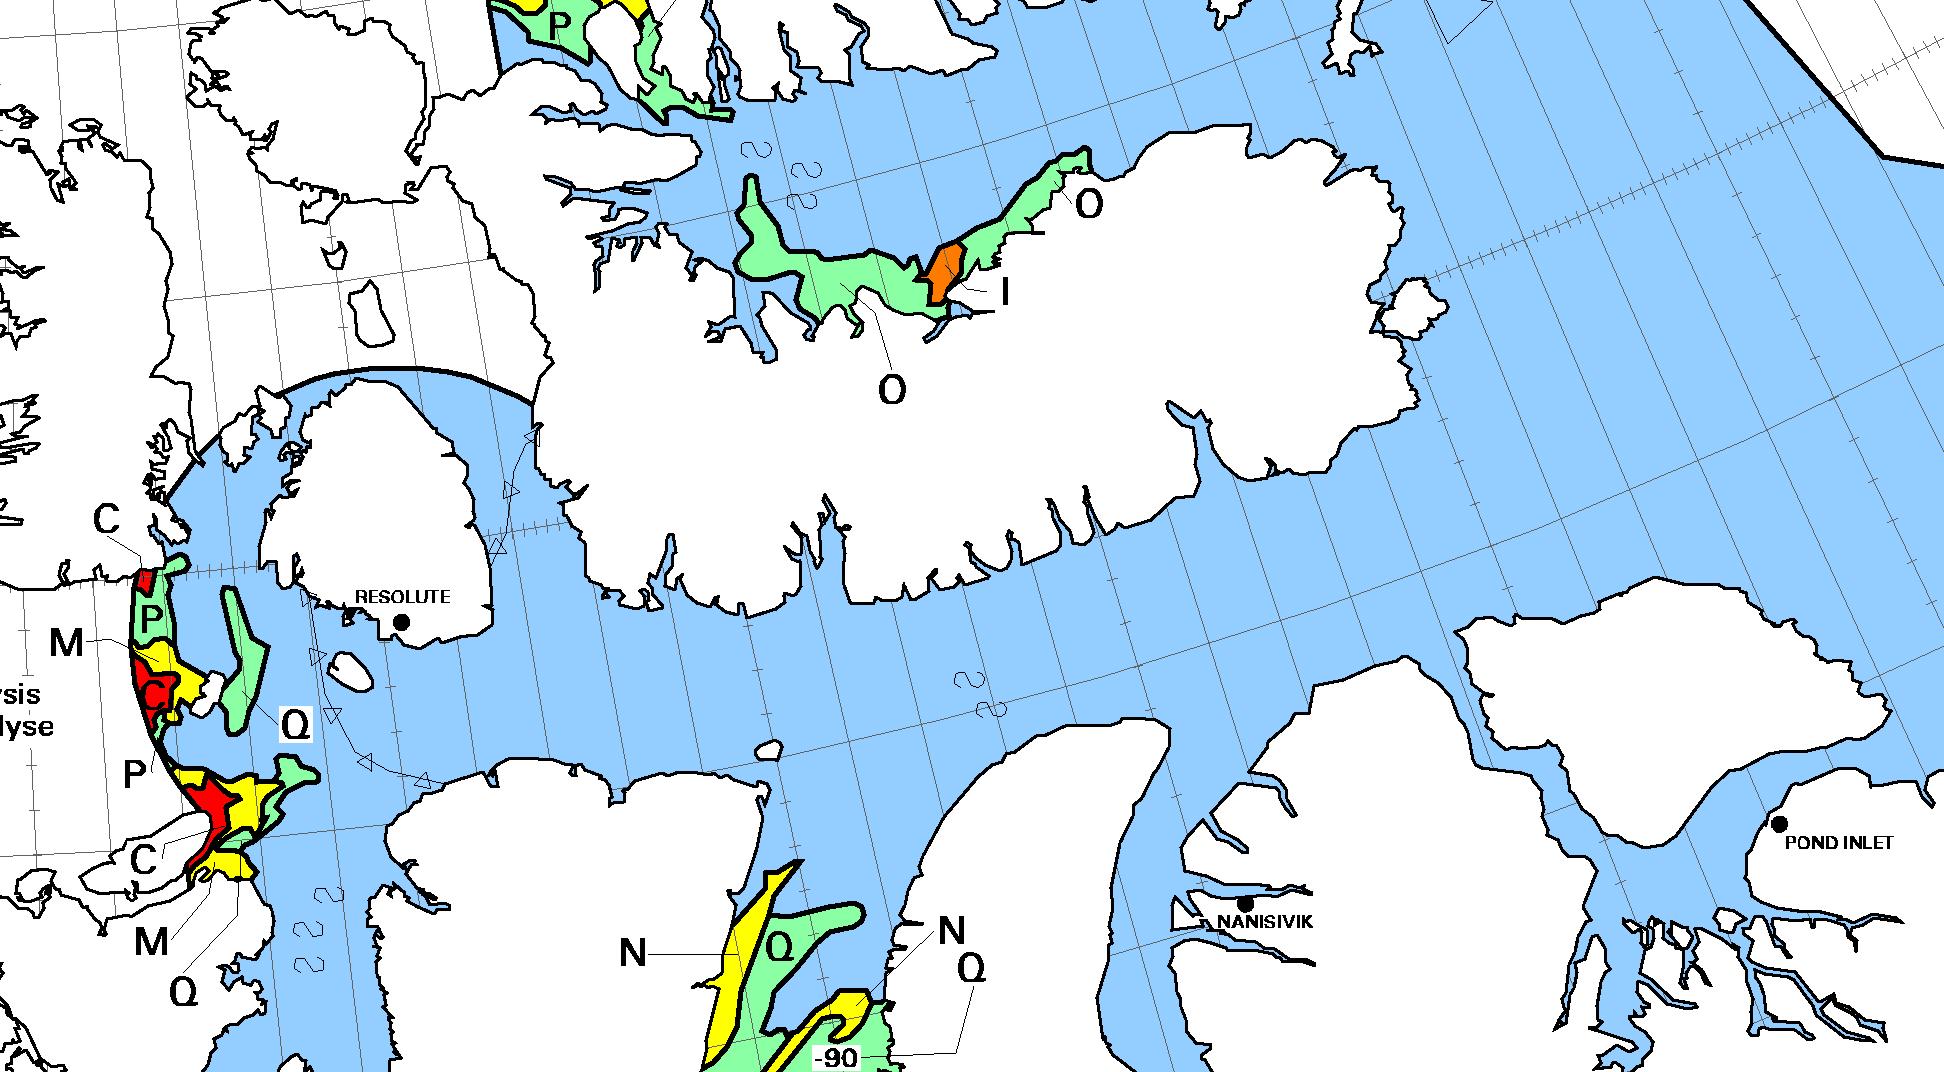
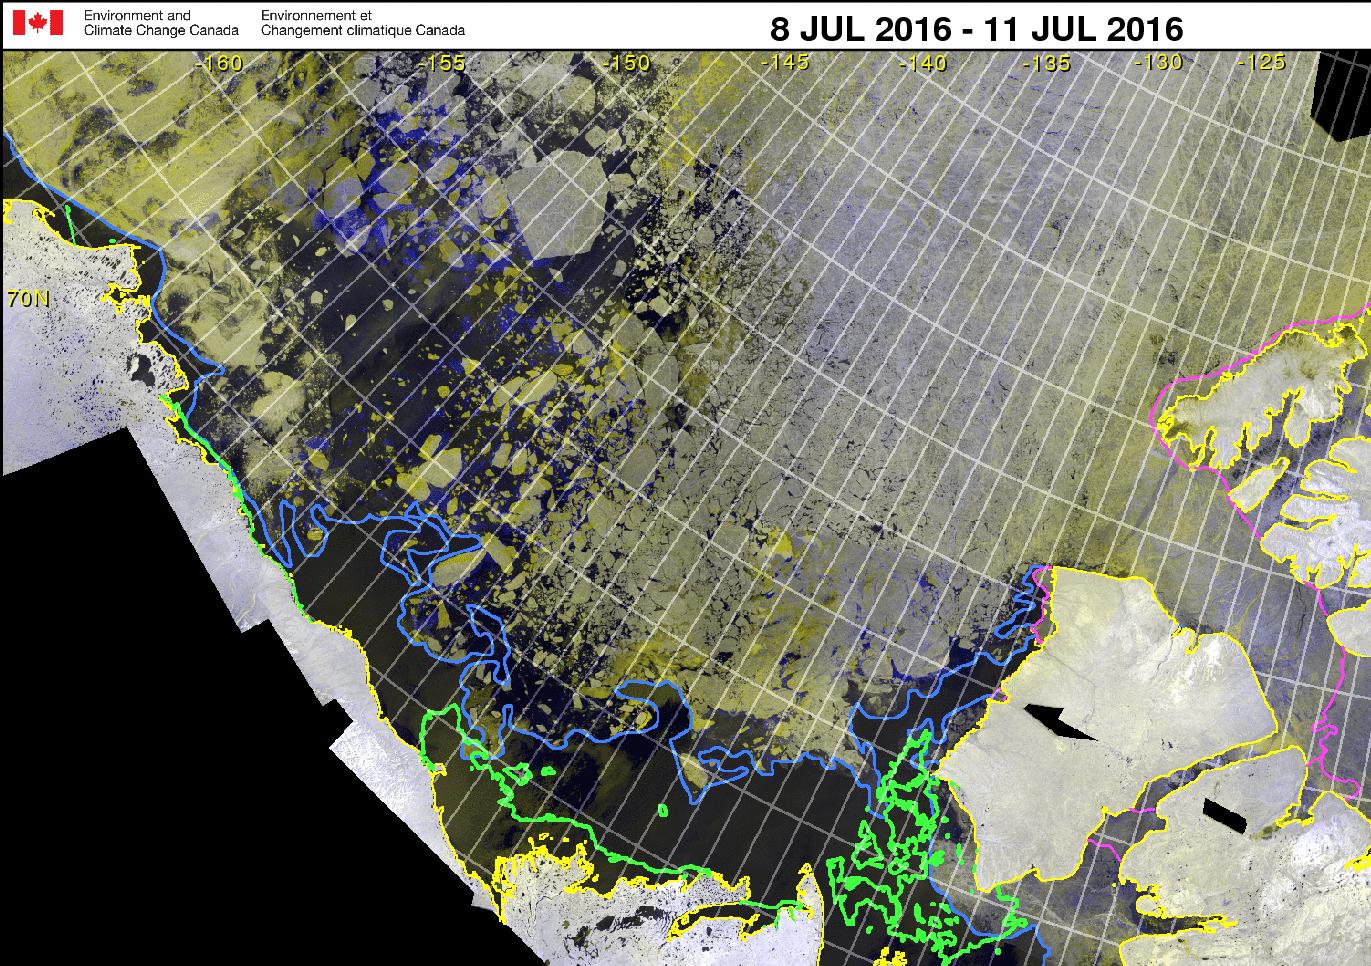
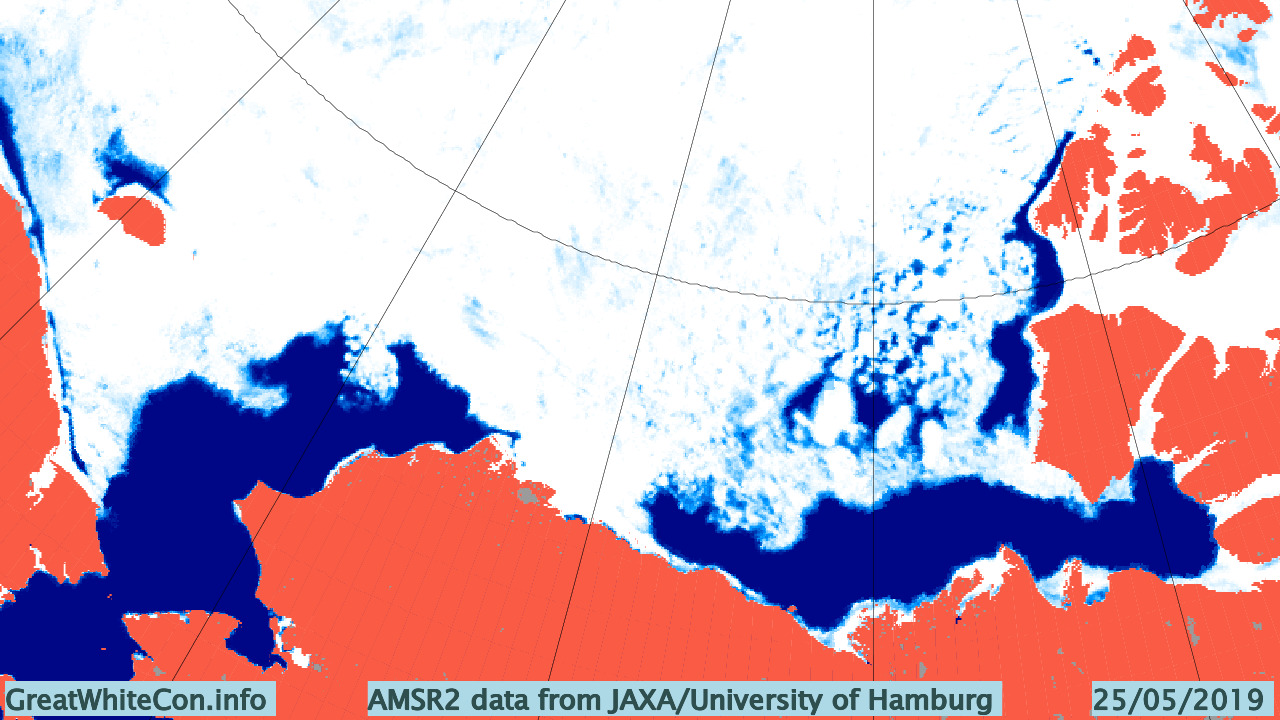
Applying the same criteria this year, open water is already hanging around in the Beaufort Sea, as well as the Amundsen Gulf:

NASA Worldview “true-color” image of the Beaufort Sea on May 21st 2019, derived from the MODIS sensor on the Terra satellite

What’s more a cyclone is currently spinning in the area too:

With those prerequisites in place, how about my other criteria? Here’s the current northern hemisphere snow cover graph:

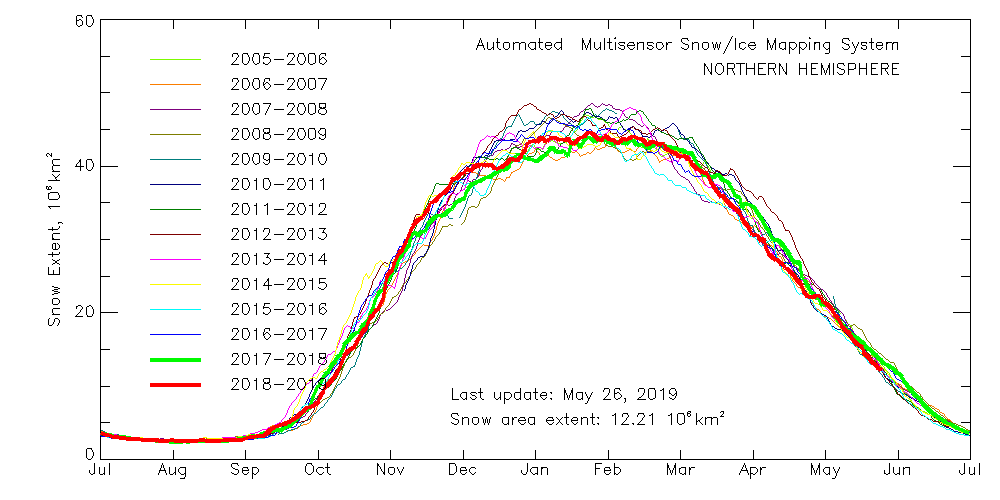
That suggests snow cover over land is close to recent lows, which is confirmed by the Rutgers University snow cover anomaly graph for April:

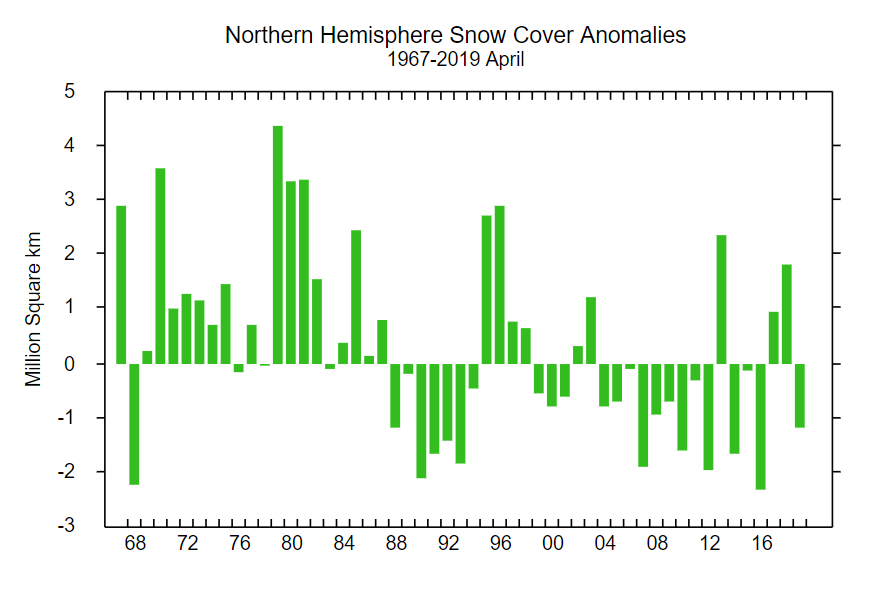
This year is anomalously low, but not by as much as 2012 and 2016. For completeness, here also is the current US National Ice Center snow cover map:

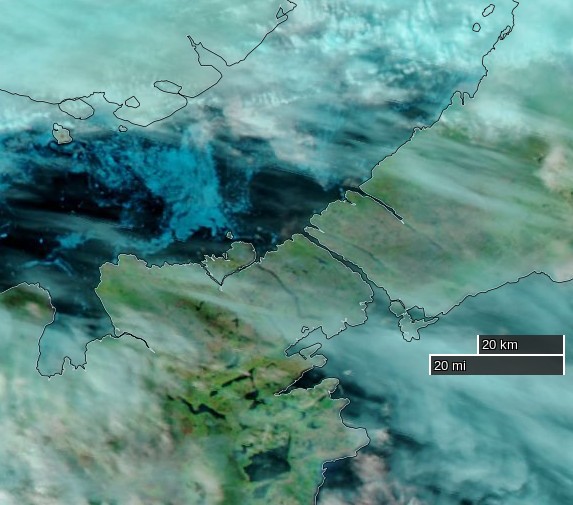
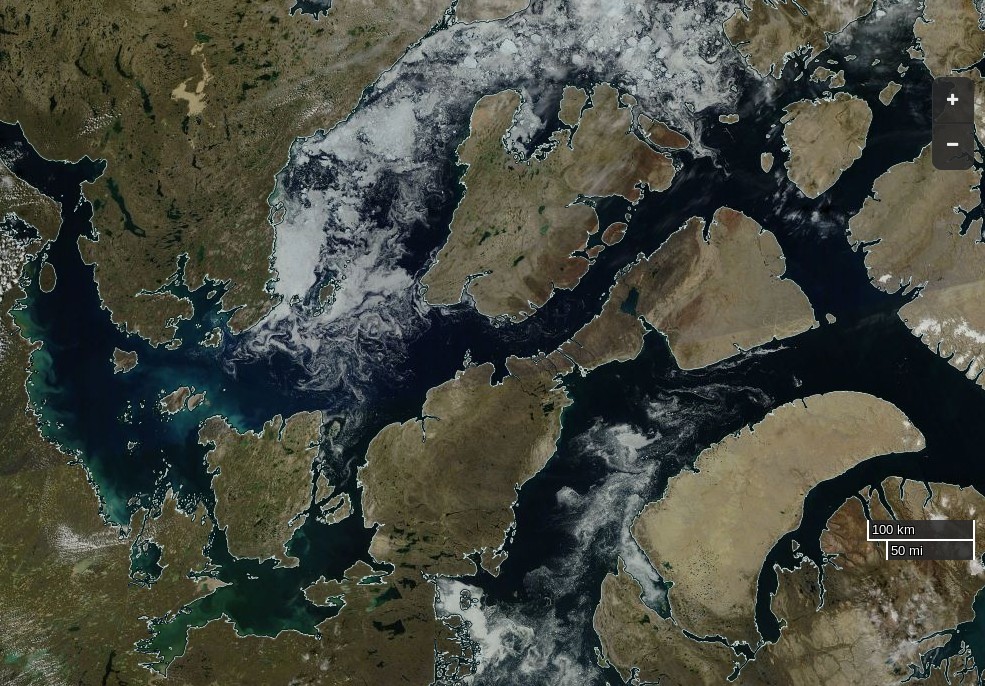
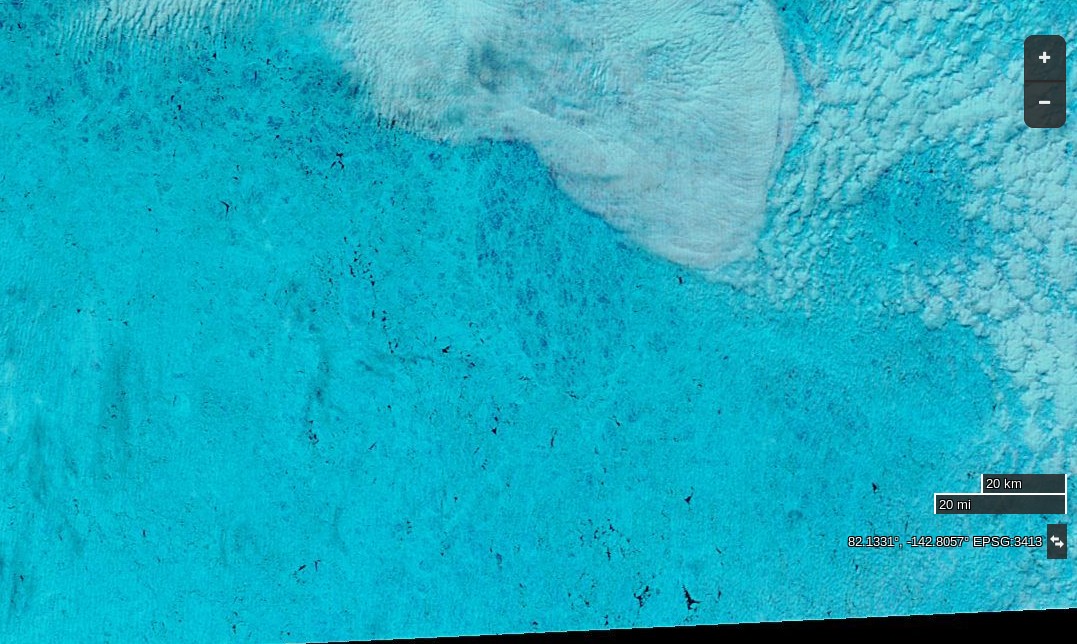
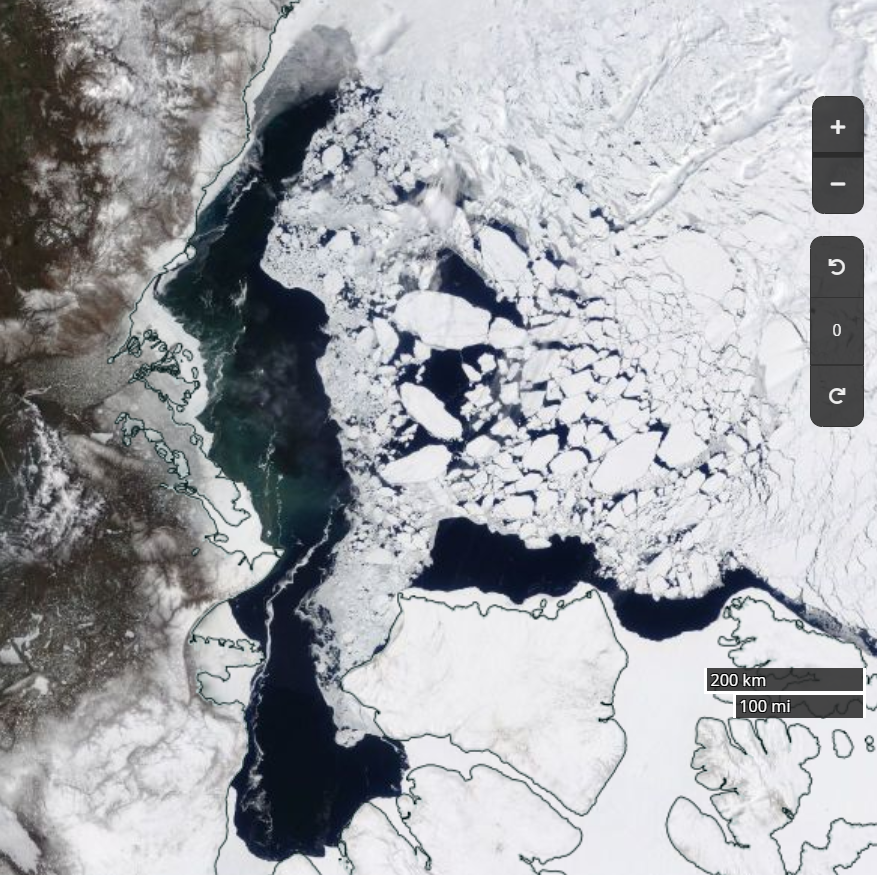
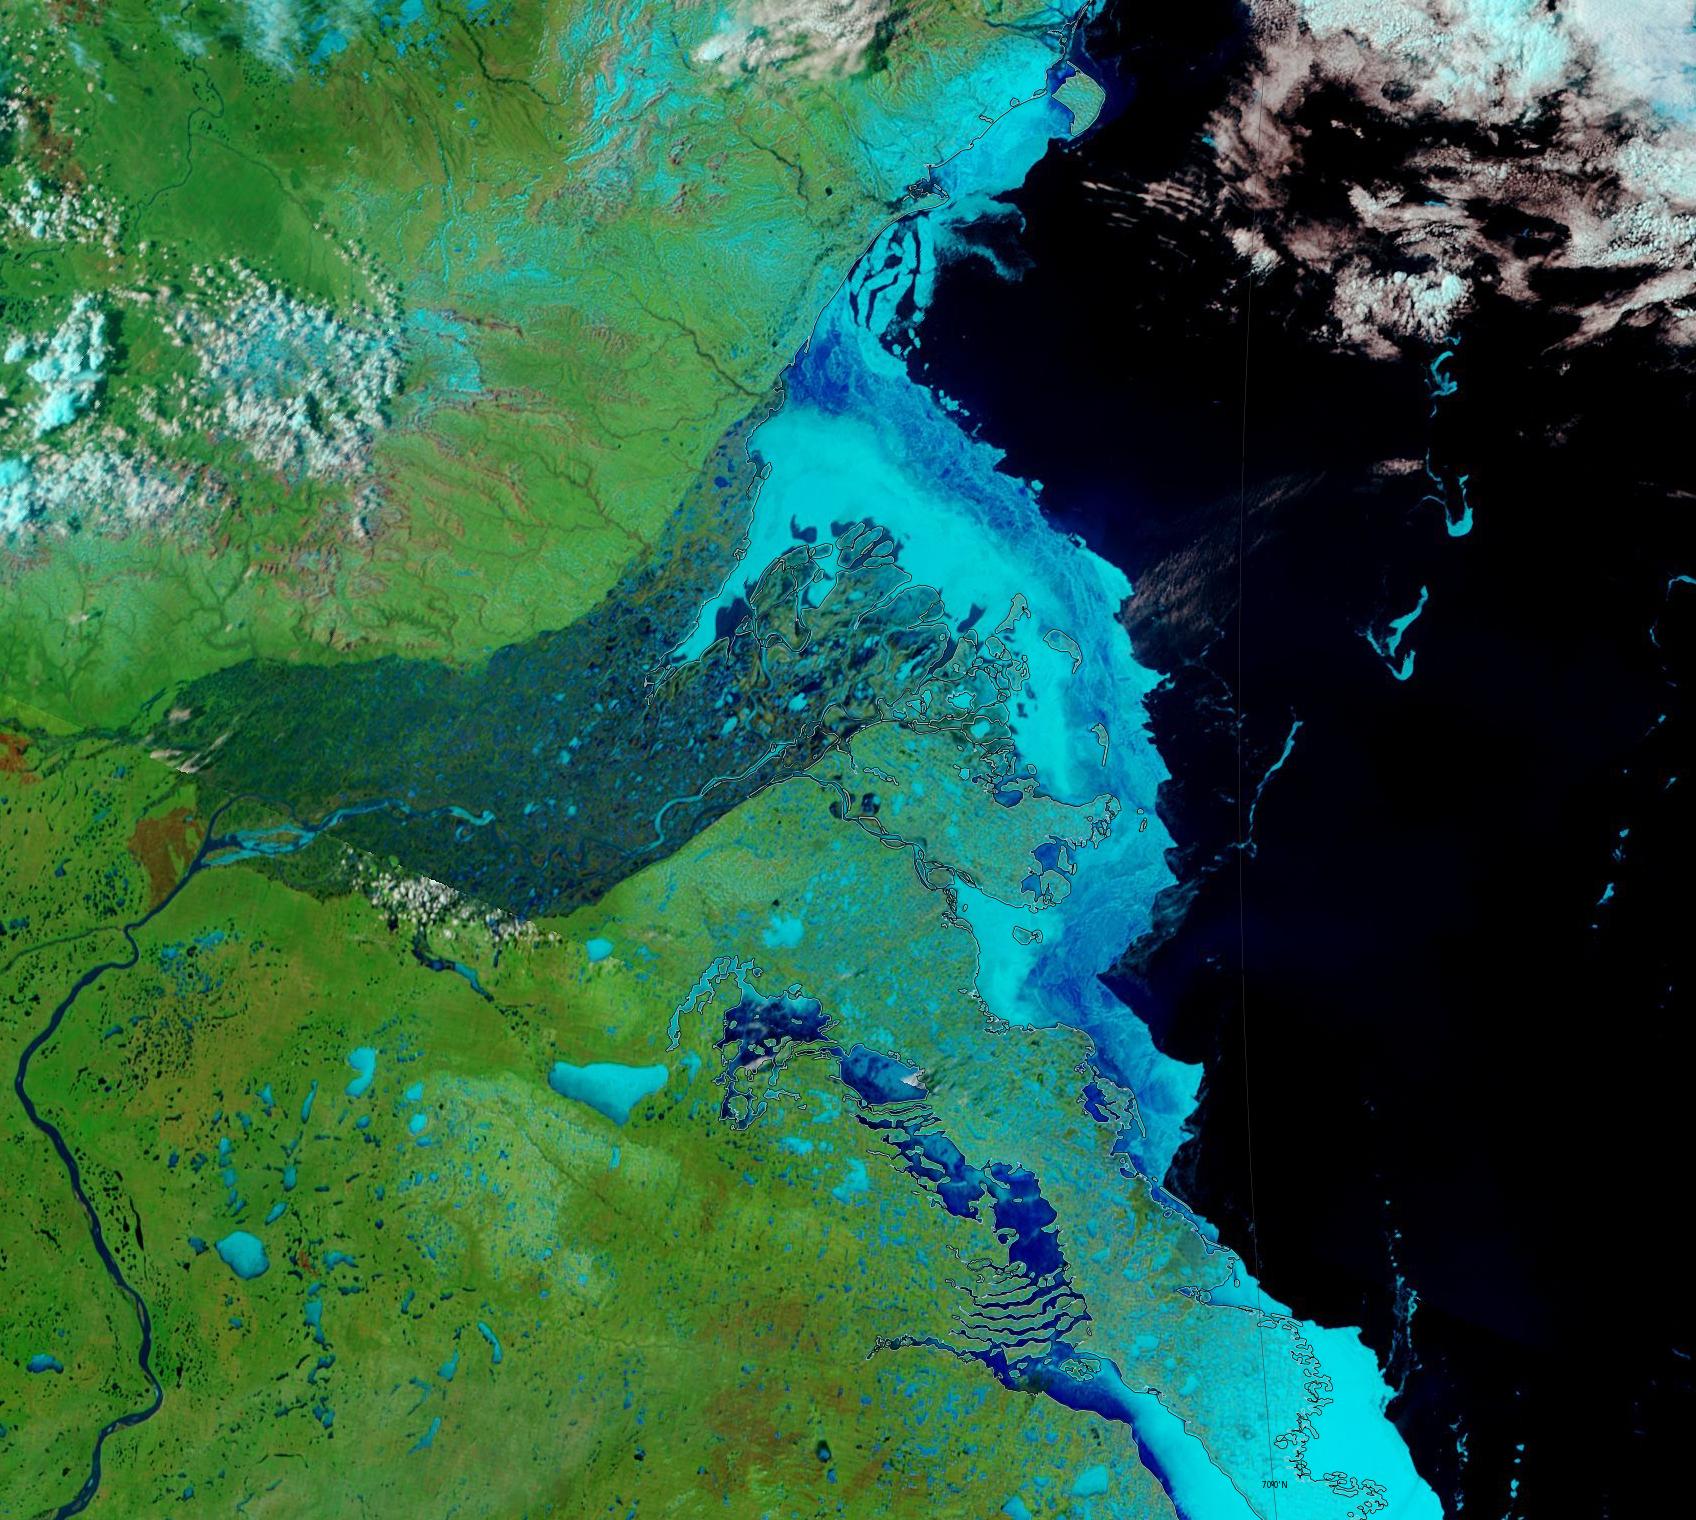
Moving on to melt ponds, there are plenty to be seen on the fast ice around the Mackenzie river delta:

NASA Worldview “false-color” image of the Mackenzie Delta on May 24th 2019, derived from the MODIS sensor on the Terra satellite

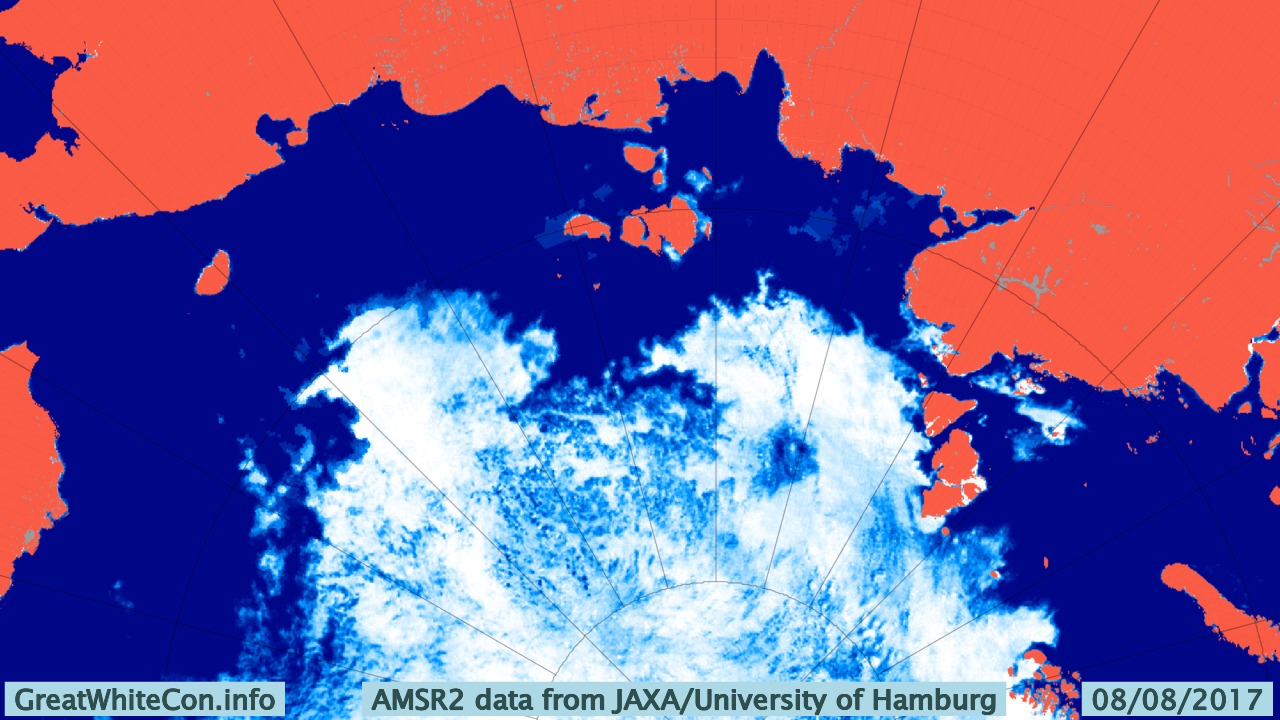
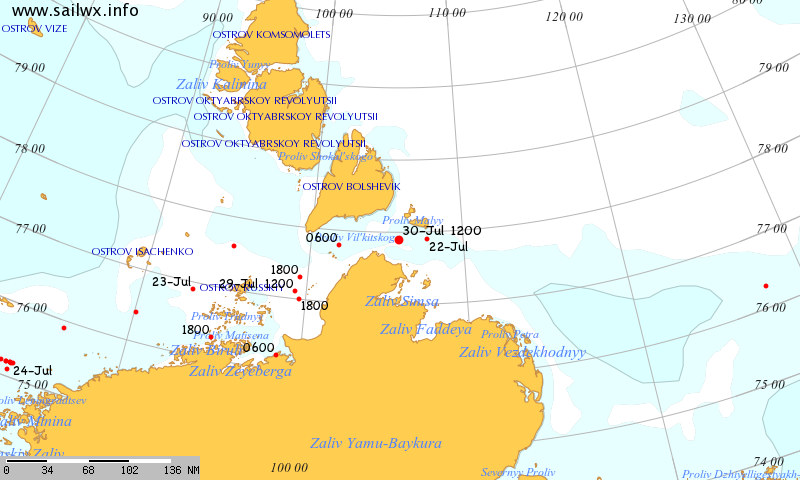
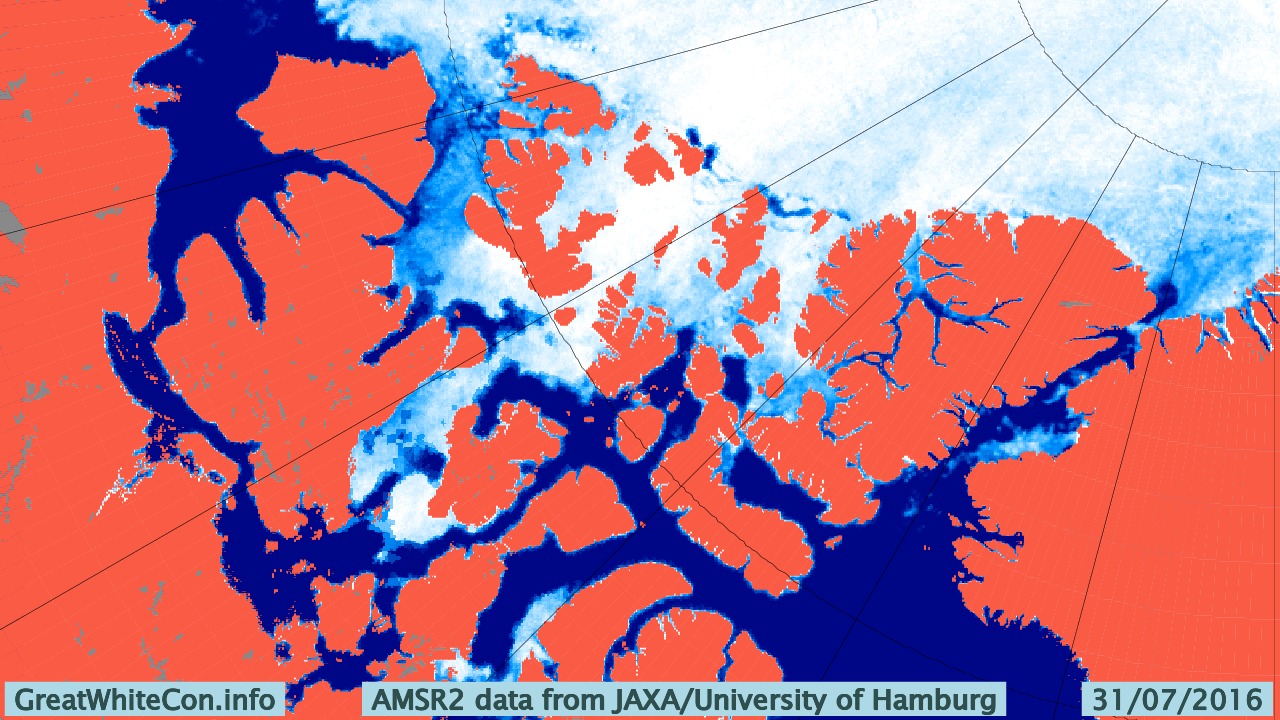
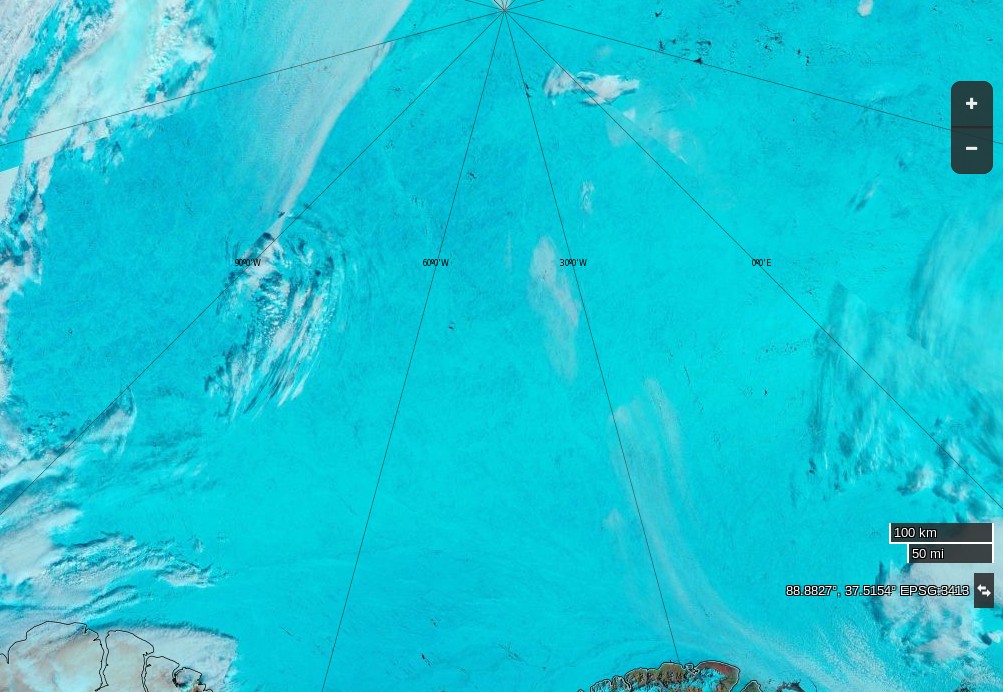
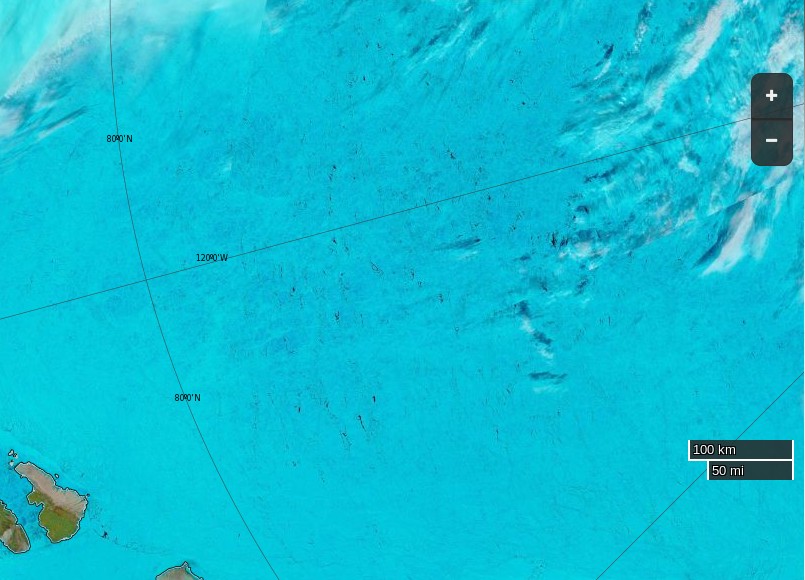
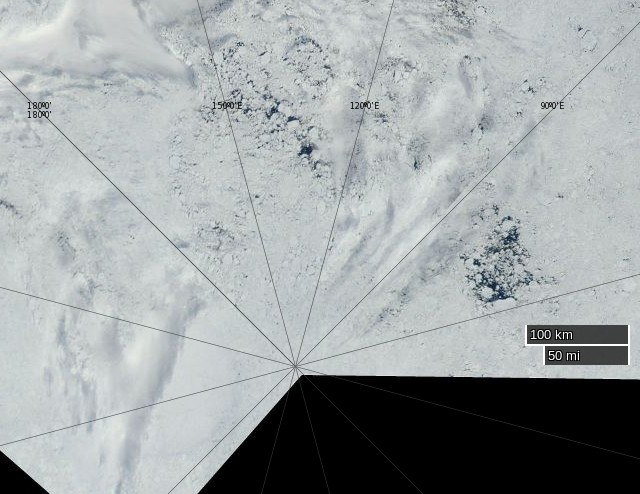
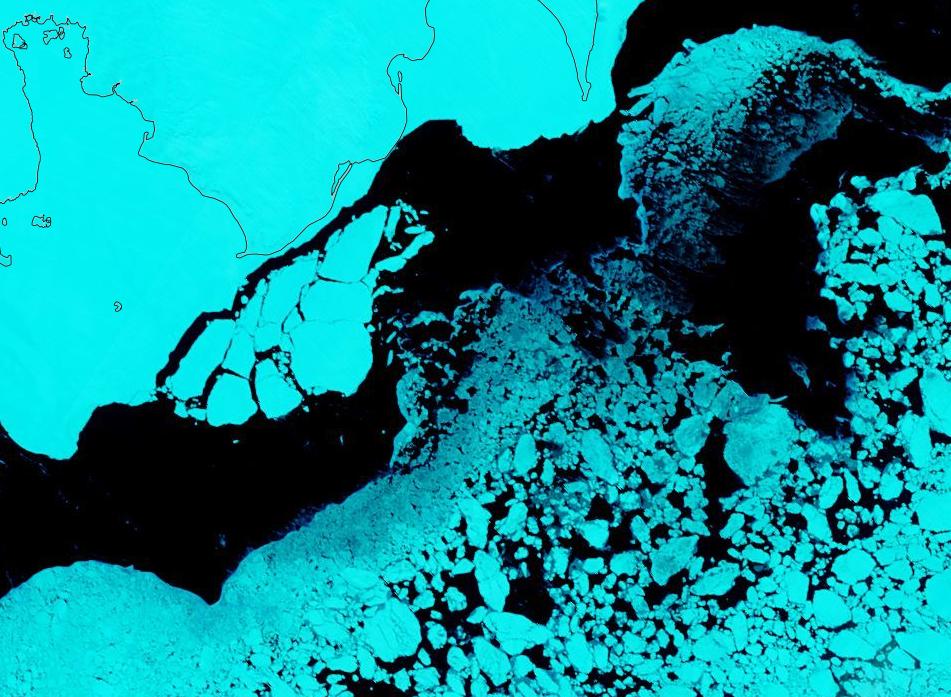
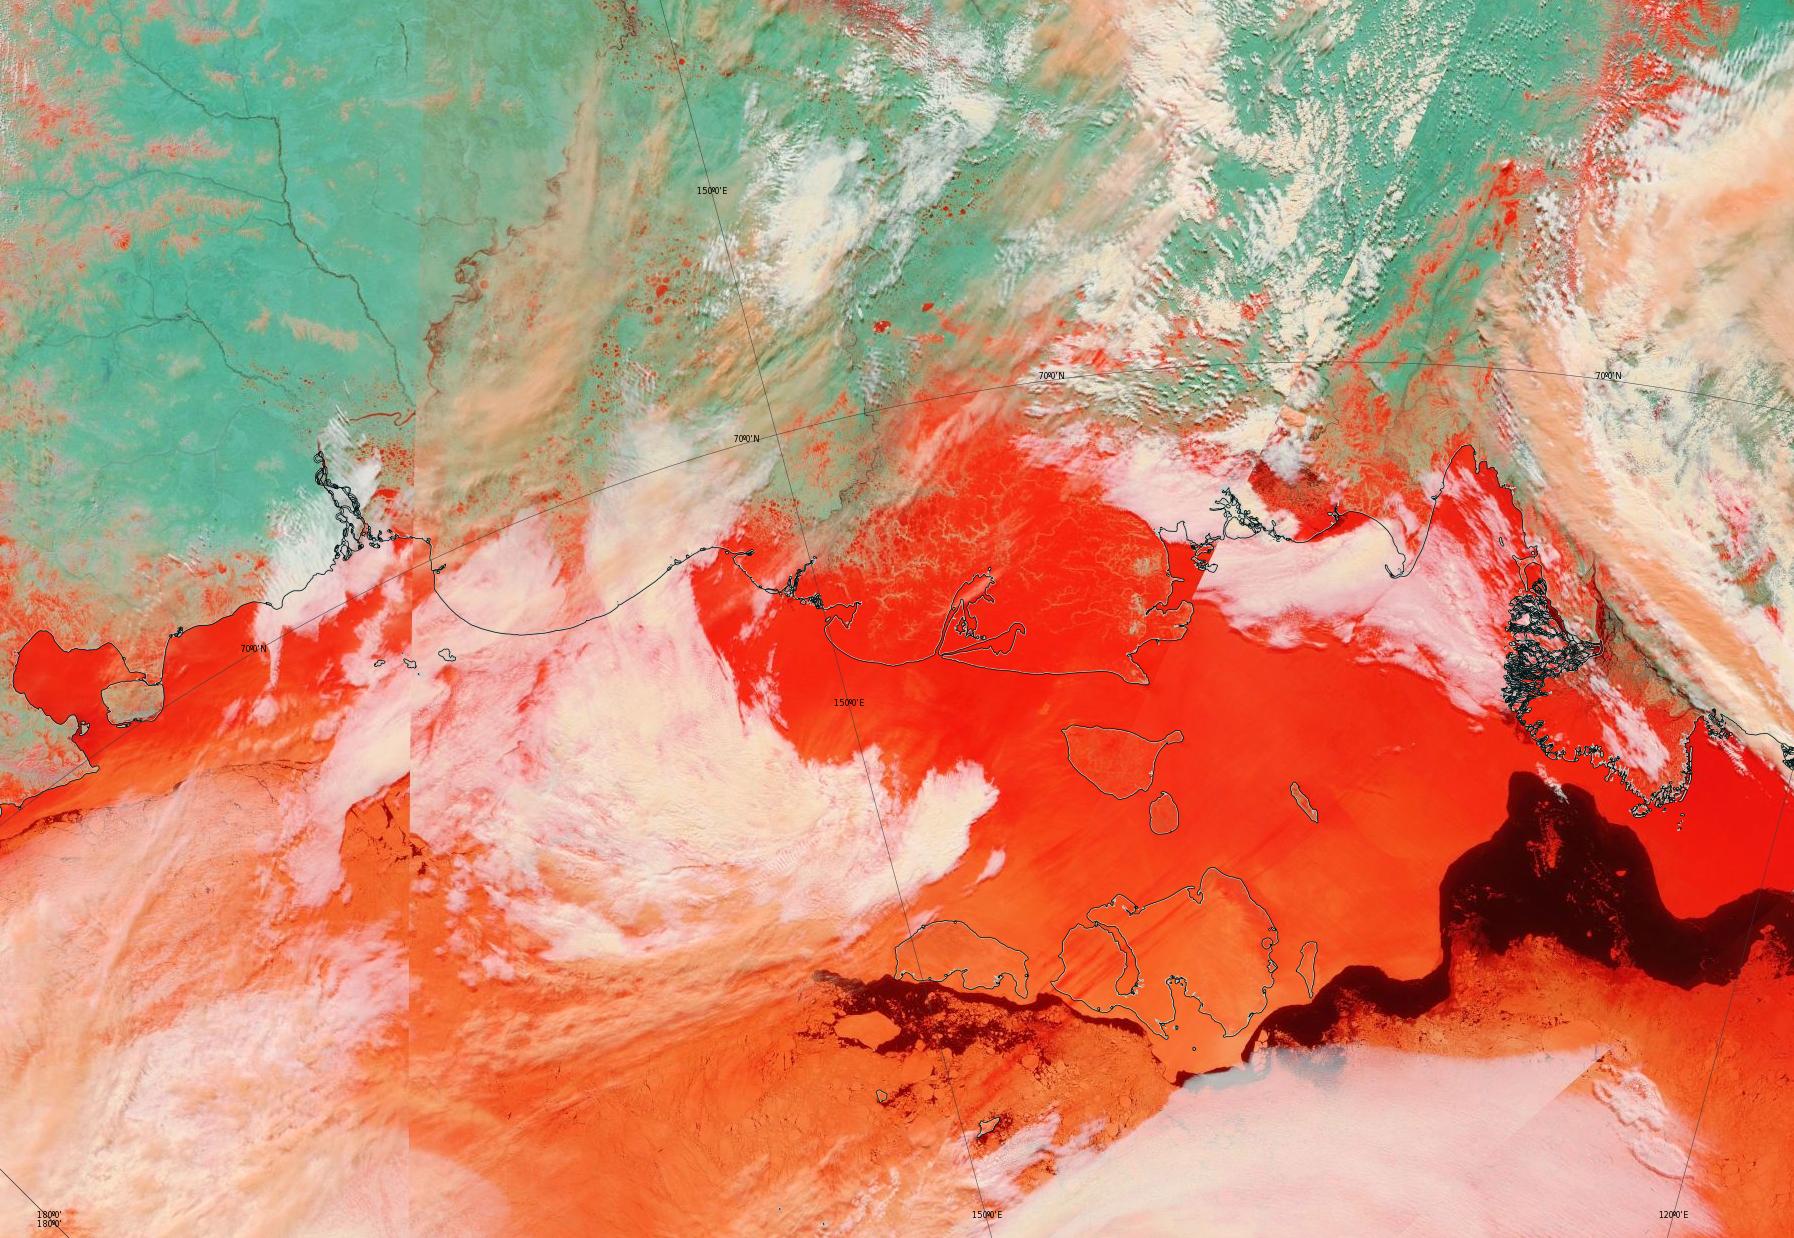
There also seem to be signs of some at a higher latitude off Ostrov Kotelny in the New Siberian Islands:

NASA Worldview “false-color” image of the Laptev Sea on May 23rd 2019, derived from the MODIS sensor on the Terra satellite

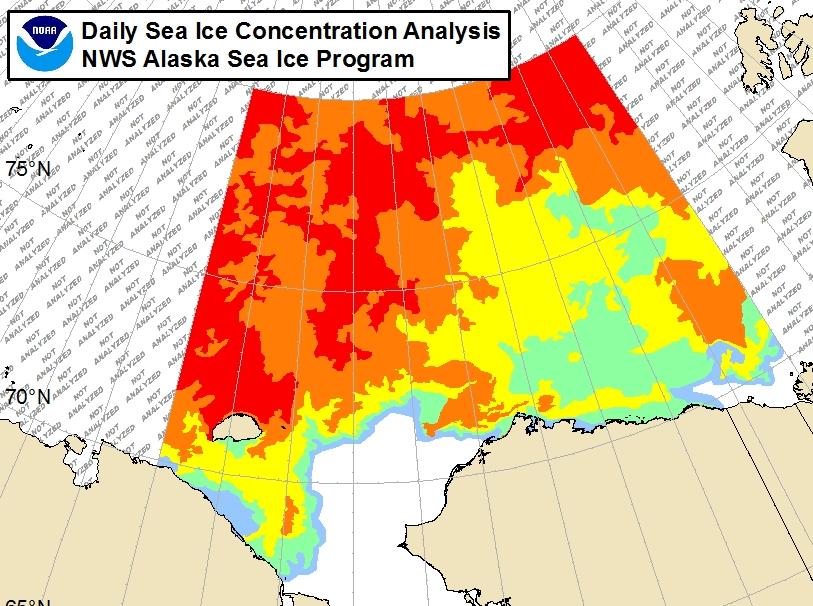
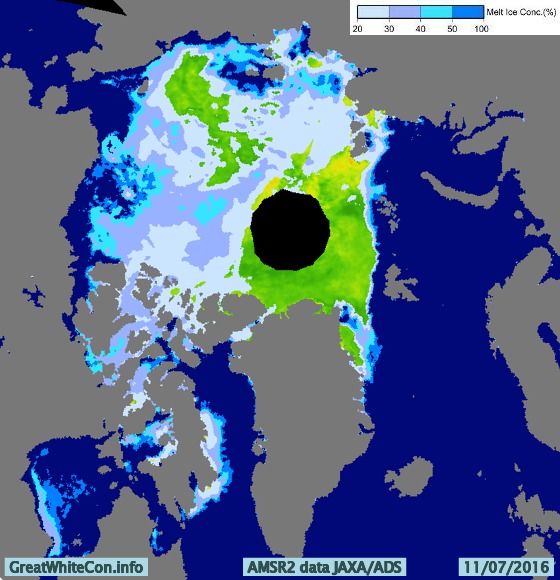
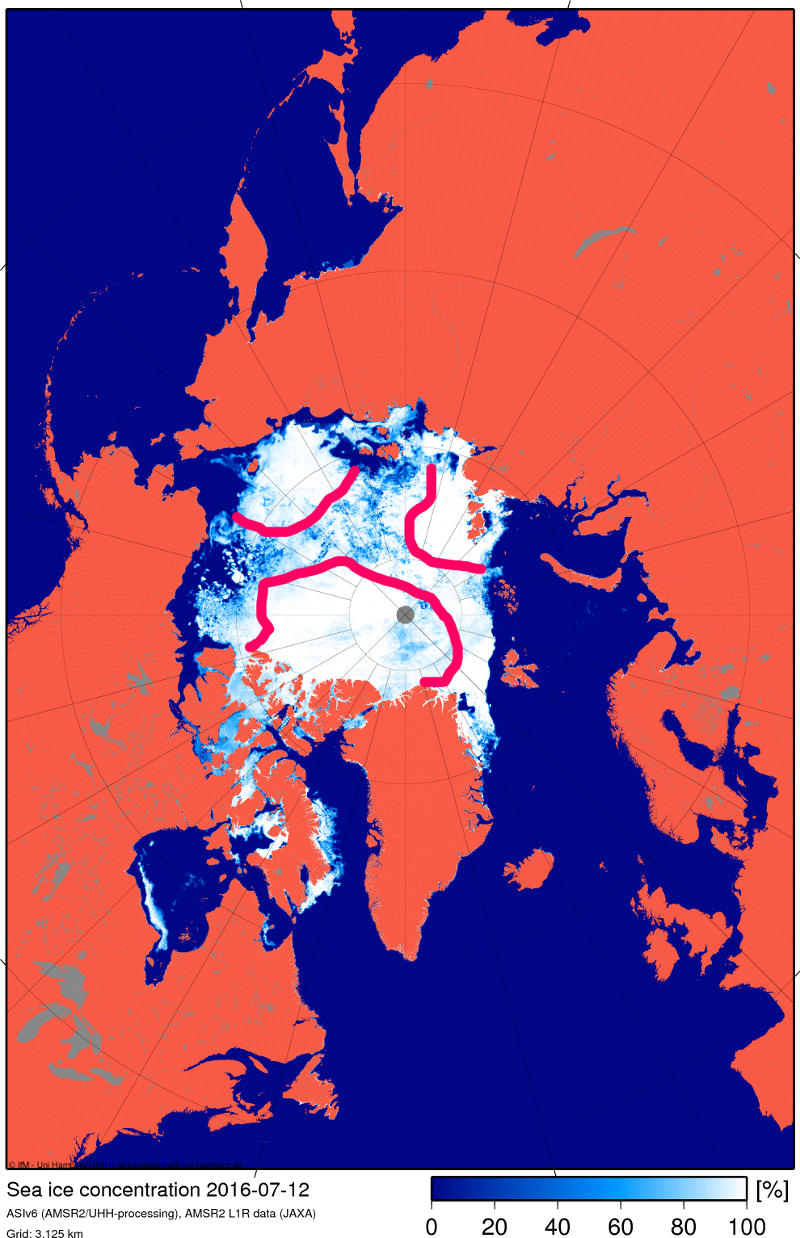
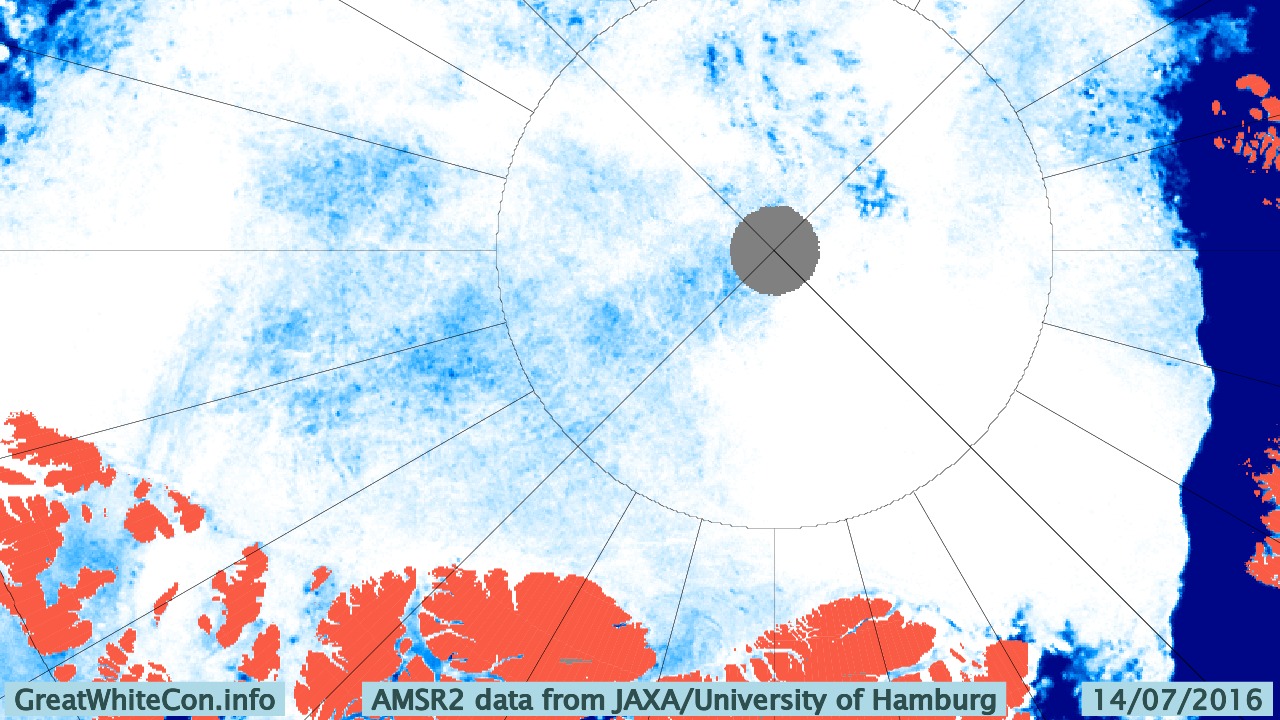
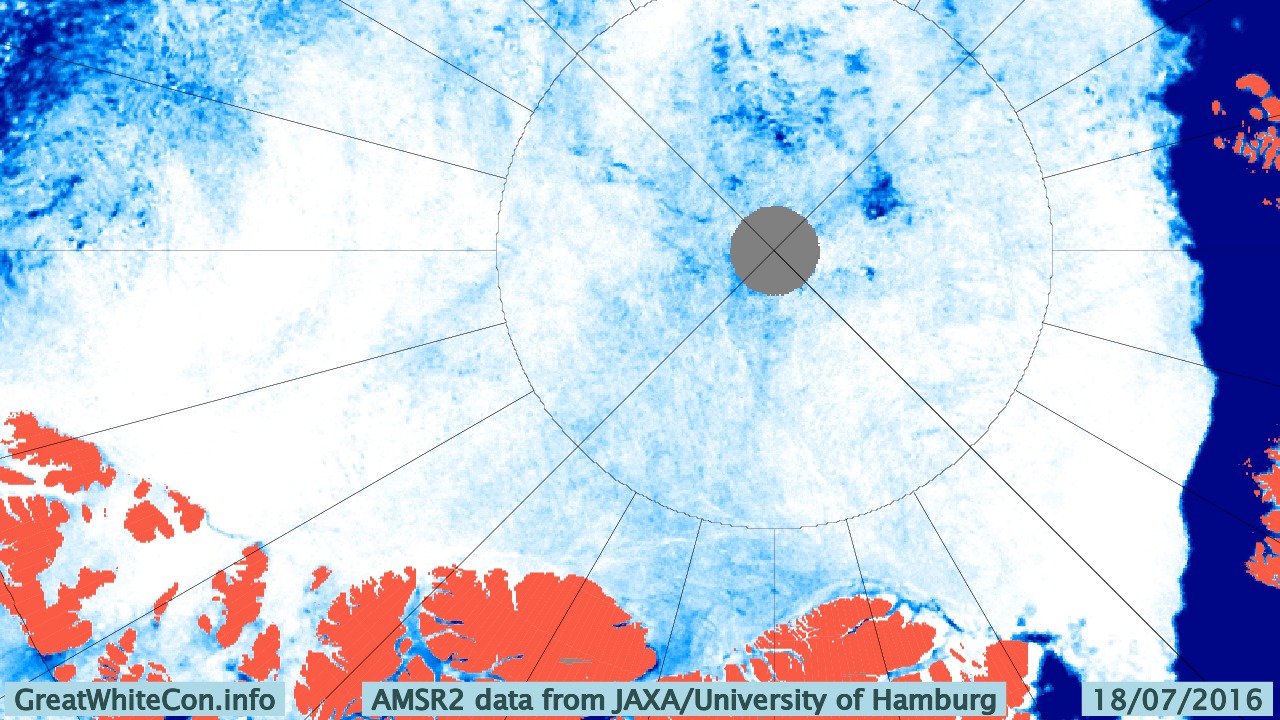
This year there is also a lot of open water in the Chukchi Sea, and almost no sea ice left in the Bering Sea:

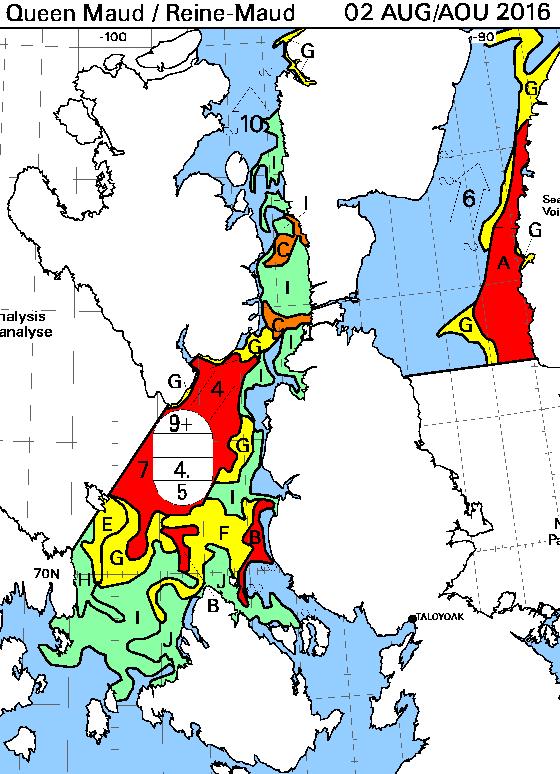
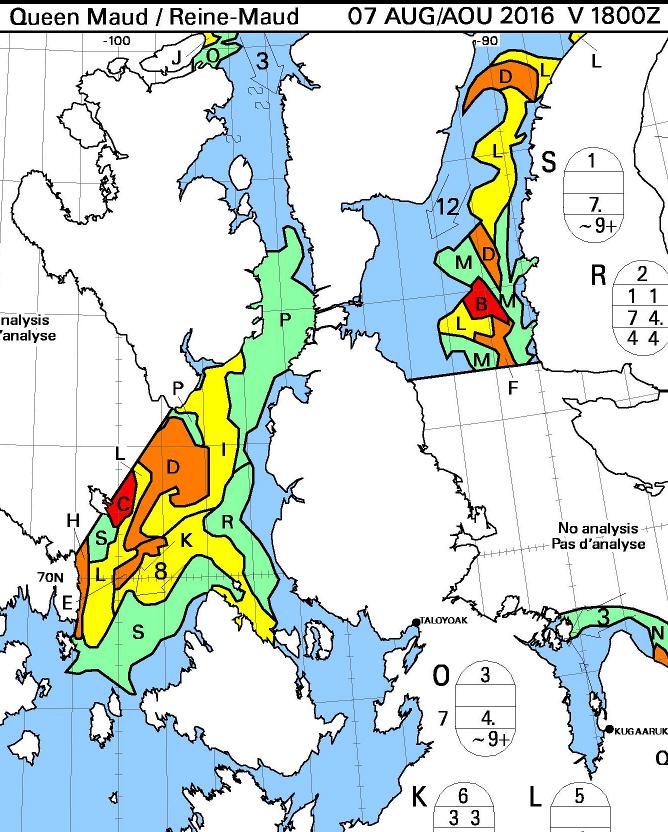
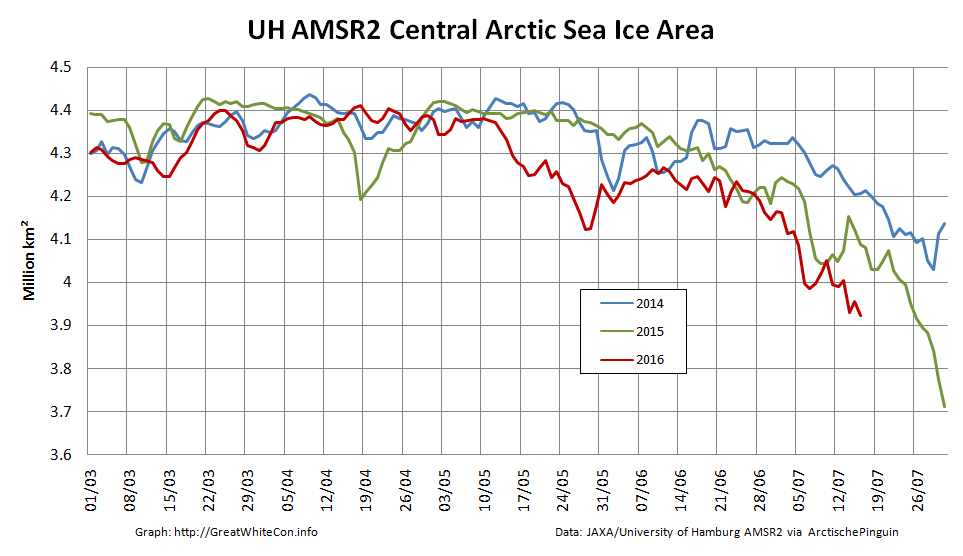
Compared with 2016 at the same time of year I am compelled to say that with June 1st just around the corner the 2019 summer melting season is primed to progress more quickly.

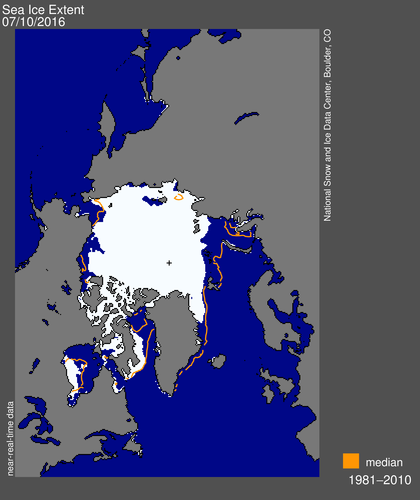
The next obvious comparison to make is with the (in)famous year of 2012, which resulted in the lowest ever minimum extent in the satellite record. Firstly let’s look at the National Snow and Ice Data Center’s graph of Arctic sea ice extent:

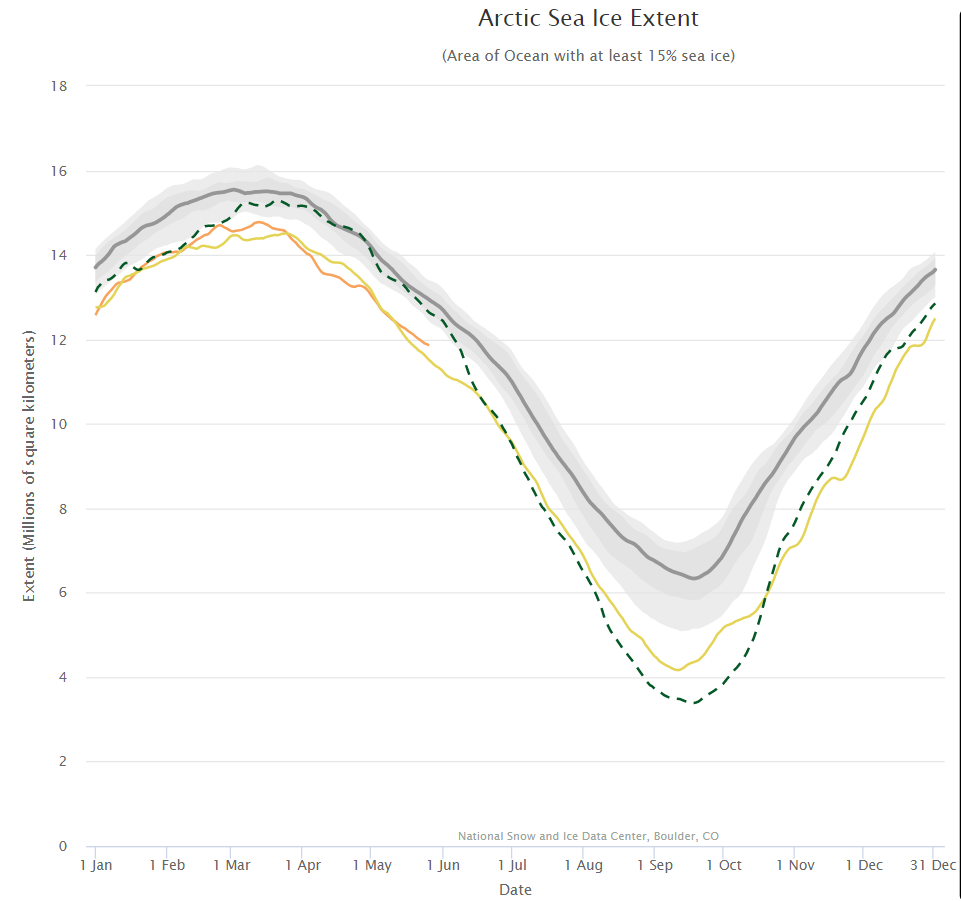
Currently extent is significantly below 2012, albeit somewhat above 2016 at the same time of year. And what of melt ponds? In 2012 there was evidence of less snow cover over land and more surface water on the ice on the Siberian side of the Arctic:

NASA Worldview “false-color” image of the Eastern Arctic on May 25th 2012, derived from the MODIS sensor on the Terra satellite

Other than that Arctic sea ice in 2019 looks to be in worse shape than in 2012.

[Edit – May 27th]

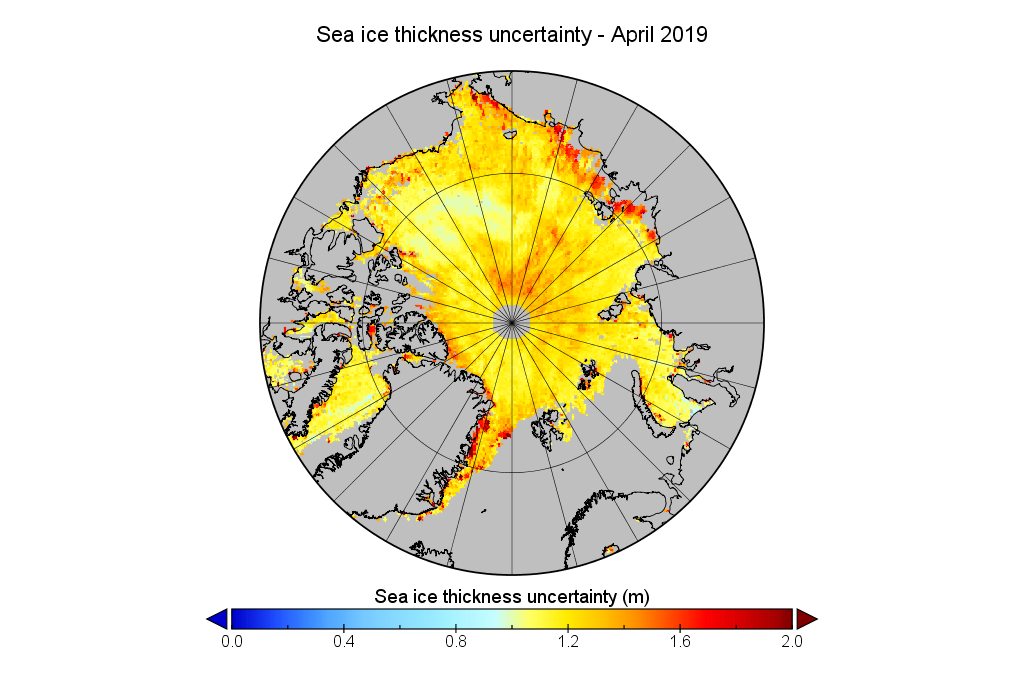
We’ve established that the extent of Arctic sea ice at the end of May 2019 is less than in 2012, but something else to consider is whether that ice is currently thicker than in 2012, or not. Satellites can have a reasonable stab at measuring the area of sea ice, but the third dimension is much trickier. The European Space Agency’s CryoSat-2 satellite has been attempting to measure sea ice thickness since 2010, so let’s take at the conclusions it has reached:

Don’t forget to take a good long look at the associated uncertainties too:

Watch this space!

The Northern Sea Route in 2017

Depending on whether you’re reading an “alarmist” or a “skeptical” web site you may have been told either that the Northern Sea Route is already “open” or that the “icebreaker stuck in the sea ice off Pevek” escaped very late this summer. Here at Great White Con we like to think of ourselves as “realists”, so what are the actual facts of the matter.

Our customary way of looking at such things is to use the Canadian Ice Service’s definition of “open” for the Northwest Passage, which seems to be 3/10 or less concentration along the entire route. That would allow an intrepid little yacht like Northabout through without too much trouble, but that point has not quite been reached yet this year. The NSR looks to be eminently “open” already if you only look at an AMSR2 concentration map:

Arc_20170808_res3.125_LARGE

However according to the Russian Arctic and Antarctic Research Institute (AARI for short) there is still not a suitably simple way through Vilkitsky Strait. Here’s their latest ice chart of the area:

AARI_20170808_KARA

Convoys led by nuclear powered icebreakers have already passed through the Vilkitsky Strait this summer. See for example this tracking map of Yamal from a few days ago:

Yamal-20170730

Also an unaccompanied liquid natural gas carrier has made it through the Vilkitsky Strait already this year. According to a Total press release:

After loading its cargo at the Snøhvit LNG export terminal in Norway, in which Total has an 18.4% interest, the Christophe de Margerie is taking the Northern Sea Route to Boryeong in South Korea, where it will deliver a cargo for Total Gas & Power. It’s the first unescorted merchant LNG vessel ever to take this route, which makes it possible to reach Asia via the Bering Strait in 15 days versus 30 days via the Suez Canal.

This technological feat was made possible through the participation of Total teams to the design of these next-generation LNG carriers. Compilations of technology, they efficiently transport large quantities of LNG year-round, without requiring escort icebreakers during the period from July to November. The Christophe de Margerie is the first of a total of 15 planned LNG carriers that will be gradually deployed.

As you can see, whilst it travels forwards in open water the Christophe de Margerie goes into reverse when breaking ice! Little yachts and other unaccompanied vessels lacking an ice class certificate will have to wait just a little longer however, unless of course they are inclined to be “intrepid”.


[Edit – August 19th]

As Cesium points out below, there is now a <= 3/10 concentration channel through the Vilkitsky Strait on the AARI maps.

AARI_20170818_KARA

AARI_20170818_LAPTEV

Here’s a couple of Sentinel 1A tiles from this morning stitched together:

S1A_Vilkitsky_20170819

We can now safely declare the Northern Sea Route “open”, even for less intrepid little yachts.

Is the Northwest Passage Open Yet?

We asked this question last year, albeit a couple of weeks later. It looks like it is if you only peruse passive microwave visualisations such as this one:

Arc_20160731_res3.125_LARGE

However if you were the captain of a yacht attempting to sail through the Northwest Passage this year you might well have some reservations. For example, the Barrow webcam (currently stuck on July 31st) reveals this:

Here’s the associated National Weather Service ice chart:

NWS-Alaska-20160801-Crop

Meanwhile further east the approach to the often troublesome “choke point” of Bellot Strait looks like this from the Suomi satellite:

NASA Worldview “false-color” image of the Bellot Strait on August 1st 2016, derived from the VIIRS sensor on the Suomi satellite

whilst the associated Canadian Ice Service ice chart looks like this:

QueenMaud-201608011800

Discretion being the better part of valour, in all the circumstances waiting a day or two longer before casting off might prove prudent:

Arc_20160801_res3.125_LARGE


[Edit – August 3rd]

Clearer skies over the Northwest Passage yesterday reveal the remaining ice:

NASA Worldview “true-color” image of Larsen Sound on August 2nd 2016, derived from the MODIS sensor on the Aqua satellite

Here’s the CIS chart of the area from yesterday evening:

QueenMaud-201608021800


[Edit – August 7th]

Here’s the August 7th CIS chart for the Queen Maud Gulf and points north:

QueenMaud-201608071800

Today there looks to be a route past Gjoa Havn and through Bellot Strait that doesn’t involve negotiating more than 3/10 concentration sea ice. The ice has been pushed back from Point Barrow too, so by my reckoning we can now declare one route through the Northwest Passage “open”, for the moment at least.


[Edit – August 10th]

A nice clear MODIS image of the Northwest Passage yesterday:

NASA Worldview “true-color” image of the Northwest Passage on August 9th 2016, derived from the MODIS sensor on the Terra satellite

backed up by the CIS ice charts:

Resolute-201608091800

QueenMaud-201608091800

Has The Ice Clearly Broken Completely In Two Now?

In the spirit of providing some spurious “balance” to the contentious Arctic sea ice “debate” our quote for today comes fairly fresh from the Arctic Sea Ice Forum:

idk how people are confusing the gaping fissures that span from Siberia to Canada with melt ponds but it seems like half the people here have blinders on to what is ongoing.

I know HYCOM gets a lot of flak but instead of projecting out, let’s look at the last five days.

[Superfluous image redacted]

The ice has clearly broken completely in two now, and the recent ~970mb low did a major whomping to the ice in the “cleavage” between what’s stuck against Siberia and the main CAB.

Intriguingly this was in response to an informed comment on June 23rd to the effect that:

As we have seen recently, these large area drops in the middle of the pack do not mean the ice is gone, just that its top is wet/ponded. In a couple of days some of these drops might be reversed. Of course the ice has suffered in the meantime, but still it’s risky to simply extrapolate these numbers.

Even more intriguingly our headline for today is remarkably like the inverse of a phrase in a Mail on Sunday article that led us to create this site in the first place!

Nearly three weeks have passed since those “gaping fissures that span from Siberia to Canada” were announced, and you may well (like me) be wondering how they have been coming along? In partial answer to that question here is our very latest video based on the University of Hamburg’s AMSR2 concentration visualisations:

In my own humble opinion this doesn’t really count as a “gaping fissure” but MODIS imagery does now show a fair bit of open water between Siberia and the North Pole:

CAB-Terra-20160711-400

A “gaping fissure” between the Pole and Canada (and/or Greenland) is however conspicuous only by its absence:

NASA Worldview “false-color” image of the Central Arctic Basin on July 11th 2016, derived from the MODIS sensor on the Aqua satellite

I do think that I can spot some melt ponds in the area at the moment though. How about you?

The one CRREL/ERDC ice mass balance buoy still reporting reveals that both surface and bottom melting have started at around 83 degrees north:

2016-07-11_2015F

The 2016 multi-year ice melting season has evidently now begun, and the floe upon which buoy 2015F is sitting still has ~1.9 metres of melting to go. It’s not beyond the bounds of possibilty that a “gaping fissure” from the Atlantic to the Pacific will ultimately emerge this year. However based on the evidence thus far I’ll be extremely surprised if there is one “from Siberia to Canada”, unless of course you count the Chukchi & Beaufort Seas. That route is already open to intrepid Arctic seafarers, as can be seen at the bottom of the animation above and on the current JAXA/ADS Arctic sea ice surface melt map:

AM2SI20160711A_SIT_NP


[Edit July 14th 2016]

It seems I was mistaken. According to my flack jacketed informant over at the ASIF:

I have taken lots of flack I will stand by my prediction that we are heading for sub-1M KM2 come September (or early October).

Structurally [the ice] has actually now broken into three pieces, one is attached to the islands N of Siberia/NE of Svalbard, one is near Wrangel/ESS, and the “bulk” is pushed against the CAA/Greenland.

The lower concentrations in CAB are clearly open water and not melt ponds.

specialforjim-scaled

I felt compelled to explain to (presumably) him that:

Here’s the NSIDC’s view of those “gaping fissures” of yours:

N_daily_extent-20160710


[Edit July 15th 2016]

“Flak jacket” assures me that:

Despite some faults I think both ARC and GLB are onto the truth. Satellite grabs over the past few days show failure on all three fronts (ATL, PAC, and the Russian side especially), but the Russian side doesn’t present as a solid front (nor does the Beaufort melt), and the leads keep getting absorbed into the slush of the main pack (which is why the ‘slush’ keeps expanding, and why most of the CAB has now evolved into this state). The only solid regions of ice are those bordering the steaming ATL waters as well as some remnants north of the CAA (no coincidence the latter was chosen as ‘evidence’).

“ARC” refers to the US Navy’s Arctic Cap Nowcast/Forecast System. Here’s the ACNFS sea ice thickness “nowcast” from July 13th:

Here’s the July 13th model run sea ice thickness forecast for July 14th:

and here’s an annotated version of the Navy’s sea ice concentration forecast:

ACNFS-Concentration-20160713+24h

Yesterday the Kara Sea didn’t suddenly become covered in sea ice, and today the area of the Central Arctic Basin around 82 N, 135 W looks like this to the MODIS instrument on board the Terra Satellite:

NASA Worldview “false-color” image of the Central Arctic Basin on July 15th 2016, derived from the MODIS sensor on the Terra satellite

and like this to the University of Hamburg’s ARTIST sea ice concentration algorithm:

Arc_20160714_res3.125_LARGE

whilst here’s the latest Canadian Ice Service RadarSat mosaic for the Western Arctic:

http://ice-glaces.ec.gc.ca/cgi-bin/getprod.pl?prodid=IPYMMR1WA&wrap=0&lang=en
Canadian Ice Service Western Arctic RadarSat mosaic for 8-11 July 2016

Ice mass balance buoy 2015F reports this morning:

Current Buoy Data (07/15/2016):
Pos: 82.89 N, 137.34 W
Air Temp: -0.76 C
Air Pres: 1011.16 mb
Ice thickness : 185 cm


[Edit July 16th 2016]

The Arctic Sea Ice Forum management have banished “Flack Jacket” to the sin bin for a month.

I’m fed up with the personal insults because a model that has a history of errors is showing something spectacular that no other data source does. Come back in a month if you still feel like it.

Meanwhile in answer to my enquiry on the HYCOM support forum Alan Wallcraft tells me:

We now use the National Ice Center’s IMS sea ice extent product in our assimiltion, see http://www.natice.noaa.gov/ims/. This is manually produced every day, and generally avoids the artifacts and deficiencies of satellite sea ice concentrations. However yesterdays IMS fields were not good, and that is where the spurious sea ice came from. Today’s IMS field is good, and we may rerun the 2016/07/13-18Z nowcast/forecast to clear this up.

After a brief “pause” ACNFS is back in action, and here is its latest Arctic sea ice concentration “nowcast”:

Yesterday the skies were clear once again over the corner of the Arctic where buoy 2015F is located:

NASA Worldview “false-color” image of the Central Arctic Basin on July 15th 2016, derived from the MODIS sensor on the Aqua satellite

Here’s how the sea ice area in the Central Arctic Basin has been faring recently:

CAB-Area-2016-07-16


[Edit July 19th 2016]

Here’s an early image of the North Pole from the Aqua satellite this morning, recorded for posterity in case it changes later:

NASA Worldview “true-color” image of the North Pole on July 19th 2016, derived from the MODIS sensor on the Aqua satellite
NASA Worldview “true-color” image of the North Pole at 09:00 UTC on July 19th 2016, derived from the MODIS sensor on the Aqua satellite

and as the recent Arctic storm heads towards the Canadian Arctic Archipelago here’s the latest Hamburg AMSR2 concentration map:

Arc_20160718_res3.125_LARGE

I now also have an answer to my “supplementary question” on the HYCOM support forum:

I attach the ACNFS plot you referenced and the corresponding plot from our next global real-time system (GOFS 3.1), which will likely replace our current global analysis (and ACNFS) once NAVGEM 1.4 is operational (it is running here with NAVGEM 1.3, like ACNFS). They assimilate the same observations, but ACNFS only does so near the ice edge while GOFS 3.1 assimilates sea ice concentration everywhere (but with higher error bounds in the ice interior). The reason for ACNFS only assimilating near the edge is in part due to that being the most important area for navigation but also because SSMI satelite ice concentrations tend to “over saturate” in the summer. We switched GOFS 3.1 to “believe” the observations because they are generally better in recent years.

The two are quite different in the interior of the sea ice and GOFS 3.1 is certainly better there. We did not see the low concentrations near the North Pole in ACNFS this time last year, so something has happened to make the free running model produce low concentrations this summer. We are looking into it.

071800_927_arcticicen.001″ width=”754″ height=”666″ class=”aligncenter size-full wp-image-4361″ />

icen2016071718_2016071800_042_arcticicen.001

icen2016071712_2016
</p>
	</div><!-- .entry-content -->
	
	<footer class=

The Beaufort Gyre Goes Into Overdrive

According to the US National Snow and Ice Data Center, the Beaufort Gyre is:

A clockwise circulation (looking from above the North Pole) in the Beaufort Sea, north of Alaska. This circulation results from an average high-pressure system that spawns winds over the region.

beaufort_gyre

Such a high pressure system has been in place over the Arctic Ocean for a few days now, and the effect of the clockwise circulation on the sea ice in the Beaufort Sea is already evident in these recent satellite images:

NASA Worldview “true-color” image of the Beaufort Sea on April 9th 2016, derived from the MODIS sensor on the Terra satellite
NASA Worldview “false-color” image of the Beaufort Sea on April 12th 2016, derived from the MODIS sensor on the Terra satellite

as well as in this animation of sea ice movement since February:

The high pressure is forecast to continue for several more days. Here’s the GFS forecast for April 20th, courtesy of MeteoCiel:

Northern Hemisphere surface pressure forecast for April 20th 2016

which shows a large system with a central pressure of 1040 hPa still sitting over the Northern Beaufort Sea. Next here’s an animation from the US Navy which forecasts ice thickness until April 19th:

April 13th 2016 ACNFS Beaufort Sea thickness forecast until April 19th

Note in particular the large area of open water forecast to be produced in the Chukchi sea off Barrow, Alaska by the end of the period. The continuing clockwise winds have already started reducing the area of sea ice in the Beaufort Sea at an unusually early date:

2016-04-13-Beaufort-AMSR2-Area_001

Amongst other things we’ll be keeping a close eye on the ice area in the Chukchi Sea over the next few days. The sun is already starting to bathe that area of our planet with its rays, and open ocean soaks up that heat much more readily than bright white ice.

[Edit – 16/04/2016]

Here’s an animation of the effect on sea ice of the Beaufort Gyre in overdrive from Neven at the Arctic Sea Ice Blog:

Neven-Gyre-20160414

Notice how towards the end of the animation another huge part of the ice pack, north of the Canadian Arctic Archipelago is pulled into the Gyre. This is mostly multi-year ice.

Here also is a MODIS image of the Beaufort Sea processed by A-Team at the Arctic Sea Ice Forum to highlight the areas of new ice:

ATeam-BeaufortDay106-2016

The Northwest Passage in 2016

Our coverage of the Northwest Passage is starting somewhat earlier then usual in 2016. That’s because an educational comment of mine seems to have gone permanently missing over at Andrew Montford’s blog. Over there commenter “Golf Charlie” suggested that:

Perhaps based on rumours, or folk stories, the possibility of a North West Passage, was the answer to many peoples dreams of wealth, fame and fortune. The Franklin Expedition set off, with all confidence, knowing that there had been an unprecedented retreat in Arctic sea ice extent. They never came home. The ships then sent to rescue them, never came home either, but some survivors did.

In July 2010, due to unprecedented ice loss, a team set out to find HMS Investigator, (one of the rescue ships) and found her within 15 minutes, exactly where she was trapped and abandoned. How had she got there?

This may be just a load of boring and irrelevant history to you, but as an ice expert keen to lecture others, it just seems strange that you don’t acknowledge the fact that before man made CO2 emissions could possibly had any remote chance of shrinking sea ice, it had all happened before.

It is likely that whatever caused the ice to retreat in the 1830s/40s, may have caused the current retreat. As no attempt has been made to explain this historical retreat, it seems premature to jump to conclusions about the present. What stories and folklore convinced Franklin there was a NWP? Had it opened before? Did the Vikings circumnavigate the North Pole? No one knows for sure.

Here’s the beginnings of my by now expanded reply:

I am already very familiar with the sorry tale of Franklin’s ill fated expedition. By way of some more recent Northwest Passage history, were you previously aware that Charles Hedrich completed his own multi-year voyage through the NWP last summer? His vessel was much smaller than Franklin’s:

“He is now, the first man to have rowed solo the North-West Passage.”

charles_hedrich_pond_inlet

It’s not terribly clear, but apparently Charlie thinks his “unprecedented ice loss” in the Summer of 2010 had a precedent in the 1840s and/or 50s. Perhaps he will pop in and elucidate? Whilst we wait to see what transpires in that regard, here’s an animation of sea ice concentration across the Northwest Passage last summer:

You will note that the “southern route” taken by Roald Amundsen in Gjøa opens first, ultimately followed by the “main route” via the McClure Strait.

My missing comment also referenced (by way of example!) a 2015 academic journal paper entitled “Ice thickness in the Northwest Passage“. Amongst its other conclusions can be found this:

Global climate models with their coarse resolution likely have difficulty capturing intricate sea ice dynamic processes within the narrow channels of the CAA. Specifically, the import, survival, and thickness of MYI are difficult to predict and may in fact increase during the transition to a sea ice-free Arctic with more mobile ice conditions in the Queen Elizabeth Islands which are located between the Arctic Ocean and NWP. Presumably, MYI from the Arctic Ocean will be more heavily ridged and thicker than locally formed MYI, posing greater danger to transiting ships than locally grown MYI.

Whilst we look forward to the prospects of the “transition to a sea ice-free Arctic”, what about the prospects for the Northwest Passage in the summer of 2016. As you can see from the video there wasn’t much in the way of multi-year sea ice left there by the Autumn of 2015, and there doesn’t seem to have been much transport of ice into the Canadian Arctic Archipelago over the winter either.

NWP-Development-20160328

On top of the ice there will of course be some snow by now. Here’s how the Topaz 4 snow cover map of the area looks at the moment:

Topaz4-CAA-20160404

All in all it looks to me at this early stage of the 2016 Arctic sea ice melting season as though one or more of the assorted routes through the Northwest Passage will be open again this coming summer. Do you suppose that will look like yet another “unprecedented retreat” to “Golf Charlie’s” eyes?

It seems as though a large commercial organisation sees things that way too. Crystal Cruises have concluded that in 2016 the Northwest Passage offers:

The ultimate expedition for the true explorer!

Anchorage to New York on Crystal Serenity
DATES : August 16 – September 17, 2016 (32 Days) CRUISE-ONLY FARES FROM : $21,855 Per Person

More than 18 months of careful planning and analysis has already gone into this project from January 2013 to July 2014, and will continue up to, and through, departure.

Crystal_Serenity

There will not be shore-based cell phone signals along the transit, except in the communities and towns we will be visiting. However, guests are requested to not use this signal when in port, as it will overwhelm the local system and disrupt the communication within the community.

While communication channels may be temporarily limited or unavailable to guests, the ship’s Captain and crew will always have operational and emergency communication throughout the entire voyage.

HadISST Historical Arctic Sea Ice Concentration Data

Commenter Henry P over on “Steve Goddard’s” (un)Real Science blog poses the following question:

Unfortunately, we do not have any record of ice around 1929. But there was an eyewitness report of the melting of ice around 1923. Noting that Antarctic ice is currently increasing, my question to you Jim is simply this: why do you think that Arctic melt now is more than 87 years ago?

By way of a partial answer to that question, the United Kingdom’s Meteorological Office (Met Office or UKMO for short) maintains the Hadley Centre Sea Ice and Sea Surface Temperature data set (HadISST for short). Unfortunately Henry P is obviously sadly misinformed, since according to the Met Office:

HadISST is a unique combination of monthly globally-complete fields of SST and sea ice concentration on a 1 degree latitude-longitude grid from 1870 to date.

Here is what the HadISST data set reveals for September 1929:

HadISST-19290916

compared to September 2015:

HadISST-20150916

Surely a working pair of Mark 1 eyeballs should be sufficient to allow even a dyed in the wool denizen of (un)Real Science to spot the difference?

The 2016 Arctic Winter Sea Ice Puzzle

Professor Judith Curry recently posed the following rhetorical question on her “Climate Etc.” blog:

Arctic sea ice extent has been anomalously low this winter. The greatest anomalies are in the European sector, specifically in the Barents Sea. To what extent are the anomalies associated with warm temperatures?

Which she answered as follows:

So, what might be causing this particular anomaly? Some possibilities are:

  • Gobal warming (January 2016 was warmest Jan on record, according to the surface temperature analyses

  • Multidecadal oscillations (e.g. stadium wave) predicts ice recovery to be occurring in the same region (European Arctic) where we see the sea ice decline).

  • Seasonal weather circulation patterns – this has been a year with with unusual weather patterns, with both low temperature and high temperature records being set.

As regular readers will already be aware we have been blogging about anomalously warm temperatures in the Arctic all year and so felt well qualified to contribute to the “debate”. What a job that turned out to be! Early on in the proceedings the anticipated pronouncement was made by one of Judith’s “denizens”. A link to a ludicrously inaccurate article on Watts Up With That accompanied by the following words of wisdom:

Other measures are high.

Which of course they aren’t! Instead of stating the bleedin’ obvious Professor Curry replied:

I spotted this, no idea what to make of it.

You would think she and her denizens would therefore have been pleased when I attempted to explain to her what to make of it, but you would have been mistaken. The icing on the ad hominem cake was the aforementioned Anthony Watts driving by to accuse me of all sorts of nefarious activities without providing a single shred of evidence and then running for the hills when invited to actually prove his ludicrous allegations.

Since the denizens of “Climate Etc.” aren’t particularly interested let’s take stock here instead shall we? After every Arctic area and extent metric under the sun sitting at “lowest *ever” levels for weeks a recent increase in coverage on the Pacific side of the Arctic has changed that. The most up to date example of that is the JAXA/ADS extent, which currently looks like this:

vishop_extent-20160228

The latest reading is the merest whisker above 2015’s record low maximum. However in other respects things are most certainly not comparable with 2015. See for example this concentration comparison from Andrew Slater of the NSIDC:

ice_con_delt_20160227

Much more ice on the Pacific periphery where it will all have disappeared by September, as opposed to much less ice on the Atlantic side, even well to the north of 80 degrees latitude where the sun still does not shine. Here’s a video revealing how the sea ice North of the Pacific Ocean has been reacting to the sequence of hurricane force storms that have been passing through the area over the past couple of months:

Now let’s take a look at “near real time” Arctic sea ice thickness as measured by the CryoSat 2 satellite:

CryoSat2_20160225

Notice the absence of any thick ice in the Beaufort and Chukchi Seas, an obvious difference from last year? Notice too the large area of thick ice that looks as though it’s heading towards the Fram strait exit from the Central Arctic. Here’s another video, this time of sea ice movement over on the Atlantic side of the Arctic Ocean:

Those dark areas between Svalbard and the North Pole are suddenly starting to look as though they represent reality rather than a mere “artifact”, although perhaps they are merely transient evidence of yet another Arctic “heat wave”?

Is the Northwest Passage Open Yet?

People keep on posing that question just at the moment. Here’s a typical example from the Arctic Sea Ice Blog this morning:

Albeit not ‘officially’ declared as such, the daily Uni-Bremen chart shows Amundsen’s route is cleared and free now.

Here’s an extract from the “Daily Uni-Bremen chart” referred to, with an apparently “ice free” section of the southern route through the Northwest Passage highlighted:

asi-AMSR2-n6250-20150813-hilite

As we’ve been discussing here recently, the automated passive microwave based satellite Arctic sea ice concentration products can miss ice that’s visible to the naked human eye. Here’s some pictures from the Great White Con Northwest Passage page:

NASA Worldview “false-color” image of the Northwest Passage on August 13th 2015, derived from bands 7, 2 and 1 of the MODIS sensor on the Terra satellite

The Canadian Ice Service sea ice concentration chart for the Queen Maud Gulf on August 13th 2015

Here’s an extract from the NSIDC’s Multisensor Analyzed Sea Ice Extent (MASIE) product (currently for August 12th 2015):

masie_all_r00_v01_2015224_crop

and here’s an extract from an answer I gave to a similar question on the Arctic Sea Ice Forum earlier this morning:

The Canadian Ice Service still have 4-6/10 ice within a whisker of the coast. Would you fancy your chances in amongst that and a bit of a breeze?

The CIS definition of “navigable” is “a criteria of less than 60% ice cover over all sections of the Northwest Passage”. See:

http://ec.gc.ca/glaces-ice/default.asp?lang=En&n=765F63E4-1

and the inset map at:

CIS-NWP-MinConc-2014

The answer to the question posed in the title to this article is therefore currently NO, the Northwest Passage is not open yet, both officially from the CIS and unofficially from any mariner with a sense of self preservation in charge of any vessel that isn’t “ice hardened”. In all the circumstances that answer might change quite quickly though!

[Edit 18/09/15]

The Canadian Ice Service have finally published a close up map of the Parry Channel that doesn’t say “No Analysis”. Here it is:

CIS_Parry_20150917-Crop

There’s still a (narrow!) green path into McClure Strait, so I reckon we can at long last confidently declare the main Northwest Passage to be OPEN!

What Planet is Tony Heller On?

There’s no rest for the wicked! Tony Heller, still better known as the pseudonymous “Steven Goddard”, is promulgating his erroneous Arctic sea ice narrative once again this morning. In an article entitled “Rommulans Never Learn” he has this to say:

From five years ago, the Arctic was doomed and I was a denier. And five years later, the ice is still almost exactly the same as twenty years ago.

and he then presents this Cryosphere Today image comparing Arctic sea ice concentration on June 1st 2015 with the same date in 1995:

unRealScience-CTcombo-20150605

and comments:

Someone with an IQ over 30 might be able to figure it out, but not climate alarmists.

Obviously Steve/Tony hasn’t received our message yet, so we repeated it yet again:

At the risk of repeating myself repeating myself, the ice is NOT still almost exactly the same as twenty years ago:

https://stevengoddard.wordpress.com/2015/05/29/trouble-looming-for-arctic-alarmists/#comment-524677

“Can you see the dark blue areas in the 2015 image where there aren’t any in the 1995 image? Try looking at the Beaufort Sea, the Chukchi Sea, the Kara Sea and the North Water Polynya”

The shiny white area in the 2015 image is also of course a long way from the current reality.

For those with an IQ of 30 or less who would like to play “spot the difference” with us, here is a hastily prepared animation of a somewhat pixellated Chukchi Sea:

1995-2015-0601-Chukchi


[Edit 15:15 BST July 5th 2015]

Steve/Tony has published another article about the Arctic today. This one is entitled “Scientific American Calls For An Ice-Free Arctic In 12 Weeks” and claims yet again that:

Arctic sea ice is closely tracking 2006, the summer with the highest minimum of the past decade.

Have we got news for you Tony? Using your preferred metric du jour:

2015-06-05_1600_unRealScience

[Edit 10:15 BST July 6th 2015]

“Caleb” is giving me still more stick over at “Real Science”:

It is my duty to report what actually is happening, even if it isn’t what I expect.

I sure do wish Mr. Hunt would learn to do the same. Why on earth he would want to tell us ice was melting when it seemed obvious it was refreezing is beyond me. Does he have some deep need to humiliate himself, like a medieval person undergoing self-flagellation?

Of course I couldn’t take that lying down, so:

For your information, and that of anyone else who might be interested, the core temperature of the ice floe underneath 2015A got up to -1.34 °C yesterday:

2015-06-05-2015A

Finally, for the moment at least, here’s an animated GIF of the North Water Polynya which I fear won’t impress Treesong very much:

1995-2015-0601-NWPolynya

[Edit 16:00 BST July 7th 2015]

If you repeat something often enough does it eventually turn into the truth? Today’s Arctic article from Steve/Tony is strangely familiar. It is entitled “Arctic Sea Ice Continues To Track 2006“. However according to the NSIDC today:

Charctic-2006-20150606-1

[Edit 11:00 BST July 11th 2015]

Steve/Tony keeps maintaining every day or two that “Arctic Sea Ice Continues To Track 2006”. There’s been a cyclone over the central Arctic with a minimum central pressure of 970 hPa (or mb if you prefer), which has caused some divergence of the sea ice:

Synopsis-20150607-crop

Here’s a closeup of the recent history of a variety of “compactness” metrics which illustrates that point:

amsr2-compact-20150610-crop

Across the board the sea ice in the Arctic is less compact than a few days ago as a result of the cyclone, but still more compact than on the same date in other recent years. Getting back to the extent metrics, here’s what the DMI 30% threshold version has been up to:

2015-06-10-DMI30

and here’s the NSIDC 5 day average of their 15% threshold flavoured variety:

2015-06-10-Charctic-2006

[/Edit]