By way of a change we start this month’s look at all things Arctic with some sea ice statistical analysis. Anthony Watts’ Arctic porky pie production line has been speeding up recently, and I am not the only one who has noticed. As part of his takedown of the latest “skeptical” allegations against the United Kingdom Met Office Tamino has been looking at trends in Arctic sea ice extent over at his “Open Mind” blog:
First and foremost, the yearly minimum is only one day out of the year. We have sea ice extent data throughout the year, and what happens during the rest of the year counts. Instead of using the annual minimum, let’s use the annual average. To avoid losing the most recent data, I’ll compute the yearly average for October through the following September rather than the usual (but arbitrary) January through December. I’ll also omit October 1978 through September 1979 because that year is incomplete. I get this:
The annual averages show much less fluctuation than the annual minima, so we can estimate things like rates of change with greater precision. I find that there is statistical evidence that the rate changed over time. One model of such changes uses three straight-line segments with their changes chosen to best-fit the data, like this:
There isn’t a million more square kilometers of ocean covered with ice than at the same time last year. Or is there?
For our younger readers perhaps I should point out that is a reference to the genesis of the Great White Con blog way back in the mists of time in September 2013, when a Daily Mail headline proudly, but erroneously, declared that:
And now it’s global COOLING! Record return of Arctic ice cap as it grows by 60% in a year.
With the COP26 conference due to start in Glasgow on October 31st UK Prime Minister Boris Johnson had this to say to the United Nations General Assembly yesterday, amongst other things:
In the words of the Oxford philosopher Toby Ord “we are just old enough to get ourselves into serious trouble”…
It is time for humanity to grow up.
It is time for us to listen to the warnings of the scientists – and look at Covid, if you want an example of gloomy scientists being proved right – and to understand who we are and what we are doing.
The world – this precious blue sphere with its eggshell crust and wisp of an atmosphere – is not some indestructible toy, some bouncy plastic romper room against which we can hurl ourselves to our heart’s content.
Daily, weekly, we are doing such irreversible damage that long before a million years are up, we will have made this beautiful planet effectively uninhabitable – not just for us but for many other species.
And that is why the Glasgow COP26 summit is the turning point for humanity.
If all that sounds unlikely, then take a look:
https://youtu.be/Z_YPE7vy_wQ?t=27
As we surmised at the time of the recent G7 Summit in Cornwall:
Prompted by my (no doubt vain?) attempt to hold a sensible discussion about the greenhouse effect in a rather hostile environment, we have just added a brand new page to the long list of Great White Con educational resources:
A very brief history of the science of the greenhouse effect, courtesy of Ed Hawkins:
In the 1820s, the French mathematician Joseph Fourier was trying to understand the various factors that affect Earth’s temperature. But he found a problem – according to his calculations, the Earth should have been a ball of ice.
In 1861, the Irish physicist John Tyndall performed an experiment which changed our view of the atmosphere. Tyndall demonstrated that gases such as methane and carbon dioxide absorbed infrared radiation, and could trap heat within the atmosphere.
Svante Arrhenius, a Swedish chemist, provided the first numerical estimates of “climate sensitivity” – defined as the temperature change corresponding to a doubling of carbon dioxide in the atmosphere. He suggested a value around 4°C in 1896.
In 1938, Guy Stewart Callendar revealed evidence for a 0.3°C rise in global temperatures over the previous 50 years.
Much more recently “Tamino” has just penned an article on his Open Mind blog entitled:
Intriguingly the supplementary materials accompanying Rasmus’ paper include ‘R’ source code!
If you have any constructive comments to make about efforts to explain the physics of the greenhouse effect to a lay audience and/or our new resource on that topic please feel free to do so in the space provided below.
Our regular reader(s) may recall that this time last year we took umbrage at an article by David Rose in the Mail on Sunday about the joint NASA/NOAA press briefing outlining their findings about global surface temperatures in 2014.
We’ve been discussing Mr. Rose’s recent misleading “Tweets” about the Arctic with him:
As a consequence we also found ourselves in conversation with Gavin Schmidt of NASA about this year’s NASA/NOAA press briefing about global surface temperatures in 2015, which takes place on January 20th. Pencil it into your diary:
Climate experts from NASA and the National Oceanic and Atmospheric Administration (NOAA) will discuss the release of new data on 2015 global temperatures, and the most important weather and climate events of the year, during a media teleconference at 11 a.m. EST Wednesday, Jan. 20.
The teleconference panelists are:
Gavin Schmidt, director of NASA’s Goddard Institute for Space Studies in New York
Thomas R. Karl, director of NOAA’s National Centers for Environmental Information in Asheville, North Carolina, and chair of the Subcommittee on Global Change Research for the U.S. Global Change Research Program in Washington
Media can participate in the teleconference by calling 888-790-1804 (toll-free in the United States and Canada) or 415-228-4885 (international) and use the passcode “climate.”
Audio of the briefing, as well as supporting graphics, will stream live.
Whilst we wait with bated breath for the NASA/NOAA announcement, here’s how the Gavin, David & Snow show has been going over on Twitter:
You will note from the exchange on Twitter that the Berkeley Earth Surface Temperature project are one of the organisations that have already declared 2015 “The Warmest Year in the Modern Record”, which brings me to the Arctic connection. Tamino explains over at “Open Mind”, in an article entitled “Hottest Year On Record“:
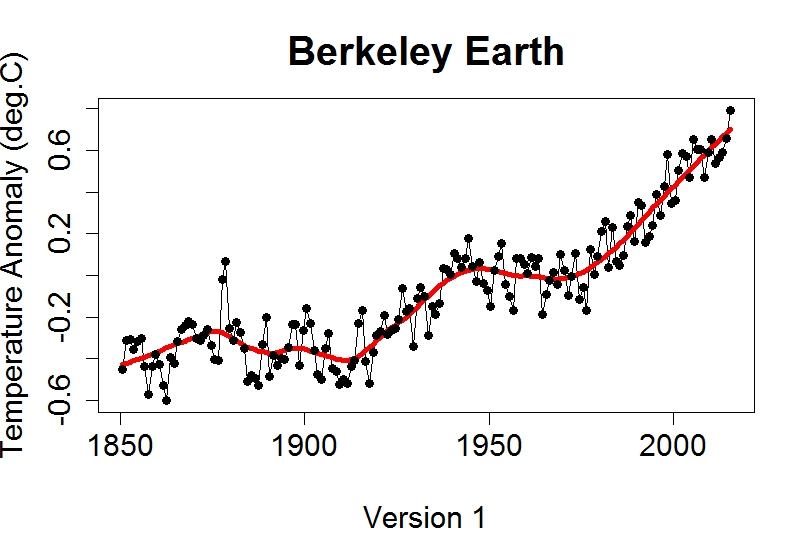
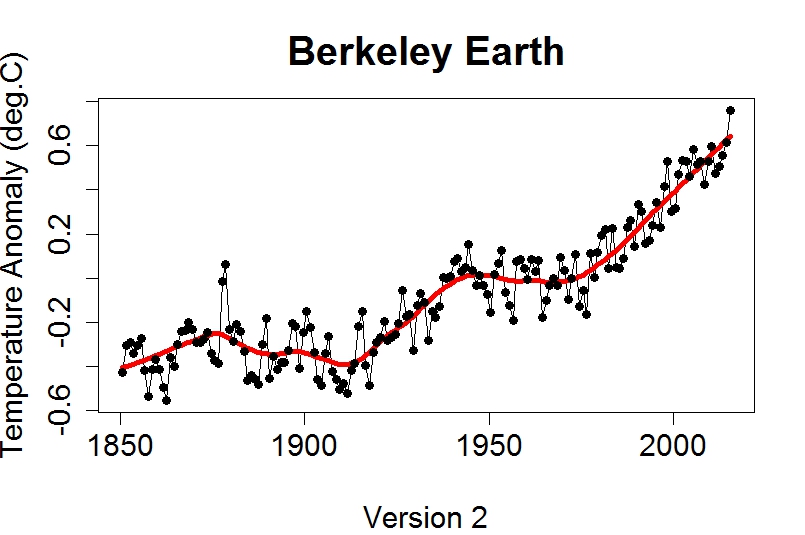
When it comes to global temperature over land and sea, Berkeley produces two versions, different in the way they treat areas covered with sea ice. Version 1 uses air temperature estimates for sea-ice covered regions, version 2 uses ocean temperature estimates.
and quotes BEST as follows:
For most of the ocean, sea-surface temperatures are similar to near-surface air temperatures; however, air temperatures above sea ice can differ substantially from the water below the sea ice. The air temperature version of this average shows larger changes in the recent period, in part this is because water temperature changes are limited by the freezing point of ocean water. We believe that the use of air temperatures above sea ice provides a more natural means of describing changes in Earth’s surface temperature.
As Tamino puts it:
Let’s not keep you in suspense any longer. Here are annual averages through 2015 (which is now complete) according to version 1:
Here it is according to version 2:
Any way you look at it, 2015 is the hottest. Any way you look at it, there was no “pause” in global temperature.
[Edit – 17:30 UTC on January 20th 2016]
The joint NASA/NOAA media briefing on 2015 global average surface temperatures has just finished. The recording of the event is due to go online “in 2 hours” or so from:
I waited patiently in the NASA/NOAA queue to ask some Arctic related questions, but never received the call. I’ll let you know when I receive the promised answers by email.
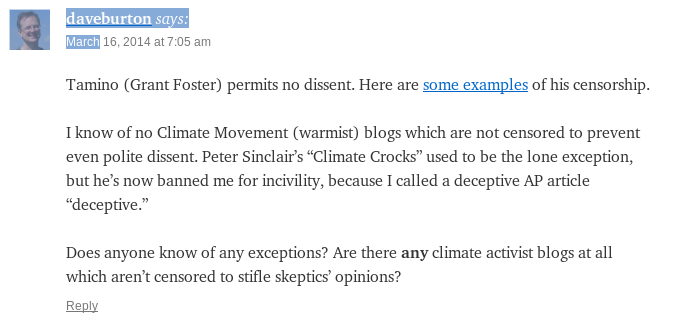
Earlier on this morning a debate about censorship started over on the so called “Real Science” blog. Unfortunately after a couple of attempts it became clear to me that my participation was not welcome.
Them:
A question about censorship is posed on the “Real Science” blog
Subsequently, back on “Real Science” (and possibly thanks to Dave’s intervention below)
Them:
We’ll keep you posted!
This website uses cookies to improve your experience. We'll assume you're ok with this, but you can opt-out if you wish. Cookie settingsACCEPT
Privacy & Cookies Policy
Privacy Overview
This website uses cookies to improve your experience while you navigate through the website. Out of these, the cookies that are categorized as necessary are stored on your browser as they are essential for the working of basic functionalities of the website. We also use third-party cookies that help us analyze and understand how you use this website. These cookies will be stored in your browser only with your consent. You also have the option to opt-out of these cookies. But opting out of some of these cookies may affect your browsing experience.
Necessary cookies are absolutely essential for the website to function properly. This category only includes cookies that ensures basic functionalities and security features of the website. These cookies do not store any personal information.
Any cookies that may not be particularly necessary for the website to function and is used specifically to collect user personal data via analytics, ads, other embedded contents are termed as non-necessary cookies. It is mandatory to procure user consent prior to running these cookies on your website.