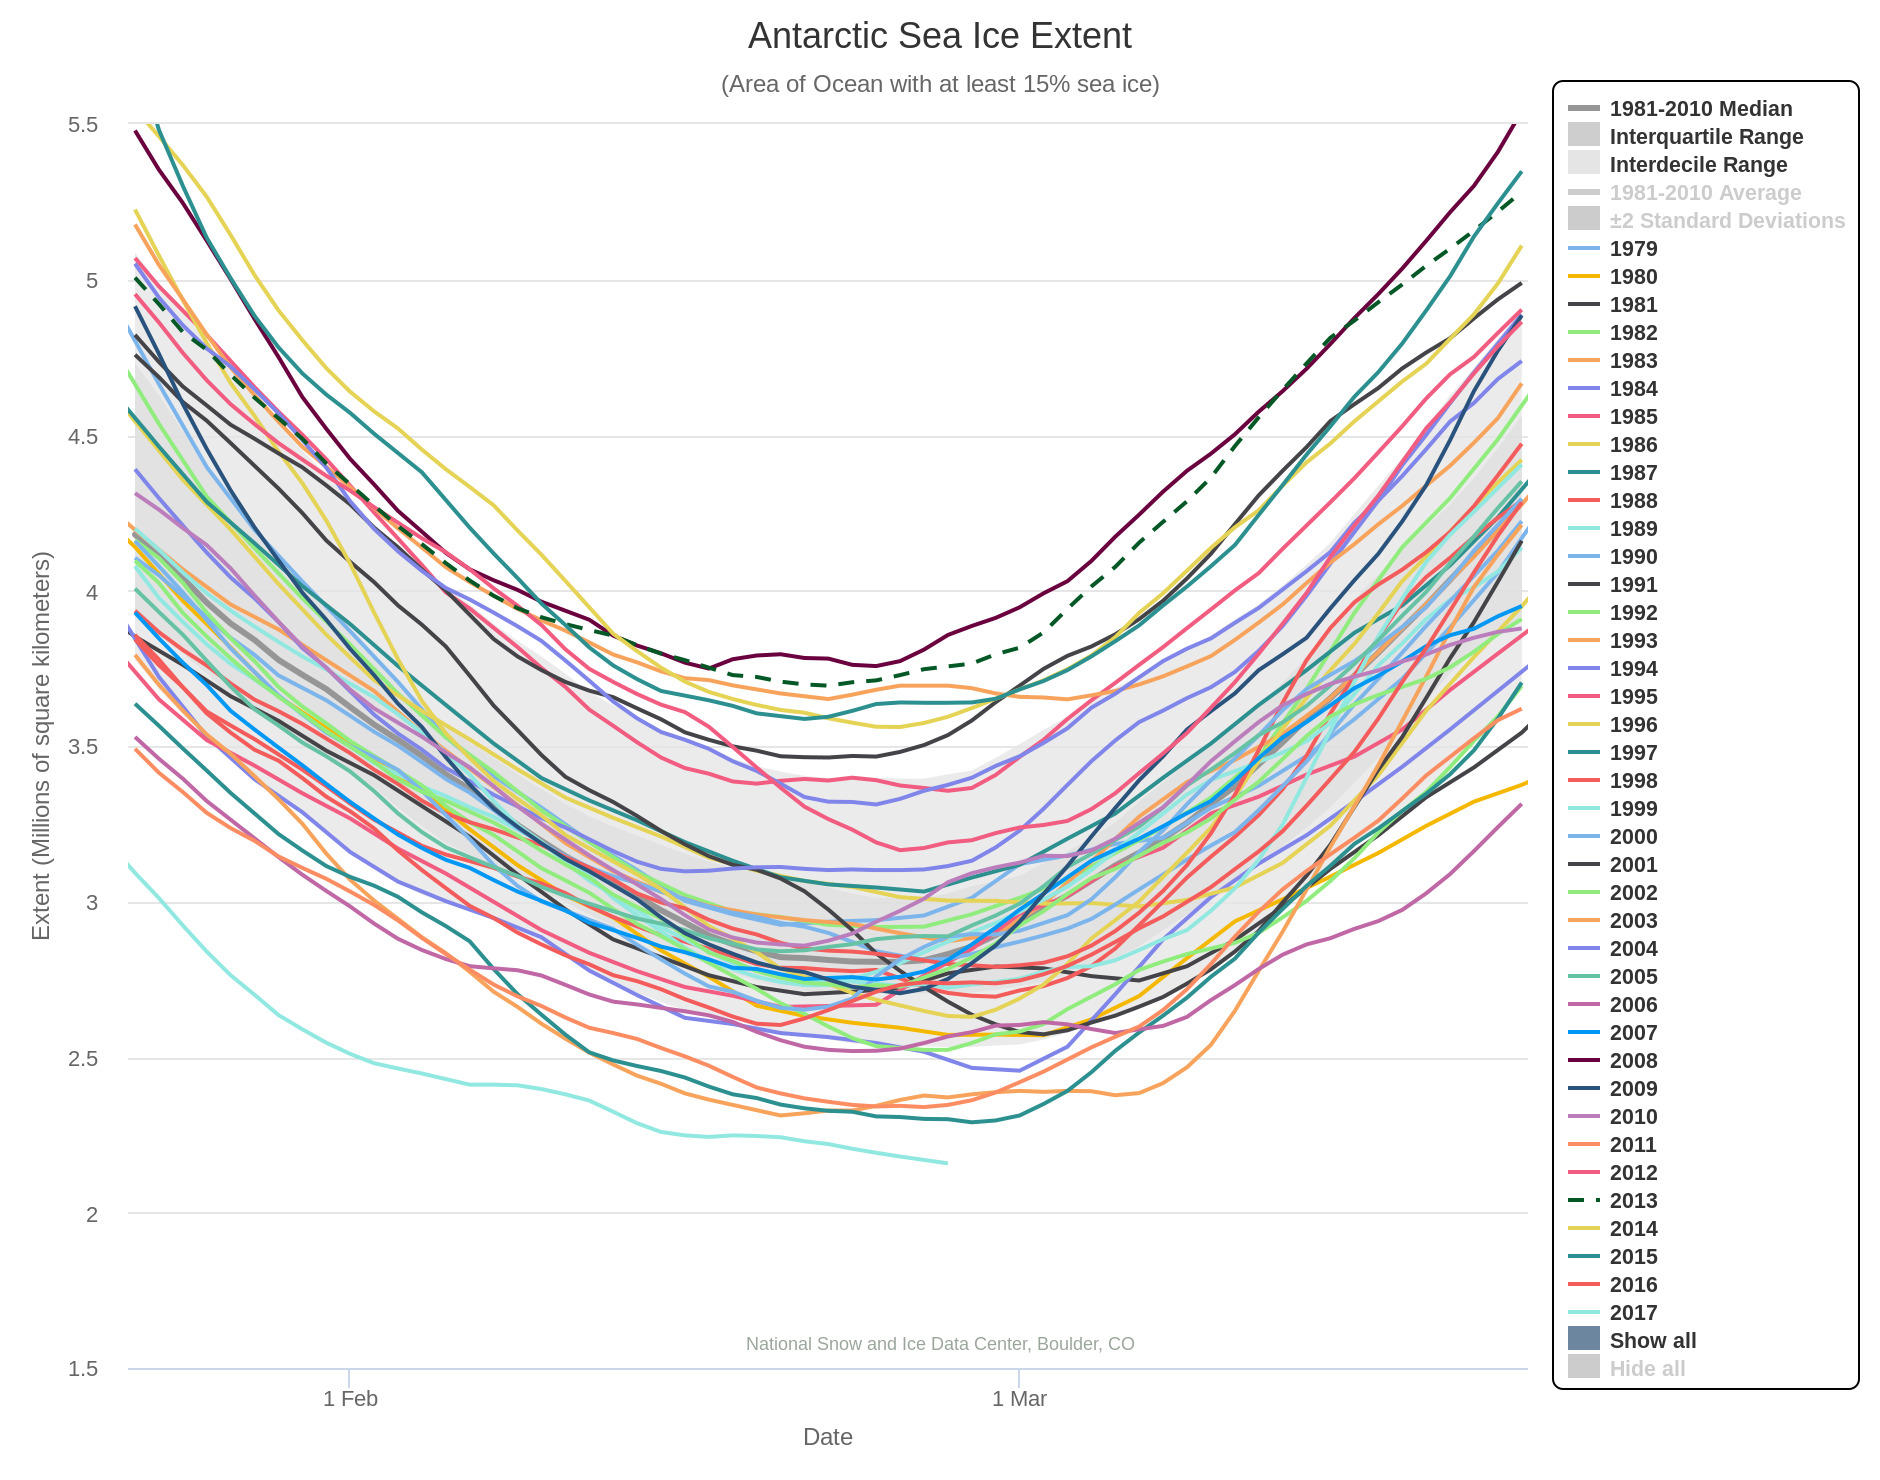
In 2017 Antarctic sea ice extent is beating all the records. All flavours of the metric are already below the minimum of all previous years in the satellite record, and it looks like there’s still some more melting left to go. Here’s the NSIDC’s 5 day averaged extent:
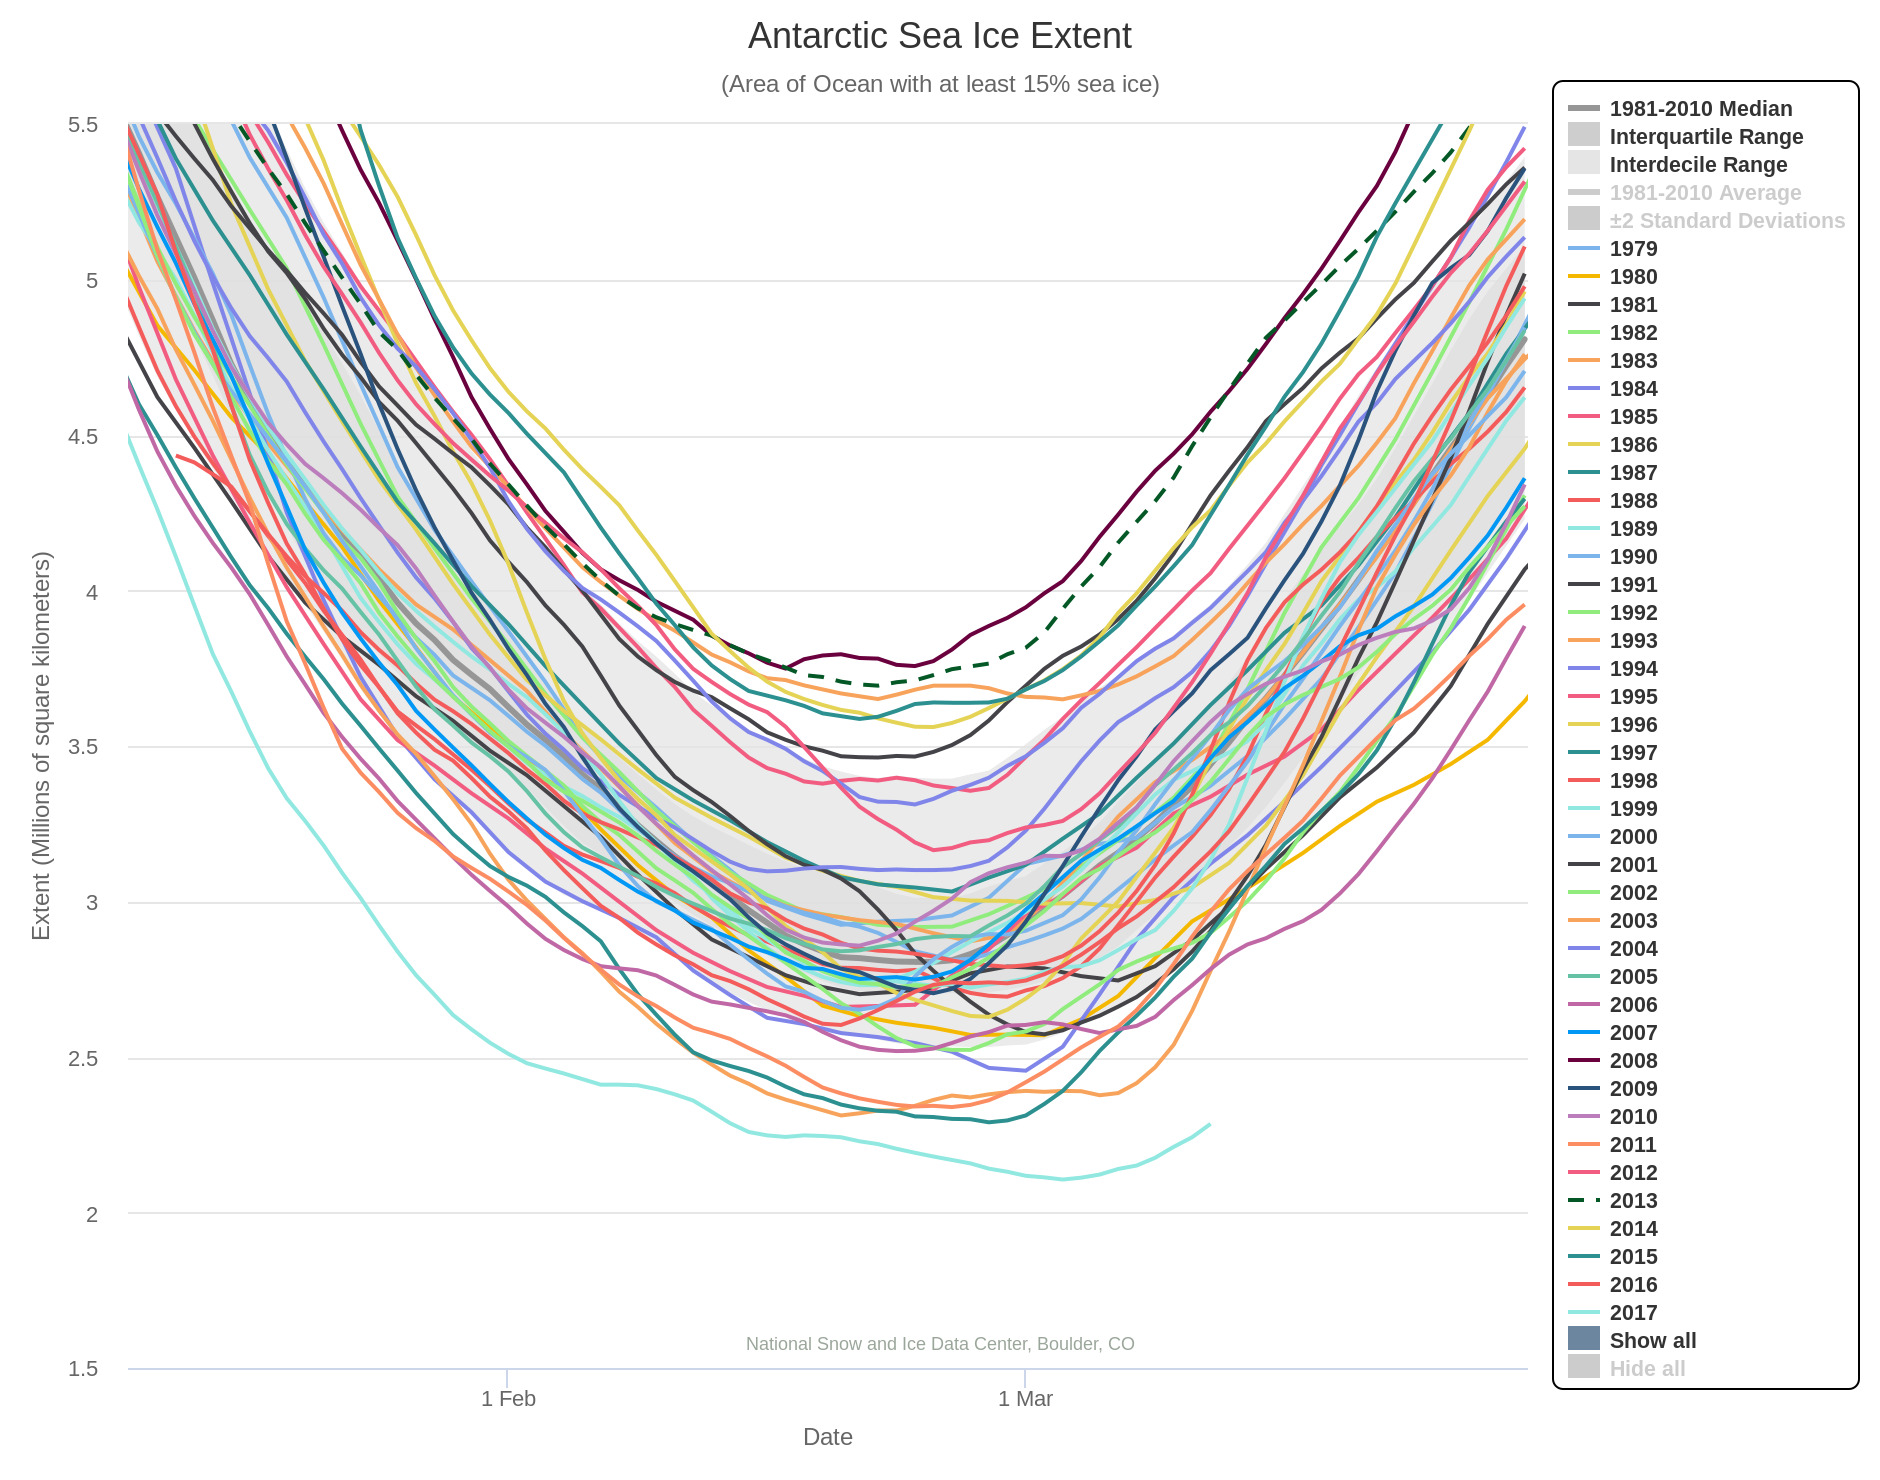
It seems highly likely that the 2017 Antarctic sea ice minimum extent has now been reached. Here’s the NSIDC 5 day averaged extent graph:
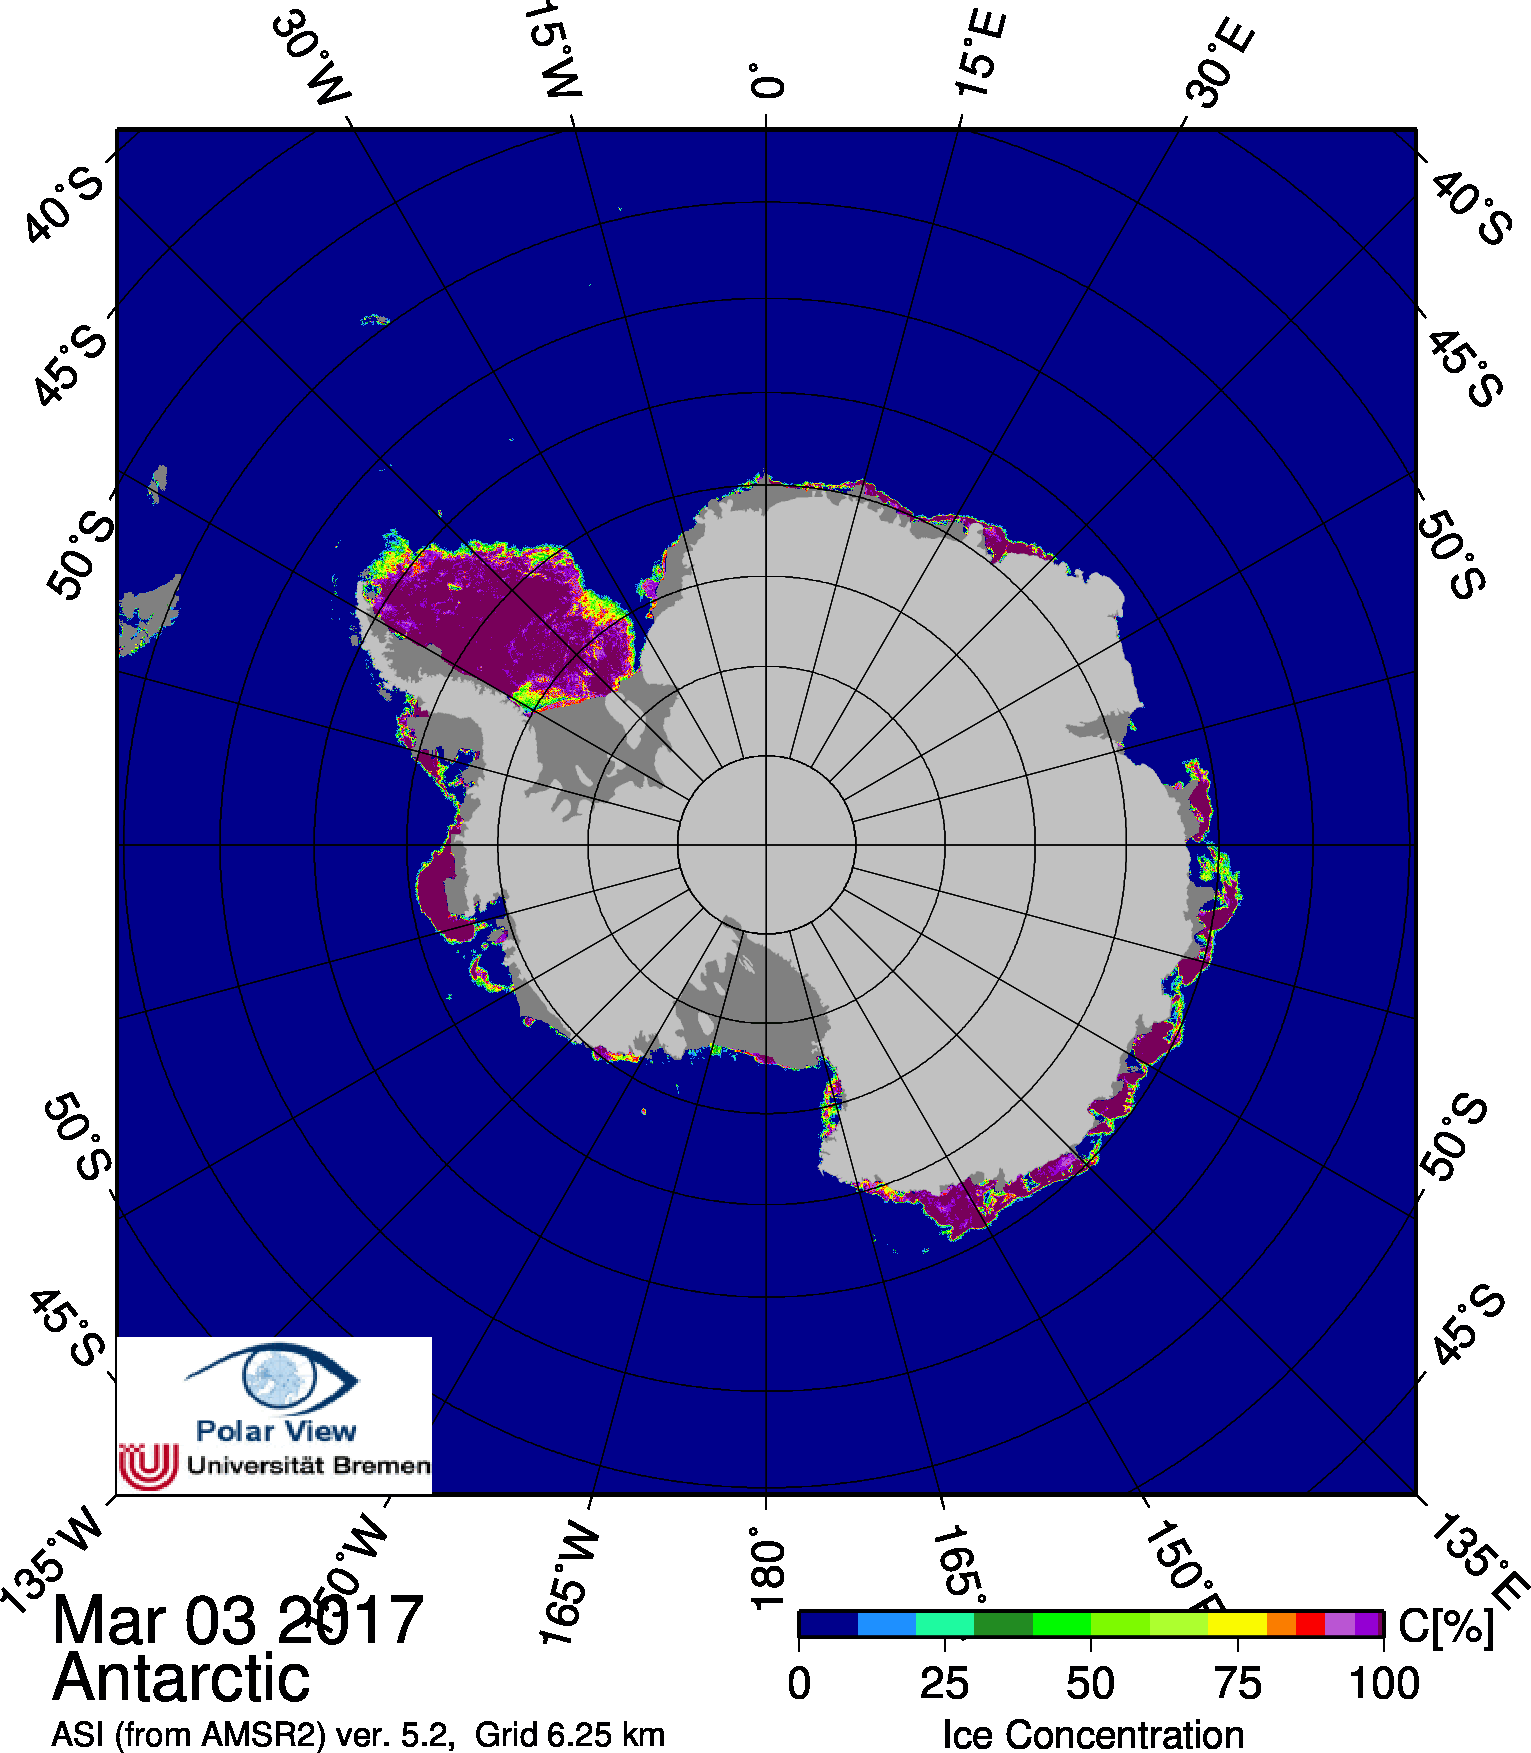
The minimum extent of 2.106 million square kilometers was reached on March 3rd. Here’s the University of Bremen’s Antarctic sea ice concentration map for March 3rd:
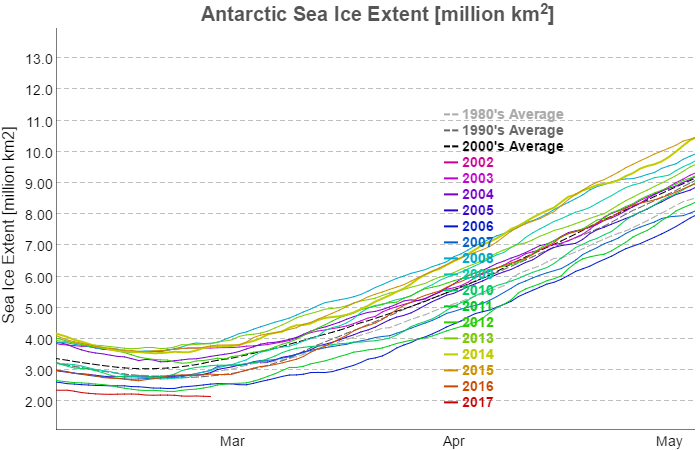
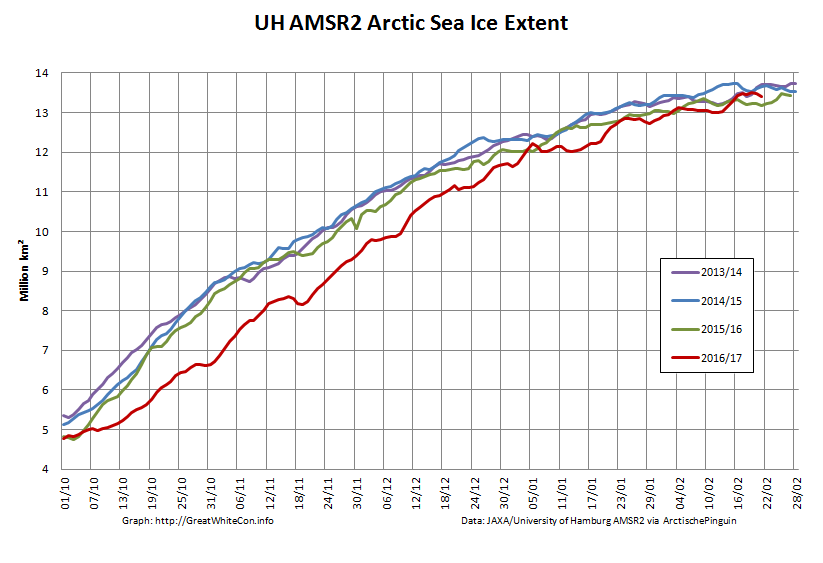
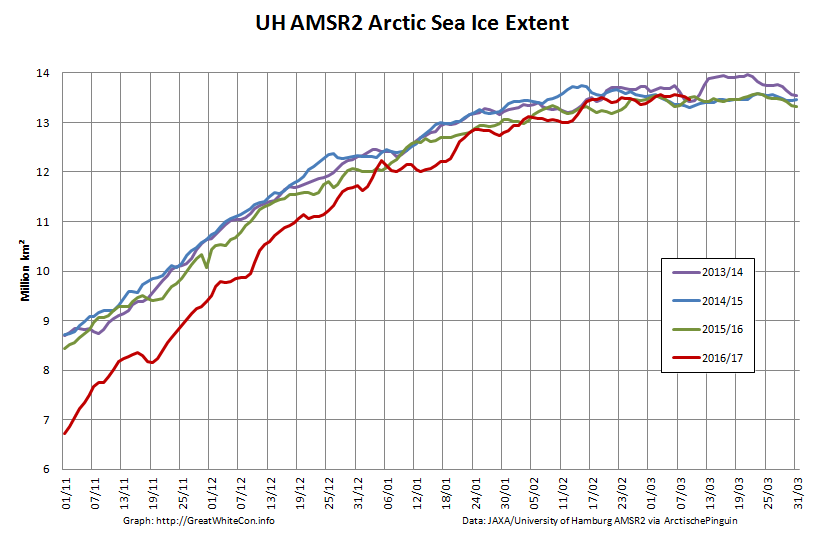
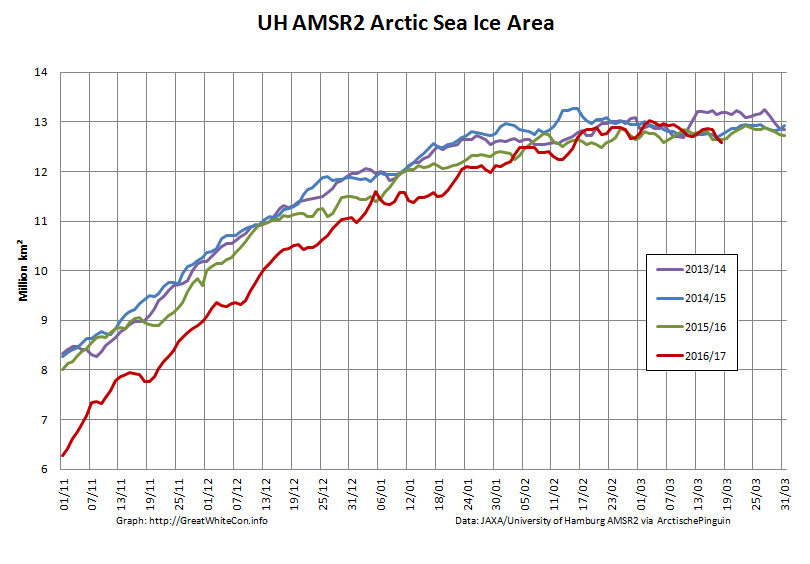
It’s far too early to be sure about this yet, but it’s not beyond the bounds of possibility that the 2017 maximum is already in place. Here’s our favourite high resolution extent graph calculated by “Wipneus” from University of Hamburg/JAXA AMSR2 data:
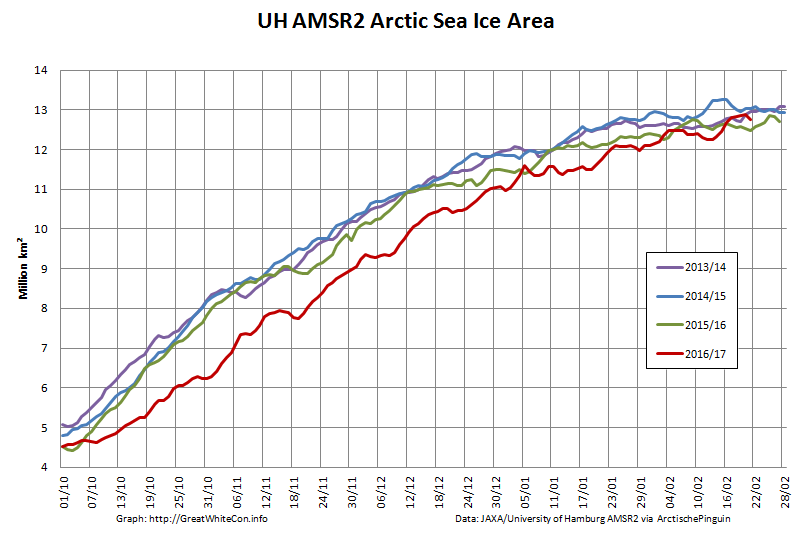
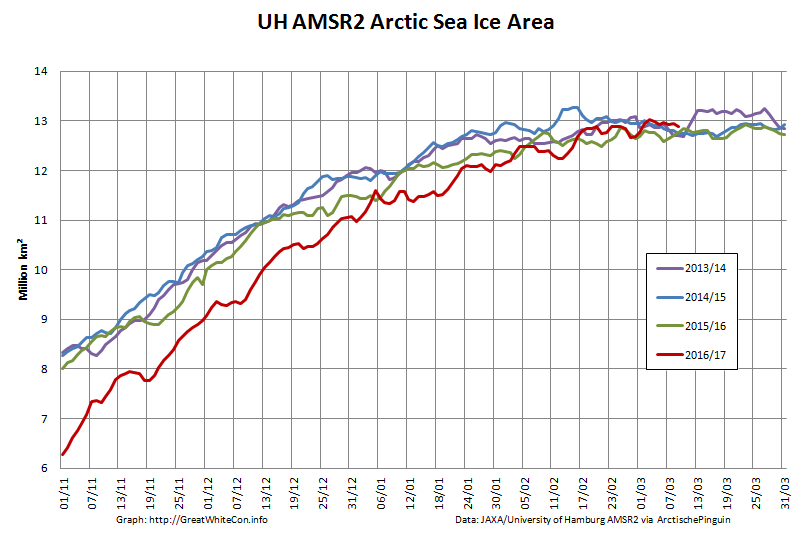
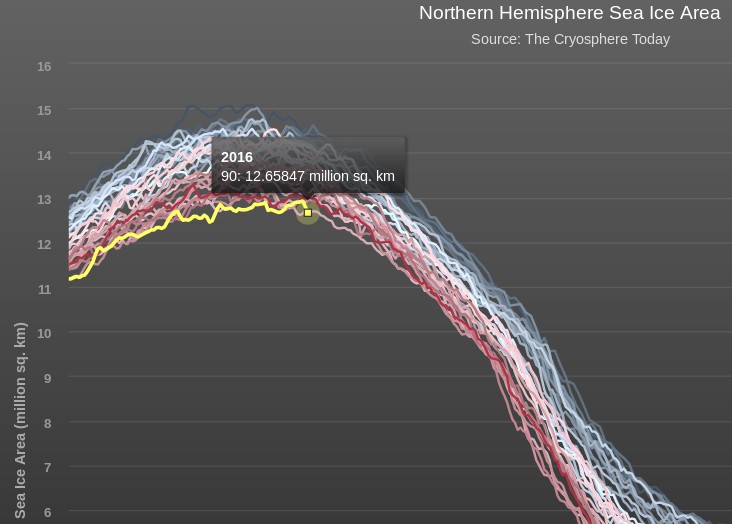
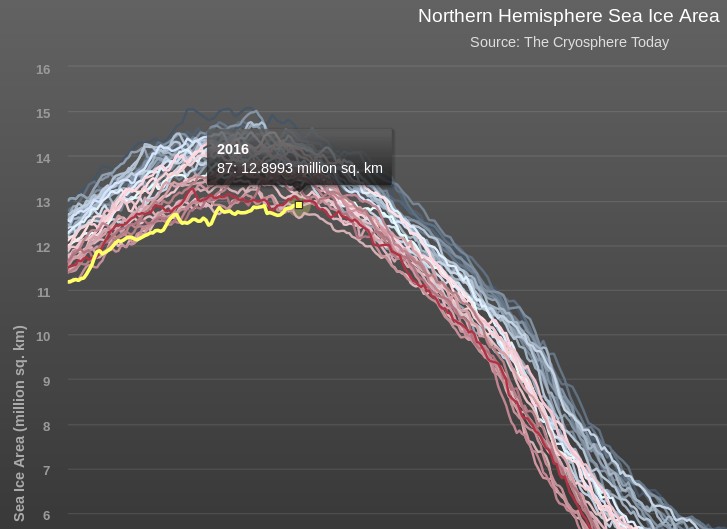
The current maximum Arctic sea ice extent for 2017 is 13.49 million square kilometers on February 19th. Here’s Arctic sea ice area for good measure:
The current maximum area for 2017 is 12.88 million square kilometers on February 20th. Here also is the NSIDC’s 5 day averaged extent:
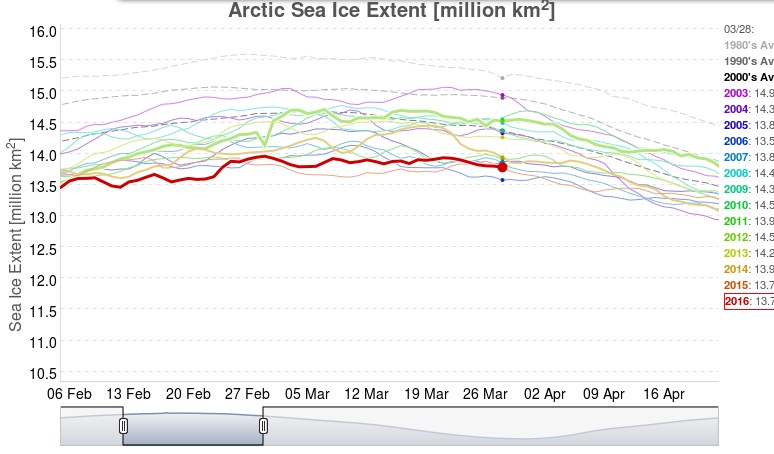
This reveals a current maximum extent for 2017 of 14.302 million square kilometers on February 20th.
[Edit – March 1st]
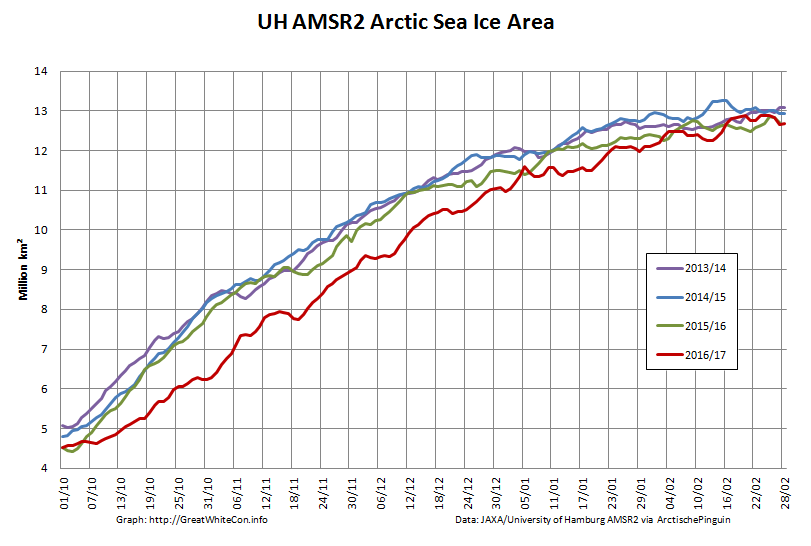
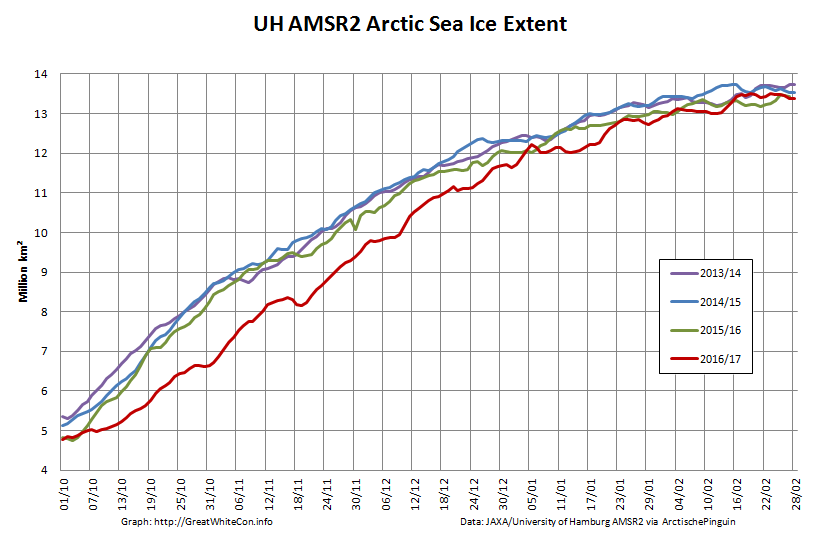
Here are the high resolution AMSR2 area and extent graphs for the end of February:
With each day that passes the highs of February 19th/20th look more likely to have been this years maximum. Nonetheless past experience suggests it’s still far to soon to be sure about that.
[Edit – March 10th]
Arctic sea ice area and extent are declining again, having reached new heights for the year on March 3rd:
However the 2013/14 winter showed a late surge is still possible.
[Edit – March 18th]
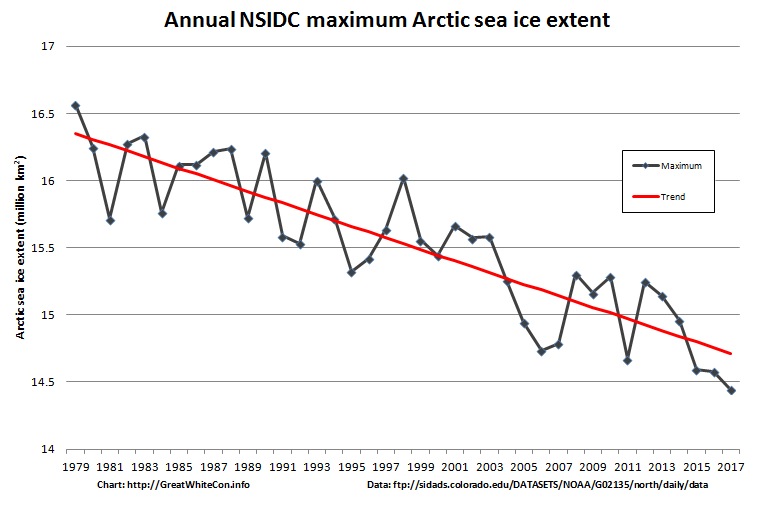
A “late surge” is looking increasingly unlikely. That being the case, here is our provisional long term graph of NSIDC daily Arctic sea ice extent:
Subject to an unanticipated “surge” the 2017 maximum of 14.447 million square kilometers occurred on March 5th.
JAXA extent has dropped steeply over the last couple of days, and it is now once again “lowest for the date since records began”:
The 2017 JAXA maximum of 13.878 million square kilometers occurred on March 6th.
In the continuing absence of updates to Cryosphere Today area, here’s the high resolution Arctic sea ice area graph calculated by “Wipneus” from University of Hamburg/JAXA AMSR2 data:
The maximum for that particular metric was 13.03 million square kilometers on March 3rd.
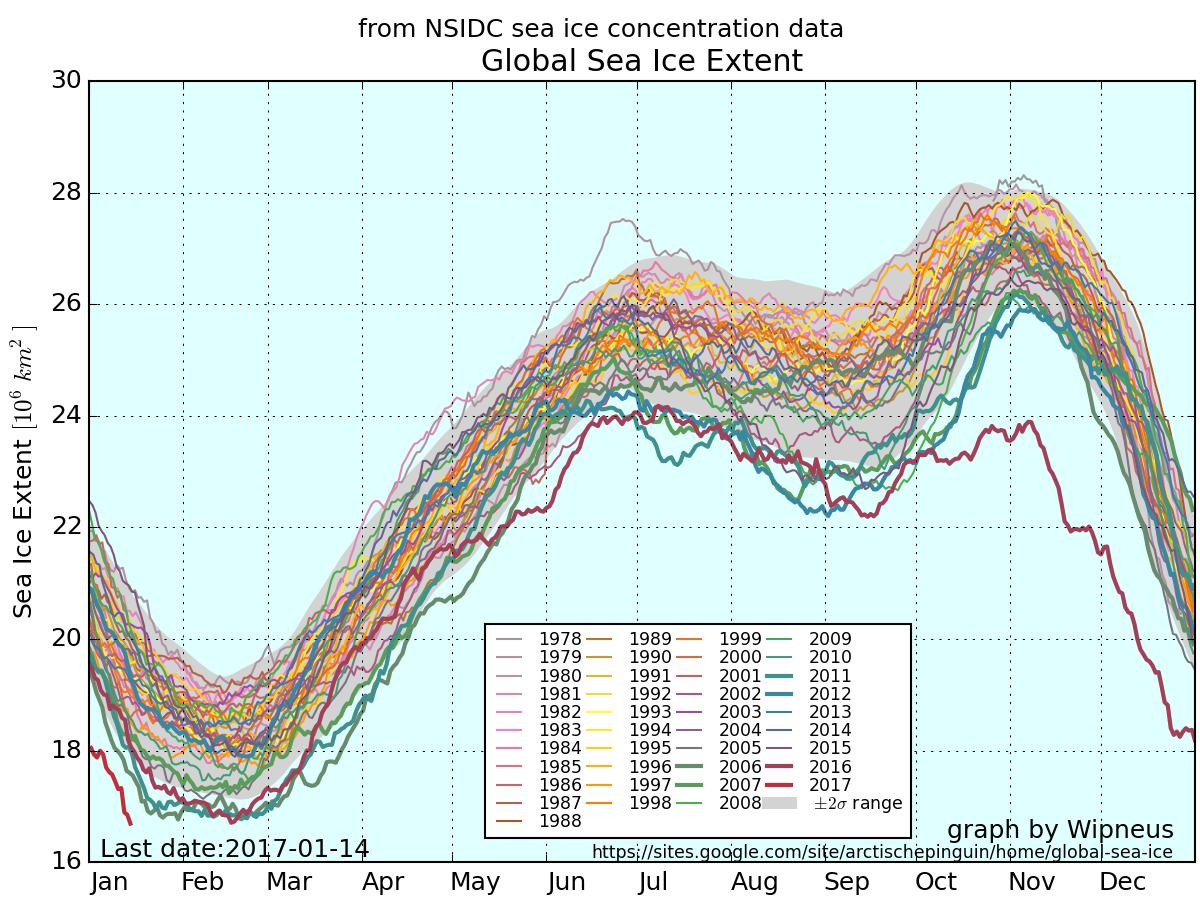
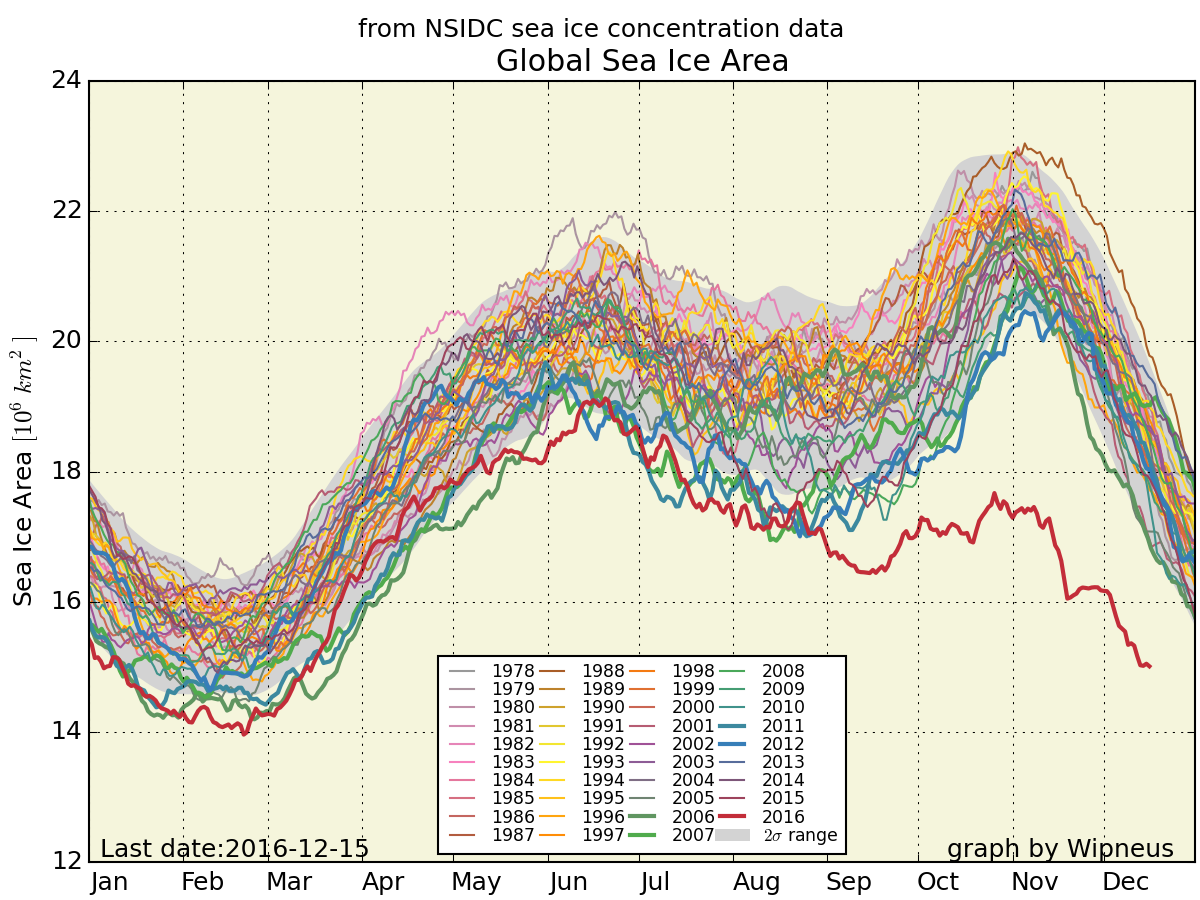
Here once again is the up to date version of Wipneus’ graphic graphic, this time of global sea ice extent:
As you can see, global sea ice extent has just reached the lowest ever level in the National Snow and Ice Data Center’s satellite records going back to 1979. It was over a month later when the previous record was broken in February 2016, so there is plenty of time for the metric to fall further.
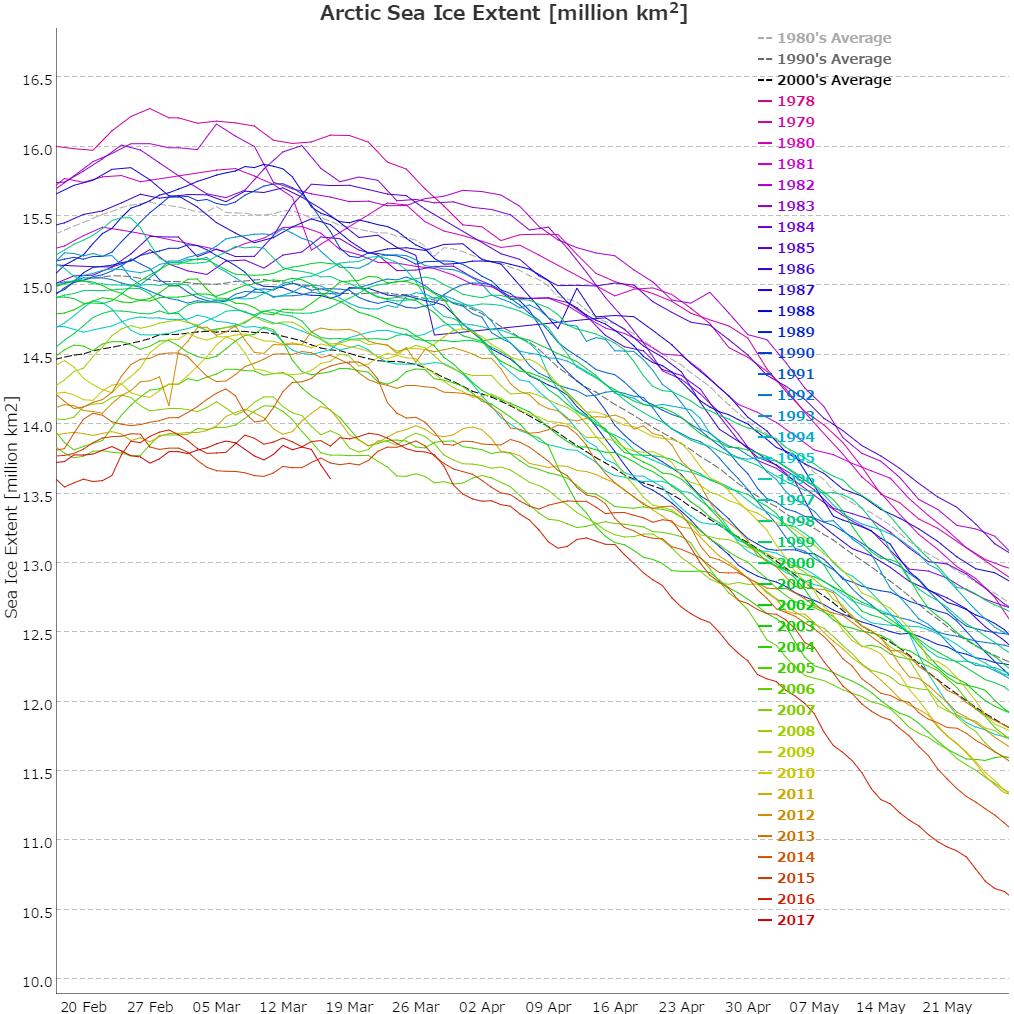
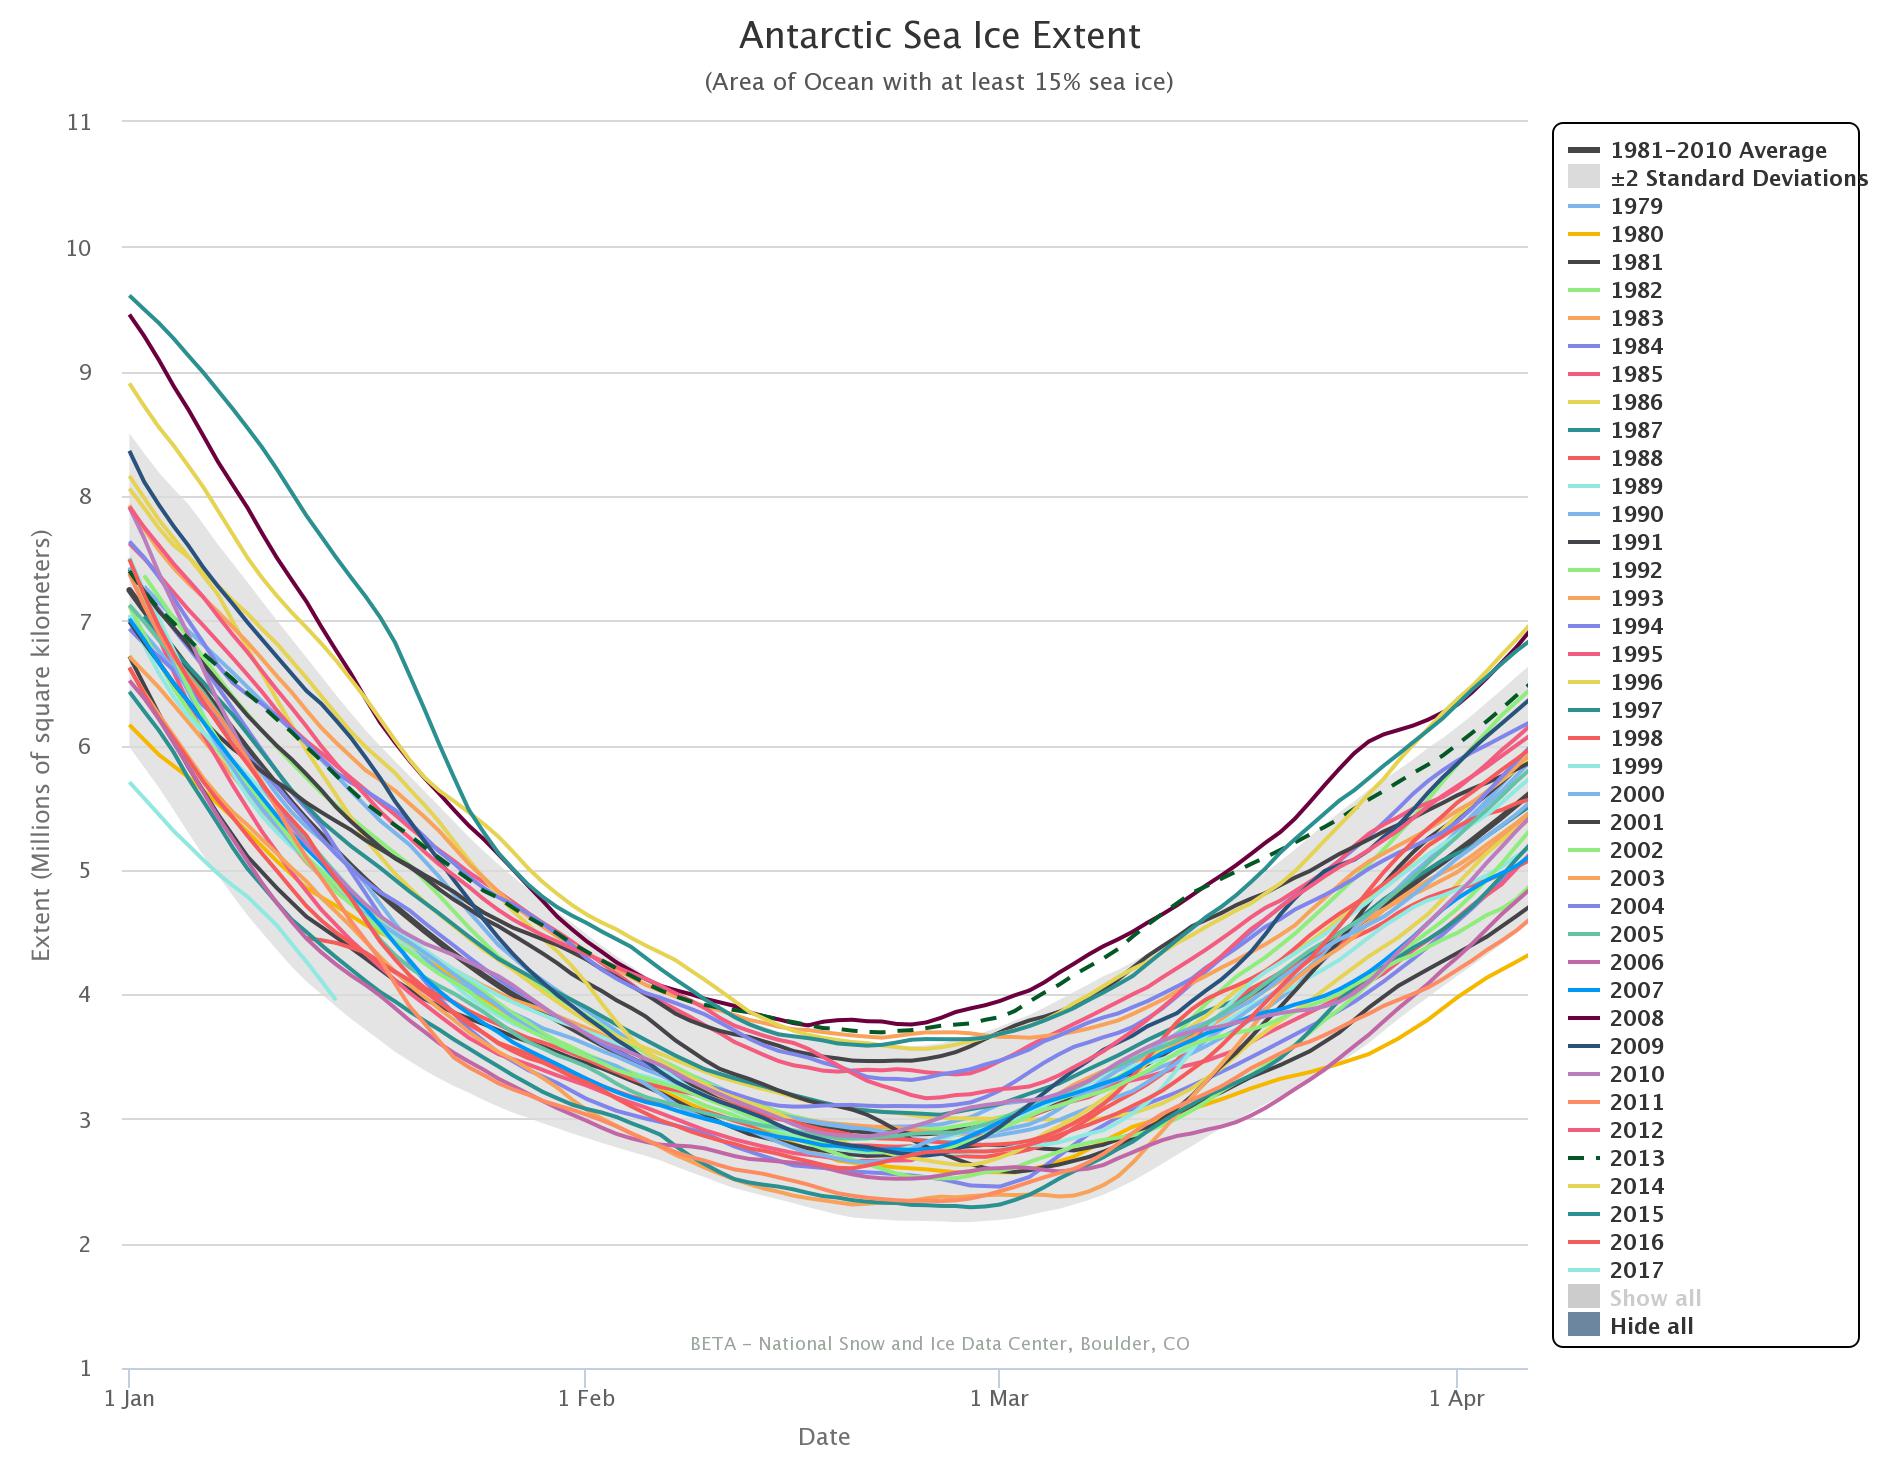
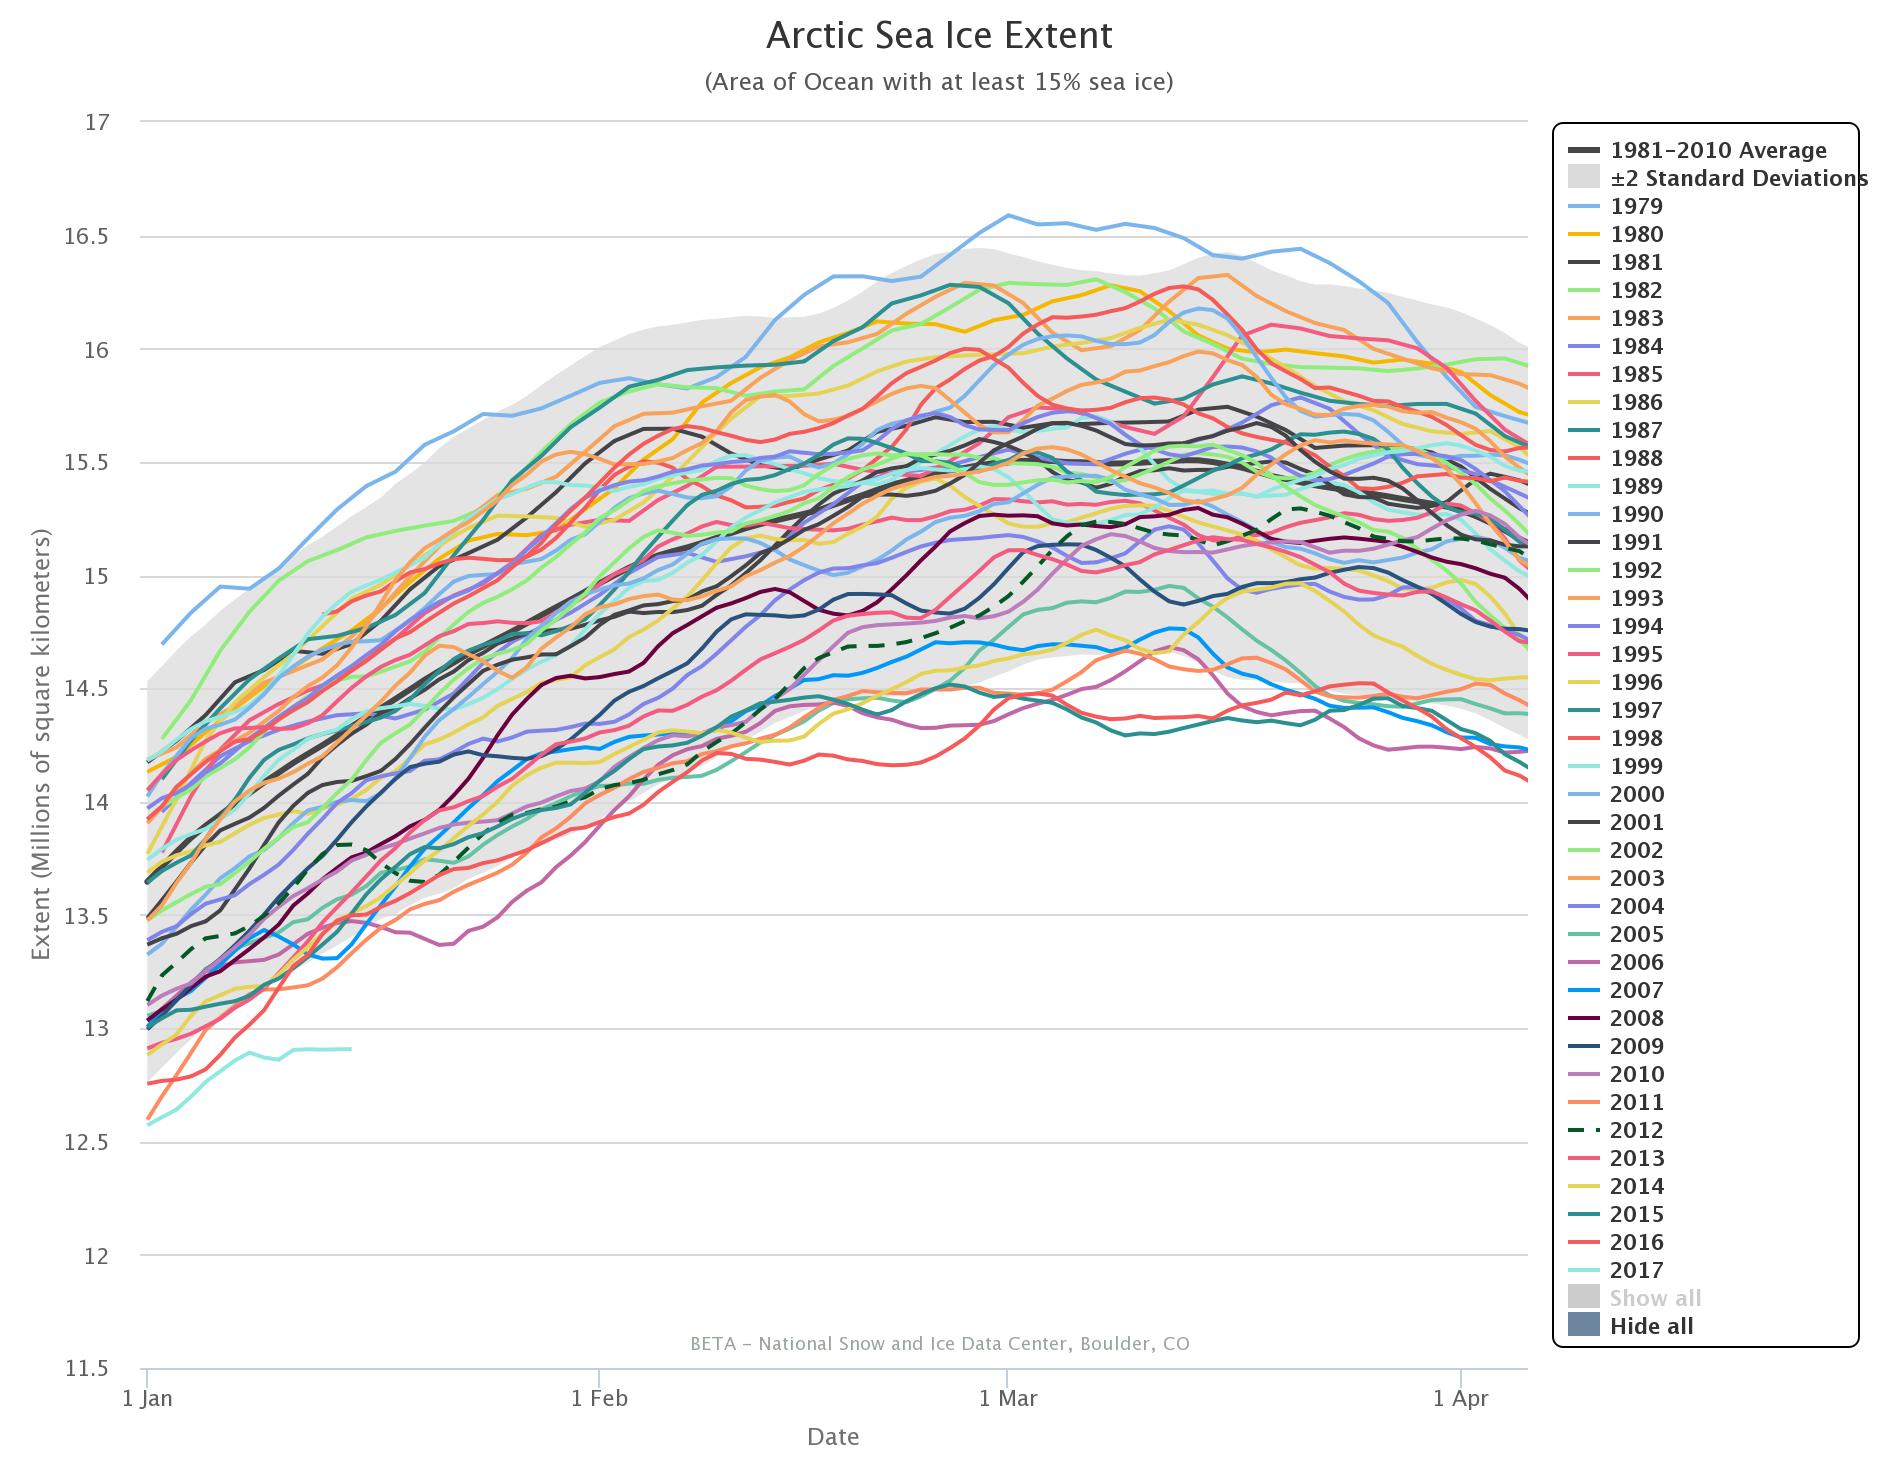
The 2017 curves in the NSIDC’s own extent graphs are coloured in a pale shade of blue. Even so they’re easy to pick out since both Antarctic and Arctic extent are at the lowest level for the date in NSIDC’s records by a considerable margin:
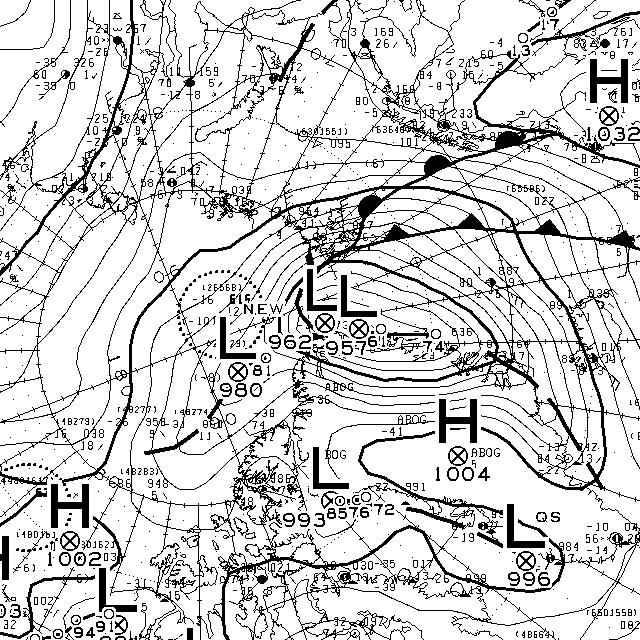
Antarctic sea ice extent is still falling, and the Arctic has been flatlining for several days now and more trouble is heading its way. Another Fram Strait cyclone is brewing, and this time around the storm’s minimum central pressure is already down to 957 hPa according to Environment Canada:
According to the current forecasts it will continue to spin over the central Arctic for several more days, driving export of sea ice via the Fram Strait:
This is the Great White Con version as opposed to the NOAA version published during the Fall AGU conference earlier this week, although there is some overlap.
Hot off the presses, here’s how Arctic sea ice age has progressed over the last year and a bit:
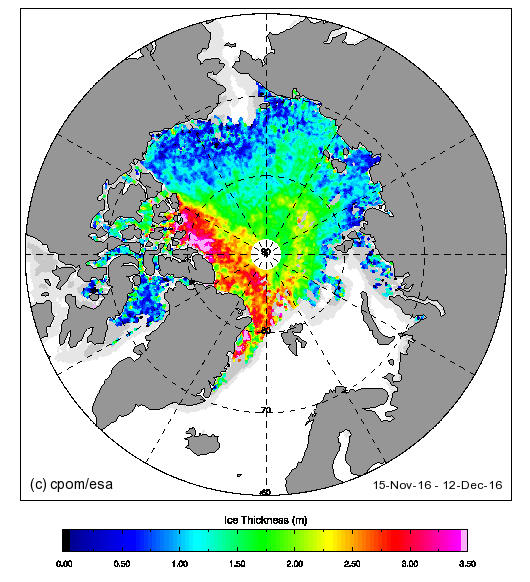
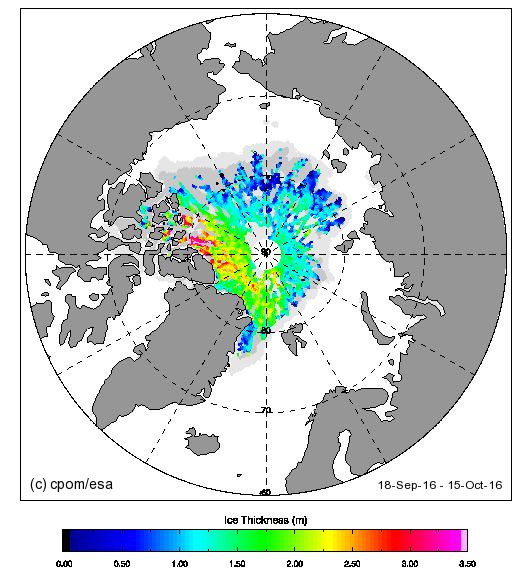
The 4 and 5 year old ice looks to be edging away from the area north of the Canadian Arctic Archipelago towards the Fram Strait. Here’s the current CryoSat-2 Arctic sea ice thickness map:
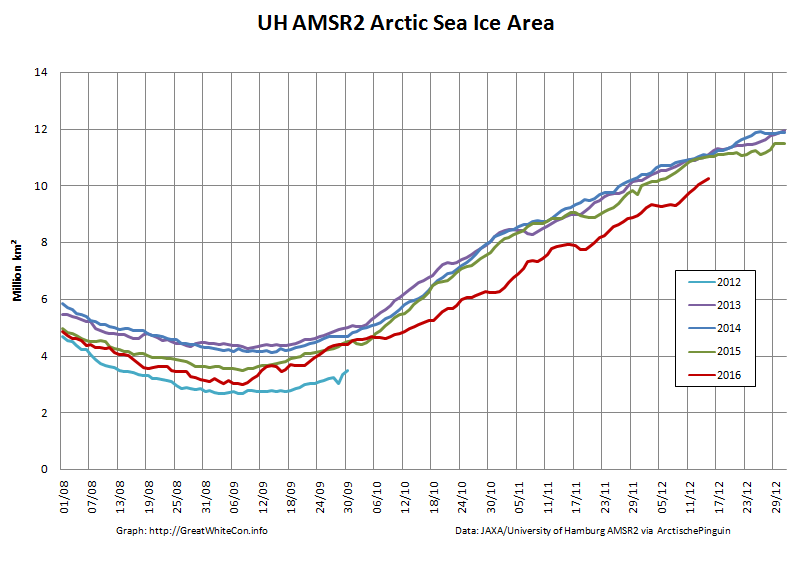
Almost no ice over 2 meters thick to be found in the Beaufort sector or anywhere on the Siberian side of the Arctic. Here’s the current AMSR2 Arctic sea ice area graph:
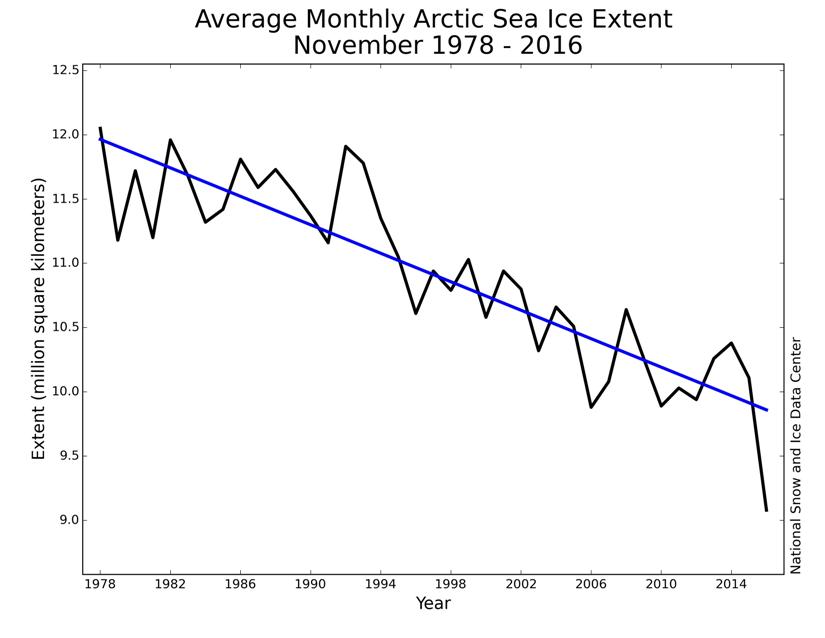
Lowest for the date in the satellite record. Here’s the NSIDC’s long term trend in November sea ice extent:
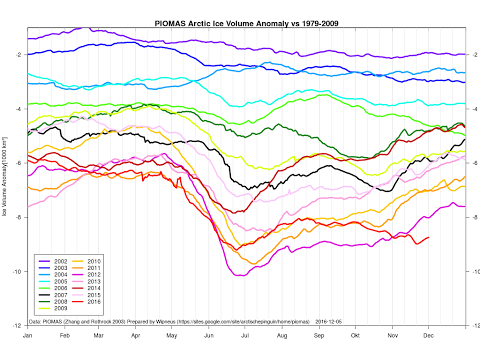
Act 1 of a 3 act play according to Don Perovich at AGU. Here’s the current PIOMAS Arctic sea ice volume anomaly graph:
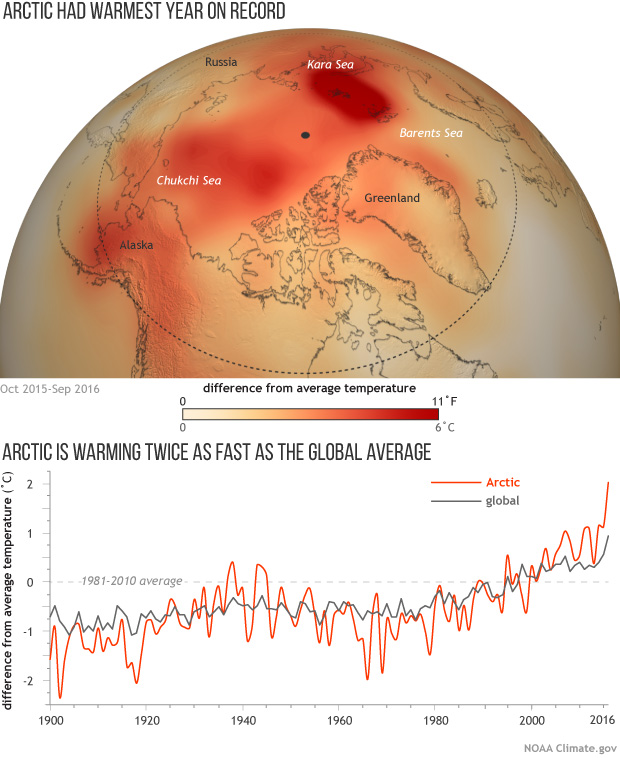
Lowest for the date in the satellite record. Here’s NOAA’s Arctic and global surface temperature graph:
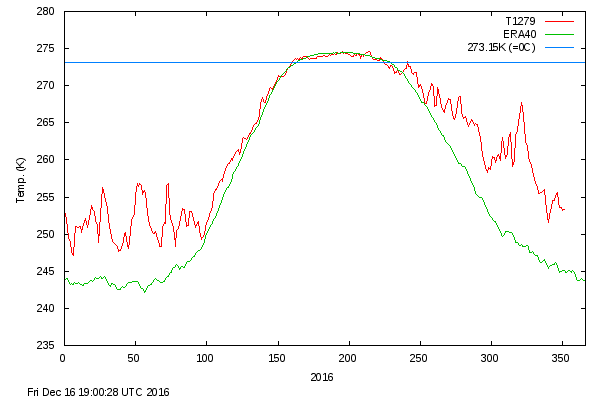
Warmest in a record going back to 1900. Here’s the current DMI >80N surface temperature graph:
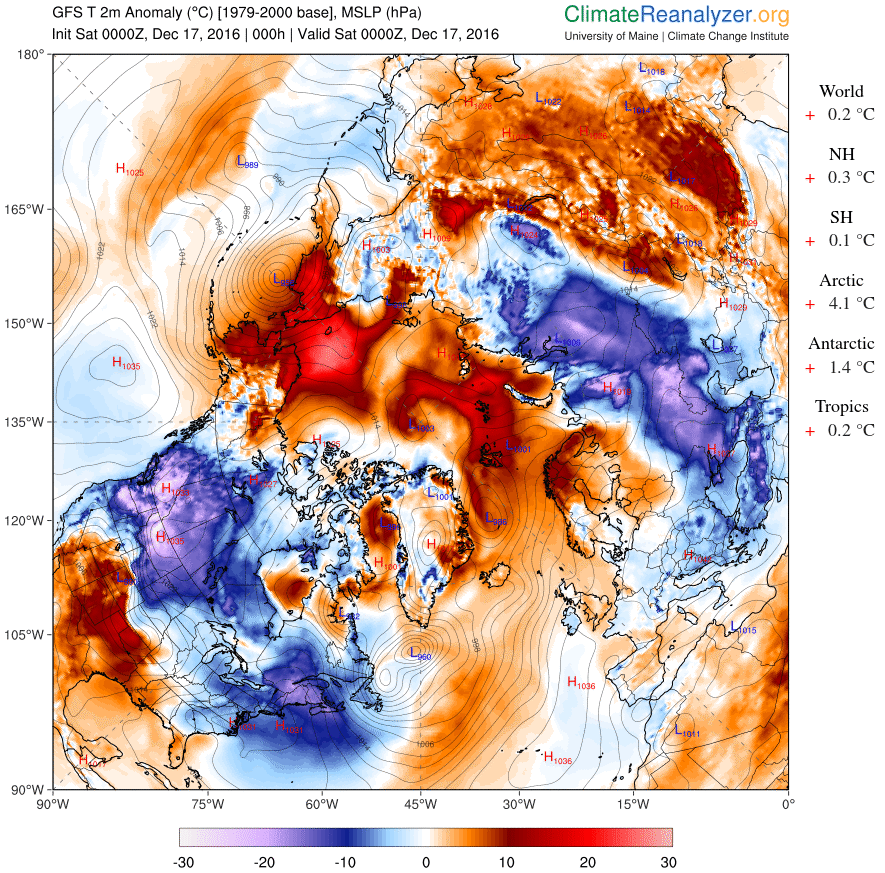
and here’s the current Arctic surface temperature anomaly map:
Finally, for the moment at least, here’s global sea ice area just for good measure:
Need I say more? How about this:
Ice has no agenda. It just melts.
Out of the labs and into the streets?
“Post-truth” is the the Oxford Dictionaries word of the year for 2016. The definition reads as follows:
post-truth – an adjective defined as ‘relating to or denoting circumstances in which objective facts are less influential in shaping public opinion than appeals to emotion and personal belief’.
and according to Oxford Dictionaries:
The concept of post-truth has been in existence for the past decade, but Oxford Dictionaries has seen a spike in frequency this year in the context of the EU referendum in the United Kingdom and the presidential election in the United States. It has also become associated with a particular noun, in the phrase post-truth politics.
Post-truth has gone from being a peripheral term to being a mainstay in political commentary, now often being used by major publications without the need for clarification or definition in their headlines.
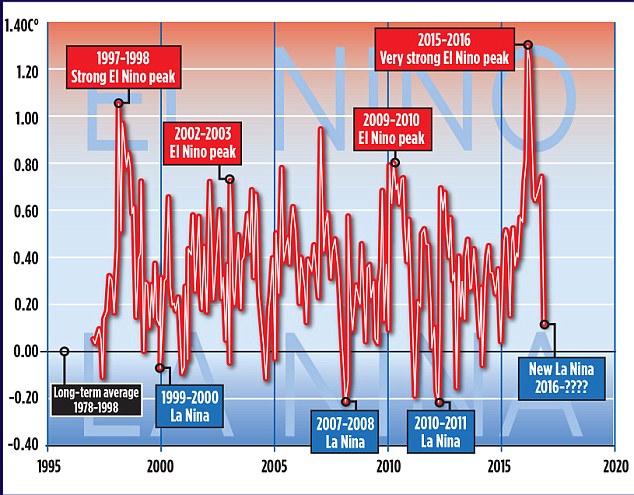
Our old friend David Rose has been remarkably quiet on the topic of Arctic sea ice recently. Presumably the objective facts from the Arctic are impossible to spin to his satisfaction even for a man of David’s talents? However that didn’t stop him from penning an article for The Mail on Sunday at the end of November on the topic of the recent “record highs in global temperatures“:
Global average temperatures over land have plummeted by more than 1C since the middle of this year – their biggest and steepest fall on record.
The news comes amid mounting evidence that the recent run of world record high temperatures is about to end. The fall, revealed by Nasa satellite measurements of the lower atmosphere, has been caused by the end of El Niño – the warming of surface waters in a vast area of the Pacific west of Central America.
The Mail article helpfully included this one year old video from the World Meteorological Organization, explaining the basics of the El Niño phenomenon:
According to the commentary:
This phenomenon affects weather conditions across the equatorial Pacific, with potential knock on effects in other parts of the world.
We’ll get on to the “potential knock on effects” in the Arctic eventually, but let’s start with a snippet of Mr. Rose’s “post-truth politics”:
Some scientists, including Dr Gavin Schmidt, head of Nasa’s climate division, have claimed that the recent highs were mainly the result of long-term global warming.
Last year, Dr Schmidt said 2015 would have been a record hot year even without El Nino. ‘The reason why this is such a warm record year is because of the long-term underlying trend, the cumulative effect of the long-term warming trend of our Earth,’ he said. This was ‘mainly caused’ by the emission of greenhouse gases by humans.
Other experts have also disputed Dr Schmidt’s claims. Professor Judith Curry, of the Georgia Institute of Technology, and president of the Climate Forecast Applications Network, said yesterday: ‘I disagree with Gavin. The record warm years of 2015 and 2016 were primarily caused by the super El Nino.’ The slowdown in warming was, she added, real, and all the evidence suggested that since 1998, the rate of global warming has been much slower than predicted by computer models – about 1C per century.
David Whitehouse, a scientist who works with Lord Lawson’s sceptic Global Warming Policy Foundation, said the massive fall in temperatures following the end of El Nino meant the warming hiatus or slowdown may be coming back. ‘According to the satellites, the late 2016 temperatures are returning to the levels they were at after the 1998 El Nino. The data clearly shows El Nino for what it was – a short-term weather event,’ he said.
In case you’re wondering where the politics is in all of this, you need look no further than here:
The last three years may eventually come to be seen as the final death rattle of the global warming scare. Thanks [sic] what’s now recognised as an unusually strong El Nino, global temperatures were driven to sufficiently high levels to revive the alarmist narrative – after an unhelpful pause period of nearly 20 years – that the world had got hotter than ever before.
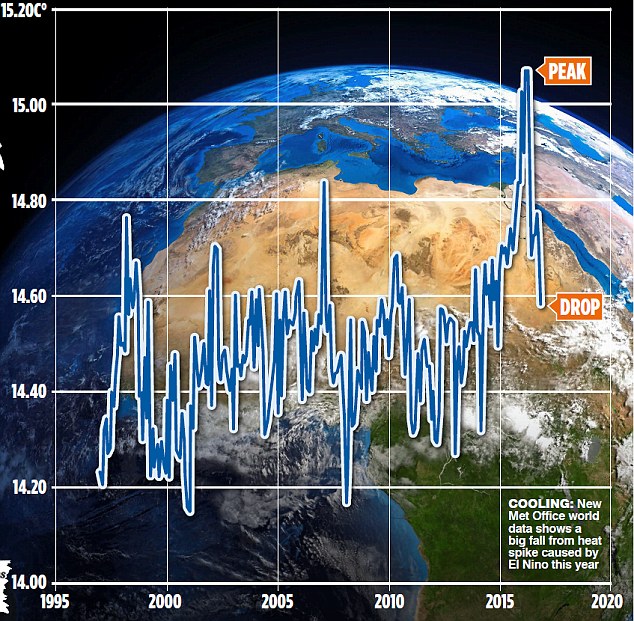
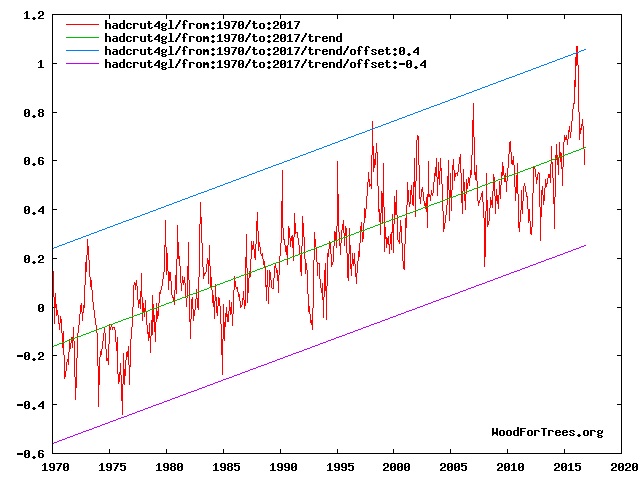
In case you’re also wondering about the objective facts of the matter David Rose quotes with approval “the authoritative Met Office ‘Hadcrut4’ surface record” in his latest article in the Mail on Sunday this very morning:
New official data issued by the Met Office confirms that world average temperatures have plummeted since the middle of the year at a faster and steeper rate than at any time in the recent past.
The huge fall follows a report by this newspaper that temperatures had cooled after a record spike. Our story showed that these record high temperatures were triggered by naturally occurring but freak conditions caused by El Nino – and not, as had been previously suggested, by the cumulative effects of man-made global warming.
The Mail on Sunday’s report was picked up around the world and widely attacked by green propagandists as being ‘cherry-picked’ and based on ‘misinformation’. The report was, in fact, based on Nasa satellite measurements of temperatures in the lower atmosphere over land – which tend to show worldwide changes first, because the sea retains heat for longer.
There were claims – now exploded by the Met Office data shown here – that our report was ‘misleading’ and ‘cherry-picked’.
Yet bizarrely, the fiercest criticism was reserved for claims we never made – that there isn’t a long-term warming trend, mainly caused by human emissions.
This just wasn’t in our report – which presumably, critics hadn’t even read.
We’ve explained all this to David before, yet bizzarely we obviously need to do so again. Here’s the Mail’s version of the latest HADCRUT 4 data from the Met Office:
Can you spot any “cumulative effects of man-made global warming”?
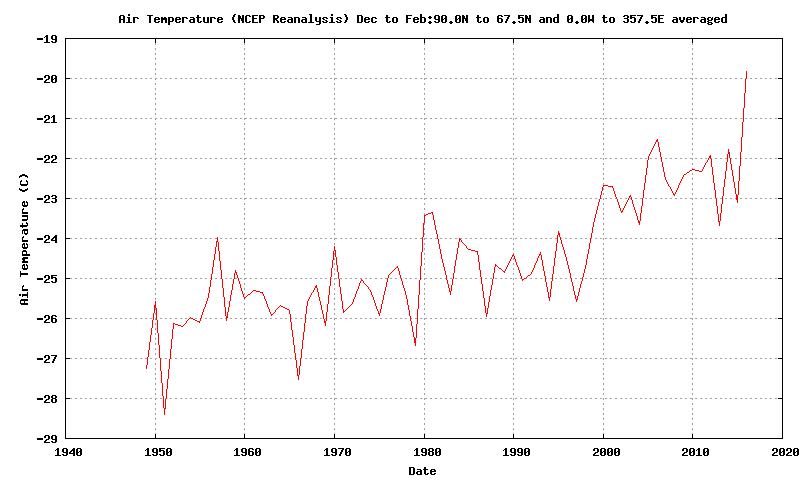
Messrs Smith, Rose, Delingpole, Whitehouse et al. may well be unaware of the fact that the satellite temperature data they’re so fond of cherry picking doesn’t include data from the lower troposphere between 80 degrees North and the North Pole. Just in case they fancy spinning the latest objective facts from the Arctic in the near future, here’s the long term autumnal temperature trend:
CryoSat-2 has burst back into life after its summer break. Here is what it reveals about Arctic sea ice thickness at the moment:
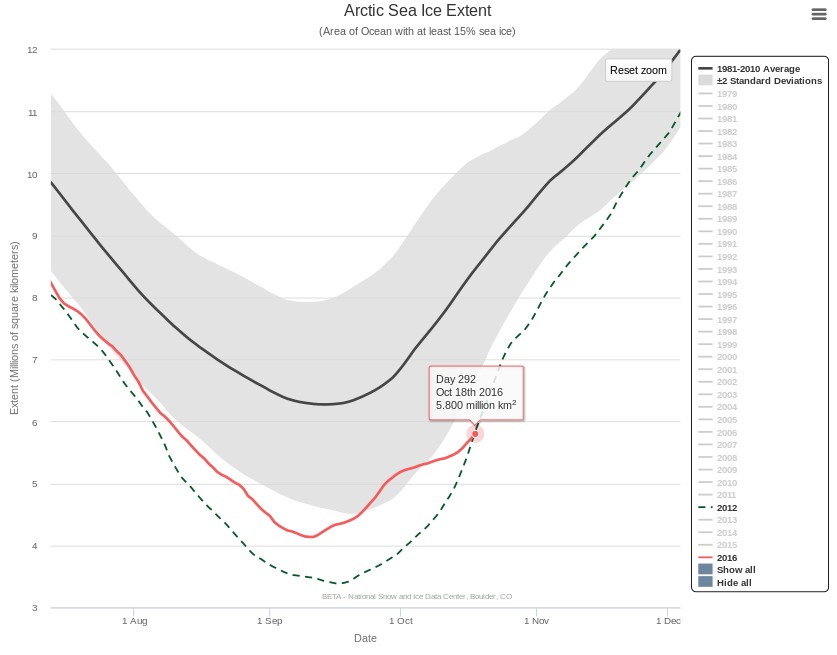
Perhaps not entirely coincidentally, the NSIDC 5 day average Arctic sea ice extent is once again less than on the same day of 2012, the year of the “record melt”:
The Central Arctic has of course already been battered by the Great Arctic Cyclone(s) of August 2016. The minimum sea ice extent has been called by the NSIDC, with a slight proviso:
Arctic sea ice appears to have reached its seasonal minimum extent for 2016 on September 10. A relatively rapid loss of sea ice in the first ten days of September has pushed the ice extent to a statistical tie with 2007 for the second lowest in the satellite record. September’s low extent followed a summer characterized by conditions generally unfavorable for sea ice loss.
Please note that this is a preliminary announcement. Changing winds or late-season melt could still reduce the Arctic ice extent, as happened in 2005 and 2010. NSIDC scientists will release a full analysis of the Arctic melt season, and discuss the Antarctic winter sea ice growth, in early October.
On September 10, Arctic sea ice extent stood at 4.14 million square kilometers (1.60 million square miles).
Now, however, yet another cyclone is raging in the Central Arctic. According to Environment Canada this one is already down to a mean sea level pressure of 975 hPa:
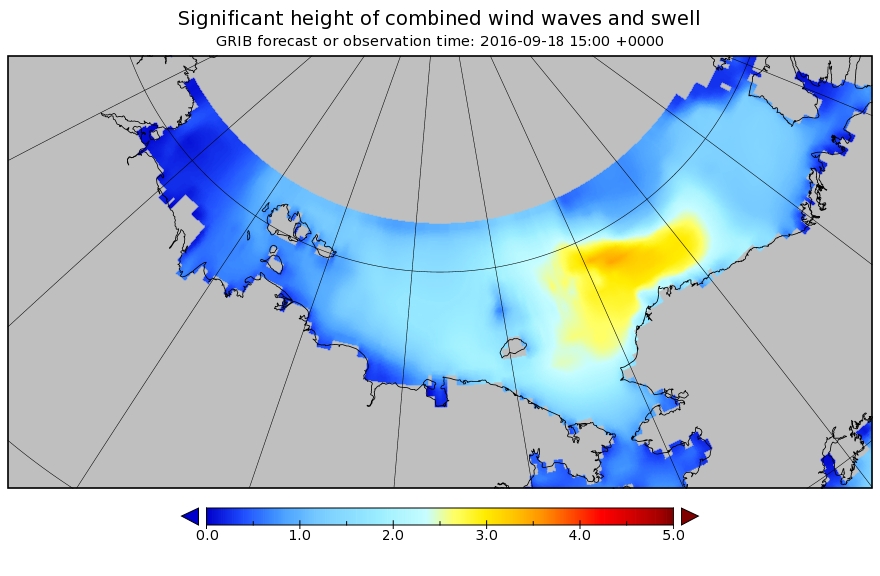
As our regular readers will be well aware, at this time of year strong winds beget large swells. On this occasion it looks as though Barrow will get another battering, as well as the remaining and refreezing sea ice. Here’s the current WaveWatch III significant wave height forecast for September 18th:
Such large swells on the surface of the Arctic Ocean don’t only physically break up the sea ice. Last September scientists aboard the University of Alaska’s research icebreaker Sikuliaq observed the effects of a similar storm in the Beaufort Sea. According to Jennifer MacKinnon, Chief Scientist on the ArcticMix voyage:
One of the funny things about the Arctic is that there’s a reservoir of heat beneath the surface here.
So the more the wind is blowing on the ocean, the more it’s mixing this heat upwards. Which is bringing warmer water to the surface at a pretty rapid rate, warming the surface and accelerating the rate at which this ice is melting.
And if storms like this continue, as there’s more open water, more storms mean more exposed surface. It will not only melt the ice in the summer, but delay the onset of fall ice formation and accelerate the onset of spring ice melting.
In October 2015 the Sikuliaq was back in the Beaufort Sea observing the effect of storm swells on refreezing sea ice. Here’s a report from Chief Scientist Jim Thomson:
A strong easterly wind event came through that built large waves — waves that got to almost five meters in height. And the winds were something like up to thirty knots. And these waves were coming into the newly forming ice and making pancake ice.
There was a very warm layer of water 20 meters down beneath the surface. And these waves coming in were enough to drive additional mixing and bring that warm water up from the subsurface and that warm water melted the ice and changed that balance happening at the surface.
As if all that wasn’t already enough to worry about look who’s waiting in the wings. Tropical Storm Ian is heading towards the Arctic Circle at a rate of knots, even as we speak:
SURF ZONE FORECAST
NATIONAL WEATHER SERVICE BARROW AK
0500 AM AKDT SAT SEP 17 2016
AKZ202-171230-
NORTHERN ARCTIC COAST
INCLUDING THE BEACHES OF BARROW…PITT POINT…NULAVIK
0500 AM AKDT SAT SEP 17 2016
.TODAY AND TONIGHT…
.WIND… WESTERLY 20 TO 35 MPH.
.SURF HEIGHT… 2 TO 5 FT.
.SURF TEMP… 36 DEGREES F.
.TIDES… LOW SAT 0826 AM -0.03
HIGH SAT 0230 PM 0.38
LOW SAT 0846 PM -0.02
HIGH SUN 0250 AM 0.38
…HIGH SURF ADVISORY REMAINS IN EFFECT UNTIL 6 AM AKDT MONDAY…
* WAVES AND SURF…WAVES TO 10 FEET BREAKING JUST OFFSHORE COMBINED WITH TIDES UP TO 1 FOOT ABOVE NORMAL WILL CAUSE HIGH SURF CONDITIONS.
* ICE…WITH ICE JUST OFF SHORE FROM BARROW…IT IS POSSIBLE THAT CHUNKS OF SEA ICE WILL WASH UP ON SHORE EVEN WITH WINDS PREDICTED TO BE AT NEARLY PARALLEL TO THE SHORE.
* WINDS…WEST 20 TO 30 MPH FROM THIS AFTERNOON THROUGH EARLY MONDAY MORNING.
* TIMING…HIGH SURF IS EXPECTED TO BEGIN LATE THIS AFTERNOON AND CONTINUE THROUGH EARLY MONDAY.
* IMPACTS…HIGH SURF WILL WASH TO THE TOP OF THE BEACH AND CAUSE BEACH EROSION. MINOR FLOODING OF LOW LYING AREAS IS POSSIBLE AND SURF COULD WASH ONTO LOW LYING ROADS NEAR THE BEACH.
PRECAUTIONARY/PREPAREDNESS ACTIONS…
A HIGH SURF ADVISORY MEANS THAT LOCALIZED BEACH EROSION IS EXPECTED. SURF COULD WASH ONTO LOW LYING ROADS NEAR THE BEACH LIMITING TRAVEL NEAR THE BEACH. PEOPLE SHOULD MOVE BOATS AND PERSONAL PROPERTY INLAND FROM THE BEACH.
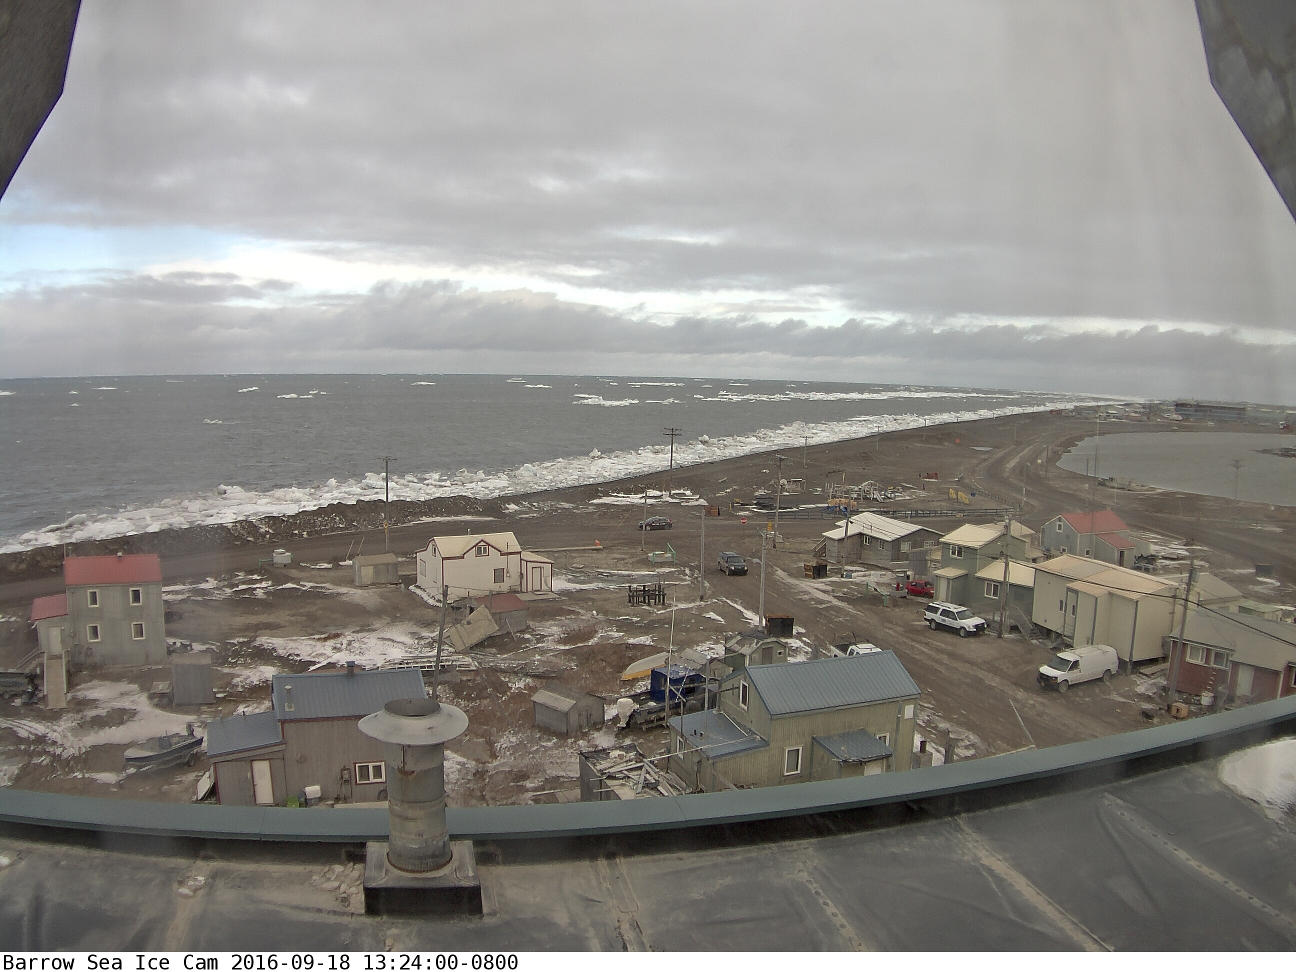
[Edit – September 19th]
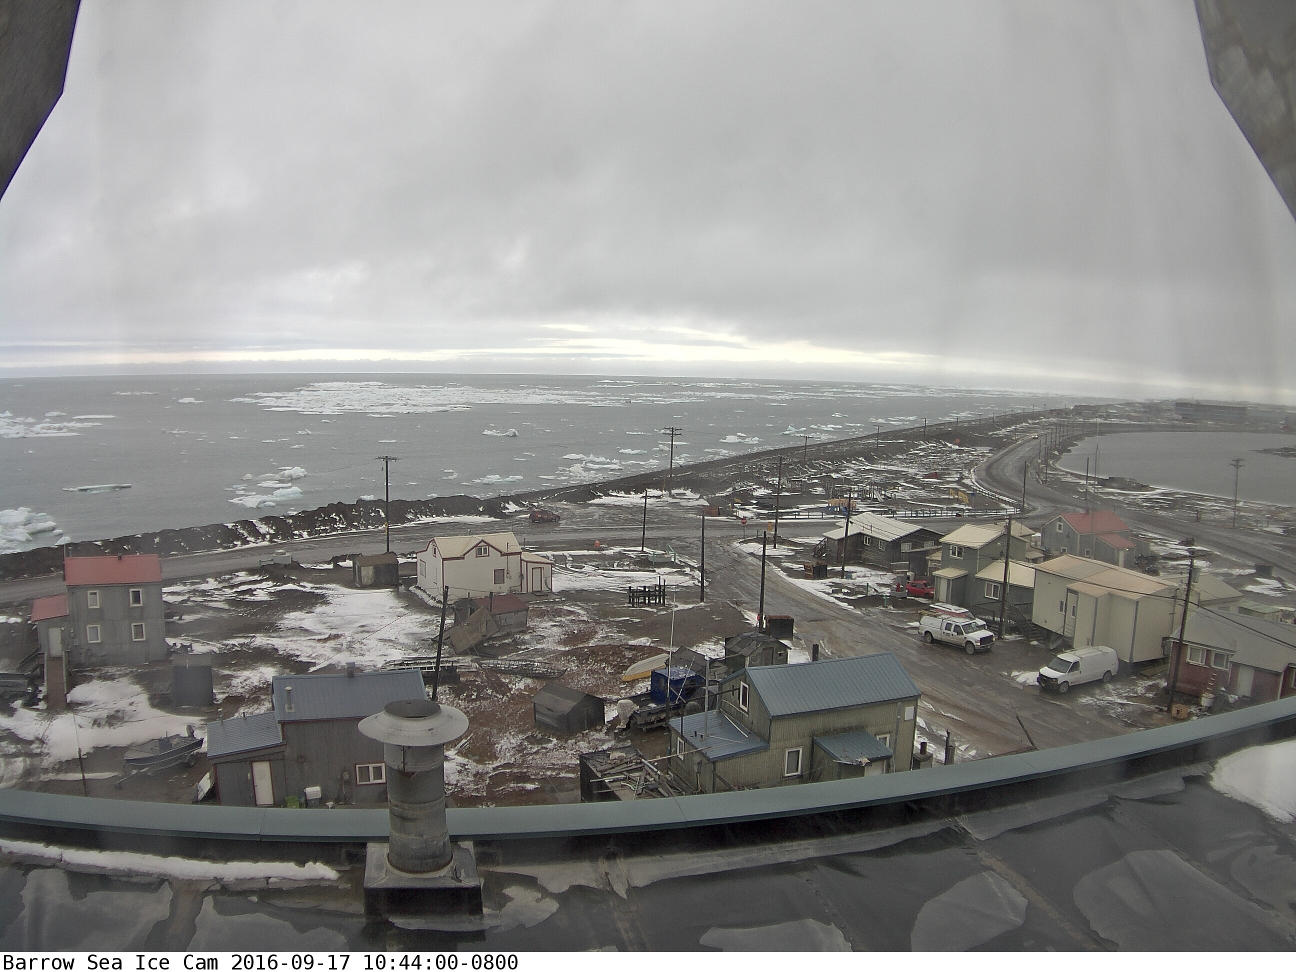
Somewhat belatedly, before:
and after:
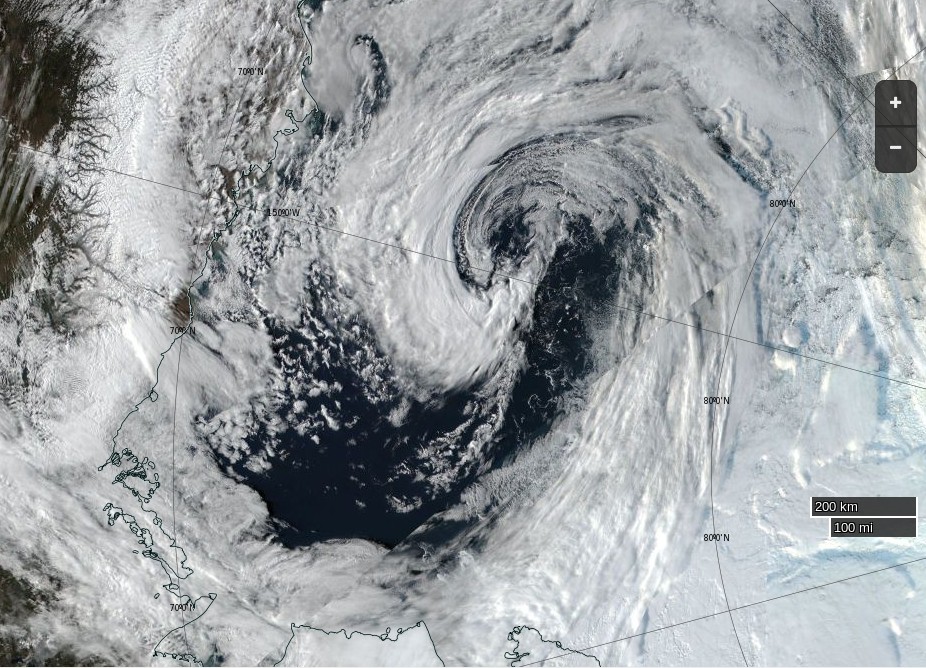
the storm images from the Barrow webcam, which has just burst back into life. Plus an image of the cyclone from on high:
NASA Worldview “true-color” image of the Beaufort Sea on September 18th 2016, derived from the VIIRS sensor on the Suomi satellite
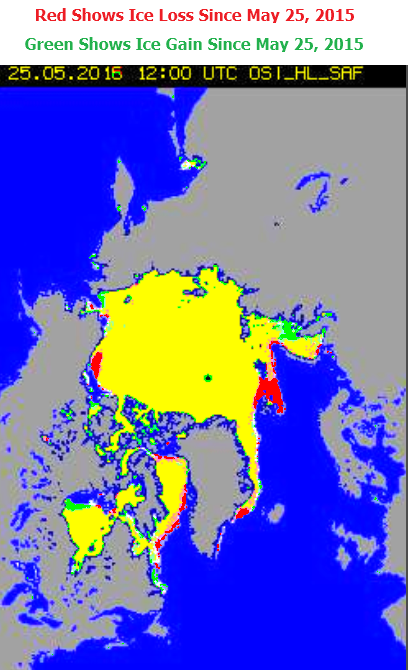
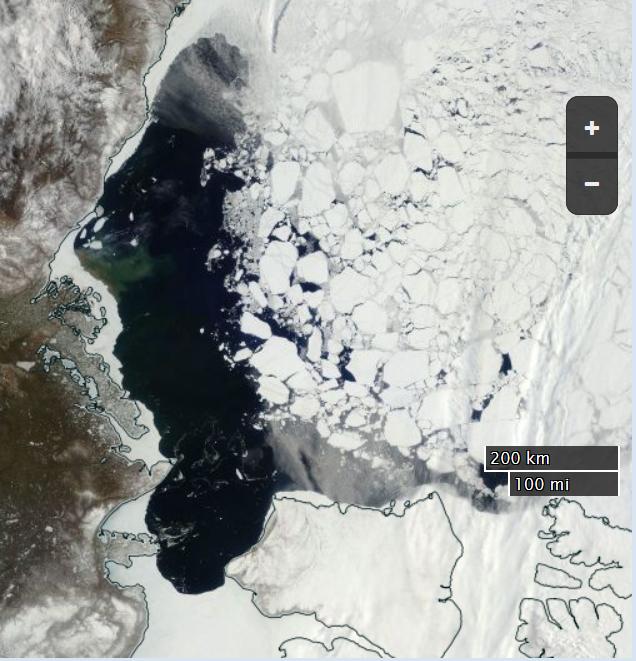
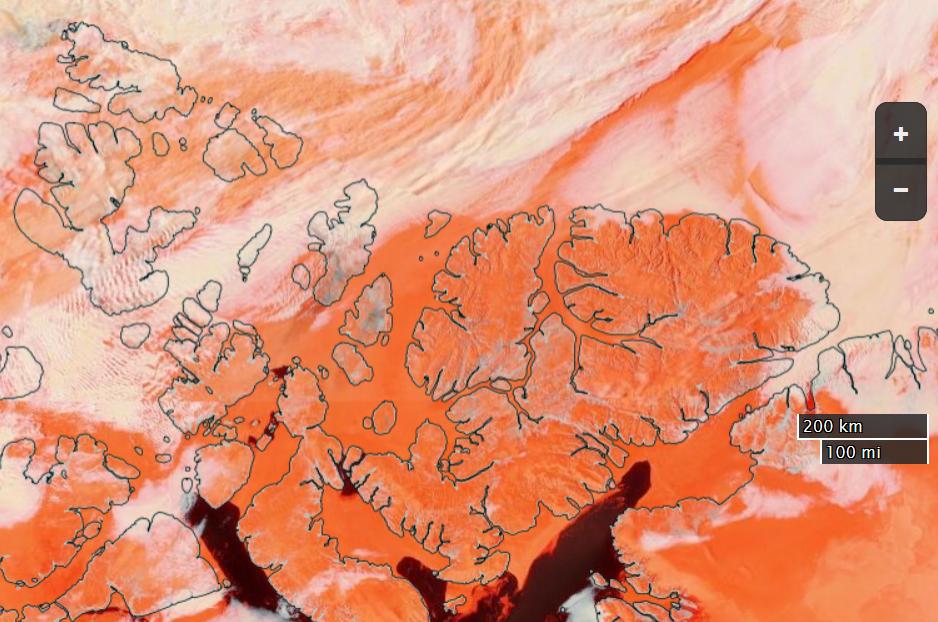
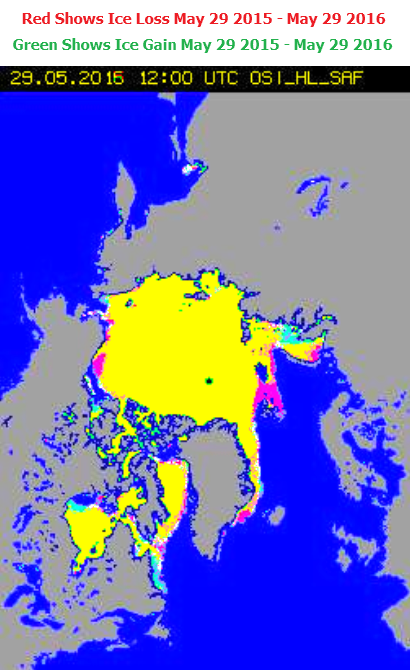
Here’s a satellite image of the Beaufort Sea this year, which is red on Tony’s low resolution 2015/16 comparison map:
NASA Worldview “true-color” image of the Beaufort Sea on May 20th 2016
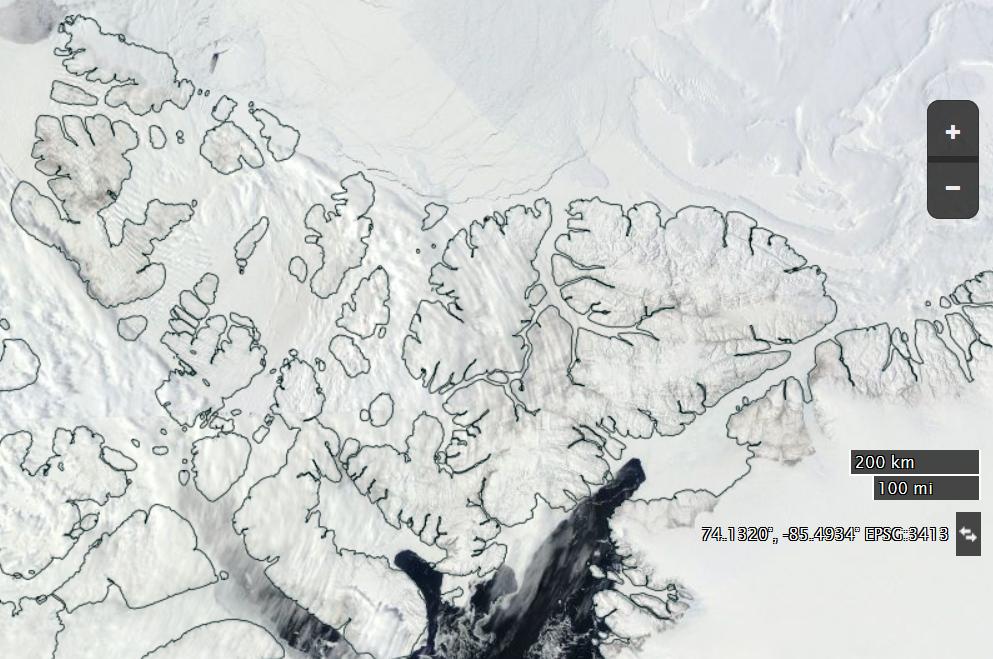
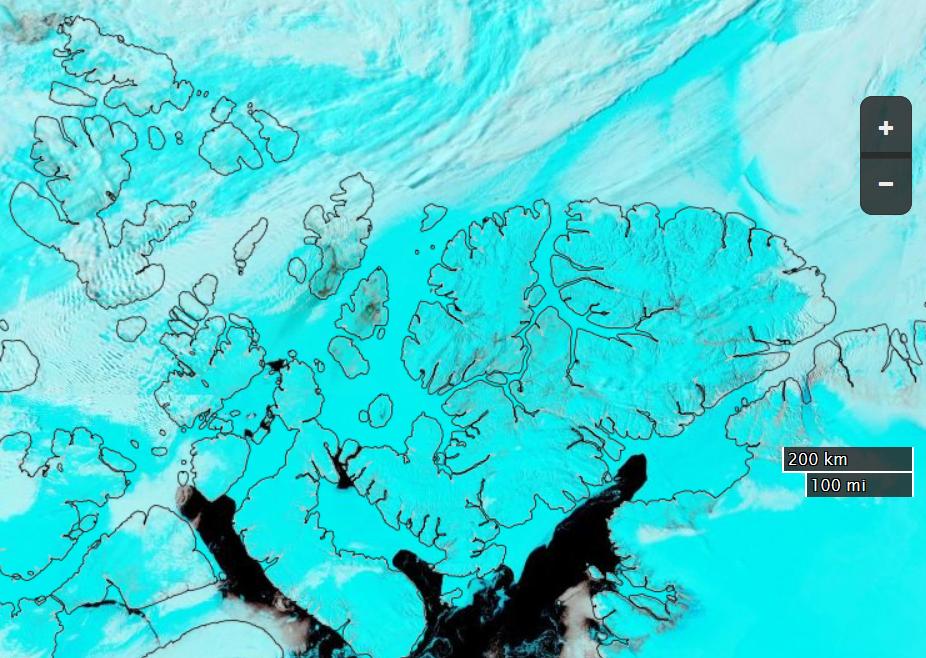
Here’s a satellite image of the the northern edge of the CAA last year, which is green on Tony’s map:
NASA Worldview “true-color” image of the Canadian Arctic Archipelago on May 20th 2015
Would you care to play “spot the difference” with Peter and I?
[Edit – May 28th 2016]
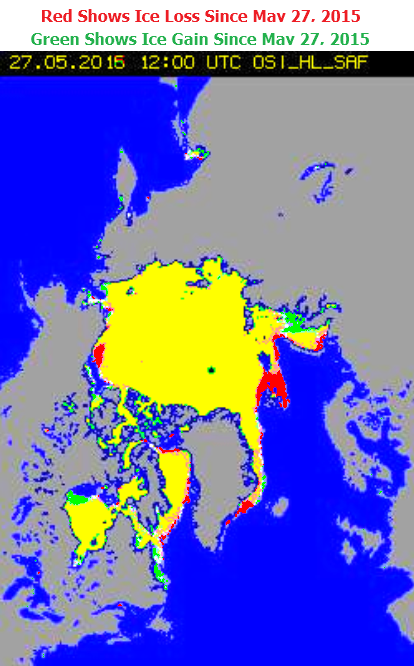
Tony is doubling down on his Arctic fraud. His Arctic monkey business continues. Despite the lucid explanation of his glaring error provided by Peter Ellis the unReal Science Gish gallop continues. We are now (un)reliably informed that:
The Arctic is very cold, and is not melting.
The amount of ice in the Arctic is almost exactly the same as this date last year.
Yours truly has asked all and sundry at unReal Science this question 9 times, phrased in a variety of different ways:
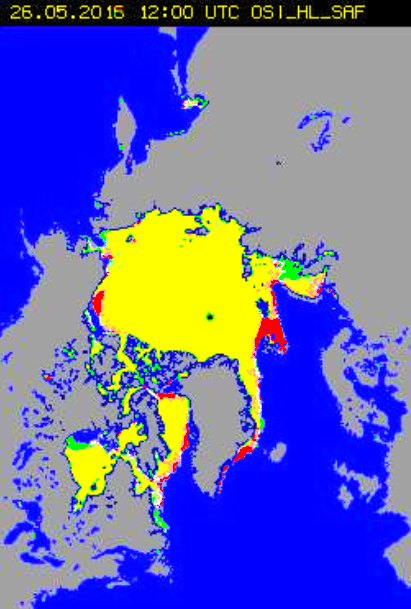
Here’s a satellite image of the the northern edge of the CAA last year. Take a good look at it and then show me the areas of open water corresponding to the green areas on Tony’s final map above.
Once again “No answer!” was the stern reply to my plaintive questions.
[Edit – May 30th 2016]
The “Jousting with Malice in Blunderland” continues, but the oppostion are remarkably quiet today. I’ve had my knuckles rapped about this previously, but cutting and pasting is so quick ‘n easy I simply cannot resist:
Us:
Evidently Tony Heller believes that when it comes to melting sea ice air temperatures are all that matters and that “somewhat warmer ocean water” is irrelevant. see above:
He also evidently believes that in May 2015 large areas of the oldest and thickest sea ice in the Arctic had already melted away to nothing. Perhaps you can point out all the polynyas around the coast of the Canadian Arctic Archipelago this time last year to him, since nobody else has yet managed to do so?
gees, Jimbo has change to a luminous blue.
Very pretty Jim..
Now how about you show one that shows th near ZERO Arctic sea ice from the first 3/4 of the Holocene..
Or are you still going to DENY/ IGNORE the FACT that there is nothing untoward happening with the Arctic Sea Ice, and all you are arguing about is the INSIGNIFICANT TRIVIA that rules your meaningless life.
Us:
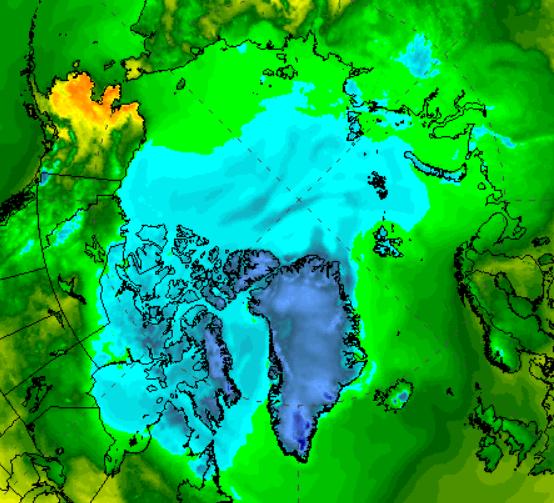
For psychedelic Arctic surface air temperature fans every where:
What do you suppose happens to sea ice when you combine “somewhat warmer ocean water” with “somewhat above freezing point air”?
N.B. Such conditions do not currently exist off the north coast of the CAA. They didn’t in May 2015 either.
Them:
You on psycho drugs yet again, Jimbo
Which of your Exeter buddies is feeding them too you ?
Us:
Evidently you and Tony are the ones who have been smoking stuff Andy.
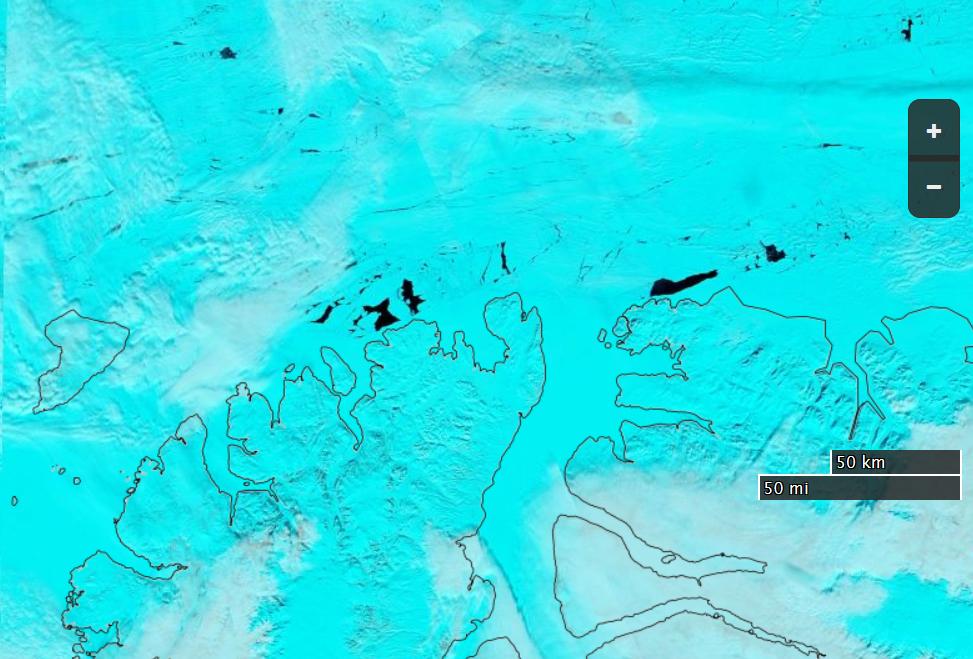
In the fantasy wonderland portrayed in several of Tony’s recent “articles” polynyas are depicted in the oldest, thickest sea ice in the Arctic in May 2015. Here is what the real life polynyas in the “oldest, thickest sea ice” in the actual Arctic of May 2016 look like from above (through cyan tinted spectacles):
Shut up about the Holocene, it’s not relevant to modern Arctic sea ice extent trends.
It’t like talking about sun spot trends and then someone comes along and says “Well, this is nothing compared to when the sun becomes a red giant”. Which is true, but not relevant at all.
Us:
Have you noticed that the world’s leading expert on satellite imagery of the Arctic during the first 3/4 of the Holocene epoch has compared MODIS imagery of the Canadian Arctic Archipelago from May 2015 with May 2016 and confirmed that there is no noticeable difference in sea ice extent between the two?
Today’s Arctic sea ice claim comes from the Bishop Hill blog of Andrew Montford, which recently stated that:
This morning’s story appears to be the hoary old “Arctic sea ice in freefall” one.
“The Arctic is in crisis. Year by year, it’s slipping into a new state, and it’s hard to see how that won’t have an effect on weather throughout the Northern Hemisphere,” said Ted Scambos, lead scientist at the Colorado-based NSIDC.”
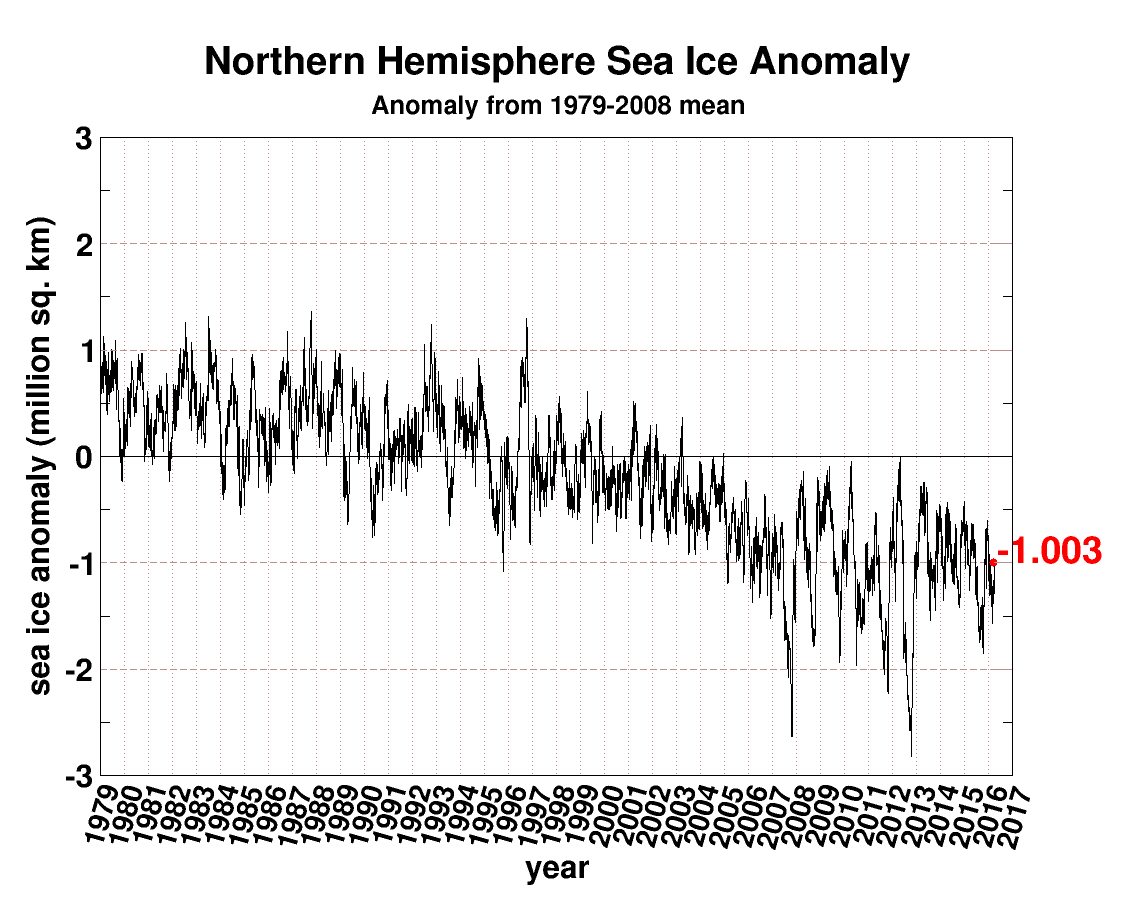
As usual on these occasions, I take a quick look at the Cryosphere Today anomaly page, where I find the sea ice apparently still stuck firmly in “pause” mode.
Having inadvertently wended my way onto The Bishop’s Hill via the northerly extension to Eli’s Rabett Warren I felt compelled, as usual, to quibble with Andrew’s “apparently firmly in ‘pause’ mode” claim. Since graphs in comments are not available over on The Hill, or The Rabett Run for that matter, let’s take a look at some graphic representations of the available data over here instead. Commenter “Golf Charlie” asks at The Bishop’s:
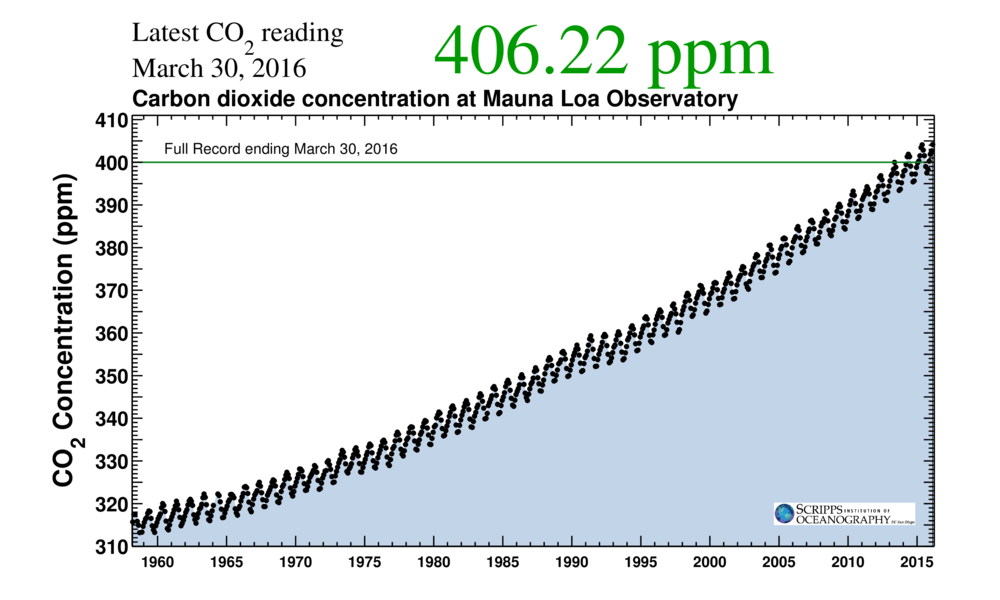
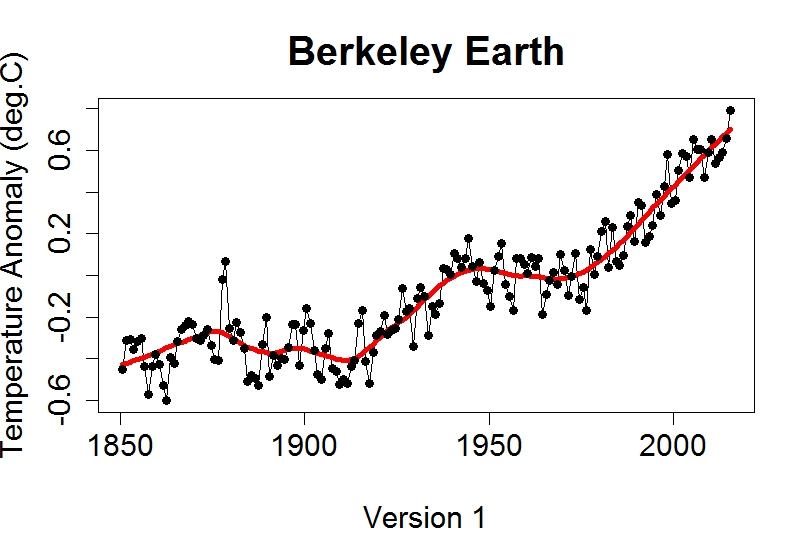
With CO₂ levels continuing to rise, why hasn’t temperature risen, and the ice disappeared as predicted?
Let’s see shall we? CO₂ levels are indeed continuing to rise:
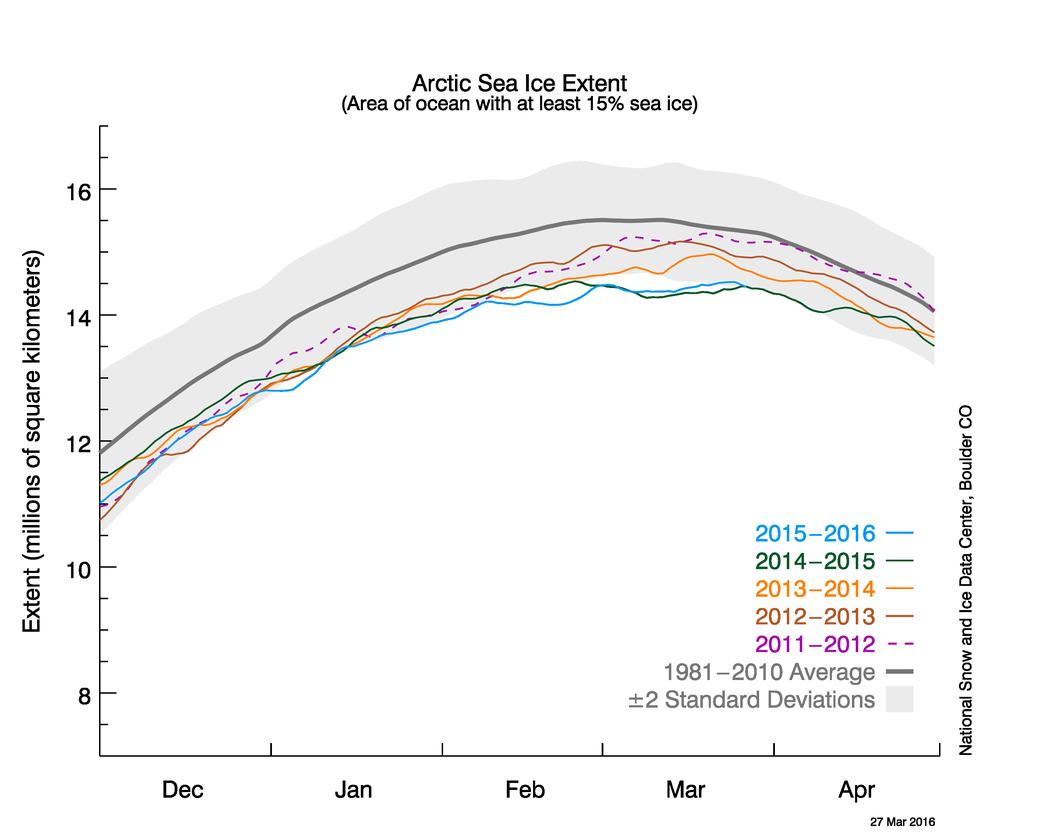
In the latest edition of their “Arctic Sea Ice News” the United States’ National Snow and Ice Data Center have announced that:
Arctic sea ice appears to have reached its annual maximum extent on March 24, and is now the lowest maximum in the satellite record, replacing last year’s record low. This year’s maximum extent occurred later than average. A late season surge in ice growth is still possible. NSIDC will post a detailed analysis of the 2015 to 2016 winter sea ice conditions in early April.
On March 24, 2016, Arctic sea ice likely reached its maximum extent for the year, at 14.52 million square kilometers (5.607 million square miles). This year’s maximum ice extent was the lowest in the satellite record, with below-average ice conditions everywhere except in the Labrador Sea, Baffin Bay, and Hudson Bay. The maximum extent is 1.12 million square kilometers (431,000 square miles) below the 1981 to 2010 average of 15.64 million square kilometers (6.04 million square miles) and 13,000 square kilometers (5,000 square miles) below the previous lowest maximum that occurred last year. This year’s maximum occurred twelve days later than the 1981 to 2010 average date of March 12. The date of the maximum has varied considerably over the years, occurring as early as February 24 in 1996 and as late as April 2 in 2010.
NASA’s Goddard Space Flight Center has also made a similar announcement, which includes this video:
The new record low follows record high temperatures in December, January and February around the globe and in the Arctic. The atmospheric warmth probably contributed to this lowest maximum extent, with air temperatures up to 10 degrees Fahrenheit above average at the edges of the ice pack where sea ice is thin, said Walt Meier, a sea ice scientist at NASA’s Goddard Space Flight Center in Greenbelt, Maryland.
The wind patterns in the Arctic during January and February were also unfavorable to ice growth because they brought warm air from the south and prevented expansion of the ice cover. But ultimately, what will likely play a bigger role in the future trend of Arctic maximum extents is warming ocean waters, Meier said.
“It is likely that we’re going to keep seeing smaller wintertime maximums in the future because in addition to a warmer atmosphere, the ocean has also warmed up. That warmer ocean will not let the ice edge expand as far south as it used to,” Meier said. “Although the maximum reach of the sea ice can vary a lot each year depending on winter weather conditions, we’re seeing a significant downward trend, and that’s ultimately related to the warming atmosphere and oceans.” Since 1979, that trend has led to a loss of 620,000 square miles of winter sea ice cover, an area more than twice the size of Texas.
This year’s record low sea ice maximum extent will not necessarily result in a subsequent record low summertime minimum extent, Meier said. Summer weather conditions have a larger impact than the extent of the winter maximum in the outcome of each year’s melt season; warm temperatures and summer storms make the ice melt fast, while if a summer is cool, the melt slows down.
Neither NASA or the NSIDC comment on one of the striking things about this winter’s NSIDC extent chart, which has effectively “plateaued” during March 2016 following an initial peak of 14.48 million square kilometers on March 2nd, which was only recently exceeded. This is also illustrated by the JAXA Arctic sea ice extent metric, for which the 2016 maximum was 13.96 million square kilometers on February 29th:
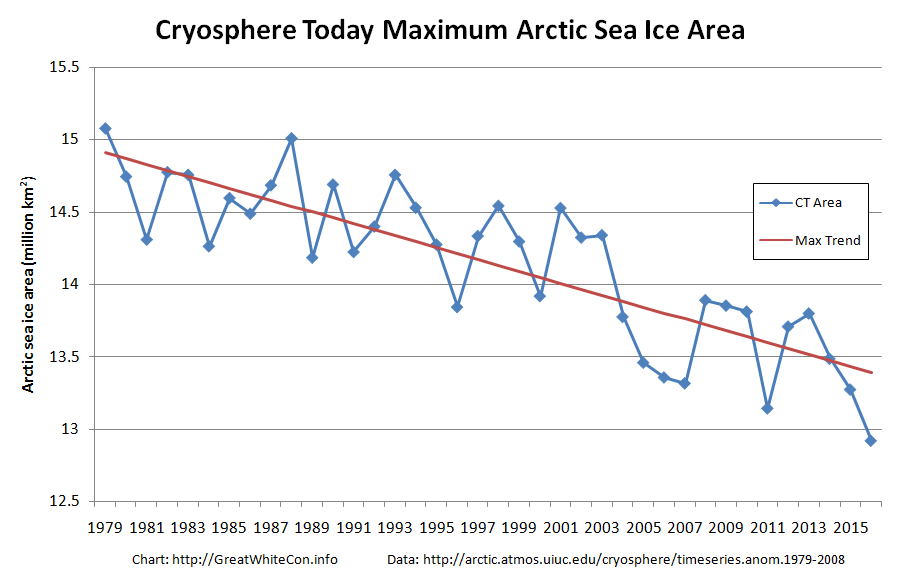
Now that the start of 2016 Arctic sea ice melting season has been called, albeit slightly hesitantly, by the experts at the NSIDC let’s also take a look at Cryosphere Today Arctic sea ice area:
The preliminary peak which we announced on March 16th has also recently been exceeded, but we now feel supremely confident in predicting that the 2016 CT area maximum will be less than 13 million square kilometers for the first time ever in the satellite record.
Thus begins what promises to be a very interesting 2016 Arctic sea ice melting season! As the NSIDC puts it:
There is little correlation between the maximum winter extent and the minimum summer extent—this low maximum does not ensure that this summer will see record low ice conditions. A key factor is the timing of widespread surface melting in the high Arctic. An earlier melt onset is important to the amount of energy absorbed by the ice cover during the summer. If surface melting starts earlier than average, the snow darkens and exposes the ice below earlier, which in turn increases the solar heat input, allowing more ice to melt. With the likelihood that much of the Arctic cover is somewhat thinner due to the warm winter, early surface melting would favor reduced summer ice cover.
This website uses cookies to improve your experience. We'll assume you're ok with this, but you can opt-out if you wish. Cookie settingsACCEPT
Privacy & Cookies Policy
Privacy Overview
This website uses cookies to improve your experience while you navigate through the website. Out of these, the cookies that are categorized as necessary are stored on your browser as they are essential for the working of basic functionalities of the website. We also use third-party cookies that help us analyze and understand how you use this website. These cookies will be stored in your browser only with your consent. You also have the option to opt-out of these cookies. But opting out of some of these cookies may affect your browsing experience.
Necessary cookies are absolutely essential for the website to function properly. This category only includes cookies that ensures basic functionalities and security features of the website. These cookies do not store any personal information.
Any cookies that may not be particularly necessary for the website to function and is used specifically to collect user personal data via analytics, ads, other embedded contents are termed as non-necessary cookies. It is mandatory to procure user consent prior to running these cookies on your website.