Category Archives: Extent

The 2018 Arctic Sea Ice Metric Minima

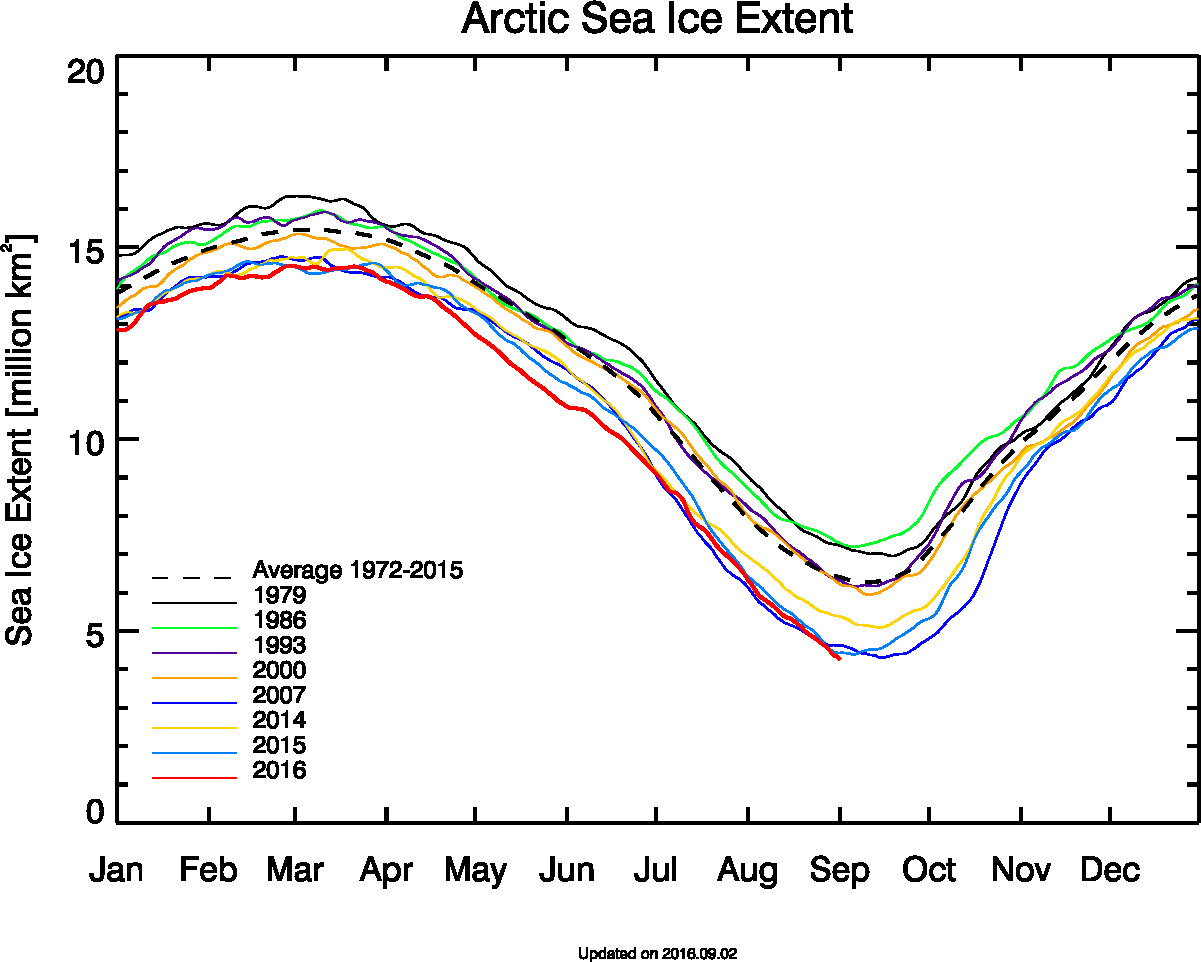
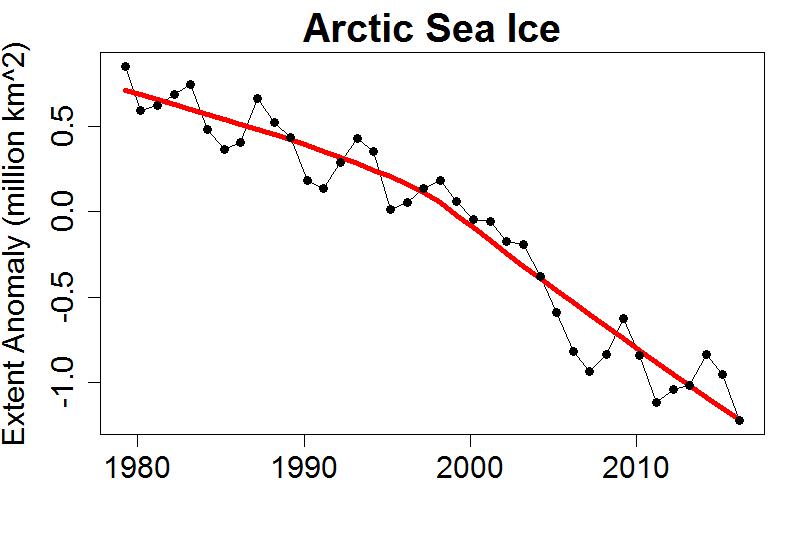
September is upon us once again, the month in which the assorted Arctic sea ice area and extent metrics (almost) always reach their respective annual minima. Now we are free to start speculating about what the assorted minima will be, and on what date.

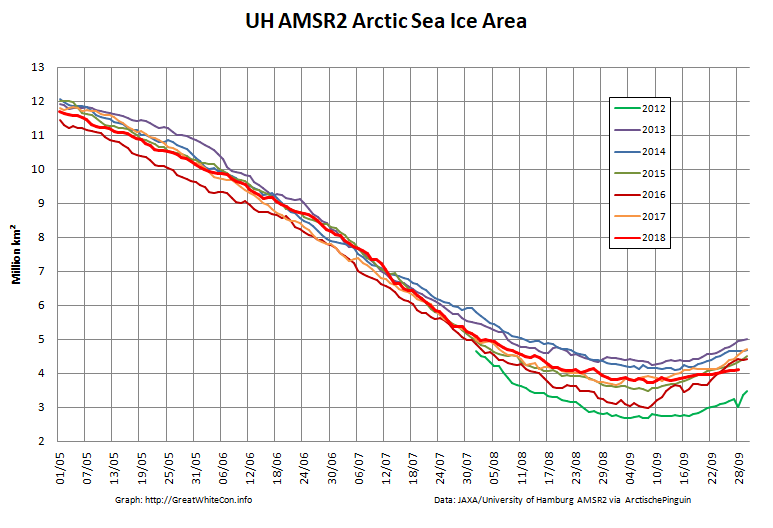
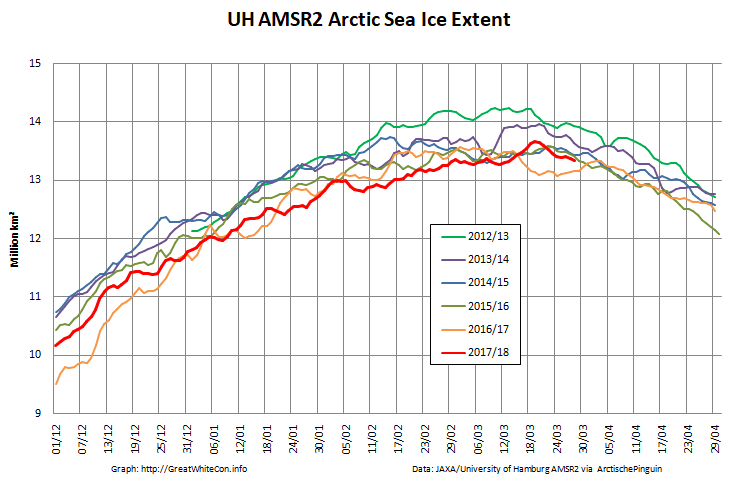
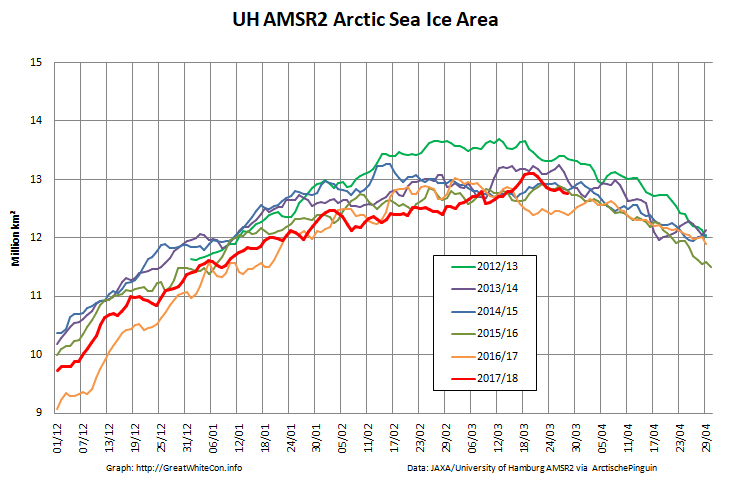
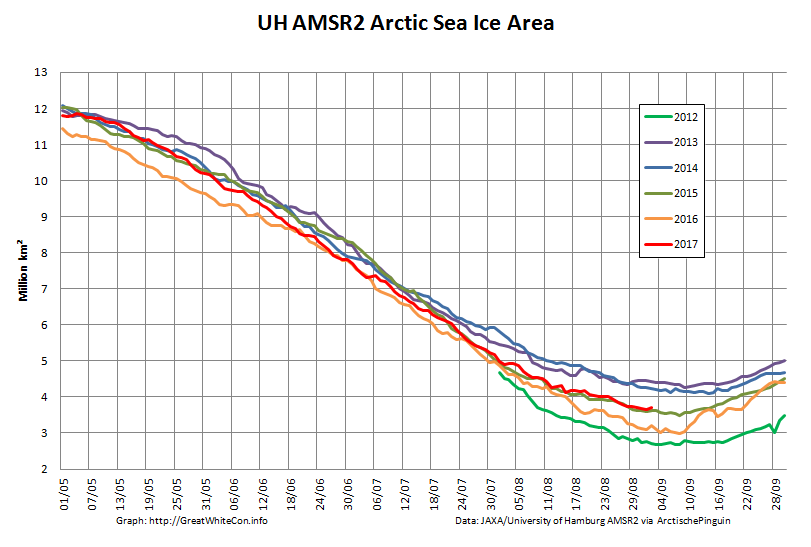
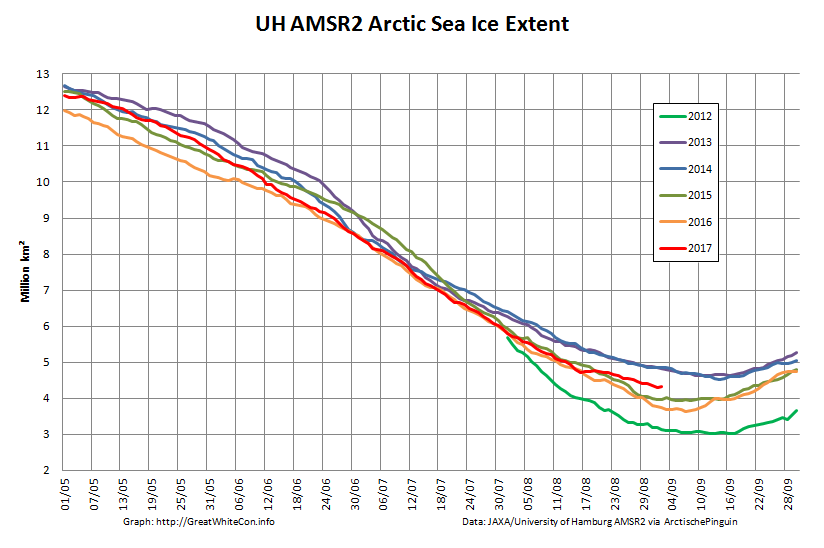
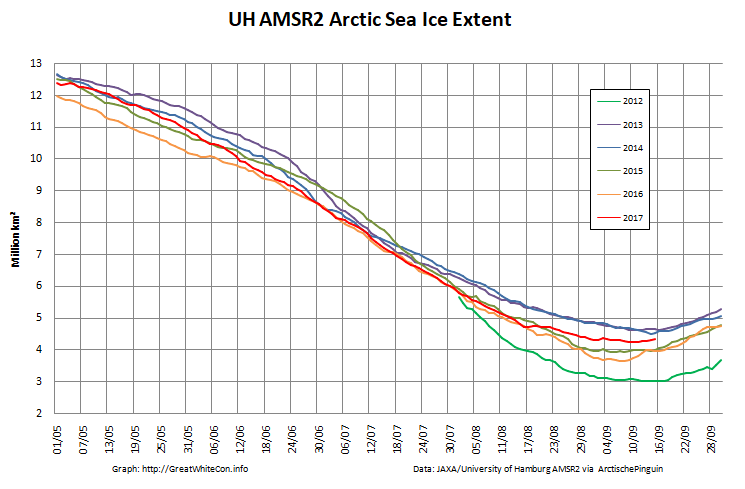
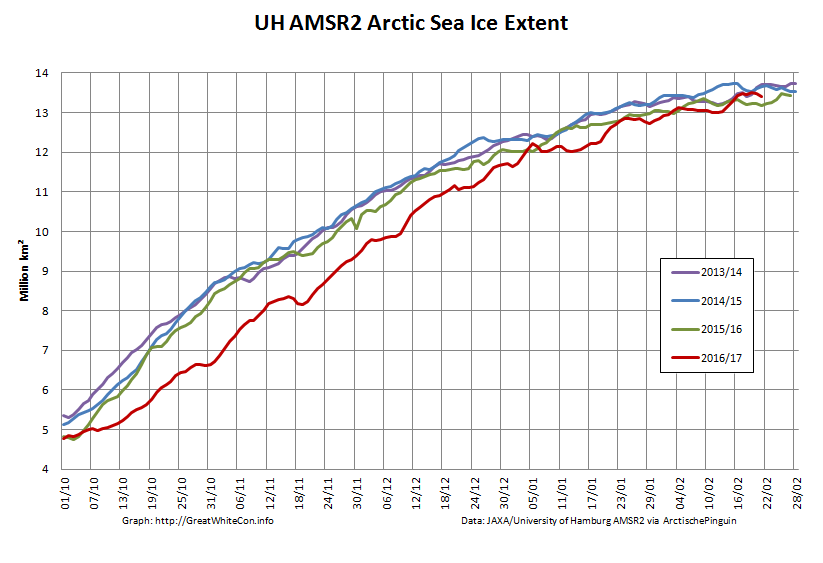
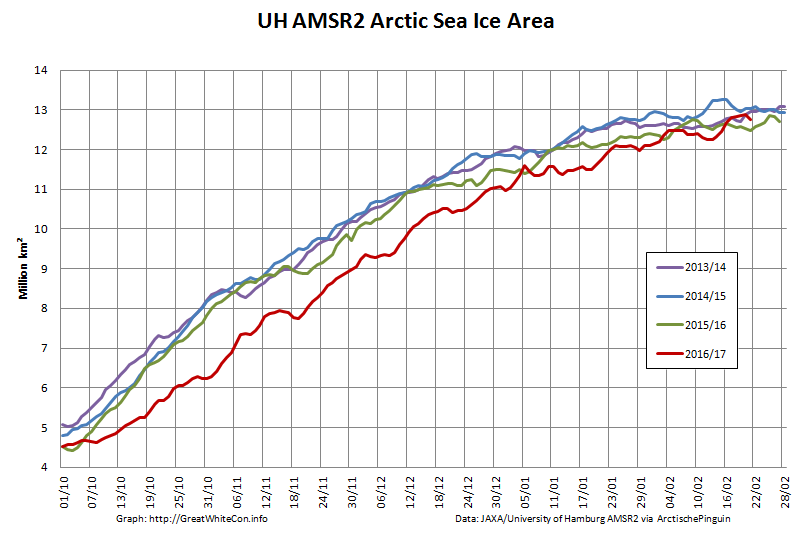
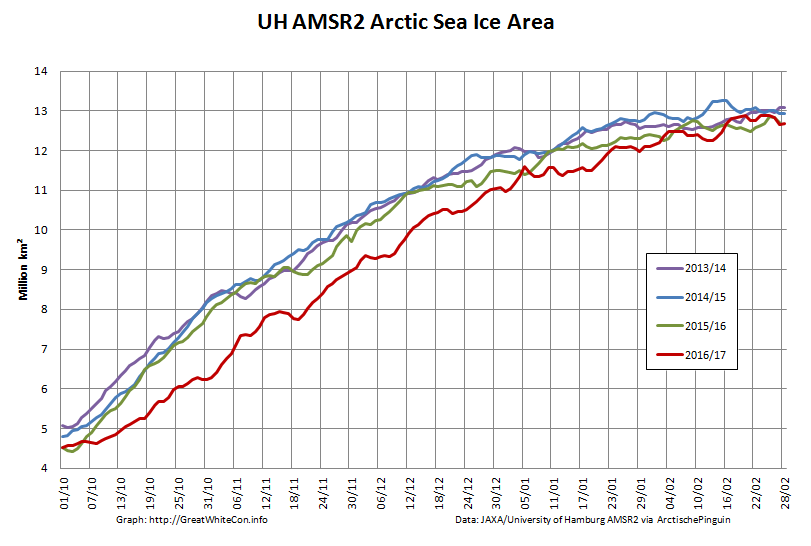
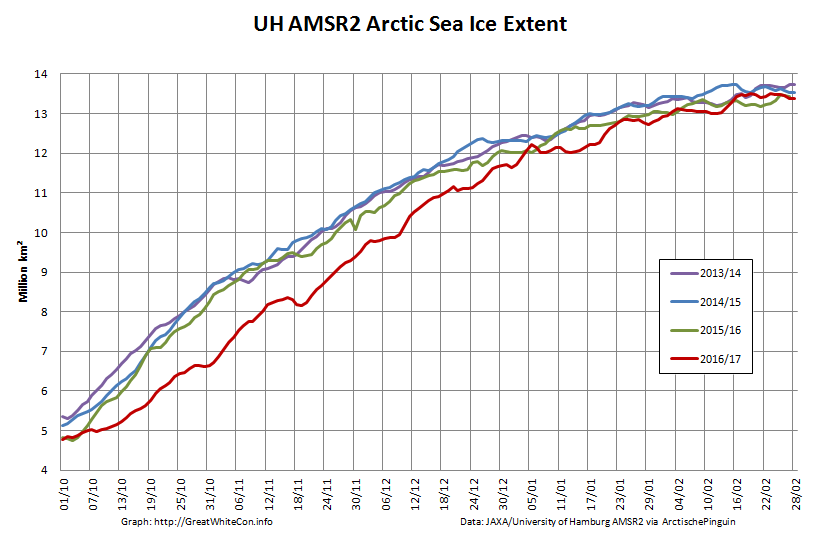
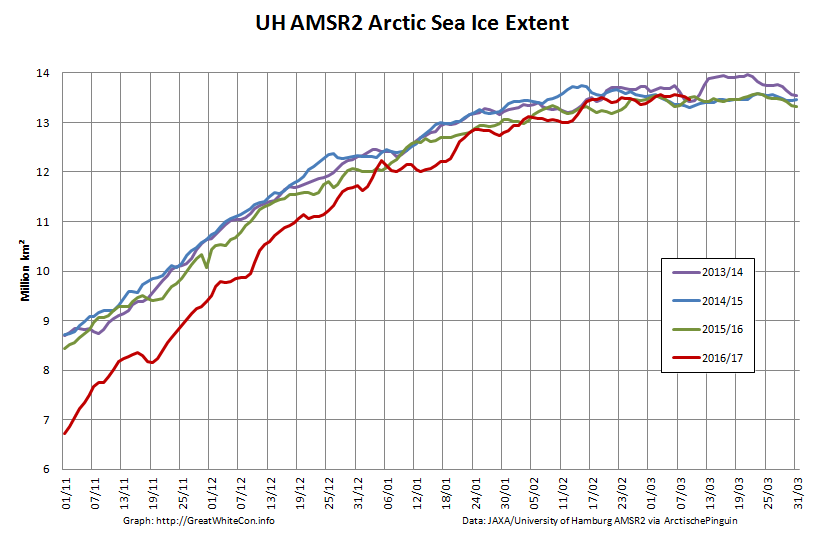
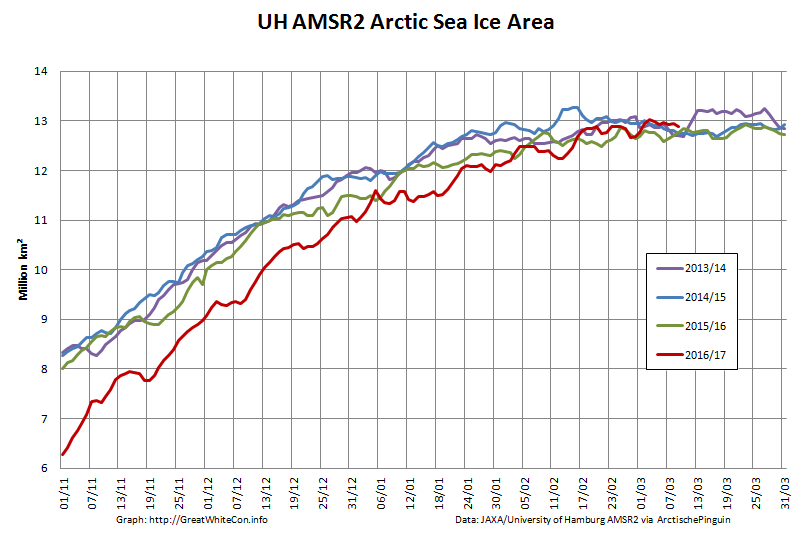
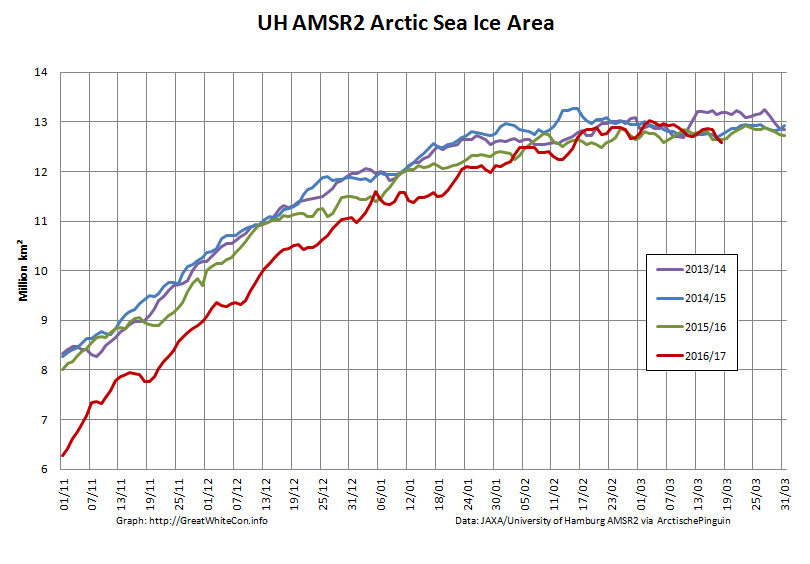
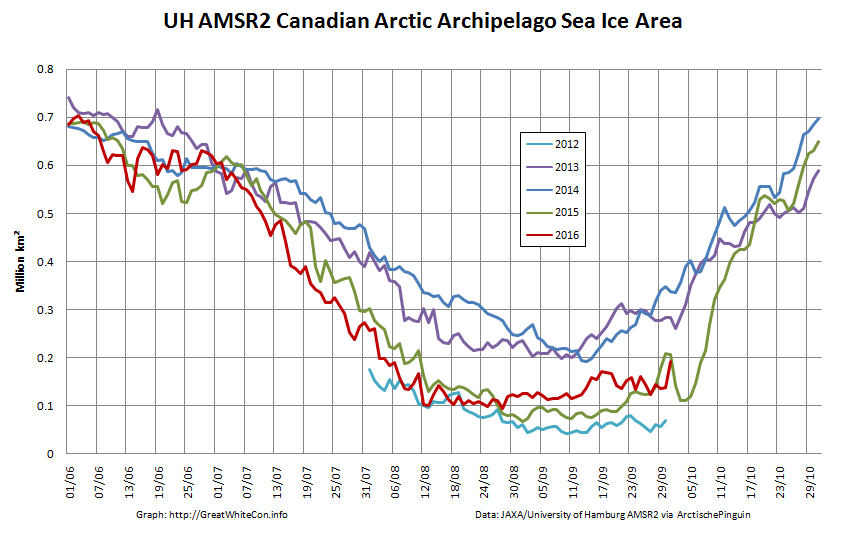
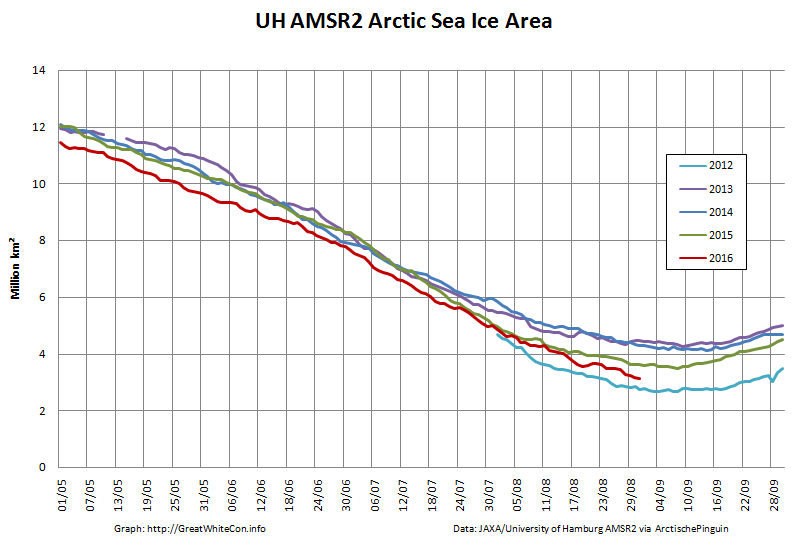
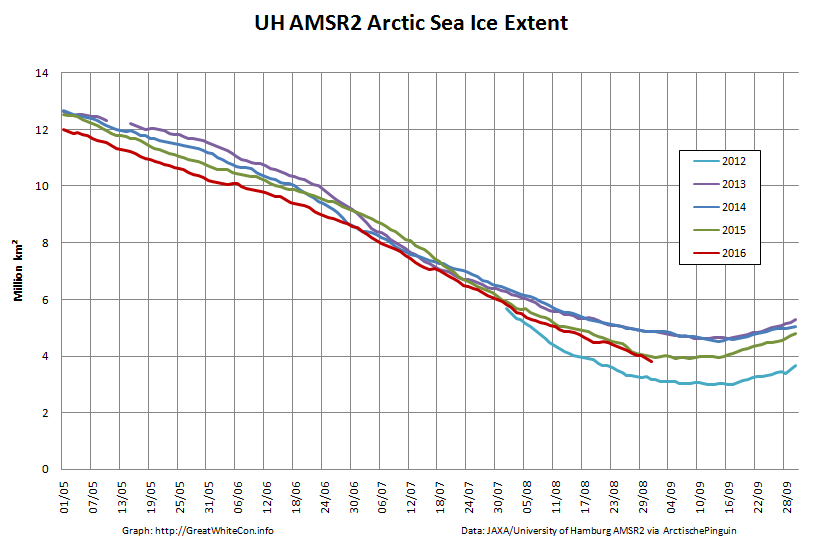
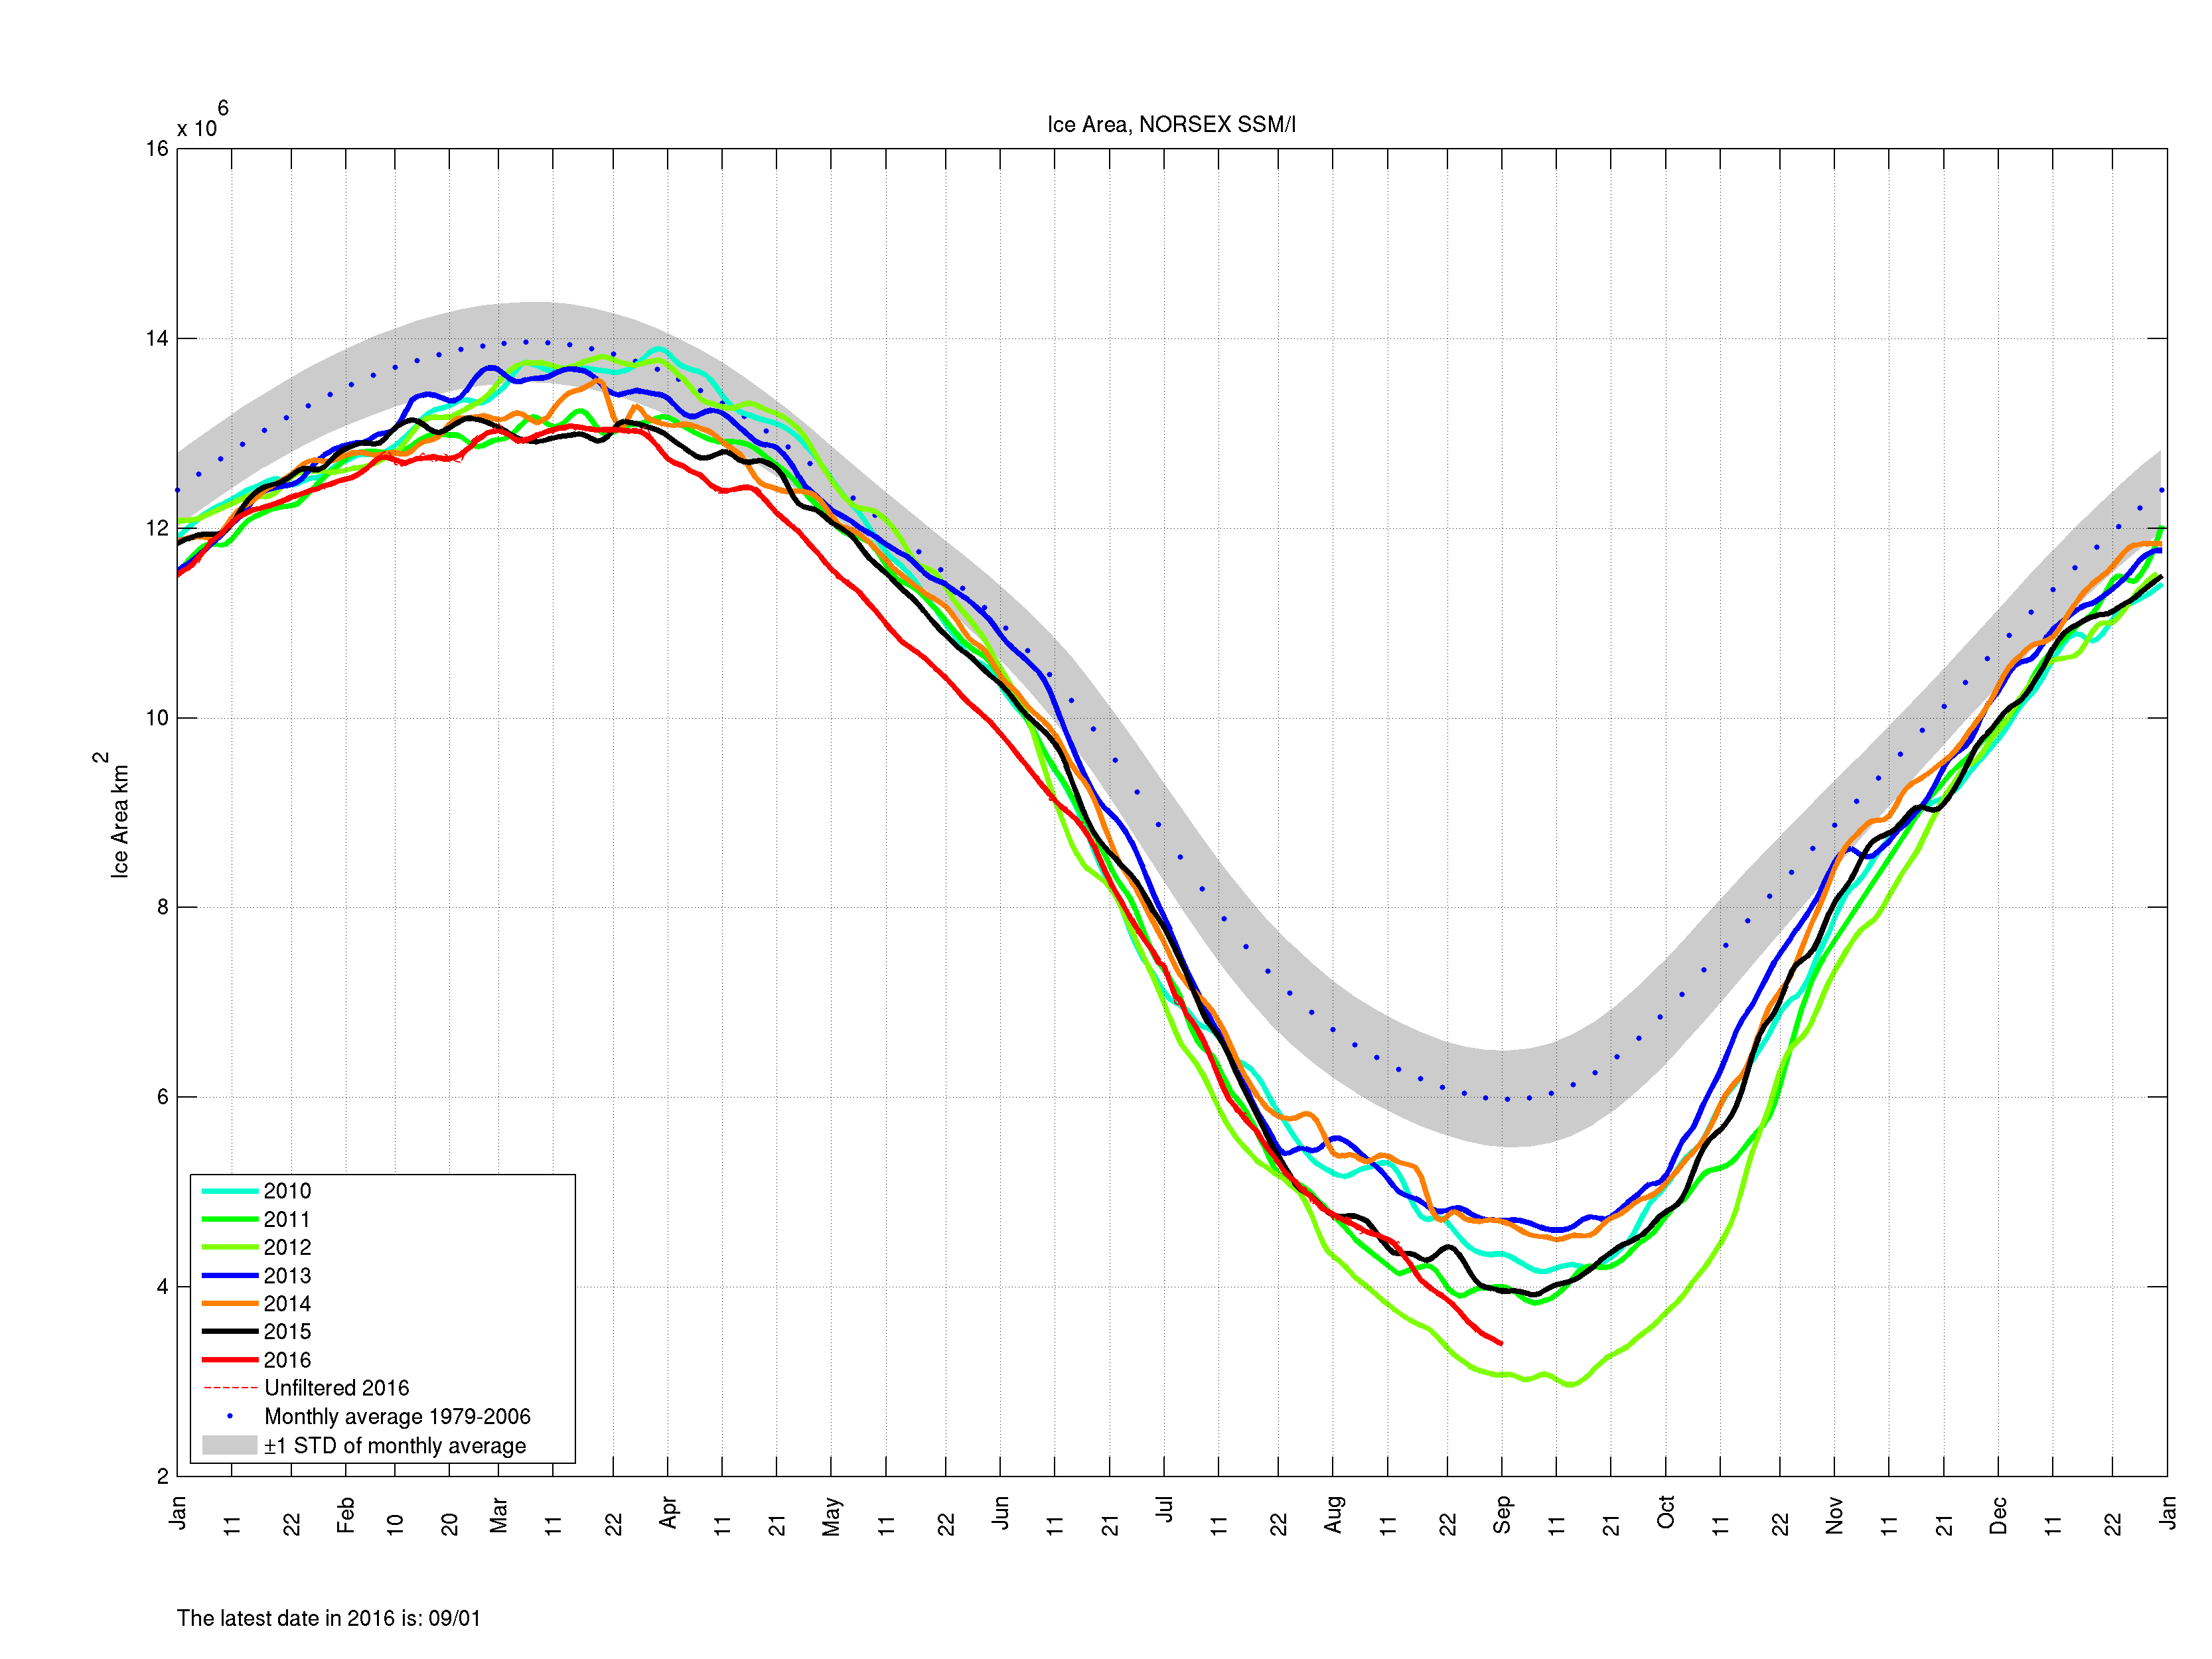
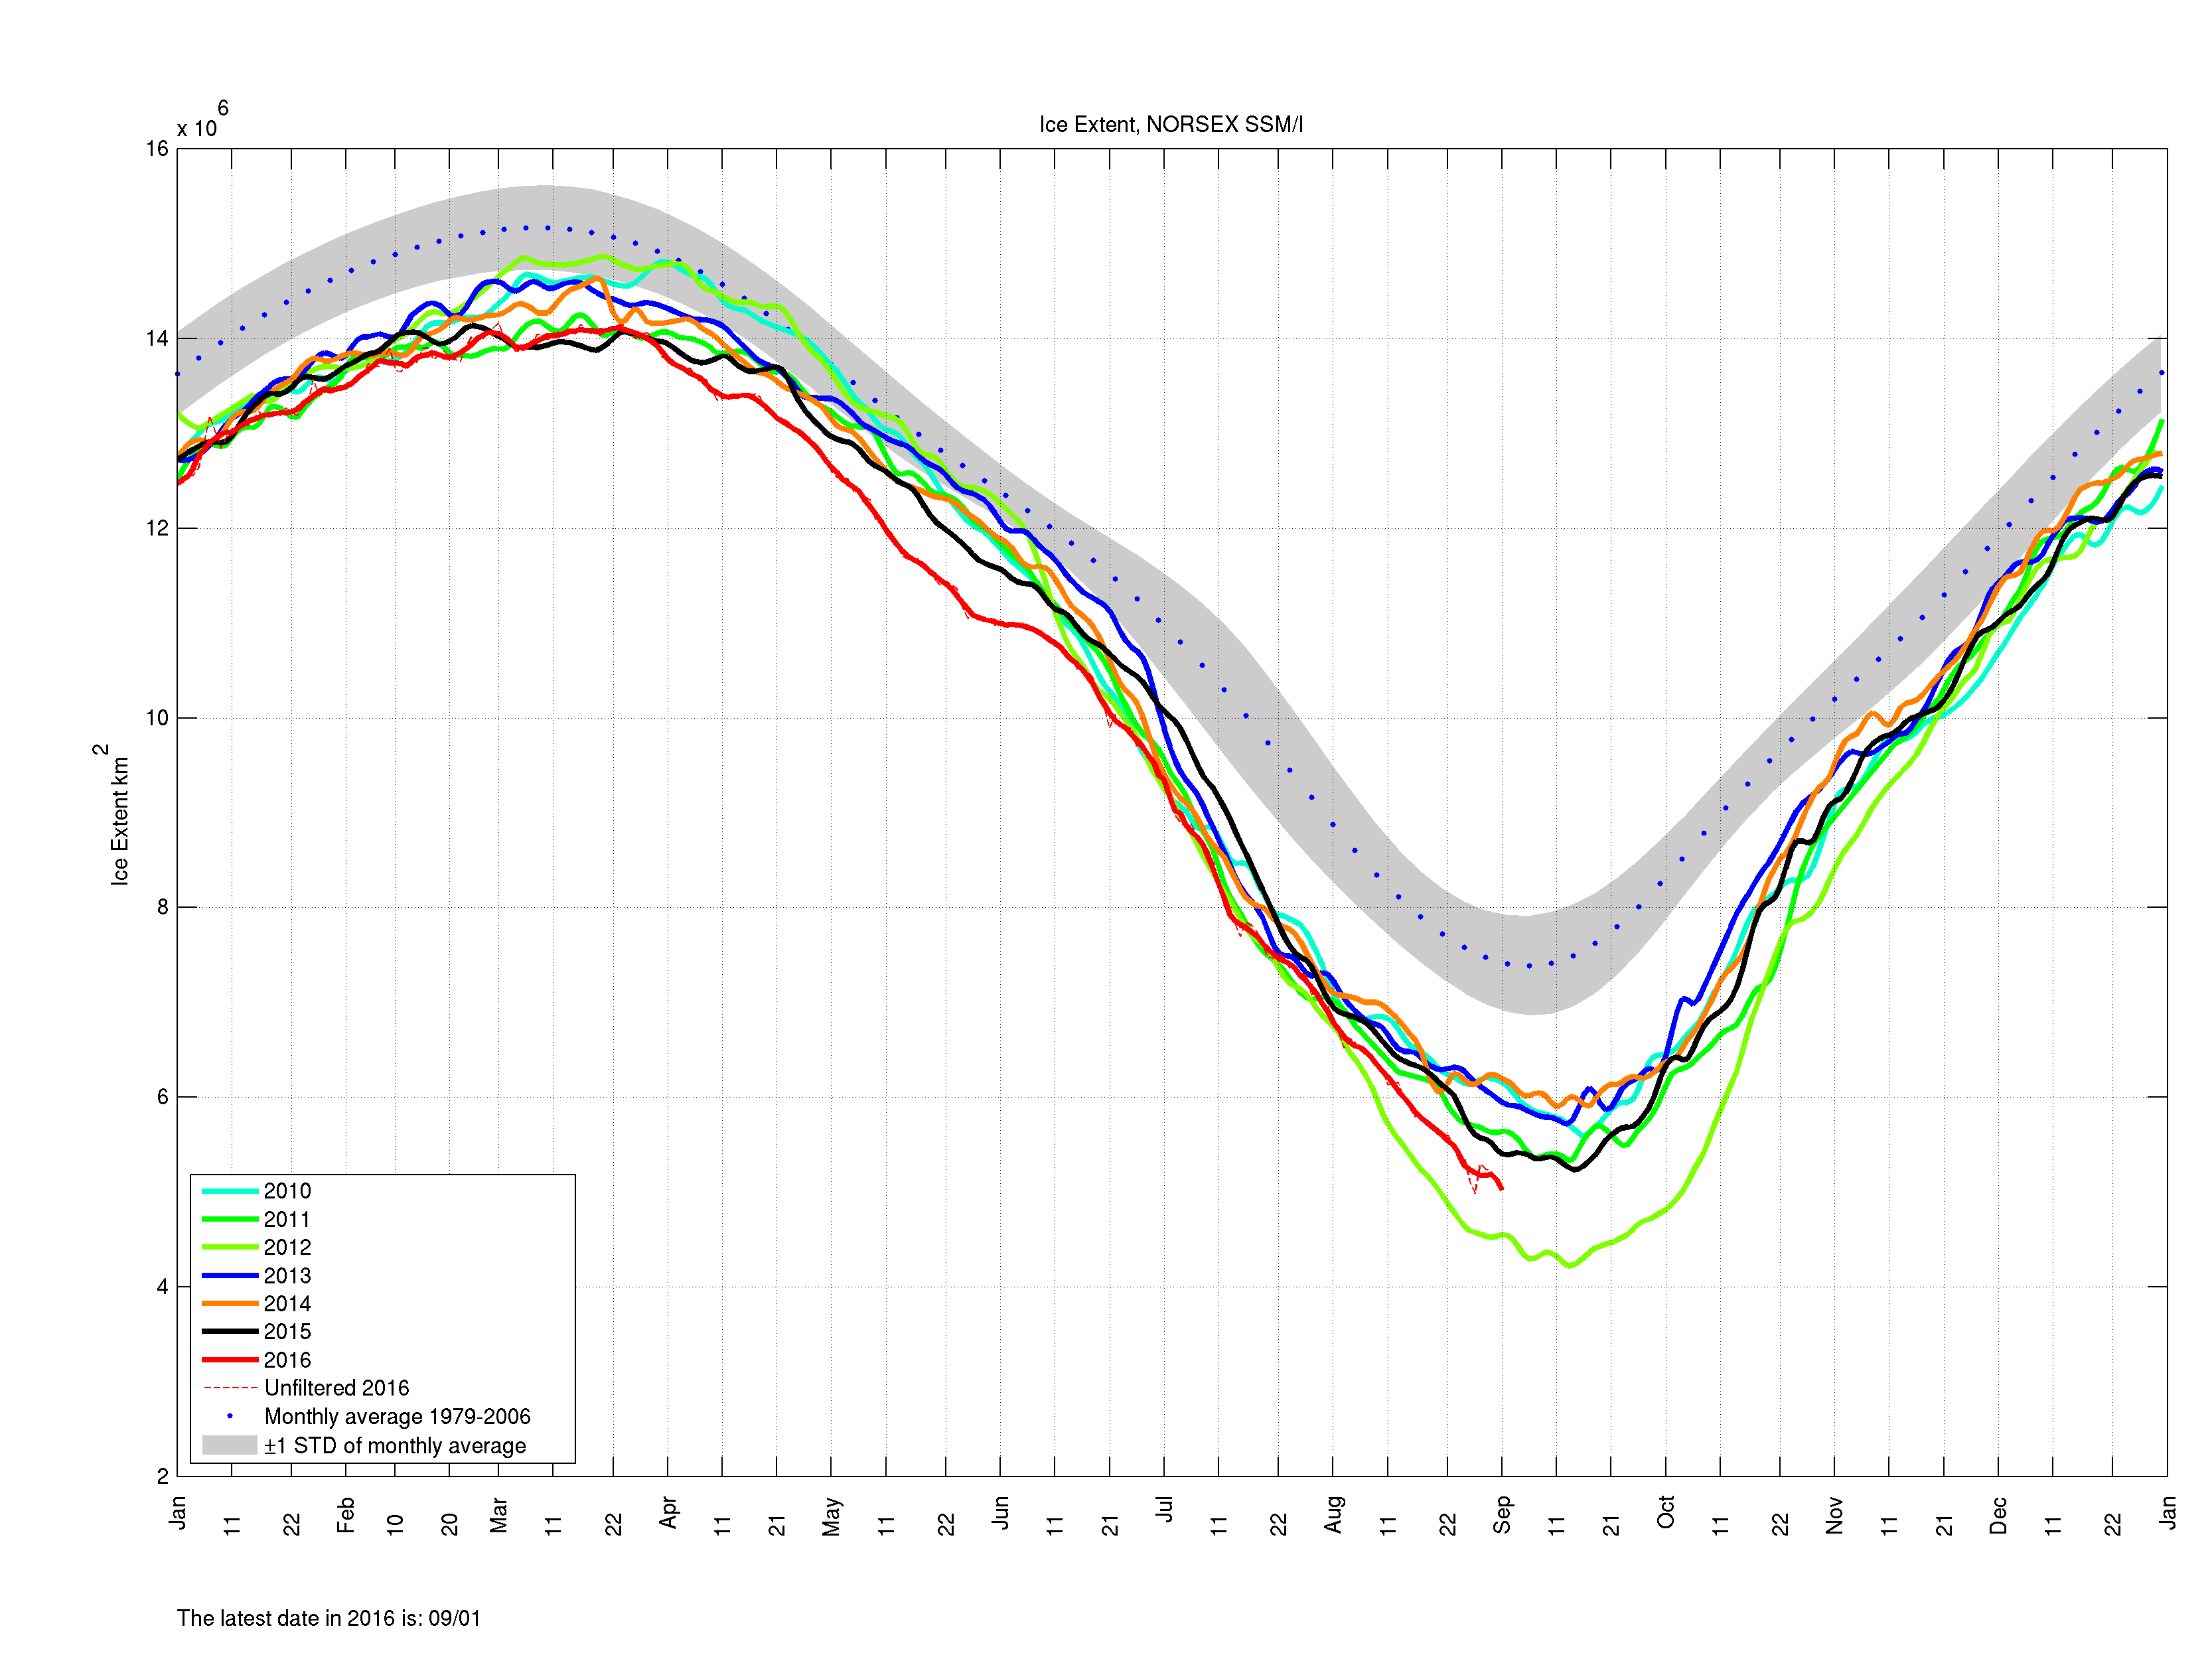
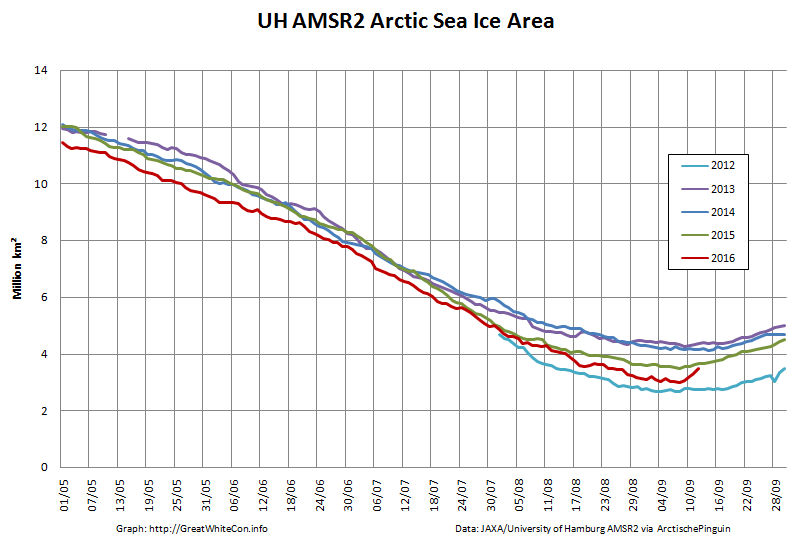
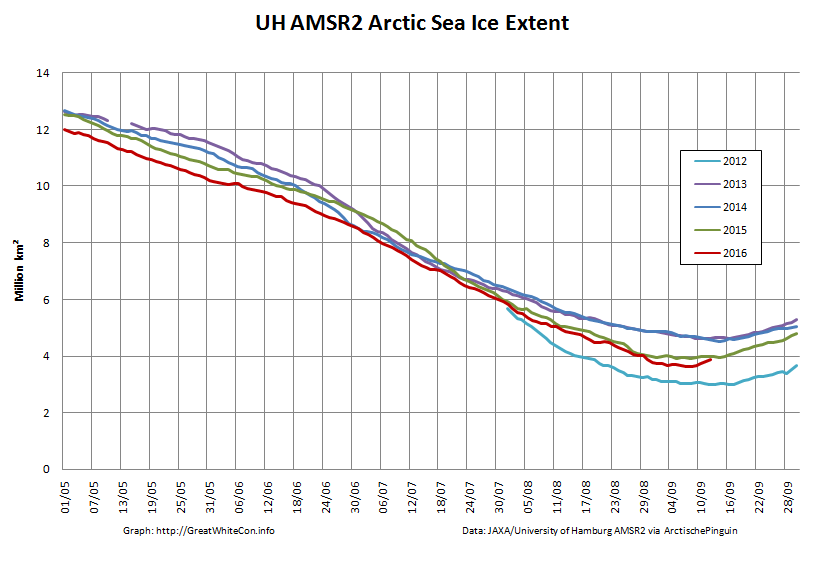
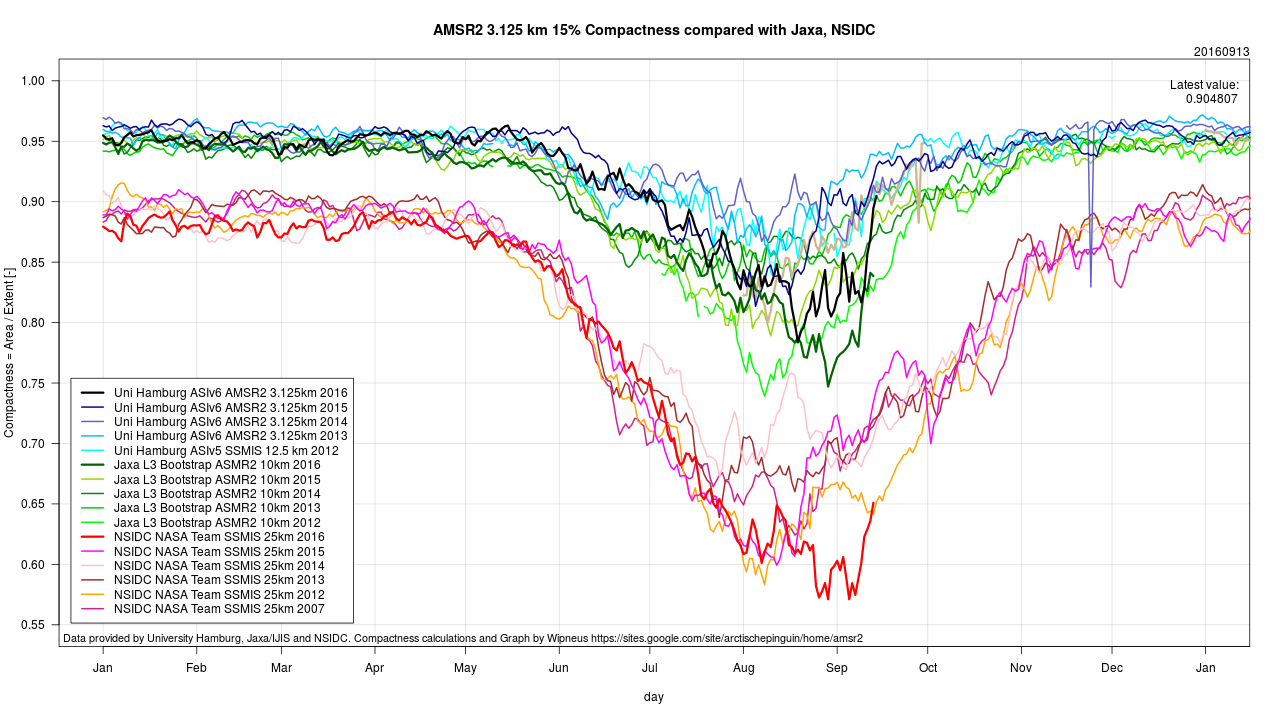
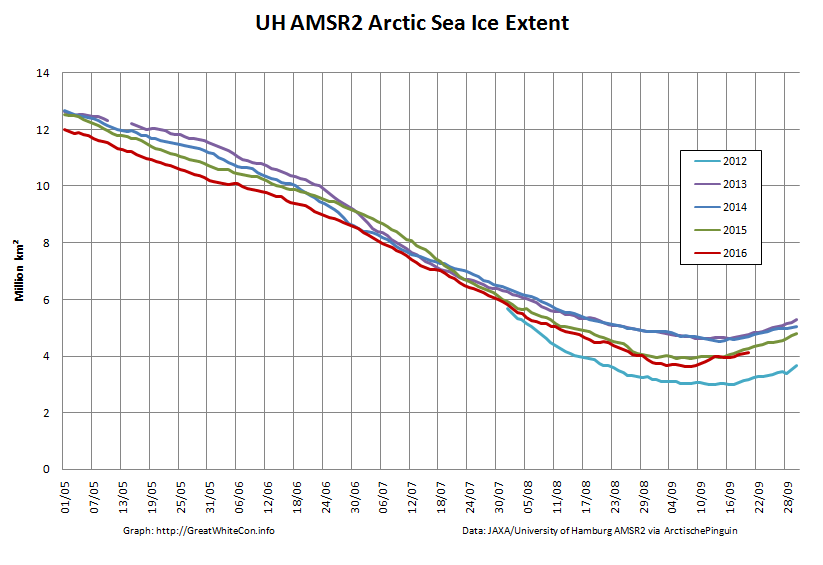
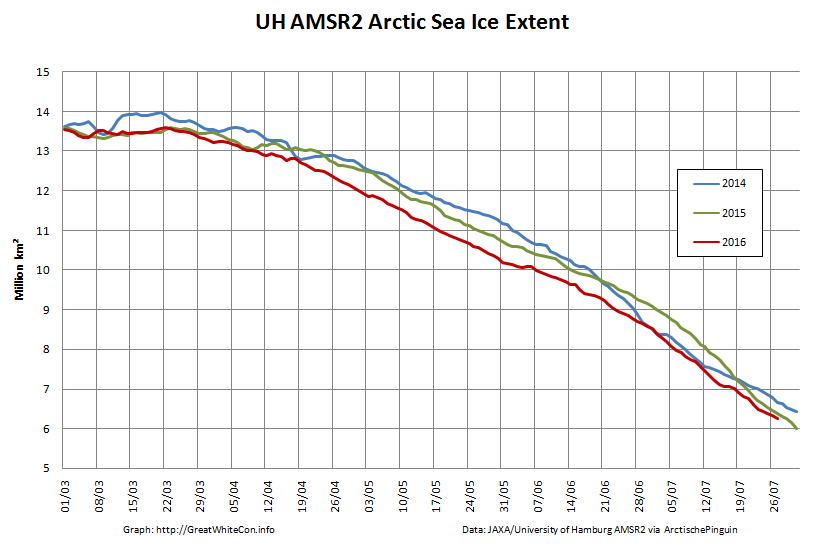
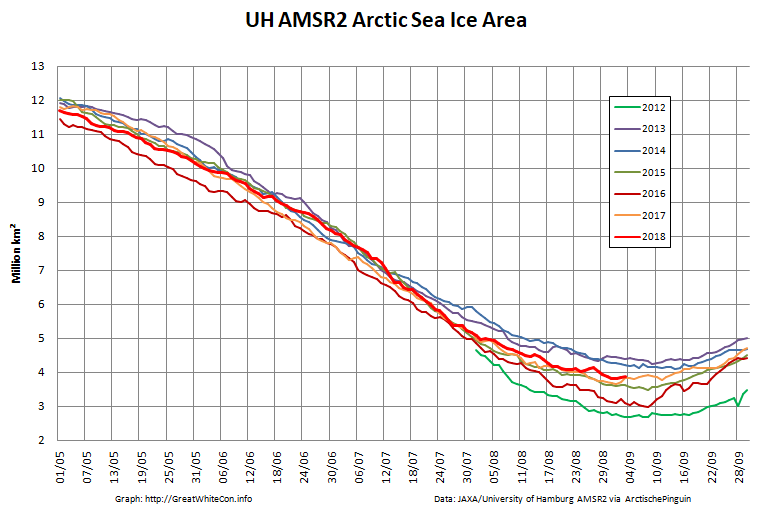
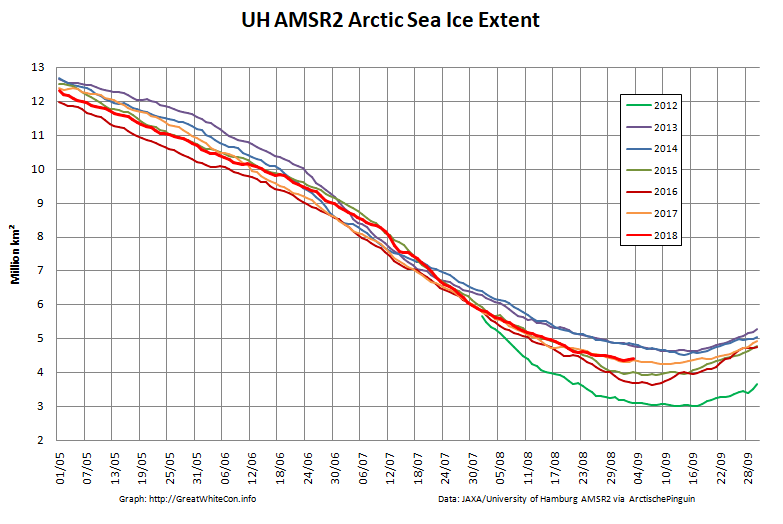
To begin with let’s take a look at our much beloved high resolution AMSR2 metrics derived by “Wipneus” from the University of Hamburg’s AMSR2 concentration data:

Arctic-Area-2018-09-01

Arctic-Extent-2018-09-01

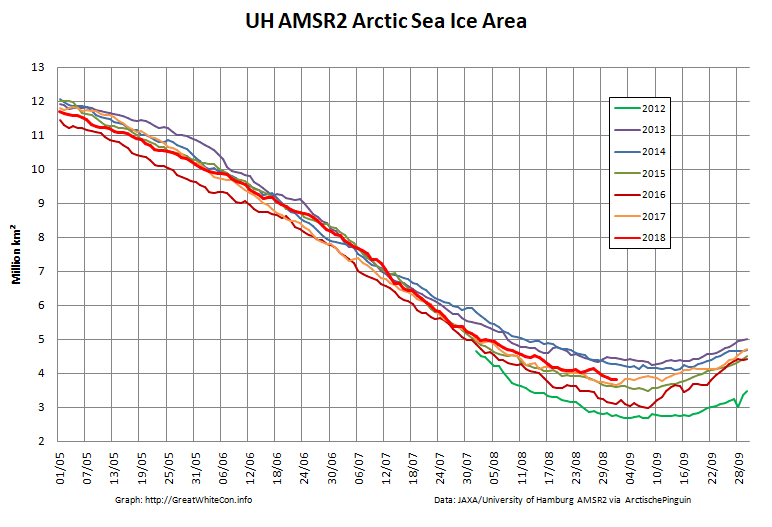
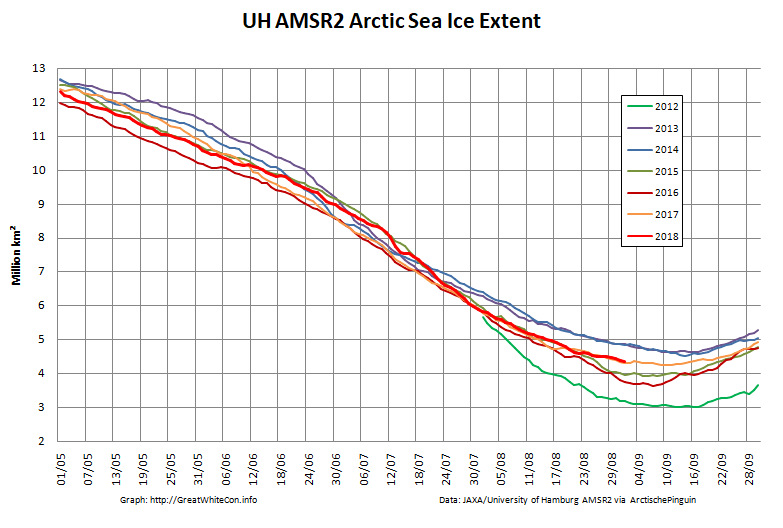
There’s currently some divergence between the area and extent graphs. Area is declining rapidly for the time of year, whilst extent seems to almost have come to a standstill!

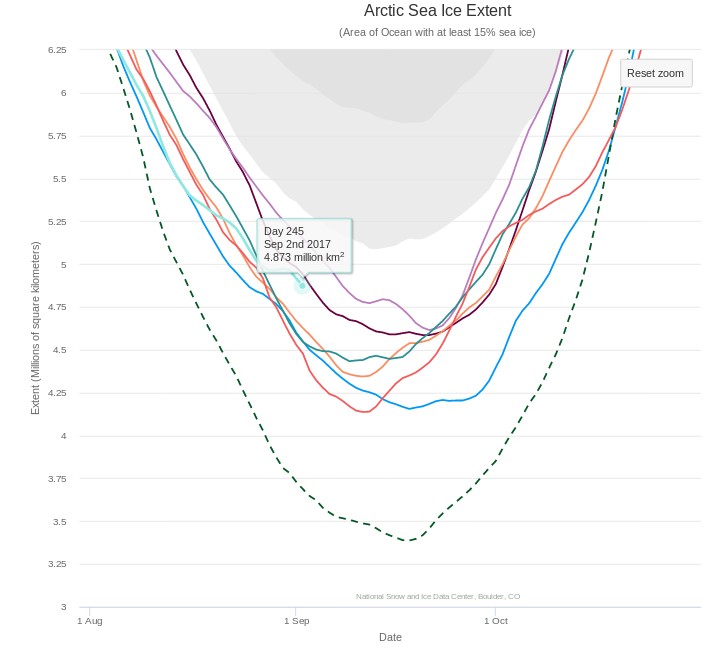
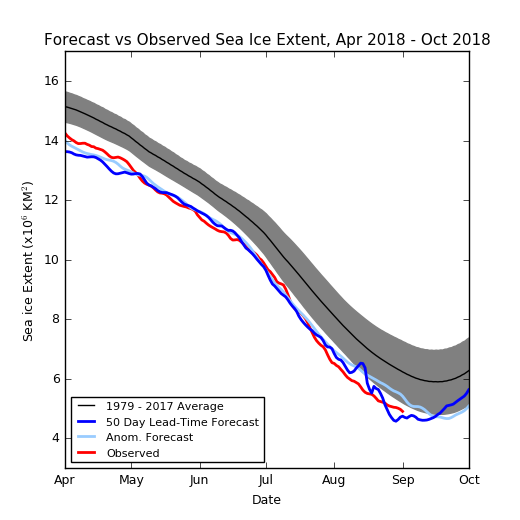
Next here’s the prediction of the late, great Andrew Slater’s Probabilistic Ice Extent algorithm:

SPIE-extent-20180901

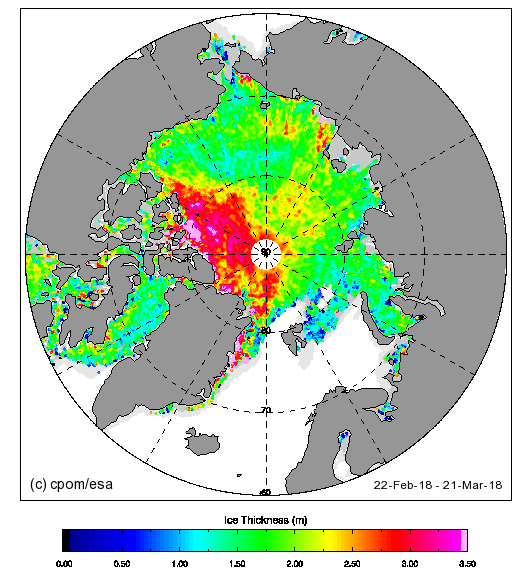
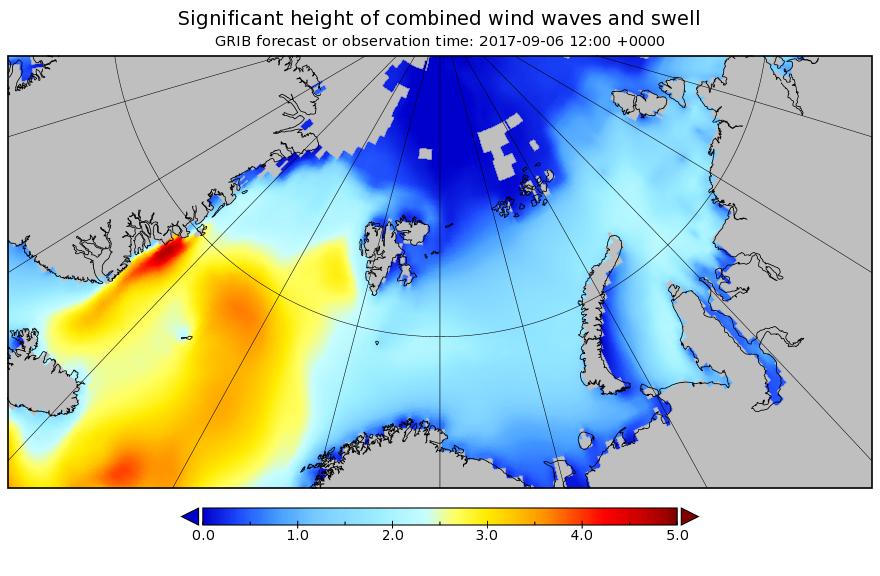
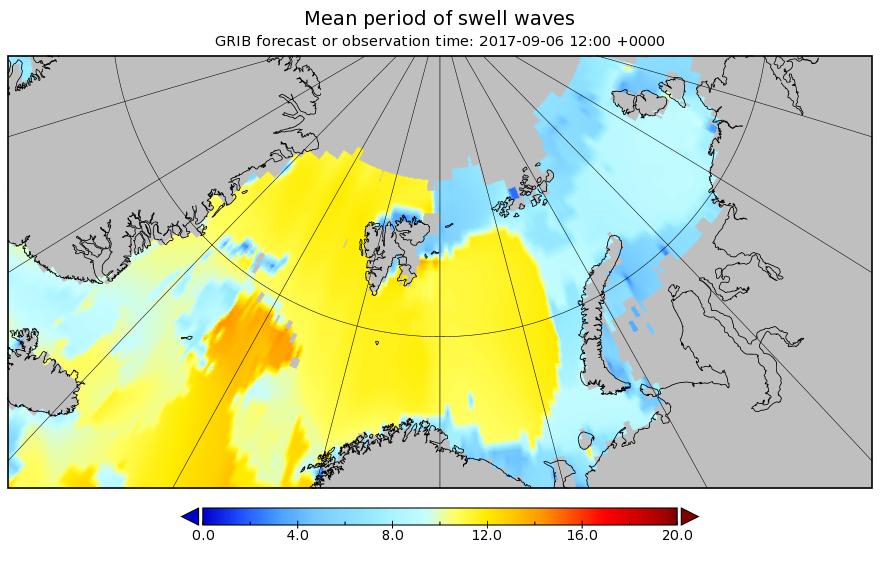
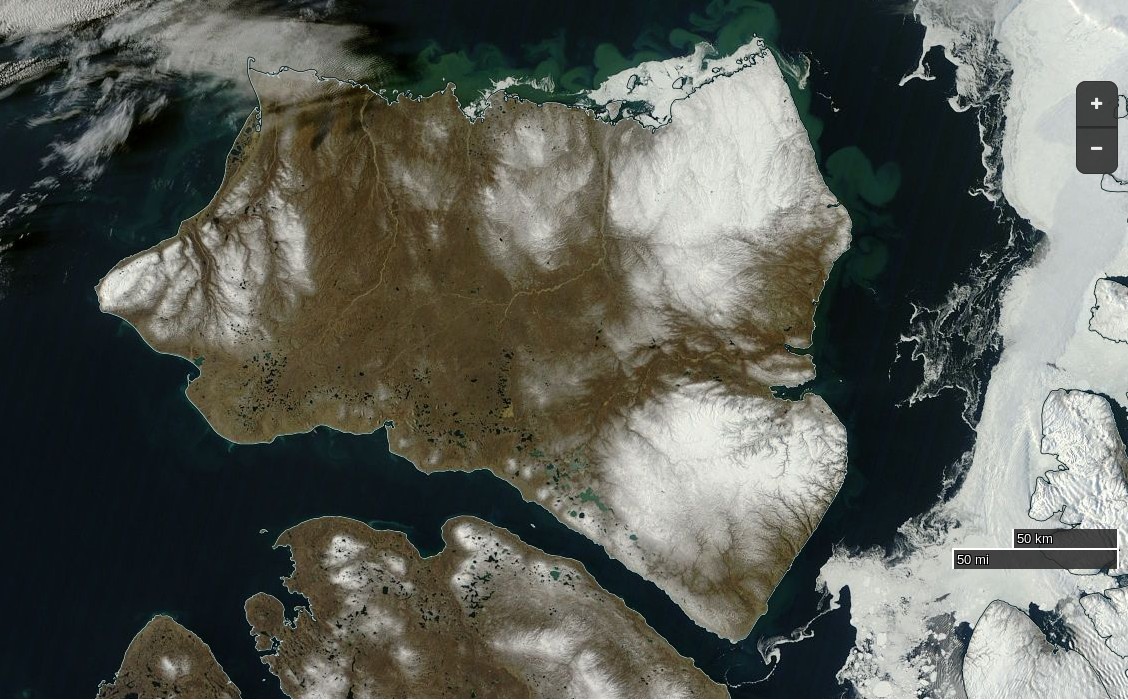
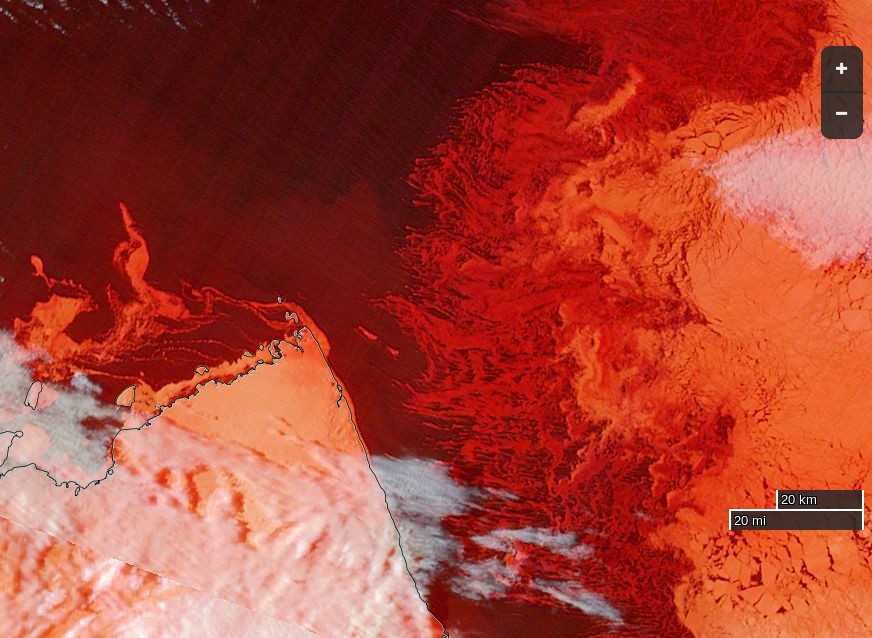
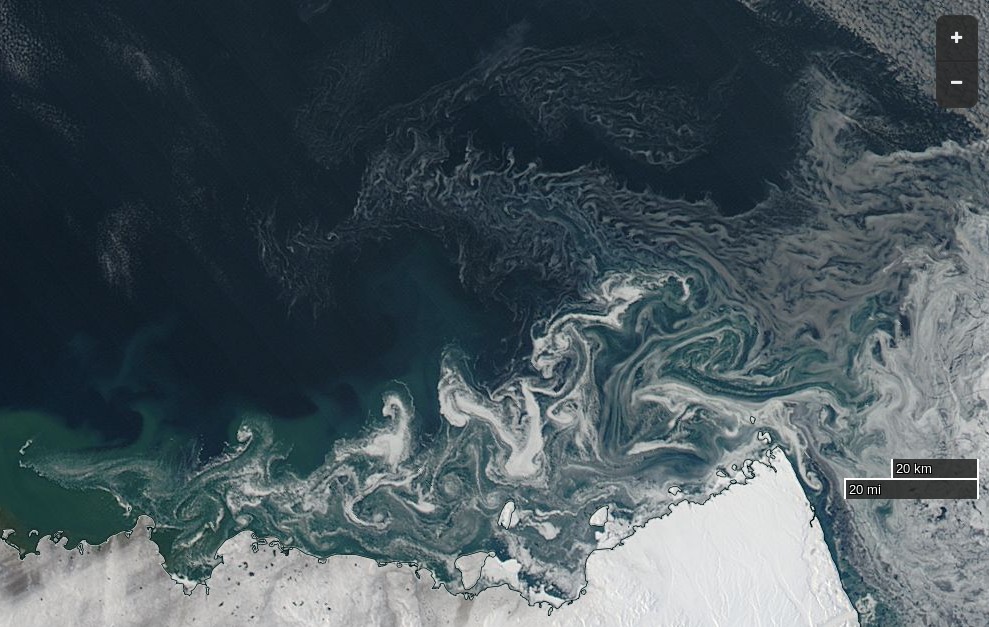
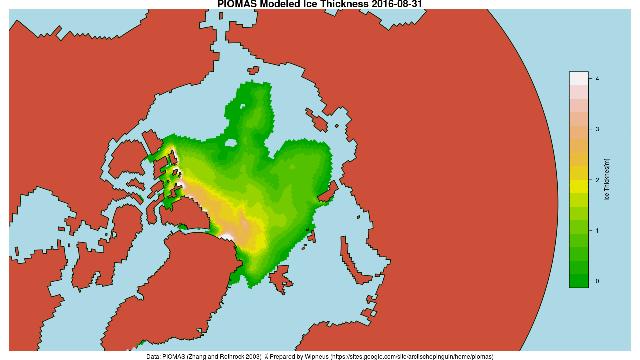
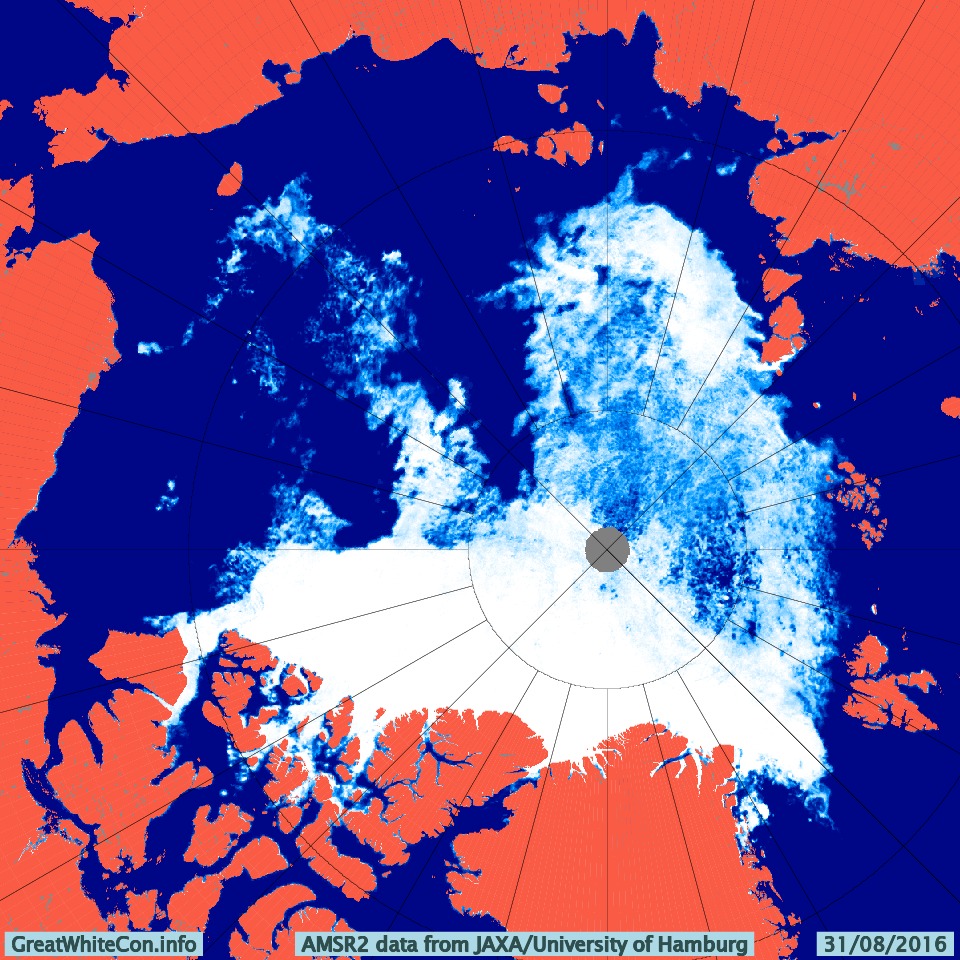
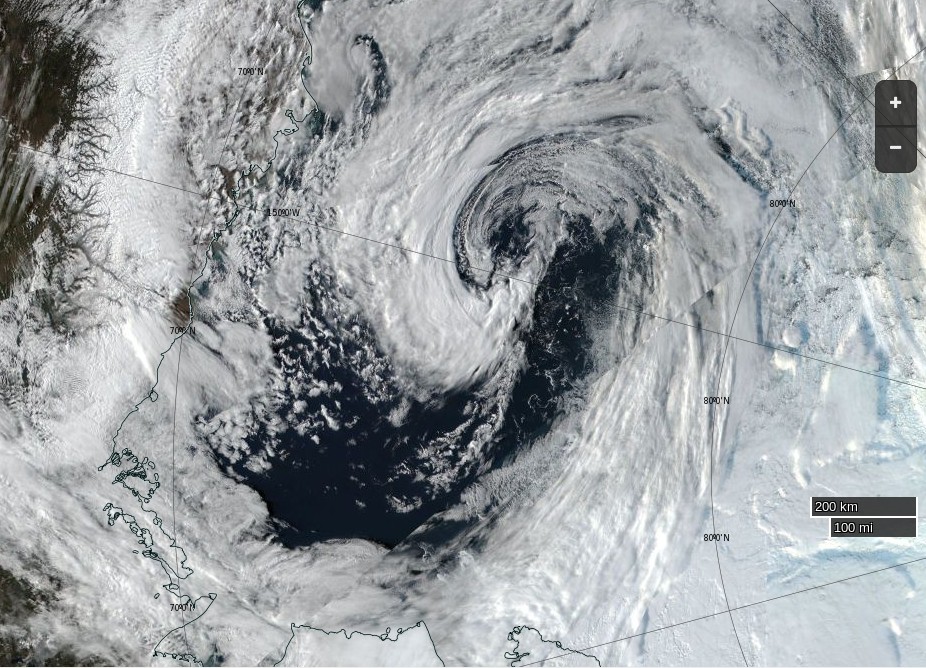
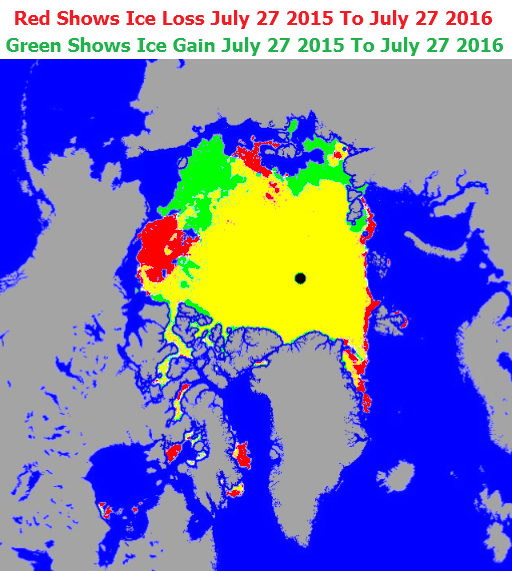
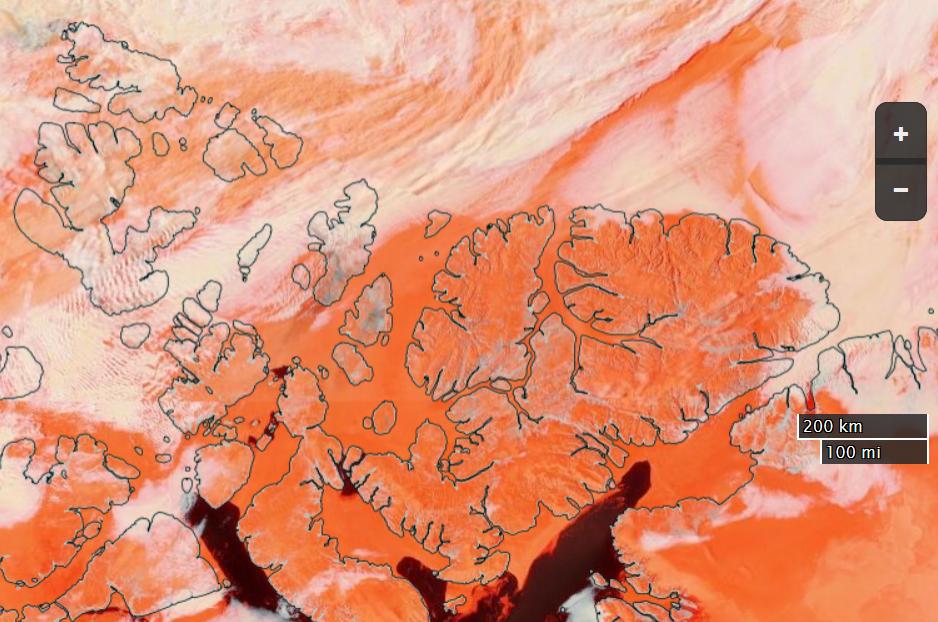
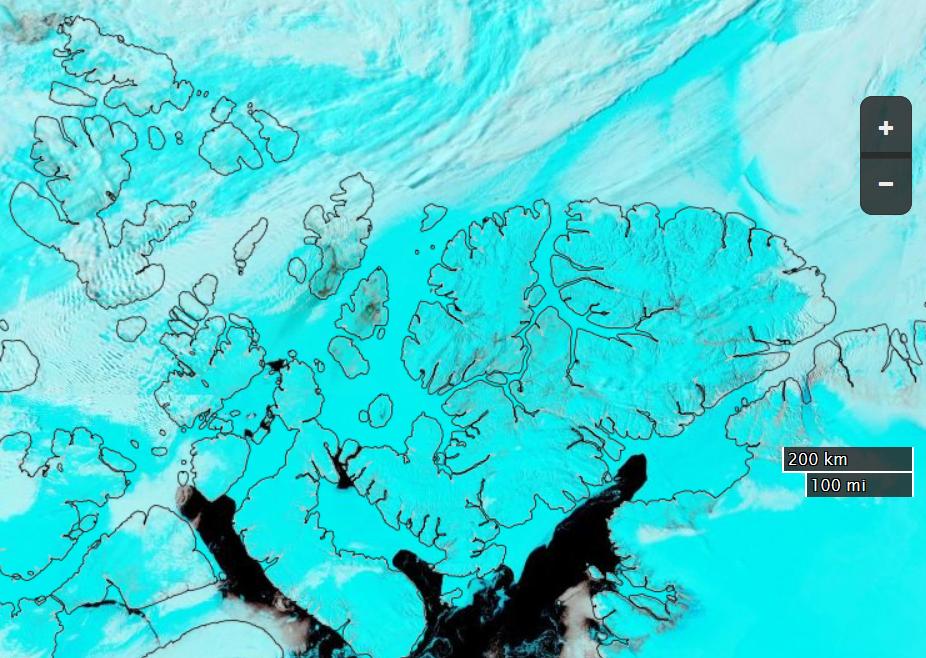
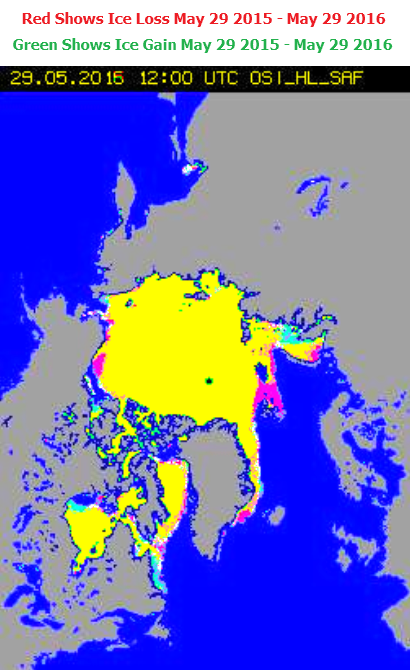
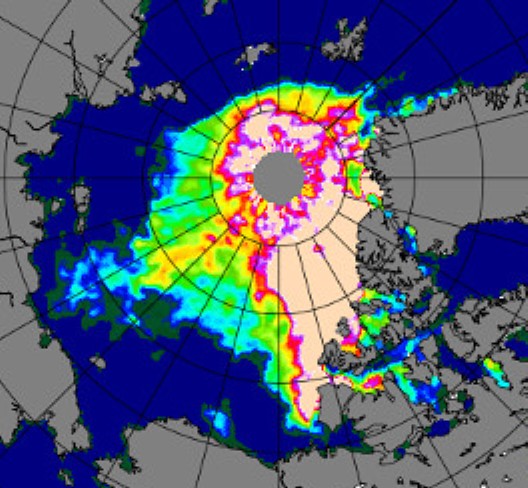
Before looking at some of the other metrics we’ll wait for the effect of the assorted storms currently circling the Arctic to play out. Here’s how the AMSR2 concentration map looks at the moment:

Arc_20180901_res3.125

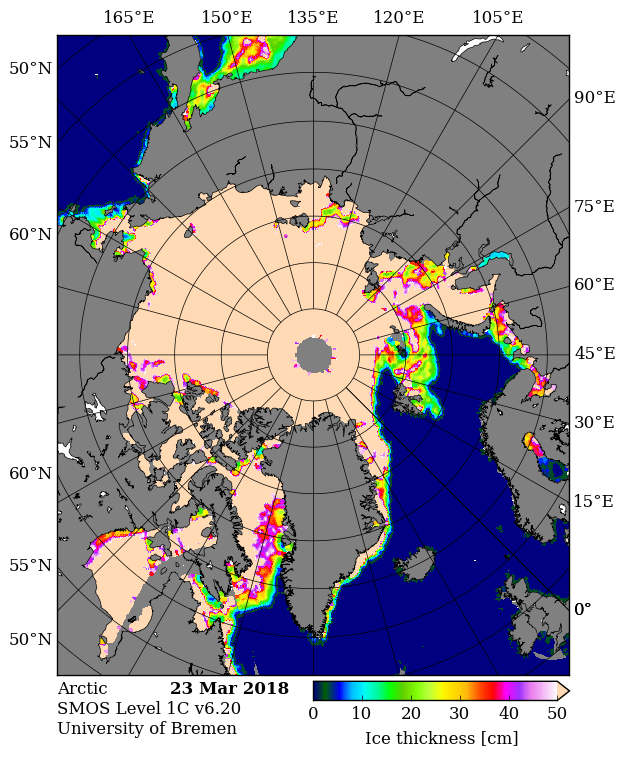
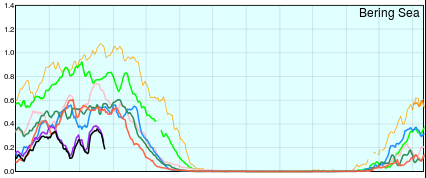
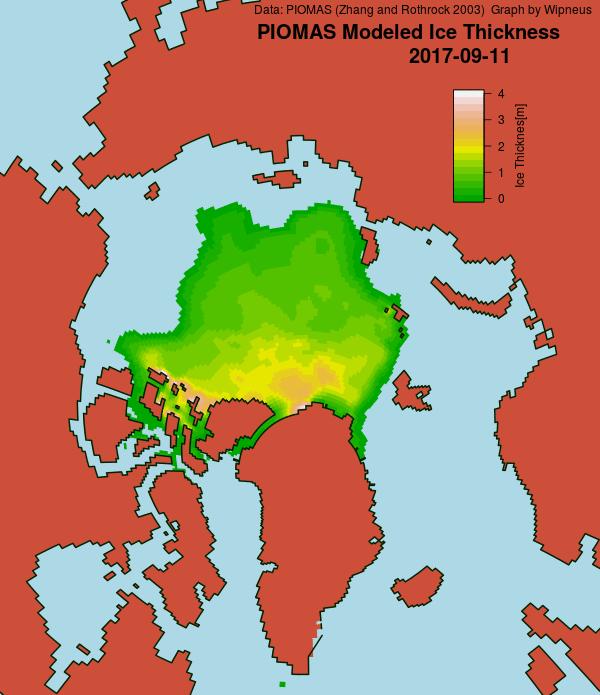
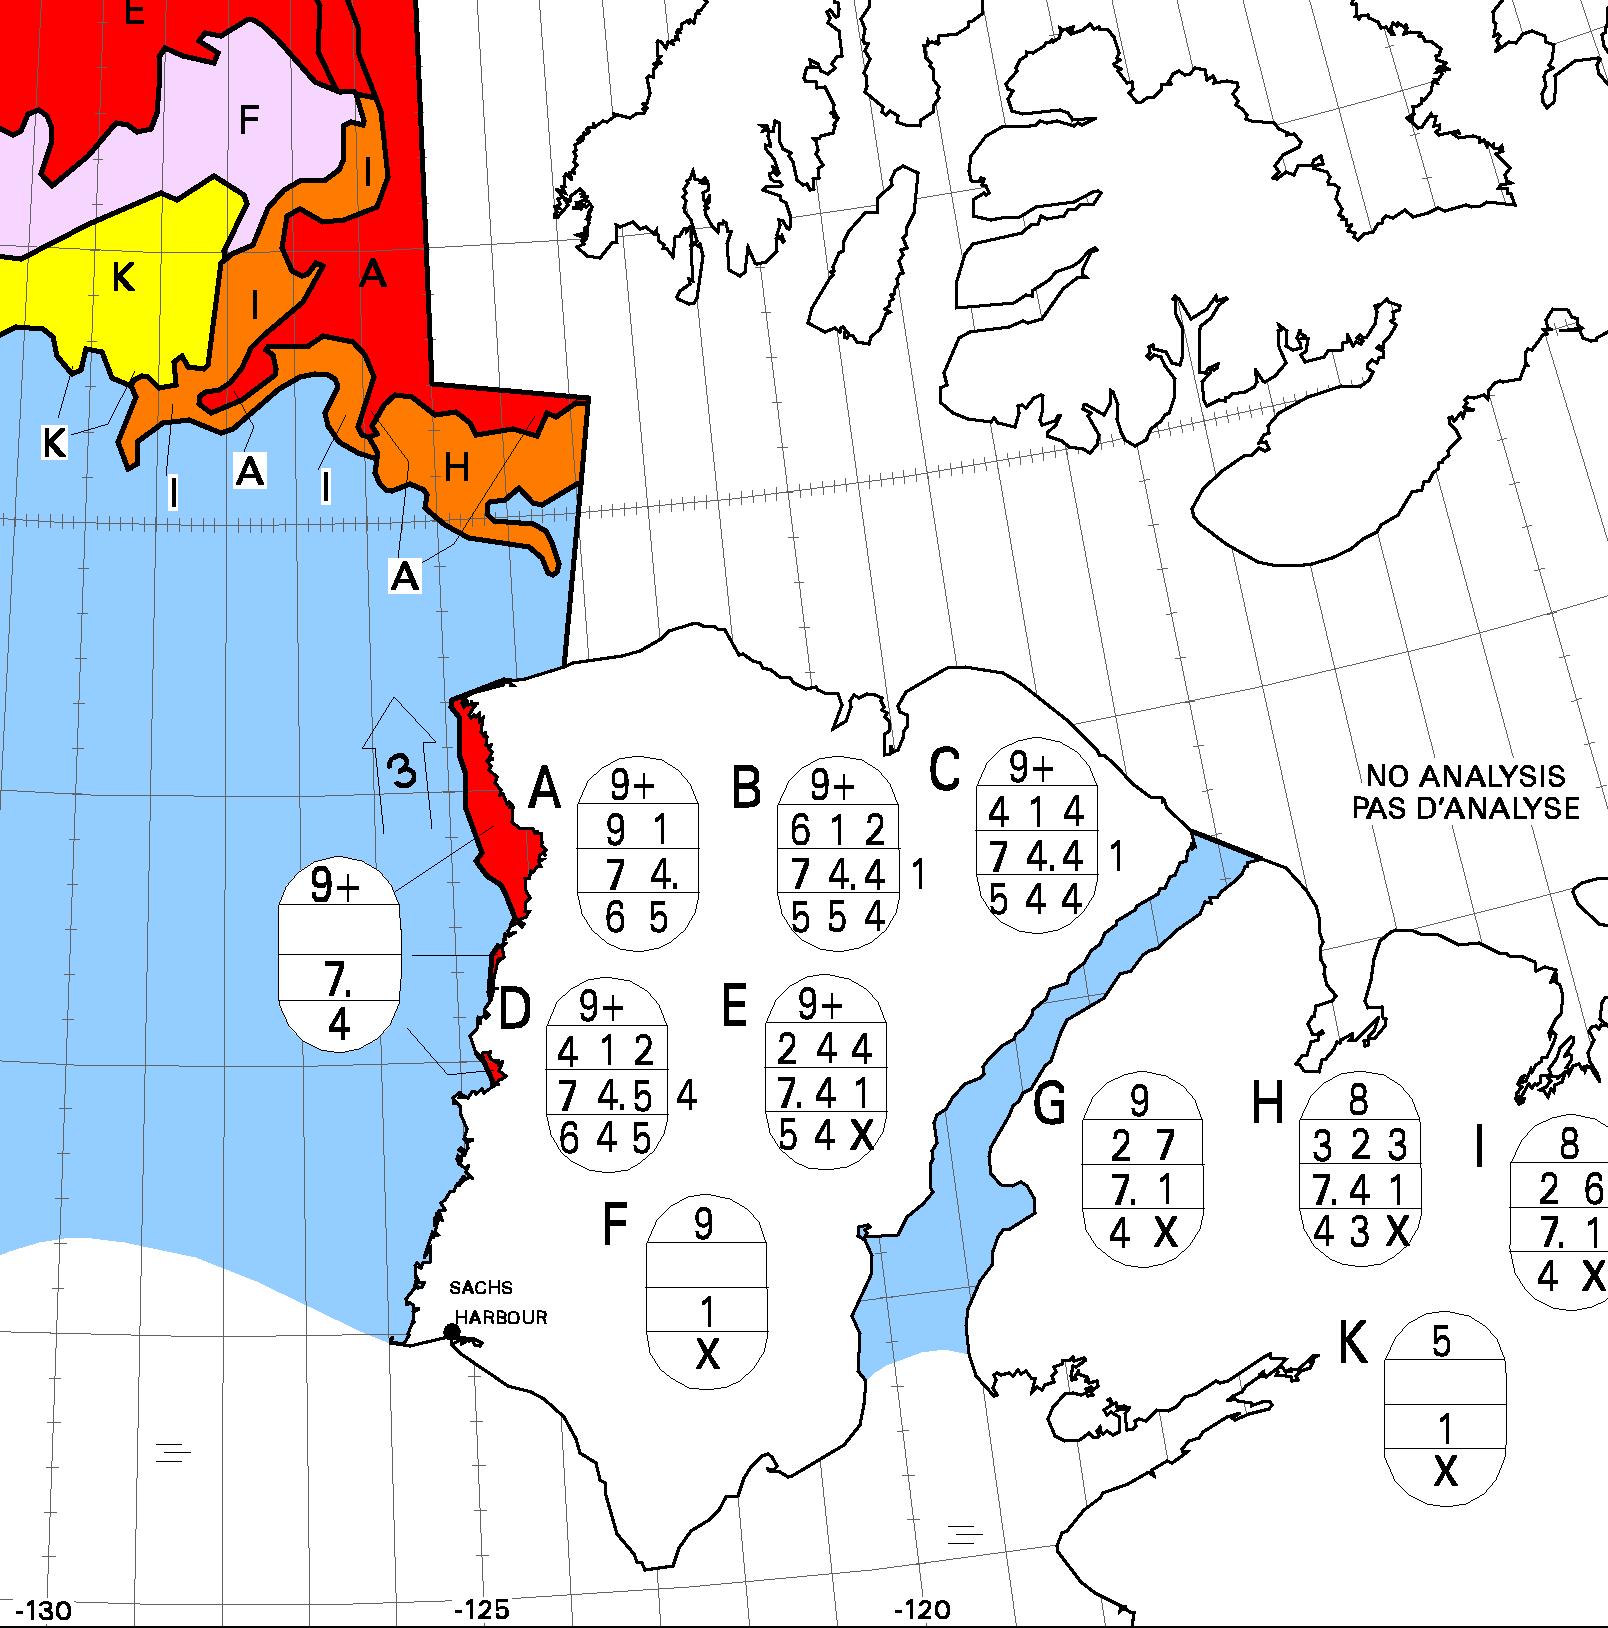
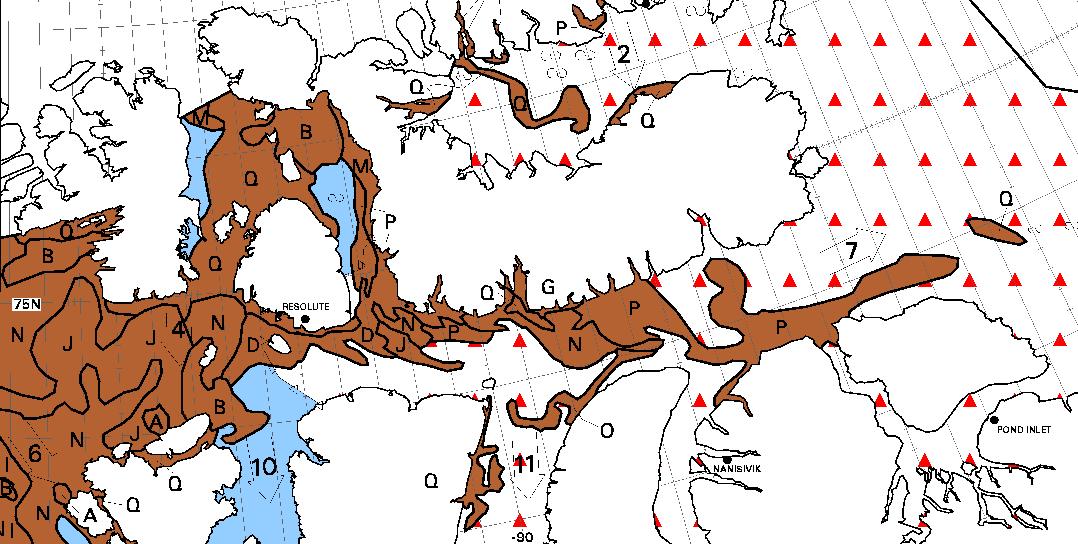
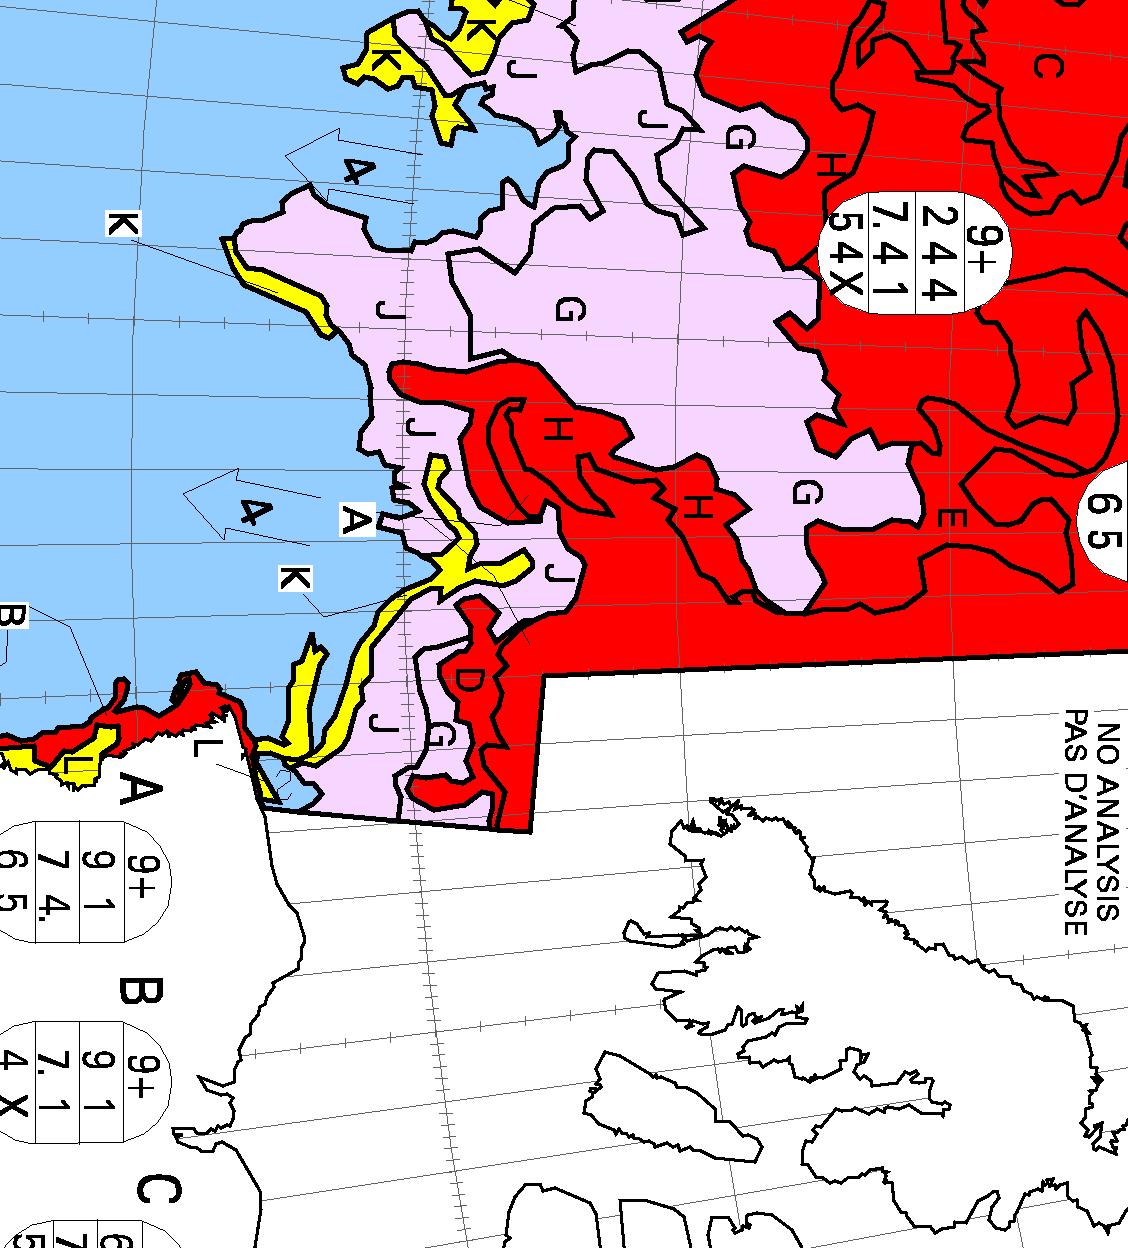
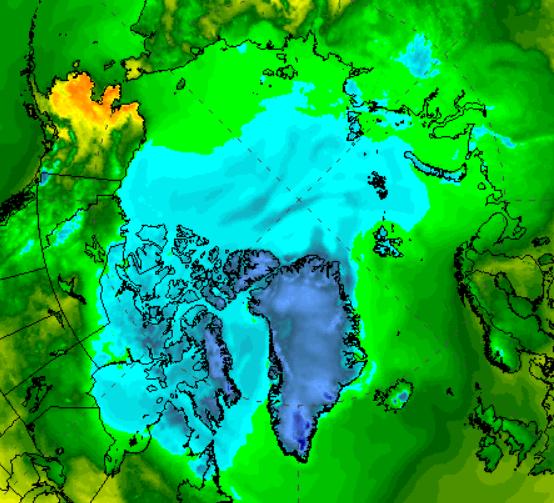
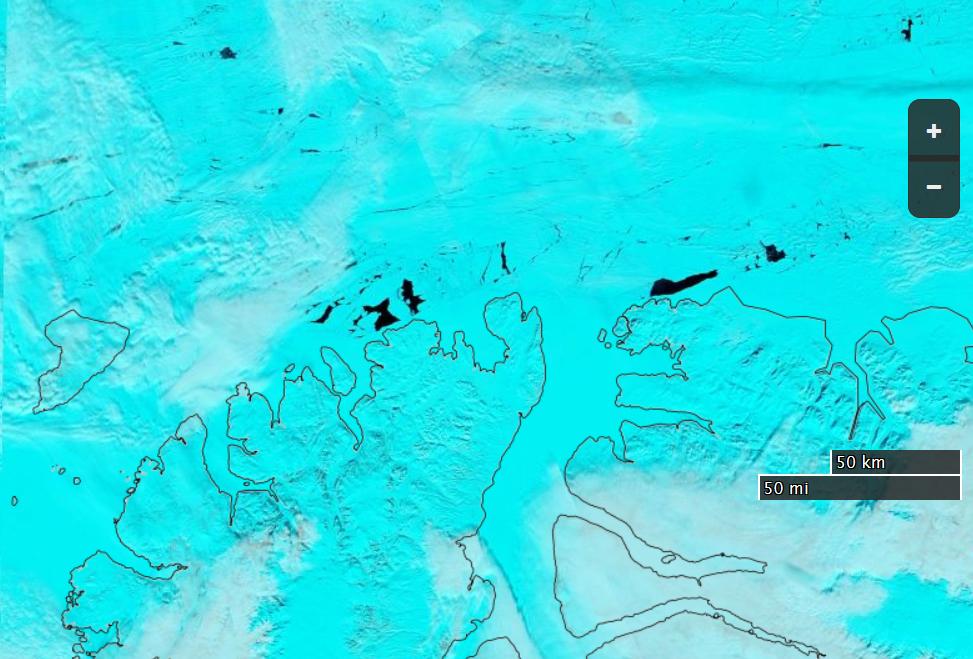
whilst here’s the University of Bremen’s summer SMOS sea ice “thinness” map:

SMOS-20180901


[Edit – September 3rd]

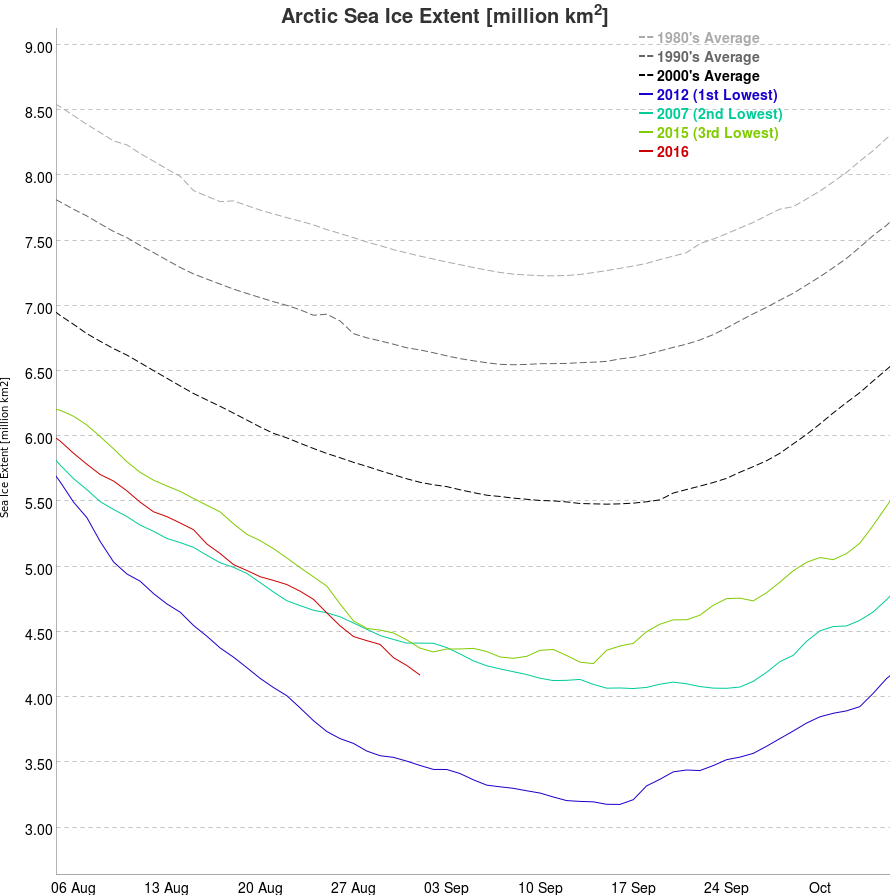
UH AMSR2 area and extent both increased yesterday, so we have a (very!) provisional minimum extent of 4.35 million square kilometres on September 1st.


[Edit – September 4th]

Area and extent have both increased again:

Arctic-Area-2018-09-03

Arctic-Extent-2018-09-03

Is the minimum already in, or will the storms still circulating around the Arctic Ocean reverse that trend over the next few days?


[Edit – September 6th]

High resolution area and extent both posted marginal new lows for the year yesterday:

Arctic-Area-2018-09-05

Arctic-Extent-2018-09-05


[Edit – September 29th]

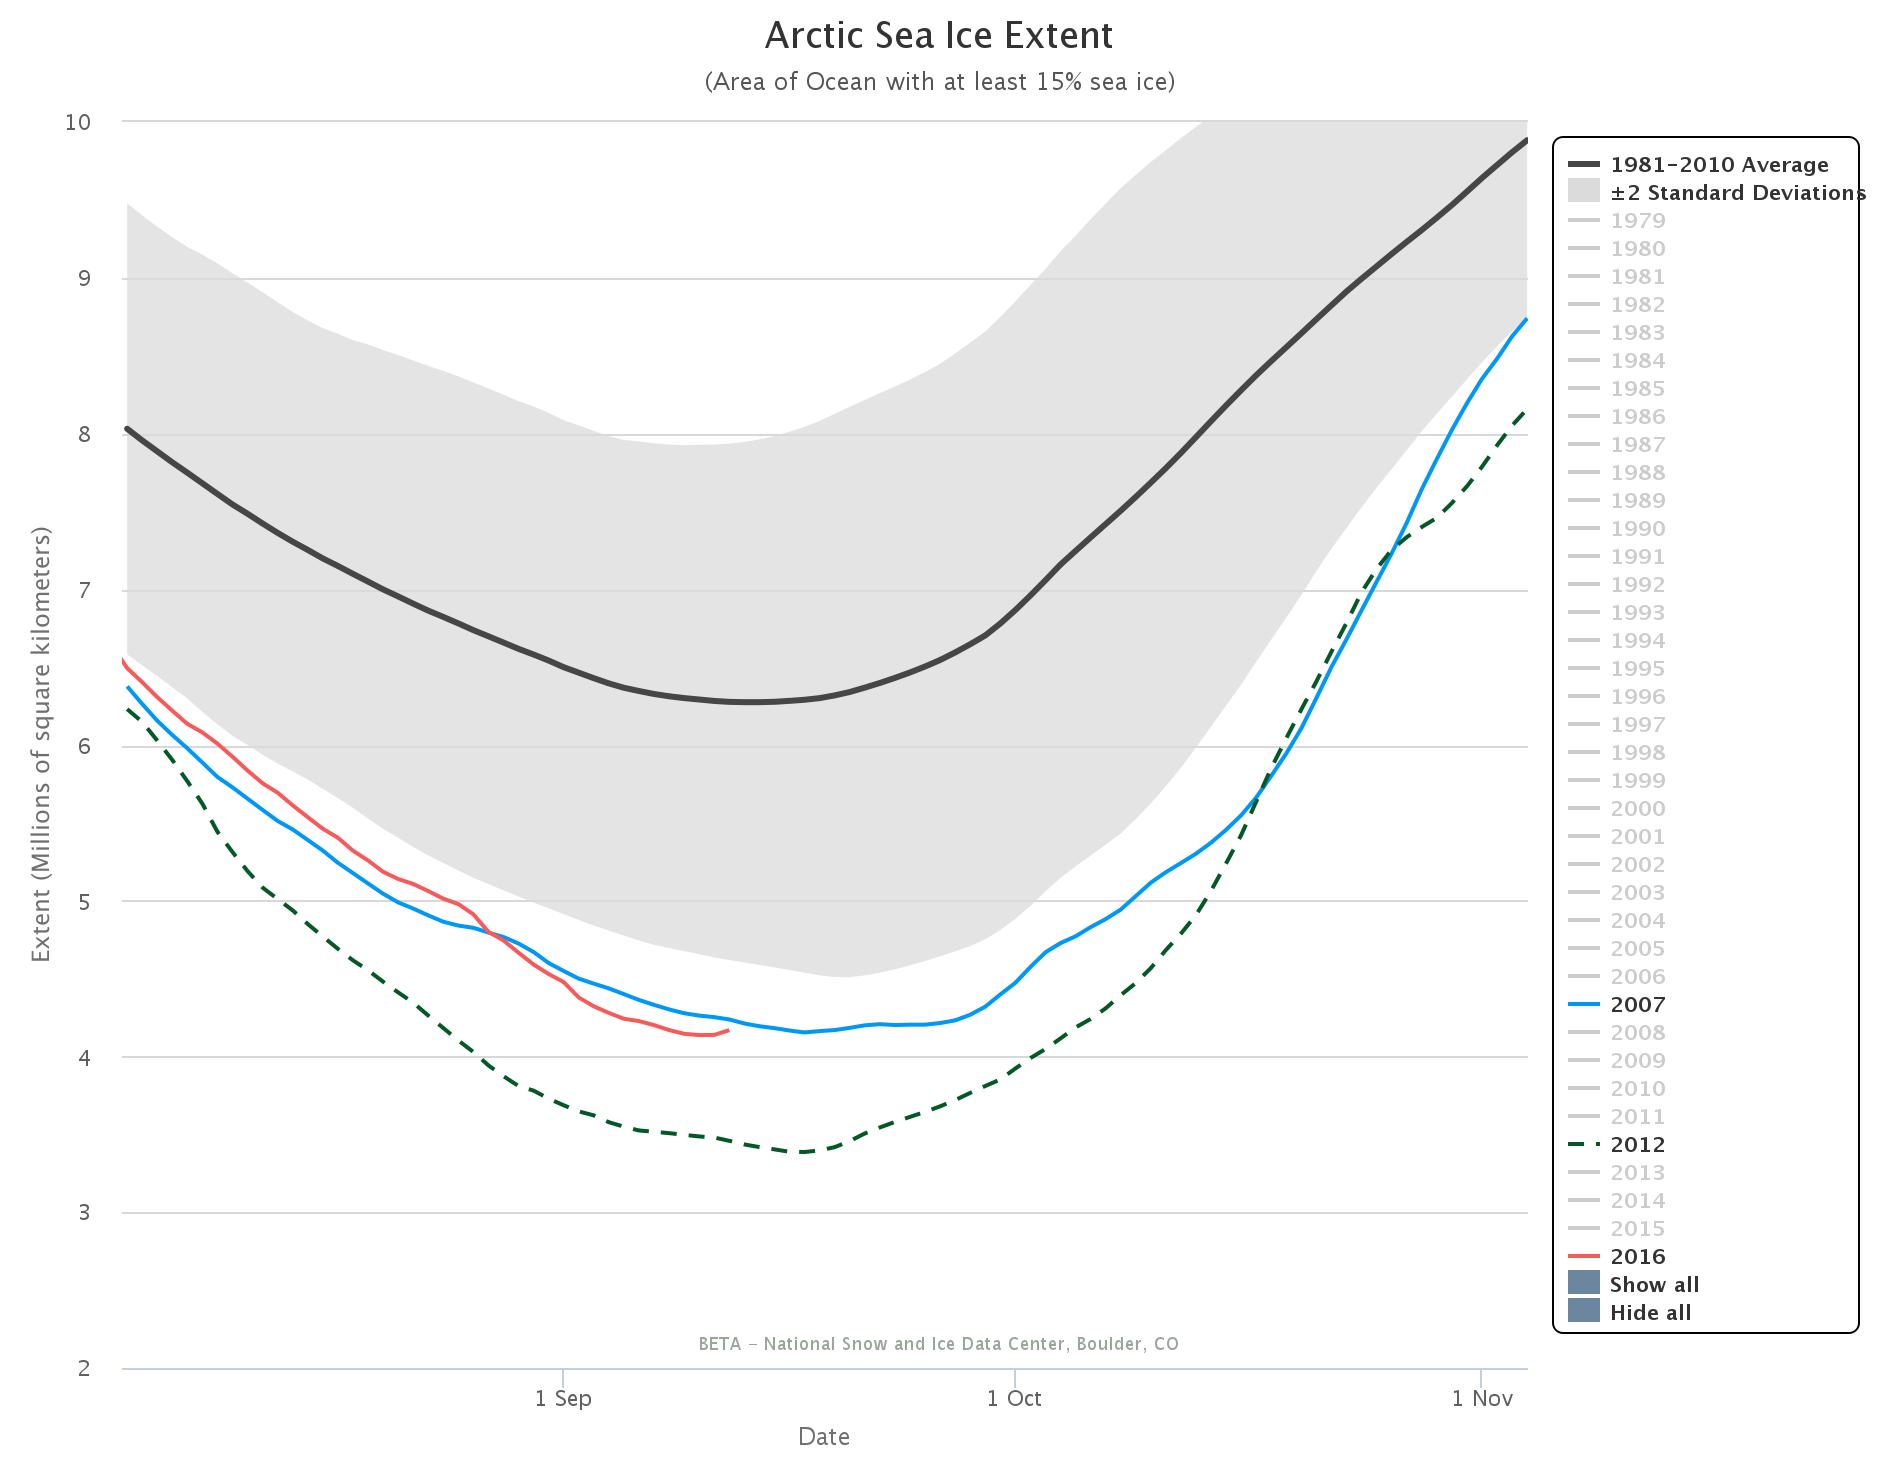
According to the latest edition of the NSIDC’s Arctic Sea Ice News:

On September 19 and 23, Arctic sea ice appeared to have reached its seasonal minimum extent for the year, at 4.59 million square kilometers (1.77 million square miles). This ties 2018 with 2008 and 2010 for the sixth lowest minimum extent in the nearly 40-year satellite record.

Please note that this is a preliminary announcement. Changing winds or late-season melt could still reduce the Arctic ice extent, as happened in 2005 and 2010. NSIDC scientists will release a full analysis of the Arctic melt season, and discuss the Antarctic winter sea ice growth, in early October.

Figure2_09232018

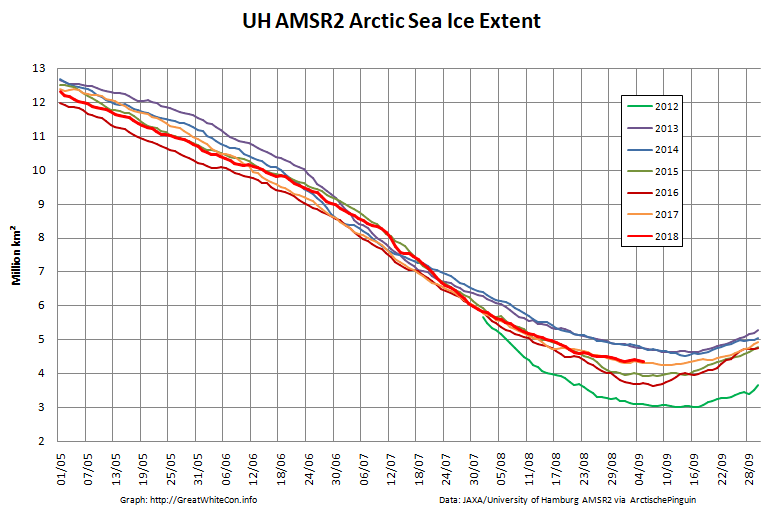
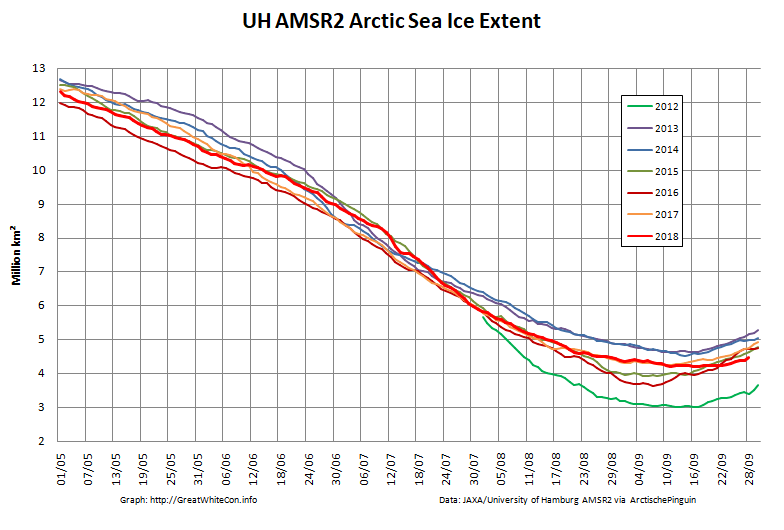
The NSIDC numbers are based on a 5 day average, whereas the one day high resolution AMSR2 extent reached a minimum of 4.195 million square kilometers on September 17th:

Arctic-Extent-2018-09-28

The AMSR2 area minimum occurred significantly earlier. 3.737 million square kilometers on September 9th:

Arctic-Area-2018-09-28

The 2018 Maximum Arctic Sea Ice Extent

According to the latest edition of the National Snow and Ice Data Center’s “Arctic Sea Ice News”

On March 17, 2018, Arctic sea ice likely reached its maximum extent for the year, at 14.48 million square kilometers (5.59 million square miles), the second lowest in the 39-year satellite record, falling just behind 2017. This year’s maximum extent is 1.16 million square kilometers (448,000 square miles) below the 1981 to 2010 average maximum of 15.64 million square kilometers (6.04 million square miles).

The four lowest seasonal maxima have all occurred during the last four years. The 2018 maximum is 60,000 square kilometers (23,200 square miles) above the record low maximum that occurred on March 7, 2017.

Here’s a close up view of recent maxima via the NSIDC’s Charctic interactive sea ice graph:

Charctic-20180323

Next let’s take a look at extent data from the Japanese National Institute of Polar Research, colloquially referred to as “JAXA extent”

VISHOP_Extent-20180323

In this case the maximum was 13.89 million square kilometers, also on March 17th.

Here too are the extent and area graphs based on Wipneus’ processing of the University of Hamburg’s AMSR2 based concentration data:

UH-Arctic-Extent-2018-03-23

UH-Arctic-Area-2018-03-23

They highlight the surge in Arctic sea ice area in the middle of March due to the sudden “cold snap”:

meanT_2018-03-24
Looking at the third Arctic dimension, here’s the latest SMOS thickness map from the University of Bremen:

SMOS-20180323

and here’s the latest CryoSat-2 thickness map:

CS2-thk_28-2018-03-21

They reveal large areas of relatively thin sea ice in the Okhotsk and Barents Seas where the ice can now be expected to melt as quickly as it formed. There is also remarkably little sea ice in the Bering Sea for the time of year:

UH-Bering-Extent-2018-03-23

The 2017 Arctic Sea Ice Metric Minima

September has arrived once again, the month in which the assorted Arctic area and extent metrics (almost) always reach their respective annual minima. Now we can start to speculate about what the assorted minima will be, and on what date.

First of all let’s take a look at “Snow White’s” favourite high resolution AMSR2 metrics derived by “Wipneus” from University of Hamburg AMSR2 concentration data:

UH-Arctic-Area-2017-09-02

UH-Arctic-Extent-2017-09-02

As you can see, today’s values are both higher than yesterday’s. Hence we already have potential minima to consider! In this case:

UH AMSR2 Area – 3.65 million km² on September 1st
UH AMSR2 Extent – 4.30 million km² on September 1st

Personally I don’t think those numbers will last long, and here’s one reason why. The “surf forecast” for the far North Atlantic for midday on September 6th:

Significant_height_of_combined_w in multi_1.glo_30mext.20170903_00029

Mean_period_of_swell_waves_order in multi_1.glo_30mext.20170903_00029

Some significant swells are currently forecast to batter the ice edge on the Atlantic side of the Arctic over the next few days.


[Edit – September 3rd PM]

Shock news! Tony Heller has made a prediction about this year’s minimum!! Unlike last year, this year the NSIDC 5 day average extent seems to be his Arctic metric of choice:

Charctic-20170902

Tony tells his faithful flock:

The Arctic sea ice minimum this year is very likely going to be be larger than 2016, 2015, 2012, 2011 and 2007.

It is also likely that the minimum extent will be higher than 2010 and 2008.

Instead of reporting the huge gain in ice and massive failure of their forecasts, climate alarmists will report that extent was “8th lowest on record.”

All those years are on the graph above. We shall see.


[Edit – September 15th]

Our normal Arctic sea ice extent 2017 minimum service will be restored as soon as possible. Meanwhile here is the test card:

That comes to you via the Daily Express of all places!

On the way the cruise’s resident naturalist and Smithsonian lecturer, Michael Scott, risked the wrath of Trump supporters by pointing to some of the changes Greenland is undergoing.

A Nasa map based on data between 2004 and 2014 revealed that the ice is melting across most of Greenland – an area nine times the size of the UK.

Pulling together several papers, Michael said Greenland’s summer melt season now lasts 70 days longer than in the early 1970s.

This melting is unfreezing the fringes of the permafrost, which may explain why Nasa satellites are picking up fires raging where the ice has retreated.


[Edit – September 16th]

It is of course still to early to be 100% certain about this. However:

UH-Arctic-Extent-2017-09-15

It certainly looks as though the bottom is in for the University of Hamburg AMSR2 extent: 4.25 million km² on September 11th.

It’s much the same story for JAXA extent:

VISHOP_Extent-20170915

4.47 million km² on September 9th and 10th.


[Edit – September 19th]

The NSIDC have followed in Snow White’s glass slippered footsteps and tentatively called the minimum:

On September 13, Arctic sea ice appears to have reached its seasonal minimum extent of 4.64 million square kilometers (1.79 million square miles), the eighth lowest in the 38-year satellite record. The overall rate of ice loss this summer was slowed by a persistent pattern of low sea level pressure focused over the central Arctic Ocean.

Please note that this is a preliminary announcement. Changing winds or late-season melt could still reduce the Arctic ice extent, as happened in 2005 and 2010. NSIDC scientists will release a full analysis of the Arctic melt season, and discuss the Antarctic winter sea ice growth, in early October.

The ever industrious Wipneus has also called the PIOMAS minimum volume for 2017:

Minimum volume was reached at 11th September: 4.542 103km3, which is fourth lowest after 2012, 2011 and 2016 (resp 3.673, 4.302, 4.402) and just below 2010 (4.582).

piomas_gridded_thickness_20170911


[Edit – September 23rd]

Here’s the 2017 edition of our annual NSIDC daily max/min extent graph:

NSIDC-NH-MaxMin-2017

The maximum extent was the lowest in the satellite record, and the minimum was just fractionally above the trend line. For those that concern themselves with “statistical significance”, the PIOMAS minimum volume was a “statistical tie” for second place:

PIOMAS-20170915

Watch this space!

The 2017 Arctic Sea Ice Maximum Extent

It’s far too early to be sure about this yet, but it’s not beyond the bounds of possibility that the 2017 maximum is already in place. Here’s our favourite high resolution extent graph calculated by “Wipneus” from University of Hamburg/JAXA AMSR2 data:

UH-Arctic-Extent-2017-02-21

The current maximum Arctic sea ice extent for 2017 is 13.49 million square kilometers on February 19th. Here’s Arctic sea ice area for good measure:

UH-Arctic-Area-2017-02-21

The current maximum area for 2017 is 12.88 million square kilometers on February 20th. Here also is the NSIDC’s 5 day averaged extent:

charctic-20170221

This reveals a current maximum extent for 2017 of 14.302 million square kilometers on February 20th.


[Edit – March 1st]

Here are the high resolution AMSR2 area and extent graphs for the end of February:

UH-Arctic-Area-2017-02-28

UH-Arctic-Extent-2017-02-28

With each day that passes the highs of February 19th/20th look more likely to have been this years maximum. Nonetheless past experience suggests it’s still far to soon to be sure about that.


[Edit – March 10th]

Arctic sea ice area and extent are declining again, having reached new heights for the year on March 3rd:

UH-Arctic-Extent-2017-03-09

UH-Arctic-Area-2017-03-09

However the 2013/14 winter showed a late surge is still possible.


[Edit – March 18th]

A “late surge” is looking increasingly unlikely. That being the case, here is our provisional long term graph of NSIDC daily Arctic sea ice extent:

NSIDC-Max-2017

Subject to an unanticipated “surge” the 2017 maximum of 14.447 million square kilometers occurred on March 5th.

JAXA extent has dropped steeply over the last couple of days, and it is now once again “lowest for the date since records began”:

JAXA-Extent-20170317

The 2017 JAXA maximum of 13.878 million square kilometers occurred on March 6th.

In the continuing absence of updates to Cryosphere Today area, here’s the high resolution Arctic sea ice area graph calculated by “Wipneus” from University of Hamburg/JAXA AMSR2 data:

UH-Arctic-Area-2017-03-18

The maximum for that particular metric was 13.03 million square kilometers on March 3rd.

Watch this space!

Global Sea Ice Extent Reaches Lowest *Ever Level

Here once again is the up to date version of Wipneus’ graphic graphic, this time of global sea ice extent:

nsidc_global_extent_20170114

As you can see, global sea ice extent has just reached the lowest ever level in the National Snow and Ice Data Center’s satellite records going back to 1979. It was over a month later when the previous record was broken in February 2016, so there is plenty of time for the metric to fall further.

The 2017 curves in the NSIDC’s own extent graphs are coloured in a pale shade of blue. Even so they’re easy to pick out since both Antarctic and Arctic extent are at the lowest level for the date in NSIDC’s records by a considerable margin:

Chantarctic-20170115

Charctic-20170115

Antarctic sea ice extent is still falling, and the Arctic has been flatlining for several days now and more trouble is heading its way. Another Fram Strait cyclone is brewing, and this time around the storm’s minimum central pressure is already down to 957 hPa according to Environment Canada:

Synopsis-20170116-12Z

According to the current forecasts it will continue to spin over the central Arctic for several more days, driving export of sea ice via the Fram Strait:

ACNFS sea ice drift forecast for January 20th 2017

* In NSIDC satellite records going back to 1979

Is the Northwest Passage Freezing or Melting?

A reader writes to ask us to explain the answer to the above question in more detail. Are you sitting comfortably once again? Then let us begin.

There has been a lot of unusual “weather” in the Arctic over the last twelve months. First of all there was an anomalously warm winter:

NCEP-Arctic-T2-DJF

Then came what we dubbed the Great Arctic Anticyclone of 2016 in April. Take a look at what happened to the sea ice north of Alaska and Canada during the Spring and early Summer:

The ice was put through the mincer for the first time. Then during August there were a series of strong cyclones, collectively the Great Arctic Cyclone of 2016. The ice was put through the mincer once again, but in an anti-clockwise direction this time. Watch what happens in the Northwest Passage as summer turns to Autumn:

Some of the oldest, thickest ice in the Arctic has been chopped into small pieces which then easily flow through the channels of the Canadian Arctic Archipelago and into the Northwest Passage. Hence when the yacht Northabout (amongst others) was racing to reach Baffin Bay it wasn’t to avoid “the refreeze” as claimed in certain quarters. It was in fact to try and avoid the worst of the chopped up chunks of old sea ice being carried swiftly in their direction by winds and currents. Here’s what some of them looked like in close up:

The next question then becomes, if the Northwest Passage wasn’t refreezing then, is it freezing now? The answer is not yet. In fact the favourite talking point of the cryodenialista, McClure Strait at the western end of the “main” route through the Passage has recently become navigable:

NASA Worldview “true-color” image of Banks Island on September 24th 2016, derived from the MODIS sensor on the Terra satellite

which is confirmed by the latest Canadian Ice Service chart of the area:

mcclure-201609261800

The “pretty pink” area towards the top left of the chart reveals “new ice”. The Northwest Passage will have started to refreeze when some of that shows up on a “stage of development” chart of the Passage itself, but that hasn’t happened yet. Here’s yesterday evening’s chart of the “Approaches to Resolute“:

resolute-devel-201609261800

Lots of old ice! It was raining in Resolute yesterday, and the old ice there was still melting:

resolute-oldice-rain-20160925


[Edit – September 27th]

No sooner said than done! This evening’s ice charts from the CIS do now show some “pretty pink” new ice in the Northwest Passage:

resolute-devel-201609271800

The wispy areas of new ice are also visible on this “false-color” image of the Parry Channel:

NASA Worldview “false-color” image of the Parry Channel on September 27th 2016, derived from the MODIS sensor on the Terra satellite

However even if Northabout were still in Prince Regent Inlet she wouldn’t be “trapped in ice”. There is still a way back to Bristol via Fury and Hecla Strait:

foxe-201609271800

That route has been remarkably busy this year!


[Edit – September 30th]

A clear view of McClure Strait from the Terra satellite in “false colour”:

NASA Worldview “false-color” image of the McClure Strait on September 30th 2016, derived from the MODIS sensor on the Terra satellite

The inclusion of some infra red reveals the thicker old ice on the right noticeably paler than the new ice to its left. Compare also with the CIS ice chart, which has been rotated to match the orientation of the satellite image:

mcclure-201609291800


[Edit – October 2nd]

Pretty patterns in the new sea ice forming at the western entrance to McClure Strait:

NASA Worldview “true-color” image of the McClure Strait on October 1st 2016, derived from the MODIS sensor on the Aqua satellite

The freshly frozen new ice in the Northwest Passage has been spotted by the AMSR2 instrument aboard the Japanese “Shizuku” satellite:

uh-caa-area-2016-10-01

On the latest CIS “stage of development” chart the brown “old ice” has turned to deep red “multi-year ice”, and there’s lots more pretty pink out in the Beaufort Sea:

mcclure-devel-201610011800

The 2016 Arctic Sea Ice Metric Minima

September 2016 is here at last! I posed this question at the start of the recent “Great Arctic Cyclone“:

I wonder what the minimum for 2016 will be, and on what date?

I’m still wondering, and the answer does of course depend on which Arctic sea ice metric you happen to be looking at. Here’s a few examples to be going on with. Firstly there’s Tony Heller’s extent metric du jour, from the University of Bremen:

extent_n_running_mean_amsr2_regular_20160902

and then there’s (one of) his previous one(s), from the Danish Meteorological Institute:

osisaf_nh_iceextent_daily_5years_20160901

Amongst the “industry standards” Cryosphere Today area is missing in action so here’s the National Snow & Ice Data Center’s 5 day average extent:

charctic-20160901

and JAXA extent:

JAXA_Extent_20160901

Finally here are “Snow White’s” favourite high resolution AMSR2 metrics derived by “Wipneus” from University of Hamburg AMSR2 concentration data:

UH-Arctic-Area-2016-08-31

UH-Arctic-Extent-2016-08-31

Are there any other suggestions for numbers to keep a close eye on over the next few weeks?


[Edit – September 3rd]

Arctic sea ice volume, as modelled by PIOMAS, has been updated to August 2016:

piomas-201608

It’s currently 3rd lowest for the month, just a whisker behind 2011. Here’s the PIOMAS gridded data for August 31st 2016:

PIOMAS-20160831

and for comparison purposes here’s the high res AMSR2 concentration map for the same date:

Arc_20160831_res3.125

As suggested by Bill, here too are the Arctic Regional Ocean Observing System numbers. Much like the high res AMSR2 data they allow comparison between area and extent from the same sensor/algo combination, in this case SSMIS/NORSEX on a 25 km grid:

NORSEX-area-20160901

NORSEX-extent-20160901

Both sources agree that currently the remaining ice is less compact in 2016 than it was in 2012.


[Edit – September 4th]

An interesting inter-metric comparison from Lars Kaleschke of the University of Hamburg:


[Edit – September 5th]

Here’s another twist on the University of Hamburg’s AMSR2 extent, courtesy of Lars Kaleschke:

UH-AMSR2-20160904


[Edit – September 11th]

Several of the metrics displayed above have increased over the last day or two. The 2016 minimum may be upon us, but another few days will have to go by before that’s finally confirmed. Whilst we wait here’s another metric to consider, as described on “Tamino’s” Open Mind blog:

A plot of annual average extent also clearly shows the decline, and includes data from throughout the year rather than just the annual minimum. The figure for 2016 is the lowest on record, but the year isn’t done yet. If instead of averaging January-through-December we do September-through-August (to make the final year complete), we find that the most recent year is still the lowest on record:

taminoannualanomaly-aug-2016

Any way you look at it, Arctic sea ice is in decline. If you look at the entire year rather than just the annual minimum, the record year is this one.


[Edit – September 14th]

The refreeze has certainly started now. A quick look through the metrics. First of all the Hamburg University high resolution AMSR2 matched set:

uh-arctic-area-2016-09-13

uh-arctic-extent-2016-09-13

Area just squeezed under 3 million km². Next up is JAXA extent:

jaxa_extent_20160913

which just failed to fall below 4 million km². Last but not least, just for the moment, is the NSIDC 5 day trailing averaged extent:

charctic-20160912

The most striking this year is the unusually large gap between area and extent for this time of year, illustrated by this “compactness” graph from Arctische Pinguin:

amsr2-compact-20160913

Note too the striking difference between different sensor/algo combinations for this metric!


[Edit – September 15th]

With the minimum now beyond doubt, here’s a new graphic from Lars Kaleschke of the University of Hamburg:

uh-min-temp

Need I say more?


[Edit – September 20th]

The September cyclone has now done its worst:

NASA Worldview “true-color” image of the Beaufort Sea on September 18th 2016, derived from the VIIRS sensor on the Suomi satellite

Leaving the area and extent metrics with an intriguing “double dip”:

uh-arctic-area-2016-09-20

uh-arctic-extent-2016-09-20


2016 Minimum Milestones

September 3rd – JAXA extent dropped to 2nd place below the 2007 minimum at 4.05 million km²

September 7th – JAXA extent minimum of 4.02 million km²

September 8th – NSIDC single day extent dropped to 2nd place below the 2007 minimum at 4.083 million km². This proved to the minimum value for the year as a whole.

September 9th – NSIDC 5 day trailing averaged extent dropped to 2nd place below the 2007 minimum at 4.146 million km²

September 10th – NSIDC 5 day trailing averaged extent minimum of 4.137 million km²

More Arctic BS From Tony Heller

Please forgive my mixing of metaphors this morning, but the interminable stream of piss poor propaganda from Tony Heller grows ever more voluminous. Not only has he reprised his “DMIGate” nonsense but he is also posting pictures of the wrong bit of the Arctic yet again. Exhibit A:

DMI shows Arctic sea ice extent well below last year, and near a record low.

unReal-DMI-20170728

In fact, there is more ice than last year, and it likely that 2016 will end considerably higher than last year. This is because the big red spot (below) in the Beaufort Sea disappeared in a storm during the second week of August last year.

unReal-DMI-Delta-20170728

The forecast is for very cold air over the Beaufort Sea the next two weeks, so it is unlikely that a lot of melting is going to occur there. This is shaping up to be a disastrous year for Arctic alarmists, and it will be interesting to see how the graphs progress, and if and when they catch up with reality.

DMI aren’t the only ones that “show Arctic sea ice extent well below last year”:

UH-Arctic-Extent-2016-07-27

and Tony still wouldn’t recognise a higher resolution coastal mask if it bit him in the backside.

Moving on to Exhibit B, Tony still has it in for the valiant Polar Ocean Challenge team in brave little Northabout, who he claims are “Not Going Anywhere“:

The clouds over the Northeast Passage have finally cleared, and you can now see what our intrepid explorers are up against. Hundreds of miles of solid pack ice.

unReal-Vilkitsky-20170728

I pointed out the error of his ways to him yesterday, but for some strange reason Tony is still posting pictures of the wrong place. Here is an overview of the actual facts, as assessed by AMSR2:

Laptev-Kara-AMSR2-2016-07-29

Arctic Fraud Continues Unabated

The opening sentence of Tony Heller’s latest Arctic update is astonishingly accurate. Just for once we agree with him when he states:

DMI continues to show rapid melting of Arctic sea ice.

unReal-DMI-20160525

However after that the Arctic fraud continues unabated. Tony assures his loyal readership that:

Their maps show the exact opposite. Arctic sea ice coverage is hardly changing at all.

and:

Equally as troubling is that they show a lot less ice than last year, when in fact there is more ice than last year.

providing this map as justification:

unReal-Comparison-20160525

As unReal Science commenter Peter Ellis put it:

You’re getting caught out by the change in the land mask.

When Caleb quibbled yours truly felt compelled to elucidate:

What have you and Tony been smoking Caleb?

Here’s a satellite image of the Beaufort Sea this year, which is red on Tony’s low resolution 2015/16 comparison map:

NASA Worldview “true-color” image of the Beaufort Sea on May 20th 2016

Here’s a satellite image of the the northern edge of the CAA last year, which is green on Tony’s map:

NASA Worldview “true-color” image of the Canadian Arctic Archipelago on May 20th 2015, derived from the MODIS sensor on the Terra satellite
NASA Worldview “true-color” image of the Canadian Arctic Archipelago on May 20th 2015

Would you care to play “spot the difference” with Peter and I?

[Edit – May 28th 2016]

Tony is doubling down on his Arctic fraud. His Arctic monkey business continues. Despite the lucid explanation of his glaring error provided by Peter Ellis the unReal Science Gish gallop continues. We are now (un)reliably informed that:

The Arctic is very cold, and is not melting.

The amount of ice in the Arctic is almost exactly the same as this date last year.

unReal-2016-05-27-10-40-58

Yours truly has asked all and sundry at unReal Science this question 9 times, phrased in a variety of different ways:

Here’s a satellite image of the the northern edge of the CAA last year. Take a good look at it and then show me the areas of open water corresponding to the green areas on Tony’s final map above.

I have yet to receive an answer.

[Edit – May 29th 2016]

Tony’s doubled down again. His Arctic BS continues for another day:

DMI shows ice rapidly melting and extent far below last year. But their maps show about 1% more ice this year than last.

unReal-2016-05-28-18-41-05

How long will this scam continue?

I tried using a more colourful image of the CAA today. This one’s from May 27th 2015:

CAA-Terra-367-2015-05-27

Once again “No answer!” was the stern reply to my plaintive questions.

[Edit – May 30th 2016]

The “Jousting with Malice in Blunderland” continues, but the oppostion are remarkably quiet today. I’ve had my knuckles rapped about this previously, but cutting and pasting is so quick ‘n easy I simply cannot resist:

Us:

Evidently Tony Heller believes that when it comes to melting sea ice air temperatures are all that matters and that “somewhat warmer ocean water” is irrelevant. see above:

http://realclimatescience.com/2016/05/arctic-bs-continues-for-another-day/#comment-9532

He also evidently believes that in May 2015 large areas of the oldest and thickest sea ice in the Arctic had already melted away to nothing. Perhaps you can point out all the polynyas around the coast of the Canadian Arctic Archipelago this time last year to him, since nobody else has yet managed to do so?

http://go.nasa.gov/1TO7zZk

CAA-Terra-721-2015-05-27

Them:

gees, Jimbo has change to a luminous blue.
Very pretty Jim..
Now how about you show one that shows th near ZERO Arctic sea ice from the first 3/4 of the Holocene..
Or are you still going to DENY/ IGNORE the FACT that there is nothing untoward happening with the Arctic Sea Ice, and all you are arguing about is the INSIGNIFICANT TRIVIA that rules your meaningless life.

Us:

For psychedelic Arctic surface air temperature fans every where:

http://cci-reanalyzer.org/Forecasts/#ARC-LEA

What do you suppose happens to sea ice when you combine “somewhat warmer ocean water” with “somewhat above freezing point air”?

N.B. Such conditions do not currently exist off the north coast of the CAA. They didn’t in May 2015 either.

CCI-2016-05-30_0300

Them:

You on psycho drugs yet again, Jimbo

Which of your Exeter buddies is feeding them too you ?

Us:

Evidently you and Tony are the ones who have been smoking stuff Andy.

In the fantasy wonderland portrayed in several of Tony’s recent “articles” polynyas are depicted in the oldest, thickest sea ice in the Arctic in May 2015. Here is what the real life polynyas in the “oldest, thickest sea ice” in the actual Arctic of May 2016 look like from above (through cyan tinted spectacles):

http://go.nasa.gov/1OXxeYa

CAA-Aqua-721-2016-05-27

[Edit – June 1st 2016]

The Gish gallop continues. In yet another post on the self same topic Tony Heller makes the self same mistake and opines:

DMI still shows a lot less ice than last year, but their maps show about 1% more ice than last year.

2016-05-30-04-03-04-1

I will continue to track this, because I don’t trust any government agency anymore.

Us:

Visual comparison isn’t Tony’s strong suit Sondre, whereas painting hallucinatory green pixels is.

Where are all the holes in the sea ice in the CAA that were there in 2015 but not in 2016 then Andy?

http://www.arctic.io/explorer/8-8/2016-05-29;2015-05-30/6-N79.25236-W95.51613

Them:

weather related changes…

you KNOW that, Jimbo the attention seeking prat.

You have NOTHING, and never have.

Andy:

Shut up about the Holocene, it’s not relevant to modern Arctic sea ice extent trends.
It’t like talking about sun spot trends and then someone comes along and says “Well, this is nothing compared to when the sun becomes a red giant”. Which is true, but not relevant at all.

Us:

Have you noticed that the world’s leading expert on satellite imagery of the Arctic during the first 3/4 of the Holocene epoch has compared MODIS imagery of the Canadian Arctic Archipelago from May 2015 with May 2016 and confirmed that there is no noticeable difference in sea ice extent between the two?

Them:

We’ll keep you posted!

NSIDC Announce The 2016 Arctic Sea Ice Maximum Extent

In the latest edition of their “Arctic Sea Ice News” the United States’ National Snow and Ice Data Center have announced that:

Arctic sea ice appears to have reached its annual maximum extent on March 24, and is now the lowest maximum in the satellite record, replacing last year’s record low. This year’s maximum extent occurred later than average. A late season surge in ice growth is still possible. NSIDC will post a detailed analysis of the 2015 to 2016 winter sea ice conditions in early April.

NSIDC-20160327

On March 24, 2016, Arctic sea ice likely reached its maximum extent for the year, at 14.52 million square kilometers (5.607 million square miles). This year’s maximum ice extent was the lowest in the satellite record, with below-average ice conditions everywhere except in the Labrador Sea, Baffin Bay, and Hudson Bay. The maximum extent is 1.12 million square kilometers (431,000 square miles) below the 1981 to 2010 average of 15.64 million square kilometers (6.04 million square miles) and 13,000 square kilometers (5,000 square miles) below the previous lowest maximum that occurred last year. This year’s maximum occurred twelve days later than the 1981 to 2010 average date of March 12. The date of the maximum has varied considerably over the years, occurring as early as February 24 in 1996 and as late as April 2 in 2010.

NASA’s Goddard Space Flight Center has also made a similar announcement, which includes this video:

The new record low follows record high temperatures in December, January and February around the globe and in the Arctic. The atmospheric warmth probably contributed to this lowest maximum extent, with air temperatures up to 10 degrees Fahrenheit above average at the edges of the ice pack where sea ice is thin, said Walt Meier, a sea ice scientist at NASA’s Goddard Space Flight Center in Greenbelt, Maryland.

The wind patterns in the Arctic during January and February were also unfavorable to ice growth because they brought warm air from the south and prevented expansion of the ice cover. But ultimately, what will likely play a bigger role in the future trend of Arctic maximum extents is warming ocean waters, Meier said.

“It is likely that we’re going to keep seeing smaller wintertime maximums in the future because in addition to a warmer atmosphere, the ocean has also warmed up. That warmer ocean will not let the ice edge expand as far south as it used to,” Meier said. “Although the maximum reach of the sea ice can vary a lot each year depending on winter weather conditions, we’re seeing a significant downward trend, and that’s ultimately related to the warming atmosphere and oceans.” Since 1979, that trend has led to a loss of 620,000 square miles of winter sea ice cover, an area more than twice the size of Texas.

This year’s record low sea ice maximum extent will not necessarily result in a subsequent record low summertime minimum extent, Meier said. Summer weather conditions have a larger impact than the extent of the winter maximum in the outcome of each year’s melt season; warm temperatures and summer storms make the ice melt fast, while if a summer is cool, the melt slows down.

Neither NASA or the NSIDC comment on one of the striking things about this winter’s NSIDC extent chart, which has effectively “plateaued” during March 2016 following an initial peak of 14.48 million square kilometers on March 2nd, which was only recently exceeded. This is also illustrated by the JAXA Arctic sea ice extent metric, for which the 2016 maximum was 13.96 million square kilometers on February 29th:

JAXA-20160328

Now that the start of 2016 Arctic sea ice melting season has been called, albeit slightly hesitantly, by the experts at the NSIDC let’s also take a look at Cryosphere Today Arctic sea ice area:

CT-20160327

The preliminary peak which we announced on March 16th has also recently been exceeded, but we now feel supremely confident in predicting that the 2016 CT area maximum will be less than 13 million square kilometers for the first time ever in the satellite record.

Thus begins what promises to be a very interesting 2016 Arctic sea ice melting season! As the NSIDC puts it:

There is little correlation between the maximum winter extent and the minimum summer extent—this low maximum does not ensure that this summer will see record low ice conditions. A key factor is the timing of widespread surface melting in the high Arctic. An earlier melt onset is important to the amount of energy absorbed by the ice cover during the summer. If surface melting starts earlier than average, the snow darkens and exposes the ice below earlier, which in turn increases the solar heat input, allowing more ice to melt. With the likelihood that much of the Arctic cover is somewhat thinner due to the warm winter, early surface melting would favor reduced summer ice cover.